EXHIBIT 99.1
The Joint Corp. Reports Second Quarter 2021 Record Financial Results, Raises All Elements of Guidance
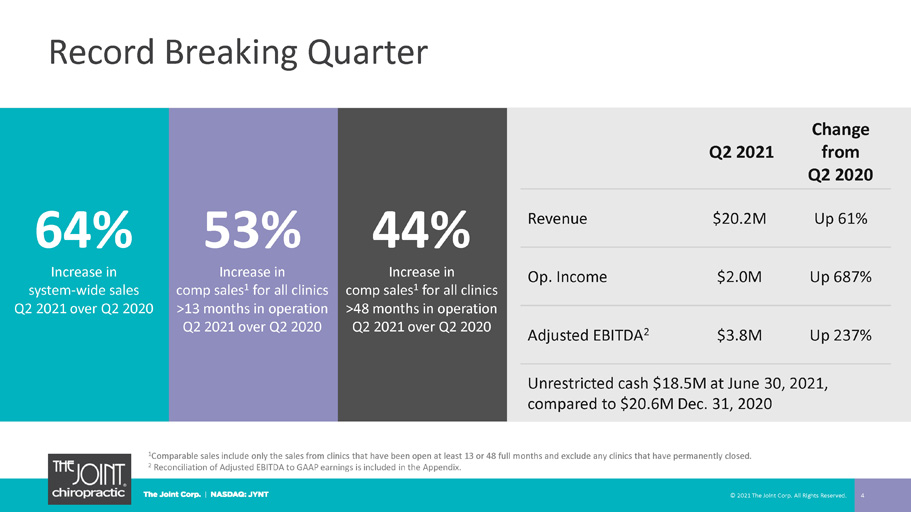
- Grows Revenue 61%, System-wide Sales 64%, and
System-wide Comp Sales 53%, Compared to Q2 2020 -
- Reports Operating Income of $2.0 Million, Up 687% Compared to Q2 2020 -
- Posts Adjusted EBITDA of $3.8 Million, Up 237% Compared to Q2 2020 -
SCOTTSDALE, Ariz., Aug. 05, 2021 (GLOBE NEWSWIRE) -- The Joint Corp. (NASDAQ: JYNT), a national operator, manager, and franchisor of chiropractic clinics, reported its financial results for the quarter ended
June 30, 2021.
Financial Highlights: Q2 2021 Compared to Q2 2020
- Grew revenue 61% to $20.2 million.
- Increased system-wide sales1 by 64%, to $87.8 million.
- Reported system-wide comp sales2 of 53%.
- Posted operating income of $2.0 million, compared to $259,000.
- Reported Adjusted EBITDA of $3.8 million, compared to $1.1 million.
Q2 2021 Operating Highlights
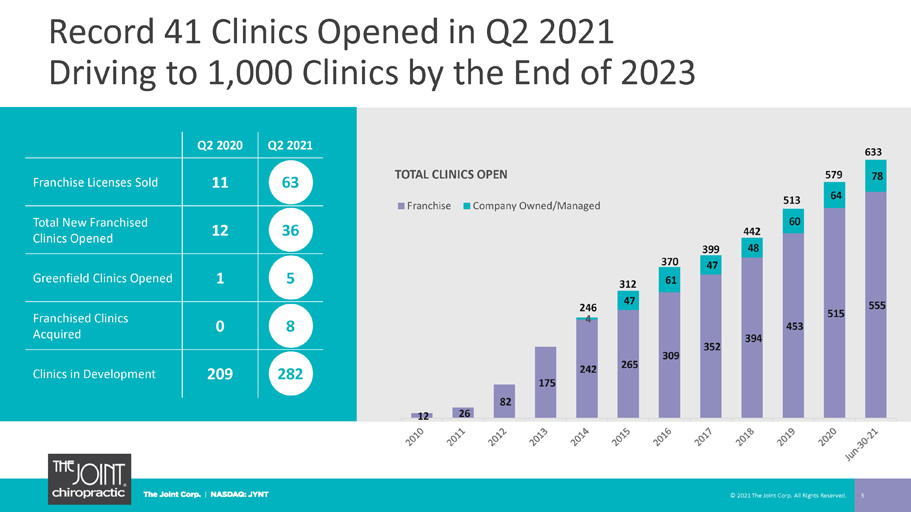
- Sold 63 franchise licenses, compared to 11 in Q2 2020.
- Increased total clinics to 633 at June 30, 2021, 555 franchised and 78 company-owned or managed, up from 592 at March 31, 2021.
- Opened 36 new franchised clinics, compared to 12 in Q2 2020.
- Opened 5 greenfield clinics, compared to 1 in Q2 2020.
- Acquired 8 previously franchised clinics, compared to no activity in Q2 2020.
“Our business model continues to deliver strong financial results,” said Peter D. Holt, President and Chief Executive Officer of The Joint Corp. “In the second quarter, we broke records in franchise license sales, clinic openings, and system-wide sales driving all-time highs for the first half of the year. The six-month total for franchise license sales rose to 89, up from 35 and 75 for 2020 and 2019, respectively. The clinic openings for the first six months of the year increased to 54, up from 30 and 29 in 2020 and 2019, respectively. Additionally, system-wide sales reached 64% year-over-year, up from 2% and 34% in the second quarters of 2020 and 2019, respectively.”
“More importantly, our future is even brighter. These trends support long-term growth, which we expect to continue to accelerate and build upon our financial foundation. Already, we have opened 6 greenfield clinics in 2021, and we anticipate a faster pace in the latter half of the year. Based on performance and activity, we raised every element of our guidance. We continue to march toward our goal of 1,000 open clinics by the end of 2023, which we expect to be a tipping point for national brand recognition to drive growth at an even faster pace. Combined with the large and expanding chiropractic care market opportunity, we believe in our long-term ability to increase stakeholder value.”
1 System-wide sales include sales at all clinics, whether operated or managed by the company or by franchisees. While franchised sales are not recorded as revenues by the company, management believes the information is important in understanding the company’s financial performance, because these sales are the basis on which the company calculates and records royalty fees and are indicative of the financial health of the franchisee base.
2 Comp sales include the sales from both company-owned or managed clinics and franchised clinics that in each case have been open at least 13 full months and exclude any clinics that have closed.
Financial Results for the Three Months Ended June 30: 2021 Compared to 2020
Revenue was $20.2 million in the second quarter of 2021, compared to $12.6 million in the second quarter of 2020, reflecting a greater number of clinics, continued organic growth and the favorable comparison to revenues during the beginning of the pandemic in the prior year period. Cost of revenue was $2.0 million, compared to $1.4 million in the second quarter of 2020, reflecting the increase in franchised clinics and the associated higher regional developer royalties and commissions.
Selling and marketing expenses were $3.1 million, up 76%, driven by an increase in advertising fund expenditures from a larger franchise base and the timing of the national marketing fund spend as well as an increase in local marketing expenditures by the company-owned or managed clinics. General and administrative expenses were $11.6 million, compared to $8.5 million in the second quarter of 2020, primarily due to an increase in payroll and related expenses to support revenue growth and a greater number of clinics. As a percentage of revenue, general and administrative expenses during the second quarter of 2021 and 2020 were 57% and 68%, respectively, reflecting improved leverage in the operating model. The improvement is not expected to continue at that level in following quarters due to the opening of four greenfields at the end of June, the anticipated pace of more greenfields openings in the latter half of the year, and the related up-front expense of those openings.
Operating income was $2.0 million, compared to $259,000 in the second quarter of 2020. Income tax benefit was $666,000, compared to an expense of $118,000 in the second quarter of 2020. The income tax benefit was primarily driven by excess tax benefits from the exercise of stock options. Net income was $2.7 million, or $0.18 per diluted share, compared to $116,000, or $0.01 per diluted share, in the second quarter of 2020.
Adjusted EBITDA was $3.8 million, compared to $1.1 million in the second quarter of 2020. The company defines Adjusted EBITDA, a non-GAAP measure, as EBITDA before acquisition-related expenses, bargain purchase gain, net (gain)/loss on disposition or impairment, and stock-based compensation expenses. The company defines EBITDA as net income before net interest, tax expense, depreciation, and amortization expenses.
Financial Results for the Six Months Ended June 30: 2021 Compared to 2020
Revenue was $37.8 million for the first half of 2021, compared to $26.2 million in the same prior year period. Operating income and net income were $4.0 million and $5.0 million, compared to $1.0 million and $931,000 in the first half of 2020, respectively. Adjusted EBITDA was $7.2 million, compared to $2.8 million in the same prior year period.
Balance Sheet Liquidity
Unrestricted cash was $18.5 million at June 30, 2021, compared to $20.6 million at December 31, 2020. The change reflects net cash provided by operating activities of $9.0 million offset by $8.9 million of investing activities consisting of acquisitions, greenfield developments, and IT capital expenditures, as well as the $2.7 million repayment of the Paycheck Protection Program loan in March 2021.
Raised 2021 Guidance
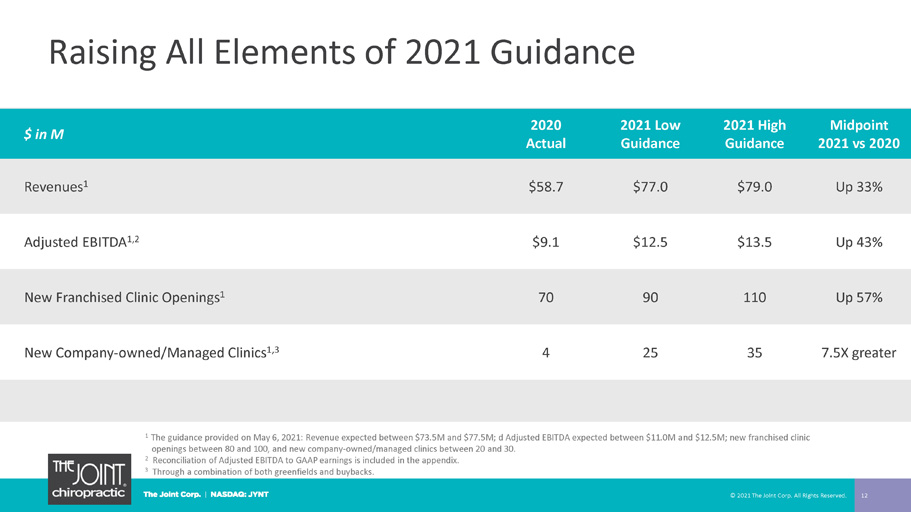
Due to strong second quarter 2021 revenues, as well as increased franchise openings and greenfield activity, management raised all elements of its 2021 financial guidance.
- Revenue is now expected to be between $77.0 million and $79.0 million, up from the May 6, 2021 guidance of between $73.5 million and $77.5 million. The updated mid-point reflects a 33% increase compared to $58.7 million in 2020.
- Adjusted EBITDA - which includes the impact of a greater number of greenfields that will be more heavily weighted in the second half of the year - is expected to be between $12.5 million and $13.5 million, up from prior guidance of between $11.0 million and $12.5 million. The updated mid-point reflects a 43% increase compared to $9.1 million in 2020.
- The expected number of franchised clinic openings has increased to be between 90 and 110, up from 80 to 100. The updated mid-point reflects a 57% increase compared to 70 in 2020.
- The expected number of company-owned or managed clinic increases, through a combination of both greenfields and buybacks, has increased to be between 25 and 35, up from 20 to 30 clinics. The updated mid-point is 7.5 times greater than 4 opened in 2020.
Conference Call
The Joint Corp. management will host a conference call at 5 p.m. ET on Thursday, August 5, 2021, to discuss the second quarter 2021 results. Shareholders and interested participants may listen to a live broadcast of the conference call by dialing 765-507-2604 or 844-464-3931 and referencing code 5959205 approximately 15 minutes prior to the start time. The accompanying slide presentation will be in the IR section of the website under Presentations and in Events. A live webcast of the conference call will also be available on the IR section of the company’s website at https://ir.thejoint.com/events. An audio replay will be available two hours after the conclusion of the call through August 13, 2021. The replay can be accessed by dialing 404-537-3406 or 855-859-2056. The passcode for the replay is 5959205.
Non-GAAP Financial Information
This release includes a presentation of non-GAAP financial measures. System-wide sales include sales at all clinics, whether operated by the company or by franchisees. While franchised sales are not recorded as revenues by the company, management believes the information is important in understanding the company’s financial performance, because these sales are the basis on which the company calculates and records royalty fees and are indicative of the financial health of the franchisee base. Comp sales include the sales from both company-owned or managed clinics and franchised clinics that in each case have been open at least 13 full months and exclude any clinics that have closed.
EBITDA and Adjusted EBITDA are presented because they are important measures used by management to assess financial performance, as management believes they provide a more transparent view of the company’s underlying operating performance and operating trends. Reconciliation of net income/(loss) to EBITDA and Adjusted EBITDA is presented in the table below. The company defines Adjusted EBITDA as EBITDA before acquisition-related expenses, bargain purchase gain, net (gain)/loss on disposition or impairment, and stock-based compensation expenses. The company defines EBITDA as net income before net interest, tax expense, depreciation, and amortization expenses.
EBITDA and Adjusted EBITDA do not represent and should not be considered alternatives to net income or cash flows from operations, as determined by accounting principles generally accepted in the United States, or GAAP. While EBITDA and Adjusted EBITDA are used as measures of financial performance and the ability to meet debt service requirements, they are not necessarily comparable to other similarly titled captions of other companies due to potential inconsistencies in the methods of calculation. EBITDA and Adjusted EBITDA should be reviewed in conjunction with the company’s financial statements filed with the SEC.
Forward-Looking Statements
This press release contains statements about future events and expectations that constitute forward-looking statements. Forward-looking statements are based on our beliefs, assumptions and expectations of industry trends, our future financial and operating performance and our growth plans, taking into account the information currently available to us. These statements are not statements of historical fact. Forward-looking statements involve risks and uncertainties that may cause our actual results to differ materially from the expectations of future results we express or imply in any forward-looking statements, and you should not place undue reliance on such statements. Factors that could contribute to these differences include, but are not limited to, the continuing impact of the COVID-19 outbreak on the economy and our operations (including temporary clinic closures, shortened business hours and reduced patient demand), our failure to develop or acquire company-owned or managed clinics as rapidly as we intend, our failure to profitably operate company-owned or managed clinics, and the other factors described in “Risk Factors” in our Annual Report on Form 10-K as filed with the SEC for the year ended December 31, 2020, as updated or revised for any material changes described in any subsequently-filed Quarterly Reports on Form 10-Q or other SEC filings. Words such as, "anticipates," "believes," "continues," "estimates," "expects," "goal," "objectives," "intends," "may," "opportunity," "plans," "potential," "near-term," "long-term," "projections," "assumptions," "projects," "guidance," "forecasts," "outlook," "target," "trends," "should," "could," "would," "will," and similar expressions are intended to identify such forward-looking statements. We qualify any forward-looking statements entirely by these cautionary factors. We assume no obligation to update or revise any forward-looking statements for any reason or to update the reasons actual results could differ materially from those anticipated in these forward-looking statements, even if new information becomes available in the future. Comparisons of results for current and any prior periods are not intended to express any future trends or indications of future performance, unless expressed as such, and should only be viewed as historical data.
About The Joint Corp. (NASDAQ: JYNT)
The Joint Corp. (NASDAQ: JYNT) revolutionized access to chiropractic care when it introduced its retail healthcare business model in 2010. Today, the company is making quality care convenient and affordable, while eliminating the need for insurance, for millions of patients seeking pain relief and ongoing wellness. With more than 600 locations nationwide and over eight million patient visits annually, The Joint is a key leader in the chiropractic industry. Named on Franchise Times “Top 200+ Franchises” and Entrepreneur’s “Franchise 500®” lists, The Joint Chiropractic is an innovative force, where healthcare meets retail. For more information, visit www.thejoint.com. To learn about franchise opportunities, visit www.thejointfranchise.com.
Business Structure
The Joint Corp. is a franchisor of clinics and an operator of clinics in certain states. In Arkansas, California, Colorado, District of Columbia, Florida, Illinois, Kansas, Kentucky, Maryland, Michigan, Minnesota, New Jersey, New York, North Carolina, Oregon, Pennsylvania, Rhode Island, South Dakota, Tennessee, Washington, West Virginia and Wyoming, The Joint Corp. and its franchisees provide management services to affiliated professional chiropractic practices.
Media Contact: Margie Wojciechowski, The Joint Corp., [email protected]
Investor Contact: Kirsten Chapman, LHA Investor Relations, 415-433-3777, [email protected]
– Financial Tables Follow –
THE JOINT CORP. AND SUBSIDIARY AND AFFILIATES
CONDENSED CONSOLIDATED BALANCE SHEETS
(unaudited)
| | June 30,
2021 | | December 31,
2020 |
| ASSETS | (unaudited) | | |
| Current assets: | | | |
| Cash and cash equivalents | $ | 18,521,042 | | | | $ | 20,554,258 | | |
| Restricted cash | 313,303 | | | | 265,371 | | |
| Accounts receivable, net | 2,805,387 | | | | 1,850,499 | | |
| Deferred franchise and regional development costs, current portion | 973,224 | | | | 897,551 | | |
| Prepaid expenses and other current assets | 1,590,448 | | | | 1,566,025 | | |
| Total current assets | 24,203,404 | | | | 25,133,704 | | |
| Property and equipment, net | 12,418,496 | | | | 8,747,369 | | |
| Operating lease right-of-use asset | 15,232,136 | | | | 11,581,435 | | |
| Deferred franchise and regional development costs, net of current portion | 5,042,889 | | | | 4,340,756 | | |
| Intangible assets, net | 6,176,429 | | | | 2,865,006 | | |
| Goodwill | 5,128,302 | | | | 4,625,604 | | |
| Deferred tax assets | 9,388,264 | | | | 8,007,633 | | |
| Deposits and other assets | 474,782 | | | | 431,336 | | |
| Total assets | $ | 78,064,702 | | | | $ | 65,732,843 | | |
| | | | |
| LIABILITIES AND STOCKHOLDERS' EQUITY | | | |
| Current liabilities: | | | |
| Accounts payable | $ | 2,160,642 | | | | $ | 1,561,648 | | |
| Accrued expenses | 1,143,858 | | | | 770,221 | | |
| Co-op funds liability | 313,304 | | | | 248,468 | | |
| Payroll liabilities | 4,624,414 | | | | 2,776,036 | | |
| Debt under the Credit Agreement | 2,000,000 | | | | — | | |
| Operating lease liability, current portion | 3,605,458 | | | | 2,918,140 | | |
| Finance lease liability, current portion | 79,752 | | | | 70,507 | | |
| Deferred franchise and regional developer fee revenue, current portion | 3,162,710 | | | | 3,000,369 | | |
| Deferred revenue from company clinics ($2.9 million and $2.6 million attributable to VIEs) | 4,366,186 | | | | 3,905,200 | | |
| Debt under the Paycheck Protection Program | — | | | | 2,727,970 | | |
| Other current liabilities | 551,035 | | | | 707,085 | | |
| Total current liabilities | 22,007,359 | | | | 18,685,644 | | |
| Operating lease liability, net of current portion | 14,297,918 | | | | 10,632,672 | | |
| Finance lease liability, net of current portion | 99,772 | | | | 132,469 | | |
| Debt under the Credit Agreement | — | | | | 2,000,000 | | |
| Deferred franchise and regional developer fee revenue, net of current portion | 14,708,216 | | | | 13,503,745 | | |
| Other liabilities | 27,230 | | | | 27,230 | | |
| Total liabilities | 51,140,495 | | | | 44,981,760 | | |
| Commitments and contingencies | | | |
| Stockholders' equity: | | | |
| Series A preferred stock, $0.001 par value; 50,000 shares authorized, 0 issued and outstanding, as of June 30, 2021 and December 31, 2020 | — | | | | — | | |
| Common stock, $0.001 par value; 20,000,000 shares authorized, 14,406,148 shares issued and 14,375,362 shares outstanding as of June 30, 2021 and 14,174,237 shares issued and 14,157,070 outstanding as of December 31, 2020 | 14,405 | | | | 14,174 | | |
| Additional paid-in capital | 43,142,391 | | | | 41,350,001 | | |
| Treasury stock 30,786 shares as of June 30, 2021 and 17,167 shares as of December 31, 2020, at cost | (761,265 | ) | | | (143,111 | ) | |
| Accumulated deficit | (15,471,424 | ) | | | (20,470,081 | ) | |
| Total The Joint Corp. stockholders' equity | 26,924,107 | | | | 20,750,983 | | |
| Non-controlling Interest | 100 | | | | 100 | | |
| Total equity | 26,924,207 | | | | 20,751,083 | | |
| Total liabilities and stockholders' equity | $ | 78,064,702 | | | | $ | 65,732,843 | | |
THE JOINT CORP. AND SUBSIDIARY AND AFFILIATES
CONDENSED CONSOLIDATED INCOME STATEMENTS
(unaudited)
| | Three Months Ended
June 30, | | Six Months Ended
June 30, |
| | 2021 | | 2020 | | 2021 | | 2020 |
| Revenues: | | | | | | | |
| Revenues from company-owned or managed clinics | $ | 11,433,072 | | | | $ | 6,856,807 | | | | $ | 20,903,933 | | | | $ | 14,151,102 | | |
| Royalty fees | 5,332,618 | | | | 3,268,653 | | | | 10,101,862 | | | | 6,986,883 | | |
| Franchise fees | 623,655 | | | | 523,964 | | | | 1,319,082 | | | | 1,036,716 | | |
| Advertising fund revenue | 1,518,908 | | | | 930,795 | | | | 2,893,650 | | | | 1,988,413 | | |
| Software fees | 786,037 | | | | 631,198 | | | | 1,546,574 | | | | 1,276,922 | | |
| Regional developer fees | 214,434 | | | | 213,424 | | | | 432,390 | | | | 421,066 | | |
| Other revenues | 310,074 | | | | 164,952 | | | | 569,271 | | | | 373,177 | | |
| Total revenues | 20,218,798 | | | | 12,589,793 | | | | 37,766,762 | | | | 26,234,279 | | |
| Cost of revenues: | | | | | | | |
| Franchise and regional development cost of revenues | 1,786,833 | | | | 1,275,191 | | | | 3,411,404 | | | | 2,692,682 | | |
| IT cost of revenues | 251,705 | | | | 92,450 | | | | 392,450 | | | | 161,115 | | |
| Total cost of revenues | 2,038,538 | | | | 1,367,641 | | | | 3,803,854 | | | | 2,853,797 | | |
| Selling and marketing expenses | 3,132,715 | | | | 1,783,666 | | | | 5,622,043 | | | | 3,838,954 | | |
| Depreciation and amortization | 1,443,018 | | | | 693,400 | | | | 2,612,884 | | | | 1,347,649 | | |
| General and administrative expenses | 11,614,444 | | | | 8,541,108 | | | | 21,701,047 | | | | 17,235,358 | | |
| Total selling, general and administrative expenses | 16,190,177 | | | | 11,018,174 | | | | 29,935,974 | | | | 22,421,961 | | |
| Net (gain) loss on disposition or impairment | (44,260 | ) | | | (54,606 | ) | | | 20,508 | | | | (53,413 | ) | |
| Income from operations | 2,034,343 | | | | 258,584 | | | | 4,006,426 | | | | 1,011,934 | | |
| Other expense, net | (16,373 | ) | | | (25,243 | ) | | | (37,909 | ) | | | (29,581 | ) | |
| Income before income tax (benefit) expense | 2,017,970 | | | | 233,341 | | | | 3,968,517 | | | | 982,353 | | |
| Income tax (benefit) expense | (665,992 | ) | | | 117,756 | | | | (1,030,140 | ) | | | 51,821 | | |
| Net income | $ | 2,683,962 | | | | $ | 115,585 | | | | $ | 4,998,657 | | | | $ | 930,532 | | |
| Earnings per share: | | | | | | | |
| Basic earnings per share | $ | 0.19 | | | | $ | 0.01 | | | | $ | 0.35 | | | | $ | 0.07 | | |
| Diluted earnings per share | $ | 0.18 | | | | $ | 0.01 | | | | $ | 0.34 | | | | $ | 0.06 | | |
| Basic weighted average shares | 14,290,697 | | | | 13,980,984 | | | | 14,234,929 | | | | 13,935,829 | | |
| Diluted weighted average shares | 14,927,451 | | | | 14,491,639 | | | | 14,901,863 | | | | 14,487,083 | | |
THE JOINT CORP. AND SUBSIDIARY AND AFFILIATES
CONDENSED CONSOLIDATED STATEMENTS OF CASH FLOWS
(unaudited)
| | Six Months Ended
June 30, |
| | 2021 | | 2020 |
| Cash flows from operating activities: | | | |
| Net income | $ | 4,998,657 | | | | $ | 930,532 | | |
| Adjustments to reconcile net income to net cash provided by operating activities: | | | |
| Depreciation and amortization | 2,612,884 | | | | 1,347,649 | | |
| Net loss on disposition or impairment (non-cash portion) | 109,519 | | | | 1,193 | | |
| Net franchise fees recognized upon termination of franchise agreements | (81,196 | ) | | | (50,312 | ) | |
| Deferred income taxes | (1,380,631 | ) | | | (2,756 | ) | |
| Stock based compensation expense | 530,058 | | | | 466,473 | | |
| Changes in operating assets and liabilities: | | | |
| Accounts receivable | (954,888 | ) | | | 635,605 | | |
| Prepaid expenses and other current assets | (24,423 | ) | | | (35,789 | ) | |
| Deferred franchise costs | (881,891 | ) | | | 2,498 | | |
| Deposits and other assets | (53,096 | ) | | | 4,406 | | |
| Accounts payable | (162,524 | ) | | | (141,327 | ) | |
| Accrued expenses | 130,609 | | | | 406,986 | | |
| Payroll liabilities | 1,848,378 | | | | (784,505 | ) | |
| Deferred revenue | 1,757,294 | | | | (317,053 | ) | |
| Other liabilities | 565,779 | | | | 572,795 | | |
| Net cash provided by operating activities | 9,014,529 | | | | 3,036,395 | | |
| | | | |
| Cash flows from investing activities: | | | |
| Acquisition of AZ clinics | (1,925,000 | ) | | | — | | |
| Acquisition of NC clinics | (2,325,000 | ) | | | — | | |
| Purchase of property and equipment | (3,238,959 | ) | | | (1,986,367 | ) | |
| Reacquisition and termination of regional developer rights | (1,388,700 | ) | | | — | | |
| Payments received on notes receivable | — | | | | 80,441 | | |
| Net cash used in investing activities | (8,877,659 | ) | | | (1,905,926 | ) | |
| | | | |
| Cash flows from financing activities: | | | |
| Payments of finance lease obligation | (38,593 | ) | | | (23,509 | ) | |
| Purchases of treasury stock under employee stock plans | (618,154 | ) | | | (3,774 | ) | |
| Proceeds from exercise of stock options | 1,262,563 | | | | 387,920 | | |
| Proceeds from the Credit Agreement, net of related fees | — | | | | 1,947,352 | | |
| Proceeds from the Paycheck Protection Program | — | | | | 2,727,970 | | |
| Repayment of debt under the Paycheck Protection Program | (2,727,970 | ) | | | — | | |
| Net cash (used in) provided by financing activities | (2,122,154 | ) | | | 5,035,959 | | |
| | | | |
| (Decrease) increase in cash, cash equivalents and restricted cash | (1,985,284 | ) | | | 6,166,428 | | |
| Cash, cash equivalents and restricted cash, beginning of period | 20,819,629 | | | | 8,641,877 | | |
| Cash, cash equivalents and restricted cash, end of period | $ | 18,834,345 | | | | $ | 14,808,305 | | |
| | | | |
| Reconciliation of cash, cash equivalents and restricted cash: | June 30,
2021 | | June 30,
2020 |
| Cash and cash equivalents | $ | 18,521,042 | | | | $ | 14,573,266 | | |
| Restricted cash | 313,303 | | | | 235,039 | | |
| | $ | 18,834,345 | | | | $ | 14,808,305 | | |
Non-GAAP Financial Measures
The table below reconciles net income to Adjusted EBITDA for the three and six months ended June 30, 2021 and 2020.
| (unaudited) | Three Months Ended
June 30, | | Six Months Ended
June 30, |
| | 2021 | | 2020 | | 2021 | | 2020 |
| Non-GAAP Financial Data: | | | | | | | |
| Net income | $ | 2,683,962 | | | | $ | 115,585 | | | | $ | 4,998,657 | | | | $ | 930,532 | | |
| Net interest expense | 16,373 | | | | 25,243 | | | | 37,909 | | | | 29,580 | | |
| Depreciation and amortization expense | 1,443,018 | | | | 693,400 | | | | 2,612,884 | | | | 1,347,649 | | |
| Income tax (benefit) expense | (665,992 | ) | | | 117,756 | | | | (1,030,140 | ) | | | 51,821 | | |
| EBITDA | 3,477,361 | | | | 951,984 | | | | 6,619,310 | | | | 2,359,582 | | |
| Stock compensation expense | 283,564 | | | | 216,080 | | | | 530,058 | | | | 466,473 | | |
| Acquisition related expenses | 39,373 | | | | — | | | | 45,346 | | | | — | | |
| (Gain) loss on disposition or impairment | (44,260 | ) | | | (54,606 | ) | | | 20,508 | | | | (53,413 | ) | |
| Adjusted EBITDA | $ | 3,756,038 | | | | $ | 1,113,458 | | | | $ | 7,215,222 | | | | $ | 2,772,642 | | |
Exhibit 99.2

© 2021 The Joint Corp. All Rights Reserved. 1 Q2 2021 Financial Results As of June 30, 2021 | Reported on August 5, 2021

Safe Harbor Statement © 2021 The Joint Corp. All Rights Reserved. 2 Certain statements contained in this presentation are "forward - looking statements” about future events and expectations. Forward - looking statements are based on our beliefs, assumptions and expectations of industry trends, our future financial and operating performance and our growth plans, taking into account the in formation currently available to us. These statements are not statements of historical fact. Forward - looking statements involve risks and uncertainties that may cause our actual results to differ material ly from the expectations of future results we express or imply in any forward - looking statements, and you should not place undue reliance on such statements. Factors that could contribute to these differ enc es include, but are not limited to, the continuing impact of the COVID - 19 outbreak on the economy and our operations (including temporary clinic closures, shortened business hours and reduced patient de mand), our failure to develop or acquire company - owned or managed clinics as rapidly as we intend, our failure to profitably operate company - owned or managed clinics, and the other factors descr ibed in “Risk Factors” in our Annual Report on Form 10 - K as filed with the SEC for the year ended December 31, 2020, as updated or revised for any material changes described in any subsequently - filed Quarter ly Reports on Form 10 - Q or other SEC filings. We anticipate filing our Quarterly Report on Form 10 - Q for the quarter ended June 30, 2021 on or around August 6, 2021. Words such as, "anticipates," "be lieves," "continues," "estimates," "expects," "goal," "objectives," "intends," "may," "opportunity," "plans," "potential," "near - term," "long - term," "projections," "assumptions," "projects," "guid ance," "forecasts," "outlook," "target," "trends," "should," "could," "would," "will," and similar expressions are intended to identify such forward - looking statements. We qualify any forward - looking stateme nts entirely by these cautionary factors. We assume no obligation to update or revise any forward - looking statements for any reason or to update the reasons actual results could differ materially from tho se anticipated in these forward - looking statements, even if new information becomes available in the future. Comparisons of results for current and any prior periods are not intended to express any fut ure trends or indications of future performance, unless expressed as such, and should only be viewed as historical data. Business Structure The Joint Corp. is a franchisor of clinics and an operator of clinics in certain states. In Arkansas, California, Colorado, D ist rict of Columbia, Florida, Illinois, Kansas, Kentucky, Maryland, Massachusetts, Michigan, Minnesota, New Jersey, New York, North Carolina, Oregon, Pennsylvania, Rhode Island, South Dakota, Tennessee, Washi ngt on, West Virginia and Wyoming, The Joint Corp. and its franchisees provide management services to affiliated professional chiropractic practices.
© 2021 The Joint Corp. All Rights Reserved. 3 BUILD BRAND INCREASE AWARENESS DELIVER EXCEPTIONAL PATIENT EXPERIENCE OPEN NEW CLINICS Revolutionizing Access to Chiropractic Care As an essential healthcare service, The Joint Chiropractic’s mission is to improve the quality of life through routine and affordable chiropractic care.
Record Breaking Quarter 4 Q2 2021 Change from Q2 2020 Revenue $20.2M Up 61% Op. Income $2.0M Up 687% Adjusted EBITDA 2 $3.8M Up 237% Unrestricted cash $18.5 M at June 30, 2021, compared to $20.6M Dec. 31, 2020 © 2021 The Joint Corp. All Rights Reserved. 1 Comparable sales include only the sales from clinics that have been open at least 13 or 48 full months and exclude any clinics that have permanently closed. 2 Reconciliation of Adjusted EBITDA to GAAP earnings is included in the Appendix. 64 % Increase in sy stem - wide sales Q2 2021 over Q2 2020 53% In crease in comp sales 1 for all clinics >13 months in operation Q2 2021 over Q2 2020 44% In crease in comp sales 1 for all clinics >48 months in operation Q2 2021 over Q2 2020
Record 41 Clinics Opened in Q2 2021 Driving to 1,000 Clinics by the End of 2023 12 26 82 175 242 265 309 352 394 453 515 555 4 47 61 47 48 60 64 78 TOTAL CLINICS OPEN Franchise Company Owned/Managed © 2021 The Joint Corp. All Rights Reserved. 5 Q2 2020 Q2 2021 Franchise Licenses Sold 11 63 Total New Franchised Clinics Opened 12 36 Greenfield Clinics Opened 1 5 Franchised Clinics Acquired 0 8 Clinics in Development 209 282 370 399 442 513 312 246 579 633
Bringing Chiropractic C are to Military Bases © 2020 The Joint Corp. All Rights Reserved. 6 Natural Extension of Commitment to Military • 33M active - duty and retired service members and their families, along with disabled veterans and government civilians who work on military installations • I nitial target clinic sites: Phoenix, Tampa, and New Jersey • AAFES o perating • 4,900+ facilities • 30+ countries, 50 states, 4 U.S. territories and D.C.
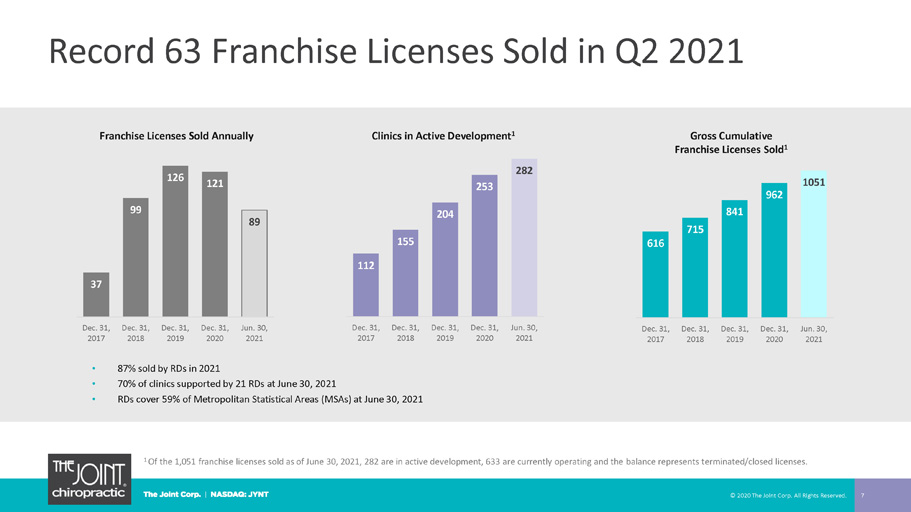
37 99 126 121 89 Dec. 31, 2017 Dec. 31, 2018 Dec. 31, 2019 Dec. 31, 2020 Jun. 30, 2021 616 715 841 962 1051 Dec. 31, 2017 Dec. 31, 2018 Dec. 31, 2019 Dec. 31, 2020 Jun. 30, 2021 112 155 204 253 282 Dec. 31, 2017 Dec. 31, 2018 Dec. 31, 2019 Dec. 31, 2020 Jun. 30, 2021 Record 63 Franchise Licenses Sold in Q2 2021 © 2020 The Joint Corp. All Rights Reserved. 7 1 Of the 1,051 franchise licenses sold as of June 30, 2021, 282 are in active development, 633 are currently operating and the bal ance represents terminated/closed licenses. • 87% sold by RDs in 2021 • 70% of clinics supported by 21 RDs at June 30, 2021 • RDs cover 59% of Metropolitan Statistical Areas (MSAs) at June 30, 2021 Gross Cumulative Franchise Licenses Sold 1 Franchise Licenses Sold Annually Clinics in Active Development 1
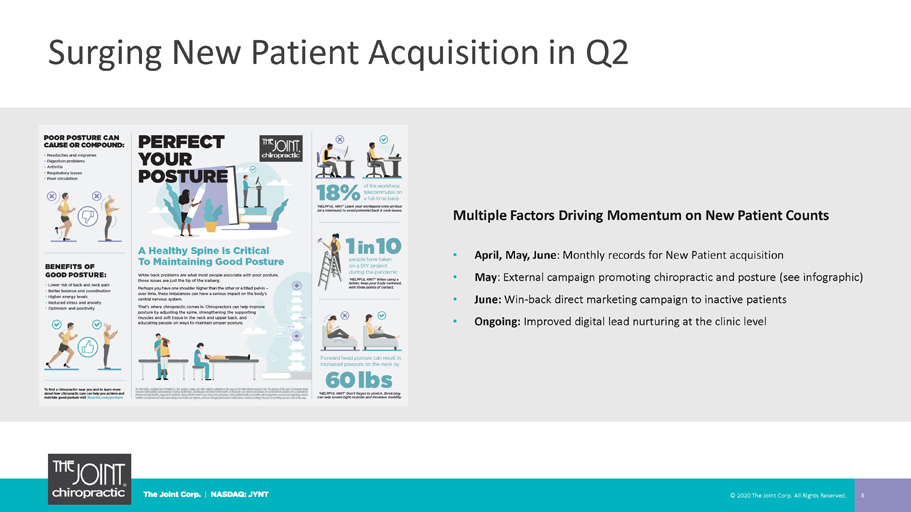
Surging New Patient Acquisition in Q2 © 2020 The Joint Corp. All Rights Reserved. 8 Multiple Factors Driving Momentum on New Patient Counts • April, May, June : Monthly records for New Patient acquisition • May : External campaign promoting chiropractic and posture (see infographic) • June: Win - back direct marketing campaign to inactive patients • Ongoing: Improved digital lead nurturing at the clinic level
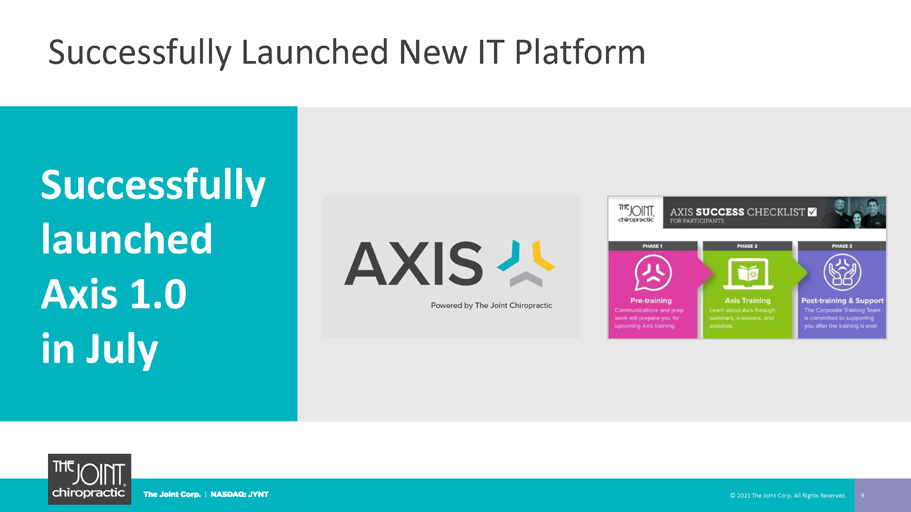
Successfully Launched New IT Platform 9 Successfully launched Axis 1.0 in July © 2021 The Joint Corp. All Rights Reserved.
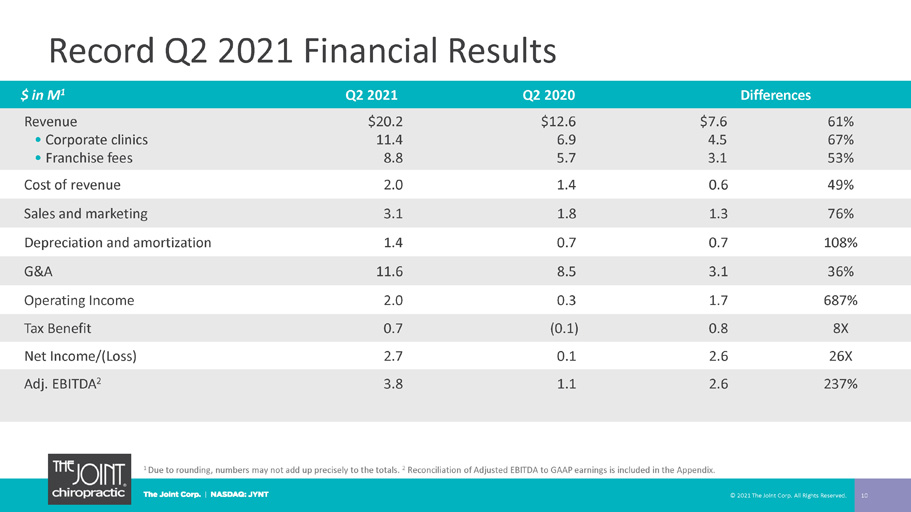
Record Q2 2021 Financial Results 10 $ in M 1 Q2 2021 Q2 2020 Differences Revenue • Corporate clinics • Franchise fees $20.2 11.4 8.8 $12.6 6.9 5.7 $7.6 4.5 3.1 61% 67% 53% Cost of revenue 2.0 1.4 0.6 49% Sales and marketing 3.1 1.8 1.3 76% Depreciation and amortization 1.4 0.7 0.7 108% G&A 11.6 8.5 3.1 36% Operating Income 2.0 0.3 1.7 687% Tax Benefit 0.7 (0.1) 0.8 8X Net Income/(Loss) 2.7 0.1 2.6 26X Adj. EBITDA 2 3.8 1.1 2.6 237% © 2021 The Joint Corp. All Rights Reserved. 1 Due to rounding, numbers may not add up precisely to the totals. 2 Reconciliation of Adjusted EBITDA to GAAP earnings is included in the Appendix.
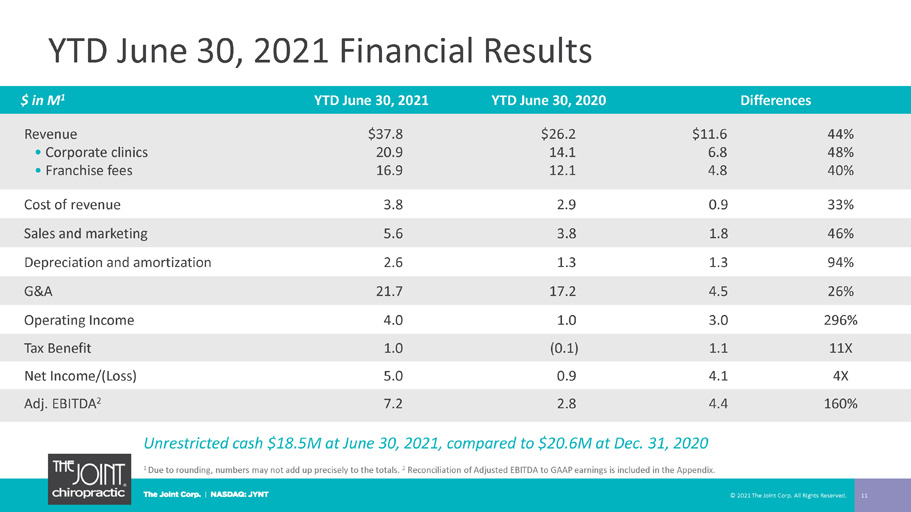
YTD June 30, 2021 Financial Results 11 $ in M 1 YTD June 30, 2021 YTD June 30, 2020 Differences Revenue • Corporate clinics • Franchise fees $37.8 20.9 16.9 $26.2 14.1 12.1 $11.6 6.8 4.8 44% 48% 40% Cost of revenue 3.8 2.9 0.9 33% Sales and marketing 5.6 3.8 1.8 46% Depreciation and amortization 2.6 1.3 1.3 94% G&A 21.7 17.2 4.5 26% Operating Income 4.0 1.0 3.0 296% Tax Benefit 1.0 (0.1) 1.1 11X Net Income/(Loss) 5.0 0.9 4.1 4X Adj. EBITDA 2 7.2 2.8 4.4 160% 1 Due to rounding, numbers may not add up precisely to the totals. 2 Reconciliation of Adjusted EBITDA to GAAP earnings is included in the Appendix. © 2021 The Joint Corp. All Rights Reserved. Unrestricted cash $18.5 M at June 30, 2021, compared to $20.6M at Dec. 31, 2020
Raising All Elements of 2021 Guidance 12 $ in M 2020 Actual 2021 Low Guidance 2021 High Guidance Midpoint 2021 vs 2020 Revenues 1 $58.7 $77.0 $79.0 Up 33% Adjusted EBITDA 1,2 $9.1 $12.5 $13.5 Up 43% New Franchised Clinic Openings 1 70 90 110 Up 57% New Company - owned/Managed Clinics 1,3 4 25 35 7.5X greater © 2021 The Joint Corp. All Rights Reserved. 1 The guidance provided on May 6, 2021: Revenue expected between $73.5M and $77.5M; d Adjusted EBITDA expected between $11.0M a nd $12.5M ; new franchised clinic openings between 80 and 100, and new company - owned/managed clinics between 20 and 30. 2 Reconciliation of Adjusted EBITDA to GAAP earnings is included in the appendix. 3 Through a combination of both greenfields and buybacks.
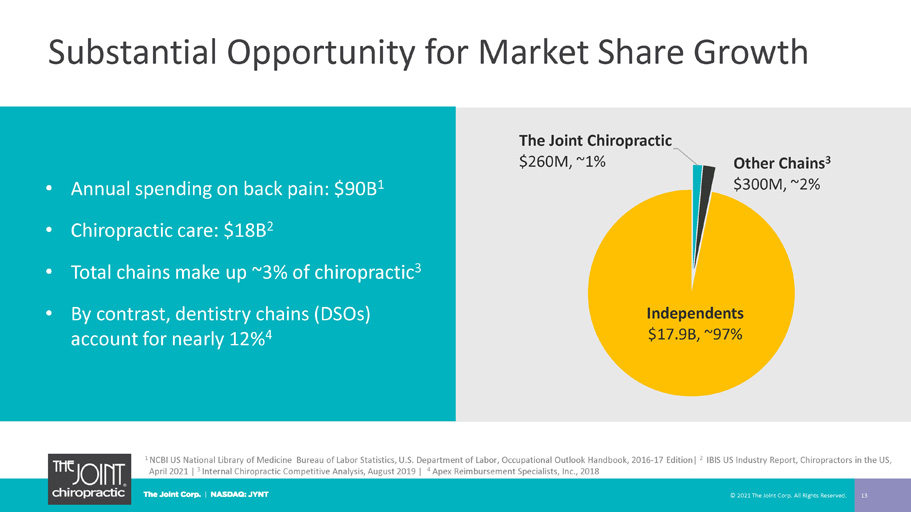
Substantial Opportunity for Market Share Growth © 2021 The Joint Corp. All Rights Reserved. 13 1 NCBI US National Library of Medicine Bureau of Labor Statistics, U.S. Department of Labor, Occupational Outlook Handbook, 20 16 - 17 Edition| 2 IBIS US Industry Report, Chiropractors in the US, April 2021 | 3 Internal Chiropractic Competitive Analysis, August 2019 | 4 Apex Reimbursement Specialists, Inc., 2018 The Joint Chiropractic $260M, ~ 1% Other Chains 3 $300M, ~ 2% Independents $17.9B, ~ 97% • Annual spending on back pain: $90B 1 • Chiropractic care: $18B 2 • Total chains make up ~3% of chiropractic 3 • By contrast, dentistry chains (DSOs) account for nearly 12% 4
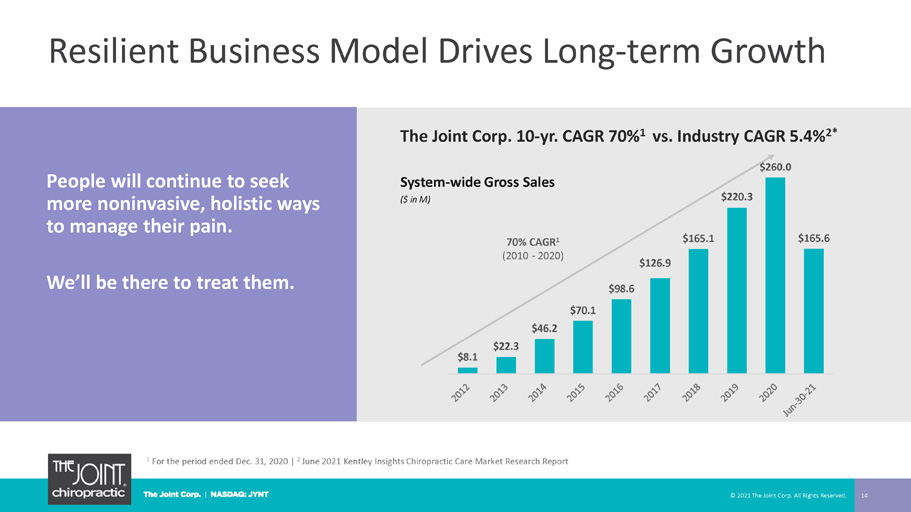
Resilient Business Model Drives Long - term Growth 14 People will continue to seek more noninvasive, holistic ways to manage their pain. We’ll be there to treat them. System - wide Gross Sales ($ in M) 70% CAGR 1 (2010 - 2020) The Joint Corp. 10 - yr. CAGR 70% 1 vs. Industry CAGR 5.4% 2* 1 For the period ended Dec. 31, 2020 | 2 June 2021 Kentley Insights Chiropractic Care Market Research Report © 2021 The Joint Corp. All Rights Reserved. $8.1 $22.3 $46.2 $70.1 $98.6 $126.9 $165.1 $220.3 $260.0 $165.6
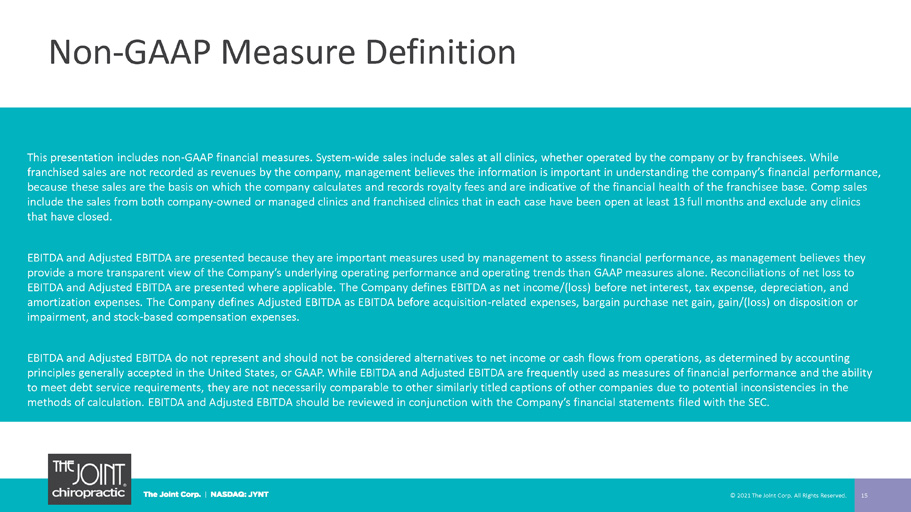
Non - GAAP Measure Definition 15 This presentation includes non - GAAP financial measures. System - wide sales include sales at all clinics, whether operated by the company or by fran chisees. While franchised sales are not recorded as revenues by the company, management believes the information is important in understandi ng the company’s financial performance, because these sales are the basis on which the company calculates and records royalty fees and are indicative of the financia l h ealth of the franchisee base. Comp sales include the sales from both company - owned or managed clinics and franchised clinics that in each case have been open at least 13 full months and exclude any clinics that have closed. EBITDA and Adjusted EBITDA are presented because they are important measures used by management to assess financial performan ce, as management believes they provide a more transparent view of the Company’s underlying operating performance and operating trends than GAAP measures alone. Reconciliat ion s of net loss to EBITDA and Adjusted EBITDA are presented where applicable. The Company defines EBITDA as net income/(loss) before net interes t, tax expense, depreciation, and amortization expenses. The Company defines Adjusted EBITDA as EBITDA before acquisition - related expenses, bargain purchase net gain, gain/(loss) on disposition or impairment, and stock - based compensation expenses. EBITDA and Adjusted EBITDA do not represent and should not be considered alternatives to net income or cash flows from operat ion s, as determined by accounting principles generally accepted in the United States, or GAAP. While EBITDA and Adjusted EBITDA are frequently used as measures of financial performance and the ability to meet debt service requirements, they are not necessarily comparable to other similarly titled captions of other companies due to potential inconsistencies in the methods of calculation. EBITDA and Adjusted EBITDA should be reviewed in conjunction with the Company’s financial statements fil ed with the SEC. © 2021 The Joint Corp. All Rights Reserved.
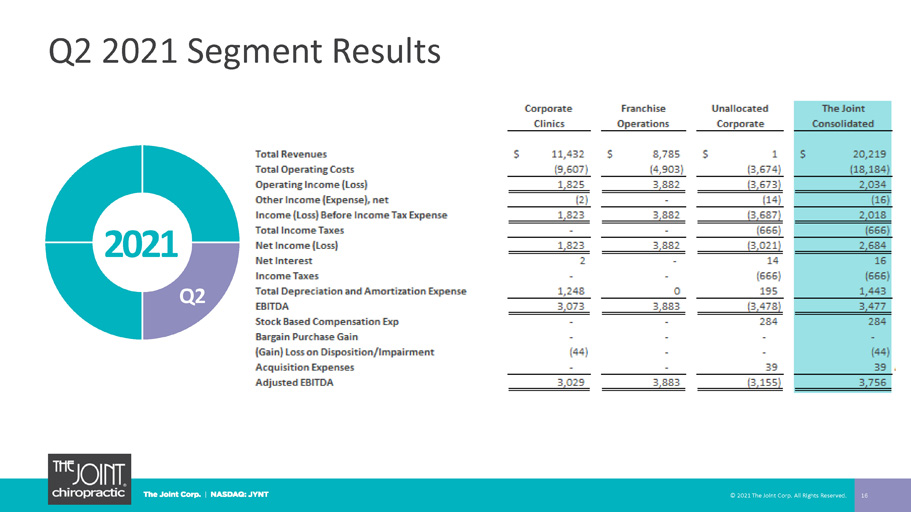
Q2 2021 Segment Results 16 2021 Q2 © 2021 The Joint Corp. All Rights Reserved.
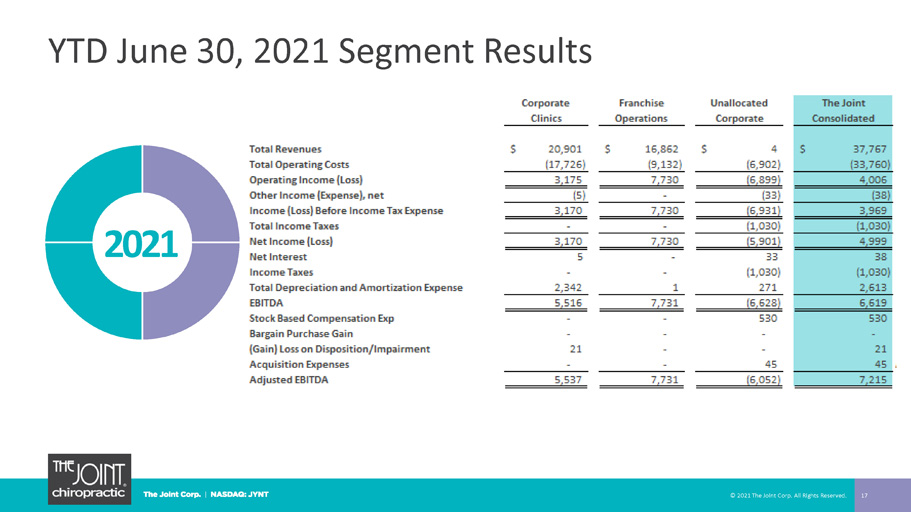
YTD June 30, 2021 Segment Results 17 2021 © 2021 The Joint Corp. All Rights Reserved.
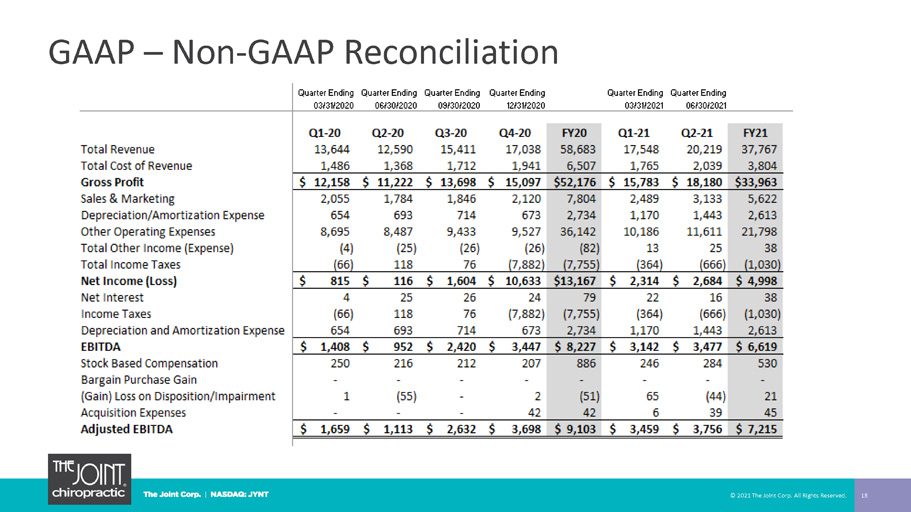
GAAP – Non - GAAP Reconciliation 18 © 2021 The Joint Corp. All Rights Reserved.

Jake Singleton, CFO [email protected] The Joint Corp. | 16767 N. Perimeter Dr., Suite 110, Scottsdale, AZ 85260 | (480) 245 - 5960 https://www.facebook.com/thejointchiro @ thejointchiro https://twitter.com/thejointchiro @ thejointchiro https://www.youtube.com/thejointcorp @ thejointcorp Peter D. Holt, President and CEO [email protected] The Joint Corp. | 16767 N. Perimeter Dr., Suite 110, Scottsdale, AZ 85260 | (480) 245 - 5960 Kirsten Chapman, LHA Investor Relations [email protected] LHA Investor Relations | One Market Street, Spear Tower, Suite 3600, San Francisco, CA 94105 | (415) 433 - 3777 19 The Joint Corp. Contact Information © 2021 The Joint Corp. All Rights Reserved.