Exhibit 99.1

Kayne Anderson BDC, Inc. Announces September 30,
2025 Financial Results and Declares Fourth Quarter 2025 Dividend of $0.40 Per Share
CHICAGO--(BUSINESS
WIRE)-- Kayne Anderson BDC, Inc. (NYSE: KBDC) (“KBDC or the Company”), a business development company externally managed
by its investment adviser, KA Credit Advisors, LLC, today announced its financial results for the third quarter ended September 30, 2025.
Financial Highlights for the Quarter Ended September 30,
2025
| ● | Net investment income of $30.0 million, or $0.43 per share; |
| ● | Net asset value of $16.34 per share, decreased from $16.37 per share as of June 30, 2025, primarily as a result of unrealized losses
of $0.08 offset by higher net investment income earned over distributions paid of $0.03 and accretive share repurchases of $0.02; |
| ● | New private credit and equity co-investment commitments of $295.5 million, fundings of $273.6 million
and repayments of $73.5 million, resulting in a net funded private credit and equity investment increase of $200.1 million; |
| ● | Sales and repayments of broadly syndicated loans of $113.0 million; |
| ● | The Company’s Board of Directors (the “Board”) declared a regular dividend of $0.40
per share, to be paid on January 16, 2026 to stockholders of record as of December 31, 2025. |
“We delivered another solid quarter marked by strong origination
activity, stable credit performance and a high-quality earnings mix. With nearly $300 million in new private credit investments
at an average spread of 568bps over SOFR, we continue to see healthy deal flow in the core middle market, driven in-part by a recent pickup
in M&A-related financing opportunities, which we believe bodes well for outlook in the near-term,” said Doug Goodwillie, Co-Chief
Executive Officer.
“Despite broader market volatility and headlines around the private
credit space, our target market broadly and portfolio specifically continue to demonstrate strong fundamentals. We remain defensively
positioned with 94% of our portfolio invested in first-lien senior secured loans, lending at an average leverage level of 4.2x, lower
than many of our peers, and continue to be pleased with credit performance of our loan book with a non-accrual rate of just 1.4%,”
said Ken Leonard, Co-Chief Executive Officer. “We believe KBDC is well-positioned to continue its relative outperformance while
generating attractive, risk-adjusted returns through varying market cycles.”
Selected Financial Highlights
| | |
As of | |
| (in thousands, expect per share data) | |
September 30,
2025 | | |
June 30,
2025 | |
| Investment portfolio, at fair value | |
$ | 2,255,513 | | |
$ | 2,174,640 | |
| Total assets | |
$ | 2,337,968 | | |
$ | 2,255,991 | |
| Total debt outstanding, at principal | |
$ | 1,153,000 | | |
$ | 1,054,000 | |
| Net assets | |
$ | 1,140,096 | | |
$ | 1,157,331 | |
| Net asset value per share | |
$ | 16.34 | | |
$ | 16.37 | |
| Total debt-to-equity ratio | |
| 1.01x | | |
| 0.91x | |
| | |
For the quarter ended | |
| | |
September 30,
2025 | | |
June 30,
2025 | |
| | |
| | |
| |
| Net investment income per share | |
$ | 0.43 | | |
$ | 0.40 | |
| Net realized and unrealized gains (losses) per share(1) | |
$ | (0.08 | ) | |
$ | (0.05 | ) |
| Earnings per share | |
$ | 0.35 | | |
$ | 0.35 | |
| Regular dividend per share | |
$ | 0.40 | | |
$ | 0.40 | |
| Special dividend per share | |
$ | - | | |
$ | 0.10 | |
| (1) | Amounts shown may not correspond for the period as it includes the effect of the timing
of the distribution, shares repurchased, and the issuance of common stock. |
Results of Operations
Total investment income for the quarter ended September
30, 2025 was $61.3 million, as compared to $57.3 million for the quarter ended June 30, 2025. The increase was primarily driven by rotations
out of the lower yielding broadly syndicated loans into middle market loans, accelerated amortization and fees earned from repayments
and the impact of net additions to the portfolio during the third quarter. PIK income represented 3.5% of total interest income for the
quarter ended September 30, 2025.
Net investment income for the quarter ended September
30, 2025 was $30.0 million or $0.43 per share as compared to $28.7 million or $0.40 per share for the quarter ended June 30, 2025. Net
expenses for the third quarter were $31.3 million, as compared to $28.6 million for the quarter ended June 30, 2025. The increase was
primarily the result of higher average borrowings on our credit facilities and increased base management fees as a partial fee waiver
was in effect during the second quarter.
For the quarter ended September
30, 2025, the Company had a net change in unrealized losses on investments of $5.0 million. The unrealized losses for the quarter were
primarily driven by negative fair value changes and quarterly amortization of original issue discounts, partially offset by new upfront
fees for originations during the quarter. Additionally, the Company had $0.4 million of deferred income tax expense related to unrealized
gains on equity investments in the Company’s wholly owned taxable subsidiary.
Portfolio and Investment Activity
| | |
As of | |
| ($ in thousands) | |
September 30,
2025 | | |
June 30,
2025 | |
| | |
| | |
| |
| Investments at fair value | |
$ | 2,255,513 | | |
$ | 2,174,640 | |
| Number of portfolio companies | |
| 108 | | |
| 114 | |
| Average portfolio company investment size | |
$ | 20,884 | | |
$ | 19,076 | |
| | |
| | | |
| | |
| Asset class: | |
| | | |
| | |
| First lien debt | |
| 93.7 | % | |
| 98.0 | % |
| Subordinated debt | |
| 4.6 | % | |
| 0.8 | % |
| Equity | |
| 1.7 | % | |
| 1.2 | % |
| | |
| | | |
| | |
| Non-accrual debt investments: | |
| | | |
| | |
| Non-accrual investments at fair value | |
$ | 30,974 | | |
$ | 34,535 | |
| Non-accrual investments as a percentage of debt investments at fair value | |
| 1.4 | % | |
| 1.6 | % |
| Number of investments on non-accrual | |
| 5 | | |
| 5 | |
| | |
| | | |
| | |
| Interest rate type: | |
| | | |
| | |
| Percentage floating-rate | |
| 96.0 | % | |
| 100.0 | % |
| Percentage fixed-rate | |
| 4.0 | % | |
| 0.0 | % |
| | |
| | | |
| | |
| Yields excluding non-income producing debt investments (at fair value): | |
| | | |
| | |
| Weighted average yield on private middle market loans | |
| 10.7 | % | |
| 10.9 | % |
| Weighted average yield on broadly syndicated loans | |
| 6.7 | % | |
| 6.9 | % |
| Weighted average yield on total debt portfolio | |
| 10.6 | % | |
| 10.6 | % |
| | |
| | | |
| | |
| Yields including non-income producing debt investments (at fair value): | |
| | | |
| | |
| Weighted average yield on private middle market loans | |
| 10.5 | % | |
| 10.7 | % |
| Weighted average yield on broadly syndicated loans | |
| 6.7 | % | |
| 6.9 | % |
| Weighted average yield on total debt portfolio | |
| 10.4 | % | |
| 10.4 | % |
| | |
| | | |
| | |
| Investment activity during the quarter ended: | |
| | | |
| | |
| Gross new investment commitments | |
$ | 295,492 | (1) | |
$ | 128,675 | (2) |
| Principal amount of investments funded | |
$ | 273,574 | (1) | |
$ | 128,665 | (2) |
| Principal amount of investments sold or repaid | |
$ | (186,434 | )(1) | |
$ | (118,602 | )(2) |
| Net principal amount of investments funded | |
$ | 87,140 | | |
$ | 10,063 | |
| (1) | For the quarter
ended September 30, 2025, broadly syndicated loans represent $0 of new investment commitments, $0 of investments funded and $112,952
of investments sold or repaid. |
| (2) | For the quarter
ended June 30, 2025, broadly syndicated loans represent $0 of new investment commitments, $0 of investments funded and $46,506 of investments
sold or repaid. |
Liquidity and Capital Resources
As of September 30, 2025, the Company had $75 million
senior unsecured notes outstanding, $1,078 million borrowed under its credit facilities and cash and cash equivalents of $46.1 million
(including investments in money market funds). As of that date, the Company had $322 million of undrawn commitments available on its credit
facilities (subject to borrowing base restrictions and other conditions).
As of September 30, 2025, the Company’s debt-to-equity
ratio was 1.01x and its asset coverage ratio was 199%. The Company targets a debt-to-equity ratio of 1.0x to 1.25x (which equates to asset
coverage of 200% to 180%). During the third quarter, the Company reached the low end of its target debt-to-equity ratio range and expects
to continue to grow its private credit portfolio. The Company may operate above or below its target based on market conditions.
Recent Developments
| ● | On October 15, 2025, the Company completed a $200 million private placement of senior unsecured notes, comprising $40 million of floating
rate Series C Notes (SOFR + 2.32%) due June 2028, $60 million of 5.80% Series D Notes due June 2028, and $100 million of 6.15% Series
E Notes due October 2030. Proceeds were used to refinance debt and for general corporate purposes. To better match its predominantly floating
rate investment portfolio, the Company entered into interest rate swaps for the Series D and E Notes, effectively converting the fixed
rates to floating rates of SOFR plus 2.37% and SOFR plus 2.6565%, respectively. |
| ● | On November 4, 2025, the Board of Directors declared a regular dividend to common stockholders in the amount of $0.40 per share. The
regular dividend of $0.40 per share will be paid on January 16, 2026, to stockholders of record as of the close of business on December
31, 2025. |
| ● | From October 1, 2025 to November 5, 2025, the Company’s agent repurchased 1,369,049 shares of common stock at an average price
of $13.99 per share for a total amount of $19.2 million. As of November 5, 2025, $65.7 million remains for repurchase under the Company’s
amended 10b5-1 Plan. |
| ● | On November 10, 2025, the Company issued a press release announcing that the Board of Directors of the Company appointed Frank P.
Karl as President and appointed Andy Wedderburn-Maxwell as Senior Vice President. |
Conference Call Information
KBDC will host a conference call at 10:00 am ET on Tuesday,
November 11, 2025, to review its financial results. All interested parties are invited to participate using the following telephone dial-in
or the webcast details:
Telephone Dial-in
| ● | International: +1 646-307-1963 |
Webcast Link
| ● | https://events.q4inc.com/attendee/531241415 |
To avoid potential delays, please join at least 10 minutes
prior to the start of the earnings call. A telephone replay will also be available by dialing 800-770-2030 (domestic) and +1 609-800-9909
(international) and conference ID of 2616610. The replay will be available until November 18, 2025.
Kayne Anderson BDC, Inc.
Consolidated Statements of Assets and Liabilities
(amounts in 000’s, except share and per share amounts)
| | |
September 30,
2025 | | |
December 31,
2024 | |
| Assets: | |
(Unaudited) | | |
| |
| Investments, at fair value: | |
| | |
| |
| Non-controlled, non-affiliated investments (amortized cost of $2,134,139 and $1,956,617) | |
$ | 2,146,829 | | |
$ | 1,982,947 | |
| Non-controlled, affiliated investments (amortized cost of $113,426 and $15,438, respectively) | |
| 108,684 | | |
| 12,196 | |
| Investments in money market funds (amortized cost of $29,765 and $48,683) | |
| 29,765 | | |
| 48,683 | |
| Cash | |
| 16,360 | | |
| 22,375 | |
| Receivable for sales of investments | |
| 14,150 | | |
| - | |
| Receivable for principal payments on investments | |
| 334 | | |
| 540 | |
| Interest receivable | |
| 21,500 | | |
| 14,965 | |
| Prepaid expenses and other assets | |
| 346 | | |
| 958 | |
| Total Assets | |
$ | 2,337,968 | | |
$ | 2,082,664 | |
| | |
| | | |
| | |
| Liabilities: | |
| | | |
| | |
| Corporate Credit Facility | |
$ | 301,000 | | |
$ | 250,000 | |
| Unamortized Corporate Credit Facility issuance costs | |
| (3,636 | ) | |
| (3,235 | ) |
| Revolving Funding Facility | |
| 570,000 | | |
| 420,000 | |
| Unamortized Revolving Funding Facility issuance costs | |
| (5,228 | ) | |
| (4,746 | ) |
| Revolving Funding Facility II | |
| 207,000 | | |
| 113,000 | |
| Unamortized Revolving Funding Facility II issuance costs | |
| (2,233 | ) | |
| (1,251 | ) |
| Notes | |
| 75,000 | | |
| 75,000 | |
| Unamortized notes issuance costs | |
| (639 | ) | |
| (643 | ) |
| Shares repurchased payable | |
| 706 | | |
| - | |
| Distributions payable | |
| 27,927 | | |
| 28,424 | |
| Management fee payable | |
| 5,583 | | |
| 3,712 | |
| Incentive fee payable | |
| 4,419 | | |
| - | |
| Accrued expenses and other liabilities | |
| 17,973 | | |
| 15,236 | |
| Accrued excise tax expense | |
| - | | |
| 825 | |
| Total Liabilities | |
$ | 1,197,872 | | |
$ | 896,322 | |
| | |
| | | |
| | |
| Commitments and contingencies | |
| | | |
| | |
| | |
| | | |
| | |
| Net Assets: | |
| | | |
| | |
| Common Shares, $0.001 par value; 100,000,000 shares authorized; 69,764,799
and 71,059,689 as of September 30, 2025 and December 31, 2024, respectively, issued and outstanding | |
$ | 70 | | |
$ | 71 | |
| Additional paid-in capital | |
| 1,133,350 | | |
| 1,152,396 | |
| Total distributable earnings (deficit) | |
| 6,676 | | |
| 33,875 | |
| Total Net Assets | |
$ | 1,140,096 | | |
$ | 1,186,342 | |
| Total Liabilities and Net Assets | |
$ | 2,337,968 | | |
$ | 2,082,664 | |
| Net Asset Value Per Common Share | |
$ | 16.34 | | |
$ | 16.70 | |
Kayne Anderson BDC, Inc.
Consolidated Statements of Operations
(amounts in 000’s, except share and per share
amounts)
| | |
For the Three Months Ended | | |
For the Nine Months Ended | |
| | |
September 30 | | |
September 30 | |
| | |
2025 | | |
2024 | | |
2025 | | |
2024 | |
| Income: | |
(Unaudited) | | |
(Unaudited) | | |
(Unaudited) | | |
(Unaudited) | |
| Investment income from investments: | |
| | |
| | |
| | |
| |
| Interest income from non-controlled, non-affiliated investments | |
$ | 58,898 | | |
$ | 57,541 | | |
$ | 171,032 | | |
$ | 155,015 | |
| Interest income from non-controlled, affiliated investments | |
| 2,063 | | |
| - | | |
| 2,063 | | |
| 754 | |
| Dividend income | |
| 412 | | |
| 278 | | |
| 821 | | |
| 997 | |
| Total Investment Income | |
| 61,373 | | |
| 57,819 | | |
| 173,916 | | |
| 156,766 | |
| | |
| | | |
| | | |
| | | |
| | |
| Expenses: | |
| | | |
| | | |
| | | |
| | |
| Management fees | |
| 5,583 | | |
| 4,764 | | |
| 16,126 | | |
| 12,537 | |
| Incentive fees | |
| 4,419 | | |
| 5,605 | | |
| 13,361 | | |
| 12,345 | |
| Interest expense | |
| 20,207 | | |
| 16,069 | | |
| 55,716 | | |
| 44,964 | |
| Professional fees | |
| 369 | | |
| 403 | | |
| 1,082 | | |
| 1,042 | |
| Directors fees | |
| 158 | | |
| 158 | | |
| 474 | | |
| 463 | |
| Excise tax expense (benefit) | |
| - | | |
| - | | |
| (43 | ) | |
| - | |
| Other general and administrative expenses | |
| 591 | | |
| 563 | | |
| 1,775 | | |
| 1,542 | |
| Total Expenses | |
| 31,327 | | |
| 27,562 | | |
| 88,491 | | |
| 72,893 | |
| Less: Management fee waiver | |
| - | | |
| (1,191 | ) | |
| (2,071 | ) | |
| (1,662 | ) |
| Less: Incentive fee waiver | |
| - | | |
| (5,605 | ) | |
| - | | |
| (9,714 | ) |
| Net Expenses | |
| 31,327 | | |
| 20,766 | | |
| 86,420 | | |
| 61,517 | |
| Net Investment Income (Loss) | |
| 30,046 | | |
| 37,053 | | |
| 87,496 | | |
| 95,249 | |
| | |
| | | |
| | | |
| | | |
| | |
| Realized and unrealized gains (losses) on investments | |
| | | |
| | | |
| | | |
| | |
| Net realized gains (losses): | |
| | | |
| | | |
| | | |
| | |
| Non-controlled, non-affiliated investments | |
| (22 | ) | |
| - | | |
| 534 | | |
| (138 | ) |
| Total net realized gains (losses) | |
| (22 | ) | |
| - | | |
| 534 | | |
| (138 | ) |
| Net change in unrealized gains (losses): | |
| | | |
| | | |
| | | |
| | |
| Non-controlled, non-affiliated investments | |
| (5,407 | ) | |
| 1,031 | | |
| (13,464 | ) | |
| 3,323 | |
| Non-controlled, affiliated investments | |
| 424 | | |
| (528 | ) | |
| (1,501 | ) | |
| (1,943 | ) |
| Total net change in unrealized gains (losses) | |
| (4,983 | ) | |
| 503 | | |
| (14,965 | ) | |
| 1,380 | |
| Total realized and unrealized gains (losses) | |
| (5,005 | ) | |
| 503 | | |
| (14,431 | ) | |
| 1,242 | |
| Income tax (expense) benefit on unrealized appreciation/depreciation on investments | |
| (428 | ) | |
| - | | |
| (1,327 | ) | |
| - | |
| Net Increase in Net Assets Resulting from Operations | |
$ | 24,613 | | |
$ | 37,556 | | |
$ | 71,738 | | |
$ | 96,491 | |
| Per Common Share Data: | |
| | | |
| | | |
| | | |
| | |
| Basic and diluted net investment income per common share | |
$ | 0.43 | | |
$ | 0.52 | | |
$ | 1.23 | | |
$ | 1.55 | |
| Basic and diluted net increase in net assets resulting from operations | |
$ | 0.35 | | |
$ | 0.53 | | |
$ | 1.01 | | |
$ | 1.57 | |
| Weighted Average Common Shares Outstanding - Basic and Diluted | |
| 70,430,331 | | |
| 71,083,885 | | |
| 70,852,621 | | |
| 61,321,163 | |
About Kayne Anderson BDC, Inc.
Kayne Anderson BDC, Inc. is a business development company
(“BDC”) that invests primarily in first lien senior secured loans, with a secondary focus on unitranche and split-lien loans
to middle market companies. KBDC is externally managed by its investment adviser, KA Credit Advisors, LLC, an indirect controlled subsidiary
of Kayne Anderson Capital Advisors, L.P., a prominent alternative investment management firm. KBDC has elected to be regulated as a BDC
under the Investment Company Act of 1940, as amended (“1940 Act”). KBDC’s investment objective is to generate current
income and, to a lesser extent, capital appreciation. For more information, please visit www.kaynebdc.com.
Forward-looking Statements
This press release may contain “forward-looking
statements” that involve substantial risks and uncertainties. Such statements involve known and unknown risks, uncertainties and
other factors and undue reliance should not be placed thereon. These forward-looking statements are not historical facts, but rather are
based on current expectations, estimates and projections about KBDC, its current and prospective portfolio investments, its industry,
its beliefs and opinions, and its assumptions. Words such as “anticipates,” “expects,” “intends,”
“plans,” “will,” “may,” “continue,” “believes,” “seeks,” “estimates,”
“would,” “could,” “should,” “targets,” “projects,” “outlook,”
“potential,” “predicts” and variations of these words and similar expressions are intended to identify forward-looking
statements. These statements are not guarantees of future performance and are subject to risks, uncertainties and other factors, some
of which are beyond KBDC’s control and difficult to predict and could cause actual results to differ materially from those expressed
or forecasted in the forward-looking statements including, without limitation, the risks, uncertainties and other factors identified in
KBDC’s filings with the SEC. All forward-looking statements speak only as of the date of this press release. KBDC does not undertake
any obligation to update or revise any forward-looking statements or any other information contained herein, except as required by applicable
law.
Contacts:
Investor Relations
[email protected]
6
Exhibit 99.2
KAYNEBDC.COM KAYNE ANDERSON BDC, INC. EARNINGS PRESENTATION Third Quarter 2025
2 Disclaimer and Forward - Looking Statement This presentation may contain “forward - looking statements” that involve substantial risks and uncertainties . Such statements involve known and unknown risks, uncertainties and other factors and undue reliance should not be placed thereon . These forward - looking statements are not historical facts, but rather are based on current expectations, estimates and projections about Kayne Anderson BDC, Inc . (“KBDC”), its current and prospective portfolio investments, its industry, its beliefs and opinions, and its assumptions . Words such as “anticipates,” “expects,” “intends,” “plans,” “will,” “may,” “continue,” “believes,” “seeks,” “estimates,” “would,” “could,” “should,” “targets,” “projects,” “outlook,” “potential,” “predicts” and variations of these words and similar expressions are intended to identify forward - looking statements . These statements are not guarantees of future performance and are subject to risks, uncertainties and other factors, some of which are beyond KBDC’s control and difficult to predict and could cause actual results to differ materially from those expressed or forecasted in the forward - looking statements including, without limitation, the risks, uncertainties and other factors identified in KBDC’s filings with the SEC . All forward - looking statements speak only as of the date of this presentation . KBDC does not undertake any obligation to update or revise any forward - looking statements or any other information contained herein, except as required by applicable law .

EXECUTIVE SUMMARY
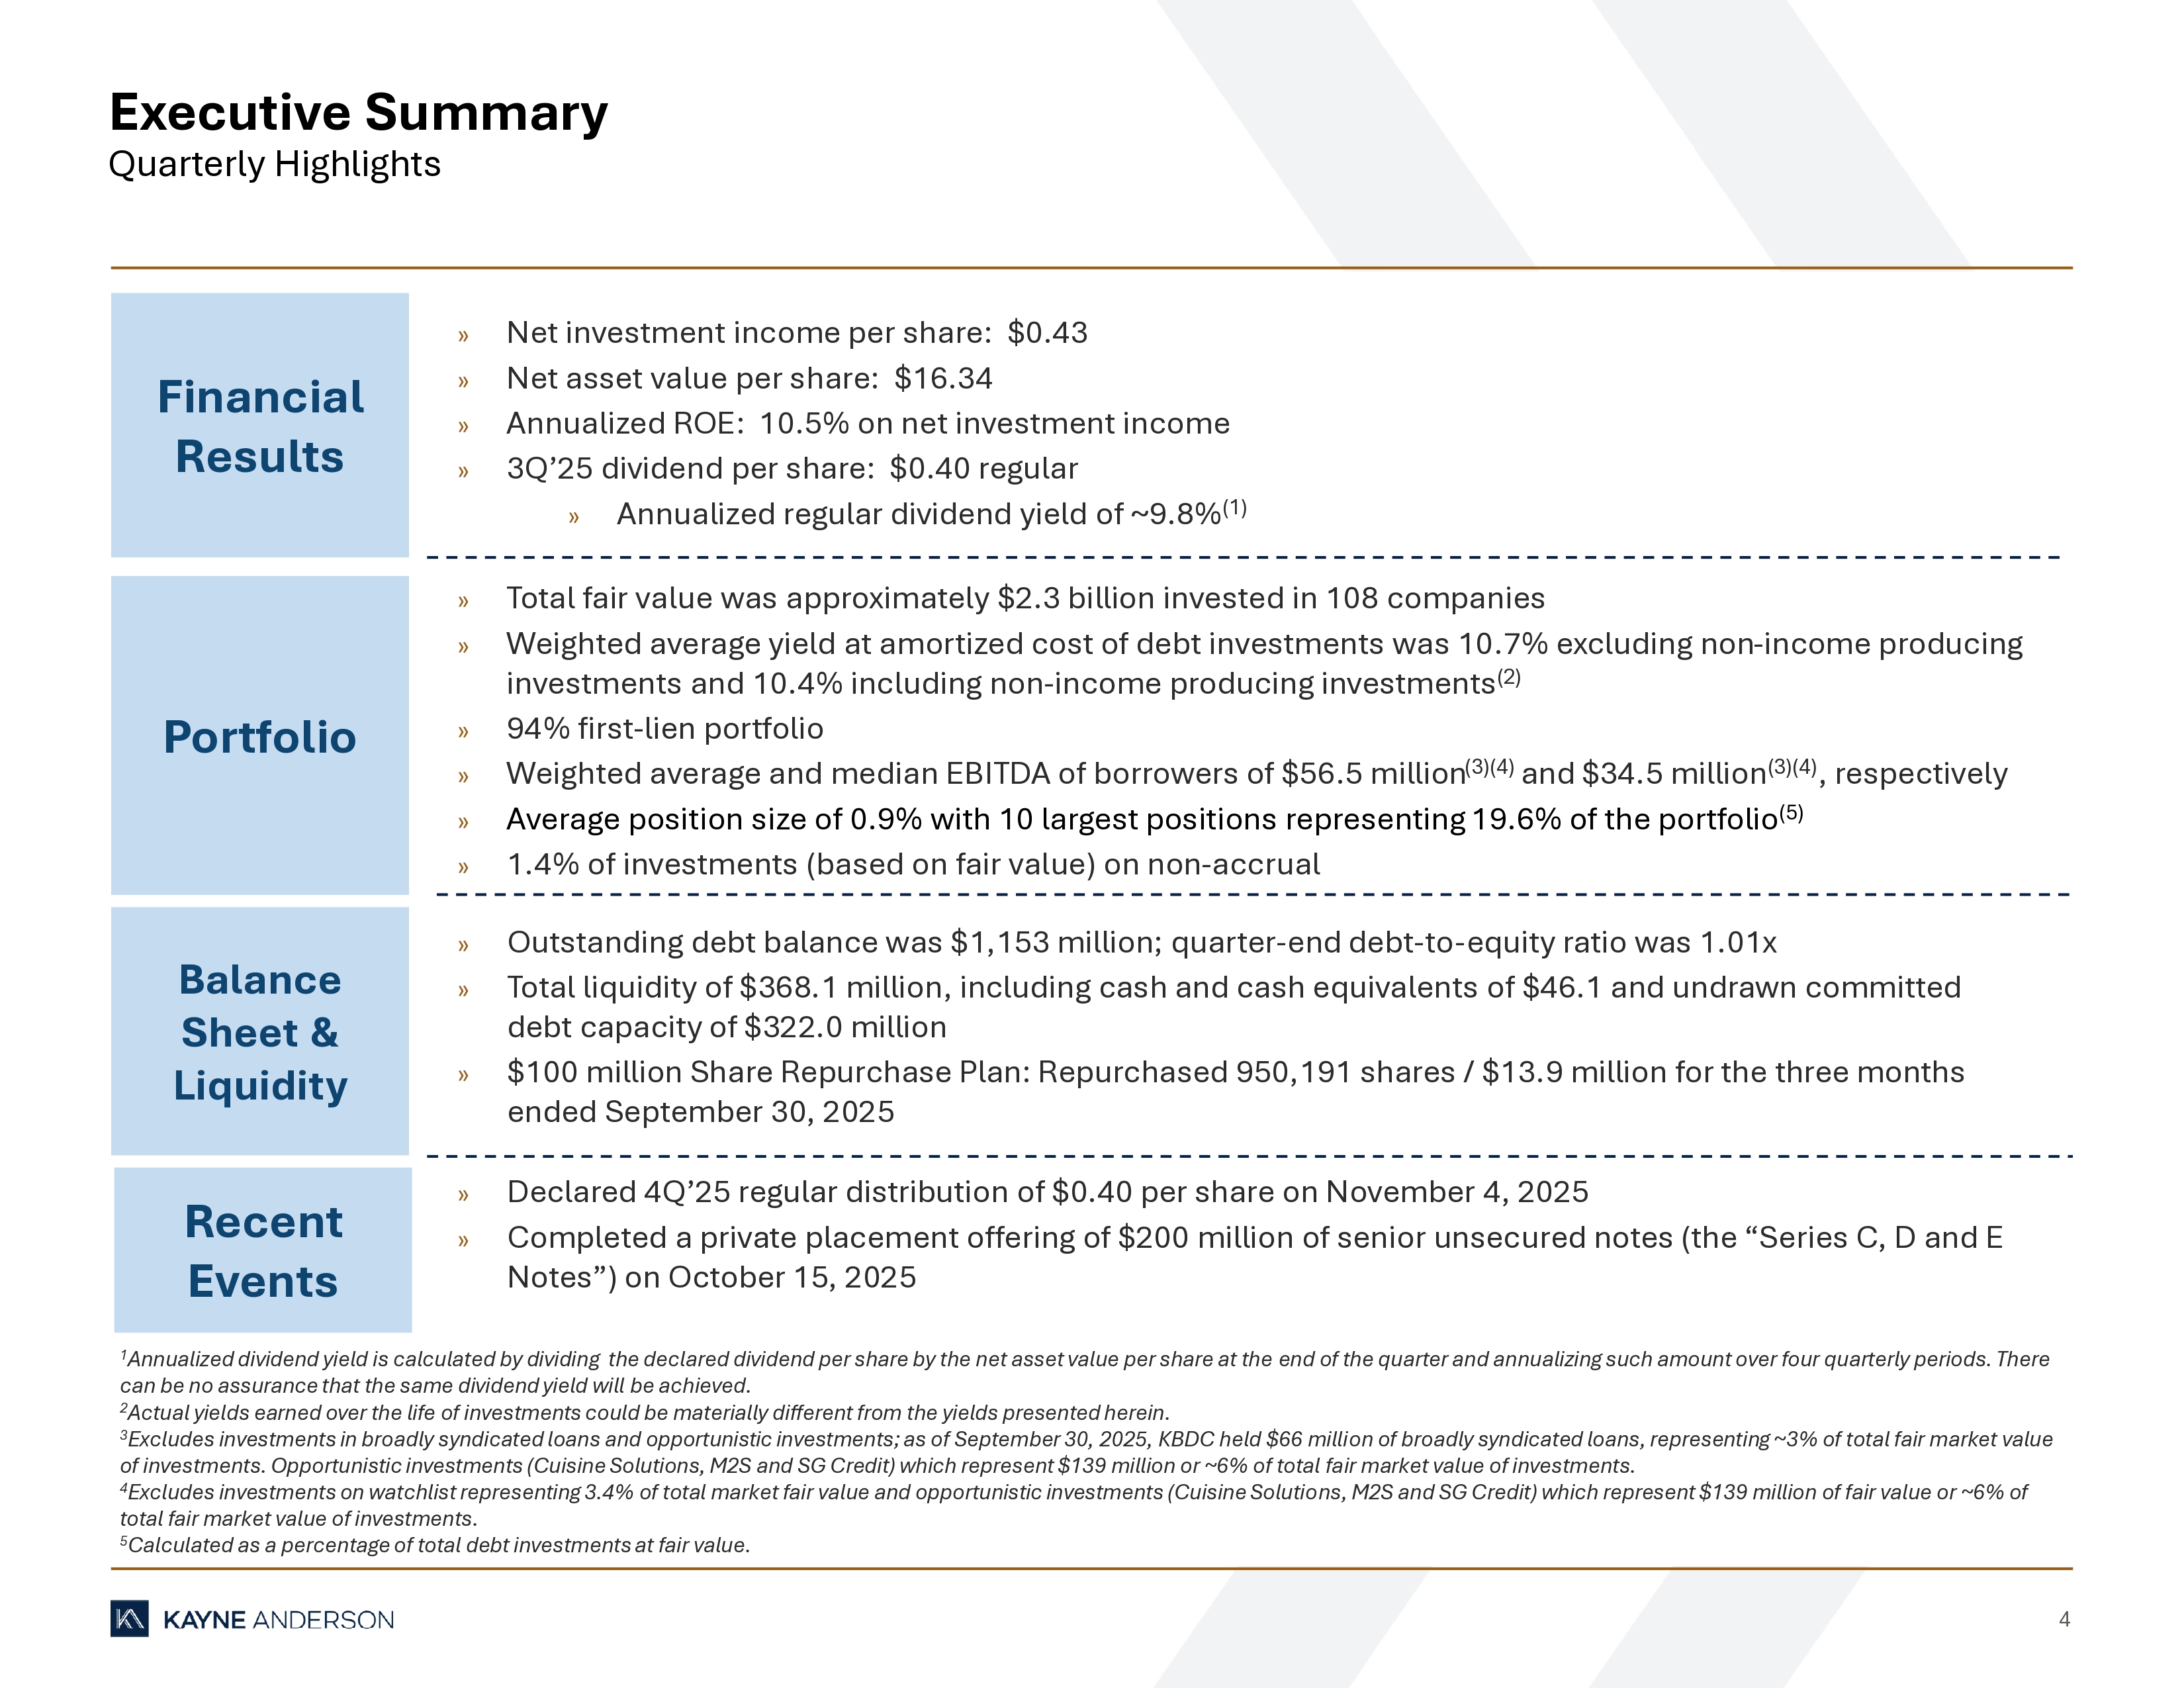
4 Executive Summary Quarterly Highlights 1 Annualized dividend yield is calculated by dividing the declared dividend per share by the net asset value per share at the end of the quarter and annualizing such amount over four quarterly periods. There can be no assurance that the same dividend yield will be achieved. 2 Actual yields earned over the life of investments could be materially different from the yields presented herein. 3 Excludes investments in broadly syndicated loans and opportunistic investments; as of September 30, 2025, KBDC held $66 milli on of broadly syndicated loans, representing ~3% of total fair market value of investments. Opportunistic investments (Cuisine Solutions, M2S and SG Credit) which represent $139 million or ~6% of total fa ir market value of investments. 4 Excludes investments on watchlist representing 3.4% of total market fair value and opportunistic investments (Cuisine Solutio ns, M2S and SG Credit) which represent $139 million of fair value or ~6% of total fair market value of investments. 5 Calculated as a percentage of total debt investments at fair value. Financial Results Portfolio Balance Sheet & Liquidity Recent Events » Net investment income per share: $0.43 » Net asset value per share: $16.34 » Annualized ROE: 10.5% on net investment income » 3Q’25 dividend per share: $0.40 regular » Annualized regular dividend yield of ~9.8% (1) » Total fair value was approximately $2.3 billion invested in 108 companies » Weighted average yield at amortized cost of debt investments was 10.7% excluding non - income producing investments and 10.4% including non - income producing investments (2) » 94% first - lien portfolio » Weighted average and median EBITDA of borrowers of $56.5 million (3)(4) and $34.5 million (3)(4) , respectively » Average position size of 0.9% with 10 largest positions representing 19.6% of the portfolio (5) » 1.4% of investments (based on fair value) on non - accrual » Outstanding debt balance was $1,153 million; quarter - end debt - to - equity ratio was 1.01x » Total liquidity of $368.1 million, including cash and cash equivalents of $46.1 and undrawn committed debt capacity of $322.0 million » $100 million Share Repurchase Plan: Repurchased 950,191 shares / $13.9 million for the three months ended September 30, 2025 » Declared 4Q’25 regular distribution of $0.40 per share on November 4, 2025 » Completed a private placement offering of $200 million of senior unsecured notes (the “Series C, D and E Notes”) on October 15, 2025
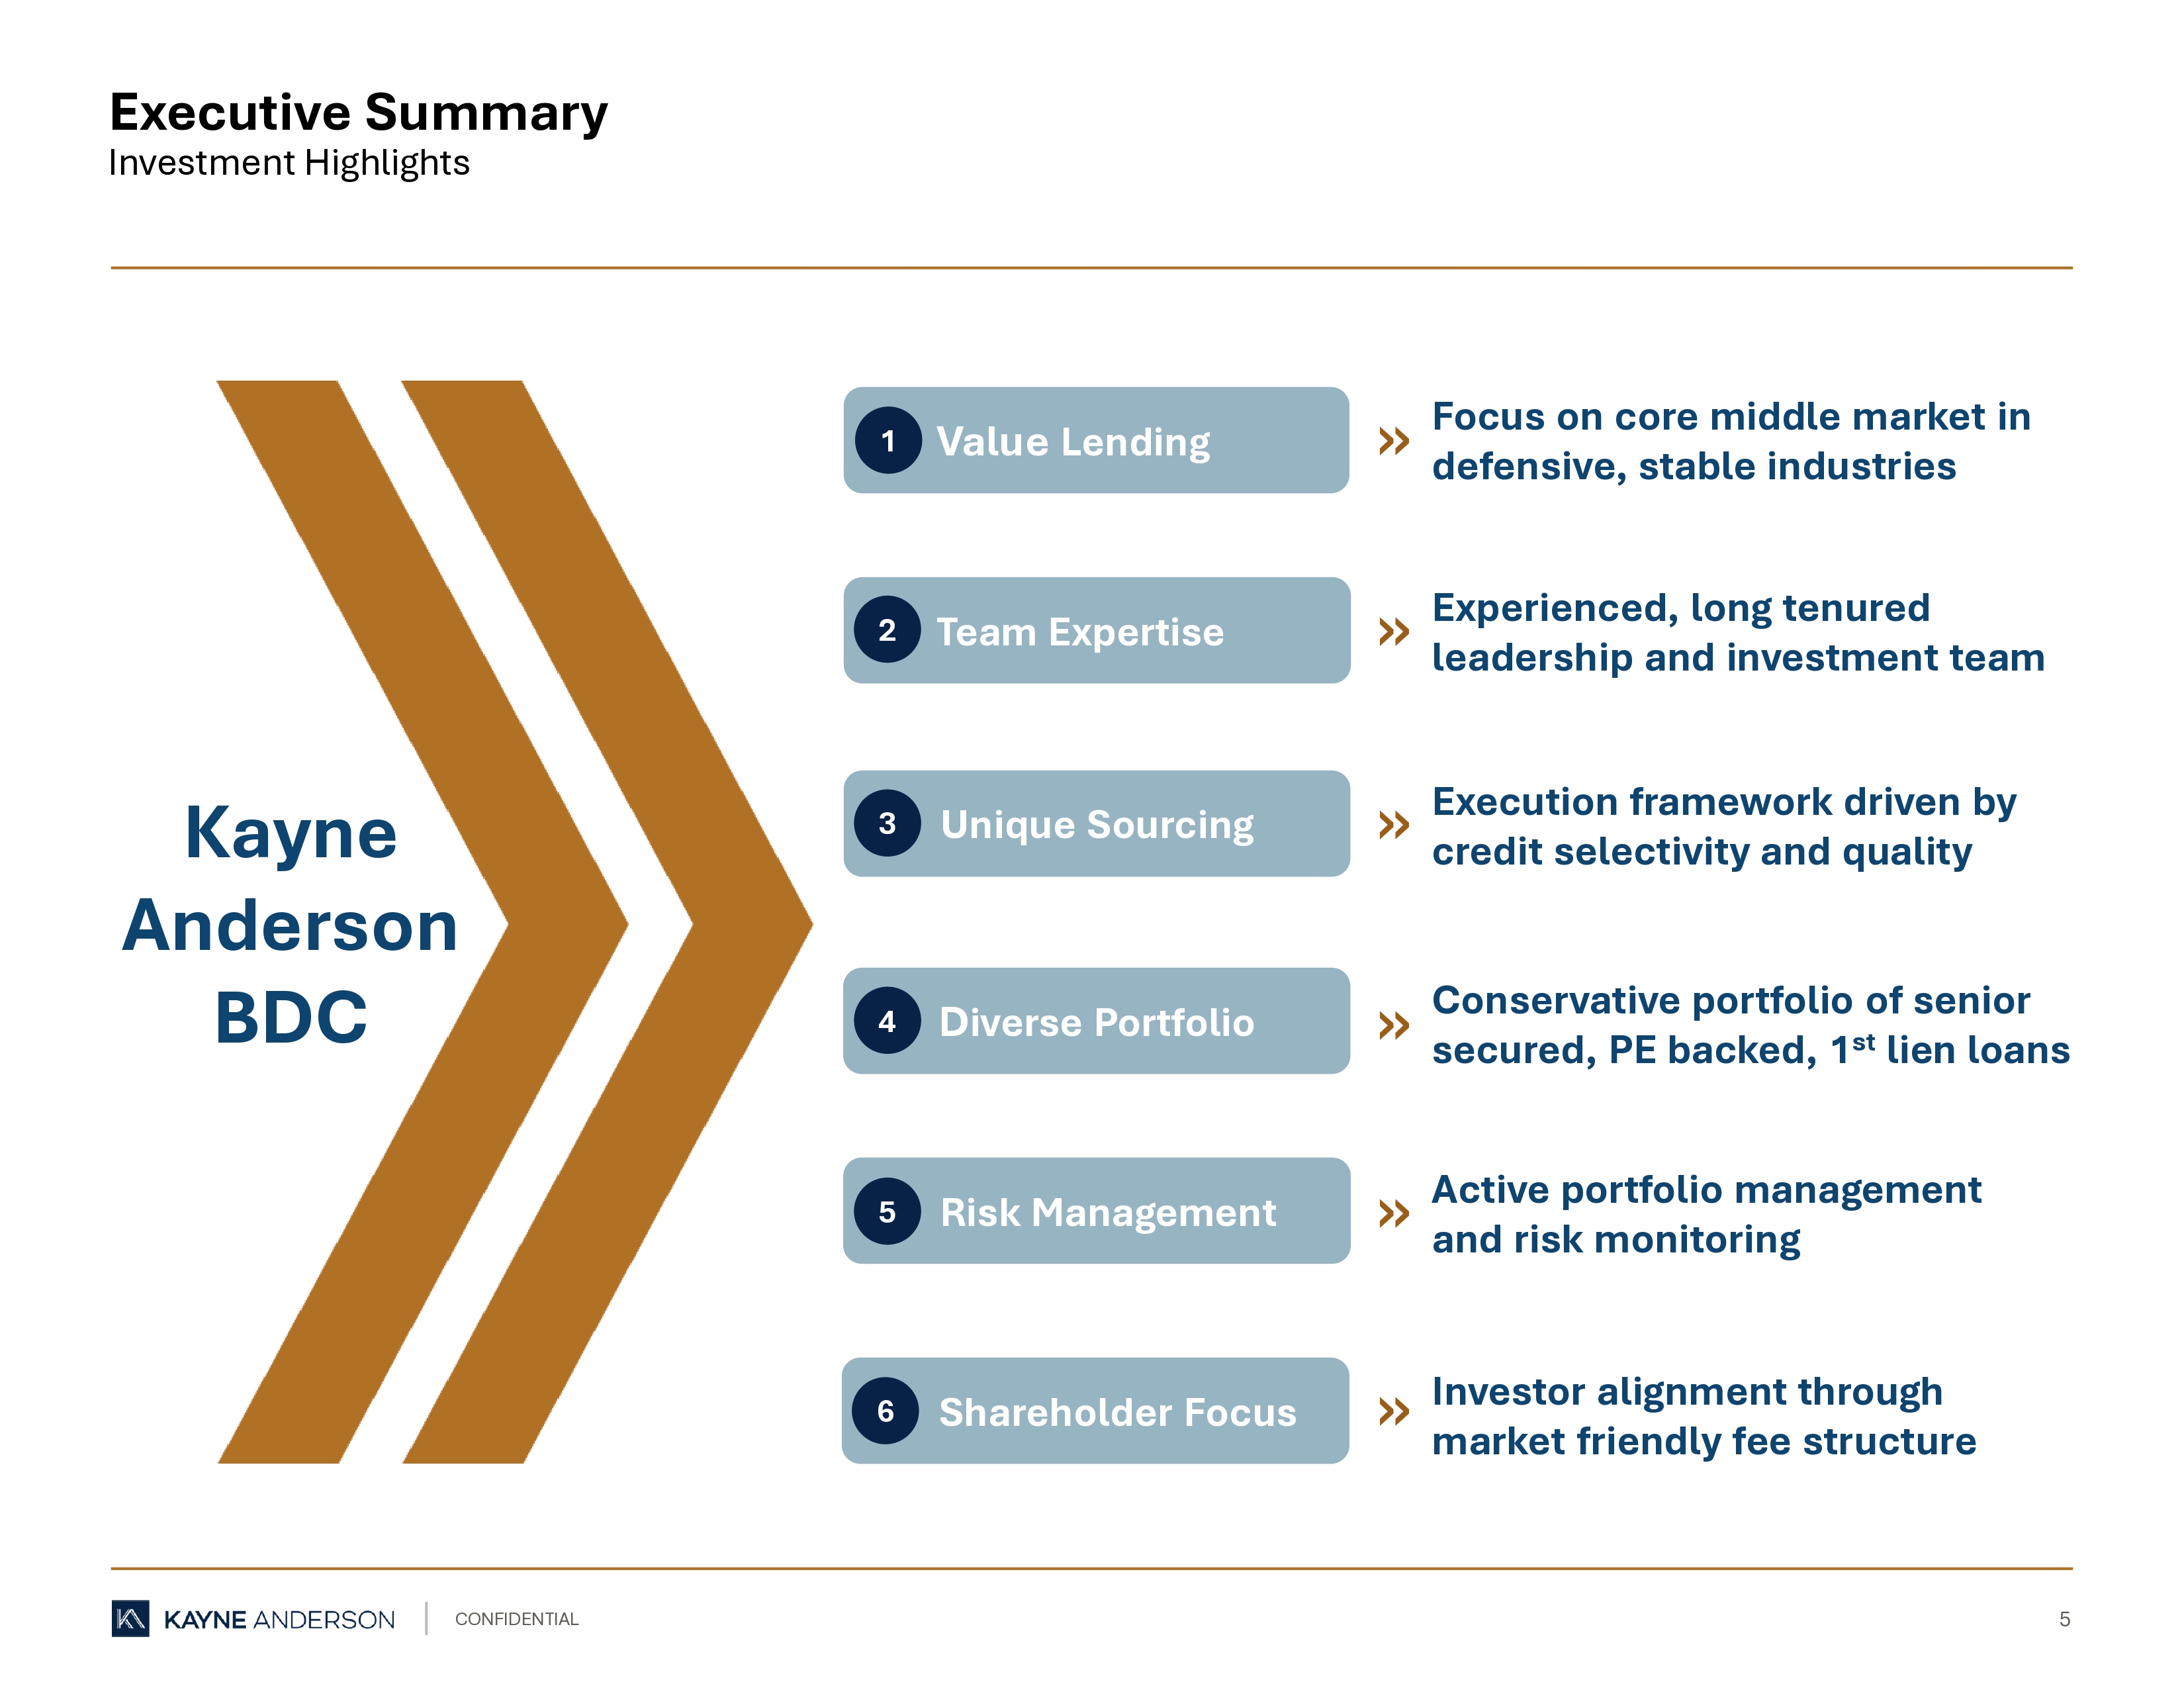
5 CONFIDENTIAL 5 Team Expertise Unique Sourcing D iverse Portfolio Risk Management Shareholder Focus Executive Summary Investment Highlights Kayne Anderson BDC 2 3 4 5 6 Focus on core middle market in defensive, stable industries Experienced, long tenured leadership and investment team Execution framework driven by credit selectivity and quality Conservative portfolio of senior secured, PE backed, 1 st lien loans Active portfolio management and risk monitoring Investor alignment through market friendly fee structure » » » » » » » Value Lending 1
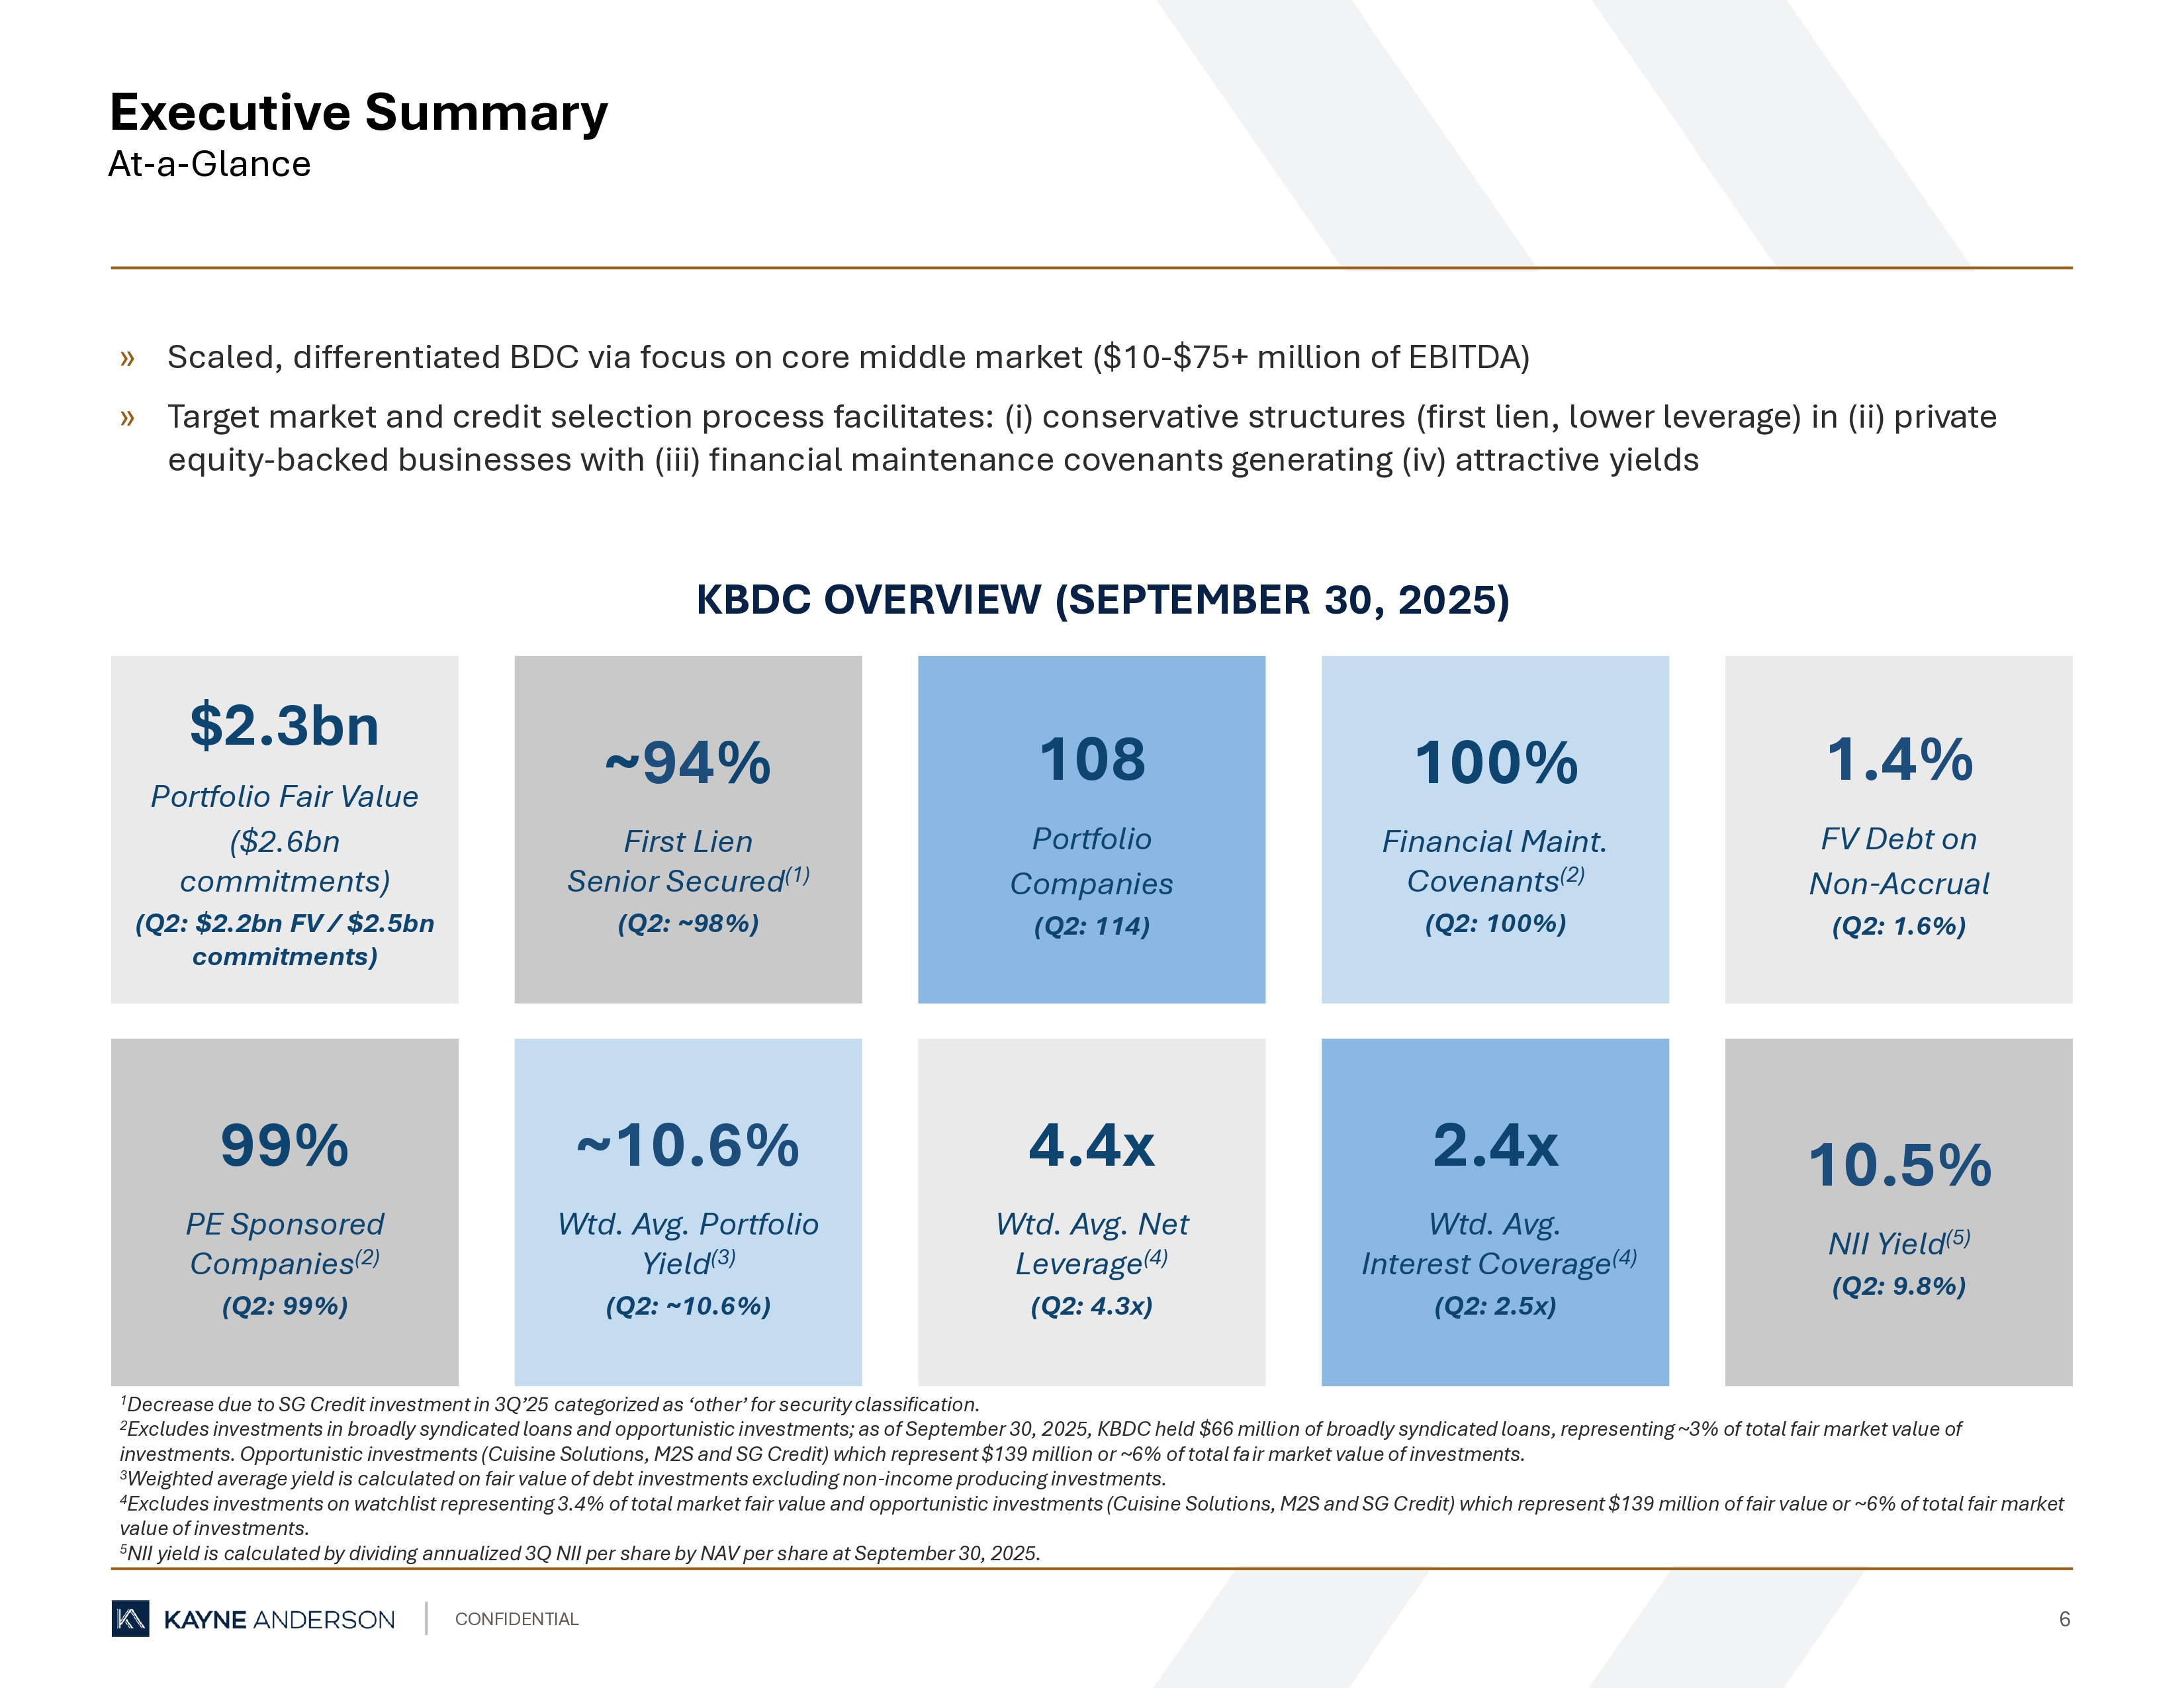
CONFIDENTIAL 6 » Scaled, differentiated BDC via focus on core middle market ($10 - $75+ million of EBITDA) » Target market and credit selection process facilitates: (i) conservative structures (first lien, lower leverage) in (ii) priv ate equity - backed businesses with (iii) financial maintenance covenants generating (iv) attractive yields Executive Summary At - a - Glance 1 Decrease due to SG Credit investment in 3Q’25 categorized as ‘other’ for security classification. 2 Excludes investments in broadly syndicated loans and opportunistic investments; as of September 30, 2025, KBDC held $66 milli on of broadly syndicated loans, representing ~3% of total fair market value of investments. Opportunistic investments (Cuisine Solutions, M2S and SG Credit) which represent $139 million or ~6% of total fa ir market value of investments. 3 Weighted average yield is calculated on fair value of debt investments excluding non - income producing investments. 4 Excludes investments on watchlist representing 3.4% of total market fair value and opportunistic investments (Cuisine Solutio ns, M2S and SG Credit) which represent $139 million of fair value or ~6% of total fair market value of investments. 5 NII yield is calculated by dividing annualized 3Q NII per share by NAV per share at September 30, 2025. KBDC OVERVIEW (SEPTEMBER 30, 2025) $2.3bn Portfolio Fair Value ($2.6bn commitments) (Q2: $2.2bn FV / $2.5bn commitments) 100% Financial Maint. Covenants (2) (Q2: 100%) ~ 94 % First Lien Senior Secured (1) (Q2: ~98%) 99% PE Sponsored Companies (2) (Q2: 99%) 108 Portfolio Companies (Q2: 114) 2.4x Wtd. Avg. Interest Coverage (4) (Q2: 2.5x) ~10.6% Wtd. Avg. Portfolio Yield (3) (Q2: ~10.6%) 4.4x Wtd. Avg. Net Leverage (4) (Q2: 4.3x) 1.4% FV Debt on Non - Accrual (Q2: 1.6%) 10.5% NII Yield (5) (Q2: 9.8%)
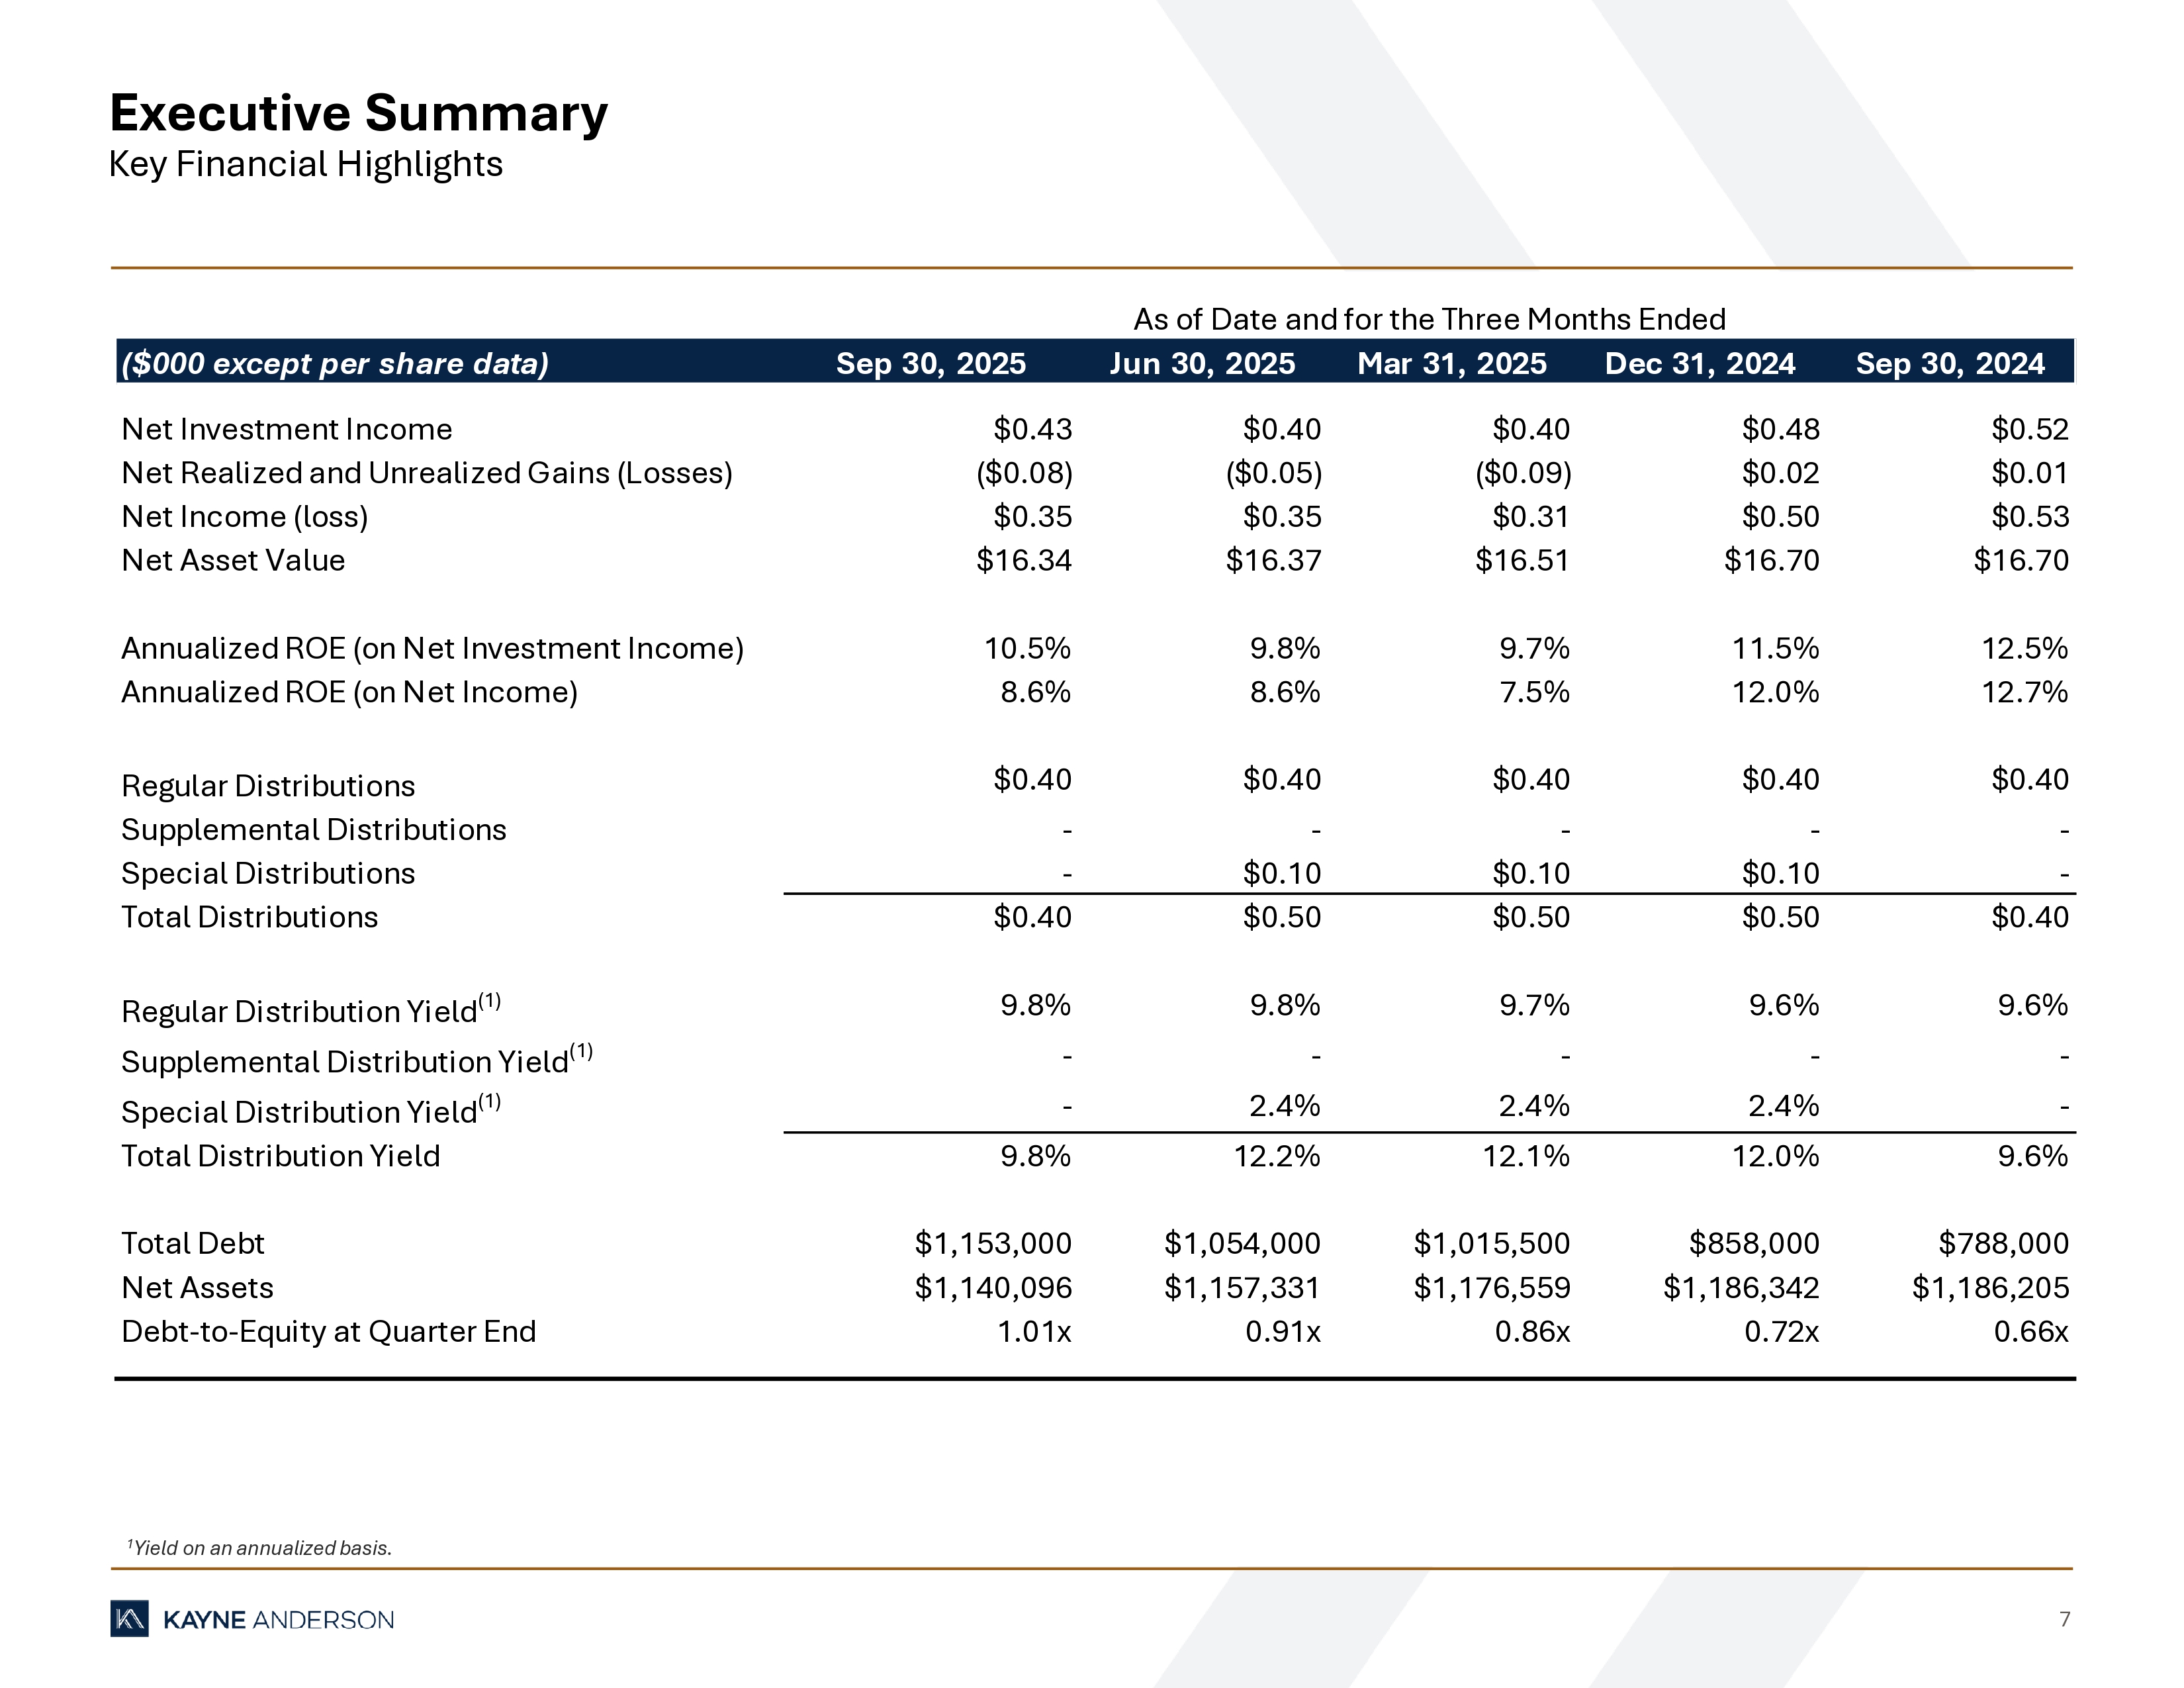
7 Executive Summary Key Financial Highlights 1 Yield on an annualized basis. ($000 except per share data) Sep 30, 2025 Jun 30, 2025 Mar 31, 2025 Dec 31, 2024 Sep 30, 2024 Net Investment Income $0.43 $0.40 $0.40 $0.48 $0.52 Net Realized and Unrealized Gains (Losses) ($0.08) ($0.05) ($0.09) $0.02 $0.01 Net Income (loss) $0.35 $0.35 $0.31 $0.50 $0.53 Net Asset Value $16.34 $16.37 $16.51 $16.70 $16.70 Annualized ROE (on Net Investment Income) 10.5% 9.8% 9.7% 11.5% 12.5% Annualized ROE (on Net Income) 8.6% 8.6% 7.5% 12.0% 12.7% Regular Distributions $0.40 $0.40 $0.40 $0.40 $0.40 Supplemental Distributions - - - - - Special Distributions - $0.10 $0.10 $0.10 - Total Distributions $0.40 $0.50 $0.50 $0.50 $0.40 Regular Distribution Yield (1) 9.8% 9.8% 9.7% 9.6% 9.6% Supplemental Distribution Yield (1) - - - - - Special Distribution Yield (1) - 2.4% 2.4% 2.4% - Total Distribution Yield 9.8% 12.2% 12.1% 12.0% 9.6% Total Debt $1,153,000 $1,054,000 $1,015,500 $858,000 $788,000 Net Assets $1,140,096 $1,157,331 $1,176,559 $1,186,342 $1,186,205 Debt-to-Equity at Quarter End 1.01x 0.91x 0.86x 0.72x 0.66x As of Date and for the Three Months Ended

PORTFOLIO OVERVIEW
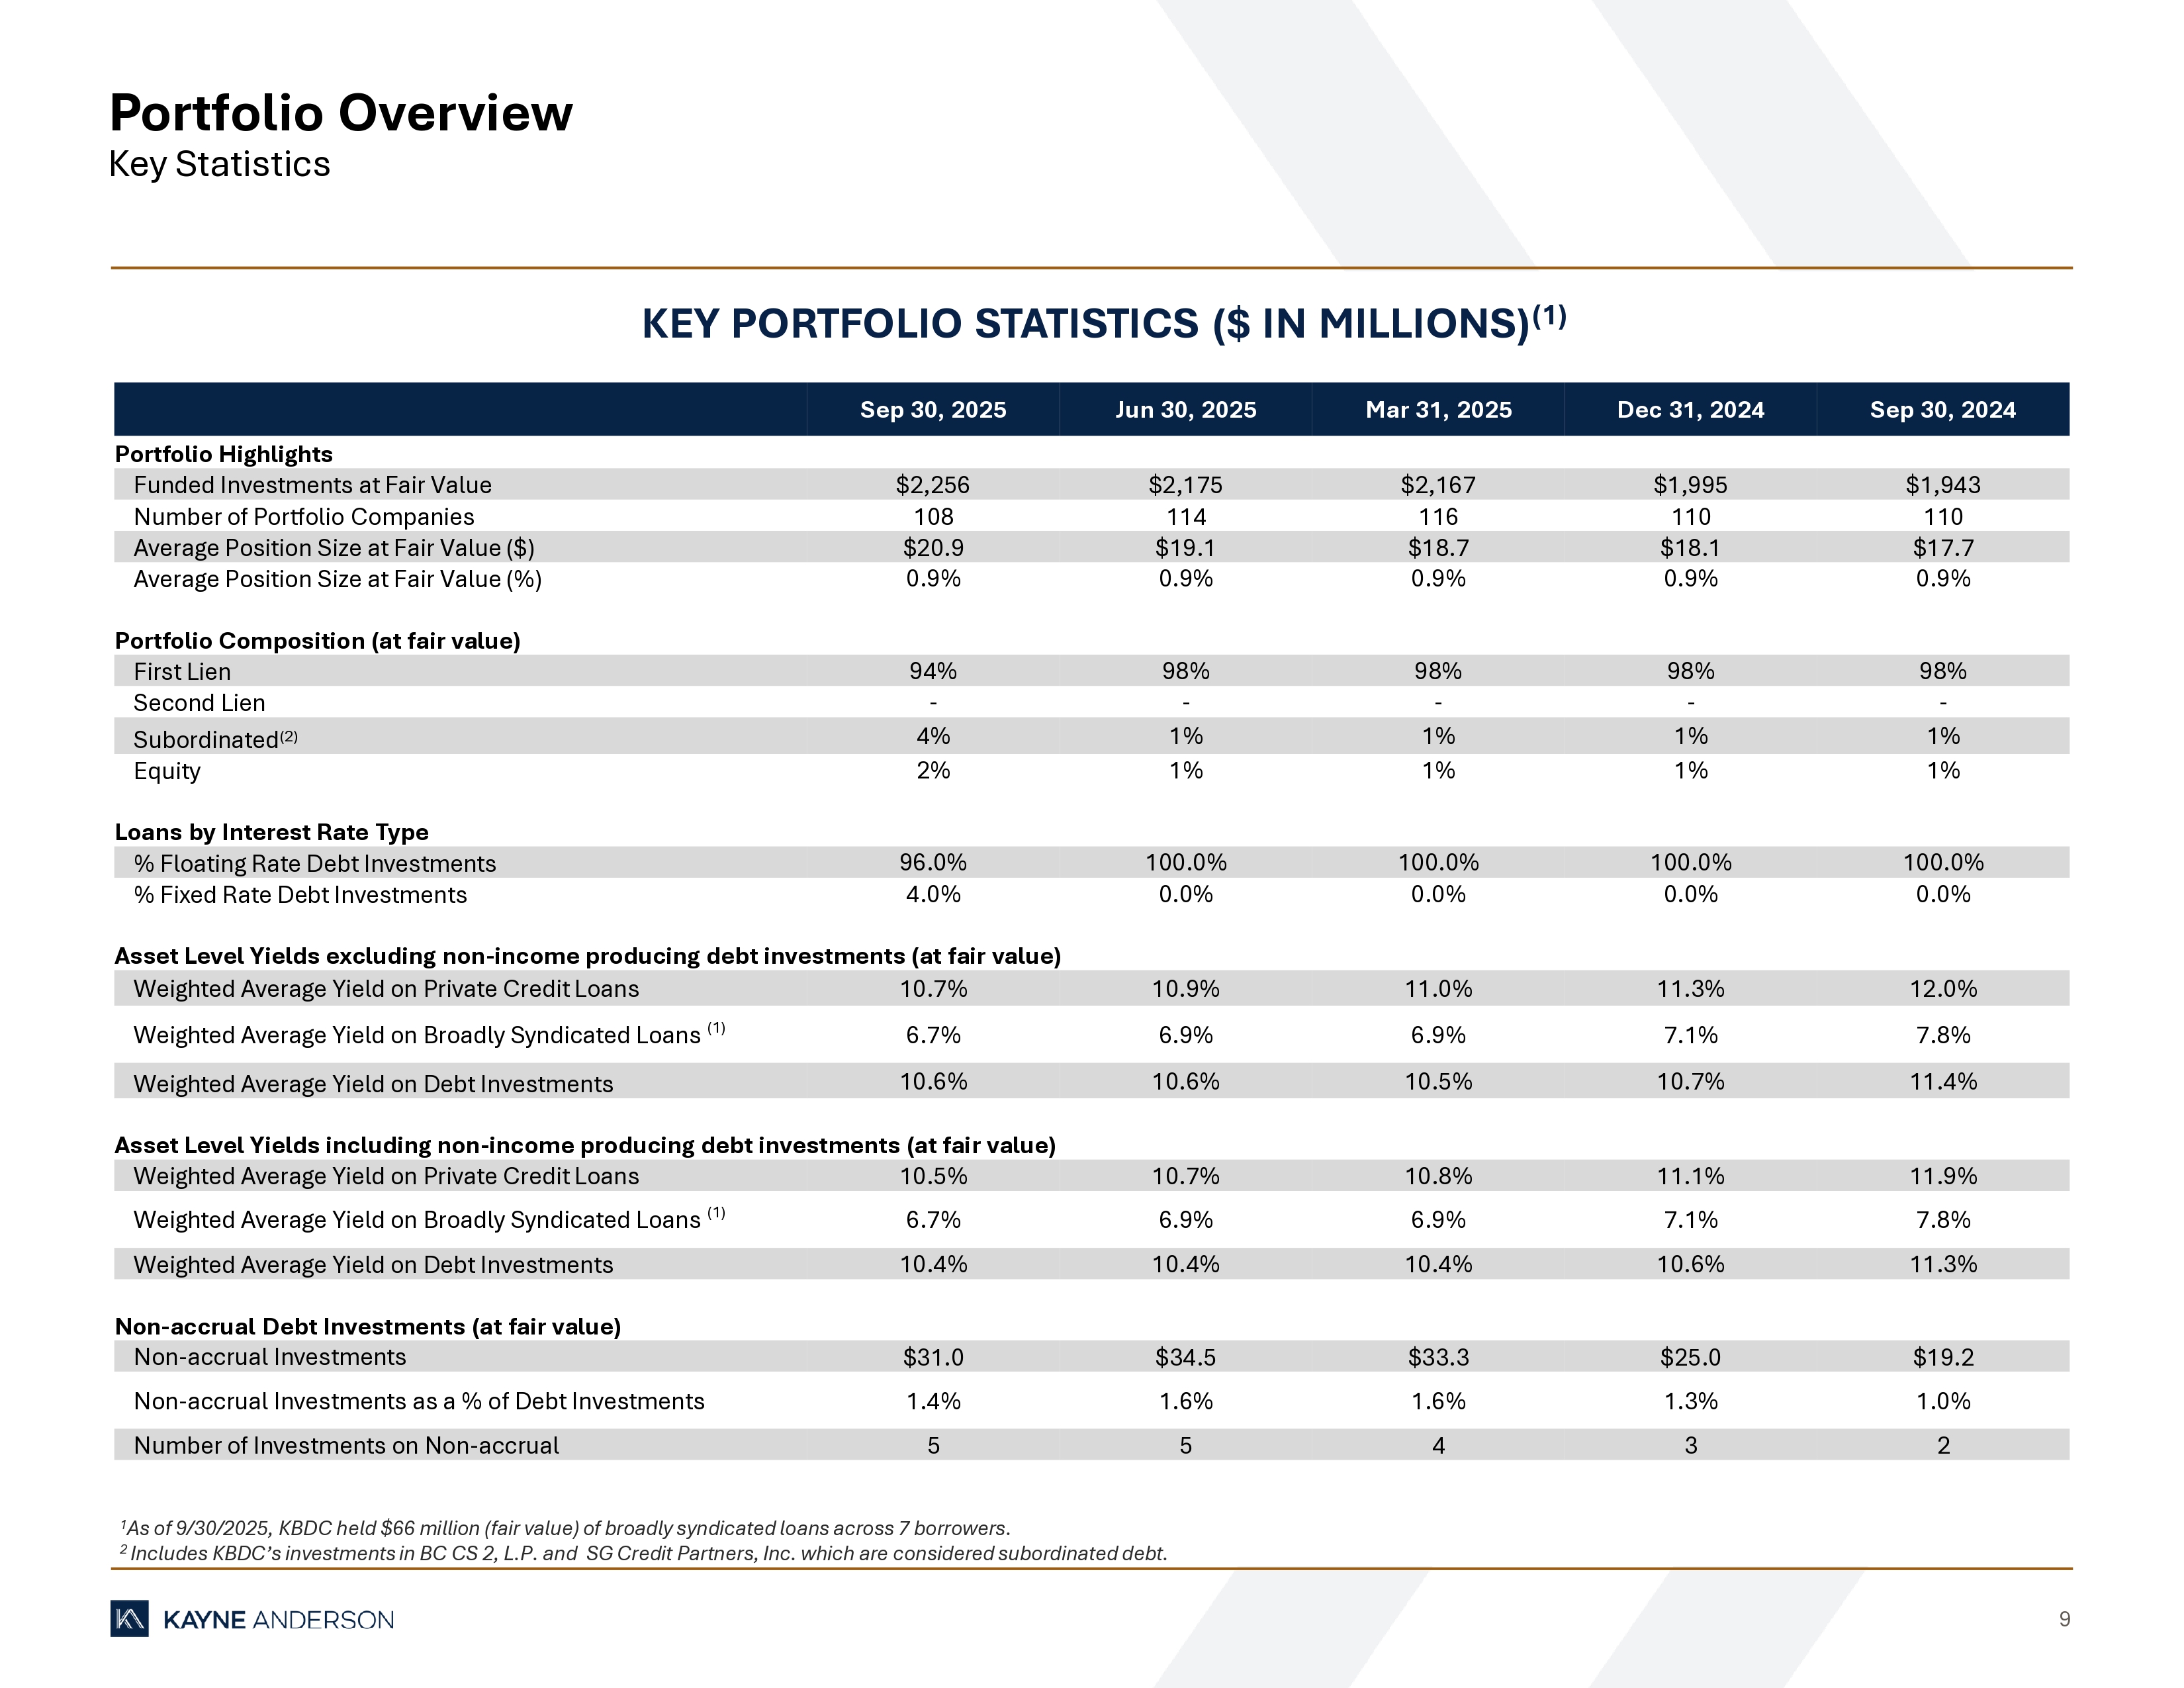
9 Portfolio Overview Key Statistics 1 As of 9/30/2025, KBDC held $66 million (fair value) of broadly syndicated loans across 7 borrowers. 2 Includes KBDC’s investments in BC CS 2, L.P. and SG Credit Partners, Inc. which are considered subordinated debt. KEY PORTFOLIO STATISTICS ($ IN MILLIONS) (1) Sep 30, 2024 Dec 31, 2024 Mar 31, 2025 Jun 30, 2025 Sep 30, 2025 Portfolio Highlights $1,943 $1,995 $2,167 $2,175 $2,256 Funded Investments at Fair Value 110 110 116 114 108 Number of Portfolio Companies $17.7 $18.1 $18.7 $19.1 $20.9 Average Position Size at Fair Value ($) 0.9% 0.9% 0.9% 0.9% 0.9% Average Position Size at Fair Value (%) Portfolio Composition (at fair value) 98% 98% 98% 98% 94% First Lien - - - - - Second Lien 1% 1% 1% 1% 4% Subordinated (2) 1% 1% 1% 1% 2% Equity Loans by Interest Rate Type 100.0% 100.0% 100.0% 100.0% 96.0% % Floating Rate Debt Investments 0.0% 0.0% 0.0% 0.0% 4.0% % Fixed Rate Debt Investments Asset Level Yields excluding non - income producing debt investments (at fair value) 12.0% 11.3% 11.0% 10.9% 10.7% Weighted Average Yield on Private Credit Loans 7.8% 7.1% 6.9% 6.9% 6.7% Weighted Average Yield on Broadly Syndicated Loans (1) 11.4% 10.7% 10.5% 10.6% 10.6% Weighted Average Yield on Debt Investments Asset Level Yields including non - income producing debt investments (at fair value) 11.9% 11.1% 10.8% 10.7% 10.5% Weighted Average Yield on Private Credit Loans 7.8% 7.1% 6.9% 6.9% 6.7% Weighted Average Yield on Broadly Syndicated Loans (1) 11.3% 10.6% 10.4% 10.4% 10.4% Weighted Average Yield on Debt Investments Non - accrual Debt Investments (at fair value) $19.2 $25.0 $33.3 $34.5 $31.0 Non - accrual Investments 1.0% 1.3% 1.6% 1.6% 1.4% Non - accrual Investments as a % of Debt Investments 2 3 4 5 5 Number of Investments on Non - accrual
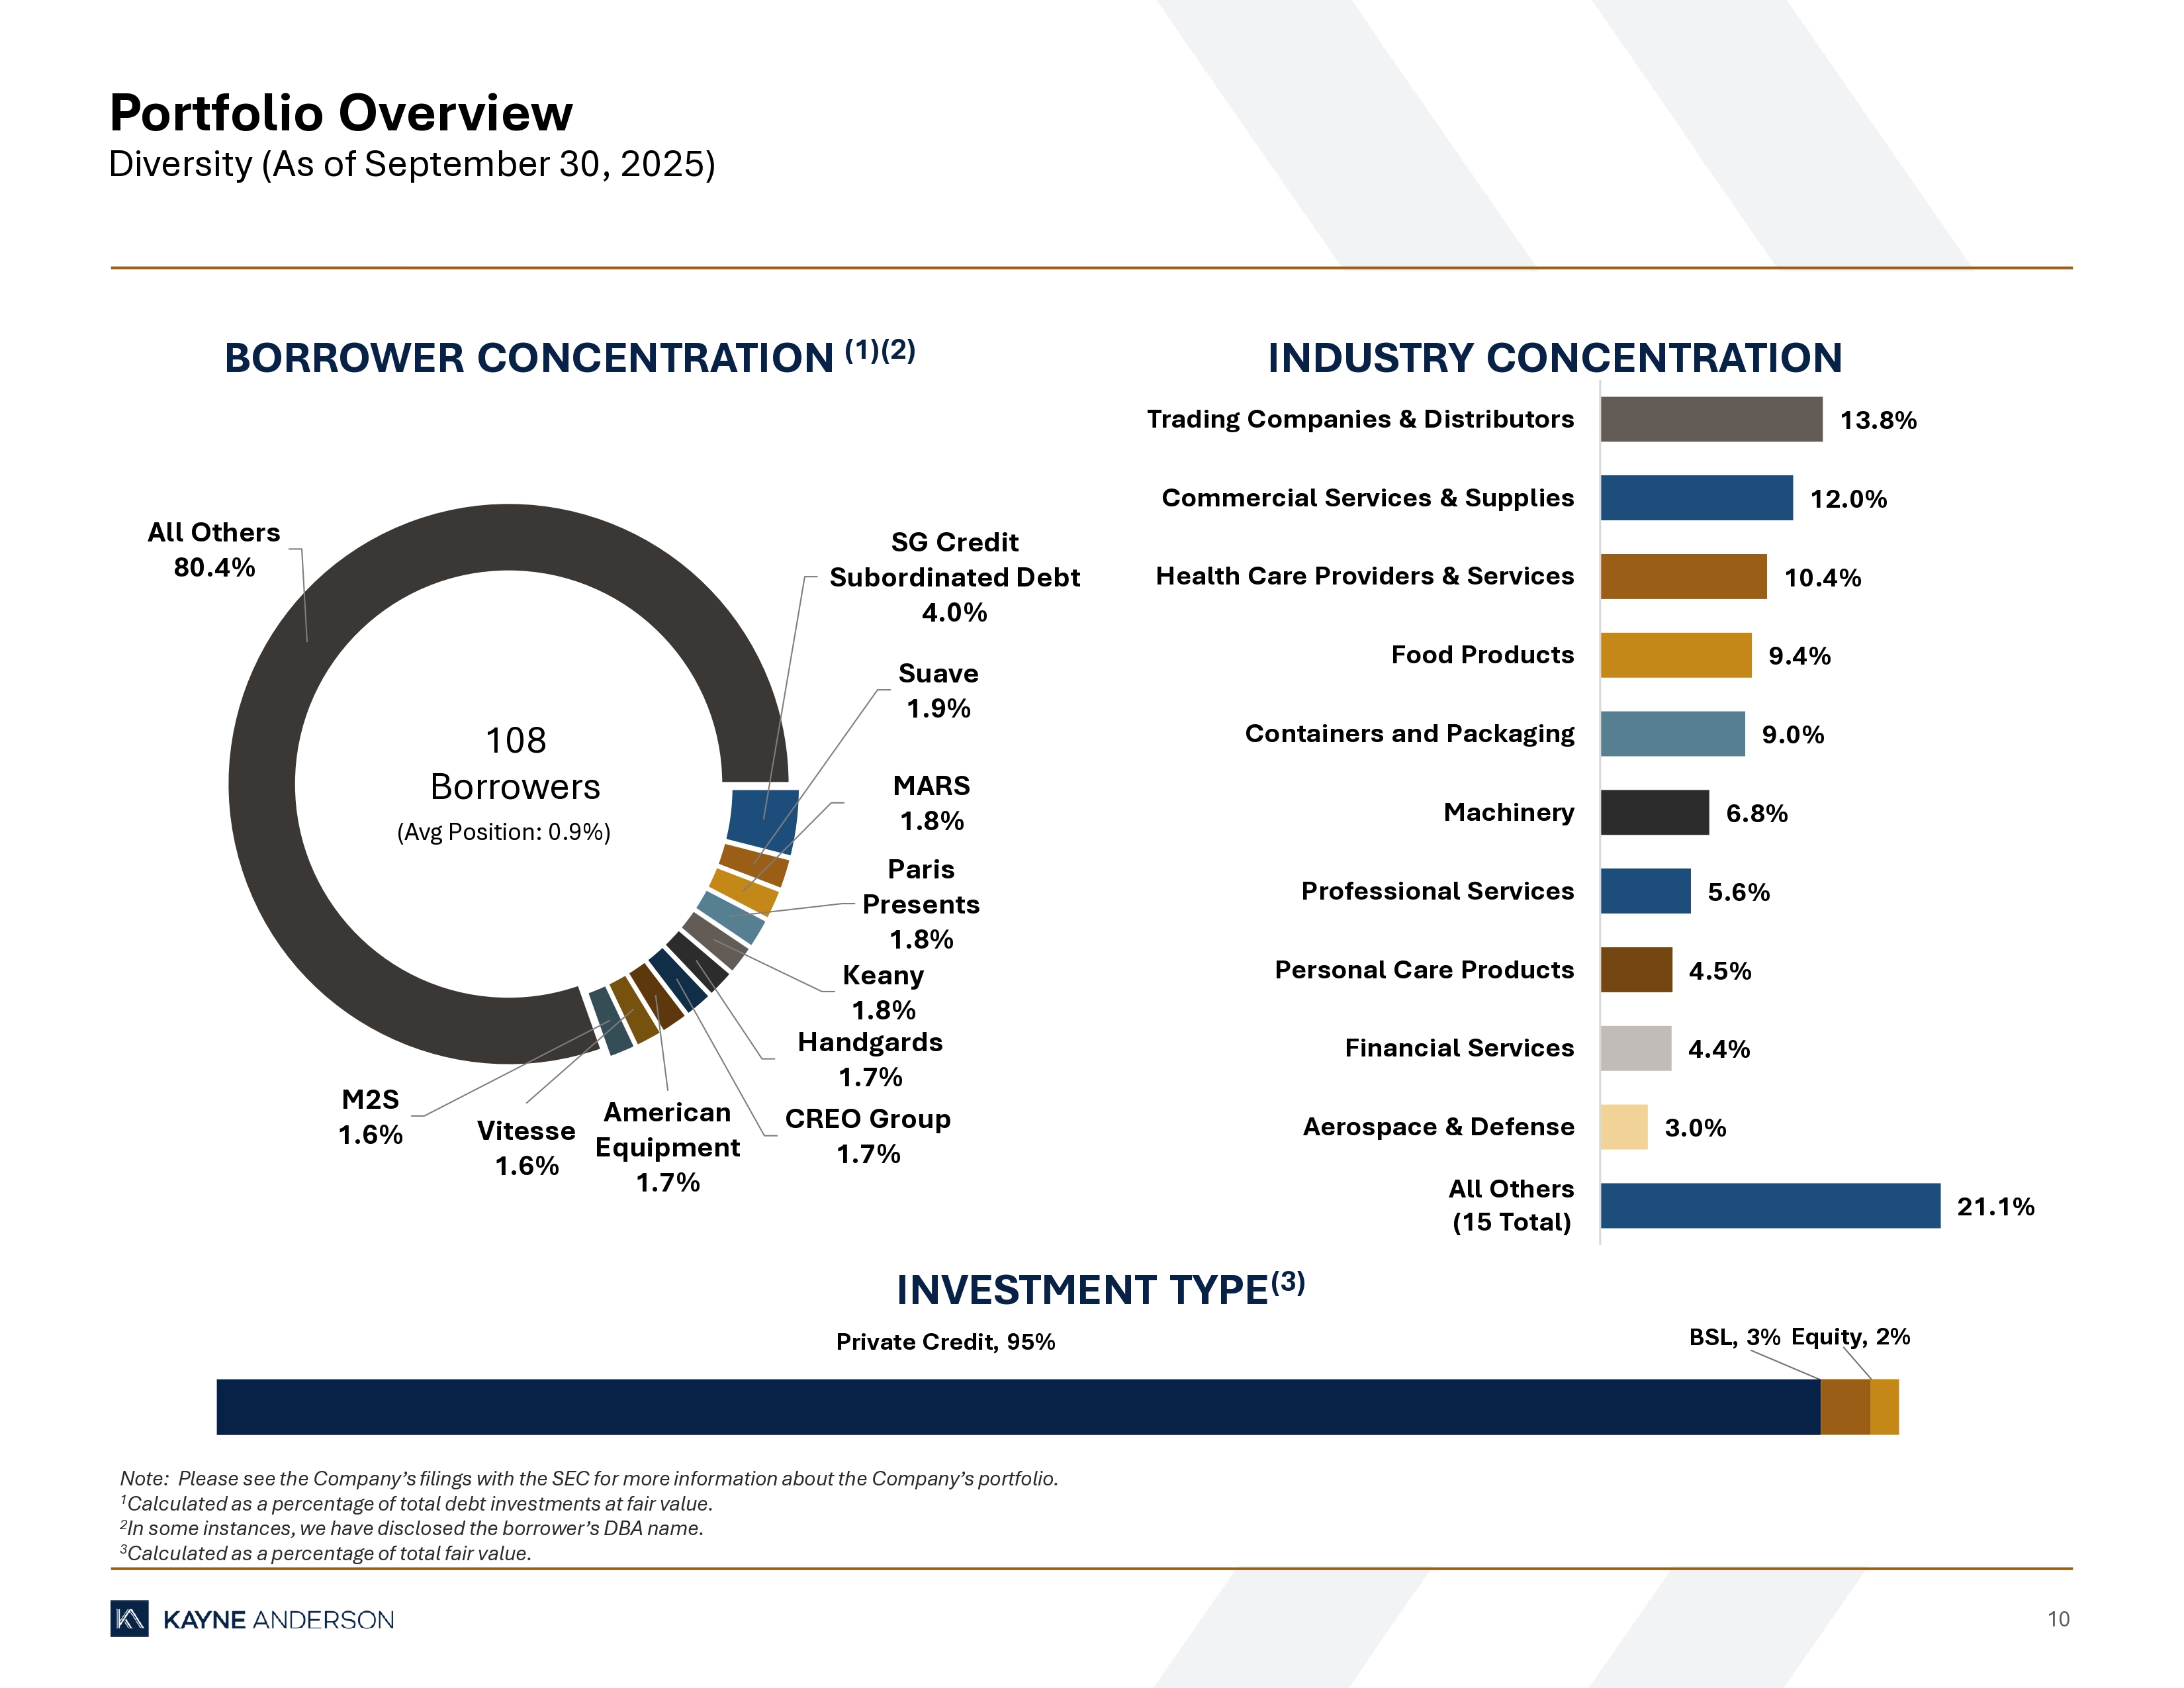
10 Portfolio Overview Diversity (As of September 30, 2025) Note: Please see the Company’s filings with the SEC for more information about the Company’s portfolio. 1 Calculated as a percentage of total debt investments at fair value. 2 In some instances, we have disclosed the borrower’s DBA name. 3 Calculated as a percentage of total fair value. BORROWER CONCENTRATION (1)(2) INDUSTRY CONCENTRATION INVESTMENT TYPE (3) 21.1% 3.0% 4.4% 4.5% 5.6% 6.8% 9.0% 9.4% 10.4% 12.0% 13.8% All Others (15 Total) Aerospace & Defense Financial Services Personal Care Products Professional Services Machinery Containers and Packaging Food Products Health Care Providers & Services Commercial Services & Supplies Trading Companies & Distributors Private Credit, 95% BSL , 3% Equity , 2% SG Credit Subordinated Debt 4.0% Suave 1.9% MARS 1.8% Paris Presents 1.8% Keany 1.8% Handgards 1.7% CREO Group 1.7% American Equipment 1.7% Vitesse 1.6% M2S 1.6% All Others 80.4% (Avg Position: 0.9%) 108 Borrowers
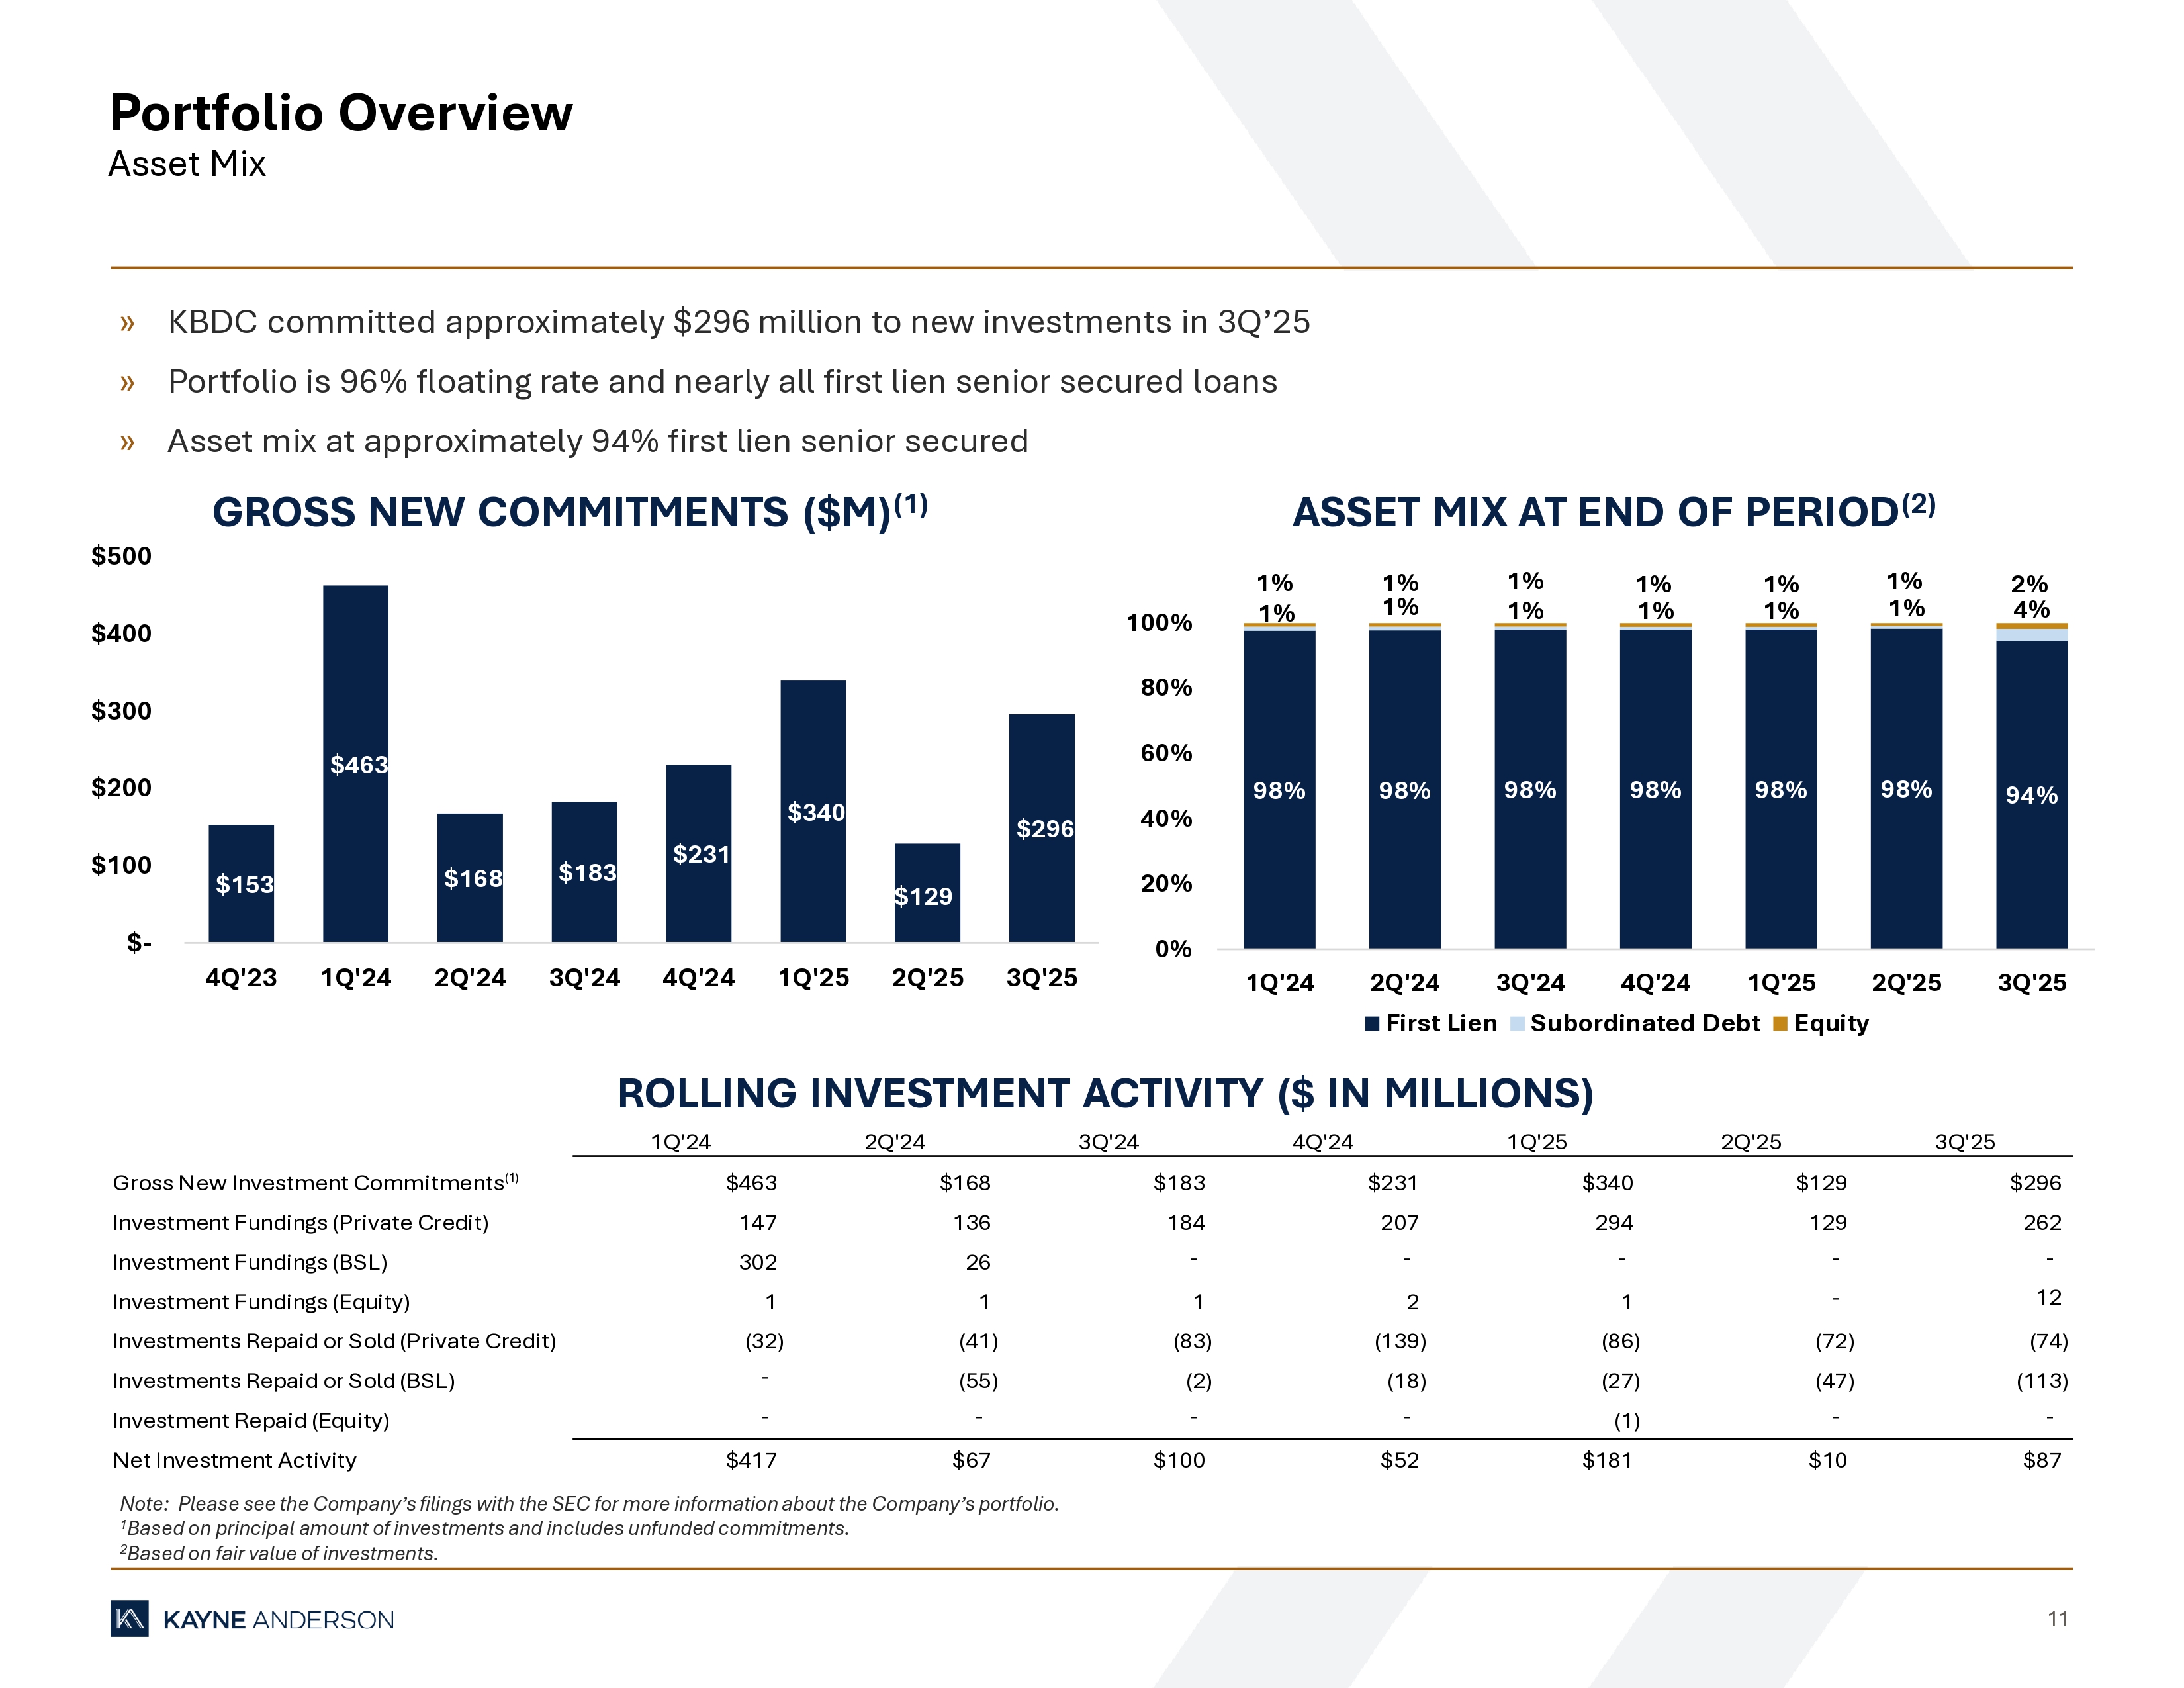
11 Portfolio Overview Asset Mix GROSS NEW COMMITMENTS ($M) (1) ASSET MIX AT END OF PERIOD (2) » KBDC committed approximately $296 million to new investments in 3Q’25 » Portfolio is 96% floating rate and nearly all first lien senior secured loans » Asset mix at approximately 94% first lien senior secured ROLLING INVESTMENT ACTIVITY ($ IN MILLIONS) Note: Please see the Company’s filings with the SEC for more information about the Company’s portfolio. 1 Based on principal amount of investments and includes unfunded commitments. 2 Based on fair value of investments. $153 $463 $168 $183 $231 $340 $129 $296 $- $100 $200 $300 $400 $500 4Q'23 1Q'24 2Q'24 3Q'24 4Q'24 1Q'25 2Q'25 3Q'25 1Q'24 2Q'24 3Q'24 4Q'24 1Q'25 2Q'25 3Q'25 Gross New Investment Commitments(1) $463 $168 $183 $231 $340 $129 $296 Investment Fundings (Private Credit) 147 136 184 207 294 129 262 Investment Fundings (BSL) 302 26 - - - - - Investment Fundings (Equity) 1 1 1 2 1 - 12 Investments Repaid or Sold (Private Credit) (32) (41) (83) (139) (86) (72) (74) Investments Repaid or Sold (BSL) - (55) (2) (18) (27) (47) (113) Investment Repaid (Equity) - - - - (1) - - Net Investment Activity $417 $67 $100 $52 $181 $10 $87 98% 98% 98% 98% 98% 98% 94% 1% 1% 1% 1% 1% 1% 4% 1% 1% 1% 1% 1% 1% 2% 0% 20% 40% 60% 80% 100% 1Q'24 2Q'24 3Q'24 4Q'24 1Q'25 2Q'25 3Q'25 First Lien Subordinated Debt Equity

FINANCIAL HIGHLIGHTS
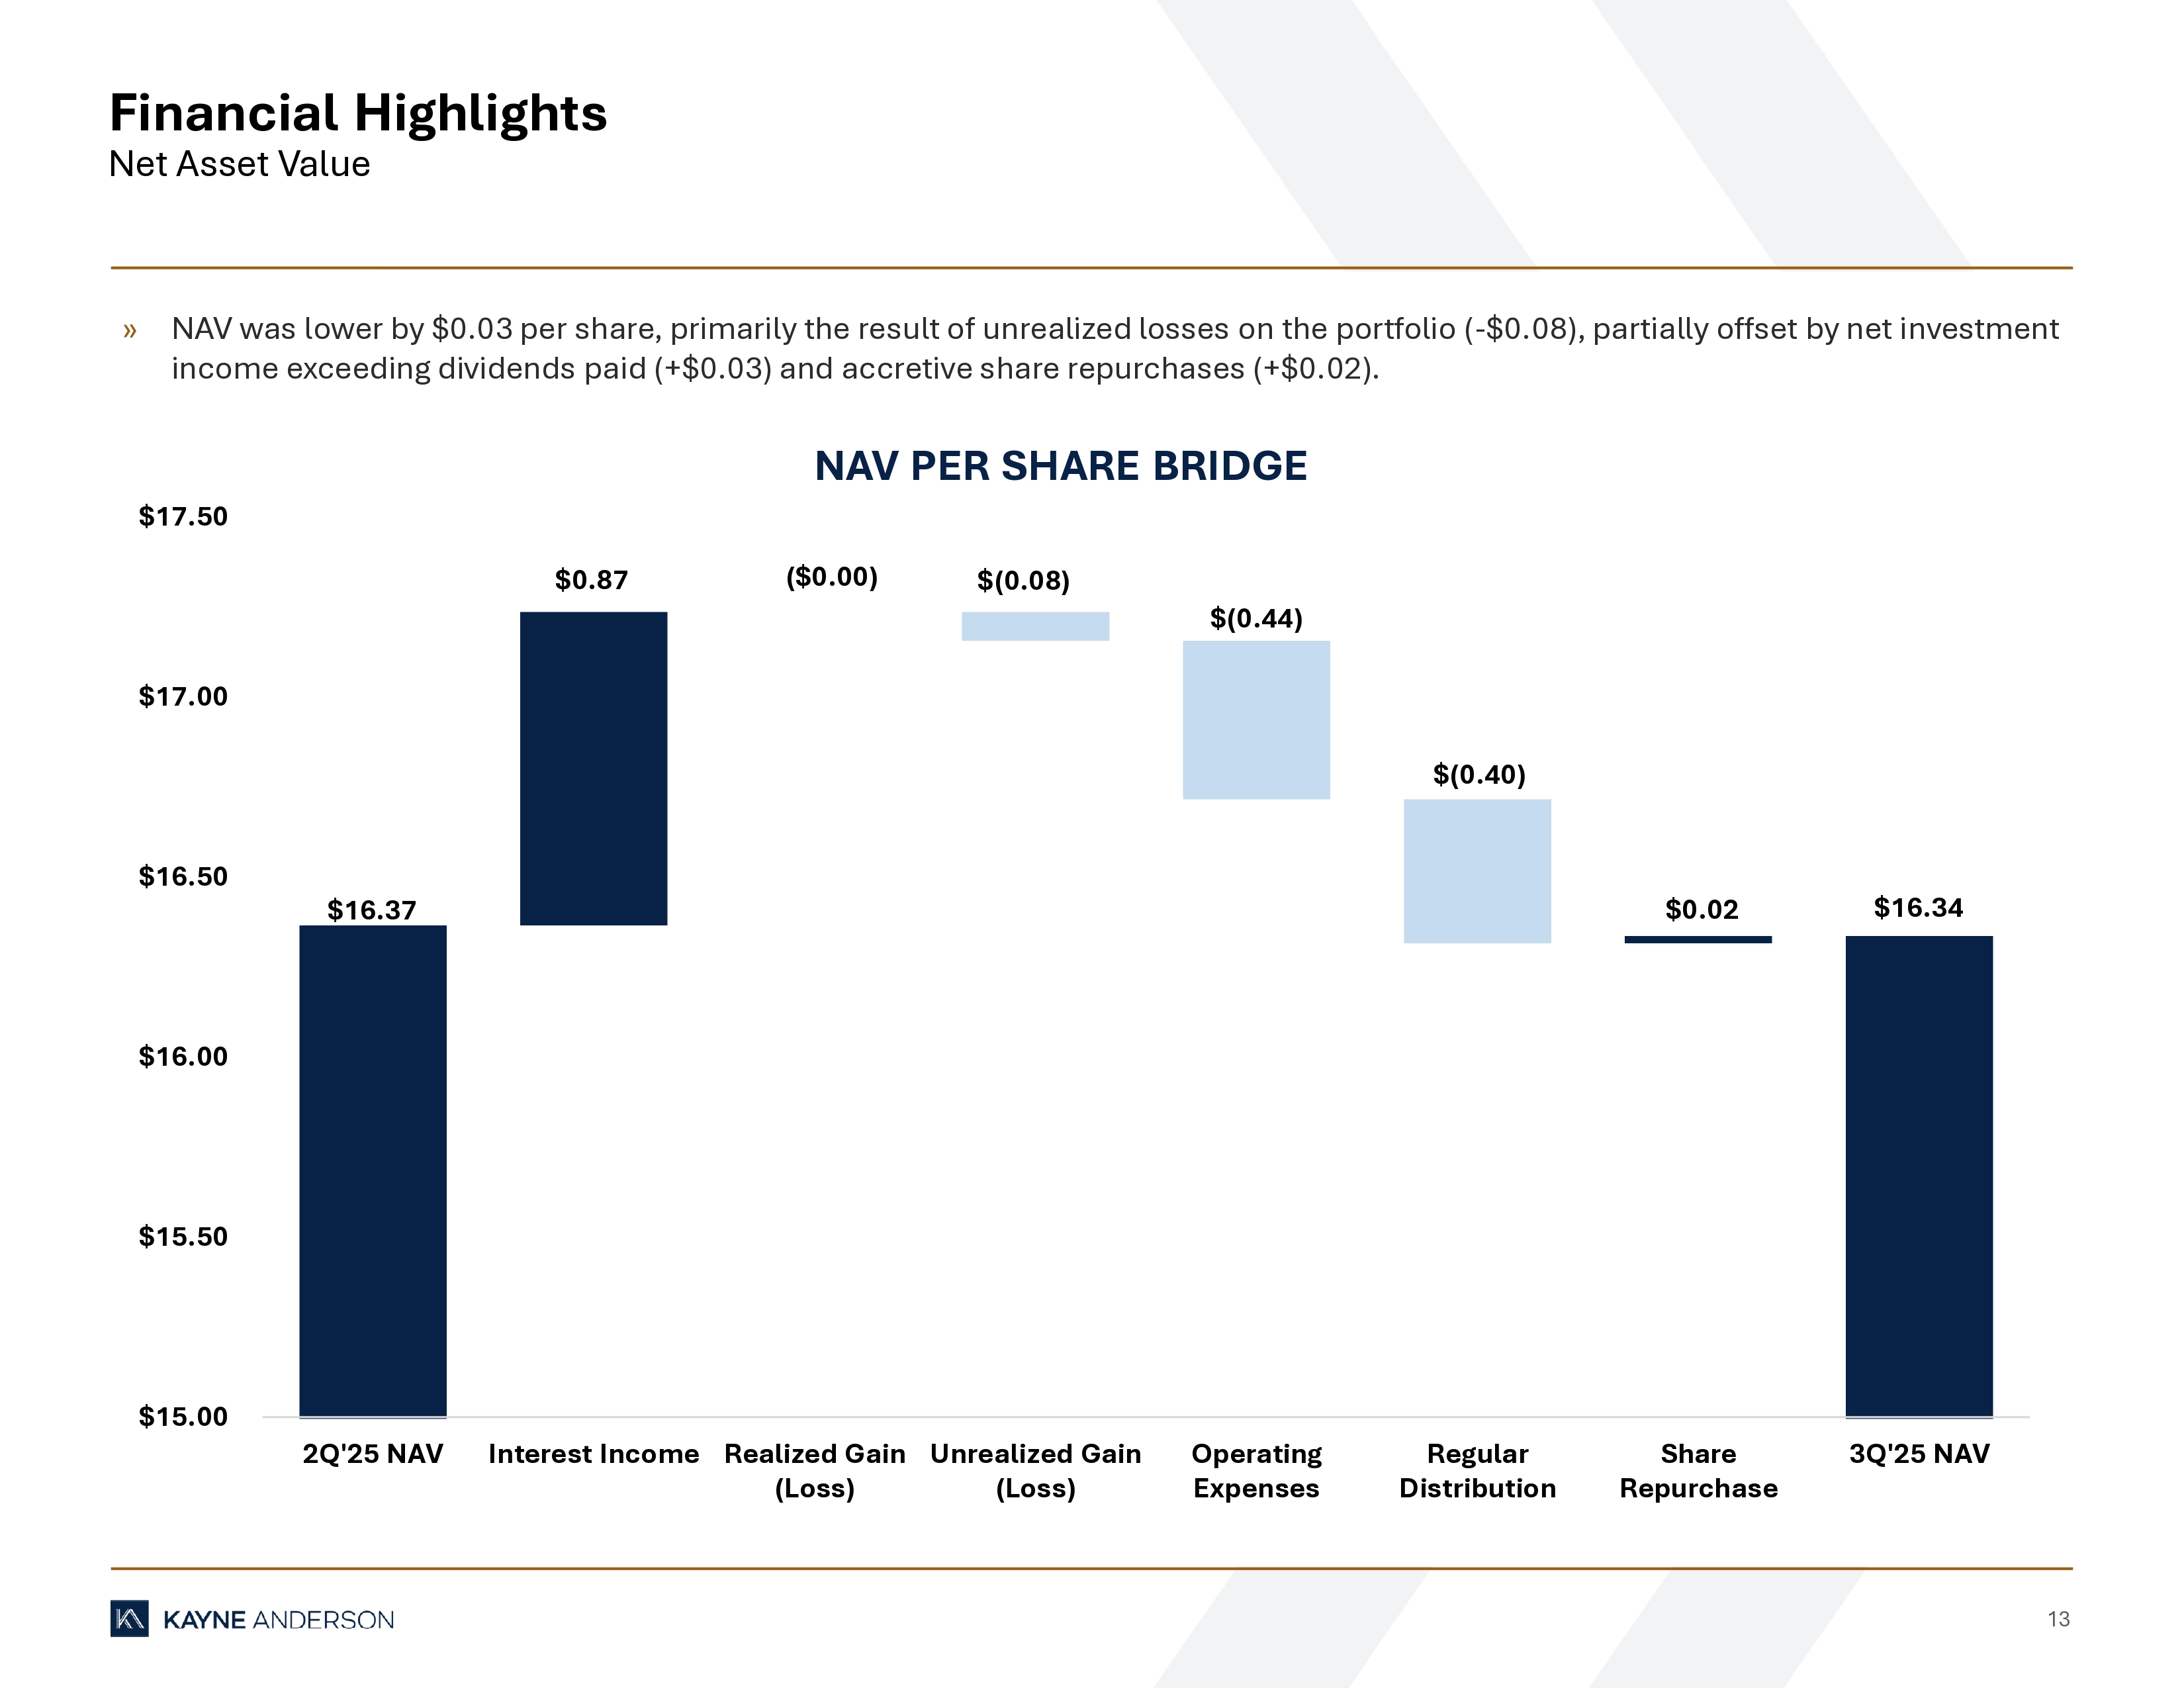
13 Financial Highlights Net Asset Value NAV PER SHARE BRIDGE » NAV was lower by $0.03 per share, primarily the result of unrealized losses on the portfolio ( - $0.08), partially offset by net i nvestment income exceeding dividends paid (+$0.03) and accretive share repurchases (+$0.02). $16.37 $0.87 ($0.00) $(0.08) $(0.44) $(0.40) $0.02 $16.34 $15.00 $15.50 $16.00 $16.50 $17.00 $17.50 2Q'25 NAV Interest Income Realized Gain (Loss) Unrealized Gain (Loss) Operating Expenses Regular Distribution Share Repurchase 3Q'25 NAV
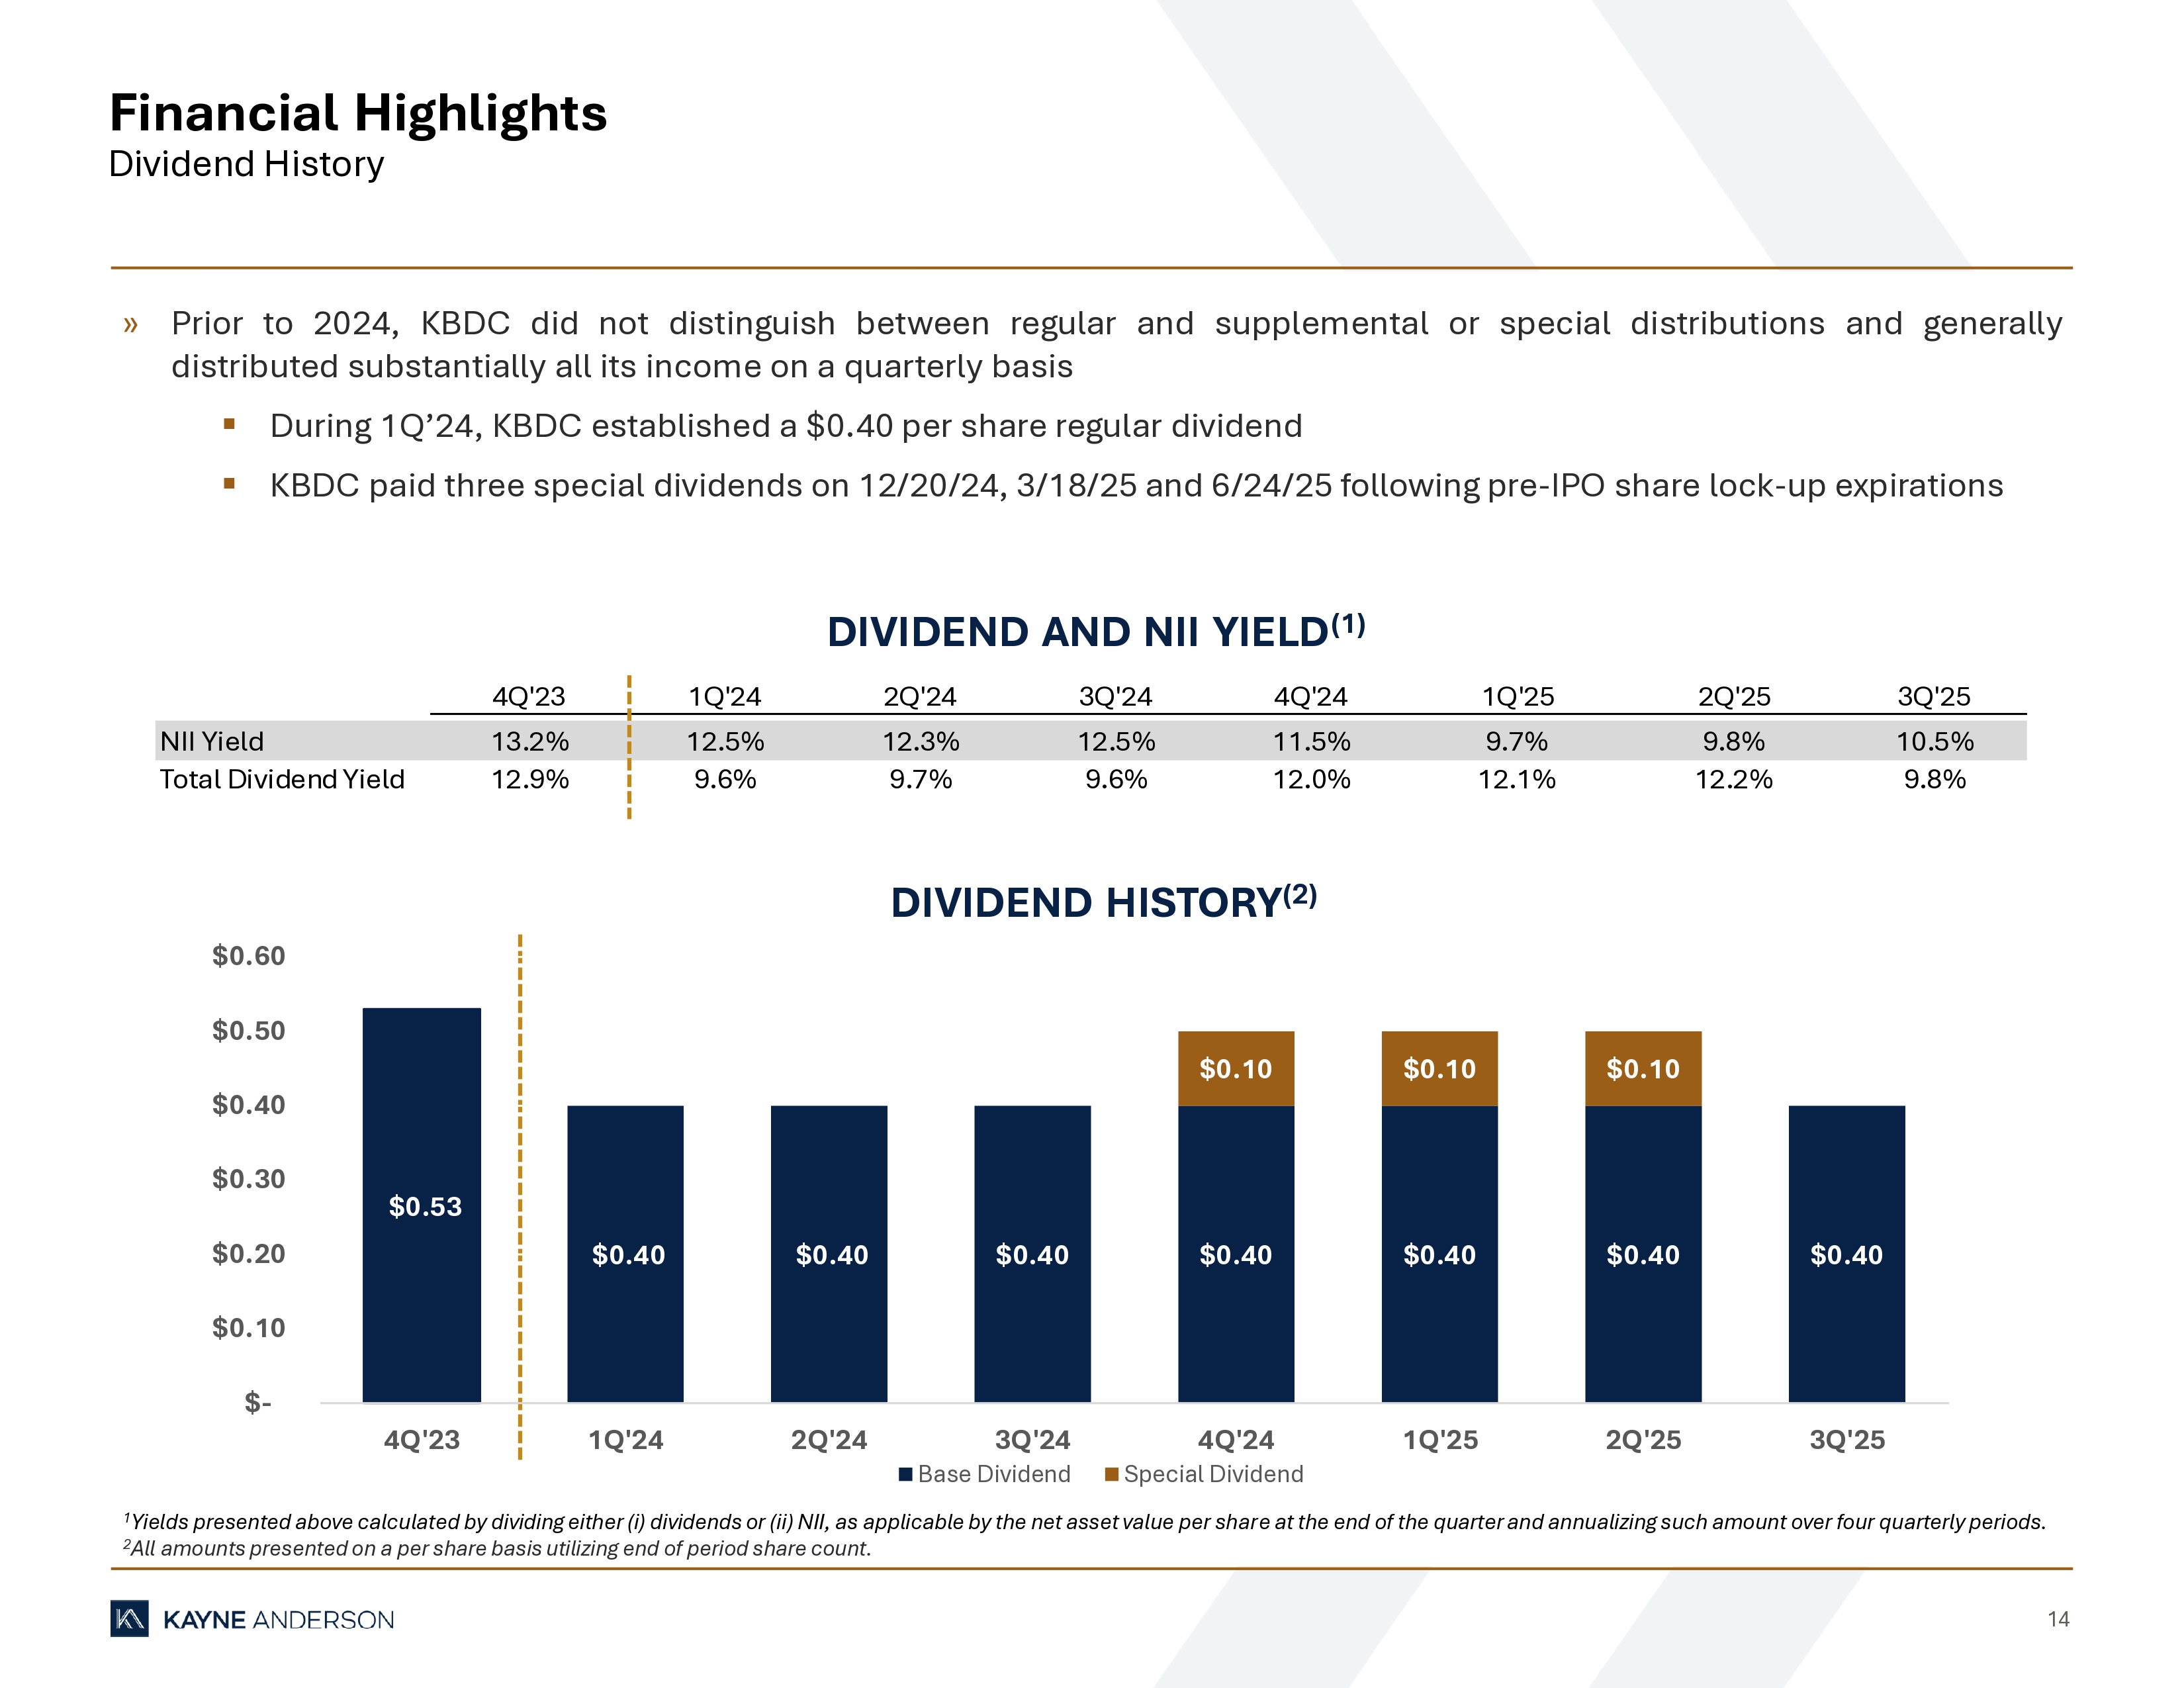
14 Financial Highlights Dividend History 1 Yields presented above calculated by dividing either (i) dividends or (ii) NII, as applicable by the net asset value per shar e a t the end of the quarter and annualizing such amount over four quarterly periods. 2 All amounts presented on a per share basis utilizing end of period share count. DIVIDEND HISTORY (2) DIVIDEND AND NII YIELD (1) » Prior to 2024 , KBDC did not distinguish between regular and supplemental or special distributions and generally distributed substantially all its income on a quarterly basis ▪ During 1 Q’ 24 , KBDC established a $ 0 . 40 per share regular dividend ▪ KBDC paid three special dividends on 12 / 20 / 24 , 3 / 18 / 25 and 6 / 24 / 25 following pre - IPO share lock - up expirations 4Q'23 1Q'24 2Q'24 3Q'24 4Q'24 1Q'25 2Q'25 3Q'25 NII Yield 13.2% 12.5% 12.3% 12.5% 11.5% 9.7% 9.8% 10.5% Total Dividend Yield 12.9% 9.6% 9.7% 9.6% 12.0% 12.1% 12.2% 9.8% $0.53 $0.40 $0.40 $0.40 $0.40 $0.40 $0.40 $0.40 $0.10 $0.10 $0.10 $- $0.10 $0.20 $0.30 $0.40 $0.50 $0.60 4Q'23 1Q'24 2Q'24 3Q'24 4Q'24 1Q'25 2Q'25 3Q'25 Base Dividend Special Dividend

BALANCE SHEET AND OPERATING RESULTS
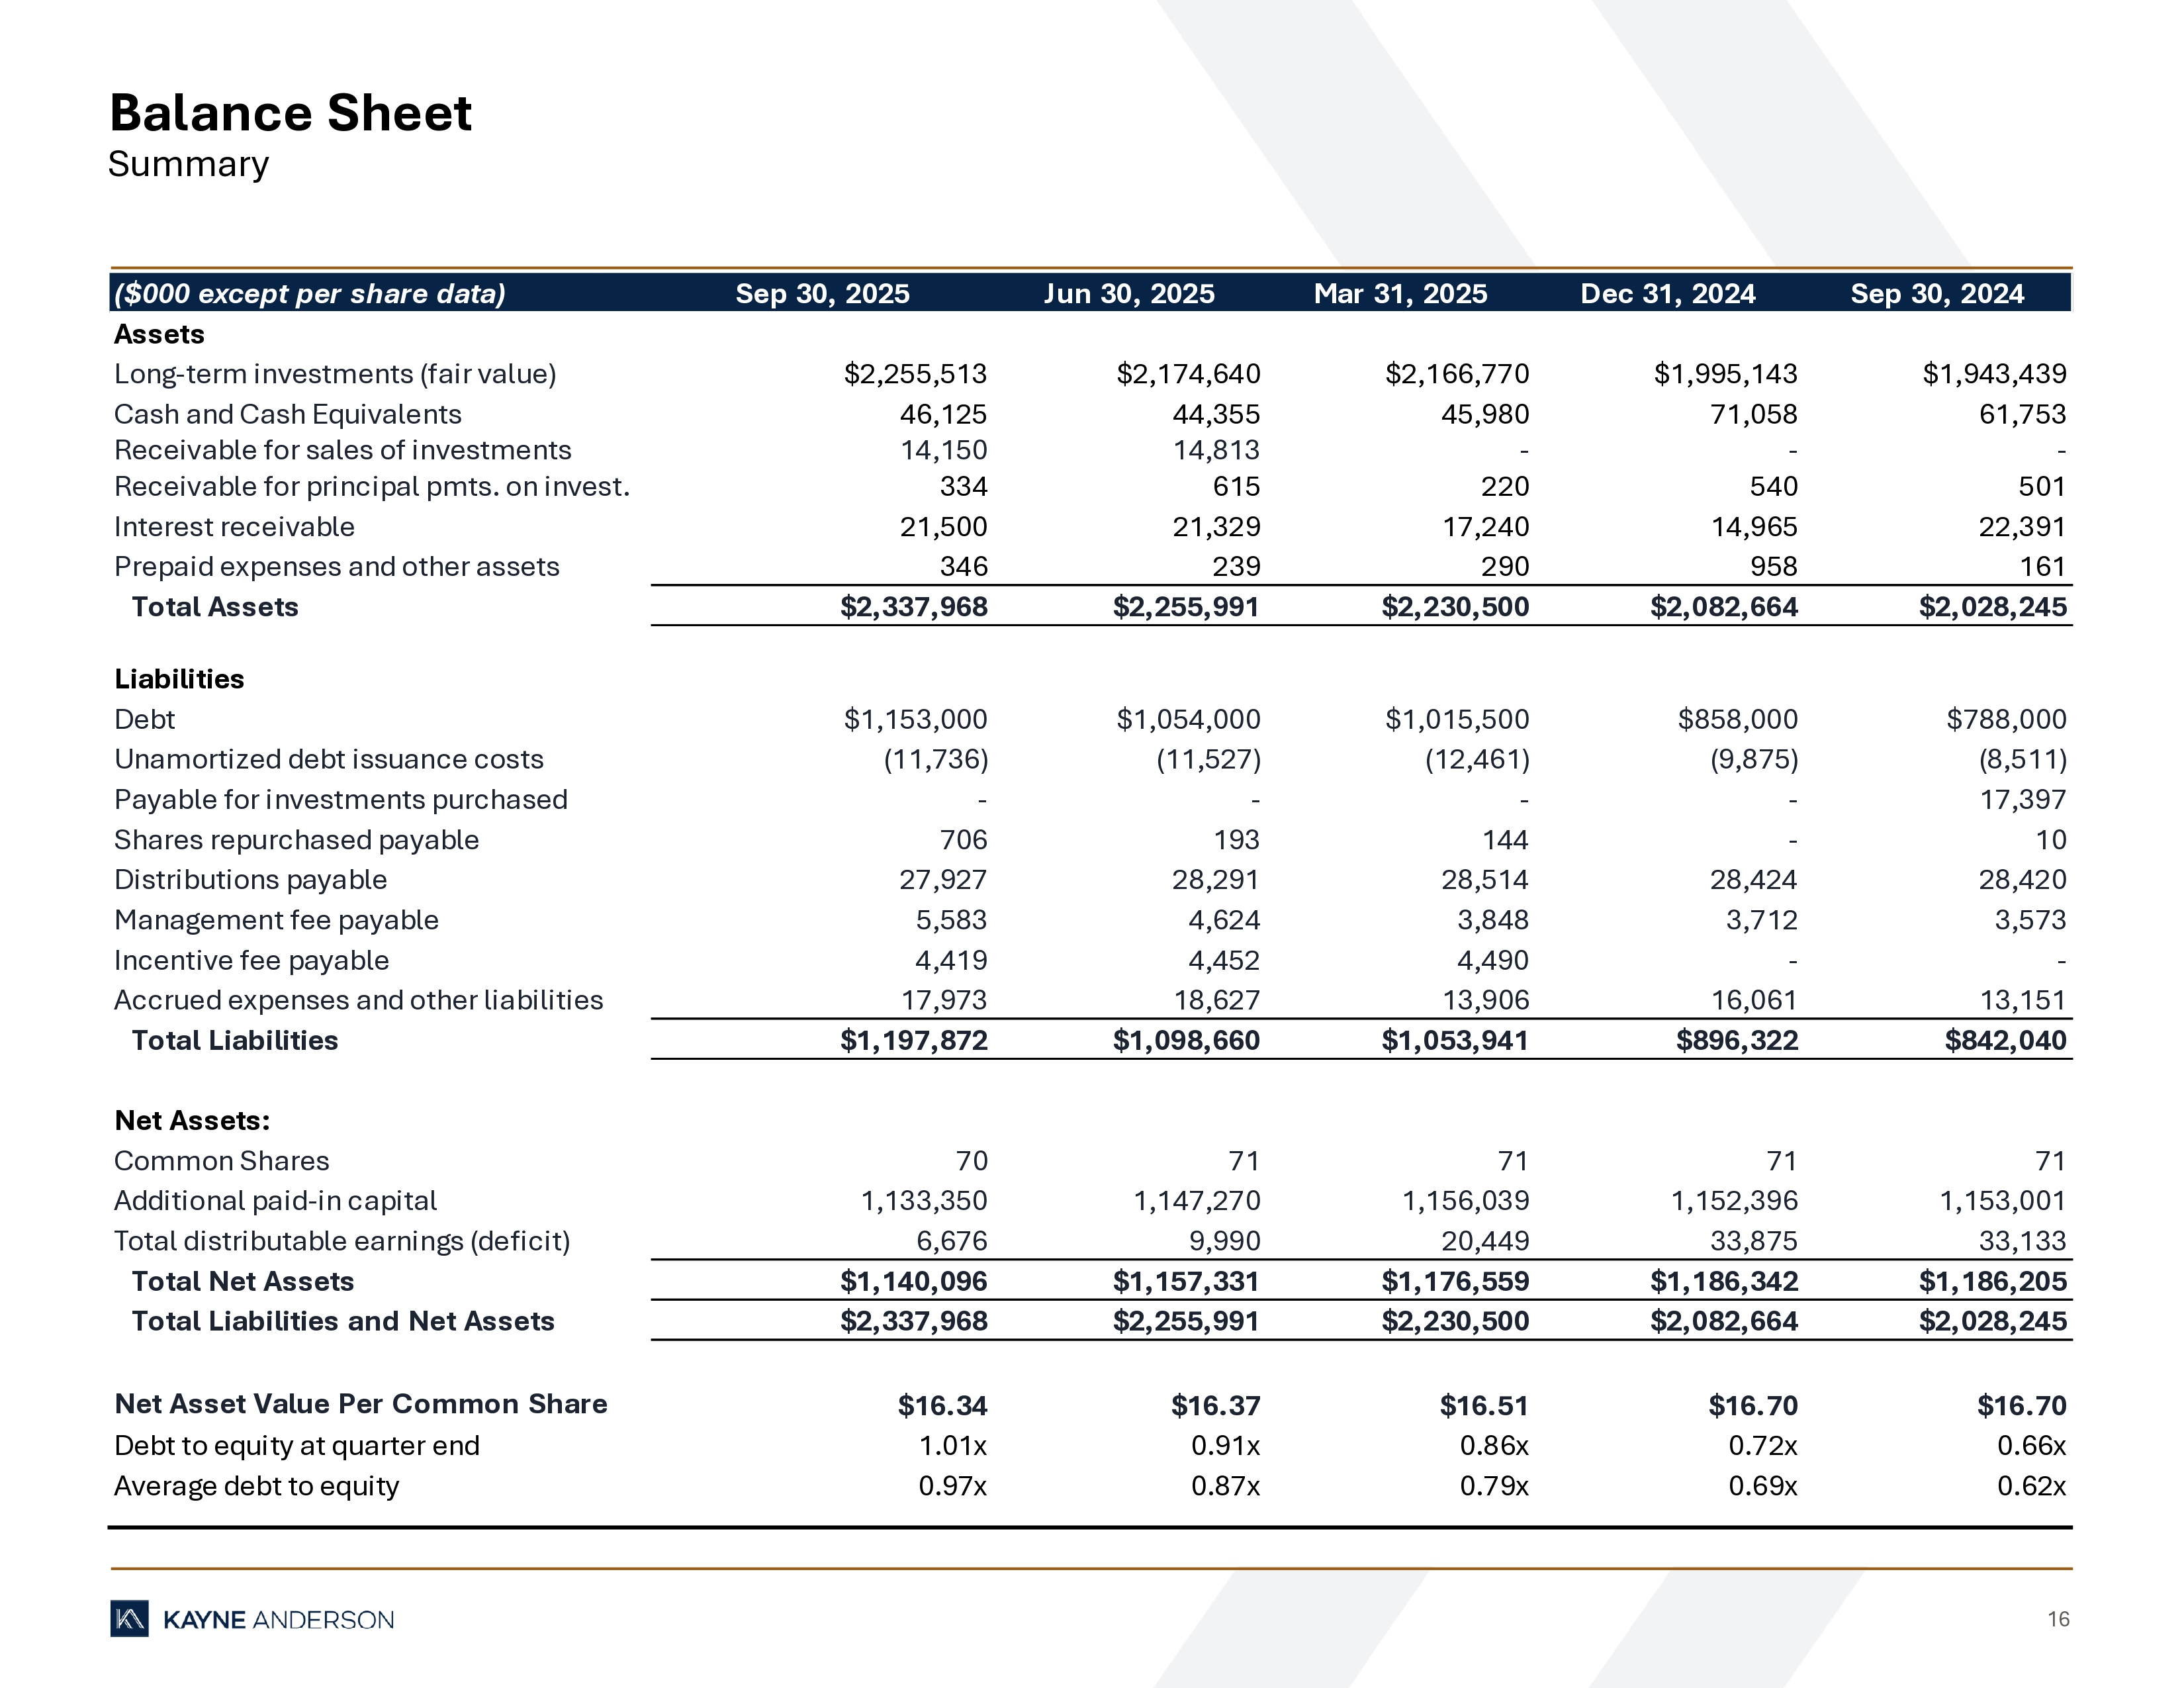
16 Balance Sheet Summary ($000 except per share data) Sep 30, 2025 Jun 30, 2025 Mar 31, 2025 Dec 31, 2024 Sep 30, 2024 Assets Long-term investments (fair value) $2,255,513 $2,174,640 $2,166,770 $1,995,143 $1,943,439 Cash and Cash Equivalents 46,125 44,355 45,980 71,058 61,753 Receivable for sales of investments 14,150 14,813 - - - Receivable for principal pmts. on invest. 334 615 220 540 501 Interest receivable 21,500 21,329 17,240 14,965 22,391 Prepaid expenses and other assets 346 239 290 958 161 Total Assets $2,337,968 $2,255,991 $2,230,500 $2,082,664 $2,028,245 Liabilities Debt $1,153,000 $1,054,000 $1,015,500 $858,000 $788,000 Unamortized debt issuance costs (11,736) (11,527) (12,461) (9,875) (8,511) Payable for investments purchased - - - - 17,397 Shares repurchased payable 706 193 144 - 10 Distributions payable 27,927 28,291 28,514 28,424 28,420 Management fee payable 5,583 4,624 3,848 3,712 3,573 Incentive fee payable 4,419 4,452 4,490 - - Accrued expenses and other liabilities 17,973 18,627 13,906 16,061 13,151 Total Liabilities $1,197,872 $1,098,660 $1,053,941 $896,322 $842,040 Net Assets: Common Shares 70 71 71 71 71 Additional paid-in capital 1,133,350 1,147,270 1,156,039 1,152,396 1,153,001 Total distributable earnings (deficit) 6,676 9,990 20,449 33,875 33,133 Total Net Assets $1,140,096 $1,157,331 $1,176,559 $1,186,342 $1,186,205 Total Liabilities and Net Assets $2,337,968 $2,255,991 $2,230,500 $2,082,664 $2,028,245 Net Asset Value Per Common Share $16.34 $16.37 $16.51 $16.70 $16.70 Debt to equity at quarter end 1.01x 0.91x 0.86x 0.72x 0.66x Average debt to equity 0.97x 0.87x 0.79x 0.69x 0.62x
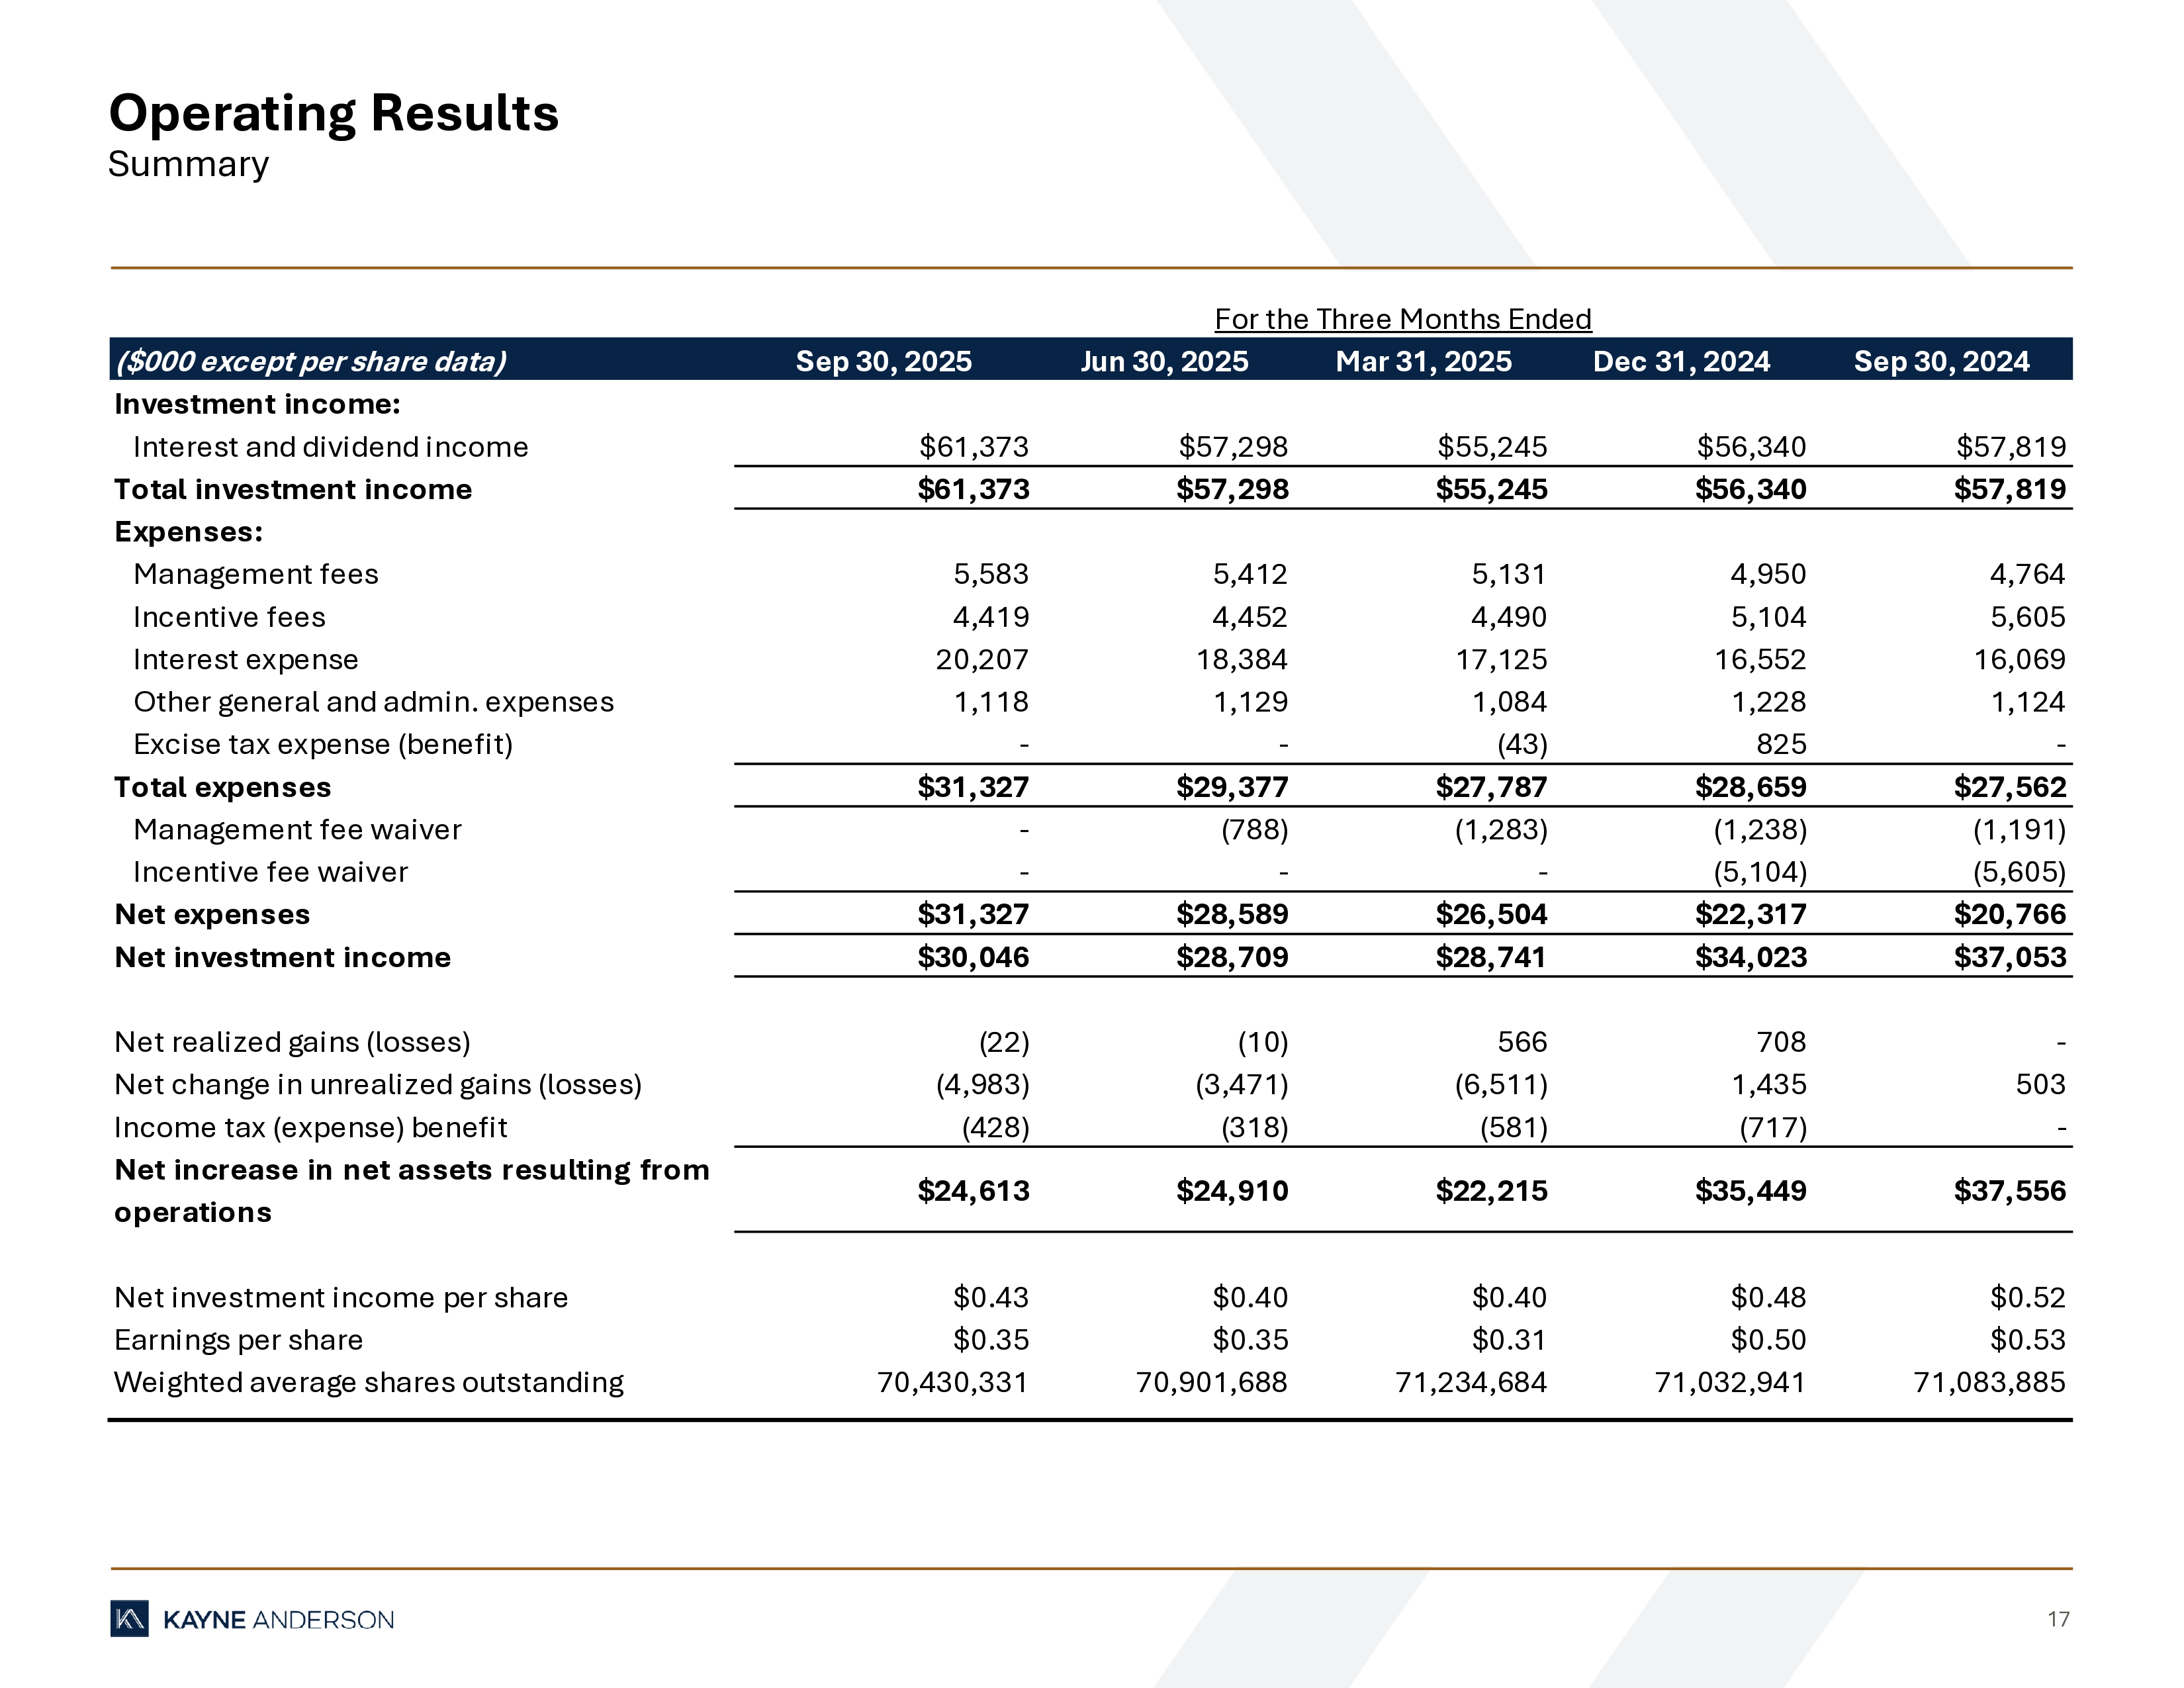
17 Operating Results Summary ($000 except per share data) Sep 30, 2025 Jun 30, 2025 Mar 31, 2025 Dec 31, 2024 Sep 30, 2024 Investment income: Interest and dividend income $61,373 $57,298 $55,245 $56,340 $57,819 Total investment income $61,373 $57,298 $55,245 $56,340 $57,819 Expenses: Management fees 5,583 5,412 5,131 4,950 4,764 Incentive fees 4,419 4,452 4,490 5,104 5,605 Interest expense 20,207 18,384 17,125 16,552 16,069 Other general and admin. expenses 1,118 1,129 1,084 1,228 1,124 Excise tax expense (benefit) - - (43) 825 - Total expenses $31,327 $29,377 $27,787 $28,659 $27,562 Management fee waiver - (788) (1,283) (1,238) (1,191) Incentive fee waiver - - - (5,104) (5,605) Net expenses $31,327 $28,589 $26,504 $22,317 $20,766 Net investment income $30,046 $28,709 $28,741 $34,023 $37,053 Net realized gains (losses) (22) (10) 566 708 - Net change in unrealized gains (losses) (4,983) (3,471) (6,511) 1,435 503 Income tax (expense) benefit (428) (318) (581) (717) - Net increase in net assets resulting from operations $24,613 $24,910 $22,215 $35,449 $37,556 Net investment income per share $0.43 $0.40 $0.40 $0.48 $0.52 Earnings per share $0.35 $0.35 $0.31 $0.50 $0.53 Weighted average shares outstanding 70,430,331 70,901,688 71,234,684 71,032,941 71,083,885 For the Three Months Ended
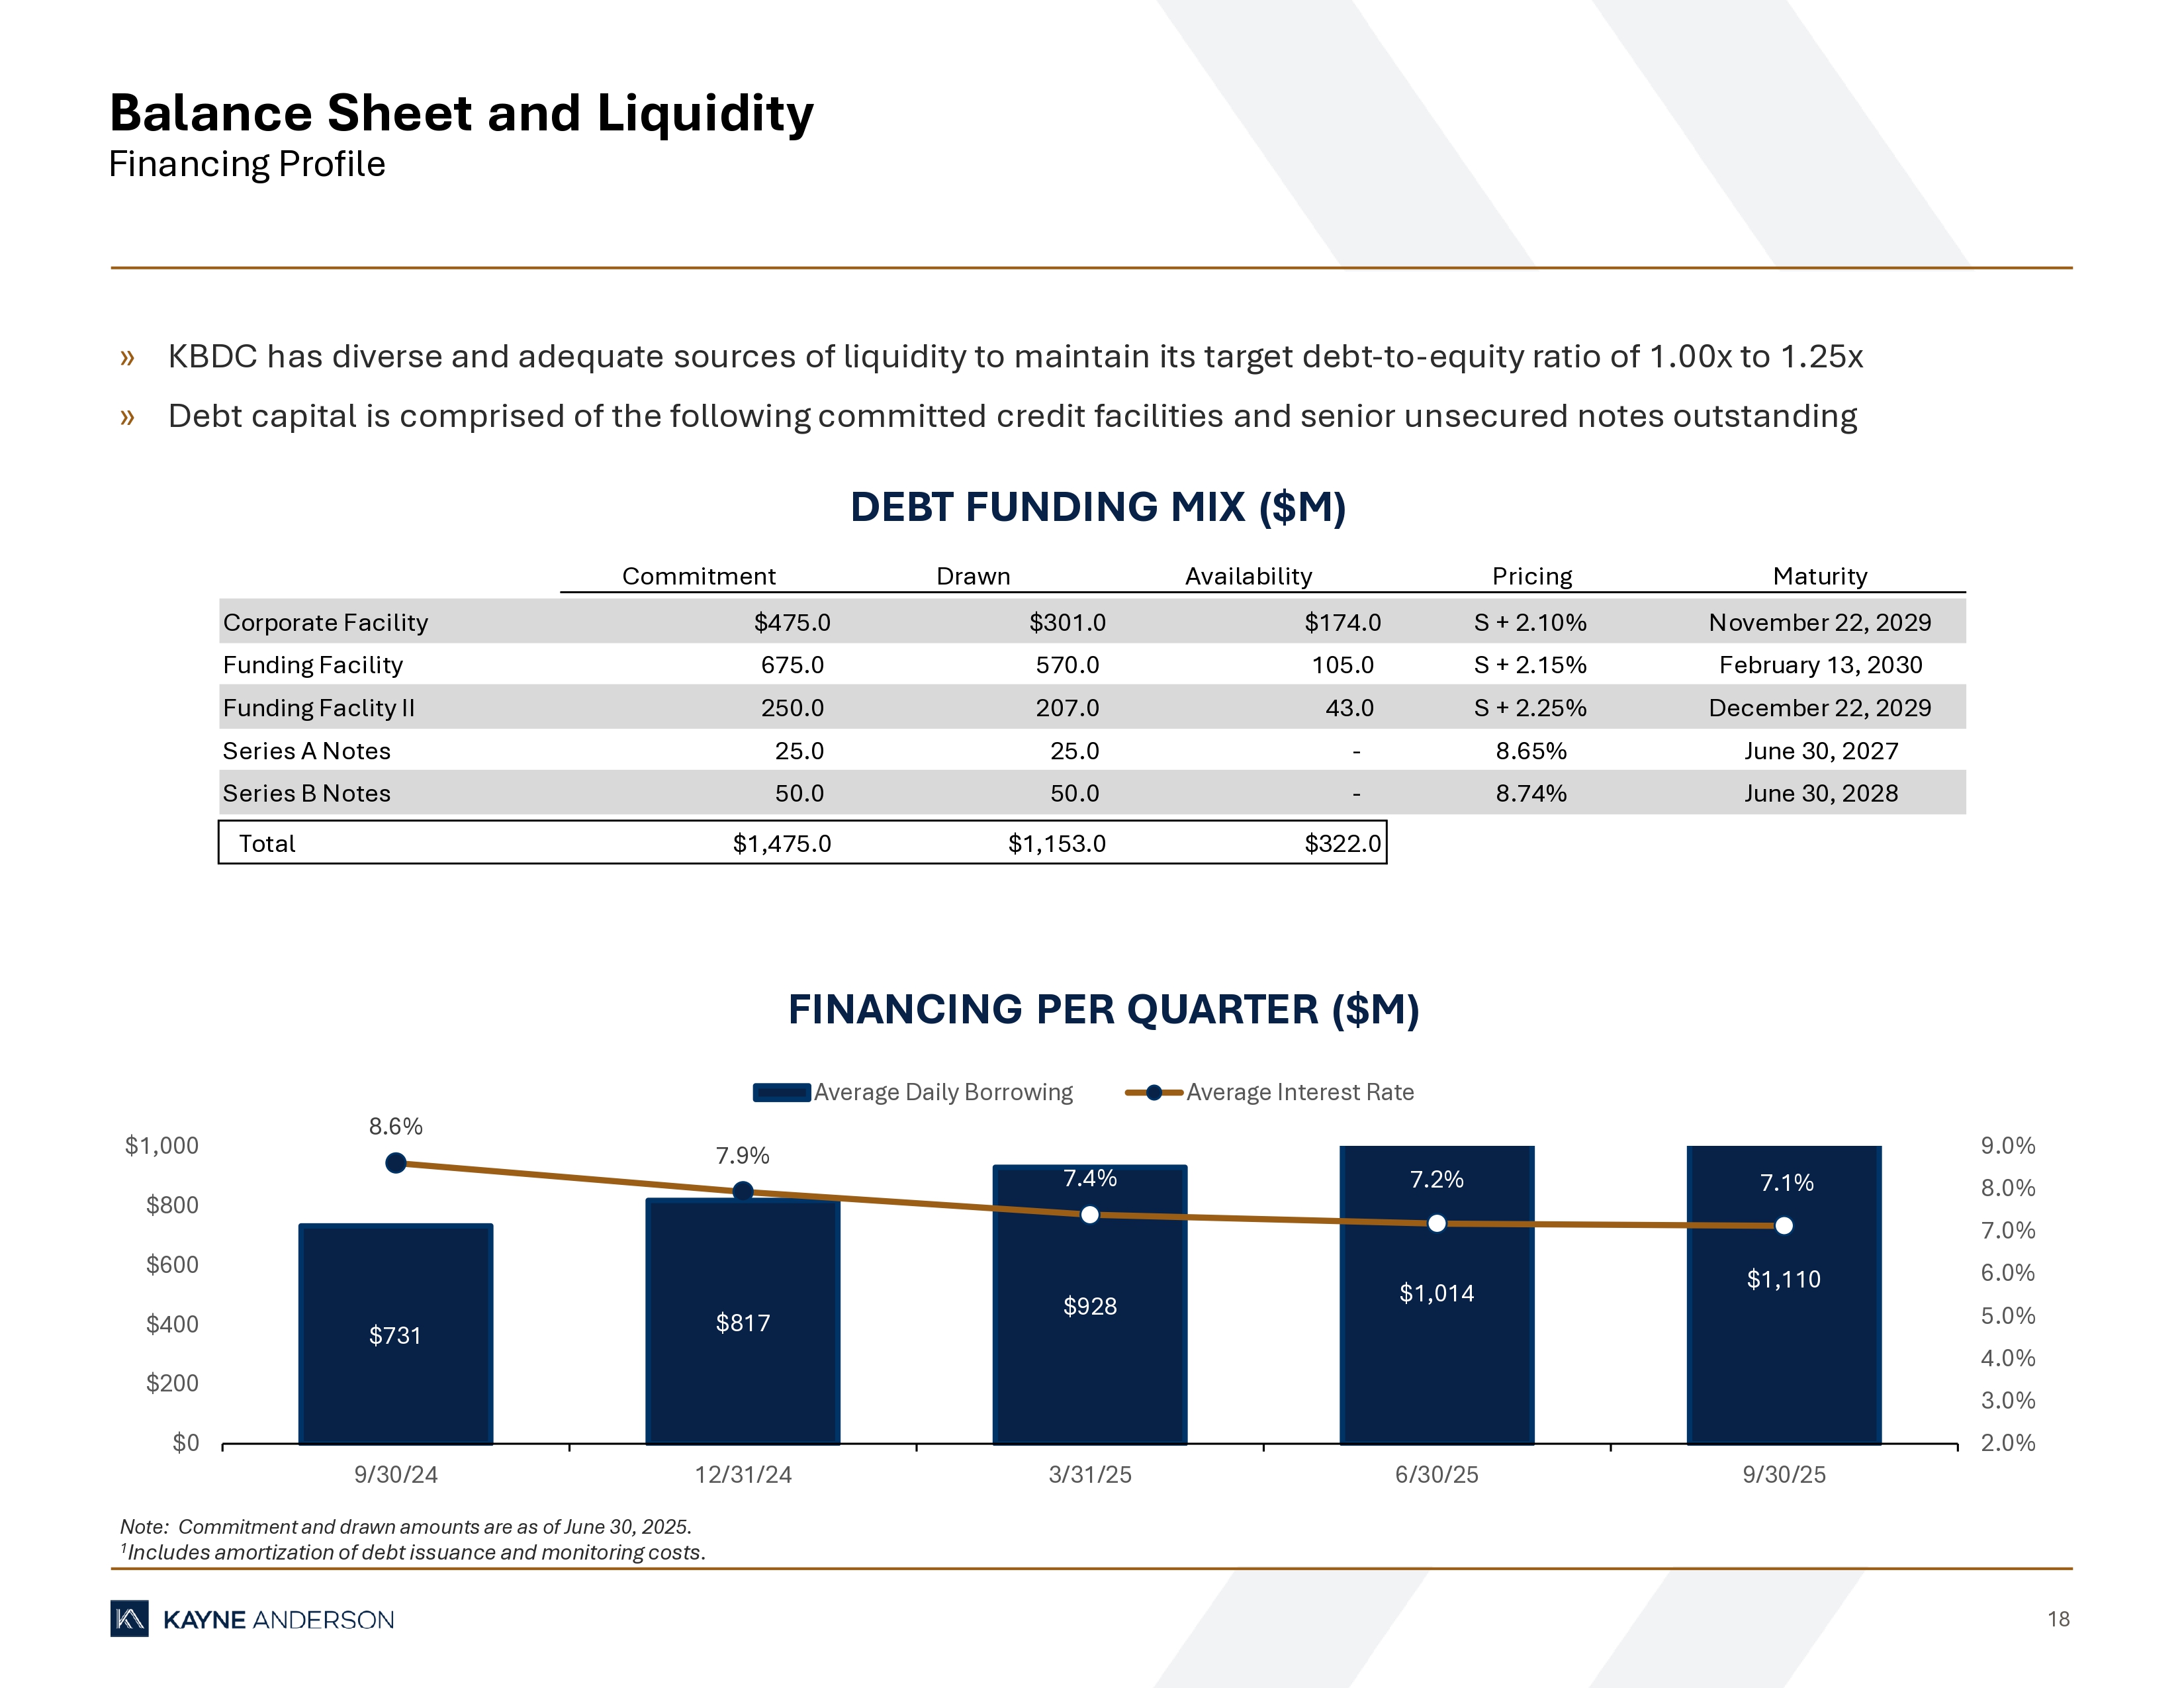
18 Balance Sheet and Liquidity Financing Profile Note: Commitment and drawn amounts are as of June 30, 2025. 1 Includes amortization of debt issuance and monitoring costs. DEBT FUNDING MIX ($M) FINANCING PER QUARTER ($M) » KBDC has diverse and adequate sources of liquidity to maintain its target debt - to - equity ratio of 1.00x to 1.25x » Debt capital is comprised of the following committed credit facilities and senior unsecured notes outstanding Commitment Drawn Availability Pricing Maturity Corporate Facility $475.0 $301.0 $174.0 S + 2.10% November 22, 2029 Funding Facility 675.0 570.0 105.0 S + 2.15% February 13, 2030 Funding Faclity II 250.0 207.0 43.0 S + 2.25% December 22, 2029 Series A Notes 25.0 25.0 - 8.65% June 30, 2027 Series B Notes 50.0 50.0 - 8.74% June 30, 2028 Total $1,475.0 $1,153.0 $322.0 $731 $817 $928 $1,014 $1,110 8.6% 7.9% 7.4% 7.2% 7.1% 2.0% 3.0% 4.0% 5.0% 6.0% 7.0% 8.0% 9.0% $0 $200 $400 $600 $800 $1,000 9/30/24 12/31/24 3/31/25 6/30/25 9/30/25 Average Daily Borrowing Average Interest Rate
Exhibit 99.3

Kayne Anderson BDC, Inc. Appoints Frank Karl
as President & Andy Wedderburn-Maxwell as Senior Vice President
CHICAGO – November 10, 2025 --(BUSINESS
WIRE)-- Kayne Anderson BDC, Inc. (NYSE: KBDC) (“KBDC” or the “Company”), a business development company externally
managed by its investment adviser, KA Credit Advisors, LLC, an affiliate of Kayne Anderson Capital Advisors, LP (“Kayne Anderson”),
today announced the promotion of Frank Karl to President and the appointment of Andy Wedderburn-Maxwell as Senior Vice President.
Frank Karl joined Kayne Anderson Capital Advisors,
L.P. (“Kayne Anderson”), in 2013 and previously served as Senior Vice President of the Company since 2023. He has been a Managing
Director at Kayne Anderson since 2021 and has been focused on Kayne Anderson’s private credit strategies during his entire tenure
at the firm.
“Frank played a pivotal role in the formation
of KBDC and was instrumental in leading our IPO process and the recent strategic investment into SG Credit. Having worked alongside him
for more than a decade I’ve had the opportunity to witness his investment expertise, focus on lasting borrower partnerships, and
strong alignment with our collaborative culture. I have full confidence that Frank and the broader Kayne Anderson leadership team, will
continue to advance our growth strategy and deliver compelling risk-adjusted returns for our shareholders,” said Doug Goodwillie,
Co-CEO of KBDC.
Andy Wedderburn-Maxwell joined Kayne Anderson
in April 2025 as Managing Director, BDCs. Andy has over 15 years of investment banking experience, having held senior roles at firms including
Citigroup and Wells Fargo, where he served as a Managing Director focused on financial institutions. Prior to joining Kayne Anderson,
Andy transitioned to the asset management side in 2023, where he contributed to the development and public listing of a BDC at another
investment management firm.
“We’ve known Andy for many years,
dating back to the early stages of our IPO process when he was a senior banker at Wells Fargo,” said Ken Leonard, Co-CEO of KBDC.
“Bringing him onto the team earlier this year has allowed us to deepen our expertise and expand our connectivity across both the
buy side and sell side. We believe Andy’s focus, industry perspective, and strategic insight will be a significant asset to KBDC
and the growth of our private credit platform.”
About Kayne Anderson BDC, Inc.
Kayne Anderson BDC, Inc. is a business development
company (“BDC”) that invests primarily in first lien senior secured loans, with a secondary focus on unitranche and split-lien
loans to middle market companies. KBDC is externally managed by its investment adviser, KA Credit Advisors, LLC, an indirect controlled
subsidiary of Kayne Anderson Capital Advisors, L.P., a prominent alternative investment management firm. KBDC has elected to be regulated
as a BDC under the Investment Company Act of 1940, as amended (“1940 Act”). KBDC’s investment objective is to generate
current income and, to a lesser extent, capital appreciation. For more information, please visit www.kaynebdc.com.
Forward-looking Statements
This press release may contain “forward-looking statements”
that involve substantial risks and uncertainties. Such statements involve known and unknown risks, uncertainties and other factors and
undue reliance should not be placed thereon. These forward-looking statements are not historical facts, but rather are based on current
expectations, estimates and projections about KBDC, its current and prospective portfolio investments, its industry, its beliefs and opinions,
and its assumptions. Words such as “anticipates,” “expects,” “intends,” “plans,” “will,”
“may,” “continue,” “believes,” “seeks,” “estimates,” “would,”
“could,” “should,” “targets,” “projects,” “outlook,” “potential,”
“predicts” and variations of these words and similar expressions are intended to identify forward-looking statements. These
statements are not guarantees of future performance and are subject to risks, uncertainties and other factors, some of which are beyond
KBDC’s control and difficult to predict and could cause actual results to differ materially from those expressed or forecasted in
the forward-looking statements including, without limitation, the risks, uncertainties and other factors identified in KBDC’s filings
with the SEC. All forward-looking statements speak only as of the date of this press release. KBDC does not undertake any obligation to
update or revise any forward-looking statements or any other information contained herein, except as required by applicable law.
Contacts:
Investor Relations [email protected]