ke-202111030001606757false00016067572021-11-032021-11-03
UNITED STATES
SECURITIES AND EXCHANGE COMMISSION
WASHINGTON, D.C. 20549
FORM 8-K
CURRENT REPORT
Pursuant to Section 13 or 15(d) of the Securities Exchange Act of 1934
Date of Report (Date of earliest event reported) November 3, 2021
KIMBALL ELECTRONICS, INC.
________________________________________________________________________________________________________
(Exact name of registrant as specified in its charter)
| | | | | | | | | | | | | | |
| | | | | |
| Indiana | | 001-36454 | | 35-2047713 |
| (State or other jurisdiction of | | (Commission File | | (IRS Employer Identification No.) |
| incorporation) | | Number) | | |
| | | | | | | | |
| | | |
1205 Kimball Boulevard, Jasper, Indiana | | 47546 |
| (Address of principal executive offices) | | (Zip Code) |
Registrant’s telephone number, including area code (812) 634-4000
| | |
| Not Applicable |
| (Former name or former address, if changed since last report) |
Check the appropriate box below if the Form 8-K filing is intended to simultaneously satisfy the filing obligation of the registrant under any of the following provisions (see General Instruction A.2. below):
☐ Written communications pursuant to Rule 425 under the Securities Act (17 CFR 230.425)
☐ Soliciting material pursuant to Rule 14a-12 under the Exchange Act (17 CFR 240.14a-12)
☐ Pre-commencement communications pursuant to Rule 14d-2(b) under the Exchange Act (17 CFR 240.14d-2(b))
☐ Pre-commencement communications pursuant to Rule 13e-4(c) under the Exchange Act (17 CFR 240.13e-4(c))
| | | | | | | | |
| Securities registered pursuant to Section 12(b) of the Act: |
| Title of each Class | Trading Symbol | Name of each exchange on which registered |
| Common Stock, no par value | KE | The Nasdaq Stock Market LLC |
Indicate by check mark whether the registrant is an emerging growth company as defined in Rule 405 of the Securities Act of 1933 (Section 230.405 of this chapter) or Rule 12b-2 of the Securities Exchange Act of 1934 (Section 240.12b-2 of this chapter).
Emerging growth company ☐
If an emerging growth company, indicate by check mark if the registrant has elected not to use the extended transition period for complying with any new or revised financial accounting standards provided pursuant to Section 13(a) of the Exchange Act. ☐
Item 2.02 Results of Operations and Financial Condition
On November 3, 2021, the Company issued an earnings release for the first quarter ended September 30, 2021. The earnings release is attached as Exhibit 99.1 and supplementary information provided for the Company’s earnings conference call is attached as Exhibit 99.2.
The information in Item 2.02 of this Form 8-K, including Exhibit 99.1 and Exhibit 99.2, is being furnished and shall not be deemed “filed” for purposes of Section 18 of the Securities Exchange Act of 1934, as amended, or otherwise subject to the liabilities of that Section. The information in this Form 8-K shall not be incorporated by reference into any filing under the Securities Act of 1933, as amended, or under the Securities Exchange Act of 1934, as amended, except as shall otherwise be expressly set forth by specific reference in such filing.
Item 9.01 Financial Statements and Exhibits
(d) Exhibits
| | | | | | | | |
| Exhibit | | |
| Number | | Description |
| 99.1 | | |
| 99.2 | | |
SIGNATURES
Pursuant to the requirements of the Securities Exchange Act of 1934, the registrant has duly caused this report to be signed on its behalf by the undersigned hereunto duly authorized.
| | | | | |
| | |
| | KIMBALL ELECTRONICS, INC. |
| | |
| By: | /s/ Jana T. Croom |
| | JANA T. CROOM
Vice President,
Chief Financial Officer |
Date: November 3, 2021
Exhibit 99.1
KIMBALL ELECTRONICS, INC. REPORTS FIRST QUARTER FISCAL 2022 RESULTS; REITERATES GUIDANCE FOR FISCAL YEAR 2022, DRIVEN BY STRONG SECOND HALF
•Net sales in the first quarter of fiscal 2022 totaled $292.7 million.
•Net income of $2.6 million, or $0.10 per diluted share.
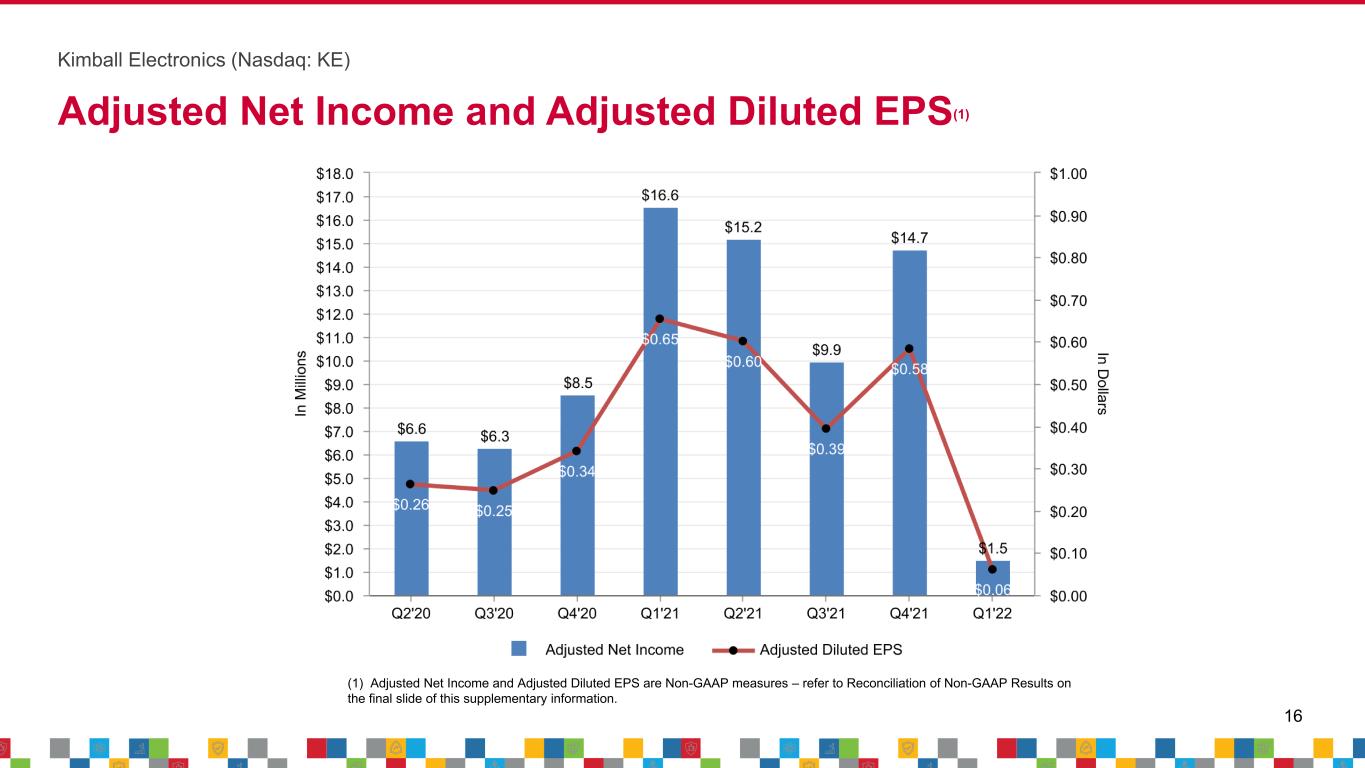
•Adjusted non-GAAP net income of $1.5 million, or $0.06 per diluted share.
JASPER, Ind., November 3, 2021 (BUSINESS WIRE) -- Kimball Electronics, Inc. (Nasdaq: KE) today announced financial results for the first quarter ended September 30, 2021.
| | | | | | | | | | | | | | | | | | | |
| | | | | | | | | | | |
| Three Months Ended | | | | |
| September 30, | | | | |
| (Amounts in Thousands, except EPS) | 2021 | | 2020 | | | | | | | | |
| Net Sales | $ | 292,717 | | | $ | 331,749 | | | | | | | | | |
| Operating Income | $ | 4,780 | | | $ | 17,807 | | | | | | | | | |
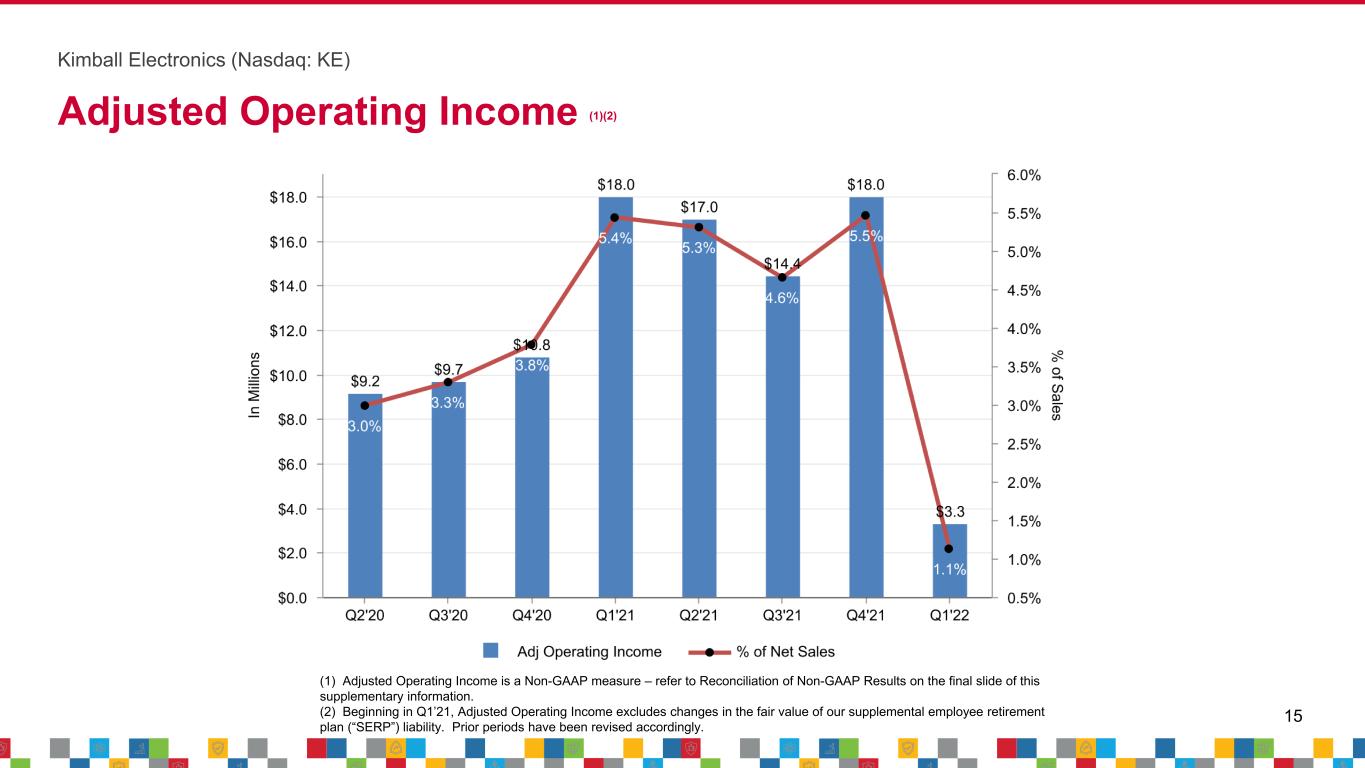
Adjusted Operating Income (non-GAAP) (1) | $ | 3,309 | | | $ | 18,016 | | | | | | | | | |
| Operating Income % | 1.6 | % | | 5.4 | % | | | | | | | | |
| Adjusted Operating Income (non-GAAP) % | 1.1 | % | | 5.4 | % | | | | | | | | |
| Net Income | $ | 2,564 | | | $ | 16,811 | | | | | | | | | |
Adjusted Net Income (non-GAAP) (1) | $ | 1,514 | | | $ | 16,552 | | | | | | | | | |
| Diluted EPS | $ | 0.10 | | | $ | 0.66 | | | | | | | | | |
Adjusted Diluted EPS (non-GAAP) (1) | $ | 0.06 | | | $ | 0.65 | | | | | | | | | |
(1) A reconciliation of GAAP and non-GAAP financial measures is included below.
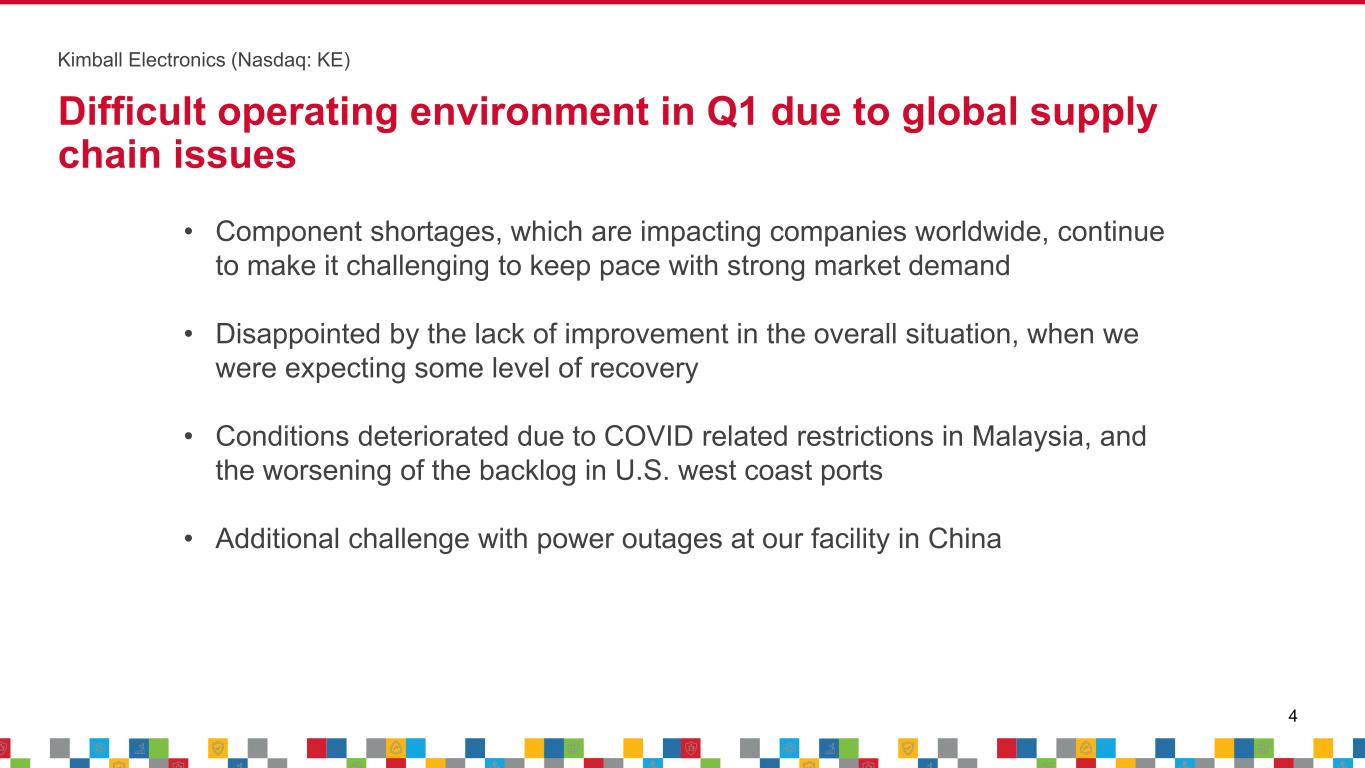
Donald D. Charron, Chairman and Chief Executive Officer, stated, “I am proud of our people, our company, and the results for Q1, considering the difficult operating environment caused by issues in the global supply chain. Component shortages, which are impacting companies worldwide, continue to make it challenging to keep pace with strong market demand. We were disappointed by the lack of improvement in the overall situation in the September ending quarter, when we were actually expecting some level of recovery. Conditions deteriorated in the period due to COVID related restrictions in Malaysia, and the worsening of the backlog in U.S. west coast ports.”
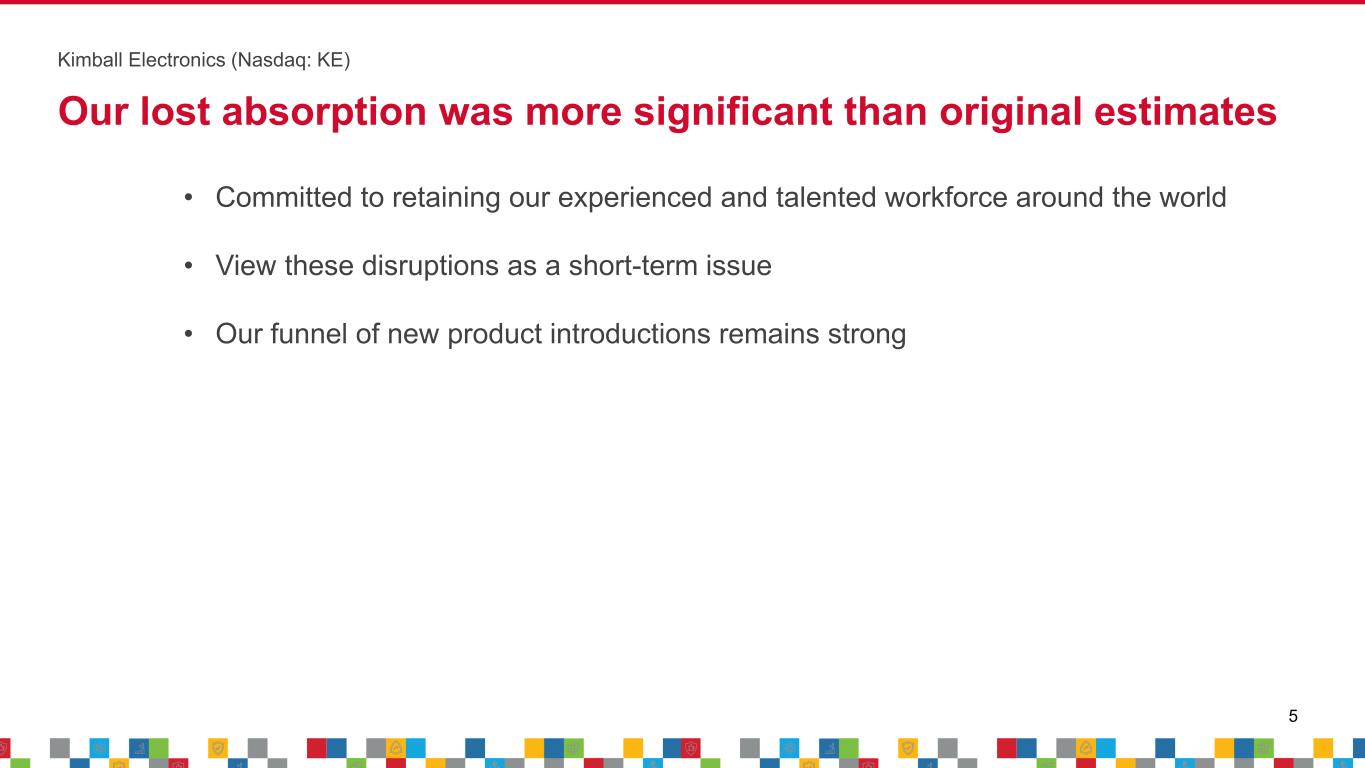
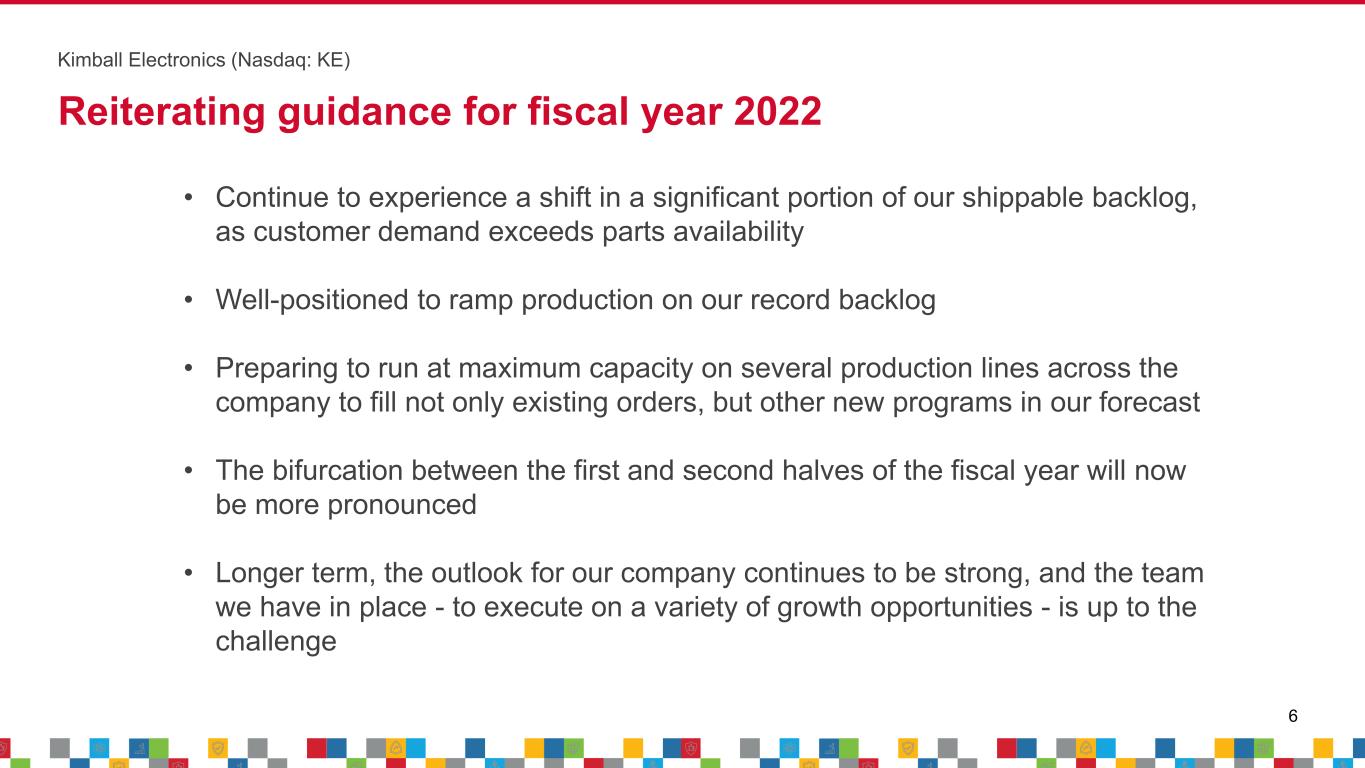
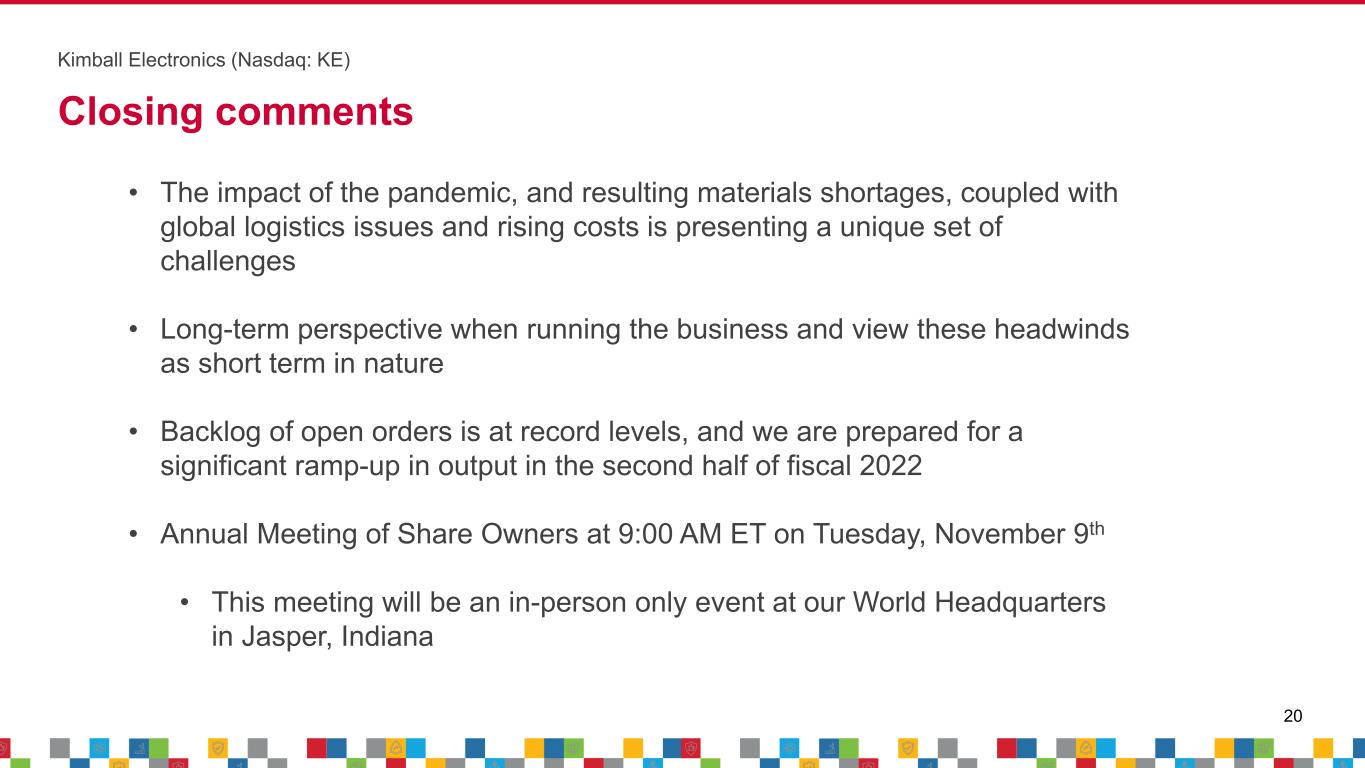
Mr. Charron continued, “While these supply chain challenges had a more significant impact on absorption than anticipated, we are committed to retaining our experienced and talented workforce around the world as we see these disruptions as a short-term issue. As supply constraints ease, we are well positioned to ramp production on our record backlog and support our strong funnel of new product introductions. We are reiterating our guidance for fiscal 2022, although the bifurcation between the first and second halves will be more pronounced.”
First Quarter Fiscal Year 2022 Overview
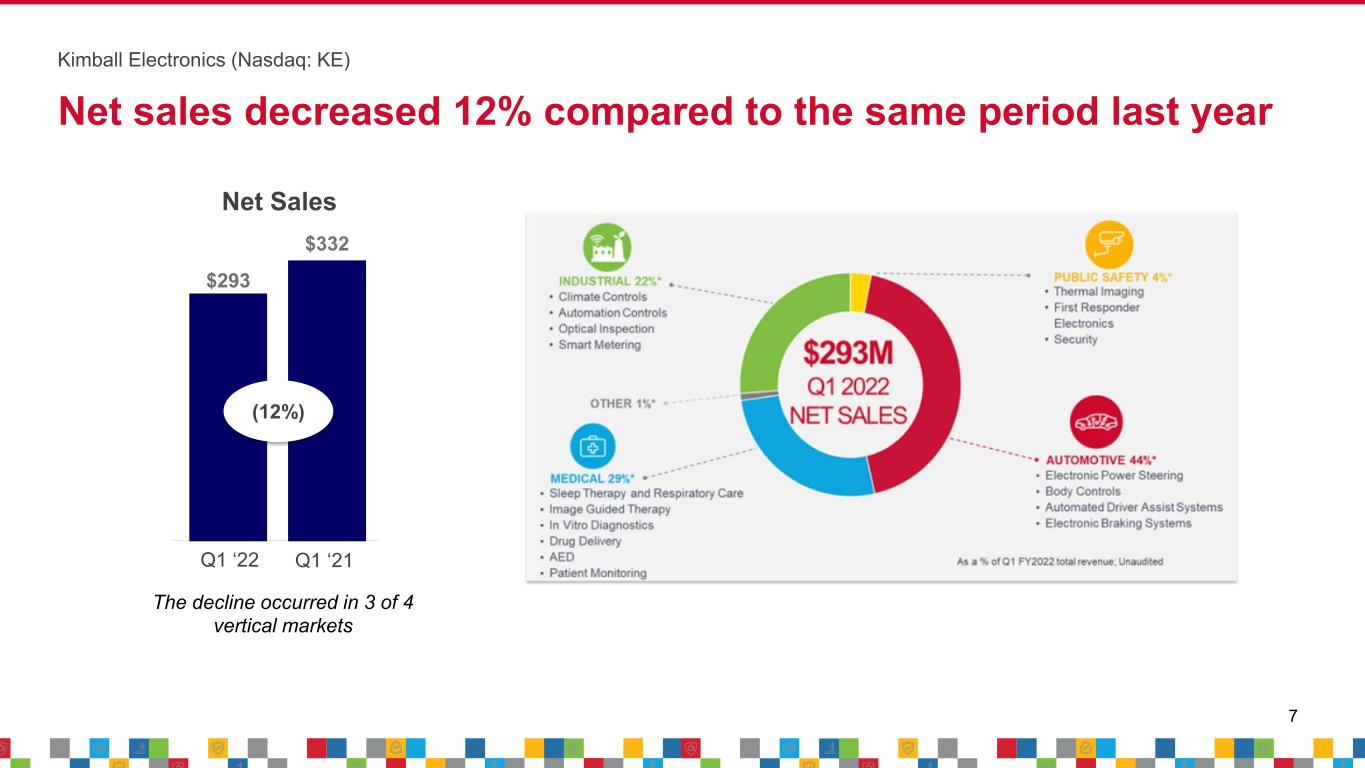
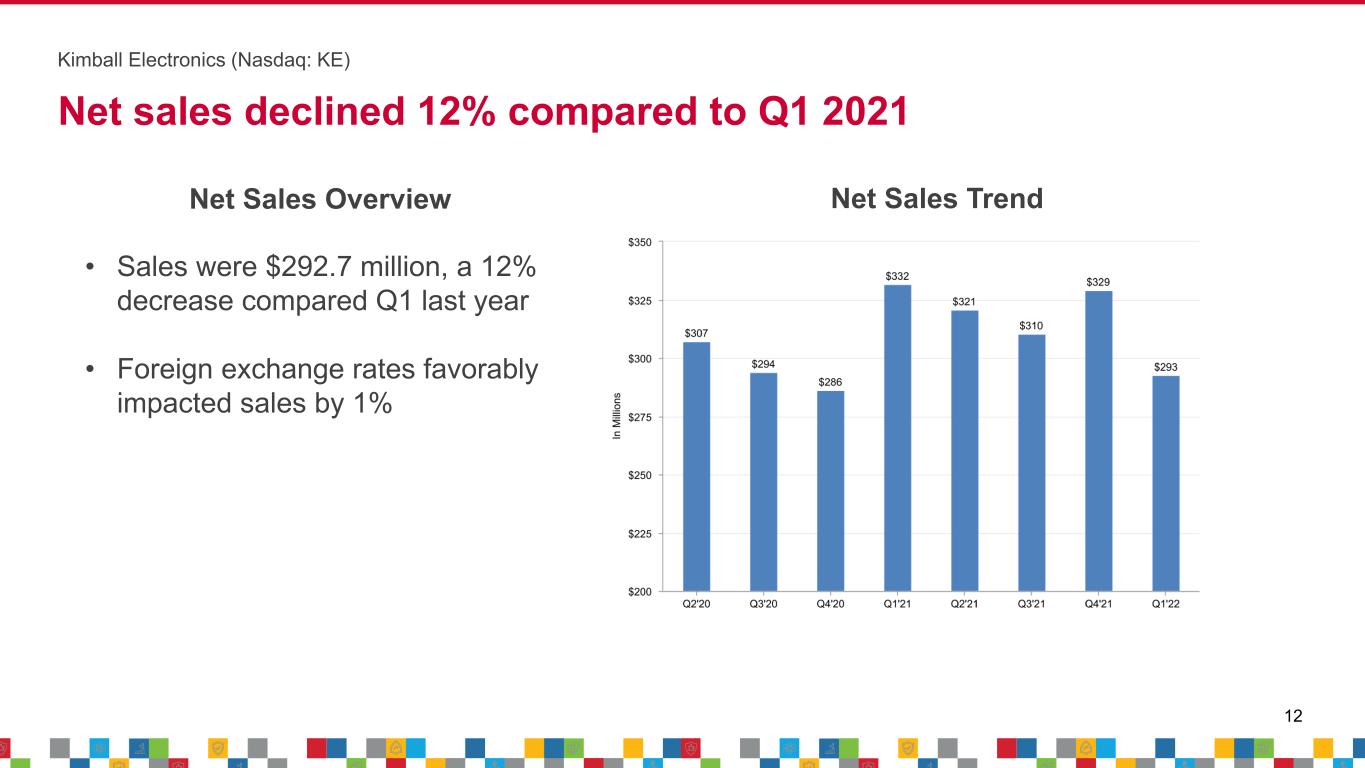
•Net sales decreased 12% compared to the first quarter of fiscal year 2021. Foreign currency had a favorable impact of 1% on net sales in the quarter compared to the same period a year ago.
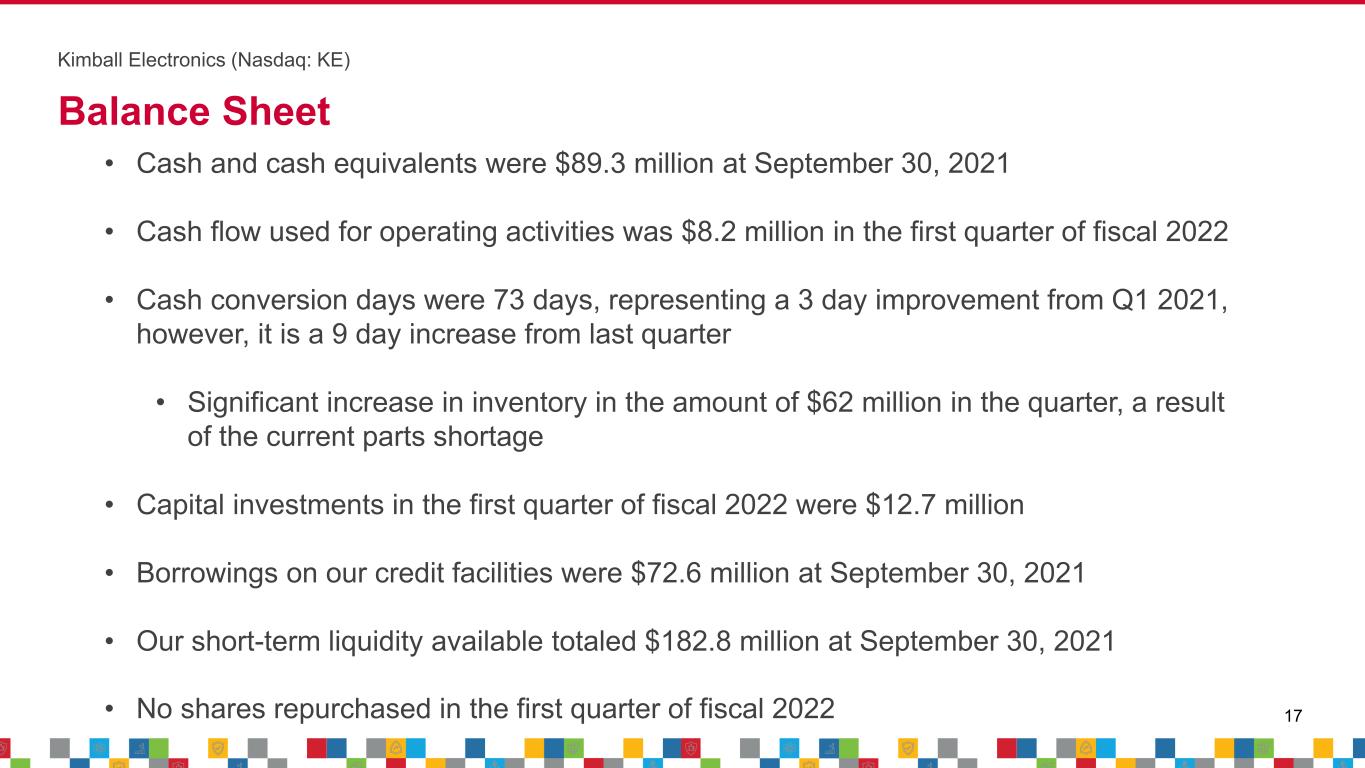
•Cash flow used for operating activities of $8.2 million during the first quarter of fiscal 2022.
•Cash conversion days (“CCD”) for the quarter ended September 30, 2021 were 73 days, down from 76 days in the first quarter of fiscal year 2021. CCD is calculated as the sum of days sales outstanding plus contract asset days plus production days supply on hand less accounts payable days.
•Investments in capital expenditures were $12.7 million during the quarter.
•Cash and cash equivalents were $89.3 million and borrowings outstanding on credit facilities were $72.6 million at September 30, 2021, including $40.0 million classified as long term.
Fiscal Year 2022 Guidance
As part of today’s announcement, the Company is reiterating its guidance for fiscal year 2022.
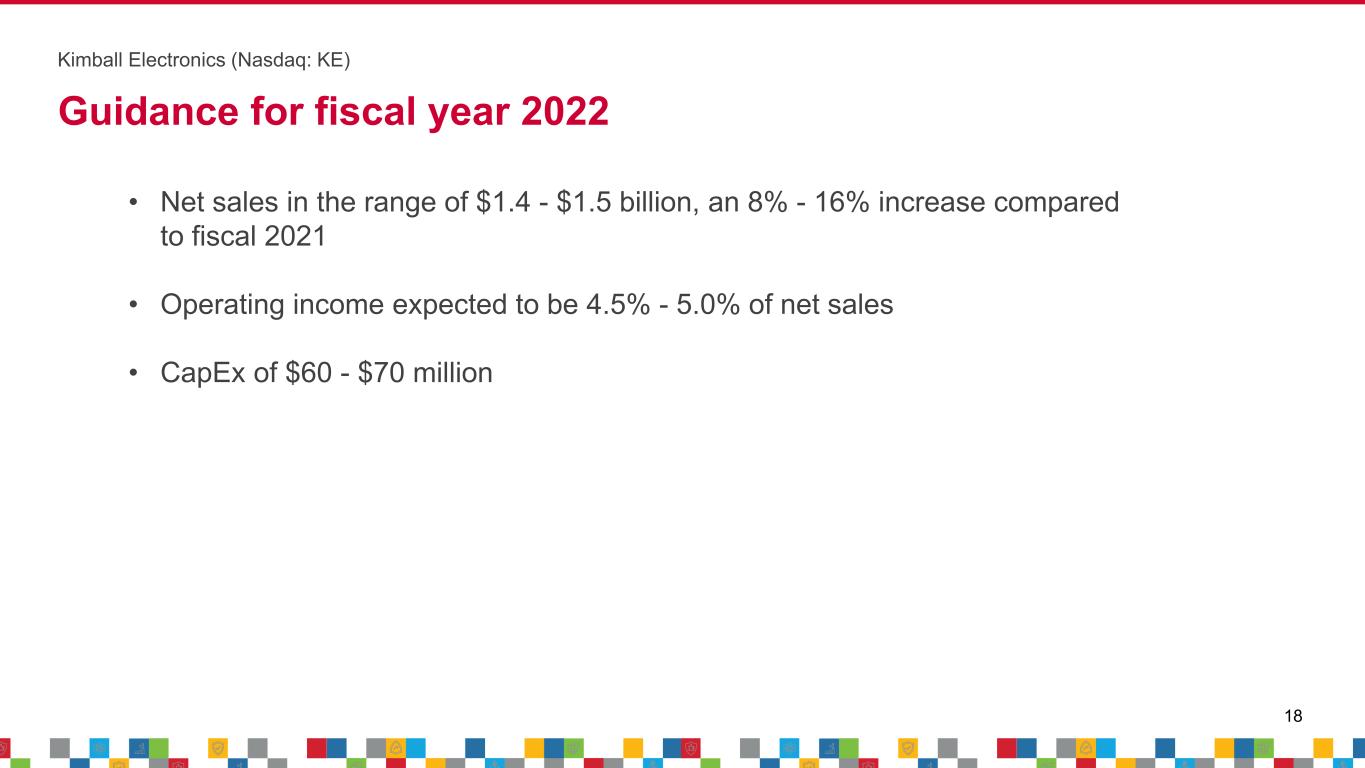
•Net sales in the range of $1.4 - $1.5 billion, an 8% to 16% increase year-over-year.
•Operating income in the range of 4.5% - 5.0% of net sales.
•Capital expenditures of $60 - $70 million in support of the expansions of the facilities in Thailand and Mexico.
Net Sales by Vertical Market for Q1 Fiscal 2022:
| | | | | | | | | | | | | | | | | | | | | | | | | | | | | | | | | | | | | | | |
| Three Months Ended | | | | | | | | | | | | |
| September 30, | | | | | | | | | | | | |
| (Amounts in Millions) | 2021 | | * | | 2020 | | * | | Percent Change | | | | | | | | | | |
| | | | | | | | | | | | | | | | | | | |
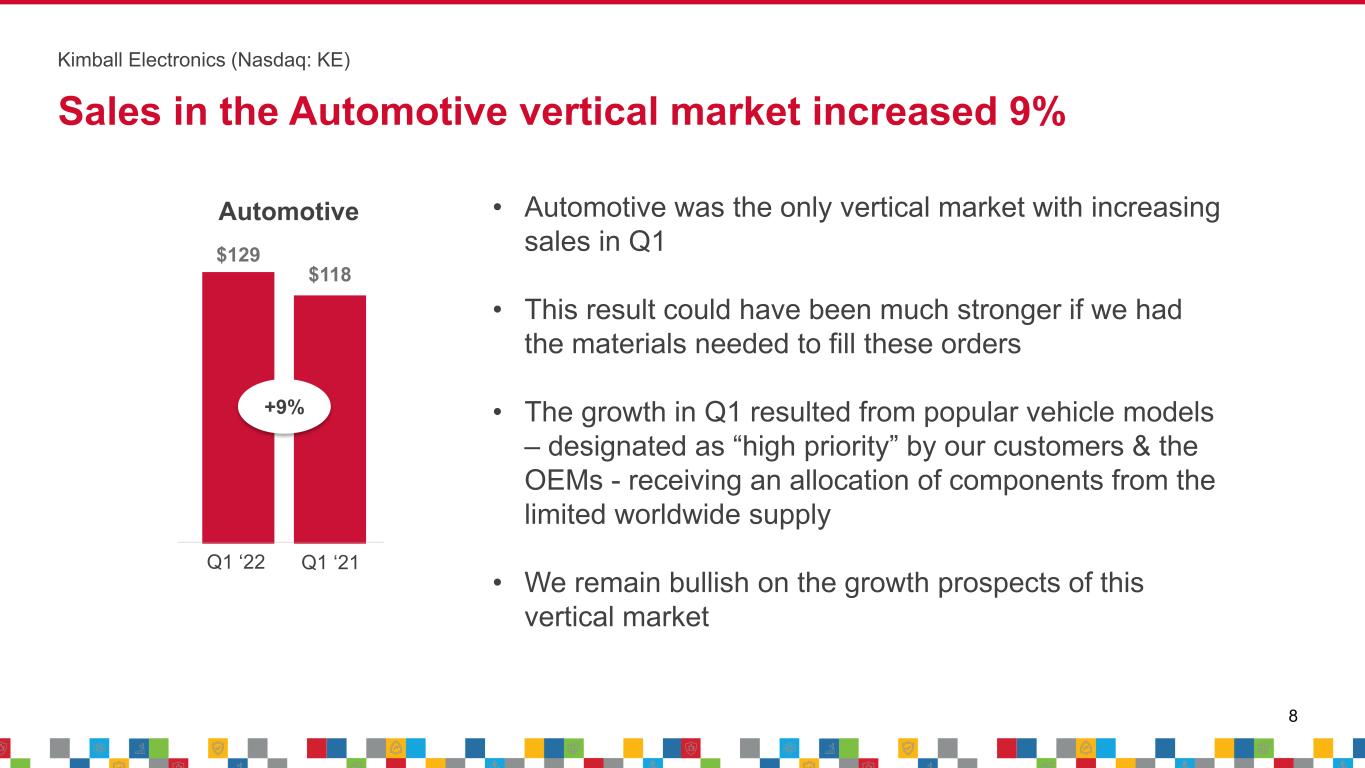
| Automotive | $ | 129.4 | | | 44 | % | | $ | 118.3 | | | 36 | % | | 9 | % | | | | | | | | | | |
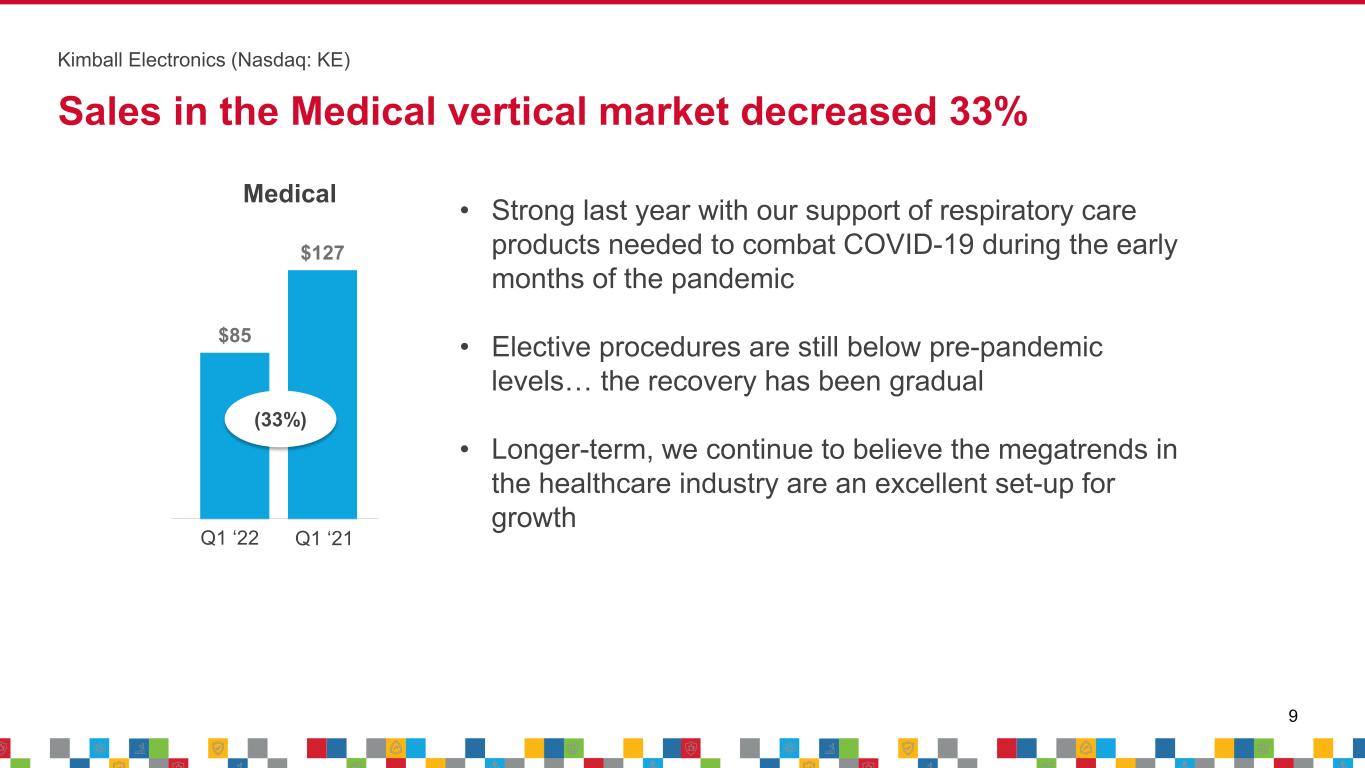
| Medical | 85.0 | | | 29 | % | | 127.1 | | | 38 | % | | (33) | % | | | | | | | | | | |
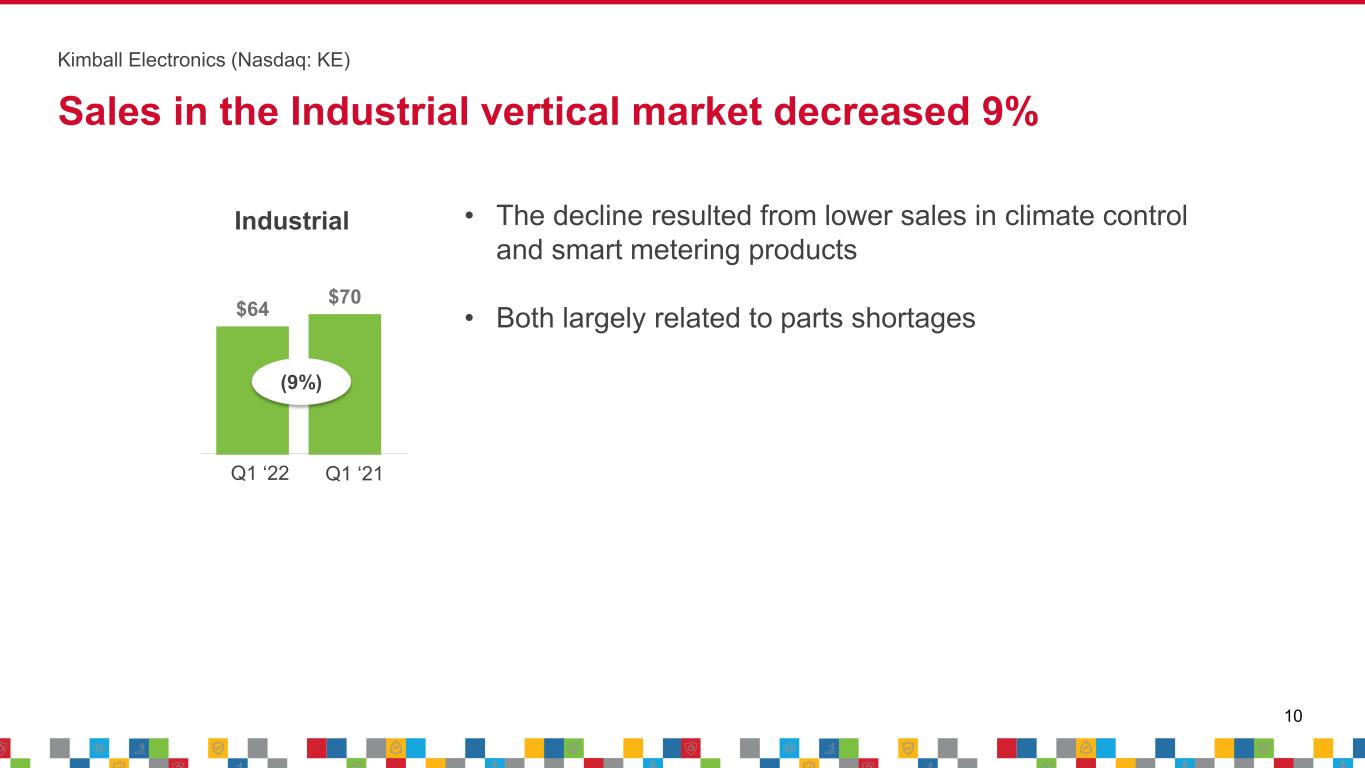
| Industrial | 63.9 | | | 22 | % | | 70.0 | | | 21 | % | | (9) | % | | | | | | | | | | |
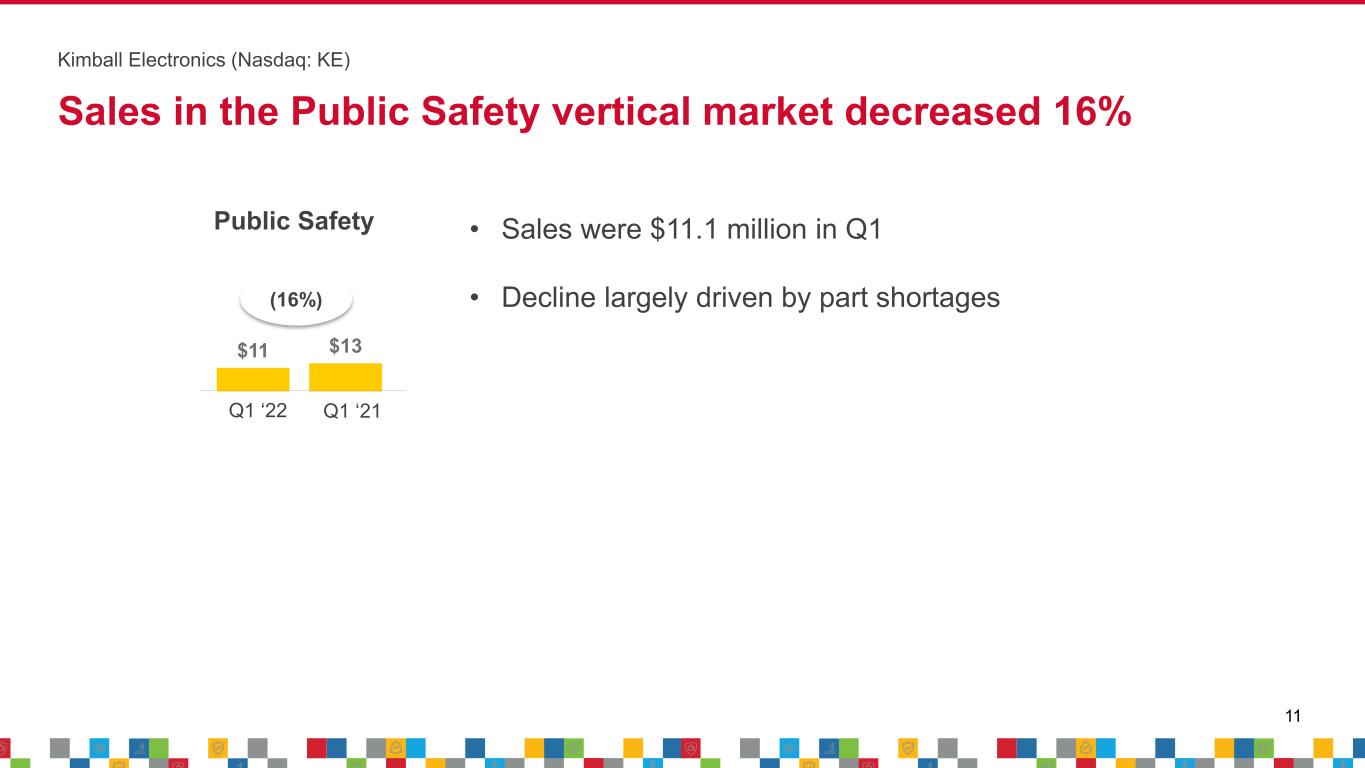
| Public Safety | 11.1 | | | 4 | % | | 13.3 | | | 4 | % | | (16) | % | | | | | | | | | | |
| Other | 3.3 | | | 1 | % | | 3.0 | | | 1 | % | | 7 | % | | | | | | | | | | |
| Total Net Sales | $ | 292.7 | | | | | $ | 331.7 | | | | | (12) | % | | | | | | | | | | |
| | | | | | | | | | |
*As a percent of Total Net Sales | | | | | | | | | | |
| | | | | | | | | | |
–Automotive includes electronic power steering, body controls, automated driver assist systems, and electronic braking systems | | | | | | | | | | |
–Medical includes sleep therapy and respiratory care, image guided therapy, in vitro diagnostics, drug delivery, AED, and patient monitoring | | | | | | | | | | |
–Industrial includes climate controls, automation controls, optical inspection, and smart metering | | | | | | | | | | |
–Public Safety includes thermal imaging, first responder electronics, and security | | | | | | | | | | |
Forward-Looking Statements
Certain statements contained within this release are considered forward-looking, including our fiscal year 2022 guidance, under the Private Securities Litigation Reform Act of 1995. The statements may be identified by the use of words such as “expect,” “should,” “goal,” “predict,” “will,” “future,” “optimistic,” “confident,” and “believe.” Undue reliance should not be placed on these forward-looking statements. These statements are based on current expectations of future events and thus are inherently subject to uncertainty. If underlying assumptions prove inaccurate or known or unknown risks or uncertainties materialize, actual results could vary materially from our expectations and projections. These forward-looking statements are subject to risks and uncertainties including, without limitation, global economic conditions, geopolitical environment, global health emergencies including the COVID-19 pandemic, availability or cost of raw materials and components, foreign exchange rate fluctuations, and our ability to convert new business opportunities into customers and revenue. Additional cautionary statements regarding other risk factors that could have an effect on the future performance of the Company are contained in its Annual Report on Form 10-K for the year ended June 30, 2021.
Non-GAAP Financial Measures
This press release contains non-GAAP financial measures. The non-GAAP financial measures contained herein include adjusted operating income, adjusted net income, adjusted diluted EPS, and ROIC. Reconciliations of the reported GAAP numbers to these non-GAAP financial measures are included in the Reconciliation of Non-GAAP Financial Measures section below. Management believes these measures are useful and allow investors to meaningfully trend, analyze, and benchmark the performance of the Company’s core operations. The Company’s non-GAAP financial measures are not necessarily comparable to non-GAAP information used by other companies.
About Kimball Electronics, Inc.
Kimball Electronics is a multifaceted manufacturing solutions provider of electronics and diversified contract manufacturing services to customers around the world. From our operations in the United States, China, India, Japan, Mexico, Poland, Romania, Thailand, and Vietnam, our teams are proud to provide manufacturing services for a variety of industries. Recognized for a reputation of excellence, we are committed to a high-performance culture that values personal and organizational commitment to quality, reliability, value, speed, and ethical behavior. Kimball Electronics, Inc. (Nasdaq: KE) is headquartered in Jasper, Indiana.
To learn more about Kimball Electronics, visit: www.kimballelectronics.com.
| | | | | | | | |
| Conference Call / Webcast |
| | |
| Date: | | November 4, 2021 |
| Time: | | 10:00 AM Eastern Time |
| Live Webcast: | | investors.kimballelectronics.com/events-and-presentations/events |
| Dial-In #: | | 877-248-9893 (International Calls - 873-415-0287) |
| Conference ID: | | 8062466 |
For those unable to participate in the live webcast, the call will be archived at investors.kimballelectronics.com.
Lasting relationships. Global success.
Financial highlights for the first quarter ended September 30, 2021 are as follows:
| | | | | | | | | | | | | | | | | | | | | | | |
| Condensed Consolidated Statements of Income | | | | | | |
| (Unaudited) | Three Months Ended |
| (Amounts in Thousands, except Per Share Data) | September 30, 2021 | | September 30, 2020 |
| Net Sales | $ | 292,717 | | | 100.0 | % | | $ | 331,749 | | | 100.0 | % |
| Cost of Sales | 277,117 | | | 94.7 | % | | 301,166 | | | 90.8 | % |
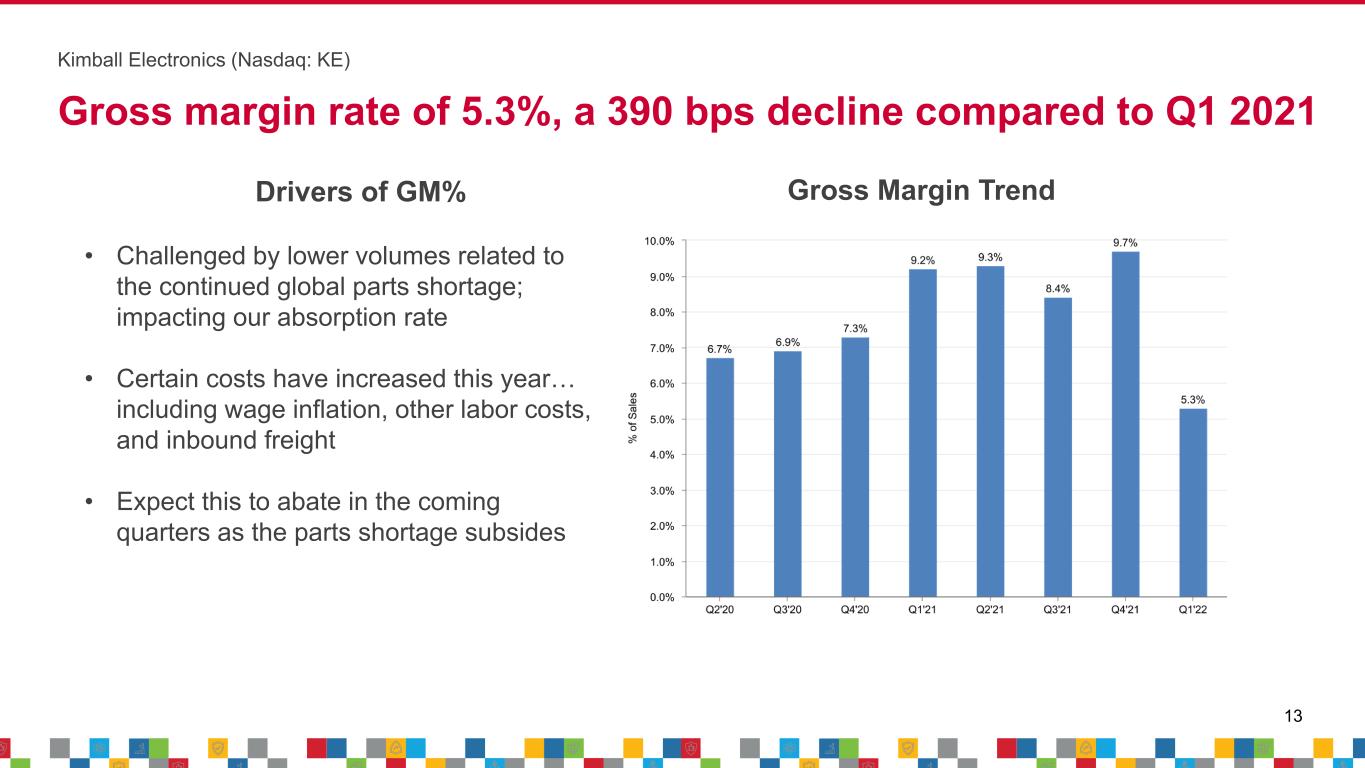
| Gross Profit | 15,600 | | | 5.3 | % | | 30,583 | | | 9.2 | % |
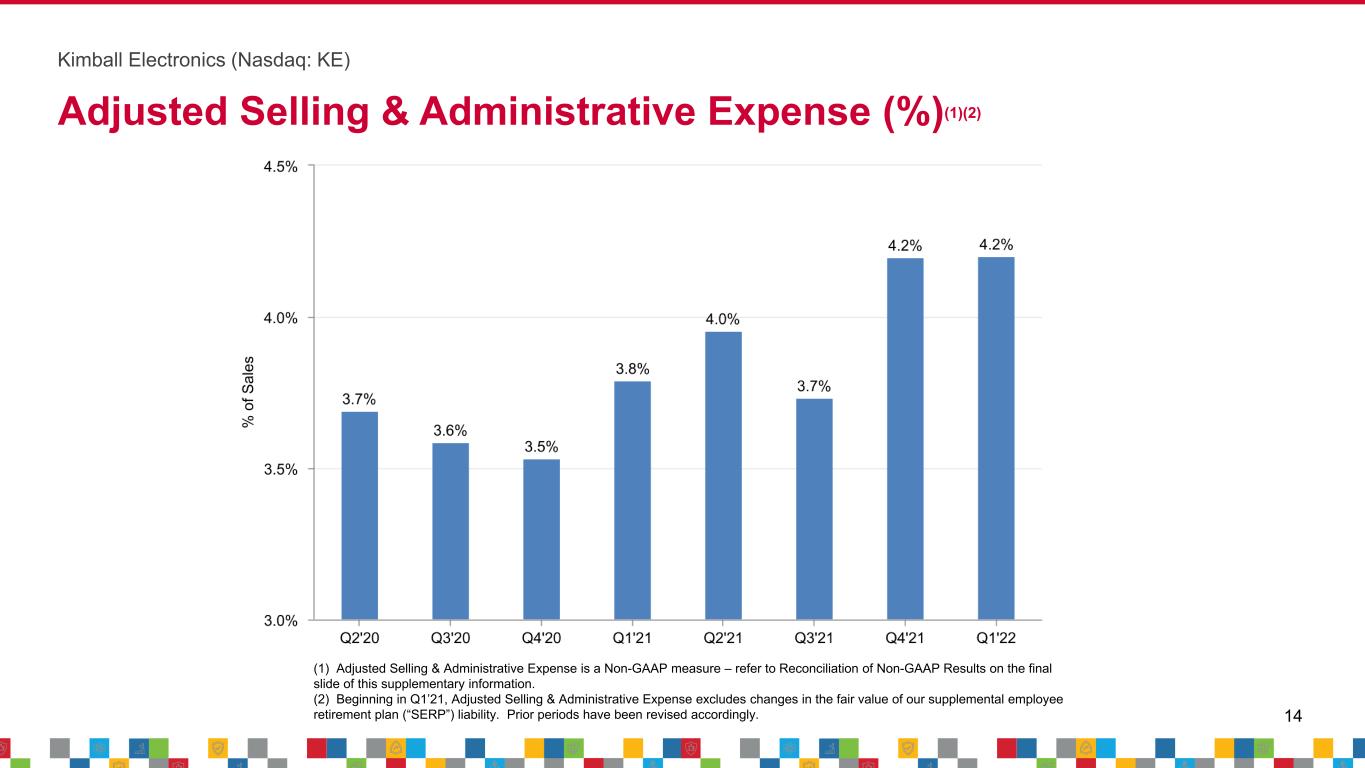
| Selling and Administrative Expenses | 12,204 | | | 4.2 | % | | 13,117 | | | 3.9 | % |
| Other General Expense (Income) | (1,384) | | | (0.5) | % | | (341) | | | (0.1) | % |
| | | | | | | |
| | | | | | | |
| Operating Income | 4,780 | | | 1.6 | % | | 17,807 | | | 5.4 | % |
| Other Income (Expense), net | (1,249) | | | (0.4) | % | | 2,135 | | | 0.6 | % |
| Income Before Taxes on Income | 3,531 | | | 1.2 | % | | 19,942 | | | 6.0 | % |
| Provision for Income Taxes | 967 | | | 0.3 | % | | 3,131 | | | 0.9 | % |
| Net Income | $ | 2,564 | | | 0.9 | % | | $ | 16,811 | | | 5.1 | % |
| | | | | | | |
| Earnings Per Share of Common Stock: | | | | | | | |
| Basic | $ | 0.10 | | | | | $ | 0.67 | | | |
| Diluted | $ | 0.10 | | | | | $ | 0.66 | | | |
| | | | | | | |
| Average Number of Shares Outstanding: | | | | | | | |
| Basic | 25,145 | | | | | 25,153 | | | |
| Diluted | 25,301 | | | | | 25,270 | | | |
| | | | | | | |
|
| | | | | | | | | | | |
| Condensed Consolidated Statements of Cash Flows | Three Months Ended |
| (Unaudited) | September 30, |
| (Amounts in Thousands) | 2021 | | 2020 |
| Net Cash Flow (used for) provided by Operating Activities | $ | (8,187) | | | $ | 20,701 | |
| Net Cash Flow used for Investing Activities | (12,868) | | | (8,322) | |
| Net Cash Flow provided by (used for) Financing Activities | 4,965 | | | (5,787) | |
| Effect of Exchange Rate Change on Cash and Cash Equivalents | (1,028) | | | 1,793 | |
| Net (Decrease) Increase in Cash and Cash Equivalents | (17,118) | | | 8,385 | |
| Cash and Cash Equivalents at Beginning of Period | 106,442 | | | 64,990 | |
| Cash and Cash Equivalents at End of Period | $ | 89,324 | | | $ | 73,375 | |
| | | | | | | | | | | |
| (Unaudited) | | |
| Condensed Consolidated Balance Sheets | September 30,
2021 | | June 30,
2021 |
| (Amounts in Thousands) |
| ASSETS | | | |
| Cash and cash equivalents | $ | 89,324 | | | $ | 106,442 | |
| Receivables, net | 176,881 | | | 203,382 | |
| Contract assets | 46,080 | | | 45,863 | |
| Inventories | 262,125 | | | 200,386 | |
| Prepaid expenses and other current assets | 27,773 | | | 27,320 | |
| | | |
| Property and Equipment, net | 166,085 | | | 163,251 | |
| Goodwill | 12,011 | | | 12,011 | |
| Other Intangible Assets, net | 16,606 | | | 17,008 | |
| Other Assets | 41,381 | | | 38,398 | |
| Total Assets | $ | 838,266 | | | $ | 814,061 | |
| | | |
LIABILITIES AND SHARE OWNERS’ EQUITY | | | |
| | | |
| | | |
| Current portion of borrowings under credit facilities | $ | 32,636 | | | $ | 26,214 | |
| Accounts payable | 247,175 | | | 216,544 | |
| | | |
| Accrued expenses | 46,772 | | | 58,016 | |
| Long-term debt under credit facilities, less current portion | 40,000 | | | 40,000 | |
| Long-term income taxes payable | 7,812 | | | 8,854 | |
| Other | 24,057 | | | 22,461 | |
| Share Owners’ Equity | 439,814 | | | 441,972 | |
| Total Liabilities and Share Owners’ Equity | $ | 838,266 | | | $ | 814,061 | |
| | | | | | | | | | | | | | | | | | | |
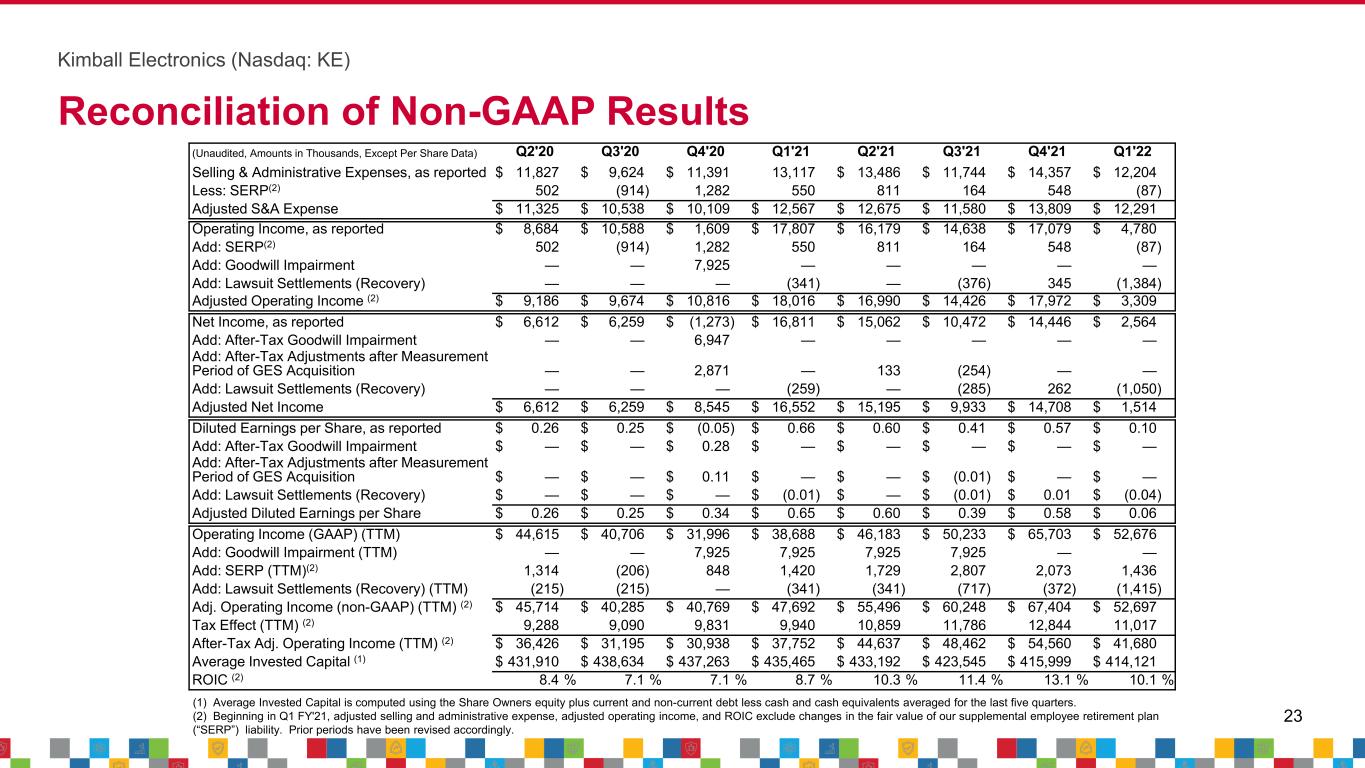
| Reconciliation of Non-GAAP Financial Measures | | | | | | | | | | |
| (Unaudited) | | | | | | | | | | | |
| (Amounts in Thousands, except Per Share Data) | | | | | | | | | | | |
| | | | | | | | | | | |
|
| Three Months Ended | | | | |
| September 30, | | | | |
| 2021 | | 2020 | | | | | | | | |
| Operating Income, as reported | $ | 4,780 | | | $ | 17,807 | | | | | | | | | |
| | | | | | | | | | | |
| | | | | | | | | | | |
| SERP | (87) | | | 550 | | | | | | | | | |
| Legal Recovery | (1,384) | | | (341) | | | | | | | | | |
| | | | | | | | | | | |
| Adjusted Operating Income | $ | 3,309 | | | $ | 18,016 | | | | | | | | | |
| | | | | | | | | | | |
| | | | | | | | | | | |
|
| | | | | |
| | | | | |
| | | | | | | | | | | |
| Net Income, as reported | $ | 2,564 | | | $ | 16,811 | | | | | | | | | |
| | | | | | | | | | | |
| | | | | | | | | | | |
| | | | | | | | | | | |
| | | | | | | | | | | |
| Legal Recovery, After-Tax | (1,050) | | | (259) | | | | | | | | | |
| | | | | | | | | | | |
| | | | | | | | | | | |
| Adjusted Net Income | $ | 1,514 | | | $ | 16,552 | | | | | | | | | |
| | | | | | | | | | | |
| | | | | | | | |
| | | | | | | | | | | |
|
| | | | | |
| | | | | |
| | | | | | | | | | | |
| Diluted Earnings per Share, as reported | $ | 0.10 | | | $ | 0.66 | | | | | | | | | |
| | | | | | | | | | | |
| | | | | | | | | | | |
| | | | | | | | | | | |
| | | | | | | | | | | |
| Legal Recovery | (0.04) | | | (0.01) | | | | | | | | | |
| | | | | | | | | | | |
| | | | | | | | | | | |
| Adjusted Diluted Earnings per Share | $ | 0.06 | | | $ | 0.65 | | | | | | | | | |
| | | | | | | | | | | |
| Twelve Months Ended | | | | | | | | |
| September 30, | | | | | | | | |
| 2021 | | 2020 | | | | | | | | |
| Operating Income | $ | 52,676 | | | $ | 38,688 | | | | | | | | | |
| Goodwill Impairment | — | | | 7,925 | | | | | | | | | |
| SERP | 1,436 | | | 1,420 | | | | | | | | | |
| Legal Recovery | (1,415) | | | (341) | | | | | | | | | |
| Adjusted Operating Income (non-GAAP) | $ | 52,697 | | | $ | 47,692 | | | | | | | | | |
| Tax Effect | 11,017 | | | 9,940 | | | | | | | | | |
| After-tax Adjusted Operating Income | $ | 41,680 | | | $ | 37,752 | | | | | | | | | |
Average Invested Capital (1) | $ | 414,121 | | | $ | 435,465 | | | | | | | | | |
| ROIC | 10.1 | % | | 8.7 | % | | | | | | | | |
(1) Average invested capital is computed using Share Owners’ equity plus current and non-current debt less cash and cash equivalents averaged for the last five quarters.