Exhibit 99.1
Financial Contact: Sarah Cook Knowles Investor Relations Email: [email protected] | |||||
Knowles Reports Q2 2026 Financial Results and Provides Outlook for Q3 2026
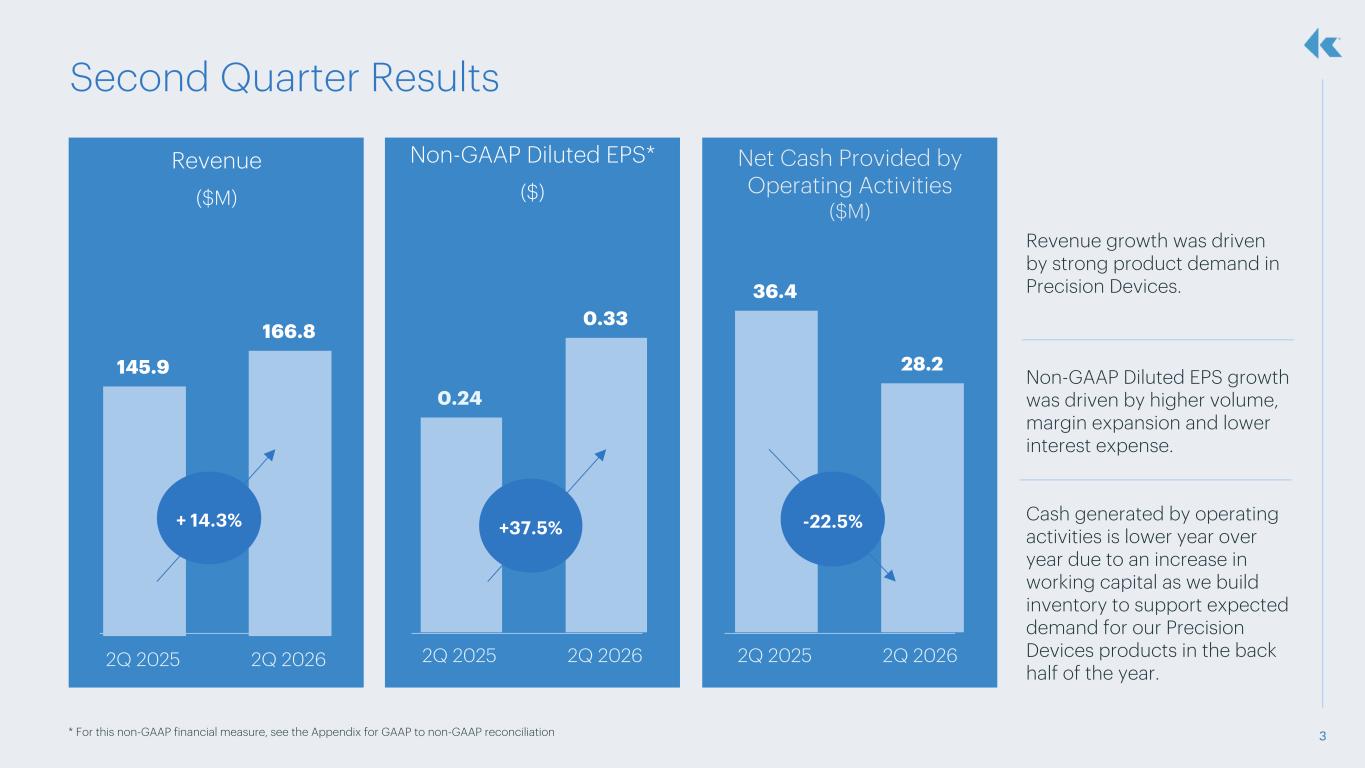
Q2 Revenues Increased 14% on a Year over Year Basis to $167 million
Q2 Diluted EPS from Continuing Operations increased $0.12 on a Year over Year Basis to $0.21
Q2 Non-GAAP Diluted EPS from Continuing Operations Increased 38% on a Year over Year Basis to $0.33
Q2 Net Cash from Operations was $28 million
ITASCA, Ill., July 23, 2026 - Knowles Corporation (NYSE: KN), a leading manufacturer of specialty electronic components, including high performance capacitors, radio frequency ("RF") filters, advanced medtech microphones, and balanced armature speakers, today announced results for the quarter ended June 30, 2026.
“We delivered second quarter revenues exceeding the high end of our guided range. Non-GAAP diluted EPS was above the high end of our guided range and cash from operations was within the guided range,” commented Jeffrey Niew, President and CEO of Knowles.
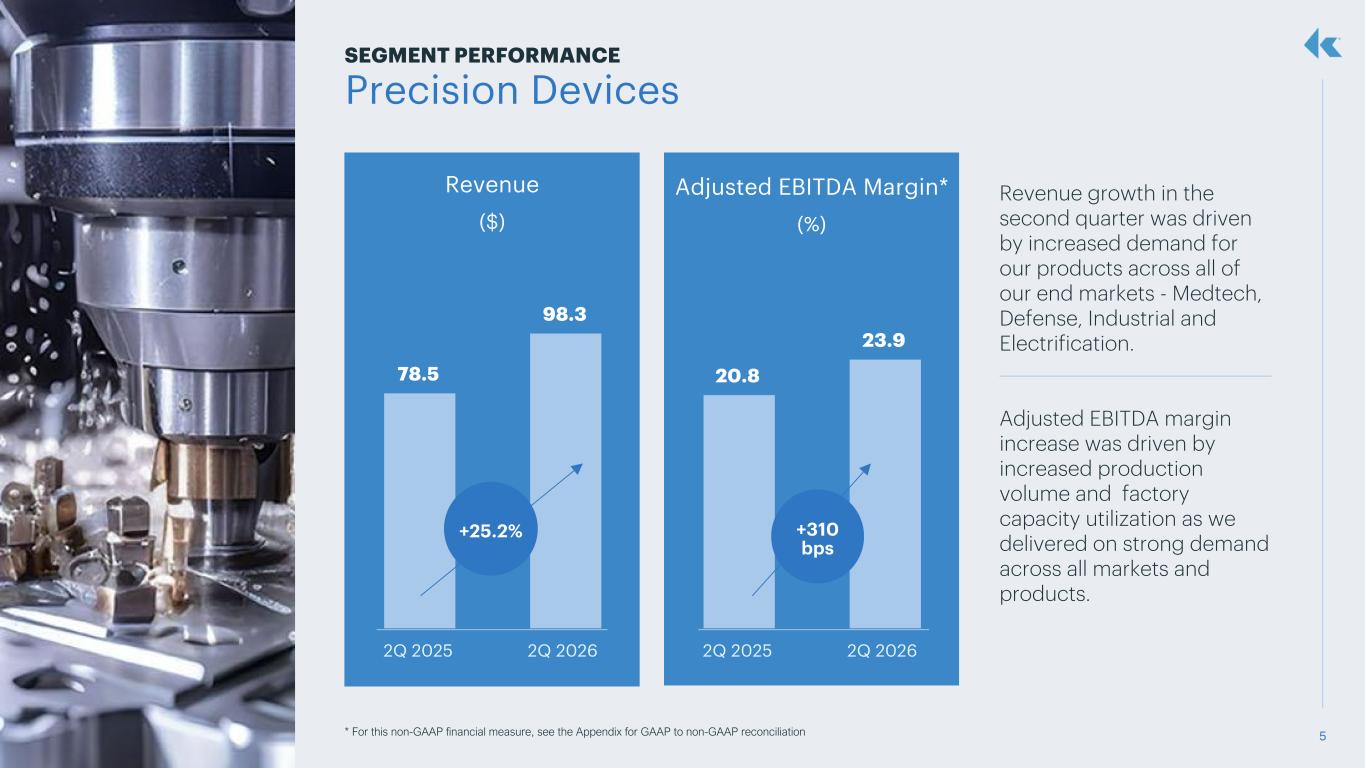
Mr. Niew continued, “I am very pleased with the Company's performance in the first half of 2026. Within the Precision Devices segment, we saw year over year revenue growth across all our end markets: Medtech, Defense, Industrial, and Electrification, as we execute our strategy of leveraging our unique technologies, creating custom products through our customer application intimacy, and then scaling into production with our world-class operational capabilities. Our total company revenue grew 14% on a year over year basis in the second quarter and this was our seventh consecutive quarter where the book to bill was greater than one.”
“With our bookings increasing every quarter over the past twelve months, numerous new design wins ramping across multiple end markets, and a very healthy backlog of existing orders, we now expect 2026 revenues will grow at a rate of 10-12% with adjusted EBITDA growth of more than 20%,” stated Mr. Niew.
Continuing, Mr. Niew said, “Looking ahead to 2027, given the magnitude of our bookings coupled with strong long-term secular growth trends in the markets we participate in, I expect we will exceed the organic growth targets we presented at our May 2025 Investor Day. I am excited about the growth opportunities that lie ahead and am confident in our ability to continue to drive long-term value for our shareholders.”
Financial Highlights
The following table highlights the Company’s financial performance on both a GAAP and supplemental non-GAAP basis for continuing operations* with the exception of Net cash provided by operating activities (in millions, except per share data):
| Q2-26 | Q1-26 | Q2-25 | |||||||||
| Revenues | $166.8 | $153.1 | $145.9 | ||||||||
| Gross profit | $74.6 | $67.1 | $60.6 | ||||||||
| (as a % of revenues) | 44.7% | 43.8% | 41.5% | ||||||||
| Non-GAAP gross profit | $75.7 | $69.7 | $64.5 | ||||||||
| (as a % of revenues) | 45.4% | 45.5% | 44.2% | ||||||||
| Diluted earnings per share** | $0.21 | $0.13 | $0.09 | ||||||||
| Non-GAAP diluted earnings per share | $0.33 | $0.27 | $0.24 | ||||||||
| Net cash provided by (used in) operating activities | $28.2 | $(0.7) | $36.4 | ||||||||
* Continuing operations excludes the results of the Consumer MEMS Microphones reporting business, which was divested in December 2024.
** Current period results include $0.06 per share in stock-based compensation expense, $0.04 per share in intangibles amortization expense, $0.01 per share in production transfer costs, and $0.01 per share for other adjustments.
1
Third Quarter 2026 Outlook
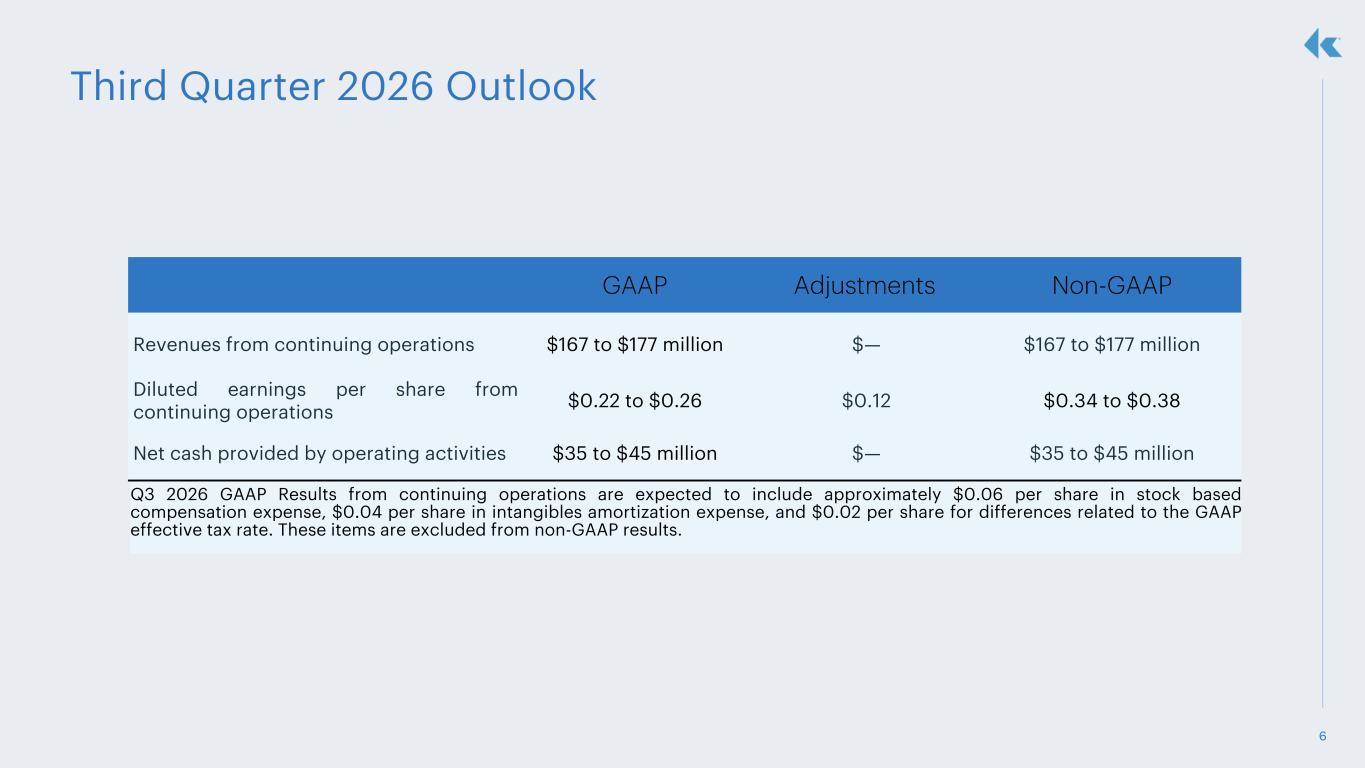
The forward looking guidance for the quarter ending September 30, 2026 on a continuing operations basis, with the exception of Net cash provided by operating activities, is as follows:
| GAAP | Adjustments | Non-GAAP | |||||||||
| Revenues from continuing operations | $167 to $177 million | — | $167 to $177 million | ||||||||
| Diluted earnings per share from continuing operations | $0.22 to $0.26 | $0.12 | $0.34 to $0.38 | ||||||||
| Net cash provided by operating activities | $35 to $45 million | — | $35 to $45 million | ||||||||
Q3 2026 GAAP results from continuing operations are expected to include approximately $0.06 per share in stock-based compensation expense, $0.04 per share in intangibles amortization expense, and $0.02 per share for differences related to the GAAP effective tax rate. These items are excluded from non-GAAP results.
Non-GAAP Financial Measures
In addition to the GAAP results included in this press release, Knowles has presented supplemental non-GAAP gross profit, earnings before interest and income taxes, adjusted earnings before interest and income taxes, earnings before interest, income taxes, depreciation, and amortization, adjusted earnings before interest, income taxes, depreciation, and amortization, non-GAAP diluted earnings per share, free cash flow, as well as other metrics on a non-GAAP basis that exclude certain amounts that are included in the most directly comparable GAAP measure to facilitate evaluation of Knowles’ operating performance. Non-GAAP results are not presented in accordance with GAAP. Non-GAAP information should be considered a supplement to, and not a substitute for, financial statements prepared in accordance with GAAP. In addition, the non-GAAP financial measures included in this press release do not have standard meanings and may vary from similarly titled non-GAAP financial measures used by other companies. Knowles believes that non-GAAP measures are useful as supplements to its GAAP results of operations to evaluate certain aspects of its operations and financial performance, and its management team primarily focuses on non-GAAP items in evaluating Knowles’ performance for business planning purposes. Knowles also believes that these measures assist it with comparing its performance between various reporting periods on a consistent basis, as these measures remove from operating results the impact of items that, in Knowles’ opinion, do not reflect its core operating performance including, for example, stock-based compensation, certain intangibles amortization expense, impairment charges, restructuring, production transfer costs, and other charges which management considers to be outside our core operating results. Knowles believes that its presentation of these non-GAAP financial measures is useful because it provides investors and securities analysts with the same information that Knowles uses internally for purposes of assessing its core operating performance. For a reconciliation of these non-GAAP financial measures to the most directly comparable GAAP financial measures, see the reconciliation table accompanying this release.
Webcast and Conference Call Information
Investors can listen to a live or replay webcast of the Company’s quarterly financial conference call at http://investor.knowles.com. The live webcast will begin today at 3:30 p.m. Central time. The webcast replay will be available after 7:00 p.m. Central time today accessible via the Knowles website at http://investor.knowles.com for a limited time.
About Knowles
Knowles is a leading manufacturer of specialty electronic components. We design parts that perform unique, critical functions for innovative technologies. Through extreme reliability, custom engineering, and scalable manufacturing, we enable businesses to succeed in the most demanding applications across medtech, defense, and industrial markets.
Our high-performance capacitors, RF microwave filters, advanced medtech microphones, balanced armature speakers, and miniaturization products enable and enhance the performance of technologies with the power to change, improve, and save lives. Founded in 1946 and headquartered in Itasca, Illinois, Knowles has grown into a global organization with employees spanning 11 countries.
For more information, please visit knowles.com.
2
Forward-Looking Statements
This news release contains forward-looking statements within the meaning of the safe harbor provisions of the United States Private Securities Litigation Reform Act of 1995, such as statements about our future plans, objectives, expectations, financial performance, and continued business operations. The words "believe," "expect," "anticipate," "project," "estimate," "budget," "continue," "could," "intend," "may," "plan," "potential," "predict," "seek," "should," "will," "would," "objective," "forecast," "goal," "guidance," "outlook," "effort," "target," and similar expressions, among others, generally identify forward-looking statements, which speak only as of the date the statements were made. The statements in this presentation are based on currently available information and the current expectations, forecasts, and assumptions of Knowles’ management concerning risks and uncertainties that could cause actual outcomes or results to differ materially from those outcomes or results that are projected, anticipated, or implied in these statements. Other risks and uncertainties include, but are not limited to: fluctuations in our stock's market price; fluctuations in operating results and cash flows; our ability to prevent or identify quality issues in our products or to promptly remedy any such issues that are identified; risks associated with increasing our inventories in advance of anticipated orders by customers; escalating international trade tensions, new or increased tariffs and trade wars among countries; the impact of changes to laws and regulations that affect the Company’s ability to offer products or services to customers in different regions; our ability to achieve reductions in our operating expenses; the ability to qualify our products and facilities with customers; our ability to obtain, enforce, defend or monetize our intellectual property rights; disruption caused by a cybersecurity incident, including a cyber-attack, cyber breach, theft, or other unauthorized access (the risk of which could be exacerbated by geopolitical tensions); increases in the costs of critical raw materials and components; availability of raw materials and components; managing new product ramps and introductions for our customers; our dependence on a limited number of large customers; our ability to maintain and expand our existing relationships with leading OEMs in order to maintain and increase our revenue; increasing competition and new entrants in the market for our products; our ability to develop new or enhanced products or technologies in a timely manner that achieve market acceptance; global economic instability, including due to inflation, rising interest rates, or the impacts of geopolitical uncertainties (including the impact of the conflict with Iran); financial risks, including risks relating to currency fluctuations, credit risks and fluctuations in the market value of the Company; a sustained decline in our stock price and market capitalization may result in the impairment of certain intangible or long-lived assets; market risk associated with fluctuations in commodity prices, particularly for various precious metals used in our manufacturing operation, changes in tax laws, changes in tax rates and exposure to additional tax liabilities; and other risks, relevant factors, and uncertainties identified in our Annual Report on Form 10-K for the fiscal year ended December 31, 2025, subsequent Reports on Forms 10-Q and 8-K and our other filings we make with the U.S. Securities and Exchange Commission. Knowles disclaims any intention or obligation to update or revise any forward-looking statements, whether as a result of new information, future events or otherwise, except as required by law.
3
INVESTOR SUPPLEMENT - SECOND QUARTER 2026
KNOWLES CORPORATION
CONSOLIDATED STATEMENTS OF EARNINGS
(in millions, except per share amounts)
(unaudited)
| Quarter Ended | |||||||||||||||||
| June 30, 2026 | March 31, 2026 | June 30, 2025 | |||||||||||||||
| Revenues | $ | 166.8 | $ | 153.1 | $ | 145.9 | |||||||||||
| Cost of goods sold | 92.1 | 85.9 | 81.7 | ||||||||||||||
| Impairment charges | — | — | 3.6 | ||||||||||||||
| Restructuring charges - cost of goods sold | 0.1 | 0.1 | — | ||||||||||||||
| Gross profit | 74.6 | 67.1 | 60.6 | ||||||||||||||
| Research and development expenses | 10.6 | 11.7 | 10.0 | ||||||||||||||
| Selling and administrative expenses | 39.2 | 39.4 | 35.9 | ||||||||||||||
| Restructuring charges | 0.1 | 0.1 | — | ||||||||||||||
| Operating expenses | 49.9 | 51.2 | 45.9 | ||||||||||||||
| Operating earnings | 24.7 | 15.9 | 14.7 | ||||||||||||||
| Interest expense, net | 1.7 | 1.5 | 2.5 | ||||||||||||||
| Other expense, net | 0.4 | 3.4 | 0.9 | ||||||||||||||
| Earnings before income taxes and discontinued operations | 22.6 | 11.0 | 11.3 | ||||||||||||||
| Provision for (benefit from) income taxes | 4.2 | (0.3) | 3.5 | ||||||||||||||
| Earnings from continuing operations | 18.4 | 11.3 | 7.8 | ||||||||||||||
| Earnings (loss) from discontinued operations, net | 1.0 | (1.6) | — | ||||||||||||||
| Net earnings | $ | 19.4 | $ | 9.7 | $ | 7.8 | |||||||||||
| Earnings per share from continuing operations: | |||||||||||||||||
| Basic | $ | 0.21 | $ | 0.13 | $ | 0.09 | |||||||||||
| Diluted | $ | 0.21 | $ | 0.13 | $ | 0.09 | |||||||||||
| Earnings (loss) per share from discontinued operations: | |||||||||||||||||
| Basic | $ | 0.02 | $ | (0.02) | $ | — | |||||||||||
| Diluted | $ | 0.01 | $ | (0.02) | $ | — | |||||||||||
| Net earnings per share: | |||||||||||||||||
| Basic | $ | 0.23 | $ | 0.11 | $ | 0.09 | |||||||||||
| Diluted | $ | 0.22 | $ | 0.11 | $ | 0.09 | |||||||||||
| Weighted-average common shares outstanding: | |||||||||||||||||
| Basic | 85.7 | 85.4 | 86.9 | ||||||||||||||
| Diluted | 87.9 | 87.7 | 87.6 | ||||||||||||||
4
KNOWLES CORPORATION
CONSOLIDATED STATEMENTS OF EARNINGS
(in millions, except per share amounts)
(unaudited)
| Six Months Ended | |||||||||||
| June 30, 2026 | June 30, 2025 | ||||||||||
| Revenues | $ | 319.9 | $ | 278.1 | |||||||
| Cost of goods sold | 178.0 | 160.1 | |||||||||
| Impairment charges | — | 3.6 | |||||||||
| Restructuring charges - cost of goods sold | 0.2 | 0.5 | |||||||||
| Gross profit | 141.7 | 113.9 | |||||||||
| Research and development expenses | 22.3 | 19.7 | |||||||||
| Selling and administrative expenses | 78.6 | 73.1 | |||||||||
| Restructuring charges | 0.2 | 2.4 | |||||||||
| Operating expenses | 101.1 | 95.2 | |||||||||
| Operating earnings | 40.6 | 18.7 | |||||||||
| Interest expense, net | 3.2 | 5.2 | |||||||||
| Other expense, net | 3.8 | 1.4 | |||||||||
| Earnings before income taxes and discontinued operations | 33.6 | 12.1 | |||||||||
| Provision for income taxes | 3.9 | 4.7 | |||||||||
| Earnings from continuing operations | 29.7 | 7.4 | |||||||||
| Loss from discontinued operations, net | (0.6) | (1.6) | |||||||||
| Net earnings | $ | 29.1 | $ | 5.8 | |||||||
| Earnings per share from continuing operations: | |||||||||||
| Basic | $ | 0.35 | $ | 0.08 | |||||||
| Diluted | $ | 0.34 | $ | 0.08 | |||||||
| Loss per share from discontinued operations: | |||||||||||
| Basic | $ | (0.01) | $ | (0.01) | |||||||
| Diluted | $ | (0.01) | $ | (0.01) | |||||||
| Net earnings per share: | |||||||||||
| Basic | $ | 0.34 | $ | 0.07 | |||||||
| Diluted | $ | 0.33 | $ | 0.07 | |||||||
| Weighted-average common shares outstanding: | |||||||||||
| Basic | 85.6 | 87.3 | |||||||||
| Diluted | 87.9 | 88.3 | |||||||||
5
KNOWLES CORPORATION
RECONCILIATION OF GAAP FINANCIAL MEASURES TO NON-GAAP FINANCIAL MEASURES (1)
(in millions, except per share amounts)
(unaudited)
| Quarter Ended | Six Months Ended | ||||||||||||||||||||||||||||
| June 30, 2026 | March 31, 2026 | June 30, 2025 | June 30, 2026 | June 30, 2025 | |||||||||||||||||||||||||
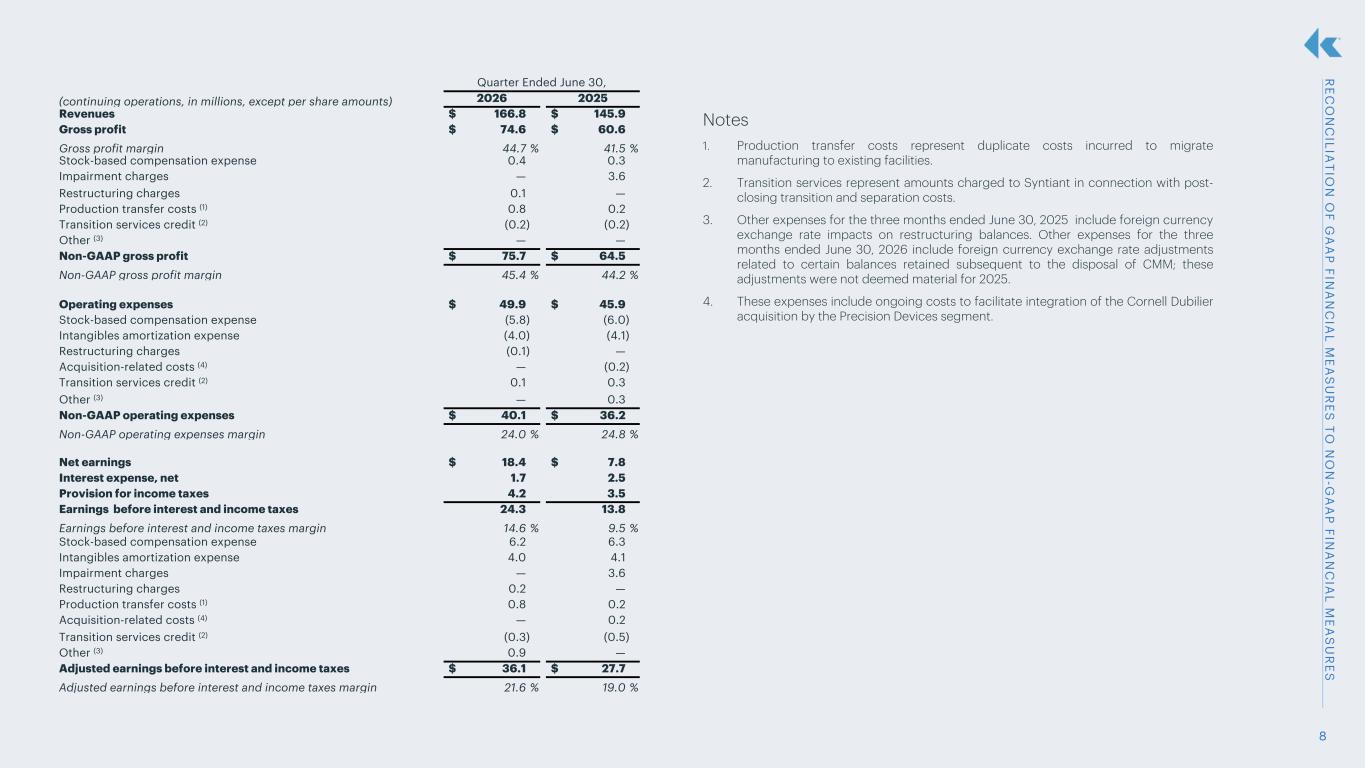
| Gross profit | $ | 74.6 | $ | 67.1 | $ | 60.6 | $ | 141.7 | $ | 113.9 | |||||||||||||||||||
| Gross profit as % of revenues | 44.7 | % | 43.8 | % | 41.5 | % | 44.3 | % | 41.0 | % | |||||||||||||||||||
| Stock-based compensation expense | 0.4 | 0.5 | 0.3 | 0.9 | 0.8 | ||||||||||||||||||||||||
| Impairment charges | — | — | 3.6 | — | 3.6 | ||||||||||||||||||||||||
| Restructuring charges | 0.1 | 0.1 | — | 0.2 | 0.5 | ||||||||||||||||||||||||
Production transfer costs (2) | 0.8 | 0.9 | 0.2 | 1.7 | 0.3 | ||||||||||||||||||||||||
Transition services credit (3) | (0.2) | (0.3) | (0.2) | (0.5) | (0.4) | ||||||||||||||||||||||||
Other (4) | — | 1.4 | — | 1.4 | 0.8 | ||||||||||||||||||||||||
| Non-GAAP gross profit | $ | 75.7 | $ | 69.7 | $ | 64.5 | $ | 145.4 | $ | 119.5 | |||||||||||||||||||
| Non-GAAP gross profit as % of revenues | 45.4 | % | 45.5 | % | 44.2 | % | 45.5 | % | 43.0 | % | |||||||||||||||||||
| Research and development expenses | $ | 10.6 | $ | 11.7 | $ | 10.0 | $ | 22.3 | $ | 19.7 | |||||||||||||||||||
| Stock-based compensation expense | (0.6) | (1.5) | (0.8) | (2.1) | (1.9) | ||||||||||||||||||||||||
| Intangibles amortization expense | (0.6) | (0.6) | (0.7) | (1.2) | (1.2) | ||||||||||||||||||||||||
Transition services credit (3) | — | — | — | — | 0.1 | ||||||||||||||||||||||||
Other (4) | — | — | 0.1 | — | 0.1 | ||||||||||||||||||||||||
| Non-GAAP research and development expenses | $ | 9.4 | $ | 9.6 | $ | 8.6 | $ | 19.0 | $ | 16.8 | |||||||||||||||||||
| Selling and administrative expenses | $ | 39.2 | $ | 39.4 | $ | 35.9 | $ | 78.6 | $ | 73.1 | |||||||||||||||||||
| Stock-based compensation expense | (5.2) | (8.4) | (5.2) | (13.6) | (13.8) | ||||||||||||||||||||||||
| Intangibles amortization expense | (3.4) | (3.4) | (3.4) | (6.8) | (6.9) | ||||||||||||||||||||||||
Production transfer costs (2) | — | — | — | — | (0.1) | ||||||||||||||||||||||||
Acquisition-related costs (5) | — | — | (0.2) | — | (0.7) | ||||||||||||||||||||||||
Transition services credit (3) | 0.1 | 0.2 | 0.3 | 0.3 | 0.7 | ||||||||||||||||||||||||
Other (4) | — | — | 0.2 | — | 0.2 | ||||||||||||||||||||||||
| Non-GAAP selling and administrative expenses | $ | 30.7 | $ | 27.8 | $ | 27.6 | $ | 58.5 | $ | 52.5 | |||||||||||||||||||
| Operating expenses | $ | 49.9 | $ | 51.2 | $ | 45.9 | $ | 101.1 | $ | 95.2 | |||||||||||||||||||
| Stock-based compensation expense | (5.8) | (9.9) | (6.0) | (15.7) | (15.7) | ||||||||||||||||||||||||
| Intangibles amortization expense | (4.0) | (4.0) | (4.1) | (8.0) | (8.1) | ||||||||||||||||||||||||
| Restructuring charges | (0.1) | (0.1) | — | (0.2) | (2.4) | ||||||||||||||||||||||||
Production transfer costs (2) | — | — | — | — | (0.1) | ||||||||||||||||||||||||
Acquisition-related costs (5) | — | — | (0.2) | — | (0.7) | ||||||||||||||||||||||||
Transition services credit (3) | 0.1 | 0.2 | 0.3 | 0.3 | 0.8 | ||||||||||||||||||||||||
Other (4) | — | — | 0.3 | — | 0.3 | ||||||||||||||||||||||||
| Non-GAAP operating expenses | $ | 40.1 | $ | 37.4 | $ | 36.2 | $ | 77.5 | $ | 69.3 | |||||||||||||||||||
| Net earnings from continuing operations | $ | 18.4 | $ | 11.3 | $ | 7.8 | $ | 29.7 | $ | 7.4 | |||||||||||||||||||
| Interest expense, net | 1.7 | 1.5 | 2.5 | 3.2 | 5.2 | ||||||||||||||||||||||||
| Provision for (benefit from) income taxes | 4.2 | (0.3) | 3.5 | 3.9 | 4.7 | ||||||||||||||||||||||||
| Earnings from continuing operations before interest and income taxes | 24.3 | 12.5 | 13.8 | 36.8 | 17.3 | ||||||||||||||||||||||||
| Earnings from continuing operations before interest and income taxes as % of revenues | 14.6 | % | 8.2 | % | 9.5 | % | 11.5 | % | 6.2 | % | |||||||||||||||||||
| Stock-based compensation expense | 6.2 | 10.4 | 6.3 | 16.6 | 16.5 | ||||||||||||||||||||||||
| Intangibles amortization expense | 4.0 | 4.0 | 4.1 | 8.0 | 8.1 | ||||||||||||||||||||||||
| Impairment charges | — | — | 3.6 | — | 3.6 | ||||||||||||||||||||||||
| Restructuring charges | 0.2 | 0.2 | — | 0.4 | 2.9 | ||||||||||||||||||||||||
Production transfer costs (2) | 0.8 | 0.9 | 0.2 | 1.7 | 0.4 | ||||||||||||||||||||||||
Acquisition-related costs (5) | — | — | 0.2 | — | 0.7 | ||||||||||||||||||||||||
Transition services credit (3) | (0.3) | (0.5) | (0.5) | (0.8) | (1.2) | ||||||||||||||||||||||||
Other (4) | 0.9 | 2.6 | — | 3.5 | 1.1 | ||||||||||||||||||||||||
| Adjusted earnings from continuing operations before interest and income taxes | $ | 36.1 | $ | 30.1 | $ | 27.7 | $ | 66.2 | $ | 49.4 | |||||||||||||||||||
| Adjusted earnings from continuing operations before interest and income taxes as % of revenues | 21.6 | % | 19.7 | % | 19.0 | % | 20.7 | % | 17.8 | % | |||||||||||||||||||
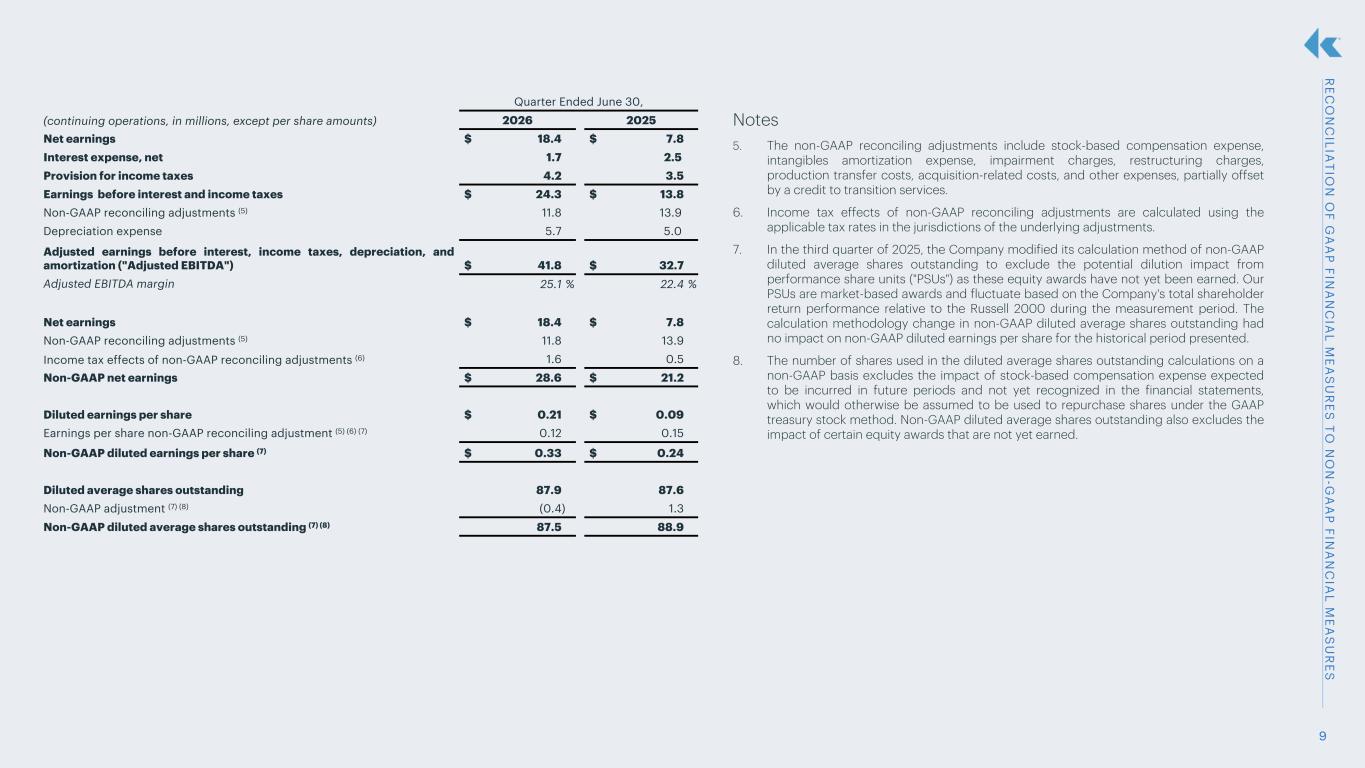
| Net earnings from continuing operations | $ | 18.4 | $ | 11.3 | $ | 7.8 | $ | 29.7 | $ | 7.4 | |||||||||||||||||||
| Interest expense, net | 1.7 | 1.5 | 2.5 | 3.2 | 5.2 | ||||||||||||||||||||||||
| Provision for (benefit from) income taxes | 4.2 | (0.3) | 3.5 | 3.9 | 4.7 | ||||||||||||||||||||||||
| Earnings from continuing operations before interest and income taxes | 24.3 | 12.5 | 13.8 | 36.8 | 17.3 | ||||||||||||||||||||||||
Non-GAAP reconciling adjustments (6) | 11.8 | 17.6 | 13.9 | 29.4 | 32.1 | ||||||||||||||||||||||||
| Depreciation expense | 5.7 | 5.2 | 5.0 | 10.9 | 10.0 | ||||||||||||||||||||||||
| Adjusted earnings from continuing operations before interest, income taxes, depreciation, and amortization ("Adjusted EBITDA") | $ | 41.8 | $ | 35.3 | $ | 32.7 | $ | 77.1 | $ | 59.4 | |||||||||||||||||||
Adjusted EBITDA as a % of revenues | 25.1 | % | 23.1 | % | 22.4 | % | 24.1 | % | 21.4 | % | |||||||||||||||||||
6
| Quarter Ended | Six Months Ended | ||||||||||||||||||||||||||||
| June 30, 2026 | March 31, 2026 | June 30, 2025 | June 30, 2026 | June 30, 2025 | |||||||||||||||||||||||||
| Provision for (benefit from) income taxes | $ | 4.2 | $ | (0.3) | $ | 3.5 | $ | 3.9 | $ | 4.7 | |||||||||||||||||||
Income tax effects of non-GAAP reconciling adjustments (7) | 1.6 | 5.1 | 0.5 | 6.7 | 2.1 | ||||||||||||||||||||||||
| Non-GAAP provision for income taxes | $ | 5.8 | $ | 4.8 | $ | 4.0 | $ | 10.6 | $ | 6.8 | |||||||||||||||||||
| Net earnings from continuing operations | $ | 18.4 | $ | 11.3 | $ | 7.8 | $ | 29.7 | $ | 7.4 | |||||||||||||||||||
Non-GAAP reconciling adjustments (6) | 11.8 | 17.6 | 13.9 | 29.4 | 32.1 | ||||||||||||||||||||||||
Income tax effects of non-GAAP reconciling adjustments (7) | 1.6 | 5.1 | 0.5 | 6.7 | 2.1 | ||||||||||||||||||||||||
| Non-GAAP net earnings | $ | 28.6 | $ | 23.8 | $ | 21.2 | $ | 52.4 | $ | 37.4 | |||||||||||||||||||
| Diluted earnings per share from continuing operations | $ | 0.21 | $ | 0.13 | $ | 0.09 | $ | 0.34 | $ | 0.08 | |||||||||||||||||||
Earnings per share non-GAAP reconciling adjustment (6) (7) (8) | 0.12 | 0.14 | 0.15 | 0.26 | 0.34 | ||||||||||||||||||||||||
Non-GAAP diluted earnings per share (8) | $ | 0.33 | $ | 0.27 | $ | 0.24 | $ | 0.60 | $ | 0.42 | |||||||||||||||||||
| Diluted average shares outstanding | 87.9 | 87.7 | 87.6 | 87.9 | 88.3 | ||||||||||||||||||||||||
Non-GAAP adjustment (8) (9) | (0.4) | (0.4) | 1.3 | (0.5) | 1.0 | ||||||||||||||||||||||||
Non-GAAP diluted average shares outstanding (8) (9) | 87.5 | 87.3 | 88.9 | 87.4 | 89.3 | ||||||||||||||||||||||||
Notes:
(1) In addition to the GAAP financial measures included herein, Knowles has presented certain non-GAAP financial measures that exclude certain amounts that are included in the most directly comparable GAAP measures. Knowles believes that non-GAAP measures are useful as supplements to its GAAP results of operations to evaluate certain aspects of its operations and financial performance, and its management team primarily focuses on non-GAAP items in evaluating Knowles' performance for business planning purposes. Knowles also believes that these measures assist it with comparing its performance between various reporting periods on a consistent basis, as these measures remove from operating results the impact of items that, in Knowles' opinion, do not reflect its core operating performance. Knowles believes that its presentation of non-GAAP financial measures is useful because it provides investors and securities analysts with the same information that Knowles uses internally for purposes of assessing its core operating performance.
(2) Production transfer costs represent duplicate costs incurred to migrate manufacturing to existing facilities.
(3) Transition services represent amounts charged to Syntiant in connection with post-closing transition and separation costs.
(4) Other expenses include foreign currency exchange rate impacts on restructuring balances. Other expenses for the three and six months ended June 30, 2026 also includes foreign currency exchange rate adjustments related to certain balances retained subsequent to the disposal of CMM; these adjustments were not deemed material for 2025 periods.
(5) These expenses include ongoing costs to facilitate integration of the Cornell Dubilier acquisition by the Precision Devices segment.
(6) The non-GAAP reconciling adjustments include stock-based compensation expense, intangibles amortization expense, impairment charges, restructuring charges, production transfer costs, acquisition-related costs, and other expenses, partially offset by a credit to transition services.
(7) Income tax effects of non-GAAP reconciling adjustments are calculated using the applicable tax rates in the jurisdictions of the underlying adjustments.
(8) In the third quarter of 2025, the Company modified its calculation method of non-GAAP diluted average shares outstanding to exclude the potential dilution impact from performance share units ("PSUs") as these equity awards have not yet been earned. Our PSUs are market-based awards and fluctuate based on the Company's total shareholder return performance relative to the Russell 2000 during the measurement period. The calculation methodology change in non-GAAP diluted average shares outstanding increased non-GAAP diluted earnings per share by $0.01 for the six months ended June 30, 2025.
(9) The number of shares used in the diluted average shares outstanding calculations on a non-GAAP basis excludes the impact of stock-based compensation expense expected to be incurred in future periods and not yet recognized in the financial statements, which would otherwise be assumed to be used to repurchase shares under the GAAP treasury stock method. Non-GAAP diluted average shares outstanding also excludes the impact of certain equity awards that are not yet earned.
7
KNOWLES CORPORATION
CONSOLIDATED BALANCE SHEETS
(in millions, except share and per share amounts)
(unaudited)
| June 30, 2026 | December 31, 2025 | ||||||||||
| Current assets: | |||||||||||
| Cash and cash equivalents | $ | 49.6 | $ | 54.2 | |||||||
Receivables, net of allowances of $0.3 and $0.0 | 116.5 | 102.8 | |||||||||
| Inventories | 147.1 | 124.6 | |||||||||
| Prepaid and other current assets | 11.1 | 9.8 | |||||||||
| Total current assets | 324.3 | 291.4 | |||||||||
| Property, plant, and equipment, net | 145.3 | 140.2 | |||||||||
| Goodwill | 270.4 | 270.3 | |||||||||
| Intangible assets, net | 133.1 | 141.1 | |||||||||
| Operating lease right-of-use assets | 18.5 | 19.1 | |||||||||
| Investment in affiliate | 83.4 | 83.4 | |||||||||
| Other assets and deferred charges | 101.0 | 105.6 | |||||||||
| Total assets | $ | 1,076.0 | $ | 1,051.1 | |||||||
| Current liabilities: | |||||||||||
| Accounts payable | $ | 48.3 | $ | 42.9 | |||||||
| Accrued compensation and employee benefits | 24.6 | 29.7 | |||||||||
| Operating lease liabilities | 4.5 | 4.1 | |||||||||
| Other accrued expenses | 22.0 | 28.2 | |||||||||
| Federal and other taxes on income | 1.9 | 1.0 | |||||||||
| Total current liabilities | 101.3 | 105.9 | |||||||||
| Long-term debt | 131.0 | 114.0 | |||||||||
| Deferred income taxes | 1.1 | 1.1 | |||||||||
| Long-term operating lease liabilities | 14.7 | 16.1 | |||||||||
| Other liabilities | 32.4 | 38.2 | |||||||||
| Commitments and contingencies | |||||||||||
| Stockholders' equity: | |||||||||||
Preferred stock - $0.01 par value; 10,000,000 shares authorized; none issued | — | — | |||||||||
Common stock - $0.01 par value; 400,000,000 shares authorized; 100,867,089 and 85,410,326 shares issued and outstanding at June 30, 2026, respectively, and 99,651,892 and 84,887,498 shares issued and outstanding at December 31, 2025, respectively | 1.0 | 1.0 | |||||||||
Treasury stock - at cost; 15,456,763 and 14,764,394 shares at June 30, 2026 and December 31, 2025, respectively | (293.2) | (270.7) | |||||||||
| Additional paid-in capital | 1,747.2 | 1,739.6 | |||||||||
| Accumulated deficit | (540.3) | (569.4) | |||||||||
| Accumulated other comprehensive loss | (119.2) | (124.7) | |||||||||
| Total stockholders' equity | 795.5 | 775.8 | |||||||||
| Total liabilities and stockholders' equity | $ | 1,076.0 | $ | 1,051.1 | |||||||
8
KNOWLES CORPORATION
CONSOLIDATED STATEMENTS OF CASH FLOWS
(in millions)
(unaudited)
| Six Months Ended June 30, | |||||||||||
| 2026 | 2025 | ||||||||||
| Operating Activities | |||||||||||
| Net earnings | $ | 29.1 | $ | 5.8 | |||||||
| Adjustments to reconcile net earnings to cash from operating activities: | |||||||||||
| Depreciation and amortization | 18.9 | 18.1 | |||||||||
| Stock-based compensation | 16.6 | 16.5 | |||||||||
| Deferred income taxes | 5.6 | 4.8 | |||||||||
| Impairment charges on fixed assets | — | 3.6 | |||||||||
| Non-cash interest expense and amortization of debt issuance costs | 0.3 | 2.8 | |||||||||
| (Gain) loss on sale of business | (0.8) | 1.6 | |||||||||
| Other, net | 6.5 | 3.6 | |||||||||
| Changes in assets and liabilities (excluding effects of foreign exchange): | |||||||||||
| Receivables, net | (14.0) | 2.8 | |||||||||
| Inventories | (23.3) | (0.4) | |||||||||
| Prepaid and other current assets | (2.1) | (1.7) | |||||||||
| Accounts payable | 5.8 | (20.8) | |||||||||
| Accrued compensation and employee benefits | (5.1) | (6.6) | |||||||||
| Other accrued expenses | (7.7) | (5.4) | |||||||||
| Accrued taxes | 0.4 | (0.9) | |||||||||
| Other non-current assets and non-current liabilities | (2.7) | 13.9 | |||||||||
| Net cash provided by operating activities | 27.5 | 37.7 | |||||||||
| Investing Activities | |||||||||||
| Capital expenditures | (17.3) | (9.1) | |||||||||
| Purchase of investments | — | (1.6) | |||||||||
| Proceeds from the sale of investments | — | 1.6 | |||||||||
| Proceeds from seller loan repayment | — | 0.5 | |||||||||
| Net cash used in investing activities | (17.3) | (8.6) | |||||||||
| Financing Activities | |||||||||||
| Borrowings under revolving credit facility | 105.0 | — | |||||||||
| Proceeds from exercise of stock options | 5.8 | 0.6 | |||||||||
| Payments under revolving credit facility | (88.0) | (15.0) | |||||||||
| Repurchase of common stock | (22.5) | (35.0) | |||||||||
| Tax on restricted stock and performance share unit vesting and stock option exercises | (14.8) | (6.9) | |||||||||
| Payments of finance lease obligations | (0.2) | (0.2) | |||||||||
| Net cash used in financing activities | (14.7) | (56.5) | |||||||||
| Effect of exchange rate changes on cash and cash equivalents | (0.1) | 0.5 | |||||||||
| Net decrease in cash and cash equivalents | (4.6) | (26.9) | |||||||||
| Cash and cash equivalents at beginning of period | 54.2 | 130.1 | |||||||||
| Cash and cash equivalents at end of period | $ | 49.6 | $ | 103.2 | |||||||
9
KNOWLES CORPORATION
RECONCILIATION OF GAAP CASH FLOW MEASURES TO NON-GAAP CASH FLOW MEASURES (1)
(in millions, except per share amounts)
(unaudited)
| Quarter Ended | Six Months Ended | ||||||||||||||||||||||||||||
| June 30, 2026 | March 31, 2026 | June 30, 2025 | June 30, 2026 | June 30, 2025 | |||||||||||||||||||||||||
| Net cash provided by (used in) by operating activities | $ | 28.2 | $ | (0.7) | $ | 36.4 | $ | 27.5 | $ | 37.7 | |||||||||||||||||||
| Amounts utilized by discontinued operations | 1.2 | 8.4 | 8.3 | 9.6 | 29.3 | ||||||||||||||||||||||||
| Non-GAAP net cash attributable to continuing operations | 29.4 | 7.7 | 44.7 | 37.1 | 67.0 | ||||||||||||||||||||||||
| Capital expenditures | (6.5) | (10.8) | (5.1) | (17.3) | (9.1) | ||||||||||||||||||||||||
| Amounts attributable to discontinued operations | — | — | — | — | — | ||||||||||||||||||||||||
| Non-GAAP capital expenditures attributable to continuing operations | (6.5) | (10.8) | (5.1) | (17.3) | (9.1) | ||||||||||||||||||||||||
| Non-GAAP net cash attributable to continuing operations | 29.4 | 7.7 | 44.7 | 37.1 | 67.0 | ||||||||||||||||||||||||
| Non-GAAP capital expenditures attributable to continuing operations | (6.5) | (10.8) | (5.1) | (17.3) | (9.1) | ||||||||||||||||||||||||
| Adjusted free cash flow | $ | 22.9 | $ | (3.1) | $ | 39.6 | $ | 19.8 | $ | 57.9 | |||||||||||||||||||
| Adjusted free cash flow as a % of revenues | 13.7 | % | (2.0) | % | 27.1 | % | 6.2 | % | 20.8 | % | |||||||||||||||||||
(1) In addition to measuring cash flow generation based on the operating, investing, and financing classifications included in the Consolidated Statement of Cash Flows, Knowles also measures adjusted free cash flow and adjusted free cash flow as a percentage of revenues. Adjusted free cash flow is defined as non-GAAP net cash attributable to continuing operations less non-GAAP capital expenditures attributable to continuing operations. Non-GAAP net cash attributable to continuing operations is defined as net cash provided by operating activities less amounts generated or utilized by discontinued operations. Non-GAAP capital expenditures attributable to continuing operations is defined as capital expenditures less amounts attributable to discontinued operations. Knowles believes these measures are helpful in measuring its cash generated from its continuing operations that is available to repay debt, fund acquisitions, and repurchase Knowles common stock. Adjusted free cash flow and adjusted free cash flow as a percentage of revenues are not presented in accordance with GAAP and may not be comparable to similarly titled measures used by other companies in our industry. As such, adjusted free cash flow and adjusted free cash flow as a percentage of revenues should not be considered in isolation from, or as an alternative to, any other liquidity measures determined in accordance with GAAP.
10