April 20, 2022
Phoenix, Arizona
| | |
Knight-Swift Transportation Holdings Inc. Reports First Quarter 2022 Revenue and Earnings |
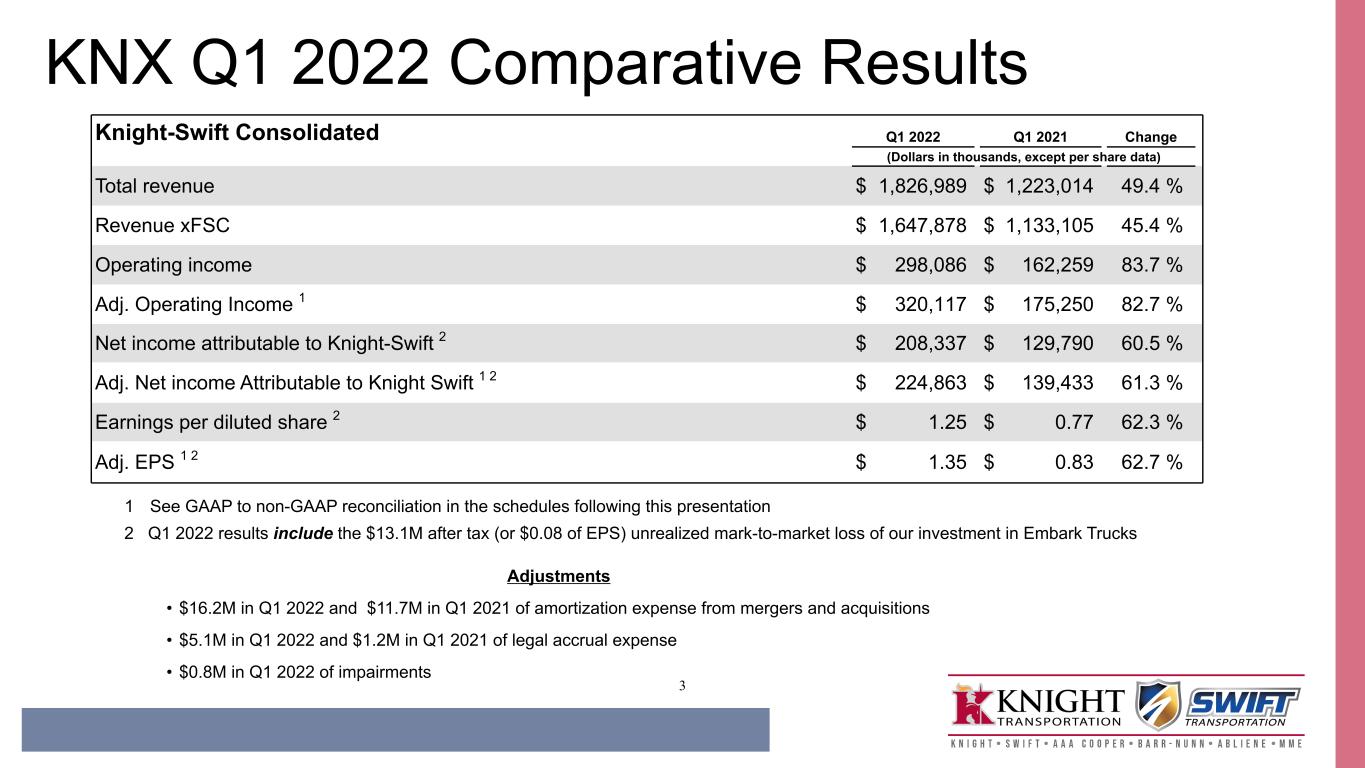
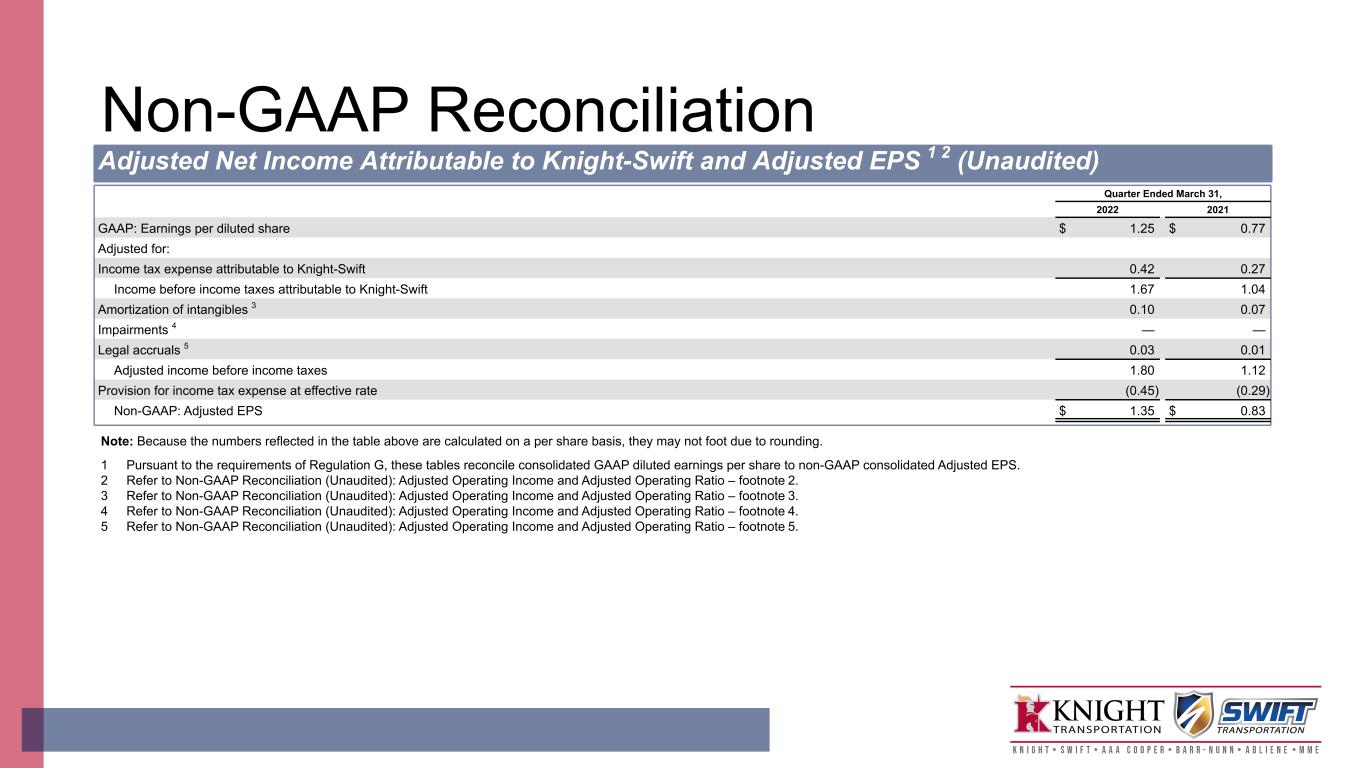
Knight-Swift Transportation Holdings Inc. (NYSE: KNX) ("Knight-Swift" or "the Company"), one of the largest and most diversified freight transportation companies, operating the largest full truckload fleet in North America, today reported first quarter 2022 net income attributable to Knight-Swift of $208.3 million and Adjusted Net Income Attributable to Knight-Swift of $224.9 million. GAAP earnings per diluted share for the first quarter of 2022 were $1.25, compared to $0.77 for the first quarter of 2021. The Adjusted EPS was $1.35 for the first quarter of 2022, compared to $0.83 for the first quarter of 2021.
Each reportable segment grew revenue while improving margins, leading to consolidated revenue growth of 45.4%, excluding truckload and less-than-truckload ("LTL") fuel surcharge, and an improvement of 83.7% in consolidated operating income to $298.1 million in the first quarter of 2022, as compared to the same quarter last year. Net Income Attributable to Knight-Swift increased by 60.5% to $208.3 million.
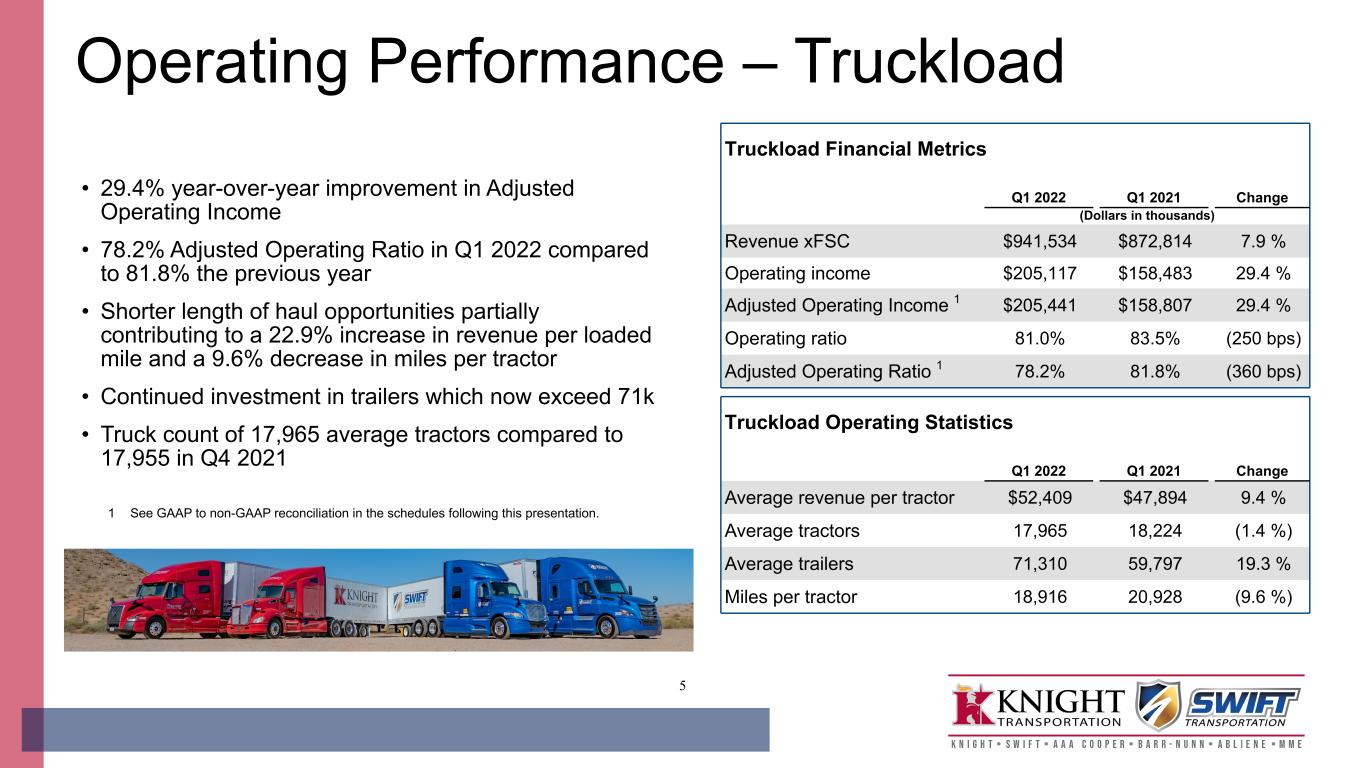
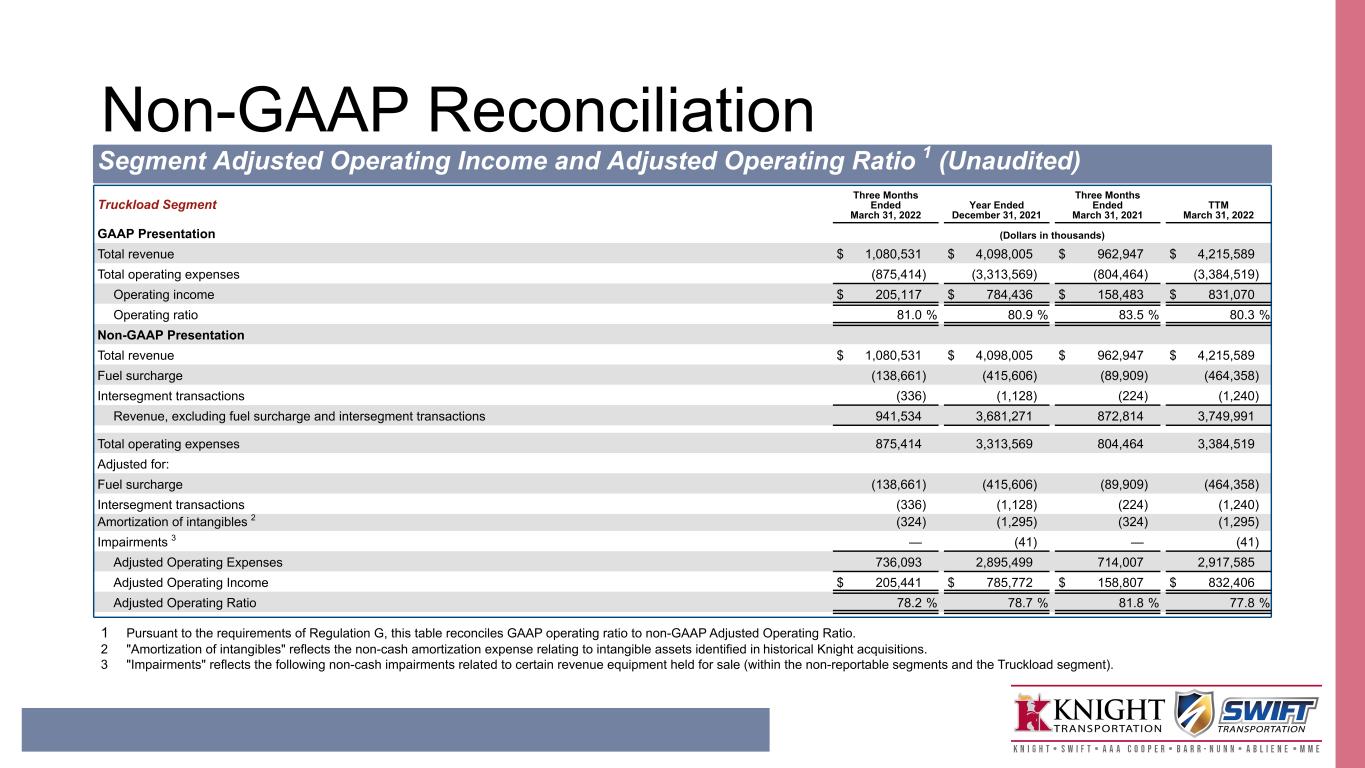
•Truckload — 78.2% Adjusted Operating Ratio, a 360 basis point improvement, supported by continued year-over-year revenue growth. This represents our strongest performance in a first quarter since the merger between Knight and Swift in 2017.
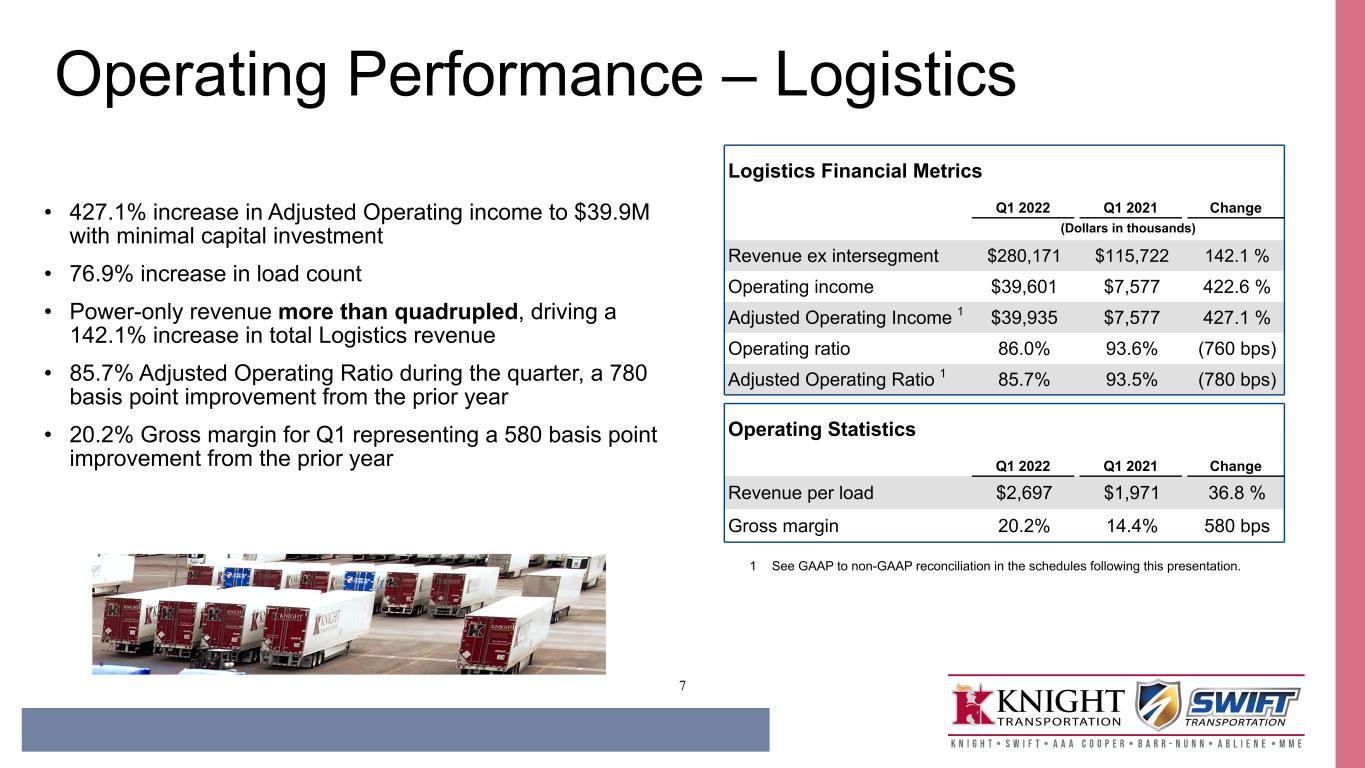
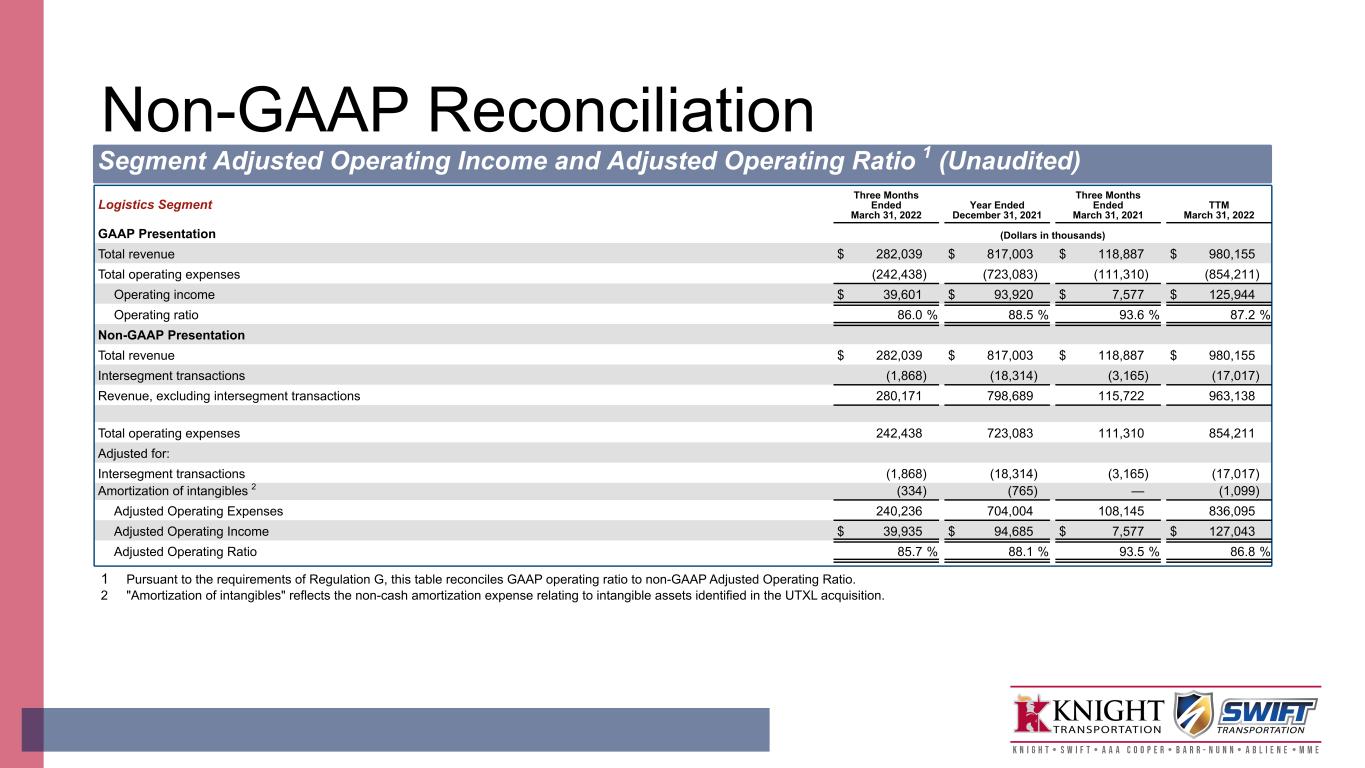
•Logistics — 85.7% Adjusted Operating Ratio with operating income improvement of 422.6%. Load count grew by 76.9%, leading to a 142.1% increase in revenue, excluding intersegment transactions.
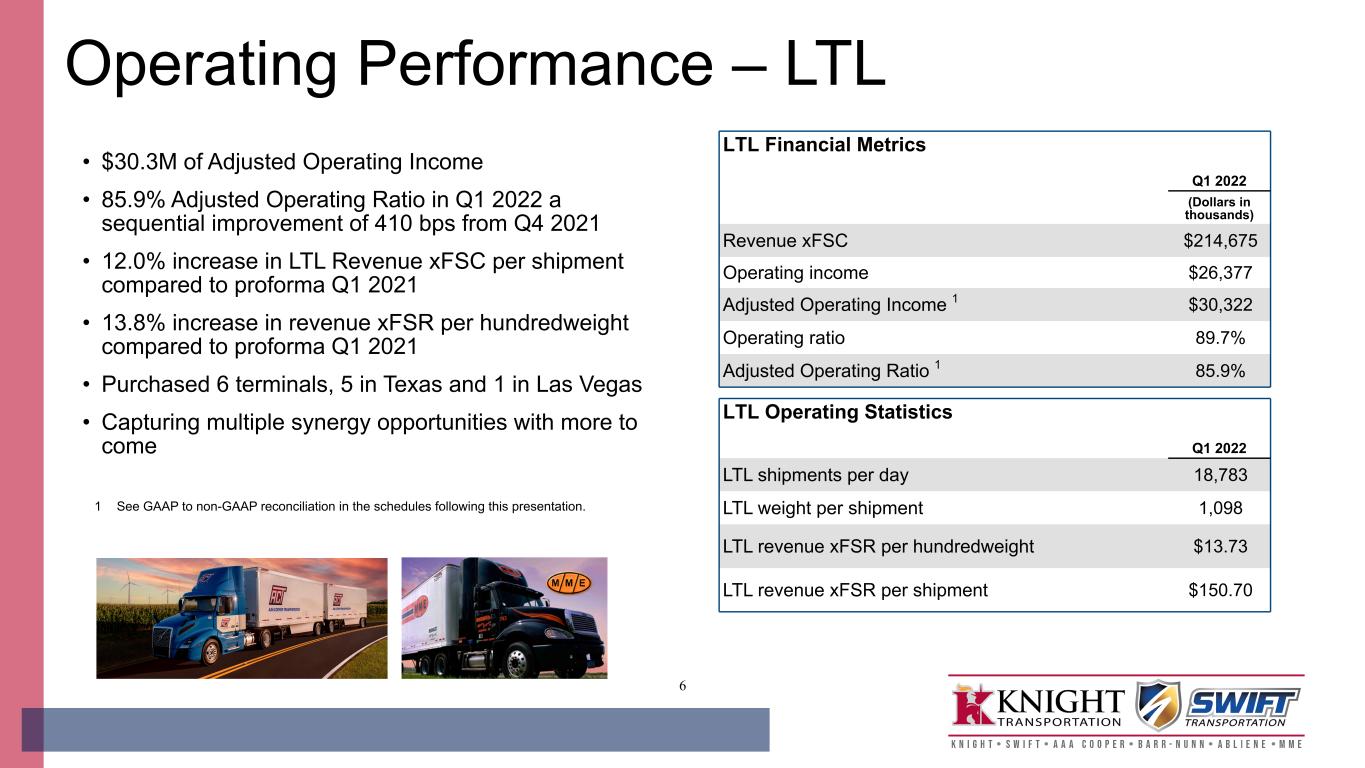
•LTL — 85.9% Adjusted Operating Ratio, led by a 13.8% improvement in revenue, excluding fuel surcharge, per hundredweight, as well as cost synergies being realized, representing a sequential 440 basis point improvement. This was supported by a 24.8% sequential increase in total revenue, which includes the results of Midwest Motor Express ("MME") beginning December 6, 2021.
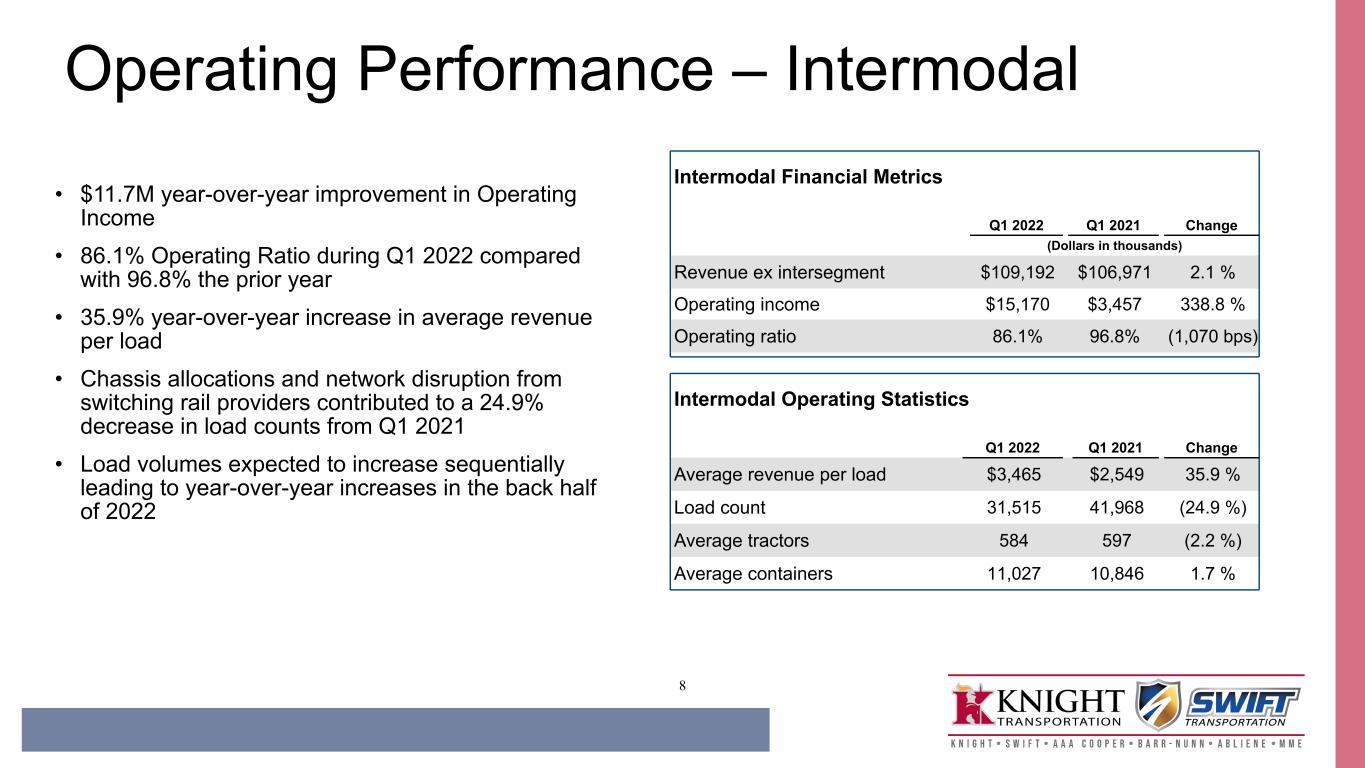
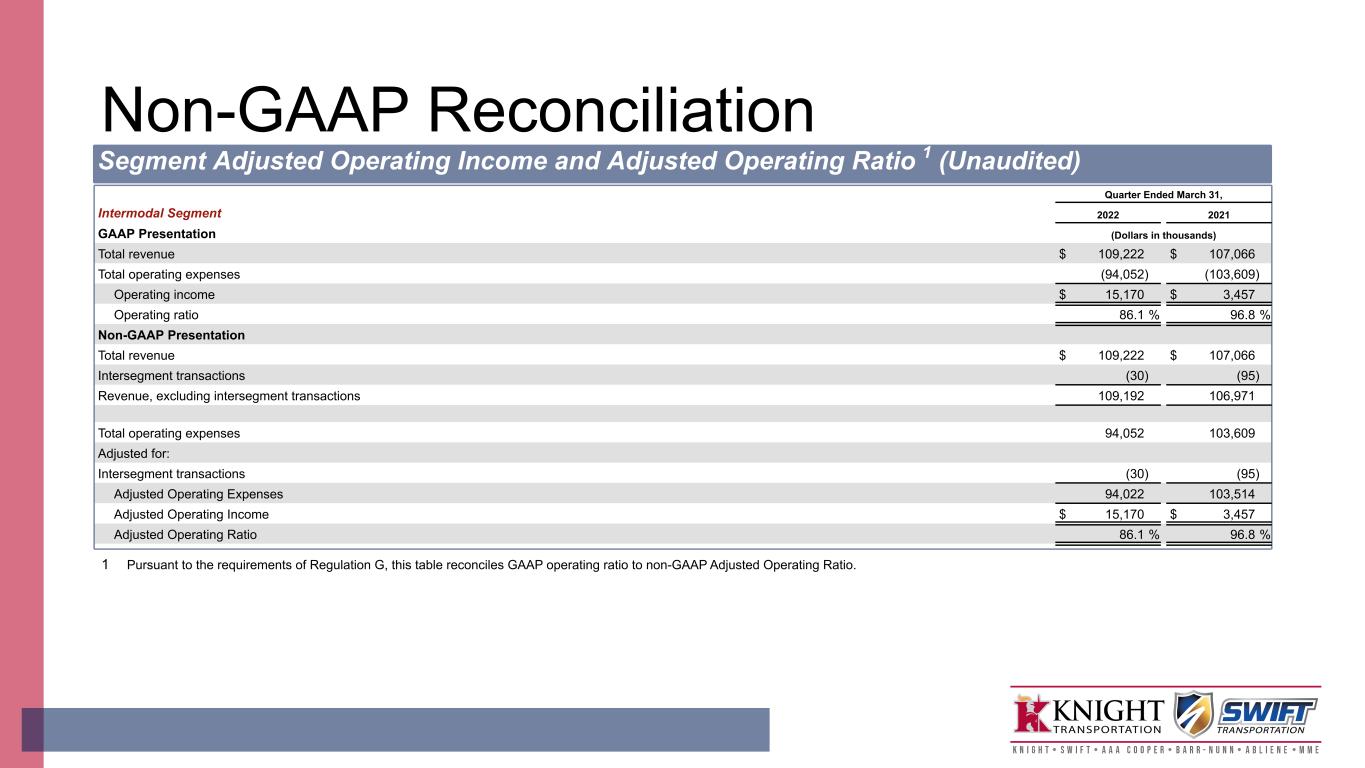
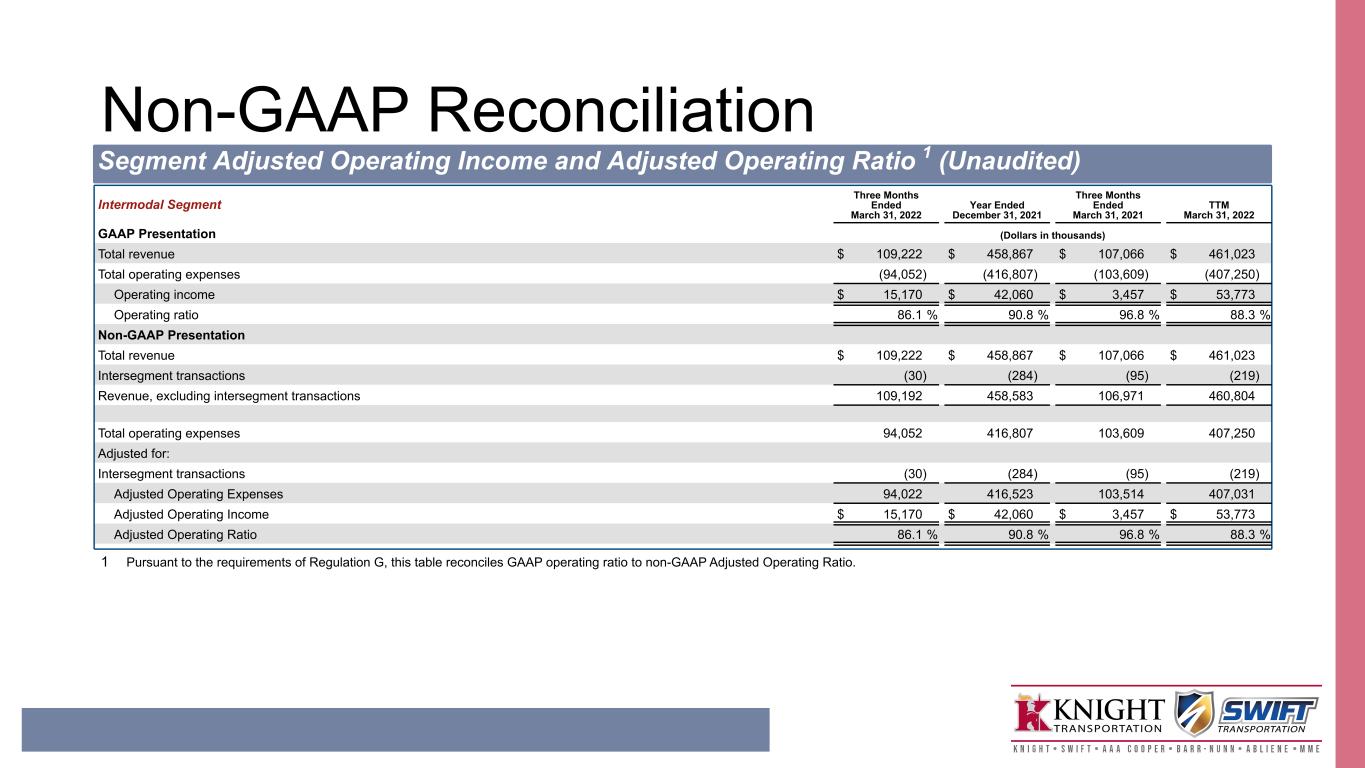
•Intermodal — 86.1% operating ratio within our Intermodal segment, a 1,070 basis point improvement, leading to a 338.8% increase in operating income with year-over-year revenue growth of 2.1%.
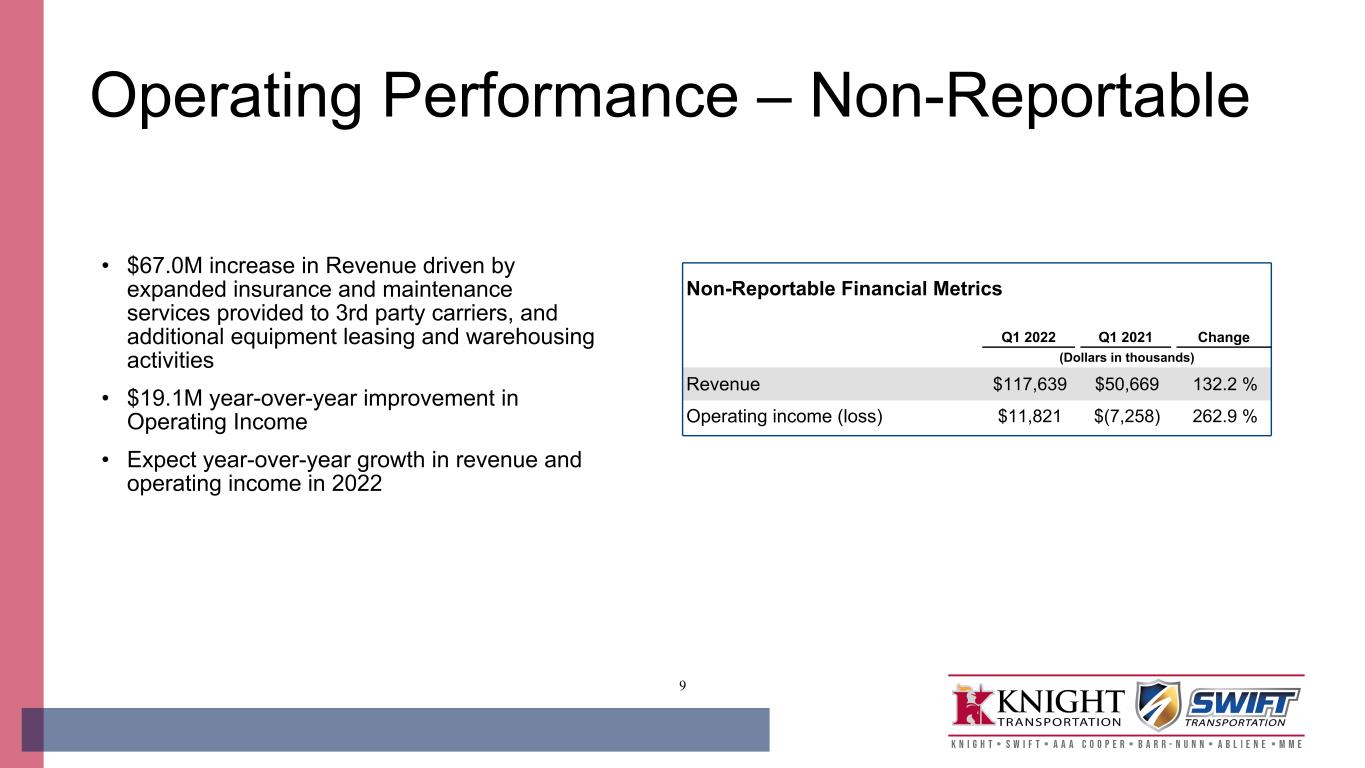
•Non-reportable Segments — Revenue growth of 132.2% was supported by the activities within our diverse operating segments of insurance, equipment maintenance, equipment leasing, and warehousing.
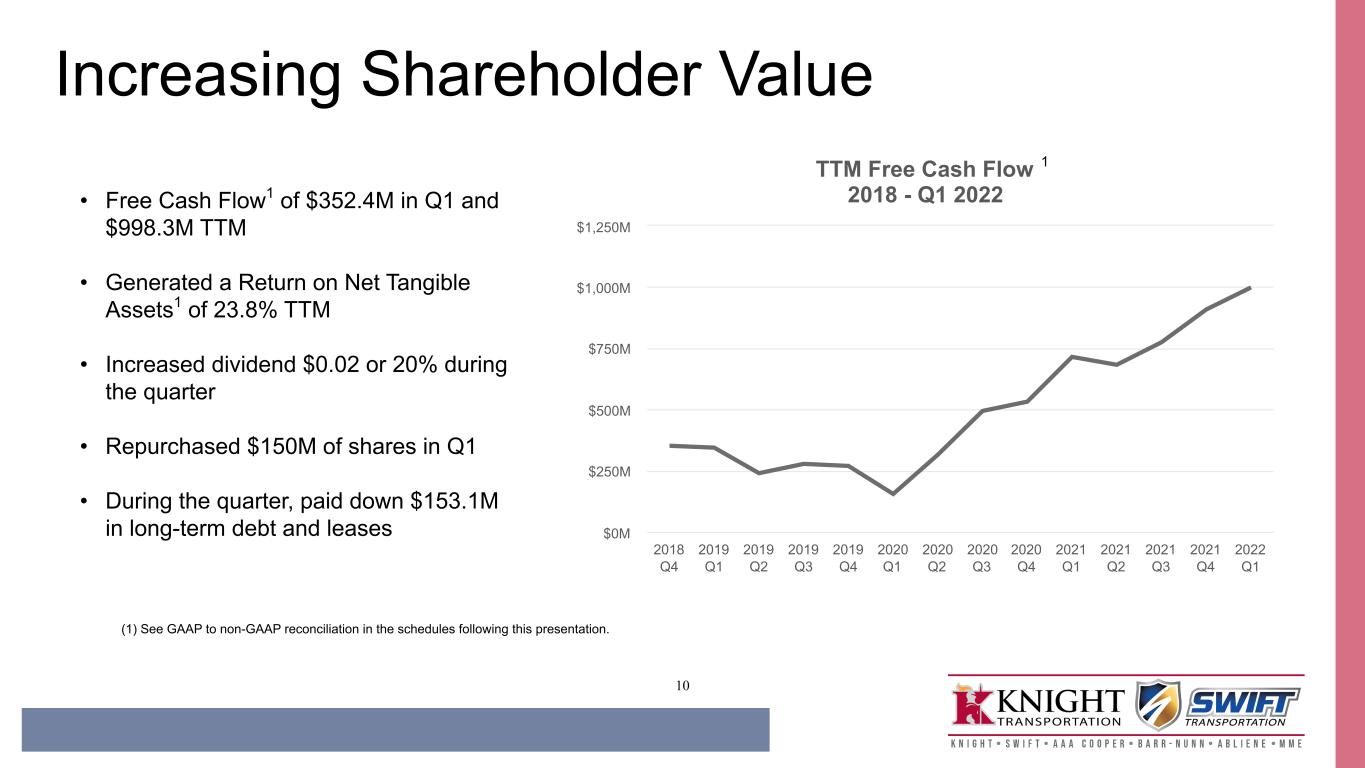
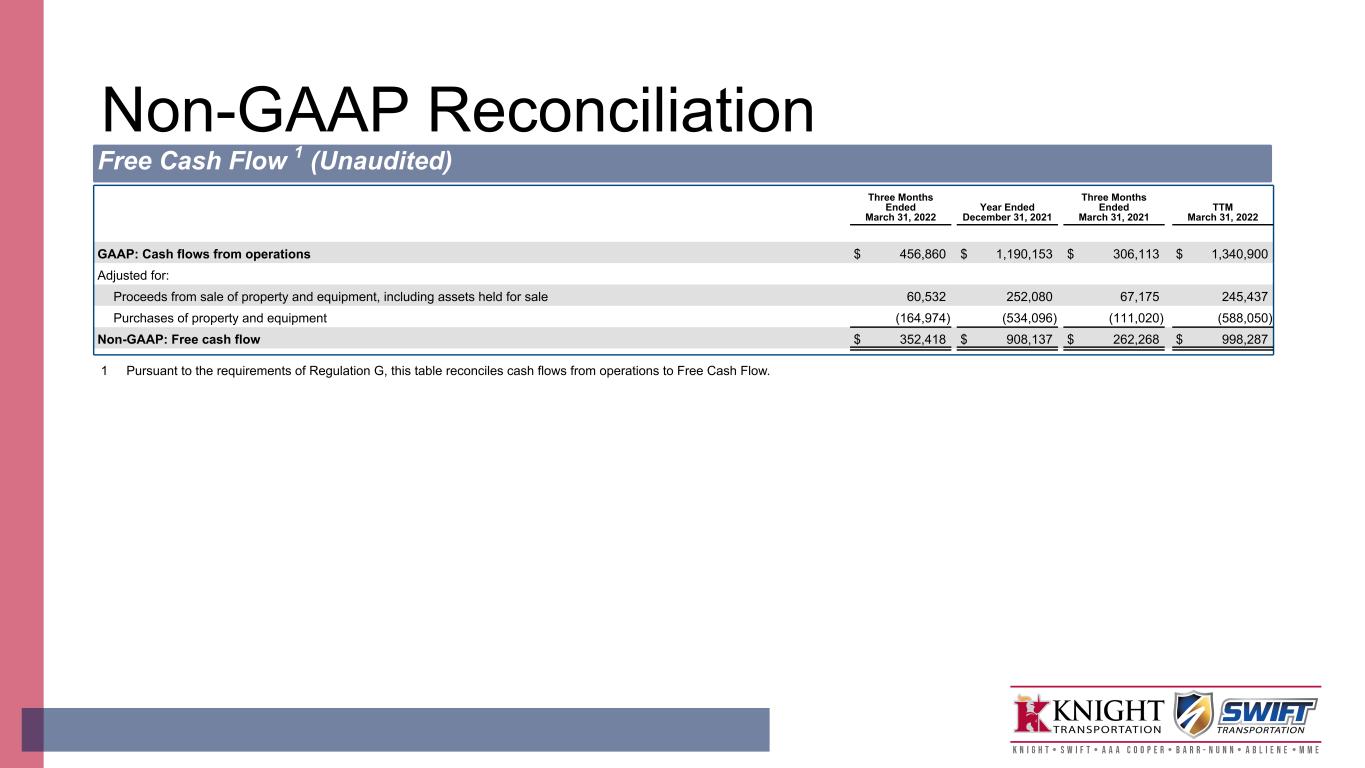
•Free Cash Flow — During the first quarter of 2022, we generated $352.4 million of free cash flow.
| | | | | | | | | | | | | | | | | |
| Quarter Ended March 31, 1 |
| 2022 | | 2021 | | Change |
| (Dollars in thousands, except per share data) |
| Total revenue | $ | 1,826,989 | | | $ | 1,223,014 | | | 49.4 | % |
| Revenue, excluding truckload and LTL fuel surcharge | $ | 1,647,878 | | | $ | 1,133,105 | | | 45.4 | % |
| Operating income | $ | 298,086 | | | $ | 162,259 | | | 83.7 | % |
Adjusted Operating Income 2 | $ | 320,117 | | | $ | 175,250 | | | 82.7 | % |
| Net income attributable to Knight-Swift | $ | 208,337 | | | $ | 129,790 | | | 60.5 | % |
Adjusted Net Income Attributable to Knight-Swift 2 | $ | 224,863 | | | $ | 139,433 | | | 61.3 | % |
| Earnings per diluted share | $ | 1.25 | | | $ | 0.77 | | | 62.3 | % |
Adjusted EPS 2 | $ | 1.35 | | | $ | 0.83 | | | 62.7 | % |
1For information regarding comparability of the reported results due to acquisitions, refer to footnote 1 of the Condensed Consolidated Statements of Comprehensive Income in the schedules following this release.
2See GAAP to non-GAAP reconciliation in the schedules following this release.
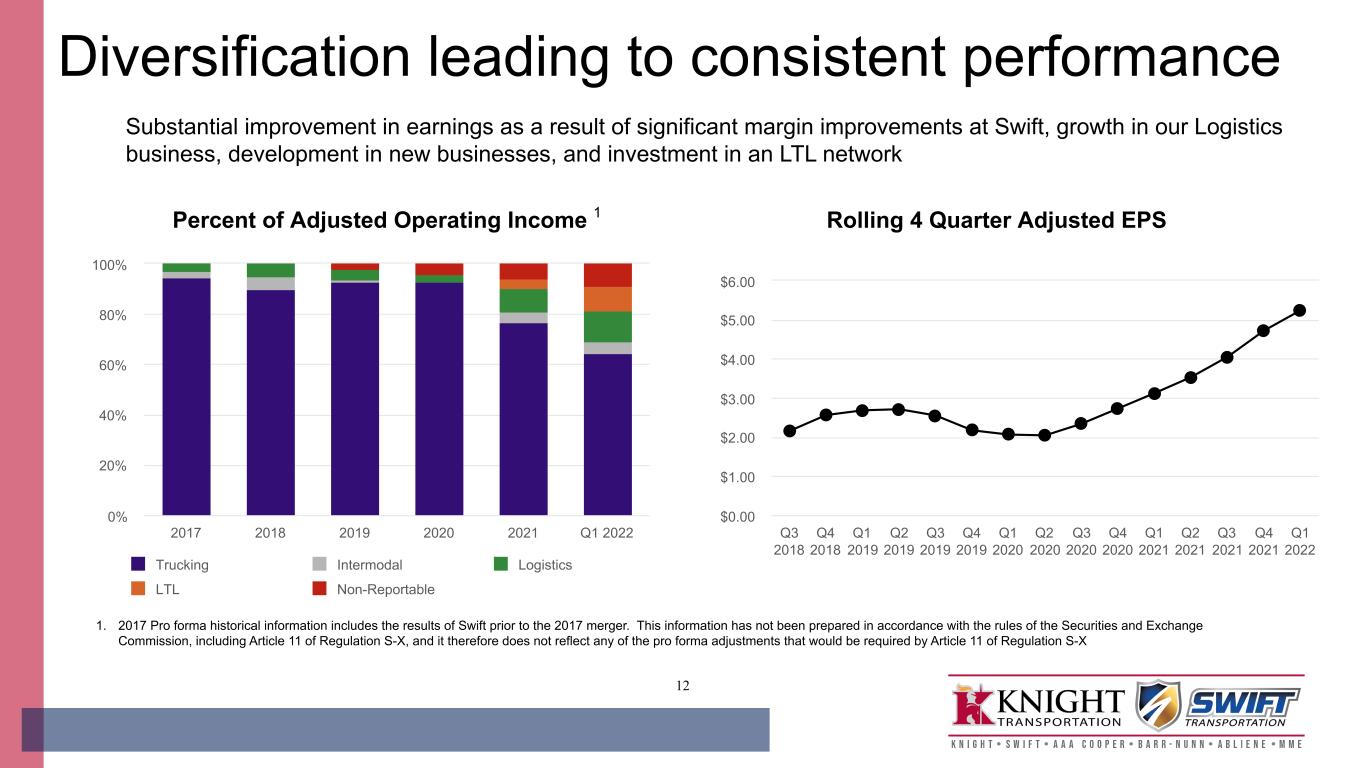
Dave Jackson, CEO of Knight-Swift, commented, "We continue to grow and diversify our business while improving our results and achieved revenue growth and margin expansion in every segment, including recently-acquired AAA Cooper Transportation ("ACT") and MME, which together operated at an 85.9% Adjusted Operating Ratio during the quarter. Additionally, we expanded our network during the quarter by adding six LTL terminals, five in the Texas market and one in Las Vegas, which we will incorporate into the network in the coming quarters. Our non-truckload operations have grown to represent over 40% of our total revenue in the first quarter. We continue to see improvement in contract rates within our Truckload segment, leading to less exposure to the spot market. Logistics continues to grow load count, both through our power-only service offering and our traditional brokerage services, resulting in a Logistics gross margin of 20.2% for the current quarter. Margins within our Intermodal segment remain strong, and we anticipate year-over-year load count growth in the second half of 2022 as we build our customer base following our recent transition to the Union Pacific. Our diverse brands, economies of scale and the unique way we provide multiple service offerings position us to grow with less cyclicality and more sustainable performance."
Other (Expense) Income, net — We incurred $14.4 million of expense within "Other (expense) income, net" in the condensed consolidated statement of comprehensive income in the first quarter of 2022, representing an unfavorable change of $30.5 million, as compared to income of $16.1 million in the first quarter of 2021. The change was primarily driven by current quarter net losses within our portfolio of investments, including the unrealized loss from the mark-to-market adjustment of our investment in Embark Trucks Inc., which impacted the Adjusted EPS by $0.08.
Income Taxes — The effective tax rate was 24.9% for the first quarter of 2022, compared to 25.9% for the first quarter of 2021. We expect the full-year 2022 effective tax rate to be approximately 25%.
Dividend and Share Repurchase — On February 3, 2022, our board of directors declared a quarterly cash dividend of $0.12 per share of common stock, which is a 20% (or $0.02) increase from our existing quarterly dividend. The dividend was payable to the Company's stockholders of record as of March 4, 2022 and was paid on March 28, 2022. During the quarter, we repurchased approximately $150 million of our shares, which was calculated based on the trade dates.
| | |
| Segment Financial Performance |
Truckload Segment
| | | | | | | | | | | | | | | | | |
| Quarter Ended March 31, |
| 2022 | | 2021 | | Change |
| (Dollars in thousands) |
| Revenue, excluding fuel surcharge and intersegment transactions | $ | 941,534 | | | $ | 872,814 | | | 7.9 | % |
| Operating income | $ | 205,117 | | | $ | 158,483 | | | 29.4 | % |
Adjusted Operating Income 1 | $ | 205,441 | | | $ | 158,807 | | | 29.4 | % |
| Operating ratio | 81.0 | % | | 83.5 | % | | (250 | bps) |
Adjusted Operating Ratio 1 | 78.2 | % | | 81.8 | % | | (360 | bps) |
| | | | | |
1See GAAP to non-GAAP reconciliation in the schedules following this release.
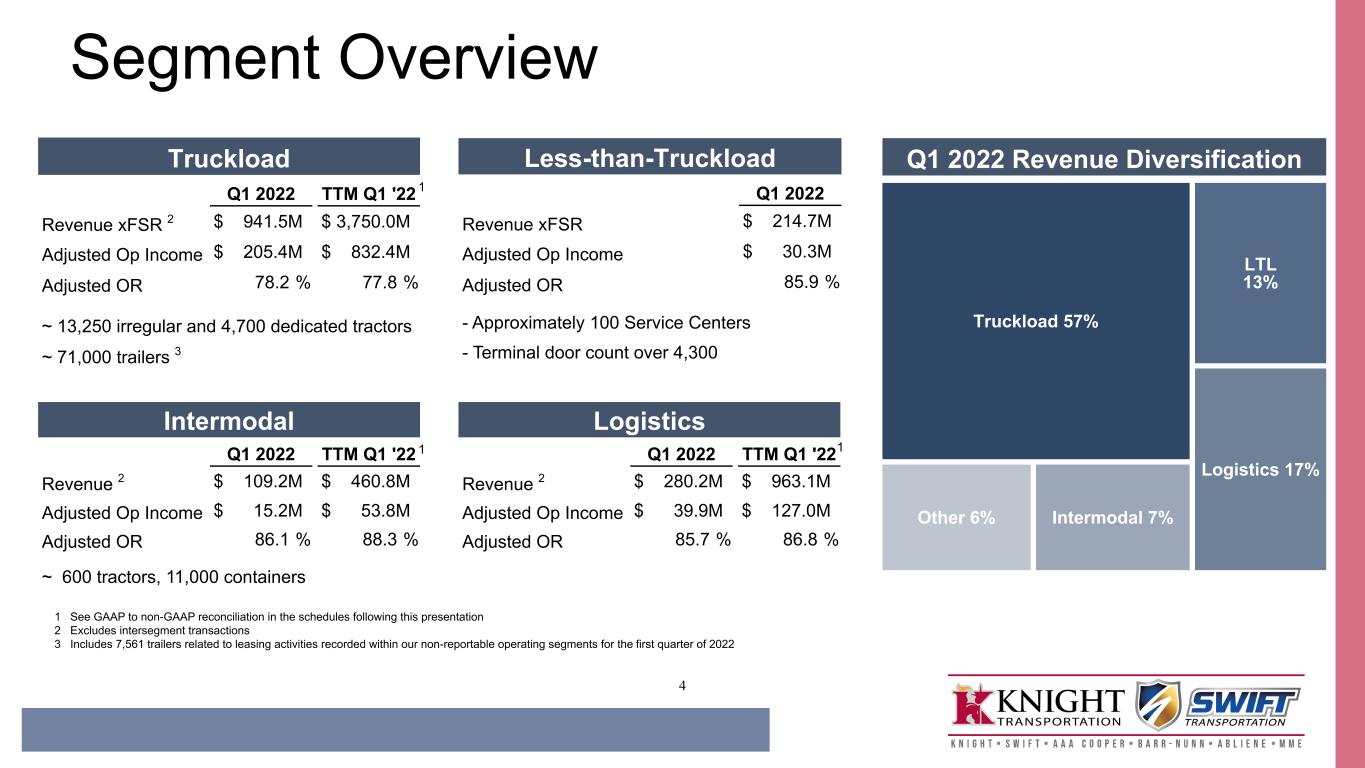
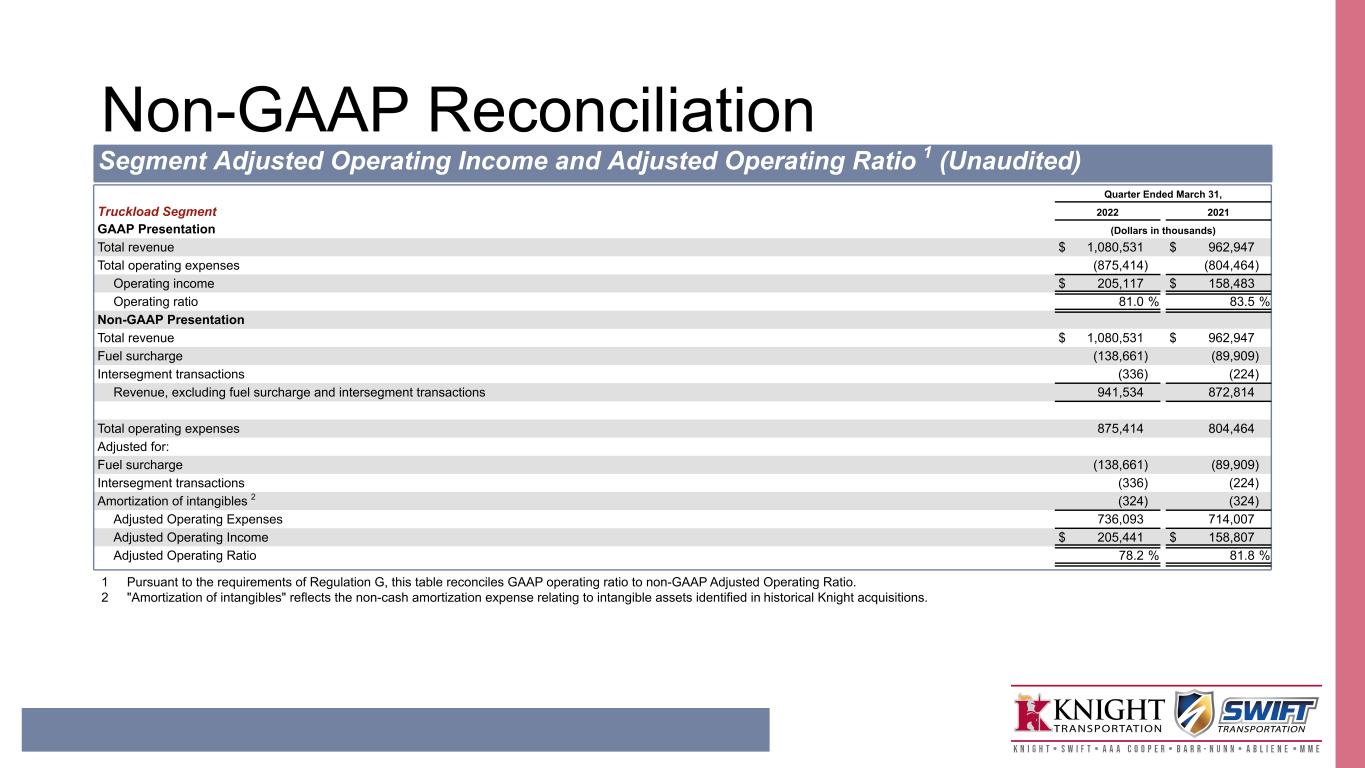
Our Truckload segment includes our irregular route, dedicated, refrigerated, expedited, flatbed, and cross-border operations across our brands with 13,249 irregular route tractors and 4,716 dedicated tractors. Our truckload segment operated at a 78.2% Adjusted Operating Ratio, which improved by 360 basis points year-over-year. This, along with a 7.9% growth in revenue, excluding fuel surcharge and intersegment transactions, led to a 29.4% improvement in Adjusted Operating Income.
Revenue per loaded mile, excluding fuel surcharge and intersegment transactions increased 22.9%, while a 4.4% shorter length of haul contributed to a 9.6% decrease in miles per tractor. These factors ultimately led to a 9.4% increase in average revenue per tractor and improved margins.
We continue making modest progress with seating our tractors and operating them productively. We continue to add scale by increasing our trailer count which has increased by over 2,200 since the fourth quarter of 2021.
Logistics Segment
| | | | | | | | | | | | | | | | | |
| Quarter Ended March 31, |
| 2022 | | 2021 | | Change |
| (Dollars in thousands) |
| Revenue, excluding intersegment transactions | $ | 280,171 | | | $ | 115,722 | | | 142.1 | % |
| Operating income | $ | 39,601 | | | $ | 7,577 | | | 422.6 | % |
Adjusted Operating Income 1 | $ | 39,935 | | | $ | 7,577 | | | 427.1 | % |
| Operating ratio | 86.0 | % | | 93.6 | % | | (760 | bps) |
Adjusted Operating Ratio 1 | 85.7 | % | | 93.5 | % | | (780 | bps) |
| | | | | |
1See GAAP to non-GAAP reconciliation in the schedules following this release.
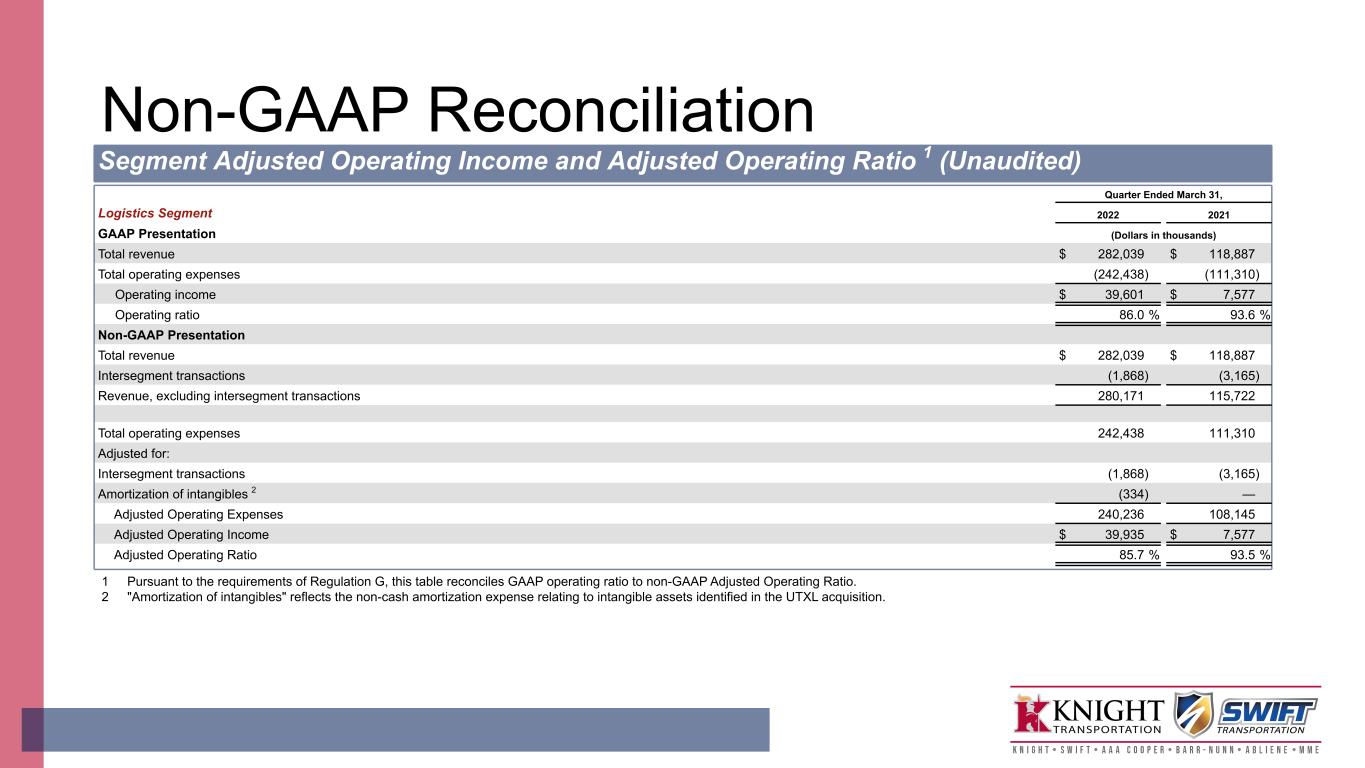
Demand for our logistics service offering remained strong throughout the quarter, as we continue to leverage our consolidated fleet of approximately 71,000 trailers to support our power-only service offering. Logistics revenue, excluding intersegment transactions, increased 142.1% as we grew load count by 76.9%, while increasing revenue per load by 36.8%. The Adjusted Operating Ratio improved to 85.7%, resulting in a 427.1% increase in Adjusted Operating Income. Brokerage gross margin was 20.2% in the first quarter of 2022, compared to 14.4% in the first quarter of 2021.
LTL Segment 1
| | | | | | | | | |
| Quarter Ended March 31, |
| 2022 | | | | |
| (Dollars in thousands) |
| Revenue, excluding fuel surcharge | $ | 214,675 | | | | | |
| Operating income | $ | 26,377 | | | | | |
Adjusted Operating Income 2 | $ | 30,322 | | | | | |
| Operating ratio | 89.7 | % | | | | |
Adjusted Operating Ratio 2 | 85.9 | % | | | | |
| | | | | |
1For information regarding comparability of the reported results due to acquisitions, refer to footnote 1 of the Condensed Consolidated Statements of Comprehensive Income in the schedules following this release.
2See GAAP to non-GAAP reconciliation in the schedules following this release.
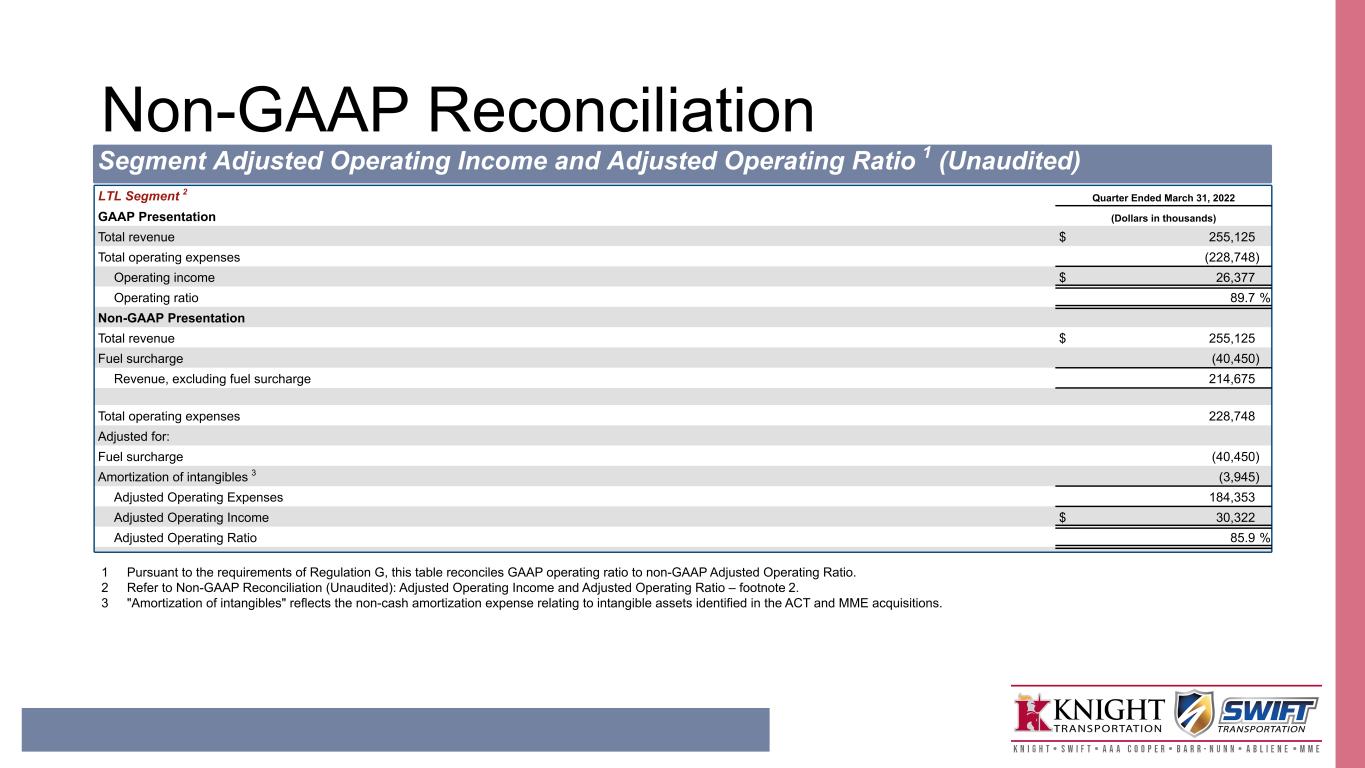
Our LTL segment operates approximately 3,100 tractors and 8,300 trailers across 100 facilities with a door count of 4,300. We generated $214.7 million in revenue, excluding fuel surcharge and an 85.9% Adjusted Operating Ratio during the first quarter of 2022. Revenue, excluding fuel surcharge, per hundredweight was $13.73, while revenue per shipment, excluding fuel surcharge was $150.70. We anticipate continued strength in revenue and margins within our LTL business in the coming quarters, as the ACT and MME teams continue to successfully connect their complementary networks. Additionally, we expanded our network during the quarter by adding six LTL terminals, five in the Texas market and one in Las Vegas.
Intermodal Segment
| | | | | | | | | | | | | | | | | |
| Quarter Ended March 31, |
| 2022 | | 2021 | | Change |
| (Dollars in thousands) |
| Revenue, excluding intersegment transactions | $ | 109,192 | | | $ | 106,971 | | | 2.1 | % |
| Operating income | $ | 15,170 | | | $ | 3,457 | | | 338.8 | % |
| | | | | |
| Operating ratio | 86.1 | % | | 96.8 | % | | (1,070 | bps) |
| | | | | |
| | | | | |
Operating income increased by 338.8%, as operating ratio improved from 96.8% to 86.1%. Continued chassis allocations and network fluidity resulted in a reduction in load count, but contributed to a 35.9% increase in revenue per load. We transitioned to a new rail partner during the quarter, while continuing to improve our operations, cost structure, and network design. To position Intermodal for continued growth, we are growing our container count by 2,000 over the course of 2022. Intermodal continues to provide value to our customers and complements the many services we offer. As a result of our new network and improved service offering, we expect load volumes to inflect positive year-over-year in the back half of the year as we grow with new customers and expand with existing customers.
Non-reportable Segments
| | | | | | | | | | | | | | | | | |
| Quarter Ended March 31, |
| 2022 | | 2021 | | Change |
| (Dollars in thousands) |
| Total revenue | $ | 117,639 | | | $ | 50,669 | | | 132.2 | % |
| | | | | |
| Operating income (loss) | $ | 11,821 | | | $ | (7,258) | | | 262.9 | % |
| | | | | |
| | | | | |
| | | | | |
| | | | | |
The non-reportable segments include support services provided to our customers and third-party carriers, including insurance, equipment maintenance, equipment leasing, warehousing, trailer parts manufacturing, and warranty services. Our non-reportable segments also include certain corporate expenses (such as legal settlements and accruals, as well as $11.6 million in quarterly amortization of intangibles related to the 2017 merger between Knight and Swift and certain acquisitions). Strong demand for the services within our non-reportable segments led to 132.2% revenue growth, which resulted in operating income improving by $19.1 million.
| | |
| Consolidated Liquidity, Capital Resources, and Earnings Guidance |
Cash Flow Sources (Uses) 1
| | | | | | | | | | | | | | | | | |
| | Quarter Ended March 31, |
| | 2022 | | 2021 | | Change |
| (In thousands) |
| Net cash provided by operating activities | $ | 456,860 | | | $ | 306,113 | | | $ | 150,747 | |
| Net cash used in investing activities | (110,187) | | | (74,141) | | | (36,046) | |
| Net cash used in financing activities | (323,249) | | | (185,366) | | | (137,883) | |
Net increase in cash, restricted cash, and equivalents 2 | $ | 23,424 | | | $ | 46,606 | | | $ | (23,182) | |
| Net capital expenditures | $ | (104,442) | | | $ | (43,845) | | | $ | (60,597) | |
| | | | | |
1For information regarding comparability of the reported results due to acquisitions, refer to footnote 1 of the Condensed Consolidated Statements of Comprehensive Income in the schedules following this release.
2"Net increase in cash, restricted cash, and equivalents" is derived from changes within "Cash and cash equivalents," "Cash and cash equivalents – restricted," and the long-term portion of restricted cash included in "Other long-term assets" in the condensed consolidated balance sheets.
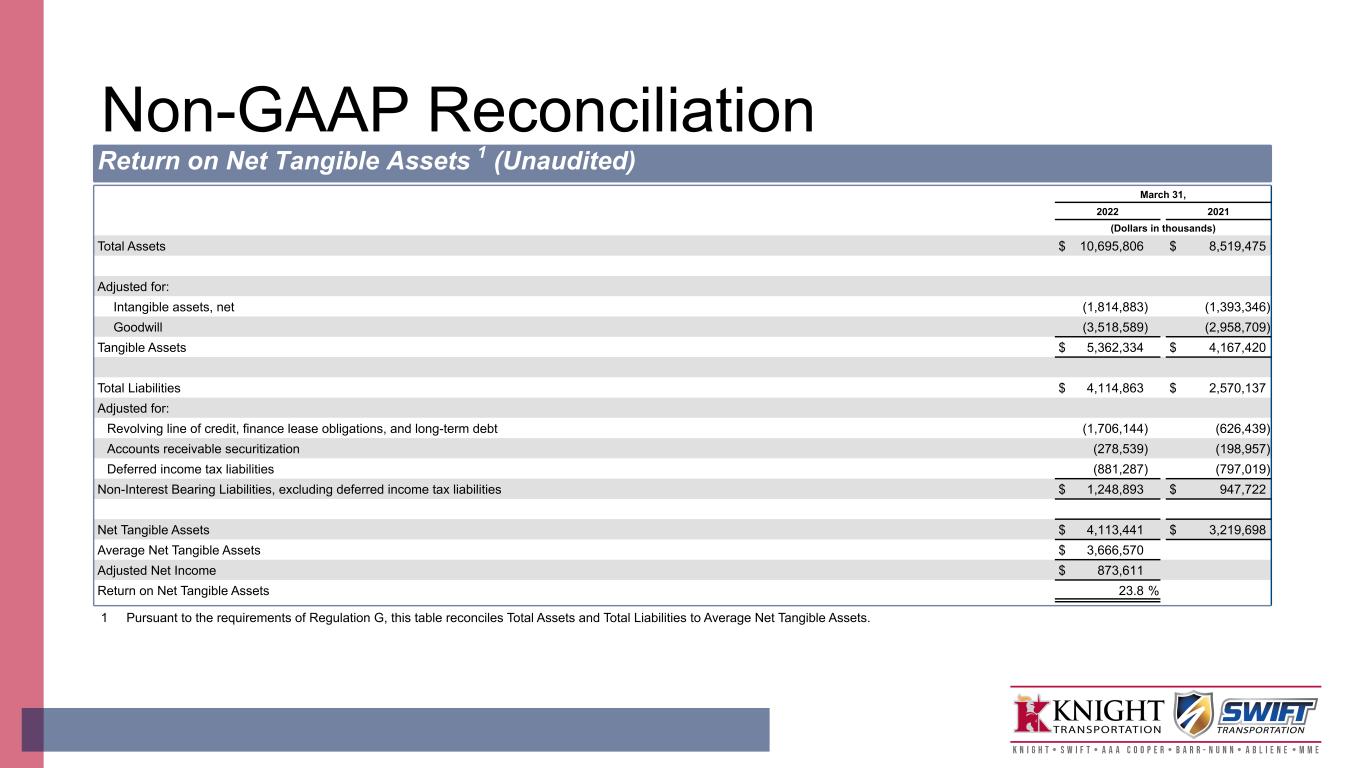
Liquidity and Capitalization — As of March 31, 2022, we had a balance of $1.3 billion of unrestricted cash and available liquidity and $6.6 billion of stockholders' equity. The face value of our debt, net of unrestricted cash ("Net Debt") was $1.7 billion as of March 31, 2022. Free Cash Flow3 for the first quarter of 2022 was $352.4 million. During the first quarter of 2022, we generated $456.9 million in operating cash flows and paid down $133.3 million in long-term debt, $10.5 million in finance liabilities and $9.3 million in cash on our operating lease liabilities. We also repurchased approximately $150 million worth of our shares, calculated based on the trade dates, and issued $20.1 million in dividends to our stockholders.
Equipment and Capital Expenditures — Gain on sale of revenue equipment increased to $34.8 million in the first quarter of 2022, compared to $10.5 million in the same quarter of 2021. The average age of the tractor fleet within our Truckload segment was 2.6 years in the first quarter of 2022, compared to 2.3 years in the same quarter of 2021. The average age of the tractor fleet within our LTL segment was 4.5 years in the first quarter of 2022. Cash capital expenditures, net of disposal proceeds, were $104.4 million in the first quarter of 2022. We expect net cash capital expenditures will be in the range of $550.0 – $600.0 million for full-year 2022. Our net cash capital expenditures primarily represent replacements of existing tractors and trailers, as well as investment in our terminal network, driver amenities, and technology.
________
3See GAAP to non-GAAP reconciliations in the schedules following this release.
Guidance — We expect that Adjusted EPS1 for full-year 2022 will range from $5.20 to $5.40, which is an update from our previously-disclosed range of $5.10 to $5.30. Our expected Adjusted EPS1 range is based on the current truckload, LTL, and general market conditions, recent trends, and the current beliefs, assumptions, and expectations of management, as follows:
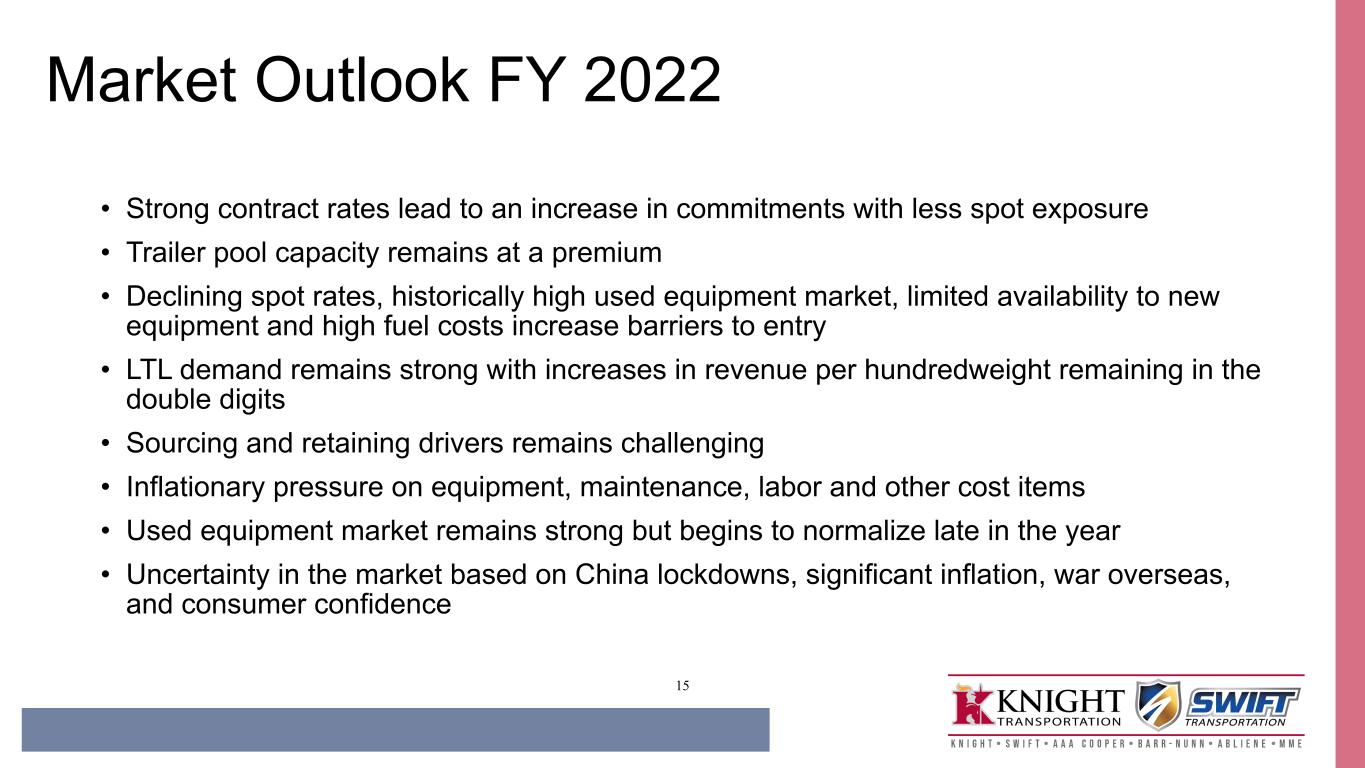
•Double-digit truckload contract rate increases while spot rates moderate year-over-year
•Stable truck count with a modest sequential improvement in miles per tractor
•Strong Intermodal margins in the first half but normalizing to an Adjusted Operating Ratio in the high 80's to low 90's by the end of the year
•Intermodal load volume down in the first half of the year and positive year-over-year in the back half
•Logistics revenue growth over 30% with an Adjusted Operating Ratio in the high 80's to low 90's
•Year-over-year increases in LTL revenue with improved margins
•Continued growth in revenue and operating income in our non-reportable segments
•Inflationary pressure in most cost areas including driver related expenses, maintenance, equipment, and non-driving labor
•Approximate tax rate of 25.0% for the full year 2022
•Net cash capital expenditures for the full year 2022 expected range of $550.0 - $600.0 million
•Higher than normal equipment gains on sale, but moderating from the first quarter of 2022
The factors described under "Forward-Looking Statements," among others, could cause actual results to materially vary from this guidance. Further, we cannot estimate on a forward-looking basis, the impact of certain income and expense items on our earnings per share, because these items, which could be significant, may be infrequent, are difficult to predict, and may be highly variable. As a result, we do not provide a corresponding GAAP measure for, or reconciliation to, our Adjusted EPS1 guidance.
________
1Our calculation of Adjusted EPS starts with GAAP diluted earnings per share and adds back the after-tax impact of intangible asset amortization (which is expected to be approximately $0.30 for full-year 2022), as well as noncash impairments and certain other unusual items, if any.
Knight-Swift will host a live conference call with analysts and investors to discuss the earnings release, the results of operations, and other matters following its earnings press release on Wednesday, April 20, 2022, at 4:30 p.m. EDT. The conference dial in information is (855) 733-9163 (Please note that, since the call will begin promptly as scheduled, you will need to join a few minutes prior to that time.) Slides to accompany this call will be posted on the Company’s website and will be available to download just prior to the scheduled conference call. To view the presentation, please visit https://investor.knight-swift.com/, "First Quarter 2022 Conference Call Presentation."
Knight-Swift Transportation Holdings Inc. is one of North America's largest and most diversified freight transportation companies, providing multiple full truckload, LTL, intermodal, and logistics services. Knight-Swift uses a nationwide network of business units and terminals in the United States and Mexico to serve customers throughout North America. In addition to operating one of the country's largest tractor fleet, Knight-Swift also contracts with third-party equipment providers to provide a broad range of transportation services to our customers while creating quality driving jobs for our driving associates and successful business opportunities for independent contractors.
| | |
| Investor Relations Contact Information |
David A. Jackson, President and Chief Executive Officer, or Adam W. Miller, Chief Financial Officer: (602) 606-6349
| | |
| Forward-Looking Statements |
This press release contains statements that may constitute forward-looking statements, which are based on information currently available, usually identified by words such as "anticipates," "believes," "estimates," "plans,'' "projects," "expects," "hopes," "intends," "strategy," ''focus," "outlook," "foresee," "will," "could," "should," "may," "feel", "goal," "continue," or similar expressions, which speak only as of the date the statement was made. Such statements are forward-looking statements and are within the meaning of Section 27A of the Securities Act of 1933, as amended, and Section 21E of the Securities Exchange Act of 1934, as amended, and such statements are subject to the safe harbor created by those sections and the Private Securities Litigation Reform Act of 1995. All statements, other than statements of historical or current fact, are statements that could be deemed forward-looking statements, including without limitation: any projections of or guidance regarding earnings, earnings per share, revenues, cash flows, dividends, share repurchases, leverage ratio, capital expenditures, or other financial items; any statement of plans, strategies, and objectives of management for future operations; any statements concerning proposed acquisition plans, new services or developments; any statements regarding future economic, industry, or Company conditions or performance, including, without limitation, expectations regarding future supply or demand, volume, or truckload capacity, or any impacts of the COVID-19 global pandemic or other similar outbreaks; and any statements of belief and any statement of assumptions underlying any of the foregoing. In this press release, such statements include, but are not limited to, statements concerning:
•any projections of or guidance regarding earnings, earnings per share, Adjusted EPS, revenues, cash flows, dividends, capital expenditures, or other financial items,
•future dividends,
•future effective tax rates,
•future performance of our reportable segments, including network design, cost structure, container count, margin, and volumes within our Intermodal segment, and the expected network, margin, and volumes within our LTL segment,
•future capital structure, capital allocation, growth strategies and opportunities, and liquidity, and
•future capital expenditures, including nature and funding of capital expenditures.
Such forward-looking statements are inherently uncertain, and are based upon the current beliefs, assumptions, and expectations of management and current market conditions, which are subject to significant risks and uncertainties as set forth in the Risk Factors section of Knight-Swift's Annual Report on Form 10-K for the year ended December 31, 2021, and various disclosures in our press releases, stockholder reports, and other filings with the SEC.
| | |
Condensed Consolidated Statements of Comprehensive Income (Unaudited) 1 |
| | | | | | | | | | | | | | | |
| | | Quarter Ended March 31, |
| | | | | | 2022 | | 2021 |
| | | | | (In thousands, except per share data) |
| Revenue: | | | | | | | |
| Revenue, excluding truckload and LTL fuel surcharge | | | | | $ | 1,647,878 | | | $ | 1,133,105 | |
| Truckload and LTL fuel surcharge | | | | | 179,111 | | | 89,909 | |
| Total revenue | | | | | 1,826,989 | | | 1,223,014 | |
| Operating expenses: | | | | | | | |
| Salaries, wages, and benefits | | | | | 536,056 | | | 370,370 | |
| Fuel | | | | | 190,489 | | | 118,236 | |
| Operations and maintenance | | | | | 95,883 | | | 68,070 | |
| Insurance and claims | | | | | 98,192 | | | 55,643 | |
| Operating taxes and licenses | | | | | 29,037 | | | 22,048 | |
| Communications | | | | | 5,870 | | | 5,037 | |
| Depreciation and amortization of property and equipment | | | | | 145,044 | | | 119,915 | |
| Amortization of intangibles | | | | | 16,166 | | | 11,749 | |
| Rental expense | | | | | 13,401 | | | 16,864 | |
| Purchased transportation | | | | | 386,446 | | | 258,230 | |
| Impairments | | | | | 810 | | | — | |
| Miscellaneous operating expenses | | | | | 11,509 | | | 14,593 | |
| | | | | | | |
| Total operating expenses | | | | | 1,528,903 | | | 1,060,755 | |
| Operating income | | | | | 298,086 | | | 162,259 | |
| Other (expenses) income: | | | | | | | |
| Interest income | | | | | 461 | | | 294 | |
| Interest expense | | | | | (6,680) | | | (3,486) | |
| Other (expense) income, net | | | | | (14,405) | | | 16,105 | |
| Total other (expenses) income, net | | | | | (20,624) | | | 12,913 | |
| Income before income taxes | | | | | 277,462 | | | 175,172 | |
| Income tax expense | | | | | 69,174 | | | 45,329 | |
| Net income | | | | | 208,288 | | | 129,843 | |
| Net income (loss) attributable to noncontrolling interest | | | | | 49 | | | (53) | |
| Net income attributable to Knight-Swift | | | | | $ | 208,337 | | | $ | 129,790 | |
| Other comprehensive loss | | | | | (372) | | | — | |
| Comprehensive income | | | | | $ | 207,965 | | | $ | 129,790 | |
| | | | | | | |
| Earnings per share: | | | | | | | |
| Basic | | | | | $ | 1.26 | | | $ | 0.77 | |
| Diluted | | | | | $ | 1.25 | | | $ | 0.77 | |
| | | | | | | |
| Dividends declared per share: | | | | | $ | 0.12 | | | $ | 0.08 | |
| | | | | | | |
| Weighted average shares outstanding: | | | | | | | |
| Basic | | | | | 165,377 | | | 167,478 | |
| Diluted | | | | | 166,499 | | | 168,374 | |
________
1The reported results do not include the results of operations of ACT and its subsidiary prior to its acquisition by Knight-Swift on July 5, 2021 in accordance with the accounting treatment applicable to the transaction. The reported results do not include the results of operations of MME and its subsidiaries prior to its acquisition by Knight-Swift on December 6, 2021 in accordance with the accounting treatment applicable to the transaction.
| | |
| Condensed Consolidated Balance Sheets (Unaudited) |
| | | | | | | | | | | |
| March 31, 2022 | | December 31, 2021 |
| (In thousands) |
| ASSETS | | | |
| Current assets: | | | |
| Cash and cash equivalents | $ | 242,860 | | | $ | 261,001 | |
| Cash and cash equivalents – restricted | 128,774 | | | 87,241 | |
| Restricted investments, held-to-maturity, amortized cost | 8,302 | | | 5,866 | |
Trade receivables, net of allowance for doubtful accounts of $19,883 and $21,663, respectively | 939,704 | | | 911,336 | |
| Contract balance – revenue in transit | 21,185 | | | 22,936 | |
| | | |
| | | |
| Prepaid expenses | 86,742 | | | 90,507 | |
| Assets held for sale | 11,421 | | | 8,166 | |
| Income tax receivable | 217 | | | 909 | |
| Other current assets | 27,064 | | | 26,318 | |
| Total current assets | 1,466,269 | | | 1,414,280 | |
| Property and equipment, net | 3,579,685 | | | 3,555,364 | |
| | | |
| Operating lease right-of-use assets | 141,363 | | | 147,540 | |
| Goodwill | 3,518,589 | | | 3,515,135 | |
| Intangible assets, net | 1,814,883 | | | 1,831,049 | |
| | | |
| Other long-term assets | 175,017 | | | 192,132 | |
| Total assets | $ | 10,695,806 | | | $ | 10,655,500 | |
| | | |
| LIABILITIES AND STOCKHOLDERS' EQUITY | | | |
| Current liabilities: | | | |
| Accounts payable | $ | 248,762 | | | $ | 224,844 | |
| Accrued payroll and purchased transportation | 237,909 | | | 217,084 | |
| Accrued liabilities | 188,008 | | | 128,536 | |
| Claims accruals – current portion | 223,382 | | | 206,607 | |
| | | |
Finance lease liabilities and long-term debt – current portion | 234,146 | | | 262,423 | |
| Operating lease liabilities – current portion | 33,822 | | | 35,322 | |
| | | |
| | | |
| Total current liabilities | 1,166,029 | | | 1,074,816 | |
| Revolving line of credit | 165,000 | | | 260,000 | |
Long-term debt – less current portion | 1,029,159 | | | 1,037,552 | |
| Finance lease liabilities – less current portion | 277,839 | | | 256,166 | |
| Operating lease liabilities – less current portion | 103,161 | | | 107,614 | |
| Accounts receivable securitization – less current portion | 278,539 | | | 278,483 | |
| Claims accruals – less current portion | 202,737 | | | 210,714 | |
| Deferred tax liabilities | 881,287 | | | 874,877 | |
| Other long-term liabilities | 11,112 | | | 11,828 | |
| Total liabilities | 4,114,863 | | | 4,112,050 | |
| Stockholders’ equity: | | | |
| Common stock | 1,636 | | | 1,660 | |
| Additional paid-in capital | 4,360,889 | | | 4,350,913 | |
| Accumulated other comprehensive loss | (935) | | | (563) | |
| Retained earnings | 2,209,104 | | | 2,181,142 | |
| Total Knight-Swift stockholders' equity | 6,570,694 | | | 6,533,152 | |
| Noncontrolling interest | 10,249 | | | 10,298 | |
| Total stockholders’ equity | 6,580,943 | | | 6,543,450 | |
| Total liabilities and stockholders’ equity | $ | 10,695,806 | | | $ | 10,655,500 | |
| | |
| Segment Operating Statistics (Unaudited) |
| | | | | | | | | | | | | | | | | | | | | | | |
| | | Quarter Ended March 31, |
| | | | | | | 2022 | | 2021 | | Change |
| Truckload | | | | | | | | | | | |
Average revenue per tractor 1 | | | | | | | $ | 52,409 | | | $ | 47,894 | | | 9.4 | % |
| Non-paid empty miles percentage | | | | | | | 14.1 | % | | 12.8 | % | | 130 | bps |
| Average length of haul (miles) | | | | | | | 394 | | | 412 | | | (4.4 | %) |
| Miles per tractor | | | | | | | 18,916 | | | 20,928 | | | (9.6 | %) |
| Average tractors | | | | | | | 17,965 | | | 18,224 | | | (1.4 | %) |
Average trailers 2 | | | | | | | 71,310 | | | 59,797 | | | 19.3 | % |
| | | | | | | | | | | |
| Logistics | | | | | | | | | | | |
Revenue per load 3 | | | | | | | $ | 2,697 | | | $ | 1,971 | | | 36.8 | % |
| Gross margin | | | | | | | 20.2 | % | | 14.4 | % | | 580 | bps |
| | | | | | | | | | | |
LTL 4 5 | | | | | | | | | | | |
| | | | | | | | | | | |
| Shipments per day | | | | | | | 18,783 | | | N/A | | N/A |
| Weight per shipment (pounds) | | | | | | | 1,098 | | | N/A | | N/A |
| Average length of haul (miles) | | | | | | | 522 | | | N/A | | N/A |
| Revenue per shipment | | | | | | | $ | 178.43 | | | N/A | | N/A |
| Revenue xFSR per shipment | | | | | | | $ | 150.70 | | | N/A | | N/A |
| Revenue per hundredweight | | | | | | | $ 16.25 | | | N/A | | N/A |
| Revenue xFSR per hundredweight | | | | | | | $ 13.73 | | | N/A | | N/A |
Average tractors 6 | | | | | | | 3,091 | | | N/A | | N/A |
Average trailers 7 | | | | | | | 8,302 | | | N/A | | N/A |
| | | | | | | | | | | |
| Intermodal | | | | | | | | | | | |
Average revenue per load 3 | | | | | | | $ | 3,465 | | | $ | 2,549 | | | 35.9 | % |
| Load count | | | | | | | 31,515 | | | 41,968 | | | (24.9 | %) |
| Average tractors | | | | | | | 584 | | | 597 | | | (2.2 | %) |
| Average containers | | | | | | | 11,027 | | | 10,846 | | | 1.7 | % |
| | | | | | | | | | | |
| | | | | | | | | | | |
| | | | | | | | | | | |
| | | | | | | | | | | |
| | | | | | | | | | | |
| | | | | | | | | | | |
| | | | | | | | | | | |
| | | | | | | | | | | |
| | | | | | | | | | | |
| | | | | | | | | | | |
| | | | | | | | | | | |
1Computed with revenue, excluding fuel surcharge and intersegment transactions
2Includes 7,561 trailers related to leasing activities recorded within our non-reportable operating segments for the first quarter of 2022. Does not include 5,764 trailers related to leasing activities recorded within our non-reportable operating segments for the first quarter of 2021.
3Computed with revenue, excluding intersegment transactions
4Operating statistics within the LTL segment exclude dedicated and other businesses
5Refer to Condensed Consolidated Statements of Comprehensive Income — footnote 1.
6Includes 695 tractors from ACT's and MME's dedicated and other businesses for the first quarter of 2022.
7Includes 907 trailers from ACT's and MME's dedicated and other businesses for the first quarter of 2022.
| | |
| Non-GAAP Financial Measures and Reconciliations |
The terms "Adjusted Net Income Attributable to Knight-Swift," "Adjusted Operating Income," "Adjusted EPS," "Adjusted Operating Ratio," and "Free Cash Flow," as we define them, are not presented in accordance with GAAP. These financial measures supplement our GAAP results in evaluating certain aspects of our business. We believe that using these measures improves comparability in analyzing our performance because they remove the impact of items from our operating results that, in our opinion, do not reflect our core operating performance. Management and the board of directors focus on Adjusted Net Income Attributable to Knight-Swift, Adjusted EPS, Adjusted Operating Income, and Adjusted Operating Ratio as key measures of our performance, all of which are reconciled to the most comparable GAAP financial measures and further discussed below. Management and the board of directors use Free Cash Flow as a key measure of our liquidity. Free Cash Flow does not represent residual cash flow available for discretionary expenditures. We believe our presentation of these non-GAAP financial measures is useful because it provides investors and securities analysts the same information that we use internally for purposes of assessing our core operating performance.
Adjusted Net Income Attributable to Knight-Swift, Adjusted Operating Income, Adjusted EPS, Adjusted Operating Ratio, and Free Cash Flow are not substitutes for their comparable GAAP financial measures, such as net income, cash flows from operating activities, operating margin, or other measures prescribed by GAAP. There are limitations to using non-GAAP financial measures. Although we believe that they improve comparability in analyzing our period to period performance, they could limit comparability to other companies in our industry if those companies define these measures differently. Because of these limitations, our non-GAAP financial measures should not be considered measures of income generated by our business or discretionary cash available to us to invest in the growth of our business. Management compensates for these limitations by primarily relying on GAAP results and using non-GAAP financial measures on a supplemental basis.
| | |
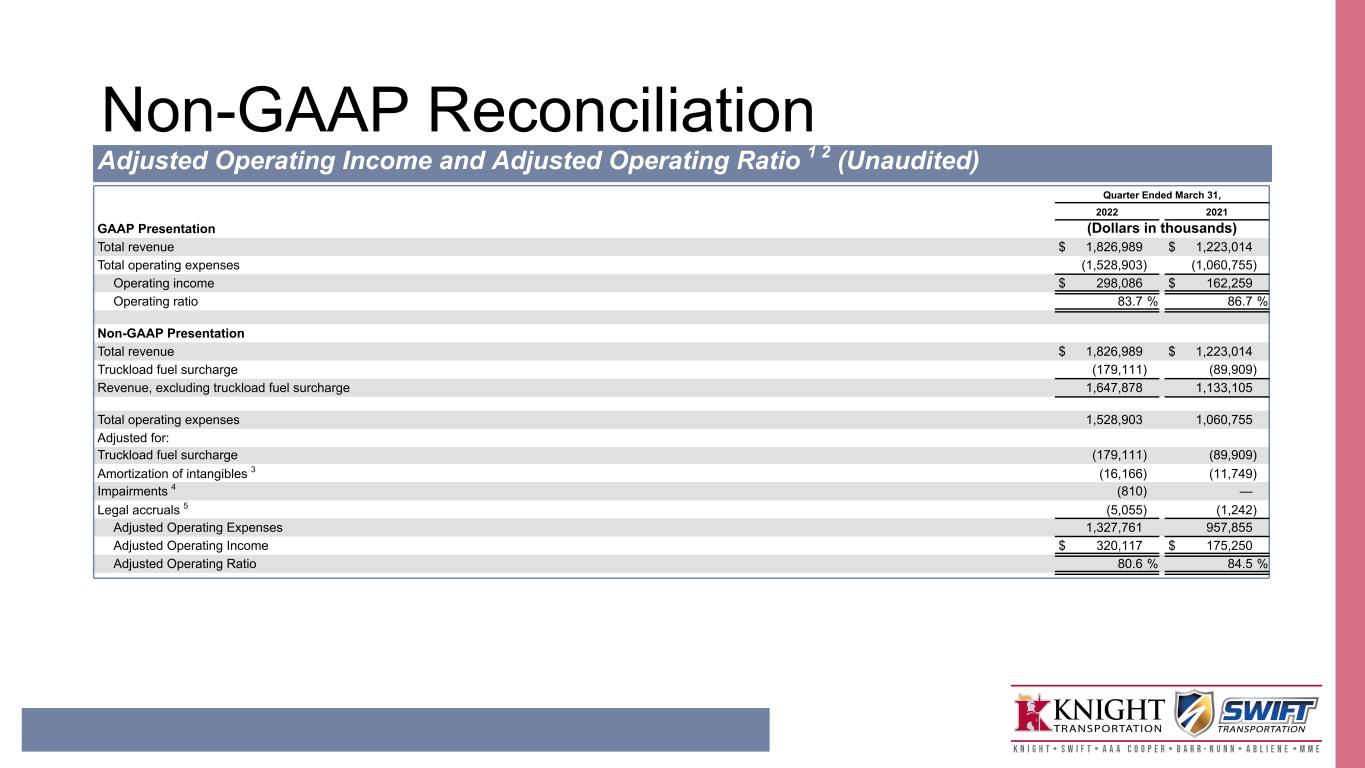
Non-GAAP Reconciliation (Unaudited): |
Adjusted Operating Income and Adjusted Operating Ratio 1 2 |
| | | | | | | | | | | | | | | |
| | | Quarter Ended March 31, |
| | | | | 2022 | | 2021 |
| GAAP Presentation | | | | | (Dollars in thousands) |
| Total revenue | | | | | $ | 1,826,989 | | | $ | 1,223,014 | |
| Total operating expenses | | | | | (1,528,903) | | | (1,060,755) | |
| Operating income | | | | | $ | 298,086 | | | $ | 162,259 | |
| Operating ratio | | | | | 83.7 | % | | 86.7 | % |
| | | | | | | |
| Non-GAAP Presentation | | | | | | | |
| Total revenue | | | | | $ | 1,826,989 | | | $ | 1,223,014 | |
| Truckload and LTL fuel surcharge | | | | | (179,111) | | | (89,909) | |
| Revenue, excluding truckload and LTL fuel surcharge | | | | | 1,647,878 | | | 1,133,105 | |
| | | | | | | |
| Total operating expenses | | | | | 1,528,903 | | | 1,060,755 | |
| Adjusted for: | | | | | | | |
| Truckload and LTL fuel surcharge | | | | | (179,111) | | | (89,909) | |
Amortization of intangibles 3 | | | | | (16,166) | | | (11,749) | |
| | | | | | | |
Impairments 4 | | | | | (810) | | | — | |
Legal accruals 5 | | | | | (5,055) | | | (1,242) | |
| | | | | | | |
| | | | | | | |
| | | | | | | |
| Adjusted Operating Expenses | | | | | 1,327,761 | | | 957,855 | |
| Adjusted Operating Income | | | | | $ | 320,117 | | | $ | 175,250 | |
| Adjusted Operating Ratio | | | | | 80.6 | % | | 84.5 | % |
| | | | | | | |
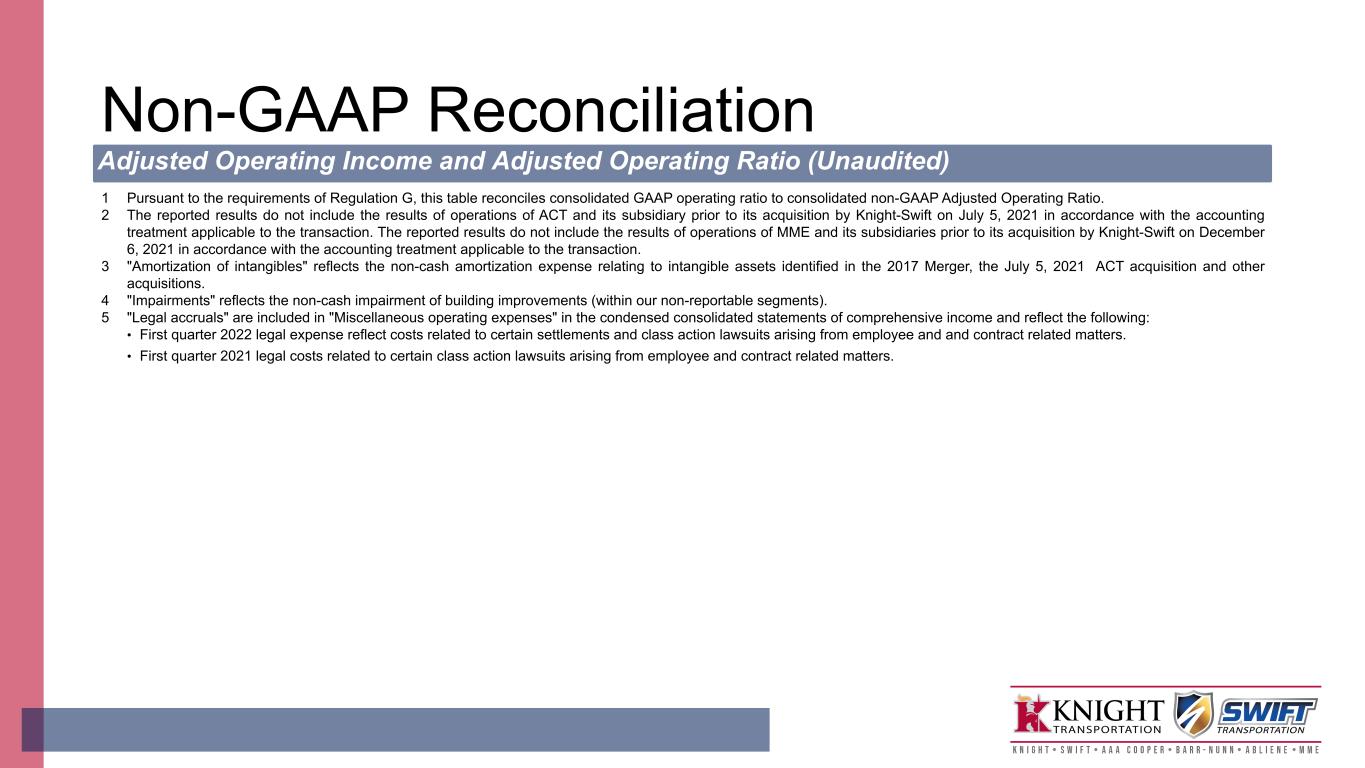
1 Pursuant to the requirements of Regulation G, this table reconciles consolidated GAAP operating ratio to consolidated non-GAAP Adjusted Operating Ratio.
2 Refer to Condensed Consolidated Statements of Comprehensive Income — footnote 1.
3 "Amortization of intangibles" reflects the non-cash amortization expense relating to intangible assets identified in the 2017 Merger, the July 5, 2021 ACT acquisition and other acquisitions.
4 "Impairments" reflects the non-cash impairment of building improvements (within our non-reportable segments).
5 "Legal accruals" are included in "Miscellaneous operating expenses" in the condensed consolidated statements of comprehensive income and reflect the following:
•First quarter 2022 legal expense reflect costs related to certain settlements and class action lawsuits arising from employee and and contract related matters.
•First quarter 2021 legal costs related to certain class action lawsuits arising from employee and contract related matters.
| | |
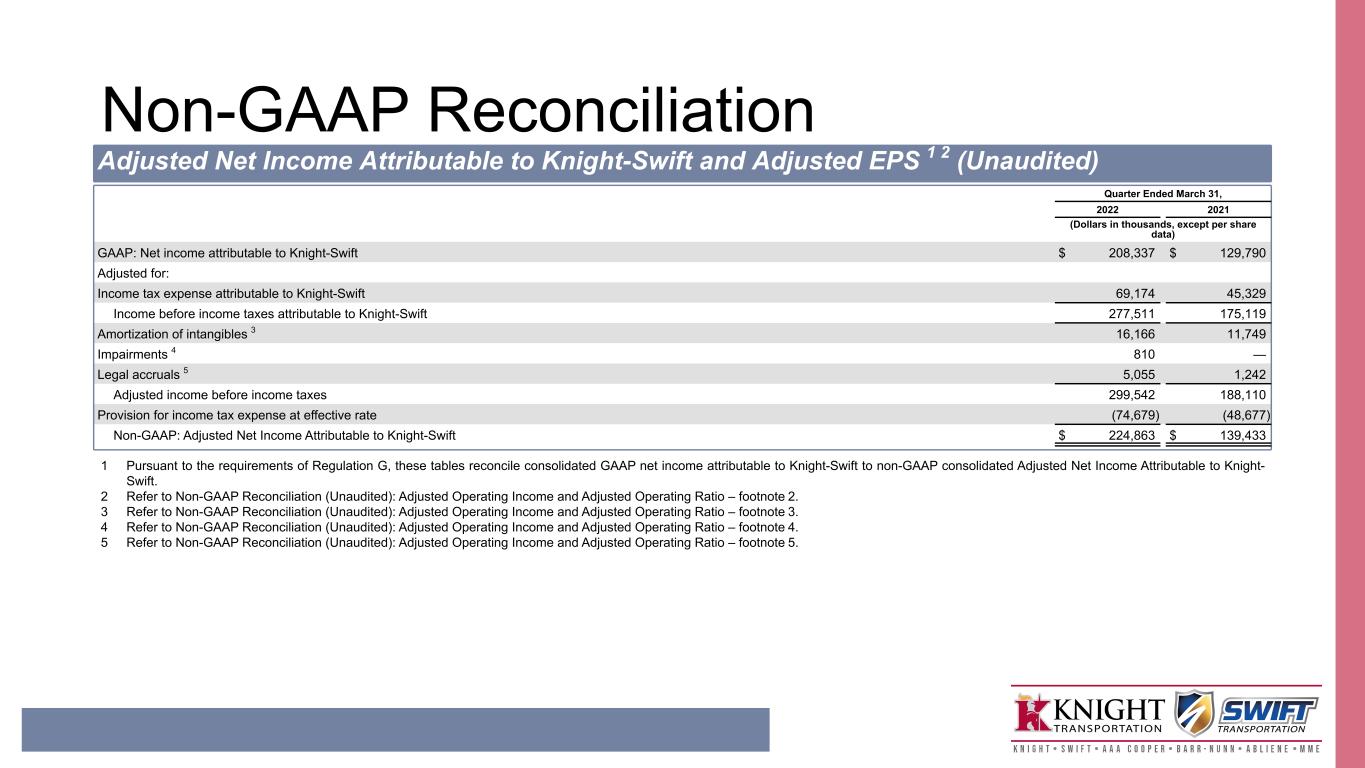
Non-GAAP Reconciliation (Unaudited): |
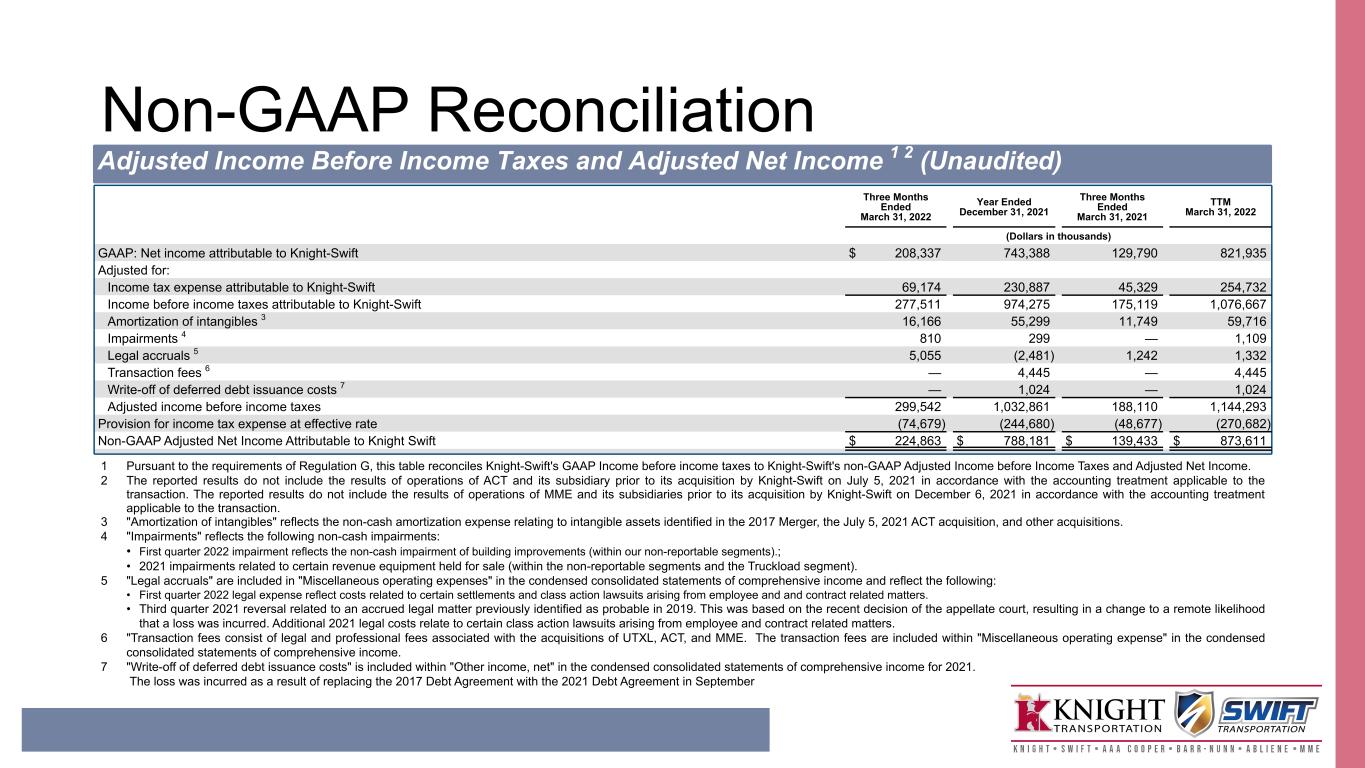
Adjusted Net Income Attributable to Knight-Swift and Adjusted EPS 1 2 |
| | | | | | | | | | | | | | | |
| | | Quarter Ended March 31, |
| | | | | 2022 | | 2021 |
| | | | | (Dollars in thousands, except per share data) |
| GAAP: Net income attributable to Knight-Swift | | | | | $ | 208,337 | | | $ | 129,790 | |
| Adjusted for: | | | | | | | |
| Income tax expense attributable to Knight-Swift | | | | | 69,174 | | | 45,329 | |
| Income before income taxes attributable to Knight-Swift | | | | | 277,511 | | | 175,119 | |
Amortization of intangibles 3 | | | | | 16,166 | | | 11,749 | |
| | | | | | | |
Impairments 4 | | | | | 810 | | | — | |
Legal accruals 5 | | | | | 5,055 | | | 1,242 | |
| | | | | | | |
| | | | | | | |
| | | | | | | |
| | | | | | | |
| Adjusted income before income taxes | | | | | 299,542 | | | 188,110 | |
| Provision for income tax expense at effective rate | | | | | (74,679) | | | (48,677) | |
| Non-GAAP: Adjusted Net Income Attributable to Knight-Swift | | | | | $ | 224,863 | | | $ | 139,433 | |
| | | | | | | |
Note: Because the numbers reflected in the table below are calculated on a per share basis, they may not foot due to rounding.
| | | | | | | | | | | | | | | |
| | | Quarter Ended March 31, |
| | | | | 2022 | | 2021 |
| GAAP: Earnings per diluted share | | | | | $ | 1.25 | | | $ | 0.77 | |
| Adjusted for: | | | | | | | |
| Income tax expense attributable to Knight-Swift | | | | | 0.42 | | | 0.27 | |
| Income before income taxes attributable to Knight-Swift | | | | | 1.67 | | | 1.04 | |
Amortization of intangibles 3 | | | | | 0.10 | | | 0.07 | |
| | | | | | | |
Impairments 4 | | | | | — | | | — | |
Legal accruals 5 | | | | | 0.03 | | | 0.01 | |
| | | | | | | |
| | | | | | | |
| | | | | | | |
| | | | | | | |
| Adjusted income before income taxes | | | | | 1.80 | | | 1.12 | |
| Provision for income tax expense at effective rate | | | | | (0.45) | | | (0.29) | |
| Non-GAAP: Adjusted EPS | | | | | $ | 1.35 | | | $ | 0.83 | |
| | | | | | | |
1Pursuant to the requirements of Regulation G, these tables reconcile consolidated GAAP net income attributable to Knight-Swift to non-GAAP consolidated Adjusted Net Income Attributable to Knight-Swift and consolidated GAAP diluted earnings per share to non-GAAP consolidated Adjusted EPS.
2Refer to Condensed Consolidated Statements of Comprehensive Income — footnote 1.
3Refer to Non-GAAP Reconciliation (Unaudited): Adjusted Operating Income and Adjusted Operating Ratio – footnote 3.
4Refer to Non-GAAP Reconciliation (Unaudited): Adjusted Operating Income and Adjusted Operating Ratio – footnote 4.
5Refer to Non-GAAP Reconciliation (Unaudited): Adjusted Operating Income and Adjusted Operating Ratio – footnote 5.
| | |
Non-GAAP Reconciliation (Unaudited): |
Segment Adjusted Operating Income and Adjusted Operating Ratio 1 |
| | | | | | | | | | | | | | | |
| | | Quarter Ended March 31, |
| Truckload Segment | | | | | 2022 | | 2021 |
| GAAP Presentation | | | | | (Dollars in thousands) |
| Total revenue | | | | | $ | 1,080,531 | | | $ | 962,947 | |
| Total operating expenses | | | | | (875,414) | | | (804,464) | |
| Operating income | | | | | $ | 205,117 | | | $ | 158,483 | |
| Operating ratio | | | | | 81.0 | % | | 83.5 | % |
| Non-GAAP Presentation | | | | | | | |
| Total revenue | | | | | $ | 1,080,531 | | | $ | 962,947 | |
| Fuel surcharge | | | | | (138,661) | | | (89,909) | |
| Intersegment transactions | | | | | (336) | | | (224) | |
| Revenue, excluding fuel surcharge and intersegment transactions | | | | | 941,534 | | | 872,814 | |
| | | | | | | |
| Total operating expenses | | | | | 875,414 | | | 804,464 | |
| Adjusted for: | | | | | | | |
| Fuel surcharge | | | | | (138,661) | | | (89,909) | |
| Intersegment transactions | | | | | (336) | | | (224) | |
Amortization of intangibles 2 | | | | | (324) | | | (324) | |
| | | | | | | |
| | | | | | | |
| | | | | | | |
| | | | | | | |
| | | | | | | |
| Adjusted Operating Expenses | | | | | 736,093 | | | 714,007 | |
| Adjusted Operating Income | | | | | $ | 205,441 | | | $ | 158,807 | |
| Adjusted Operating Ratio | | | | | 78.2 | % | | 81.8 | % |
| | | | | | | |
1 Pursuant to the requirements of Regulation G, this table reconciles GAAP operating ratio to non-GAAP Adjusted Operating Ratio.
2"Amortization of intangibles" reflects the non-cash amortization expense relating to intangible assets identified in historical Knight acquisitions.
| | |
Non-GAAP Reconciliation (Unaudited): |
Segment Adjusted Operating Income and Adjusted Operating Ratio — Continued 1 |
| | | | | | | | | | | | | | | |
| | | Quarter Ended March 31, |
| Logistics Segment | | | | | 2022 | | 2021 |
| GAAP Presentation | | | | | (Dollars in thousands) |
| Total revenue | | | | | $ | 282,039 | | | $ | 118,887 | |
| Total operating expenses | | | | | (242,438) | | | (111,310) | |
| Operating income | | | | | $ | 39,601 | | | $ | 7,577 | |
| Operating ratio | | | | | 86.0 | % | | 93.6 | % |
| Non-GAAP Presentation | | | | | |
| Total revenue | | | | | $ | 282,039 | | | $ | 118,887 | |
| | | | | | | |
| Intersegment transactions | | | | | (1,868) | | | (3,165) | |
| Revenue, excluding intersegment transactions | | | | | 280,171 | | | 115,722 | |
| | | | | | | |
| Total operating expenses | | | | | 242,438 | | | 111,310 | |
| Adjusted for: | | | | | | | |
| | | | | | | |
| Intersegment transactions | | | | | (1,868) | | | (3,165) | |
Amortization of intangibles 2 | | | | | (334) | | | — | |
| | | | | | | |
| | | | | | | |
| Adjusted Operating Expenses | | | | | 240,236 | | | 108,145 | |
| Adjusted Operating Income | | | | | $ | 39,935 | | | $ | 7,577 | |
| Adjusted Operating Ratio | | | | | 85.7 | % | | 93.5 | % |
| | | | | | | |
| | | | | | | | | | | |
| | | |
LTL Segment 3 | | | Quarter Ended March 31, 2022 | | |
| GAAP Presentation | | | | | (Dollars in thousands) | | |
| Total revenue | | | | | $ | 255,125 | | | |
| Total operating expenses | | | | | (228,748) | | | |
| Operating income | | | | | $ | 26,377 | | | |
| Operating ratio | | | | | 89.7 | % | | |
| Non-GAAP Presentation | | | | | | | |
| Total revenue | | | | | $ | 255,125 | | | |
| Fuel surcharge | | | | | (40,450) | | | |
| | | | | | | |
| Revenue, excluding fuel surcharge | | | | | 214,675 | | | |
| | | | | | | |
| Total operating expenses | | | | | 228,748 | | | |
| Adjusted for: | | | | | | | |
| Fuel surcharge | | | | | (40,450) | | | |
| | | | | | | |
Amortization of intangibles 4 | | | | | (3,945) | | | |
| | | | | | | |
| | | | | | | |
| | | | | | | |
| | | | | | | |
| | | | | | | |
| Adjusted Operating Expenses | | | | | 184,353 | | | |
| Adjusted Operating Income | | | | | $ | 30,322 | | | |
| Adjusted Operating Ratio | | | | | 85.9 | % | | |
| | | | | | | |
1Pursuant to the requirements of Regulation G, this table reconciles GAAP operating ratio to non-GAAP Adjusted Operating Ratio.
2"Amortization of intangibles" reflects the non-cash amortization expense relating to intangible assets identified in the UTXL acquisition.
3Refer to Condensed Consolidated Statements of Comprehensive Income — footnote 1.
4"Amortization of intangibles" reflects the non-cash amortization expense relating to intangible assets identified in the ACT and MME acquisitions.
| | |
Non-GAAP Reconciliation (Unaudited): |
Segment Adjusted Operating Income and Adjusted Operating Ratio — Continued 1 |
| | | | | | | | | | | | | | | |
| | | Quarter Ended March 31, |
| Intermodal Segment | | | | | 2022 | | 2021 |
| GAAP Presentation | | | | | (Dollars in thousands) |
| Total revenue | | | | | $ | 109,222 | | | $ | 107,066 | |
| Total operating expenses | | | | | (94,052) | | | (103,609) | |
| Operating income | | | | | $ | 15,170 | | | $ | 3,457 | |
| Operating ratio | | | | | 86.1 | % | | 96.8 | % |
| Non-GAAP Presentation | | | | | |
| Total revenue | | | | | $ | 109,222 | | | $ | 107,066 | |
| Intersegment transactions | | | | | (30) | | | (95) | |
| Revenue, excluding intersegment transactions | | | | | 109,192 | | | 106,971 | |
| | | | | | | |
| Total operating expenses | | | | | 94,052 | | | 103,609 | |
| Adjusted for: | | | | | | | |
| Intersegment transactions | | | | | (30) | | | (95) | |
| | | | | | | |
| | | | | | | |
| | | | | | | |
| Adjusted Operating Expenses | | | | | 94,022 | | | 103,514 | |
| Adjusted Operating Income | | | | | $ | 15,170 | | | $ | 3,457 | |
| Adjusted Operating Ratio | | | | | 86.1 | % | | 96.8 | % |
| | | | | | | |
| | |
Non-GAAP Reconciliation (Unaudited): |
Free Cash Flow 2 |
| | | | | |
| Quarter Ended March 31, 2022 |
| |
| GAAP: Cash flows from operations | $ | 456,860 | |
| Adjusted for: | |
| Proceeds from sale of property and equipment, including assets held for sale | 60,532 | |
| Purchases of property and equipment | (164,974) | |
| Non-GAAP: Free cash flow | $ | 352,418 | |
| |
1Pursuant to the requirements of Regulation G, this table reconciles GAAP operating ratio to non-GAAP Adjusted Operating Ratio.
2Pursuant to the requirements of Regulation G, this table reconciles GAAP cash flows from operations to non-GAAP Free Cash Flow.