Exhibit 99.2 Q2 2020 Results Presentation August 18, 2020Exhibit 99.2 Q2 2020 Results Presentation August 18, 2020
Cautionary Statement Regarding Forward-Looking Information This presentation contains forward-looking statements within the meaning of the Private Securities Litigation Reform Act of 1995. Words such as believes, anticipates, plans, may, intends, will, should, expects, and similar expressions are intended to identify forward-looking statements. Forward-looking statements include, but are not limited to, comments about Kohl's future financial plans, capital generation, management and deployment strategies, adequacy of capital resources and the competitive environment, including statements related to the ongoing implications of the novel coronavirus (COVID-19). Such statements are subject to certain risks and uncertainties, which could cause Kohl's actual results to differ materially from those anticipated by the forward-looking statements. These risks and uncertainties include, but are not limited to, those described in Item 1A in Kohl's Annual Report on Form 10-K and in Item 1A of Part II in Kohl’s Quarterly Report on Form 10-Q for the quarter ended May 2, 2020, which are expressly incorporated herein by reference, and other factors as may periodically be described in Kohl's filings with the SEC. Forward-looking statements speak as of the date they are made, and Kohl’s undertakes no obligation to update them. Non-GAAP Financial Measures In addition, this presentation contains non-GAAP financial measures, including Adjusted EPS, Adjusted Net Income, Adjusted EBITDA, and Free Cash Flow. Reconciliations of all non-GAAP measures to the most directly comparable GAAP measures are included in the Appendix of this presentation. 2Cautionary Statement Regarding Forward-Looking Information This presentation contains forward-looking statements within the meaning of the Private Securities Litigation Reform Act of 1995. Words such as believes, anticipates, plans, may, intends, will, should, expects, and similar expressions are intended to identify forward-looking statements. Forward-looking statements include, but are not limited to, comments about Kohl's future financial plans, capital generation, management and deployment strategies, adequacy of capital resources and the competitive environment, including statements related to the ongoing implications of the novel coronavirus (COVID-19). Such statements are subject to certain risks and uncertainties, which could cause Kohl's actual results to differ materially from those anticipated by the forward-looking statements. These risks and uncertainties include, but are not limited to, those described in Item 1A in Kohl's Annual Report on Form 10-K and in Item 1A of Part II in Kohl’s Quarterly Report on Form 10-Q for the quarter ended May 2, 2020, which are expressly incorporated herein by reference, and other factors as may periodically be described in Kohl's filings with the SEC. Forward-looking statements speak as of the date they are made, and Kohl’s undertakes no obligation to update them. Non-GAAP Financial Measures In addition, this presentation contains non-GAAP financial measures, including Adjusted EPS, Adjusted Net Income, Adjusted EBITDA, and Free Cash Flow. Reconciliations of all non-GAAP measures to the most directly comparable GAAP measures are included in the Appendix of this presentation. 2
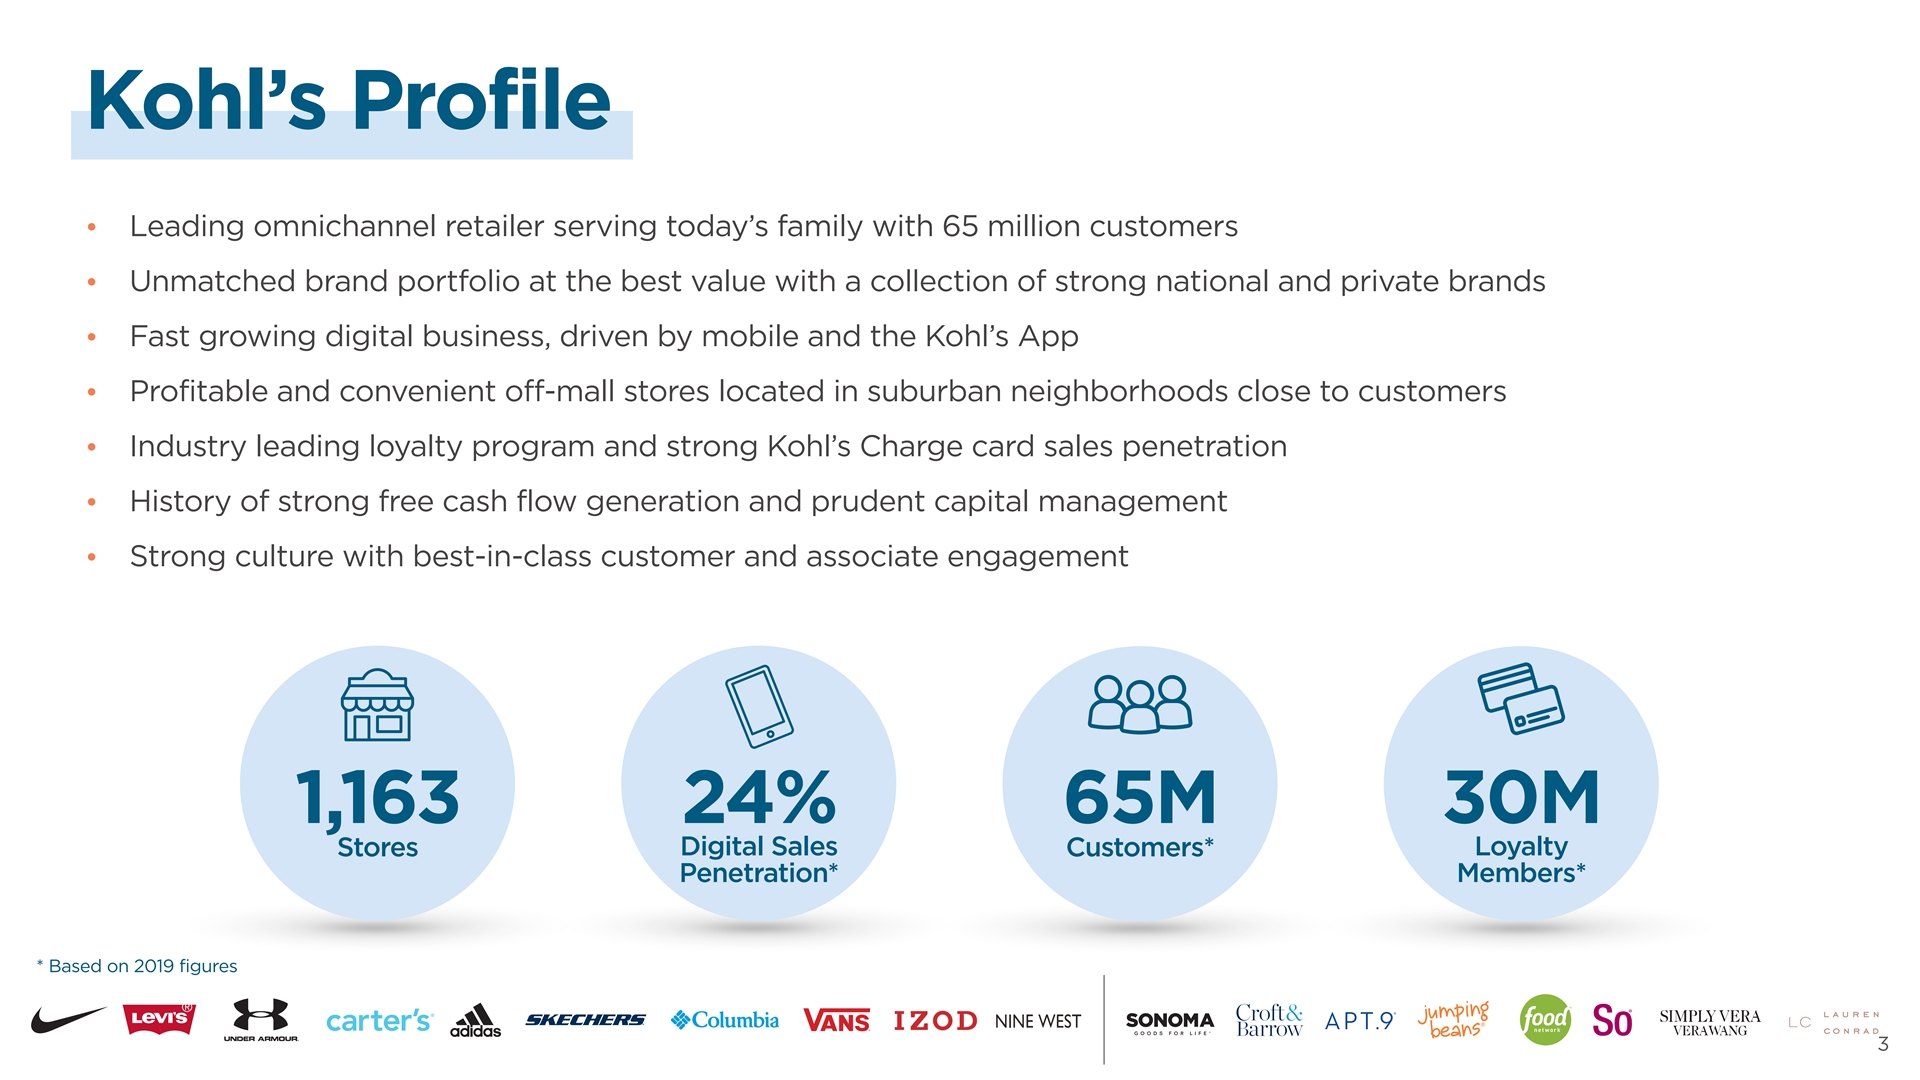
Kohl’s Profile Leading omnichannel retailer serving today’s family with 65 million customers • Unmatched brand portfolio at the best value with a collection of strong national and private brands • Fast growing digital business, driven by mobile and the Kohl’s App • Profitable and convenient off-mall stores located in suburban neighborhoods close to customers • Industry leading loyalty program and strong Kohl’s Charge card sales penetration • History of strong free cash flow generation and prudent capital management • Strong culture with best-in-class customer and associate engagement • 1,163 24% 65M 30M Digital Sales Loyalty Stores Customers* Penetration* Members* * Based on 2019 figures 3Kohl’s Profile Leading omnichannel retailer serving today’s family with 65 million customers • Unmatched brand portfolio at the best value with a collection of strong national and private brands • Fast growing digital business, driven by mobile and the Kohl’s App • Profitable and convenient off-mall stores located in suburban neighborhoods close to customers • Industry leading loyalty program and strong Kohl’s Charge card sales penetration • History of strong free cash flow generation and prudent capital management • Strong culture with best-in-class customer and associate engagement • 1,163 24% 65M 30M Digital Sales Loyalty Stores Customers* Penetration* Members* * Based on 2019 figures 3
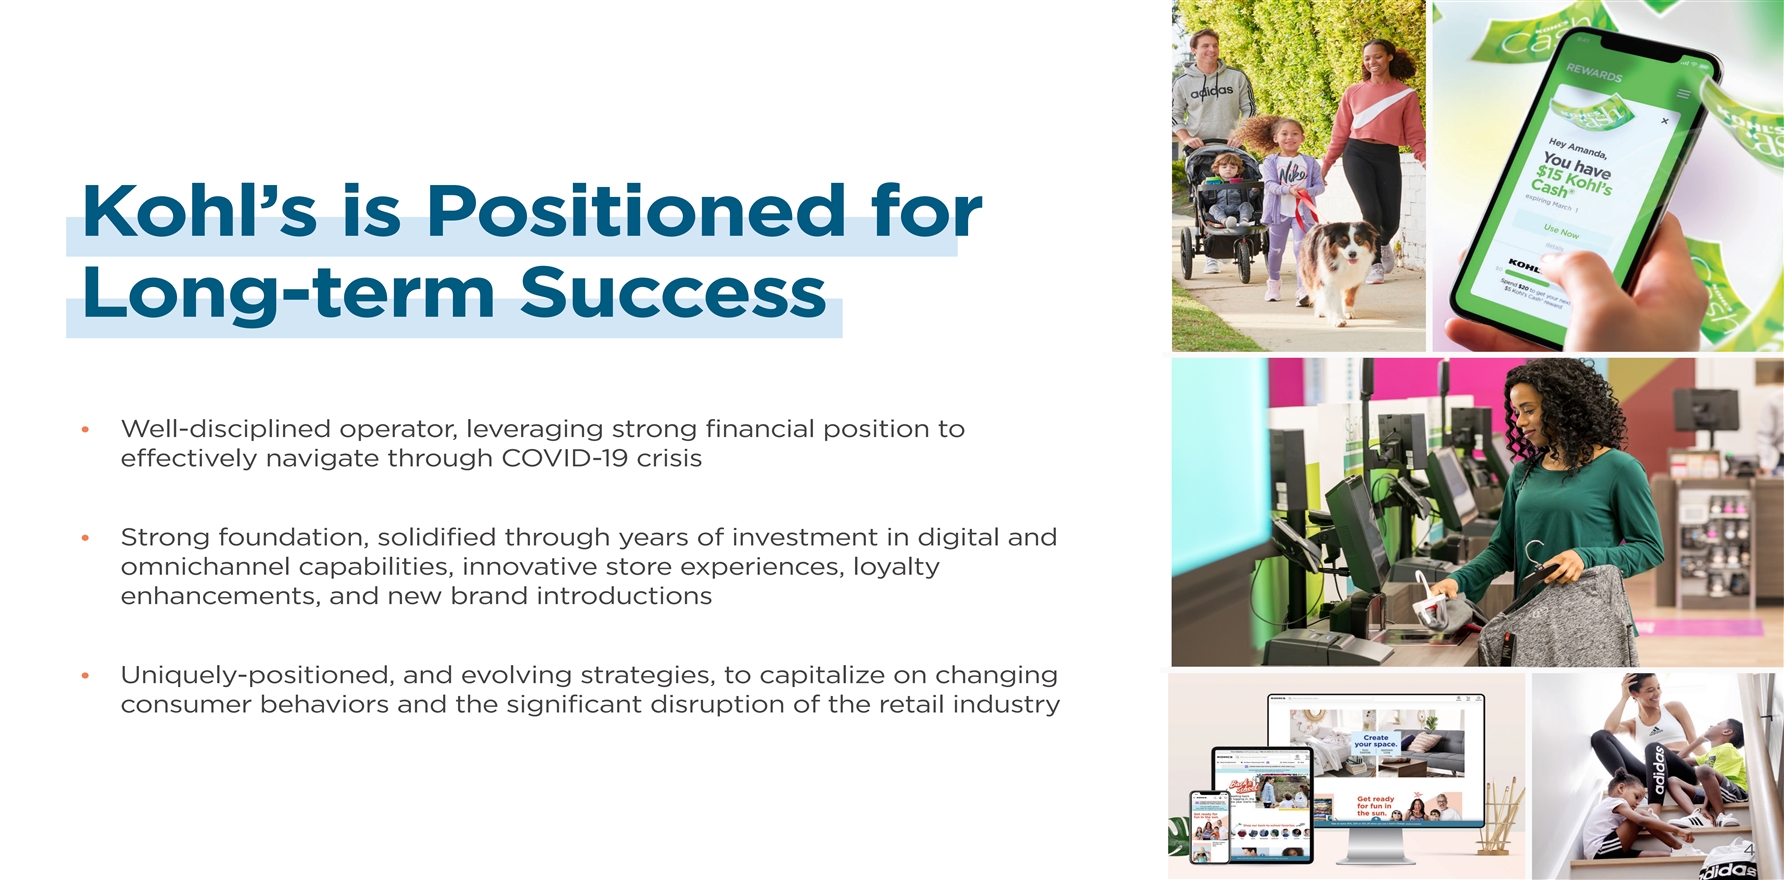
Kohl’s is Positioned for Long-term Success Well-disciplined operator, leveraging strong financial position to • effectively navigate through COVID-19 crisis Strong foundation, solidified through years of investment in digital and • omnichannel capabilities, innovative store experiences, loyalty enhancements, and new brand introductions Uniquely-positioned, and evolving strategies, to capitalize on changing • consumer behaviors and the significant disruption of the retail industry 4Kohl’s is Positioned for Long-term Success Well-disciplined operator, leveraging strong financial position to • effectively navigate through COVID-19 crisis Strong foundation, solidified through years of investment in digital and • omnichannel capabilities, innovative store experiences, loyalty enhancements, and new brand introductions Uniquely-positioned, and evolving strategies, to capitalize on changing • consumer behaviors and the significant disruption of the retail industry 4
Q2 2020 Results Presentation COVID-19 Update 1 Q2 2020 Results 2 2H 2020 Outlook & Initiatives 3 5Q2 2020 Results Presentation COVID-19 Update 1 Q2 2020 Results 2 2H 2020 Outlook & Initiatives 3 5

COVID-19 Update 6COVID-19 Update 6

Our Top Priorities Protecting the Preserving our health and financial safety of our position associates and customers 7Our Top Priorities Protecting the Preserving our health and financial safety of our position associates and customers 7
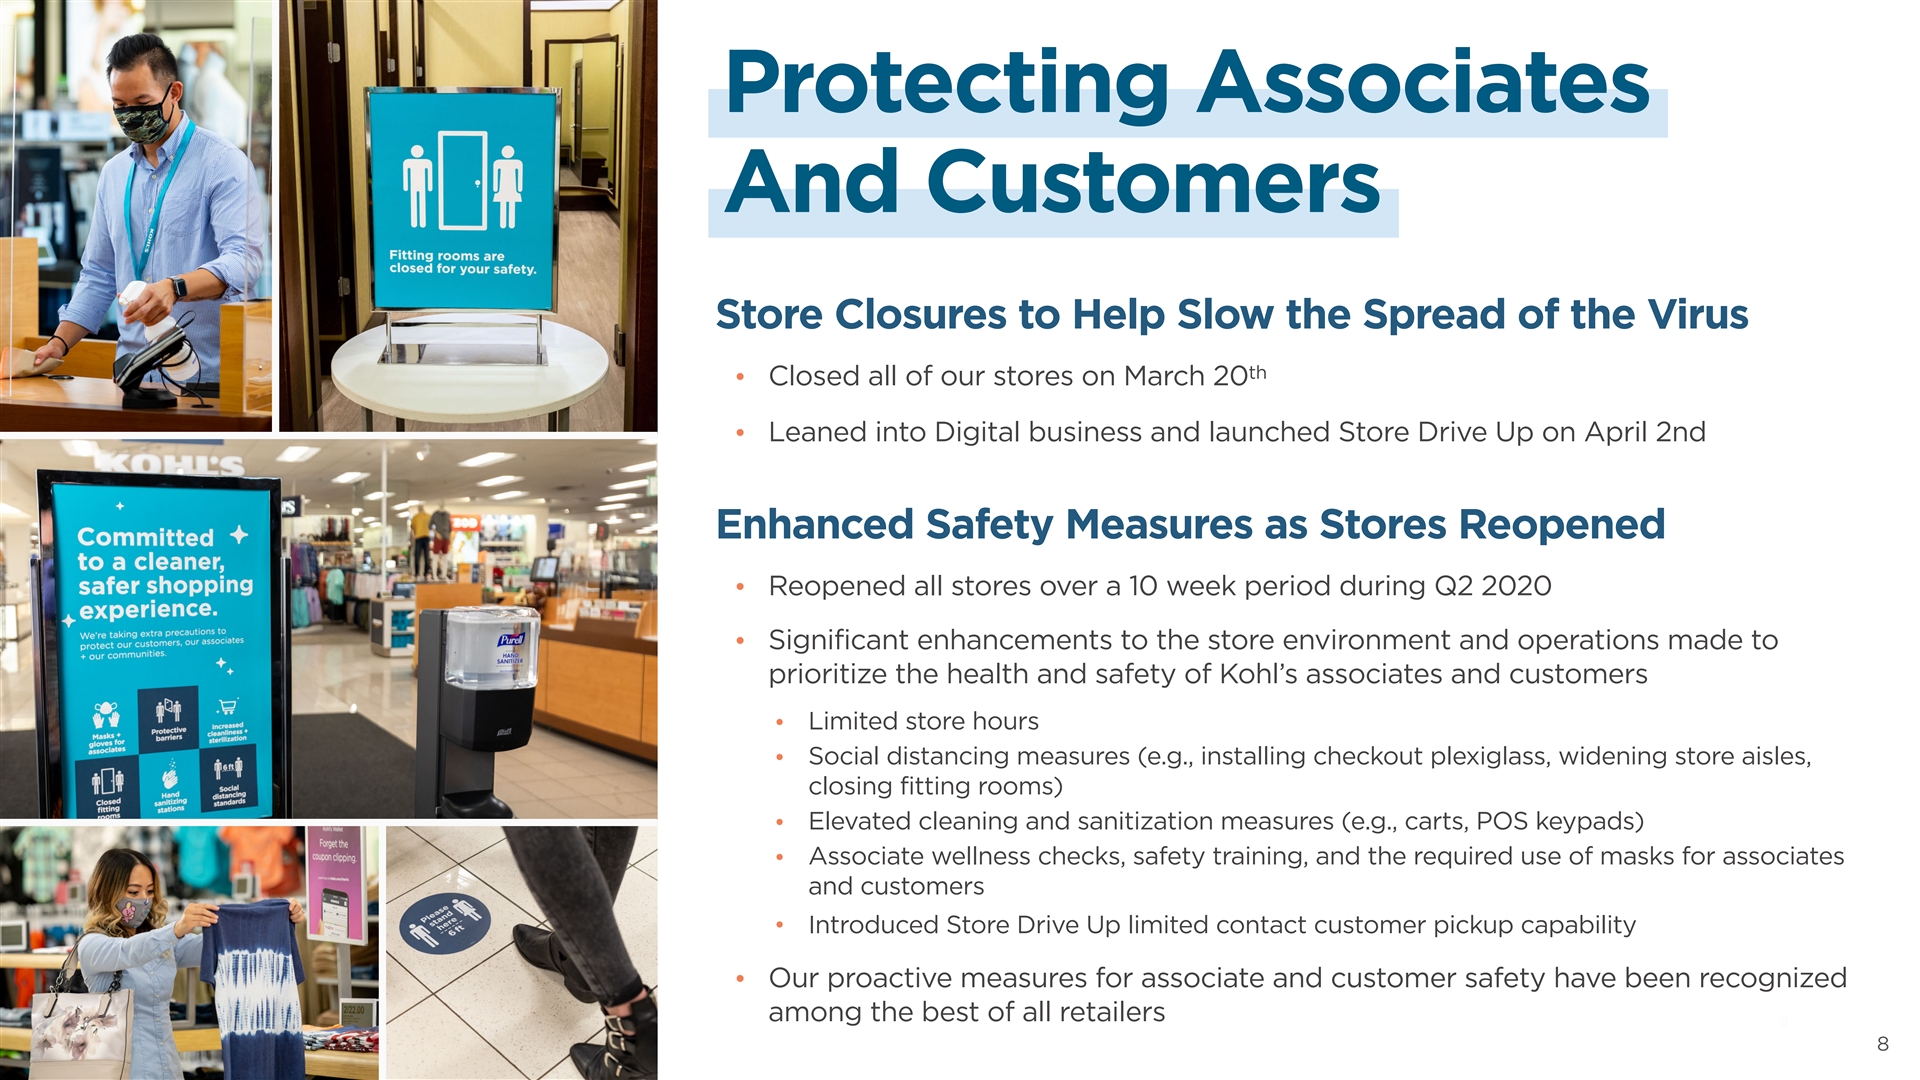
Protecting Associates And Customers Store Closures to Help Slow the Spread of the Virus th Closed all of our stores on March 20 • Leaned into Digital business and launched Store Drive Up on April 2nd • Enhanced Safety Measures as Stores Reopened Reopened all stores over a 10 week period during Q2 2020 • Significant enhancements to the store environment and operations made to • prioritize the health and safety of Kohl’s associates and customers Limited store hours • Social distancing measures (e.g., installing checkout plexiglass, widening store aisles, • closing fitting rooms) Elevated cleaning and sanitization measures (e.g., carts, POS keypads) • Associate wellness checks, safety training, and the required use of masks for associates • and customers • Introduced Store Drive Up limited contact customer pickup capability Our proactive measures for associate and customer safety have been recognized • among the best of all retailers 8 8Protecting Associates And Customers Store Closures to Help Slow the Spread of the Virus th Closed all of our stores on March 20 • Leaned into Digital business and launched Store Drive Up on April 2nd • Enhanced Safety Measures as Stores Reopened Reopened all stores over a 10 week period during Q2 2020 • Significant enhancements to the store environment and operations made to • prioritize the health and safety of Kohl’s associates and customers Limited store hours • Social distancing measures (e.g., installing checkout plexiglass, widening store aisles, • closing fitting rooms) Elevated cleaning and sanitization measures (e.g., carts, POS keypads) • Associate wellness checks, safety training, and the required use of masks for associates • and customers • Introduced Store Drive Up limited contact customer pickup capability Our proactive measures for associate and customer safety have been recognized • among the best of all retailers 8 8
Preserving Financial Position Enhanced site functionality, personalization, and shopability • Drive More efficient Digital marketing (e.g., digital search, media buying) • Digital Sales Store Drive Up continues to resonate with customers • Inventory: 26% reduction in Q2 2020 • SG&A: 17% decline in Q2 2020 • Reduced Capex: 55% reduction year-to-date 2020 • Cash Dividend: Suspended beginning in Q2 2020 • Outflow Share repurchases: Suspended • Revolver: Replaced, securitized, and upsized to $1.5 billion in Q1 2020 • Increased New Debt: Issued $600 million notes due 2025 in Q1 2020 • Financial Sale-leaseback: Completed sale of two facilities for $193 million in Q2 2020 • Liquidity 9Preserving Financial Position Enhanced site functionality, personalization, and shopability • Drive More efficient Digital marketing (e.g., digital search, media buying) • Digital Sales Store Drive Up continues to resonate with customers • Inventory: 26% reduction in Q2 2020 • SG&A: 17% decline in Q2 2020 • Reduced Capex: 55% reduction year-to-date 2020 • Cash Dividend: Suspended beginning in Q2 2020 • Outflow Share repurchases: Suspended • Revolver: Replaced, securitized, and upsized to $1.5 billion in Q1 2020 • Increased New Debt: Issued $600 million notes due 2025 in Q1 2020 • Financial Sale-leaseback: Completed sale of two facilities for $193 million in Q2 2020 • Liquidity 9
Q2 2020 Results 10Q2 2020 Results 10
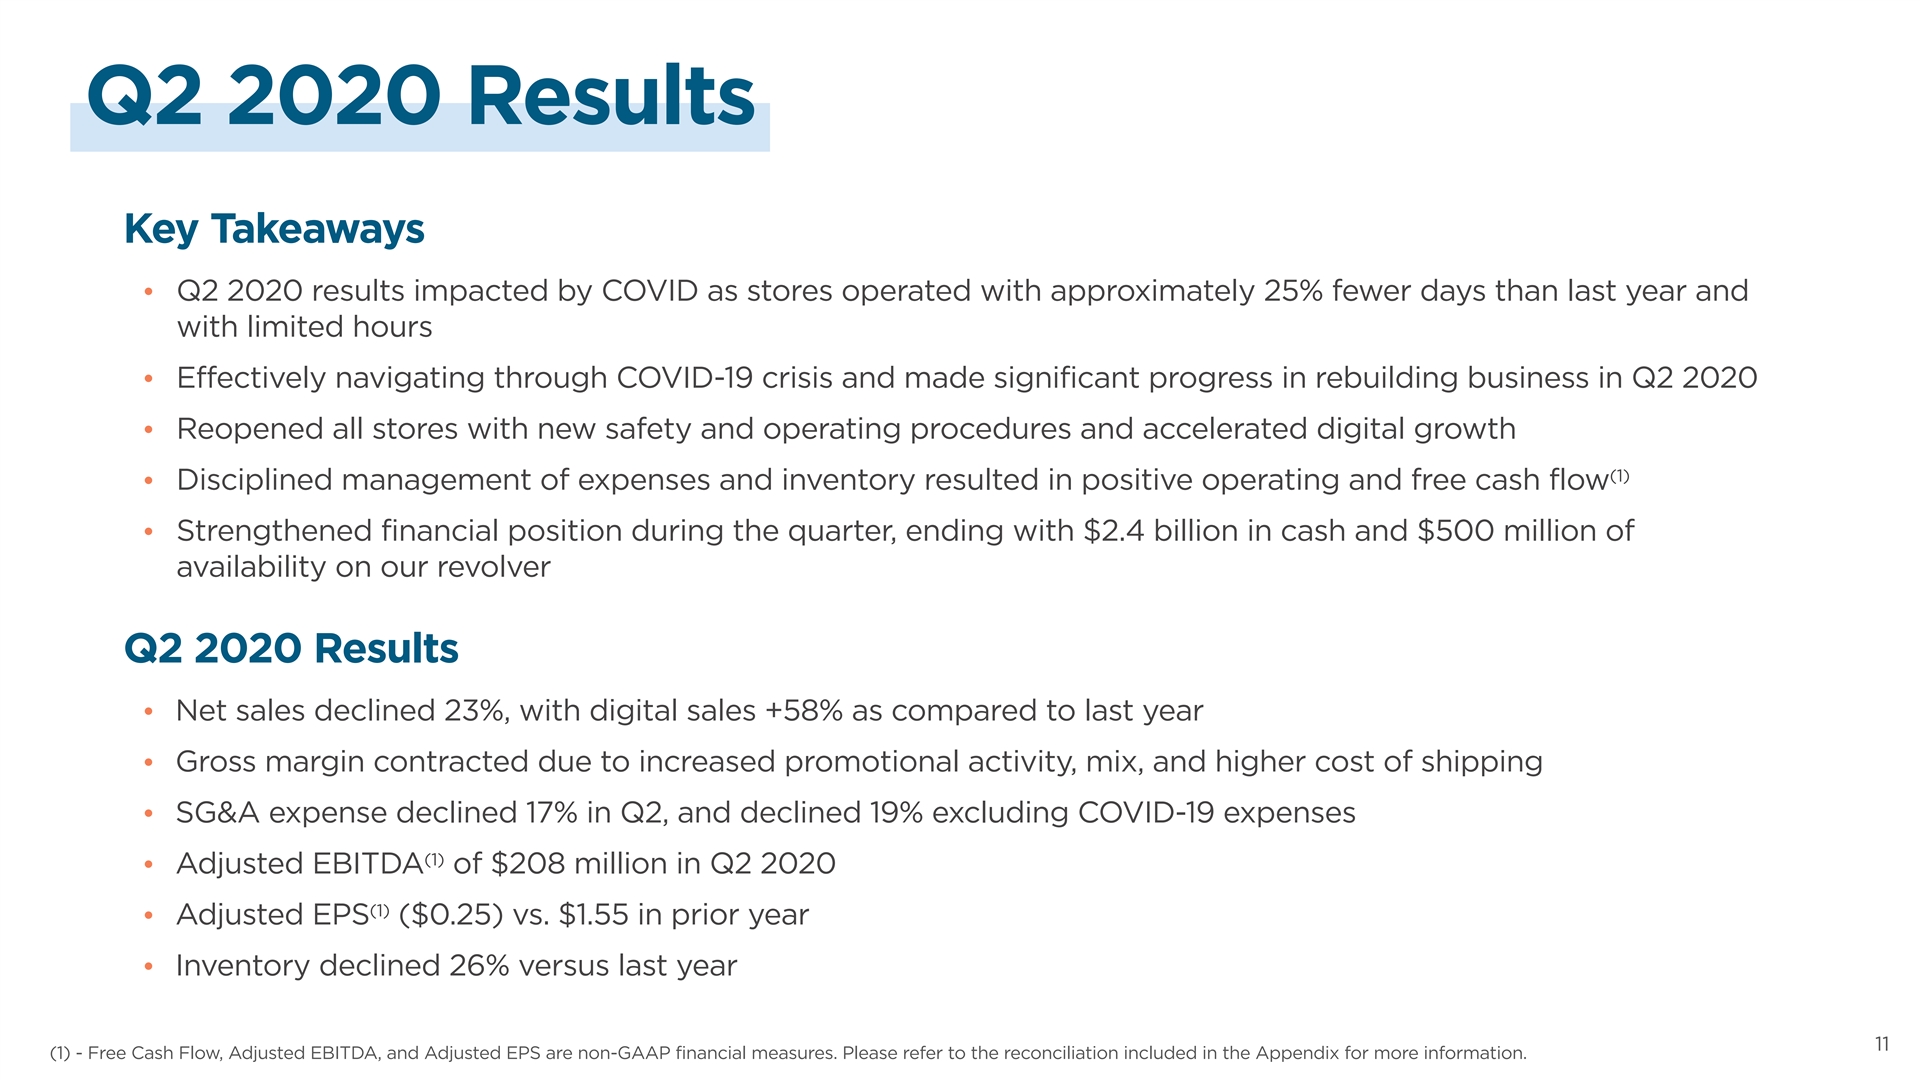
Q2 2020 Results Key Takeaways Q2 2020 results impacted by COVID as stores operated with approximately 25% fewer days than last year and • with limited hours Effectively navigating through COVID-19 crisis and made significant progress in rebuilding business in Q2 2020 • Reopened all stores with new safety and operating procedures and accelerated digital growth • (1) Disciplined management of expenses and inventory resulted in positive operating and free cash flow • Strengthened financial position during the quarter, ending with $2.4 billion in cash and $500 million of • availability on our revolver Q2 2020 Results Net sales declined 23%, with digital sales +58% as compared to last year • Gross margin contracted due to increased promotional activity, mix, and higher cost of shipping • SG&A expense declined 17% in Q2, and declined 19% excluding COVID-19 expenses • (1) Adjusted EBITDA of $208 million in Q2 2020 • (1) Adjusted EPS ($0.25) vs. $1.55 in prior year • Inventory declined 26% versus last year • 11 11 (1) - Free Cash Flow, Adjusted EBITDA, and Adjusted EPS are non-GAAP financial measures. Please refer to the reconciliation included in the Appendix for more information. Q2 2020 Results Key Takeaways Q2 2020 results impacted by COVID as stores operated with approximately 25% fewer days than last year and • with limited hours Effectively navigating through COVID-19 crisis and made significant progress in rebuilding business in Q2 2020 • Reopened all stores with new safety and operating procedures and accelerated digital growth • (1) Disciplined management of expenses and inventory resulted in positive operating and free cash flow • Strengthened financial position during the quarter, ending with $2.4 billion in cash and $500 million of • availability on our revolver Q2 2020 Results Net sales declined 23%, with digital sales +58% as compared to last year • Gross margin contracted due to increased promotional activity, mix, and higher cost of shipping • SG&A expense declined 17% in Q2, and declined 19% excluding COVID-19 expenses • (1) Adjusted EBITDA of $208 million in Q2 2020 • (1) Adjusted EPS ($0.25) vs. $1.55 in prior year • Inventory declined 26% versus last year • 11 11 (1) - Free Cash Flow, Adjusted EBITDA, and Adjusted EPS are non-GAAP financial measures. Please refer to the reconciliation included in the Appendix for more information.
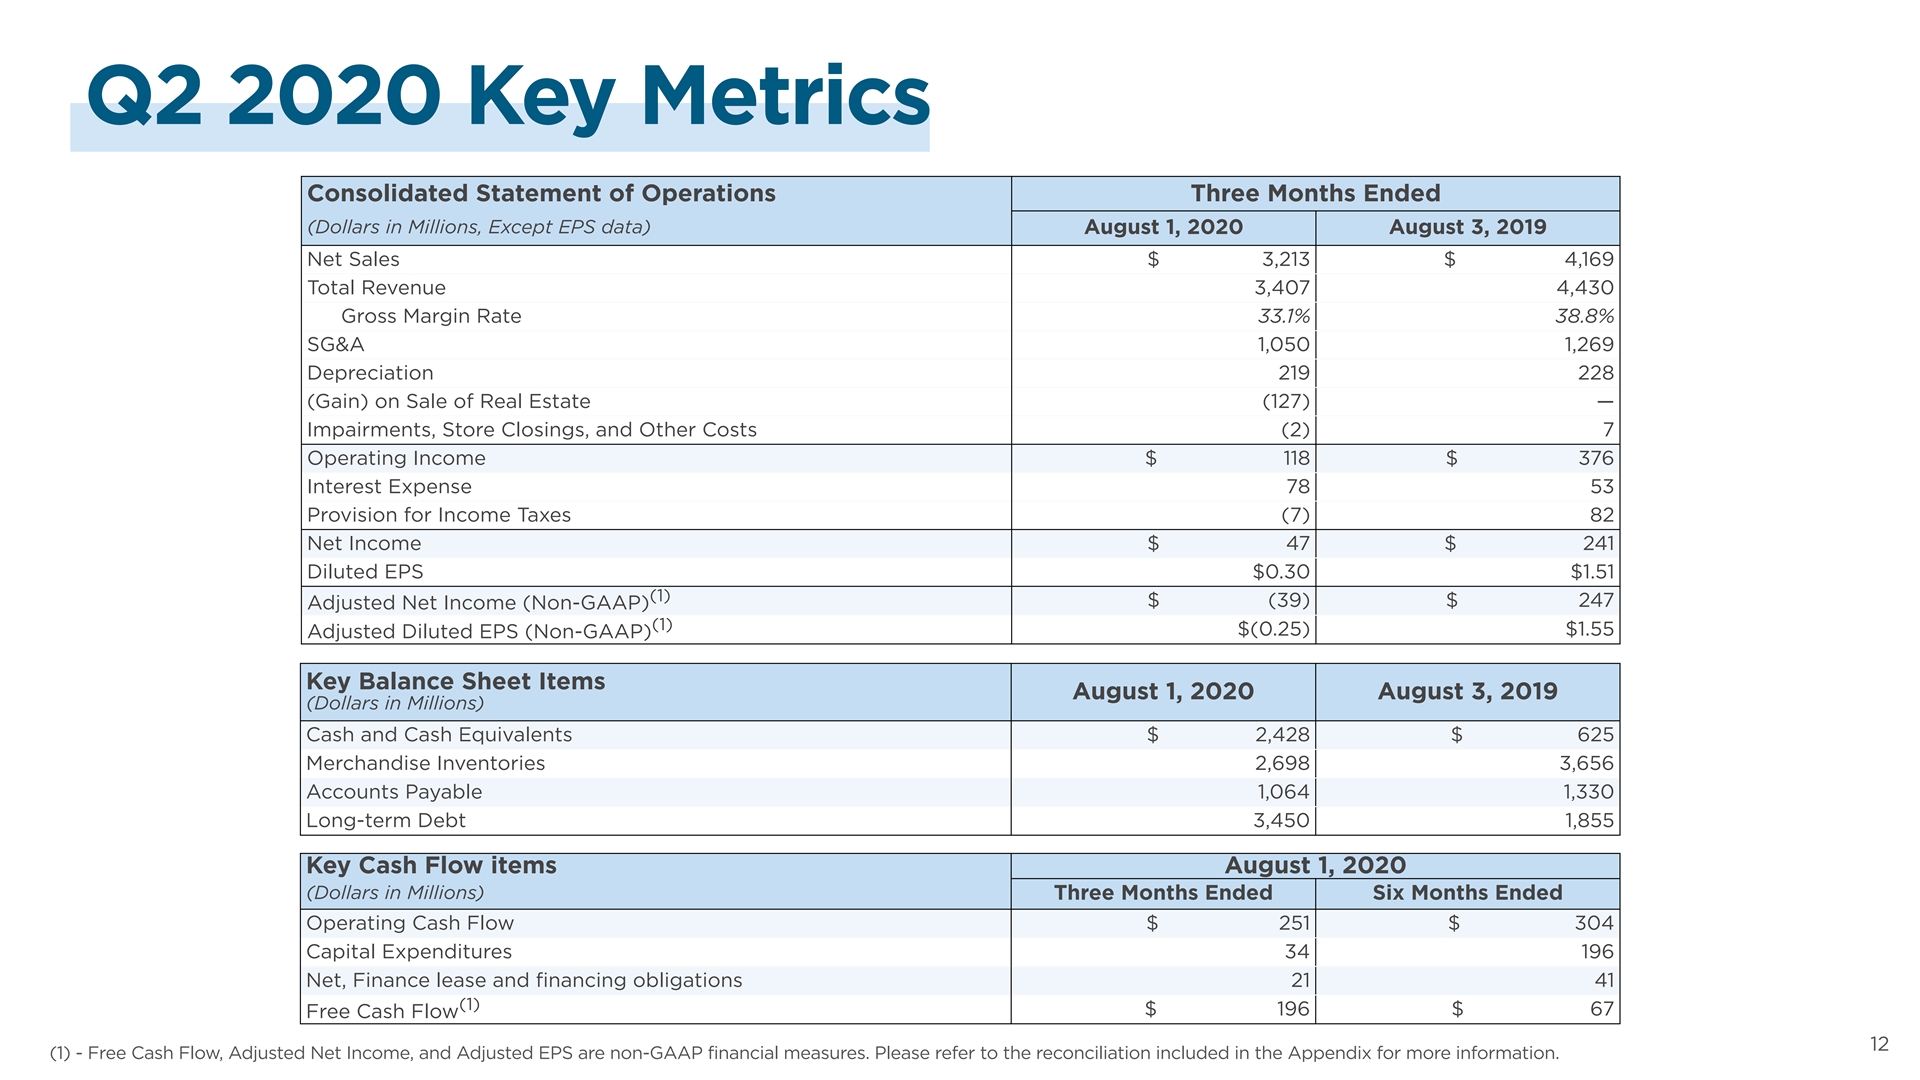
Q2 2020 Key Metrics Consolidated Statement of Operations Three Months Ended (Dollars in Millions, Except EPS data) August 1, 2020 August 3, 2019 Net Sales $ 3,213 $ 4,169 Total Revenue 3,407 4,430 Gross Margin Rate 33.1% 38.8% SG&A 1,050 1,269 Depreciation 219 228 (Gain) on Sale of Real Estate (127) — Impairments, Store Closings, and Other Costs (2) 7 Operating Income $ 118 $ 376 Interest Expense 78 53 Provision for Income Taxes (7) 82 Net Income $ 47 $ 241 Diluted EPS $0.30 $1.51 (1) $ (39) $ 247 Adjusted Net Income (Non-GAAP) (1) $(0.25) $1.55 Adjusted Diluted EPS (Non-GAAP) Key Balance Sheet Items August 1, 2020 August 3, 2019 (Dollars in Millions) Cash and Cash Equivalents $ 2,428 $ 625 Merchandise Inventories 2,698 3,656 Accounts Payable 1,064 1,330 Long-term Debt 3,450 1,855 Key Cash Flow items August 1, 2020 (Dollars in Millions) Three Months Ended Six Months Ended Operating Cash Flow $ 251 $ 304 Capital Expenditures 34 196 Net, Finance lease and financing obligations 21 41 (1) $ 196 $ 67 Free Cash Flow 12 12 12 (1) - Free Cash Flow, Adjusted Net Income, and Adjusted EPS are non-GAAP financial measures. Please refer to the reconciliation included in the Appendix for more information. Q2 2020 Key Metrics Consolidated Statement of Operations Three Months Ended (Dollars in Millions, Except EPS data) August 1, 2020 August 3, 2019 Net Sales $ 3,213 $ 4,169 Total Revenue 3,407 4,430 Gross Margin Rate 33.1% 38.8% SG&A 1,050 1,269 Depreciation 219 228 (Gain) on Sale of Real Estate (127) — Impairments, Store Closings, and Other Costs (2) 7 Operating Income $ 118 $ 376 Interest Expense 78 53 Provision for Income Taxes (7) 82 Net Income $ 47 $ 241 Diluted EPS $0.30 $1.51 (1) $ (39) $ 247 Adjusted Net Income (Non-GAAP) (1) $(0.25) $1.55 Adjusted Diluted EPS (Non-GAAP) Key Balance Sheet Items August 1, 2020 August 3, 2019 (Dollars in Millions) Cash and Cash Equivalents $ 2,428 $ 625 Merchandise Inventories 2,698 3,656 Accounts Payable 1,064 1,330 Long-term Debt 3,450 1,855 Key Cash Flow items August 1, 2020 (Dollars in Millions) Three Months Ended Six Months Ended Operating Cash Flow $ 251 $ 304 Capital Expenditures 34 196 Net, Finance lease and financing obligations 21 41 (1) $ 196 $ 67 Free Cash Flow 12 12 12 (1) - Free Cash Flow, Adjusted Net Income, and Adjusted EPS are non-GAAP financial measures. Please refer to the reconciliation included in the Appendix for more information.
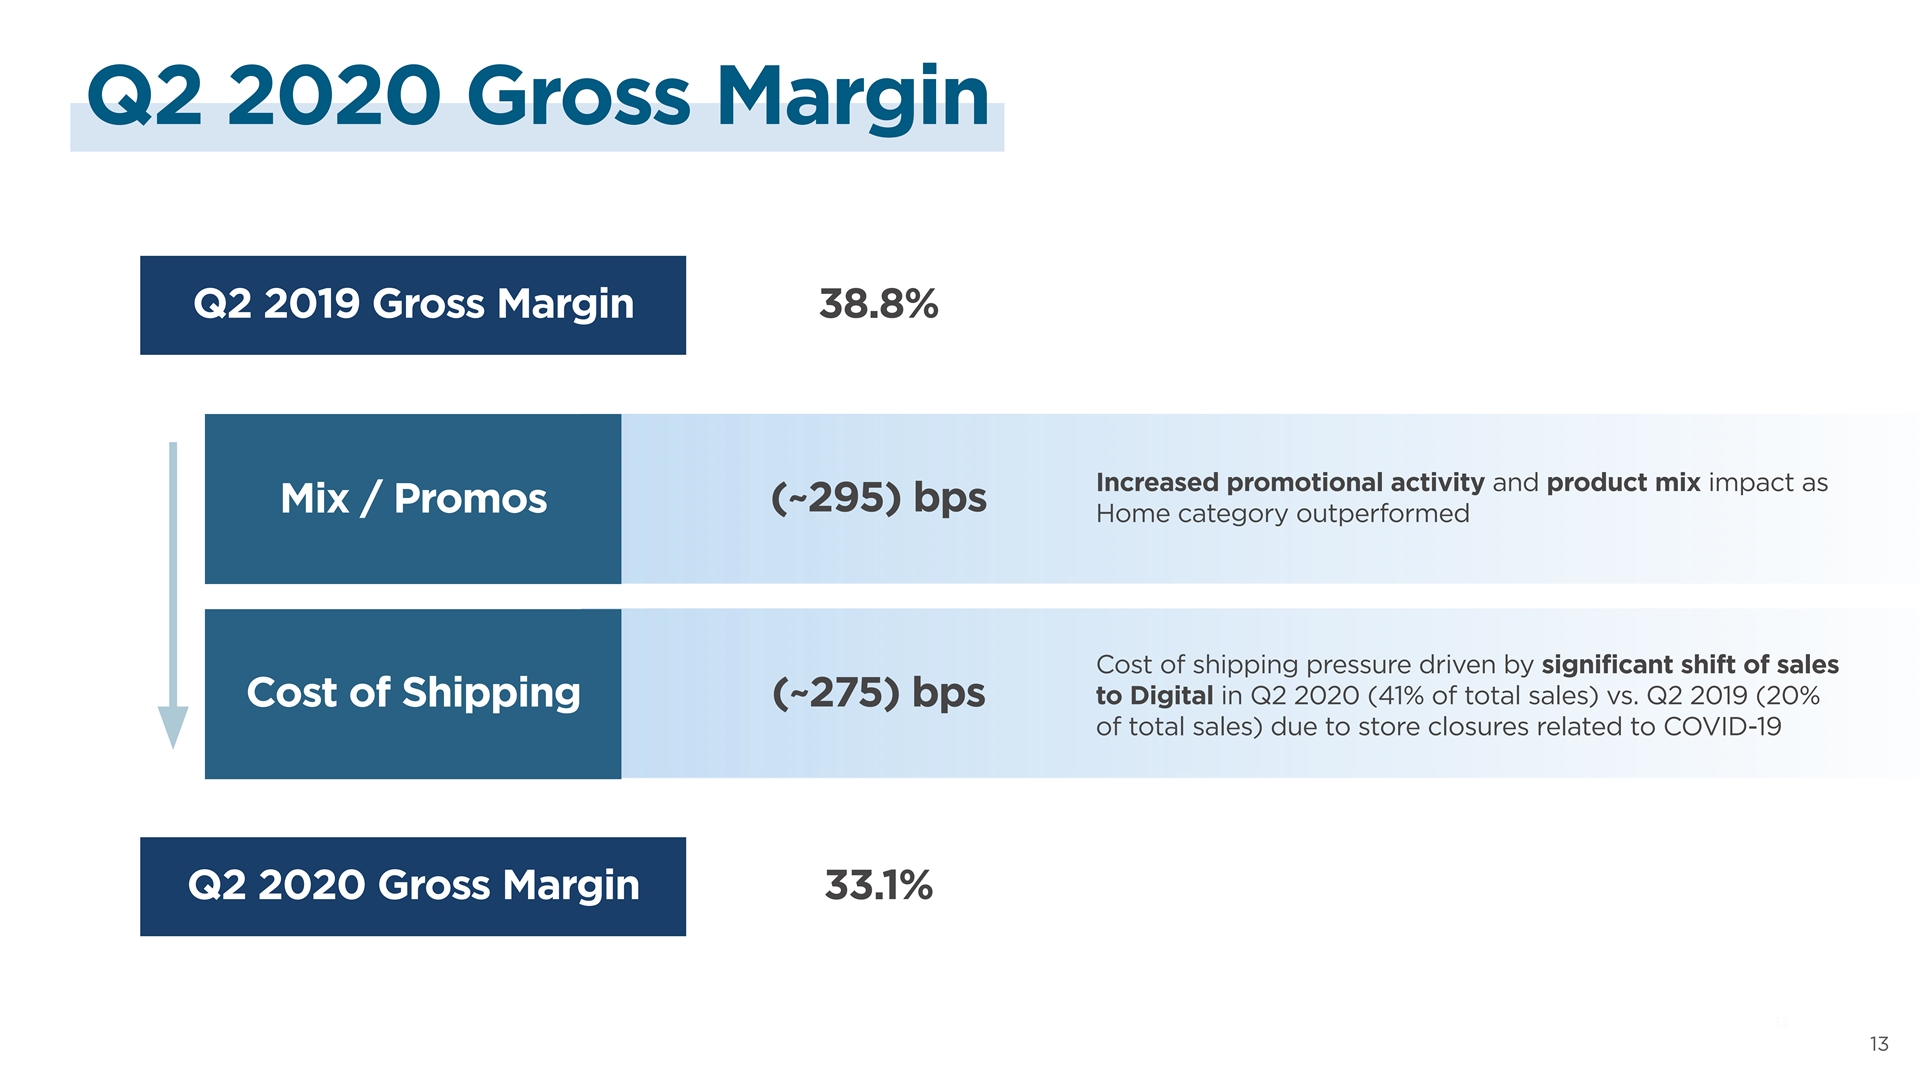
Q2 2020 Gross Margin Q2 2019 Gross Margin 38.8% Increased promotional activity and product mix impact as (~295) bps Mix / Promos Home category outperformed Cost of shipping pressure driven by significant shift of sales to Digital in Q2 2020 (41% of total sales) vs. Q2 2019 (20% Cost of Shipping (~275) bps of total sales) due to store closures related to COVID-19 Q2 2020 Gross Margin 33.1% 13 13Q2 2020 Gross Margin Q2 2019 Gross Margin 38.8% Increased promotional activity and product mix impact as (~295) bps Mix / Promos Home category outperformed Cost of shipping pressure driven by significant shift of sales to Digital in Q2 2020 (41% of total sales) vs. Q2 2019 (20% Cost of Shipping (~275) bps of total sales) due to store closures related to COVID-19 Q2 2020 Gross Margin 33.1% 13 13
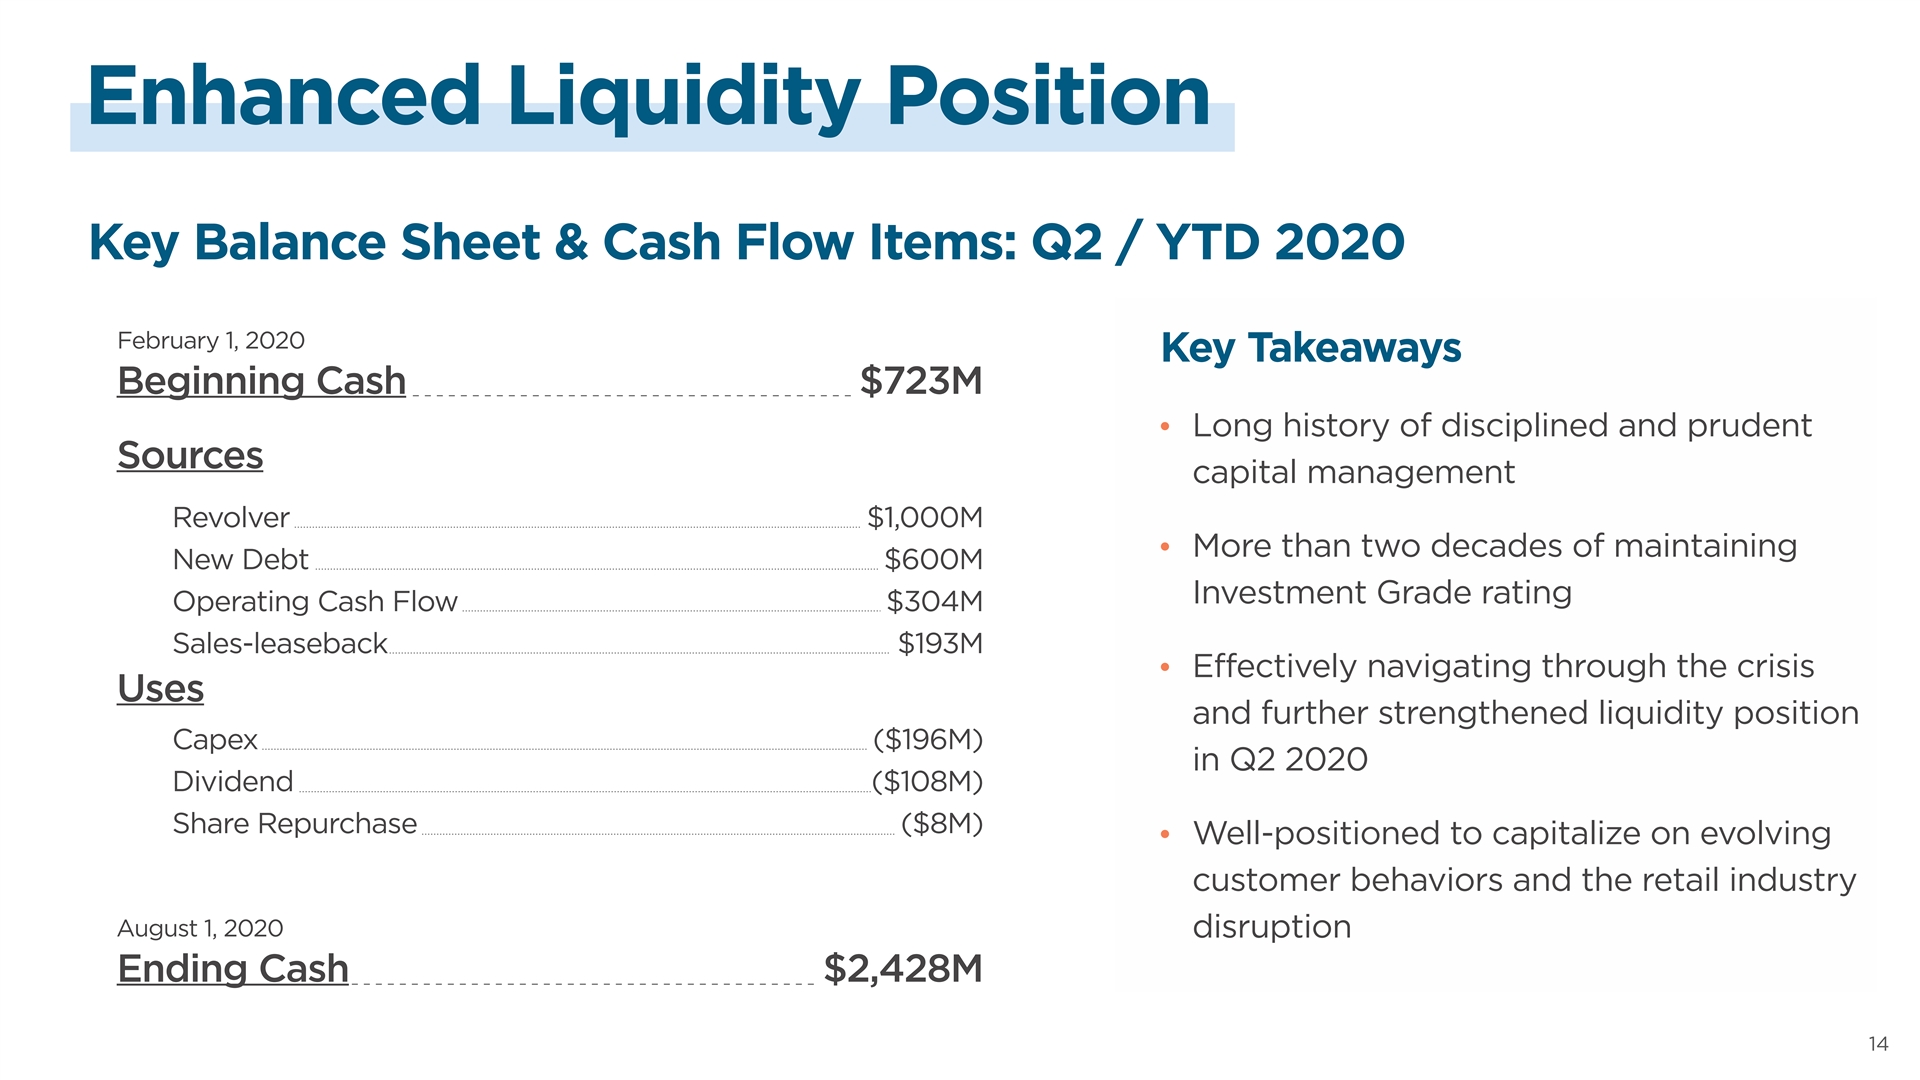
Enhanced Liquidity Position Key Balance Sheet & Cash Flow Items: Q2 / YTD 2020 February 1, 2020 Key Takeaways Beginning Cash $723M Long history of disciplined and prudent • Sources capital management Revolver $1,000M More than two decades of maintaining • New Debt $600M Investment Grade rating Operating Cash Flow $304M Sales-leaseback $193M Effectively navigating through the crisis • Uses and further strengthened liquidity position Capex ($196M) in Q2 2020 Dividend ($108M) Share Repurchase ($8M) Well-positioned to capitalize on evolving • customer behaviors and the retail industry August 1, 2020 disruption Ending Cash $2,428M 14Enhanced Liquidity Position Key Balance Sheet & Cash Flow Items: Q2 / YTD 2020 February 1, 2020 Key Takeaways Beginning Cash $723M Long history of disciplined and prudent • Sources capital management Revolver $1,000M More than two decades of maintaining • New Debt $600M Investment Grade rating Operating Cash Flow $304M Sales-leaseback $193M Effectively navigating through the crisis • Uses and further strengthened liquidity position Capex ($196M) in Q2 2020 Dividend ($108M) Share Repurchase ($8M) Well-positioned to capitalize on evolving • customer behaviors and the retail industry August 1, 2020 disruption Ending Cash $2,428M 14
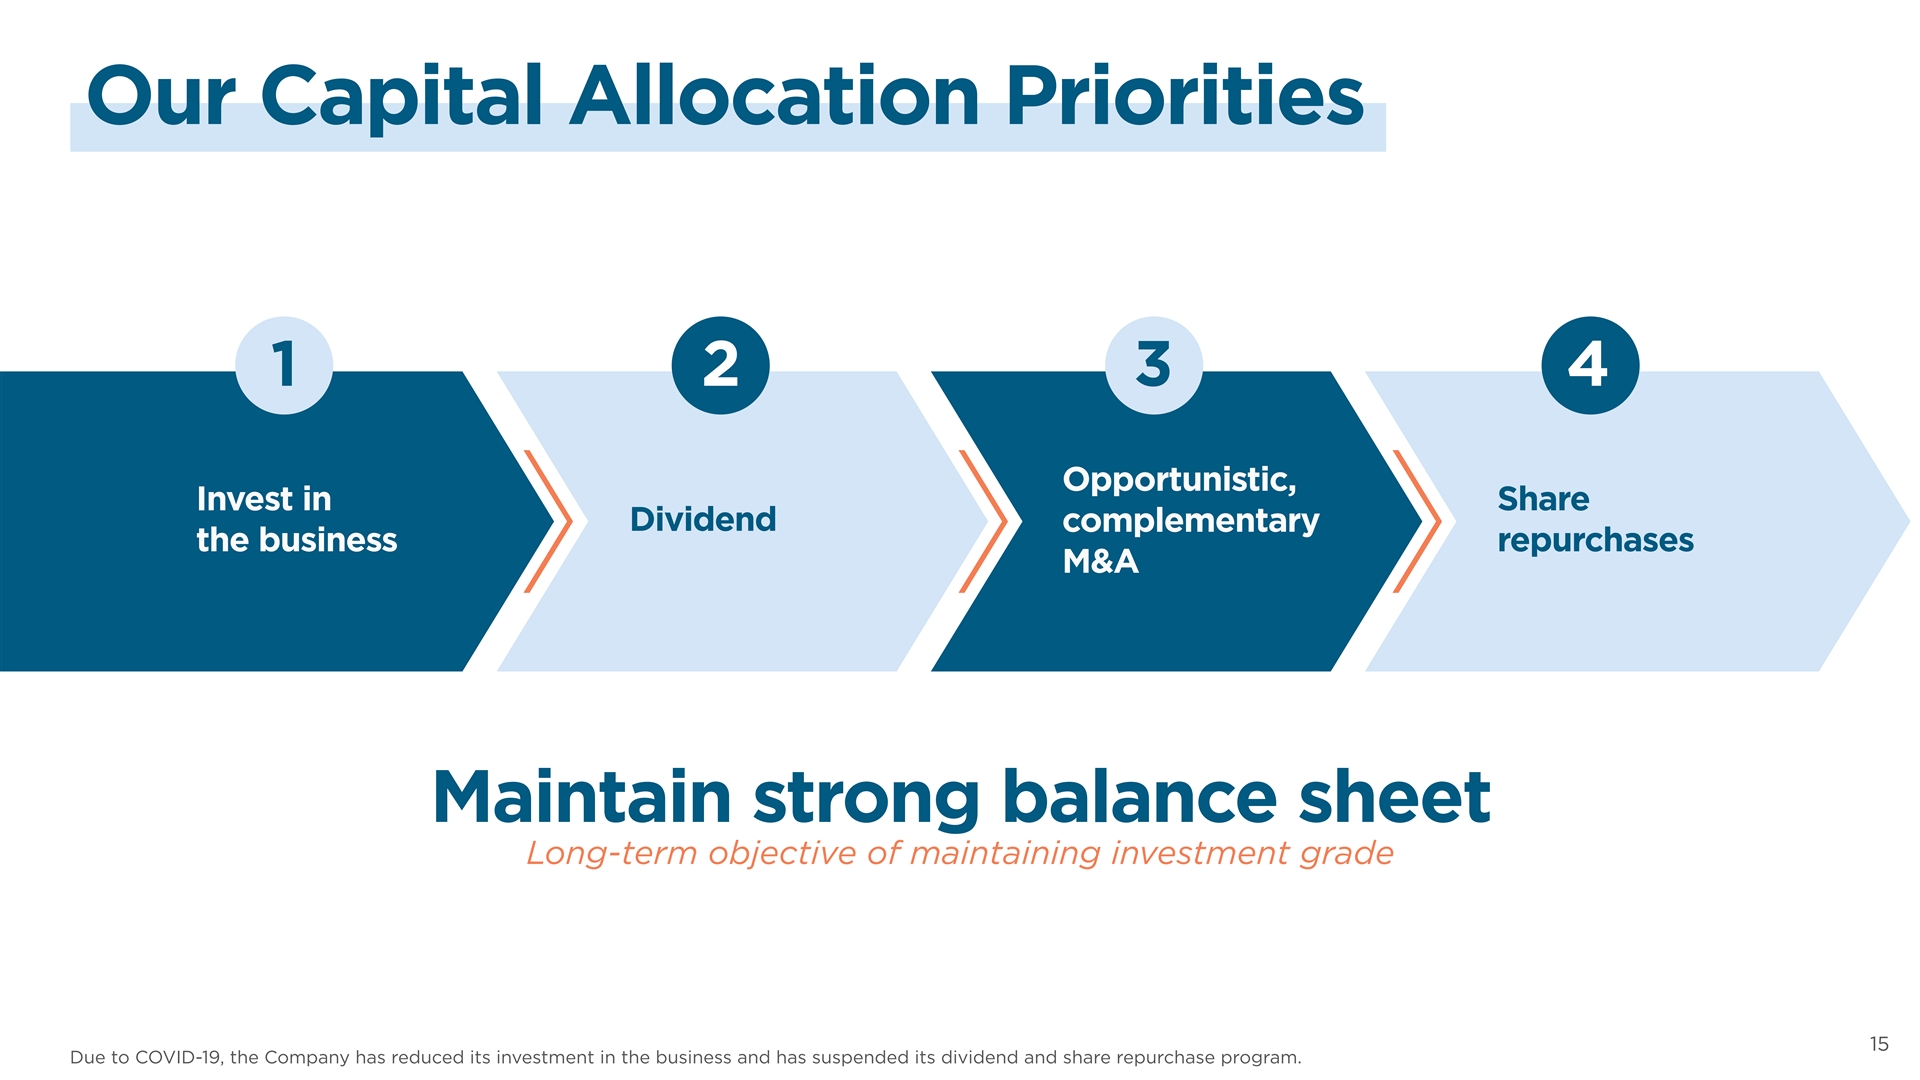
Our Capital Allocation Priorities 1 2 3 4 Opportunistic, Invest in Share Dividend complementary the business repurchases M&A Maintain strong balance sheet Long-term objective of maintaining investment grade 15 Due to COVID-19, the Company has reduced its investment in the business and has suspended its dividend and share repurchase program.Our Capital Allocation Priorities 1 2 3 4 Opportunistic, Invest in Share Dividend complementary the business repurchases M&A Maintain strong balance sheet Long-term objective of maintaining investment grade 15 Due to COVID-19, the Company has reduced its investment in the business and has suspended its dividend and share repurchase program.
2H 2020 Outlook & Initiatives 162H 2020 Outlook & Initiatives 16
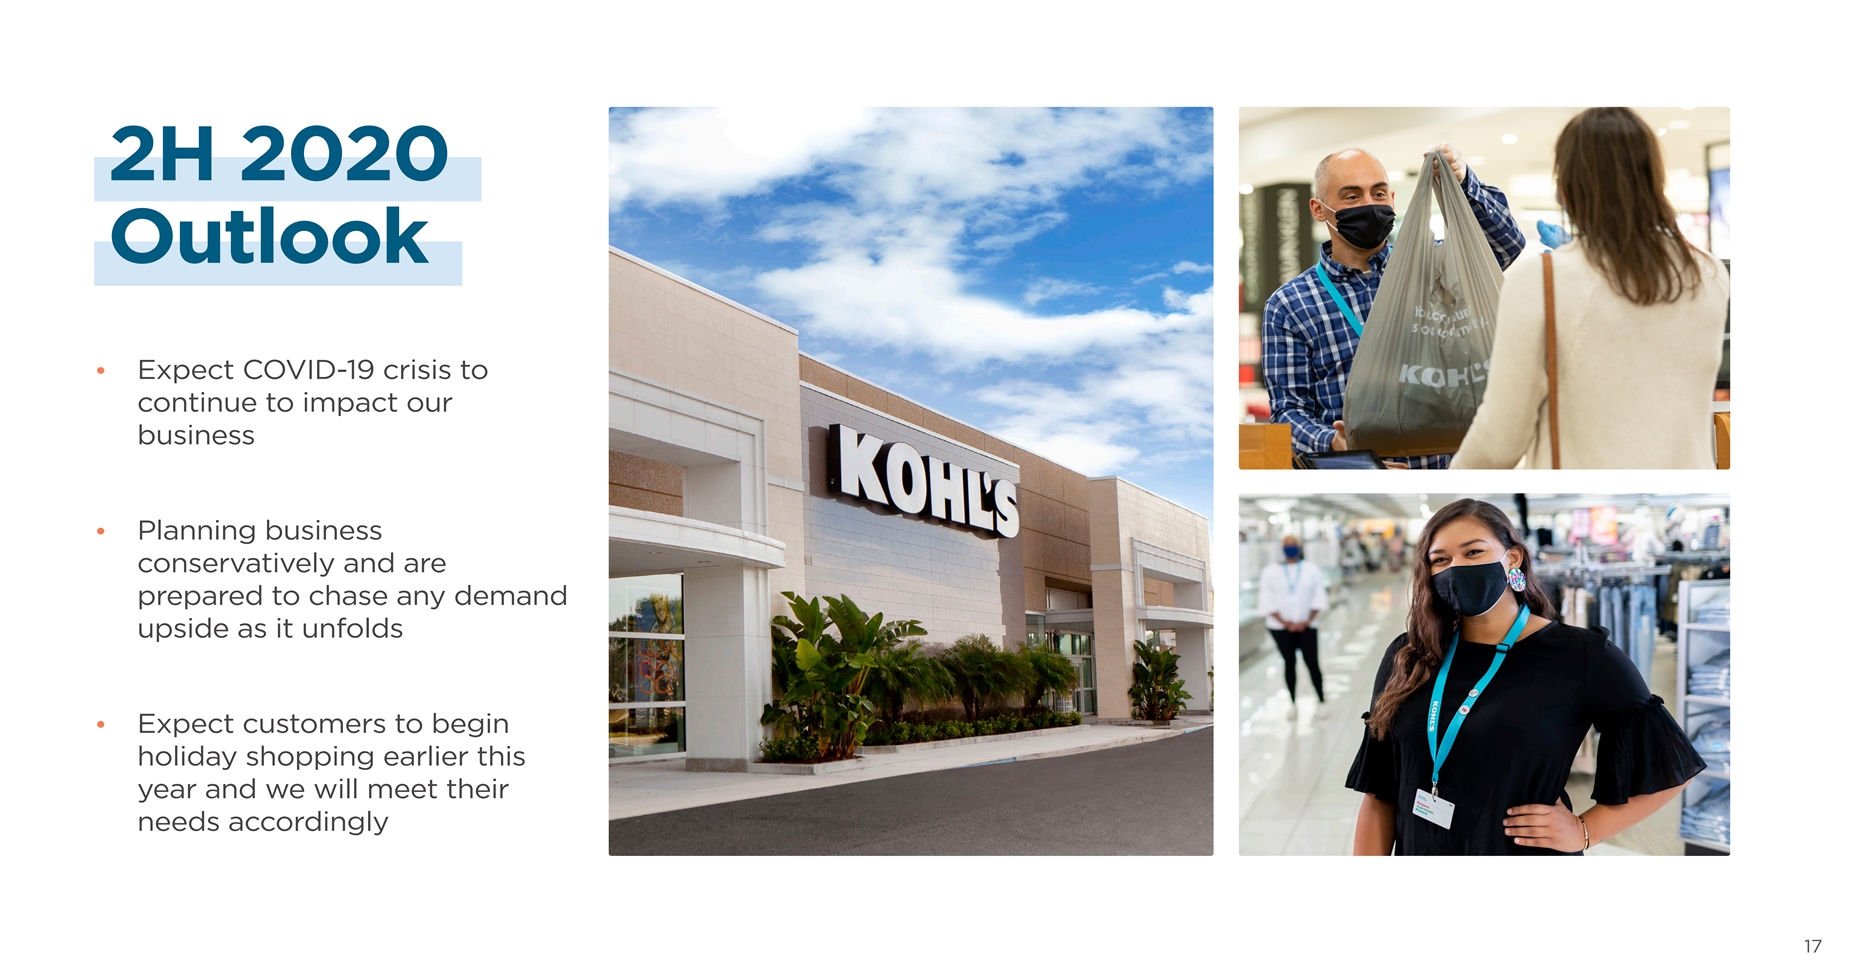
2H 2020 Outlook Expect COVID-19 crisis to • continue to impact our business Planning business • conservatively and are prepared to chase any demand upside as it unfolds Expect customers to begin • holiday shopping earlier this year and we will meet their needs accordingly 172H 2020 Outlook Expect COVID-19 crisis to • continue to impact our business Planning business • conservatively and are prepared to chase any demand upside as it unfolds Expect customers to begin • holiday shopping earlier this year and we will meet their needs accordingly 17
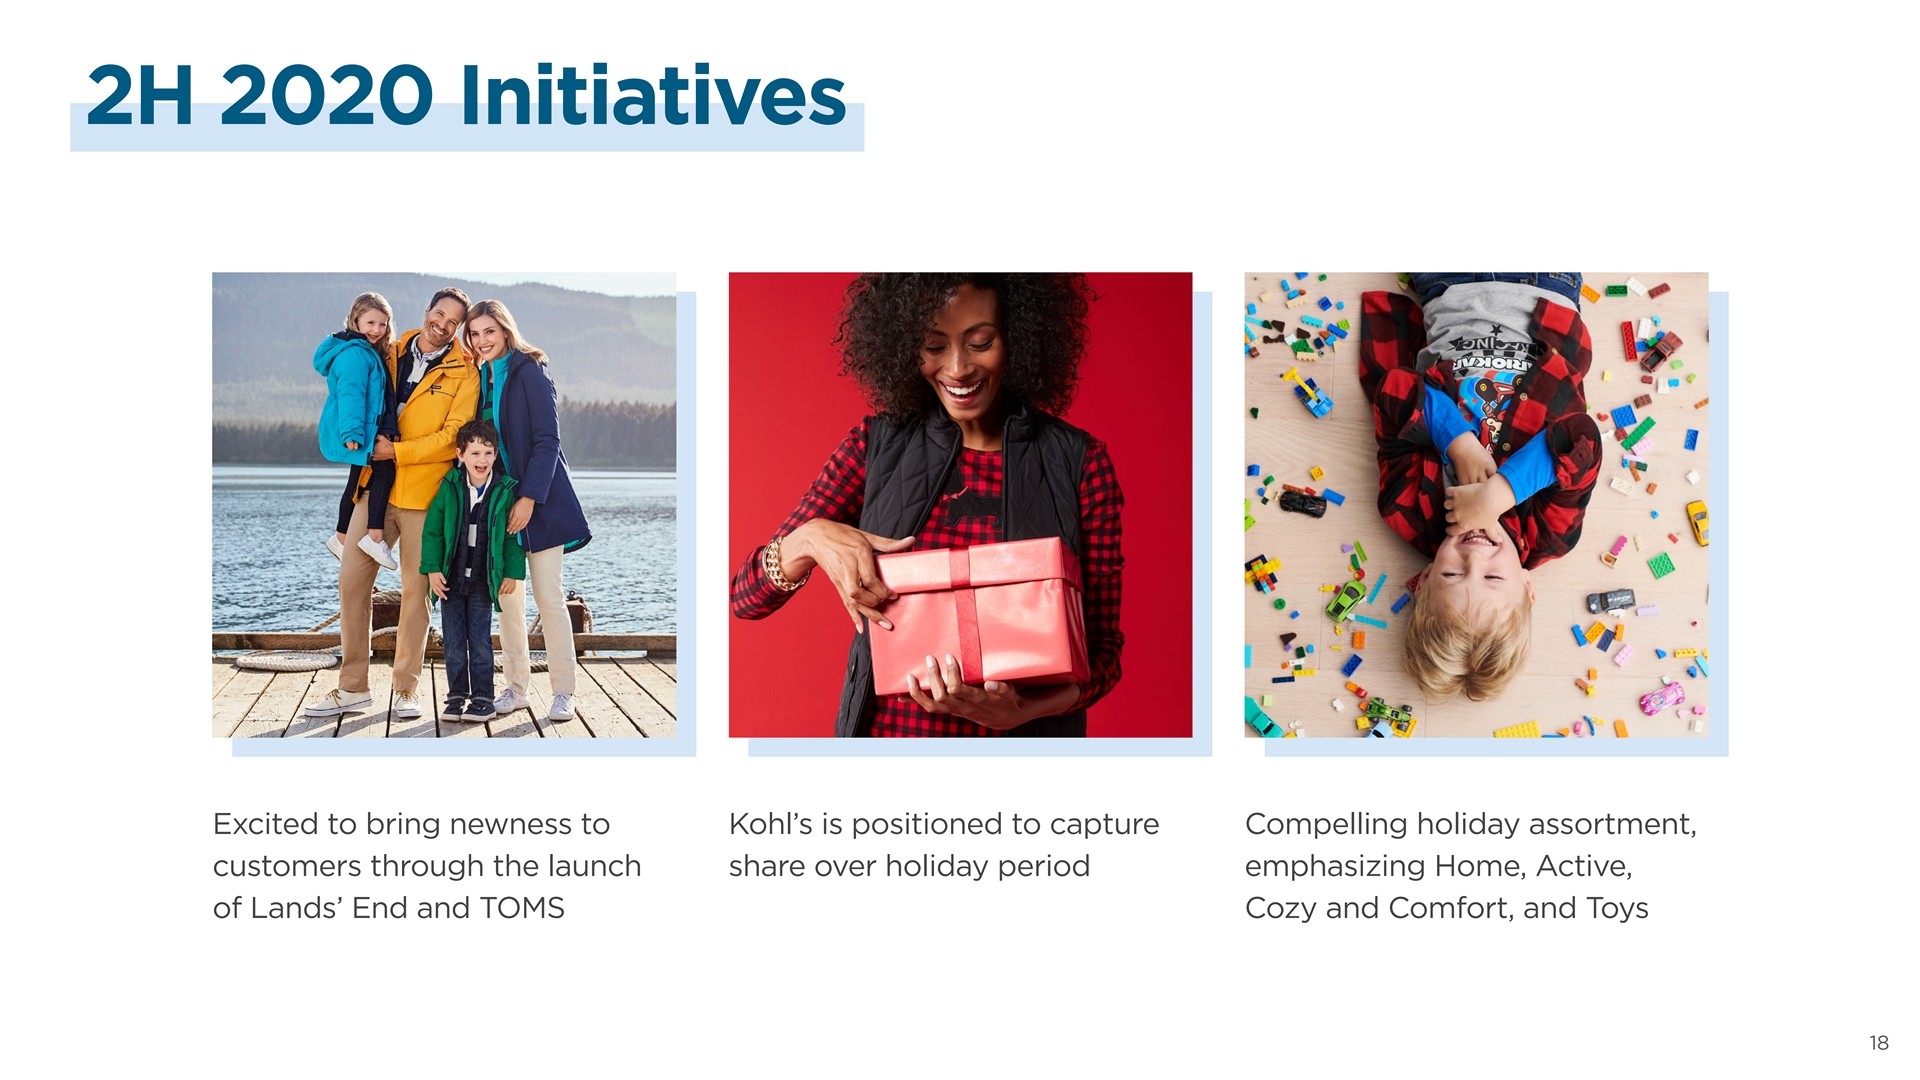
2H 2020 Initiatives Excited to bring newness to Kohl’s is positioned to capture Compelling holiday assortment, customers through the launch share over holiday period emphasizing Home, Active, of Lands’ End and TOMS Cozy and Comfort, and Toys 182H 2020 Initiatives Excited to bring newness to Kohl’s is positioned to capture Compelling holiday assortment, customers through the launch share over holiday period emphasizing Home, Active, of Lands’ End and TOMS Cozy and Comfort, and Toys 18
Appendix 19Appendix 19
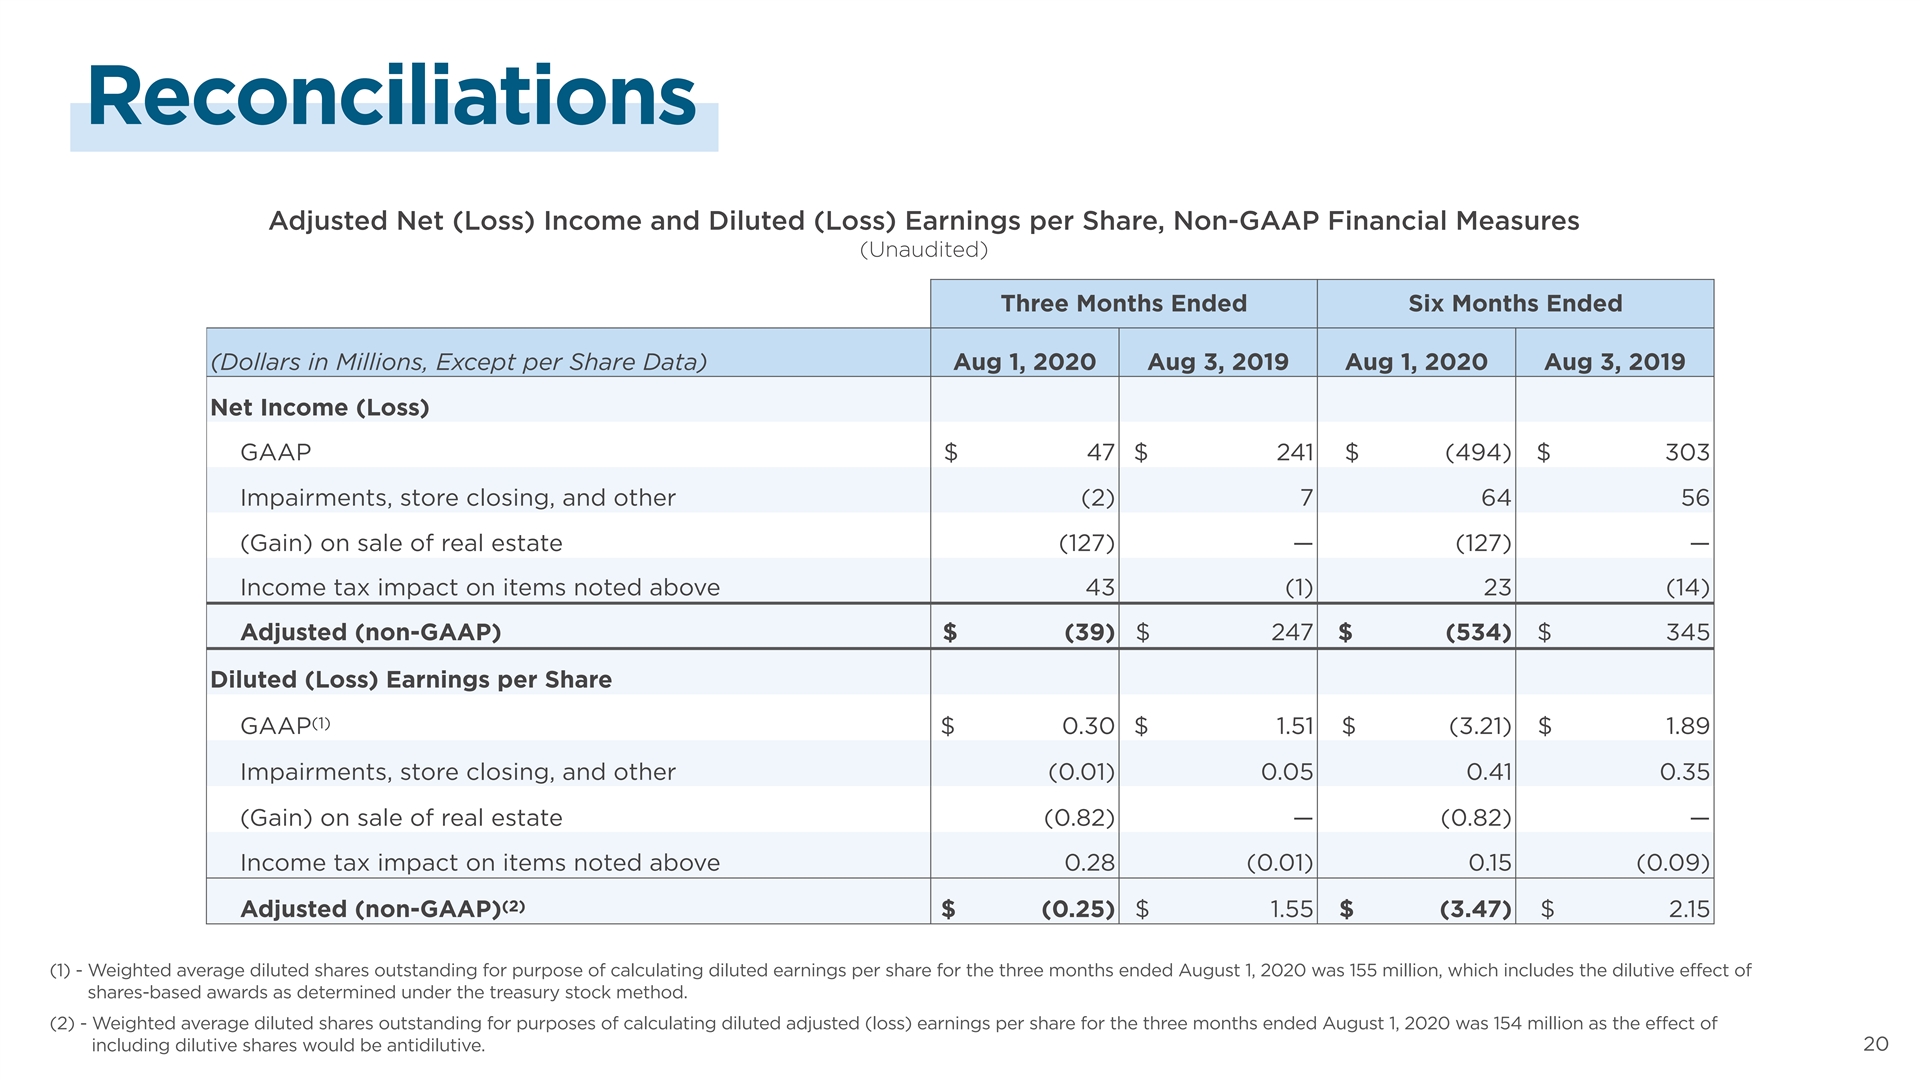
Reconciliations Adjusted Net (Loss) Income and Diluted (Loss) Earnings per Share, Non-GAAP Financial Measures (Unaudited) Three Months Ended Six Months Ended (Dollars in Millions, Except per Share Data) Aug 1, 2020 Aug 3, 2019 Aug 1, 2020 Aug 3, 2019 Net Income (Loss) • GAAP $ 47 $ 241 $ (494) $ 303 • Impairments, store closing, and other (2) 7 64 56 • (Gain) on sale of real estate (127) — (127) — • Income tax impact on items noted above 43 (1) 23 (14) • Adjusted (non-GAAP) $ (39) $ 247 $ (534) $ 345 Diluted (Loss) Earnings per Share • (1) GAAP $ 0.30 $ 1.51 $ (3.21) $ 1.89 • Impairments, store closing, and other (0.01) 0.05 0.41 0.35 • (Gain) on sale of real estate (0.82) — (0.82) — • Income tax impact on items noted above 0.28 (0.01) 0.15 (0.09) • (2) Adjusted (non-GAAP) $ (0.25) $ 1.55 $ (3.47) $ 2.15 (1) - Weighted average diluted shares outstanding for purpose of calculating diluted earnings per share for the three months ended August 1, 2020 was 155 million, which includes the dilutive effect of shares-based awards as determined under the treasury stock method. (2) - Weighted average diluted shares outstanding for purposes of calculating diluted adjusted (loss) earnings per share for the three months ended August 1, 2020 was 154 million as the effect of including dilutive shares would be antidilutive. 20 20Reconciliations Adjusted Net (Loss) Income and Diluted (Loss) Earnings per Share, Non-GAAP Financial Measures (Unaudited) Three Months Ended Six Months Ended (Dollars in Millions, Except per Share Data) Aug 1, 2020 Aug 3, 2019 Aug 1, 2020 Aug 3, 2019 Net Income (Loss) • GAAP $ 47 $ 241 $ (494) $ 303 • Impairments, store closing, and other (2) 7 64 56 • (Gain) on sale of real estate (127) — (127) — • Income tax impact on items noted above 43 (1) 23 (14) • Adjusted (non-GAAP) $ (39) $ 247 $ (534) $ 345 Diluted (Loss) Earnings per Share • (1) GAAP $ 0.30 $ 1.51 $ (3.21) $ 1.89 • Impairments, store closing, and other (0.01) 0.05 0.41 0.35 • (Gain) on sale of real estate (0.82) — (0.82) — • Income tax impact on items noted above 0.28 (0.01) 0.15 (0.09) • (2) Adjusted (non-GAAP) $ (0.25) $ 1.55 $ (3.47) $ 2.15 (1) - Weighted average diluted shares outstanding for purpose of calculating diluted earnings per share for the three months ended August 1, 2020 was 155 million, which includes the dilutive effect of shares-based awards as determined under the treasury stock method. (2) - Weighted average diluted shares outstanding for purposes of calculating diluted adjusted (loss) earnings per share for the three months ended August 1, 2020 was 154 million as the effect of including dilutive shares would be antidilutive. 20 20
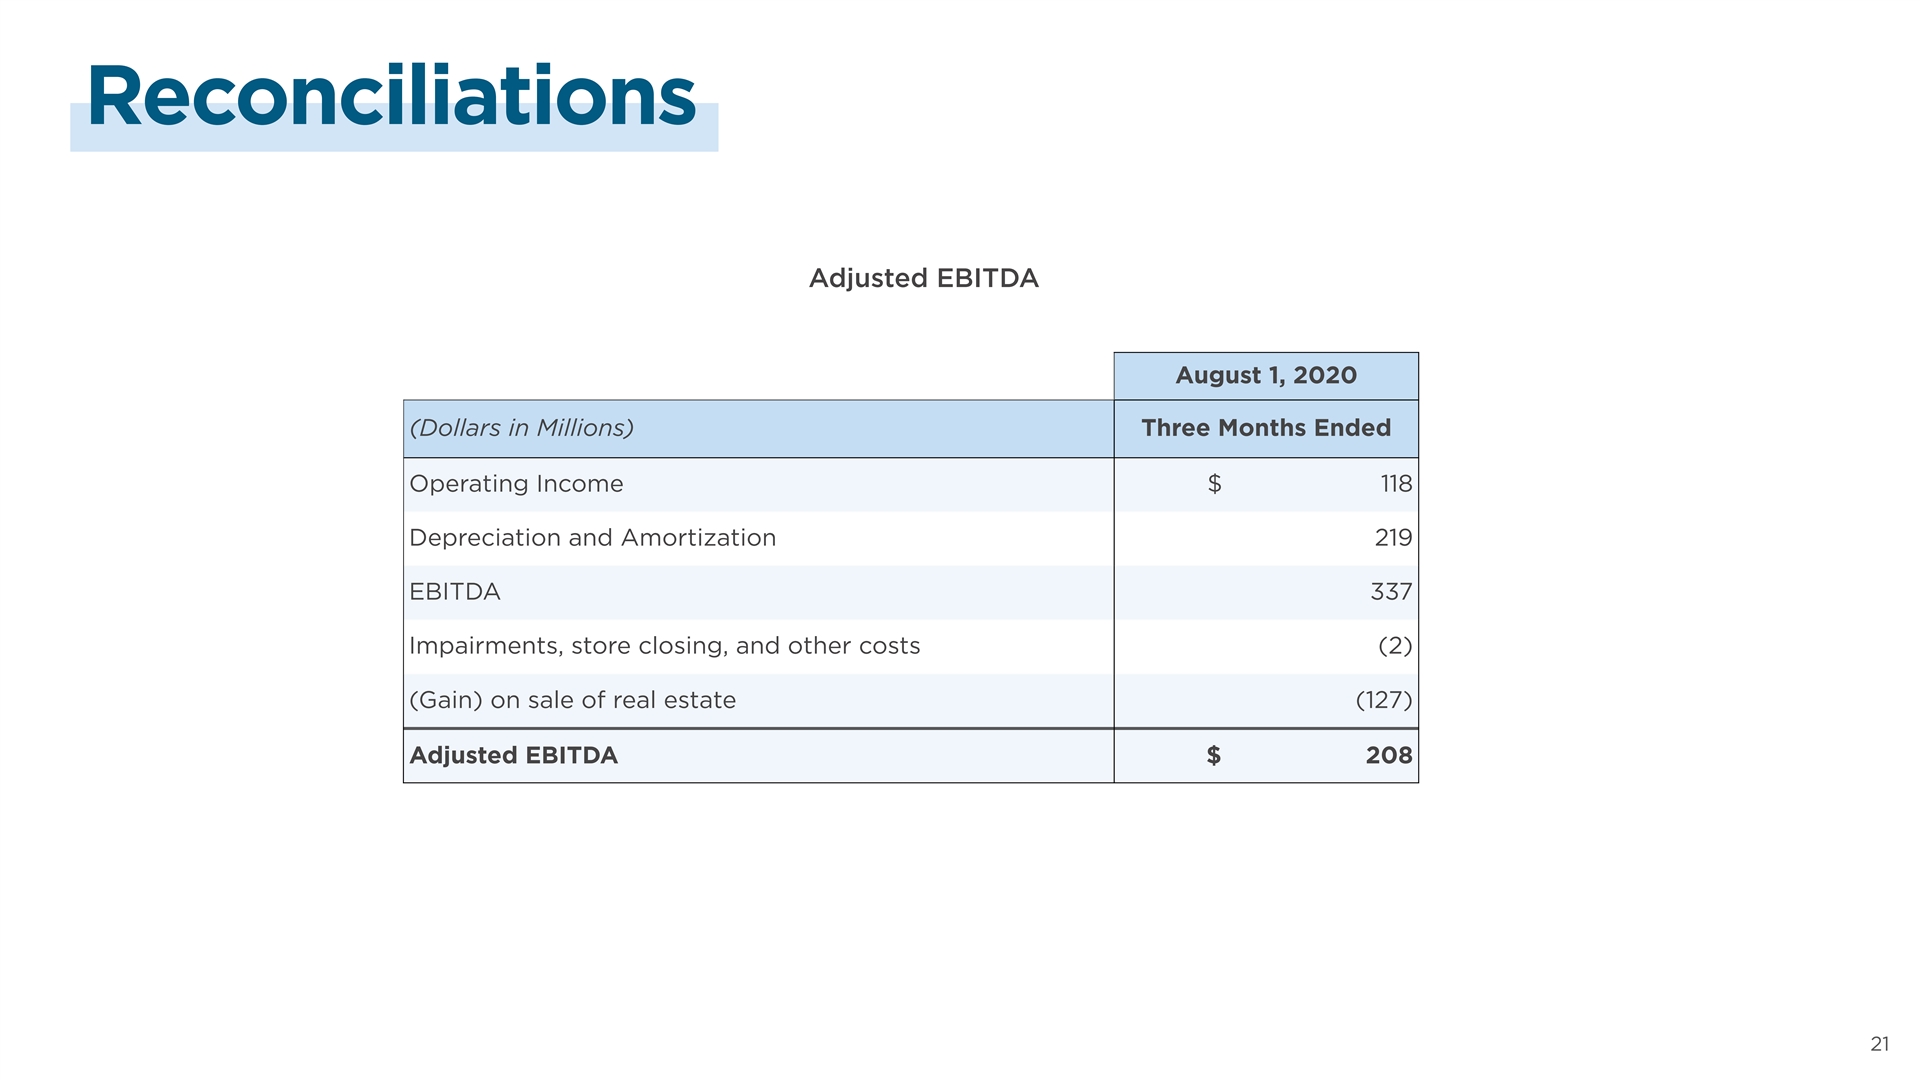
Reconciliations Adjusted EBITDA August 1, 2020 (Dollars in Millions) Three Months Ended Operating Income $ 118 Depreciation and Amortization 219 EBITDA 337 Impairments, store closing, and other costs (2) (Gain) on sale of real estate (127) Adjusted EBITDA $ 208 21 21Reconciliations Adjusted EBITDA August 1, 2020 (Dollars in Millions) Three Months Ended Operating Income $ 118 Depreciation and Amortization 219 EBITDA 337 Impairments, store closing, and other costs (2) (Gain) on sale of real estate (127) Adjusted EBITDA $ 208 21 21
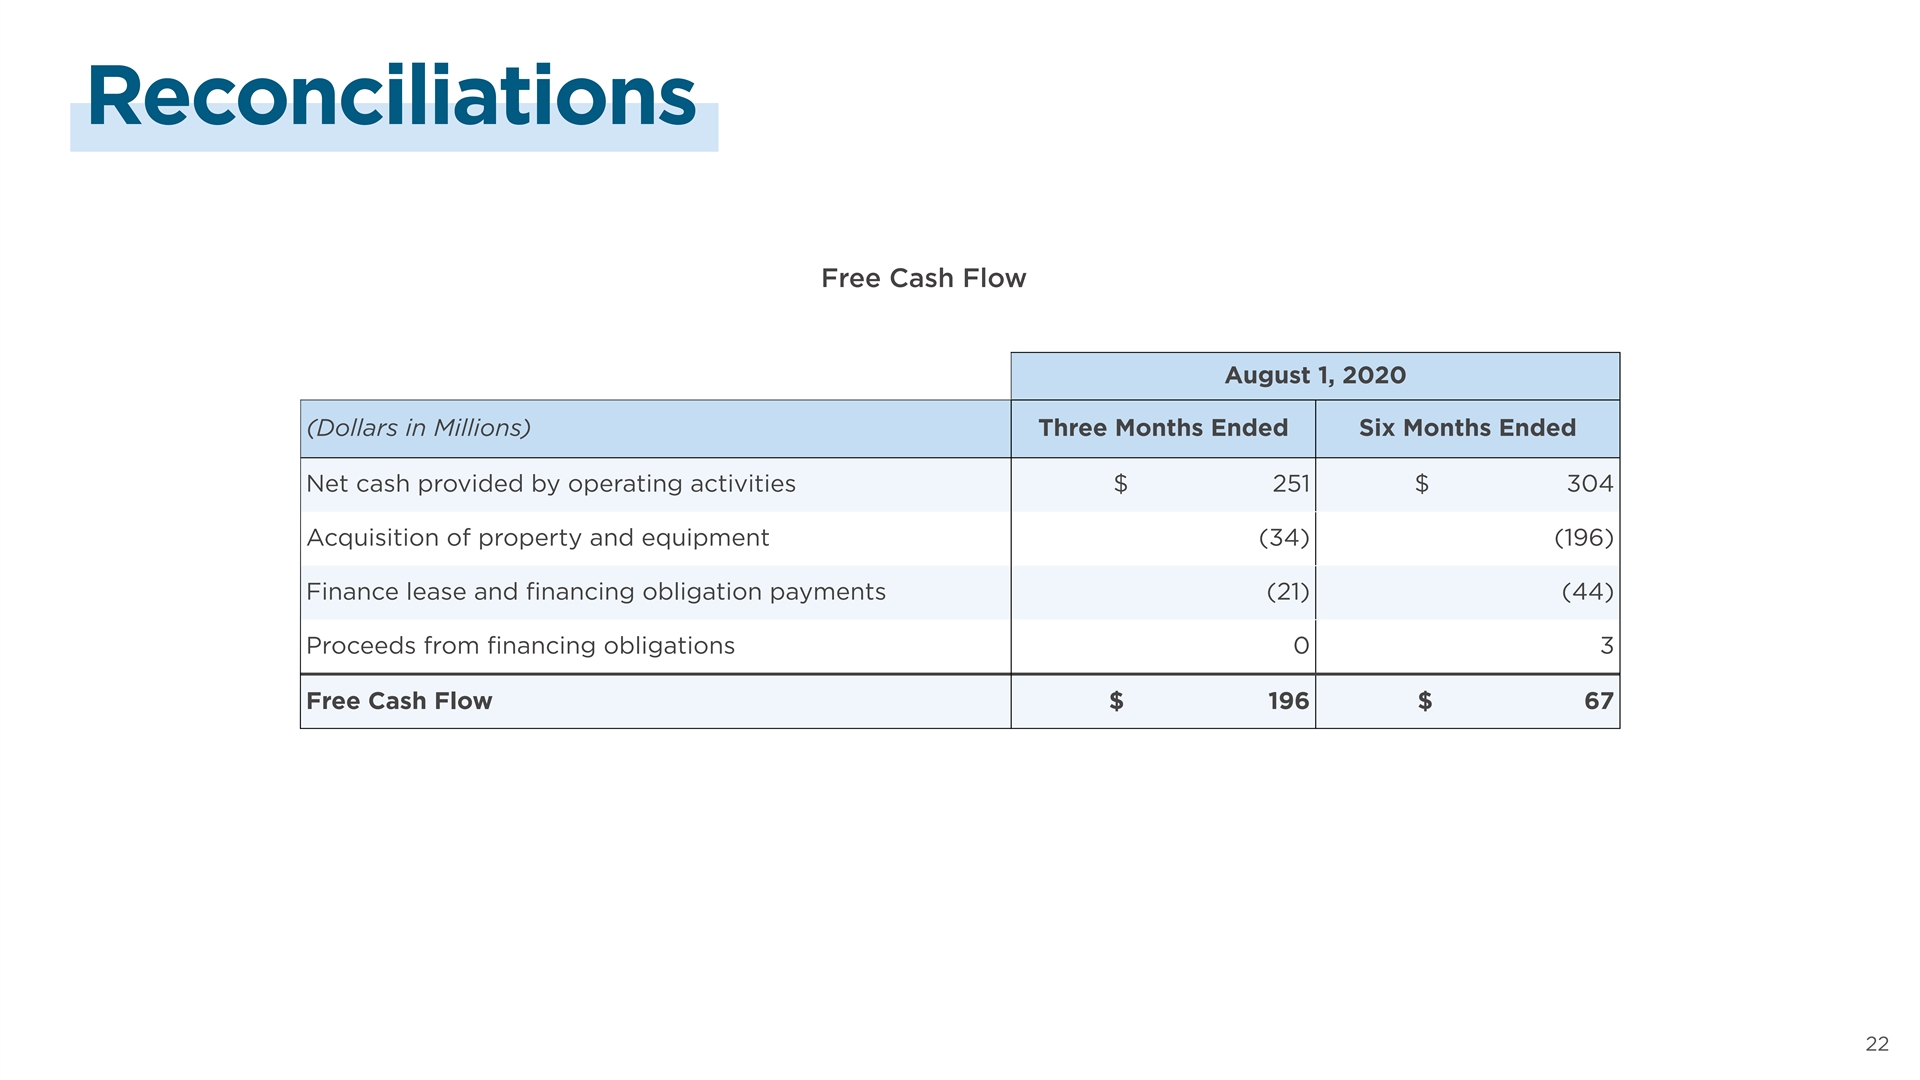
Reconciliations Free Cash Flow August 1, 2020 (Dollars in Millions) Three Months Ended Six Months Ended Net cash provided by operating activities $ 251 $ 304 Acquisition of property and equipment (34) (196) Finance lease and financing obligation payments (21) (44) Proceeds from financing obligations 0 3 Free Cash Flow $ 196 $ 67 22 22Reconciliations Free Cash Flow August 1, 2020 (Dollars in Millions) Three Months Ended Six Months Ended Net cash provided by operating activities $ 251 $ 304 Acquisition of property and equipment (34) (196) Finance lease and financing obligation payments (21) (44) Proceeds from financing obligations 0 3 Free Cash Flow $ 196 $ 67 22 22