
Exhibit 99.2 Q3 2020 Results Presentation November 17, 2020Exhibit 99.2 Q3 2020 Results Presentation November 17, 2020
Cautionary Statement Regarding Forward-Looking Information This presentation contains forward-looking statements within the meaning of the Private Securities Litigation Reform Act of 1995. Words such as believes, anticipates, plans, may, intends, will, should, expects, and similar expressions are intended to identify forward-looking statements. Forward-looking statements include, but are not limited to, comments about Kohl's future financial plans, capital generation, management and deployment strategies, adequacy of capital resources and the competitive environment. Such statements are subject to certain risks and uncertainties, which could cause Kohl's actual results to differ materially from those anticipated by the forward looking statements. These risks and uncertainties include, but are not limited to, those described in Item 1A in Kohl's Annual Report on Form 10-K, and in Item 1A of Part II in the Company's Quarterly Report on Form 10-Q for the quarter ended May 2, 2020, which are expressly incorporated herein by reference, and other factors as may periodically be described in Kohl's filings with the SEC. Any number of risks and uncertainties could cause actual results to differ materially from those Kohl’s expresses in its forward-looking statements, including the short and long-term impact of COVID-19 on the economy and the pace of recovery thereafter. Forward-looking statements speak as of the date they are made, and Kohl’s undertakes no obligation to update them. Non-GAAP Financial Measures In addition, this presentation contains non-GAAP financial measures, including Adjusted EPS, Adjusted Net Income, Adjusted EBITDA, and Free Cash Flow. Reconciliations of all non-GAAP measures to the most directly comparable GAAP measures are included in the Appendix of this presentation. 2Cautionary Statement Regarding Forward-Looking Information This presentation contains forward-looking statements within the meaning of the Private Securities Litigation Reform Act of 1995. Words such as believes, anticipates, plans, may, intends, will, should, expects, and similar expressions are intended to identify forward-looking statements. Forward-looking statements include, but are not limited to, comments about Kohl's future financial plans, capital generation, management and deployment strategies, adequacy of capital resources and the competitive environment. Such statements are subject to certain risks and uncertainties, which could cause Kohl's actual results to differ materially from those anticipated by the forward looking statements. These risks and uncertainties include, but are not limited to, those described in Item 1A in Kohl's Annual Report on Form 10-K, and in Item 1A of Part II in the Company's Quarterly Report on Form 10-Q for the quarter ended May 2, 2020, which are expressly incorporated herein by reference, and other factors as may periodically be described in Kohl's filings with the SEC. Any number of risks and uncertainties could cause actual results to differ materially from those Kohl’s expresses in its forward-looking statements, including the short and long-term impact of COVID-19 on the economy and the pace of recovery thereafter. Forward-looking statements speak as of the date they are made, and Kohl’s undertakes no obligation to update them. Non-GAAP Financial Measures In addition, this presentation contains non-GAAP financial measures, including Adjusted EPS, Adjusted Net Income, Adjusted EBITDA, and Free Cash Flow. Reconciliations of all non-GAAP measures to the most directly comparable GAAP measures are included in the Appendix of this presentation. 2
Q3 2020 10 Driving Top Line Growth Results COVID-19 Update 4 Presentation Q3 2020 Results 8 Q4 2020 Outlook 13 Our Strategy 15 3Q3 2020 10 Driving Top Line Growth Results COVID-19 Update 4 Presentation Q3 2020 Results 8 Q4 2020 Outlook 13 Our Strategy 15 3

COVID-19 Update 4COVID-19 Update 4
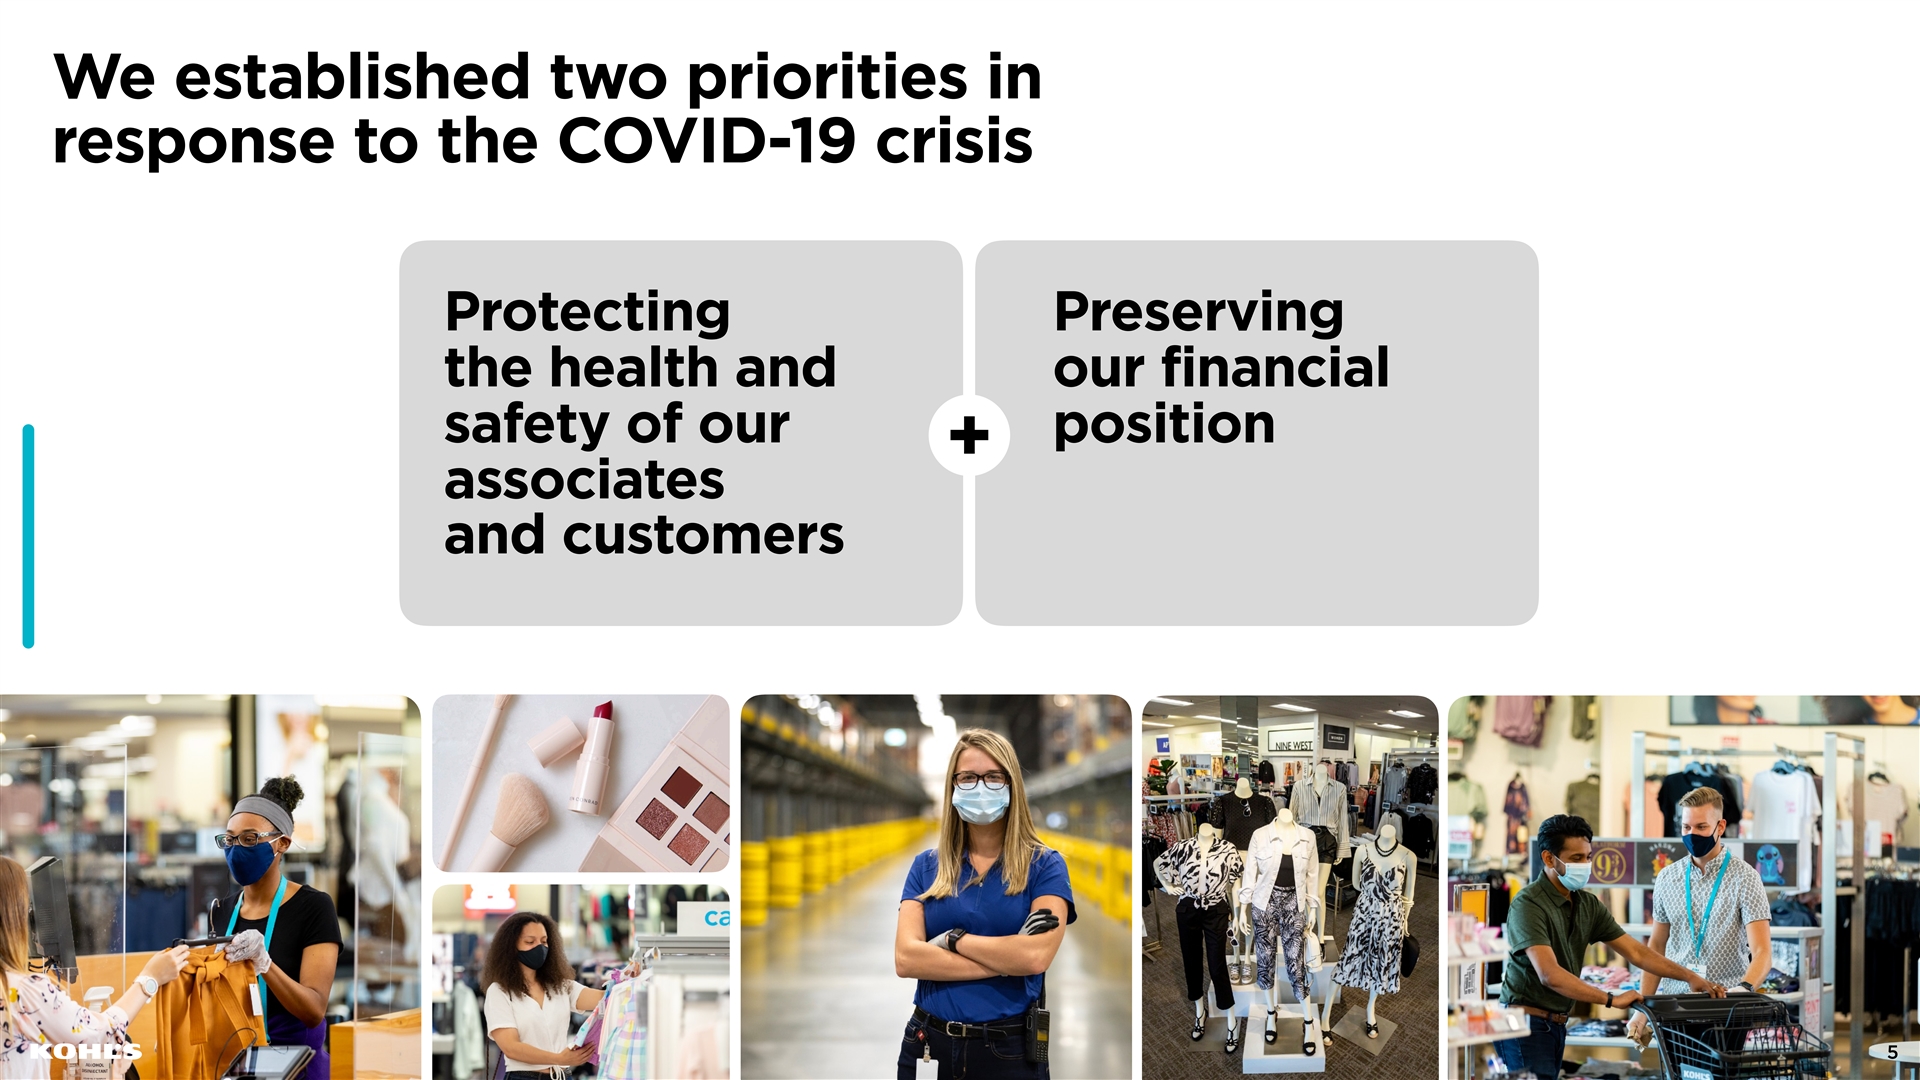
We established two priorities in response to the COVID-19 crisis Protecting Preserving the health and our financial safety of our position + associates 5 and customers 5We established two priorities in response to the COVID-19 crisis Protecting Preserving the health and our financial safety of our position + associates 5 and customers 5
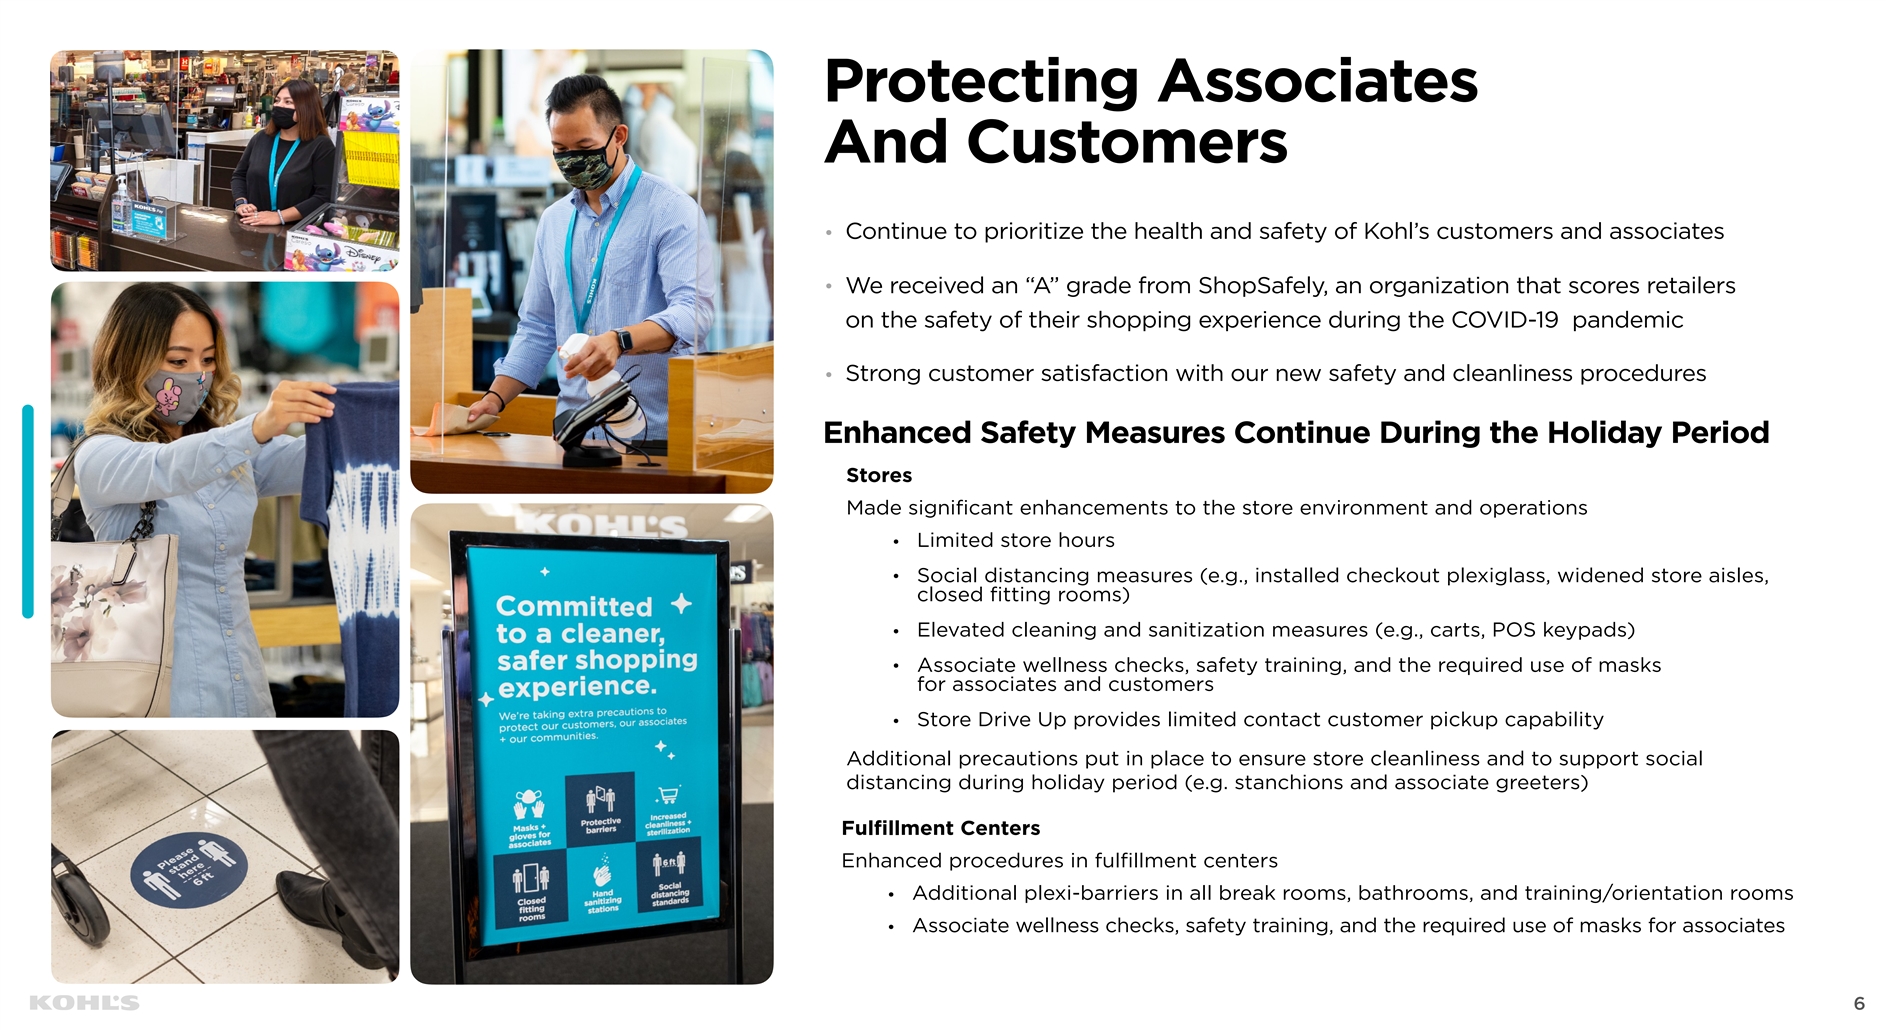
Protecting Associates And Customers Continue to prioritize the health and safety of Kohl’s customers and associates • We received an “A” grade from ShopSafely, an organization that scores retailers • on the safety of their shopping experience during the COVID-19 pandemic Strong customer satisfaction with our new safety and cleanliness procedures • Enhanced Safety Measures Continue During the Holiday Period Stores Made significant enhancements to the store environment and operations Limited store hours • Social distancing measures (e.g., installed checkout plexiglass, widened store aisles, • closed fitting rooms) Elevated cleaning and sanitization measures (e.g., carts, POS keypads) • Associate wellness checks, safety training, and the required use of masks • for associates and customers Store Drive Up provides limited contact customer pickup capability • Additional precautions put in place to ensure store cleanliness and to support social distancing during holiday period (e.g. stanchions and associate greeters) Fulfillment Centers Enhanced procedures in fulfillment centers Additional plexi-barriers in all break rooms, bathrooms, and training/orientation rooms • Associate wellness checks, safety training, and the required use of masks for associates • 6Protecting Associates And Customers Continue to prioritize the health and safety of Kohl’s customers and associates • We received an “A” grade from ShopSafely, an organization that scores retailers • on the safety of their shopping experience during the COVID-19 pandemic Strong customer satisfaction with our new safety and cleanliness procedures • Enhanced Safety Measures Continue During the Holiday Period Stores Made significant enhancements to the store environment and operations Limited store hours • Social distancing measures (e.g., installed checkout plexiglass, widened store aisles, • closed fitting rooms) Elevated cleaning and sanitization measures (e.g., carts, POS keypads) • Associate wellness checks, safety training, and the required use of masks • for associates and customers Store Drive Up provides limited contact customer pickup capability • Additional precautions put in place to ensure store cleanliness and to support social distancing during holiday period (e.g. stanchions and associate greeters) Fulfillment Centers Enhanced procedures in fulfillment centers Additional plexi-barriers in all break rooms, bathrooms, and training/orientation rooms • Associate wellness checks, safety training, and the required use of masks for associates • 6
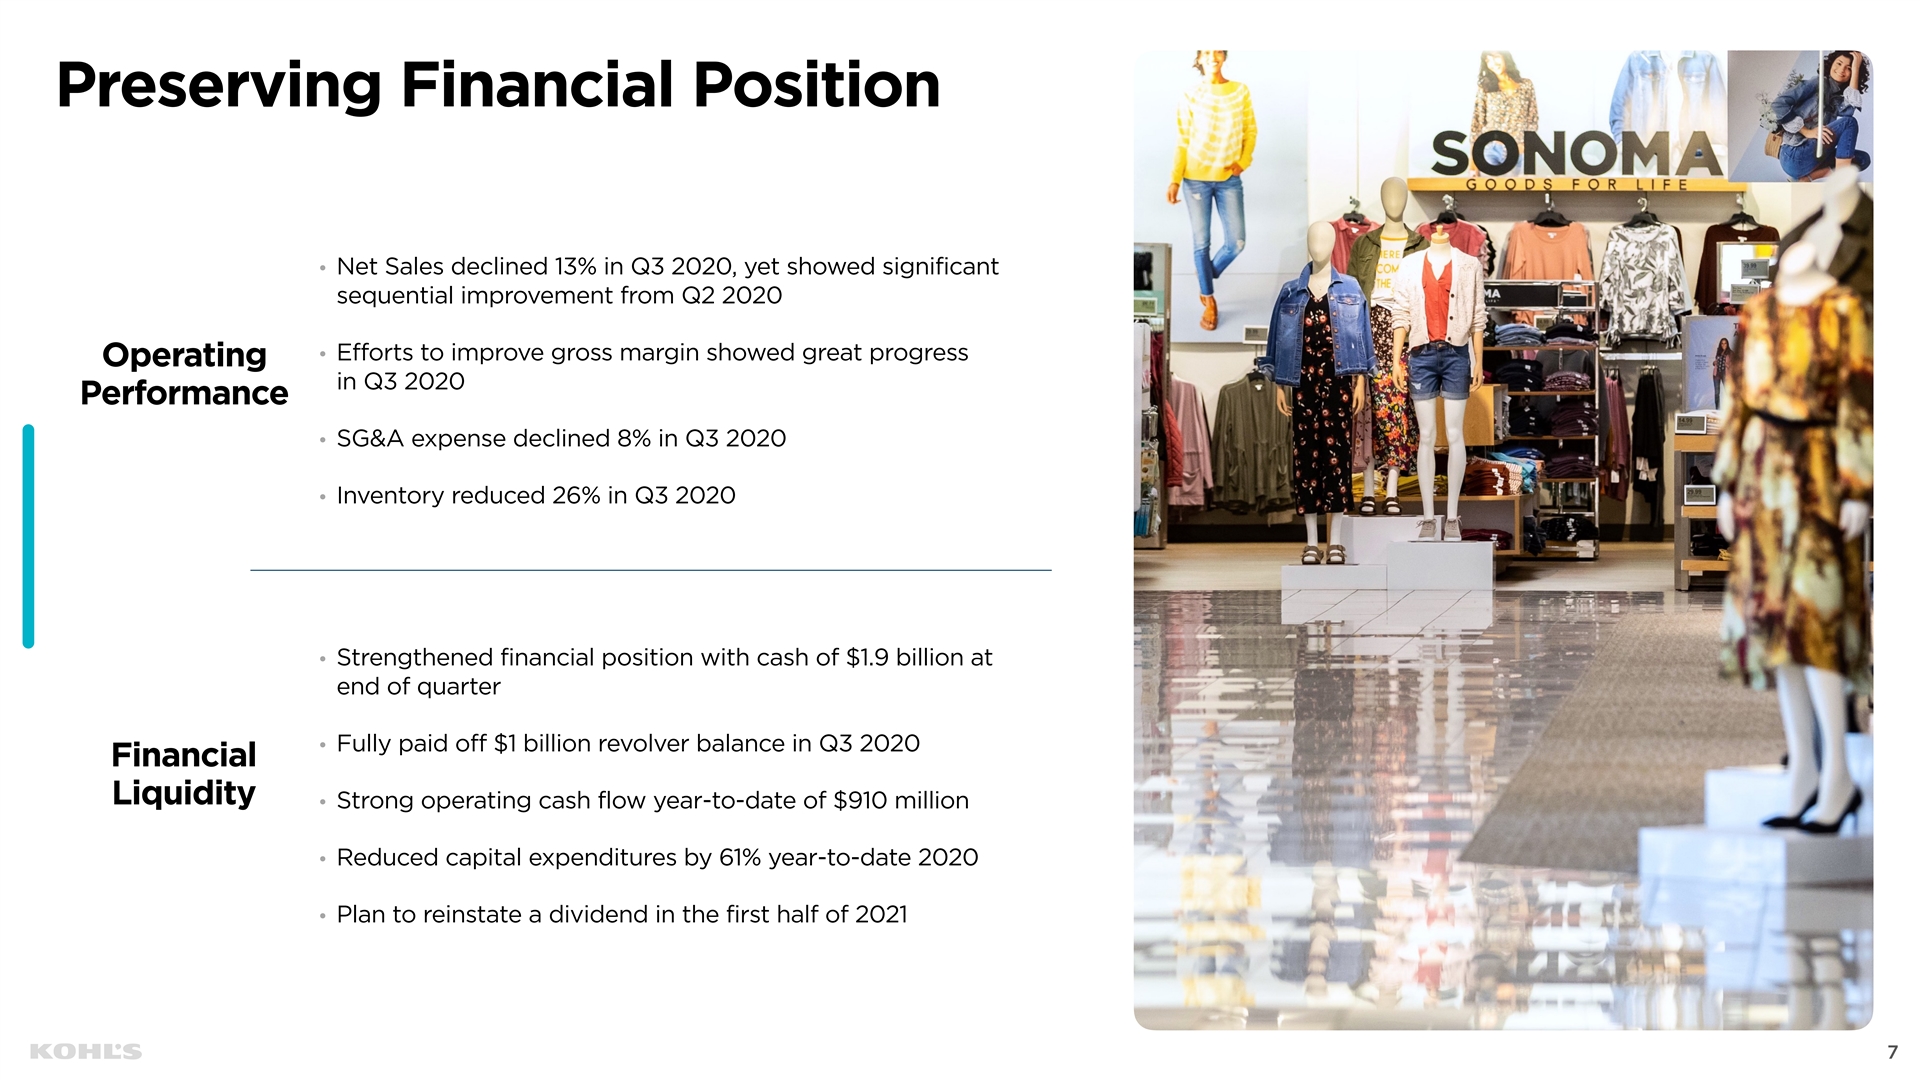
Preserving Financial Position Net Sales declined 13% in Q3 2020, yet showed significant • sequential improvement from Q2 2020 Efforts to improve gross margin showed great progress • Operating in Q3 2020 Performance SG&A expense declined 8% in Q3 2020 • Inventory reduced 26% in Q3 2020 • Strengthened financial position with cash of $1.9 billion at • end of quarter Fully paid off $1 billion revolver balance in Q3 2020 • Financial Liquidity Strong operating cash flow year-to-date of $910 million • Reduced capital expenditures by 61% year-to-date 2020 • Plan to reinstate a dividend in the first half of 2021 • 7 7 7 Preserving Financial Position Net Sales declined 13% in Q3 2020, yet showed significant • sequential improvement from Q2 2020 Efforts to improve gross margin showed great progress • Operating in Q3 2020 Performance SG&A expense declined 8% in Q3 2020 • Inventory reduced 26% in Q3 2020 • Strengthened financial position with cash of $1.9 billion at • end of quarter Fully paid off $1 billion revolver balance in Q3 2020 • Financial Liquidity Strong operating cash flow year-to-date of $910 million • Reduced capital expenditures by 61% year-to-date 2020 • Plan to reinstate a dividend in the first half of 2021 • 7 7 7
Q3 2020 Results 8 Q3 2020 Results 8
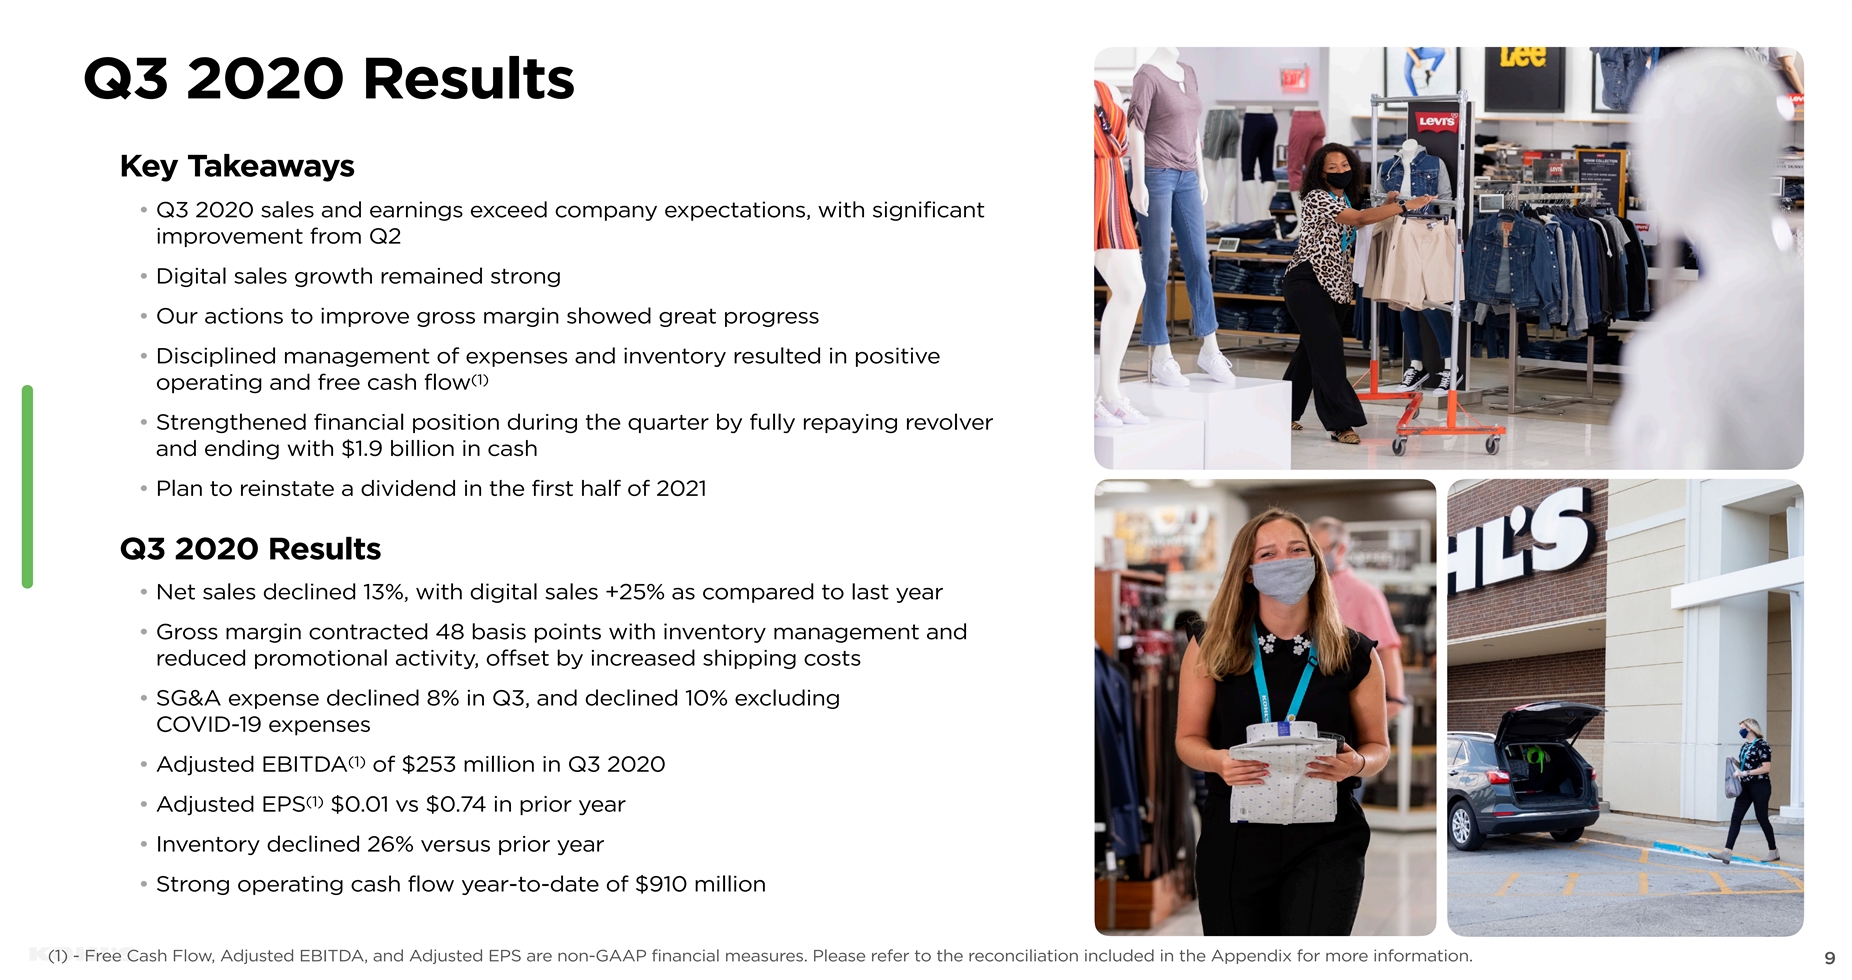
Q3 2020 Results Key Takeaways • Q3 2020 sales and earnings exceed company expectations, with significant improvement from Q2 • Digital sales growth remained strong • Our actions to improve gross margin showed great progress • Disciplined management of expenses and inventory resulted in positive (1) operating and free cash flow • Strengthened financial position during the quarter by fully repaying revolver and ending with $1.9 billion in cash • Plan to reinstate a dividend in the first half of 2021 Q3 2020 Results • Net sales declined 13%, with digital sales +25% as compared to last year • Gross margin contracted 48 basis points with inventory management and reduced promotional activity, offset by increased shipping costs • SG&A expense declined 8% in Q3, and declined 10% excluding COVID-19 expenses (1) • Adjusted EBITDA of $253 million in Q3 2020 (1) • Adjusted EPS $0.01 vs $0.74 in prior year • Inventory declined 26% versus prior year • Strong operating cash flow year-to-date of $910 million 9 (1) - Free Cash Flow, Adjusted EBITDA, and Adjusted EPS are non-GAAP financial measures. Please refer to the reconciliation included in the Appendix for more information. 9Q3 2020 Results Key Takeaways • Q3 2020 sales and earnings exceed company expectations, with significant improvement from Q2 • Digital sales growth remained strong • Our actions to improve gross margin showed great progress • Disciplined management of expenses and inventory resulted in positive (1) operating and free cash flow • Strengthened financial position during the quarter by fully repaying revolver and ending with $1.9 billion in cash • Plan to reinstate a dividend in the first half of 2021 Q3 2020 Results • Net sales declined 13%, with digital sales +25% as compared to last year • Gross margin contracted 48 basis points with inventory management and reduced promotional activity, offset by increased shipping costs • SG&A expense declined 8% in Q3, and declined 10% excluding COVID-19 expenses (1) • Adjusted EBITDA of $253 million in Q3 2020 (1) • Adjusted EPS $0.01 vs $0.74 in prior year • Inventory declined 26% versus prior year • Strong operating cash flow year-to-date of $910 million 9 (1) - Free Cash Flow, Adjusted EBITDA, and Adjusted EPS are non-GAAP financial measures. Please refer to the reconciliation included in the Appendix for more information. 9
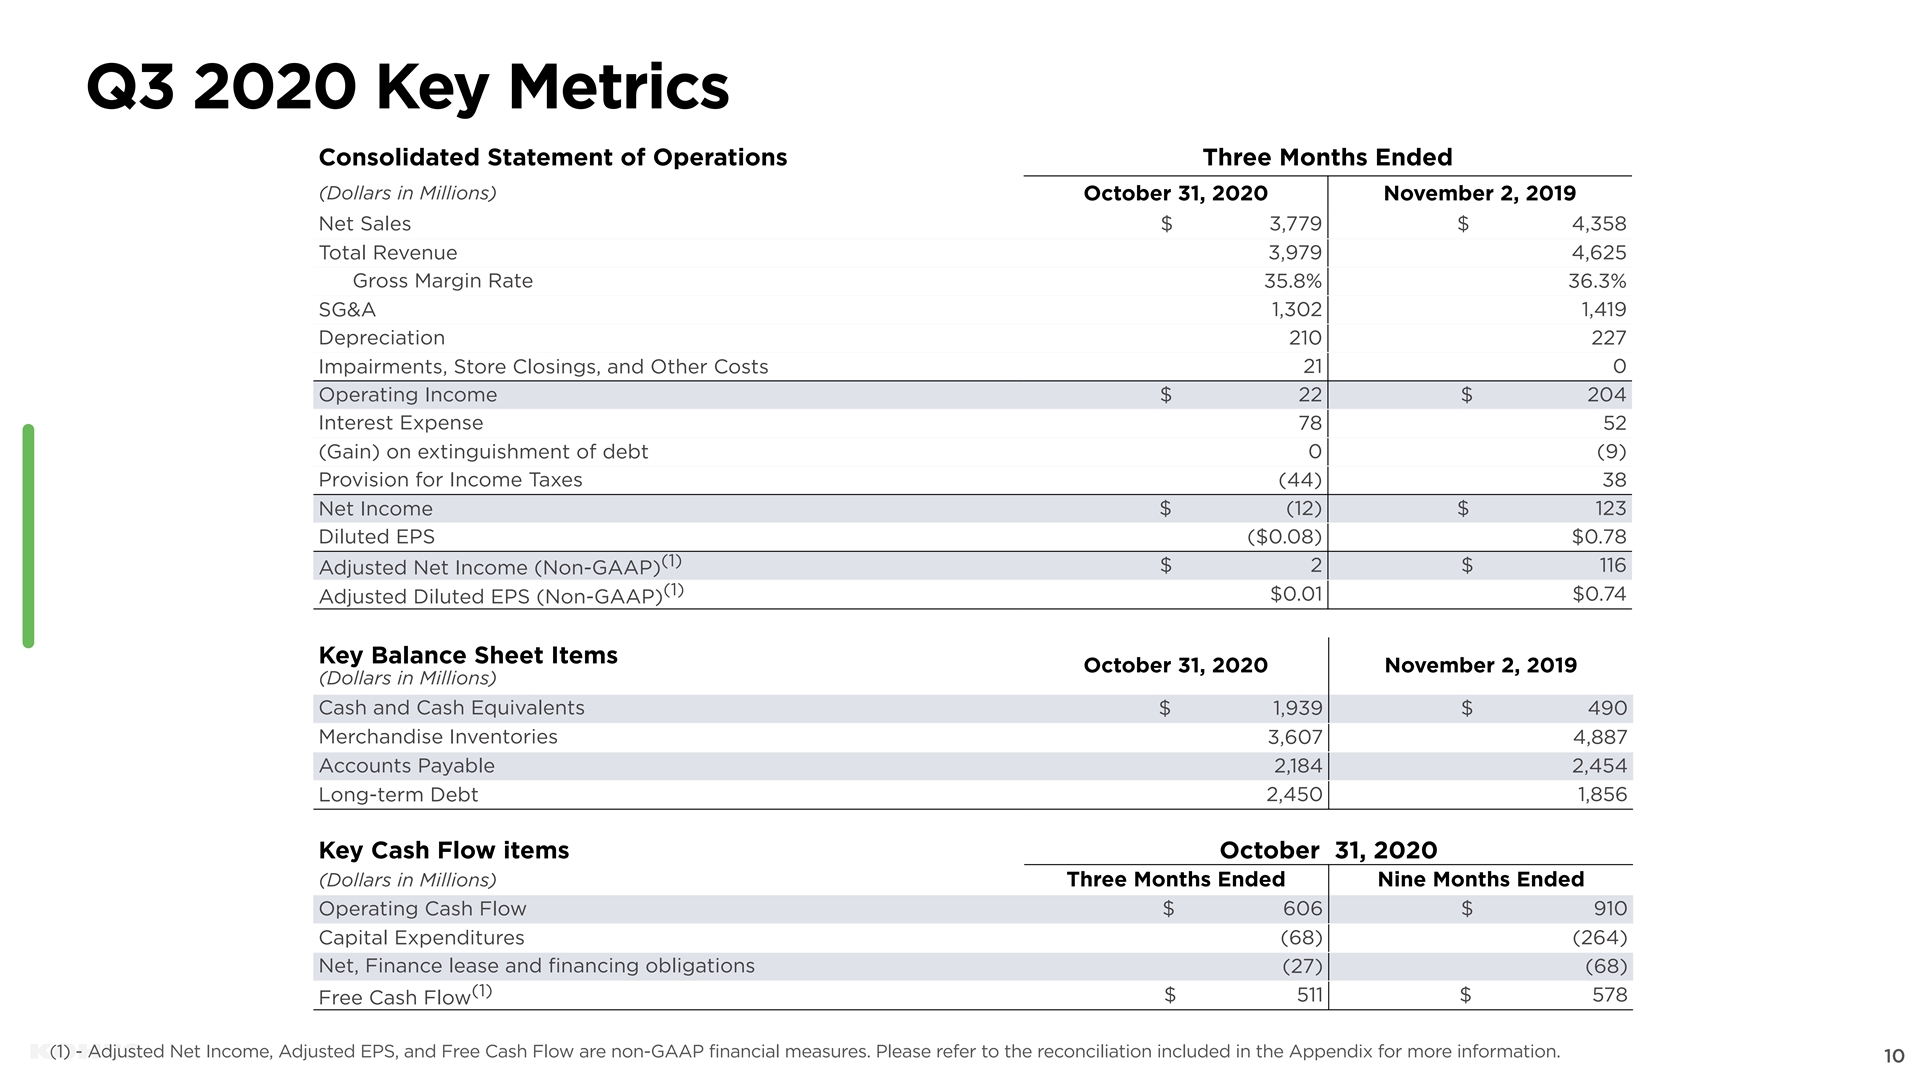
Q3 2020 Key Metrics Consolidated Statement of Operations Three Months Ended (Dollars in Millions) October 31, 2020 November 2, 2019 Net Sales $ 3,779 $ 4,358 Total Revenue 3,979 4,625 Gross Margin Rate 35.8% 36.3% SG&A 1,302 1,419 Depreciation 210 227 Impairments, Store Closings, and Other Costs 21 0 Operating Income $ 22 $ 204 Interest Expense 78 52 (Gain) on extinguishment of debt 0 (9) Provision for Income Taxes (44) 38 Net Income $ (12) $ 123 Diluted EPS ($0.08) $0.78 (1) $ 2 $ 116 Adjusted Net Income (Non-GAAP) (1) $0.01 $0.74 Adjusted Diluted EPS (Non-GAAP) Key Balance Sheet Items October 31, 2020 November 2, 2019 (Dollars in Millions) Cash and Cash Equivalents $ 1,939 $ 490 Merchandise Inventories 3,607 4,887 Accounts Payable 2,184 2,454 Long-term Debt 2,450 1,856 Key Cash Flow items October 31, 2020 (Dollars in Millions) Three Months Ended Nine Months Ended Operating Cash Flow $ 606 $ 910 Capital Expenditures (68) (264) Net, Finance lease and financing obligations (27) (68) (1) $ 511 $ 578 Free Cash Flow 10 10 (1) - Adjusted Net Income, Adjusted EPS, and Free Cash Flow are non-GAAP financial measures. Please refer to the reconciliation included in the Appendix for more information. 10Q3 2020 Key Metrics Consolidated Statement of Operations Three Months Ended (Dollars in Millions) October 31, 2020 November 2, 2019 Net Sales $ 3,779 $ 4,358 Total Revenue 3,979 4,625 Gross Margin Rate 35.8% 36.3% SG&A 1,302 1,419 Depreciation 210 227 Impairments, Store Closings, and Other Costs 21 0 Operating Income $ 22 $ 204 Interest Expense 78 52 (Gain) on extinguishment of debt 0 (9) Provision for Income Taxes (44) 38 Net Income $ (12) $ 123 Diluted EPS ($0.08) $0.78 (1) $ 2 $ 116 Adjusted Net Income (Non-GAAP) (1) $0.01 $0.74 Adjusted Diluted EPS (Non-GAAP) Key Balance Sheet Items October 31, 2020 November 2, 2019 (Dollars in Millions) Cash and Cash Equivalents $ 1,939 $ 490 Merchandise Inventories 3,607 4,887 Accounts Payable 2,184 2,454 Long-term Debt 2,450 1,856 Key Cash Flow items October 31, 2020 (Dollars in Millions) Three Months Ended Nine Months Ended Operating Cash Flow $ 606 $ 910 Capital Expenditures (68) (264) Net, Finance lease and financing obligations (27) (68) (1) $ 511 $ 578 Free Cash Flow 10 10 (1) - Adjusted Net Income, Adjusted EPS, and Free Cash Flow are non-GAAP financial measures. Please refer to the reconciliation included in the Appendix for more information. 10
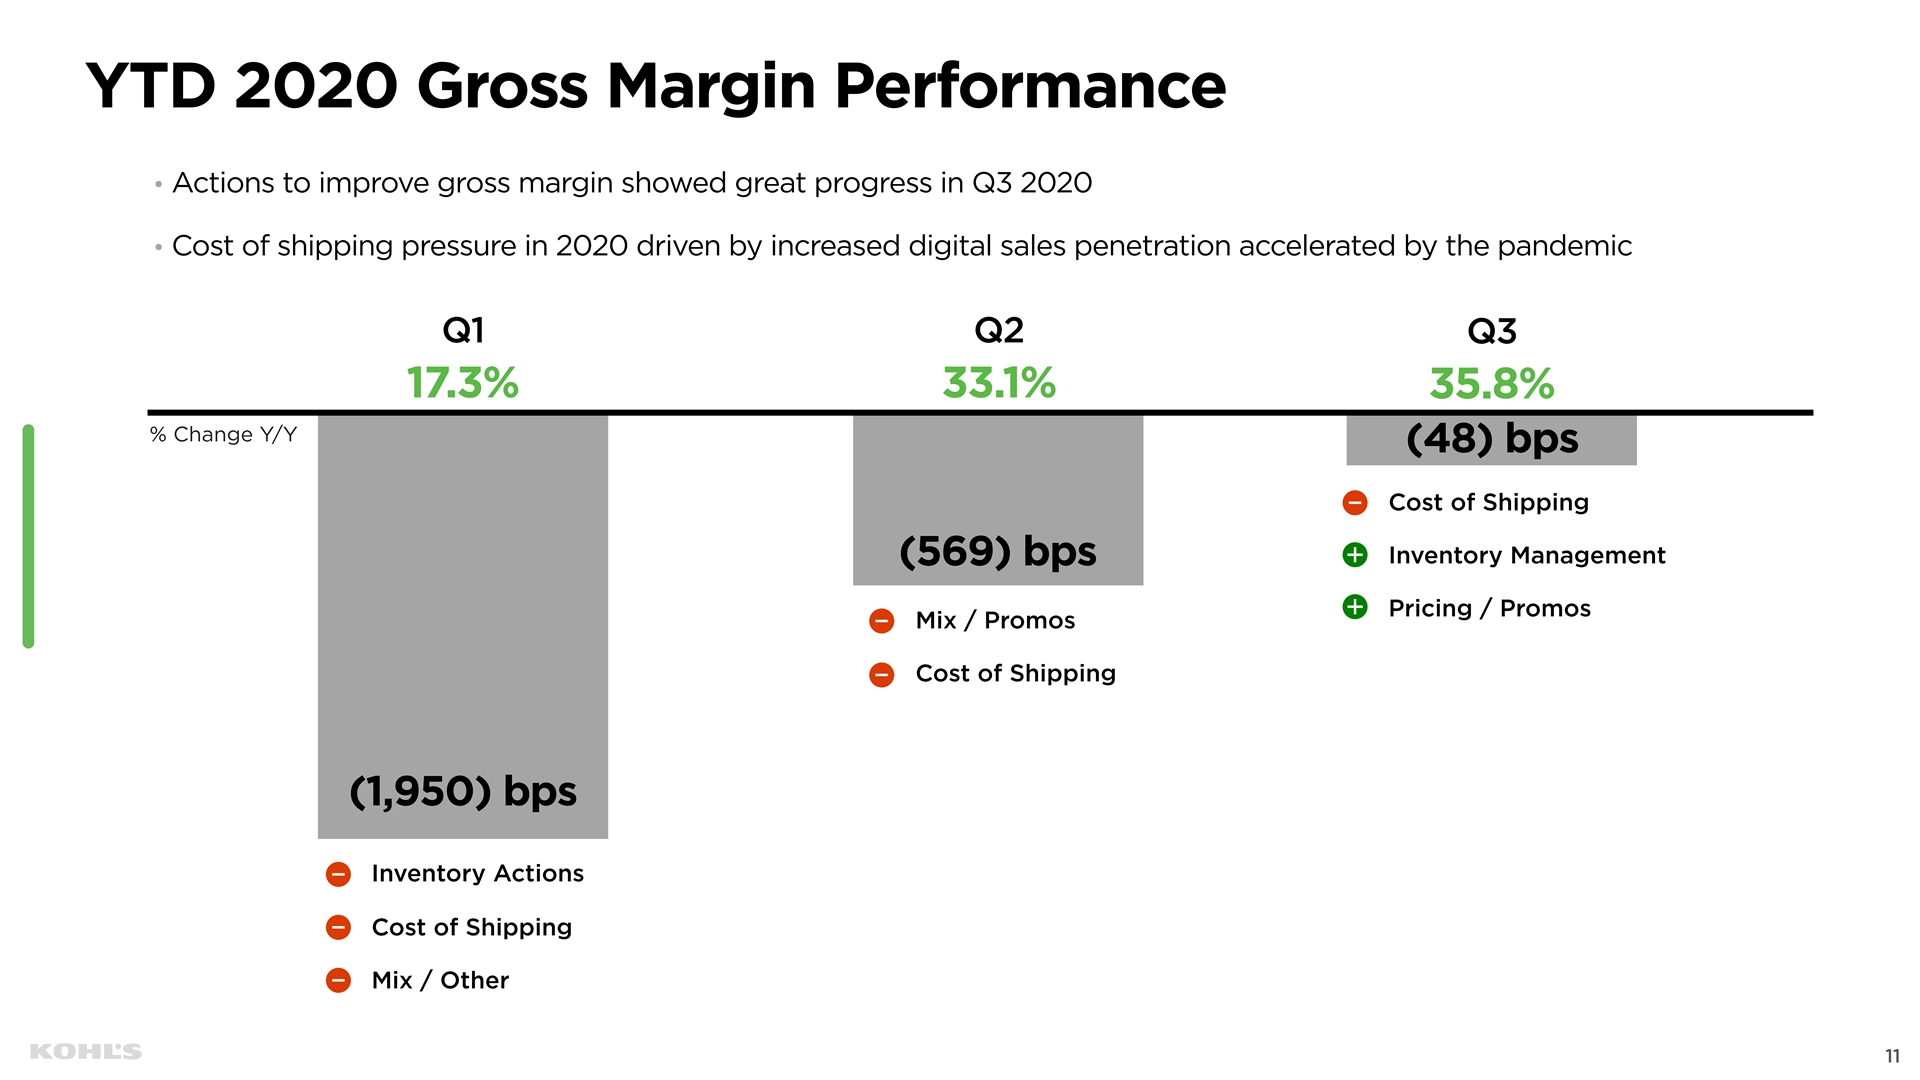
YTD 2020 Gross Margin Performance Actions to improve gross margin showed great progress in Q3 2020 • Cost of shipping pressure in 2020 driven by increased digital sales penetration accelerated by the pandemic • Q1 Q2 Q3 17.3% 33.1% 35.8% % Change Y/Y (48) bps Cost of Shipping Inventory Management (569) bps Pricing / Promos Mix / Promos Cost of Shipping (1,950) bps 11 Inventory Actions Cost of Shipping Mix / Other 11 YTD 2020 Gross Margin Performance Actions to improve gross margin showed great progress in Q3 2020 • Cost of shipping pressure in 2020 driven by increased digital sales penetration accelerated by the pandemic • Q1 Q2 Q3 17.3% 33.1% 35.8% % Change Y/Y (48) bps Cost of Shipping Inventory Management (569) bps Pricing / Promos Mix / Promos Cost of Shipping (1,950) bps 11 Inventory Actions Cost of Shipping Mix / Other 11
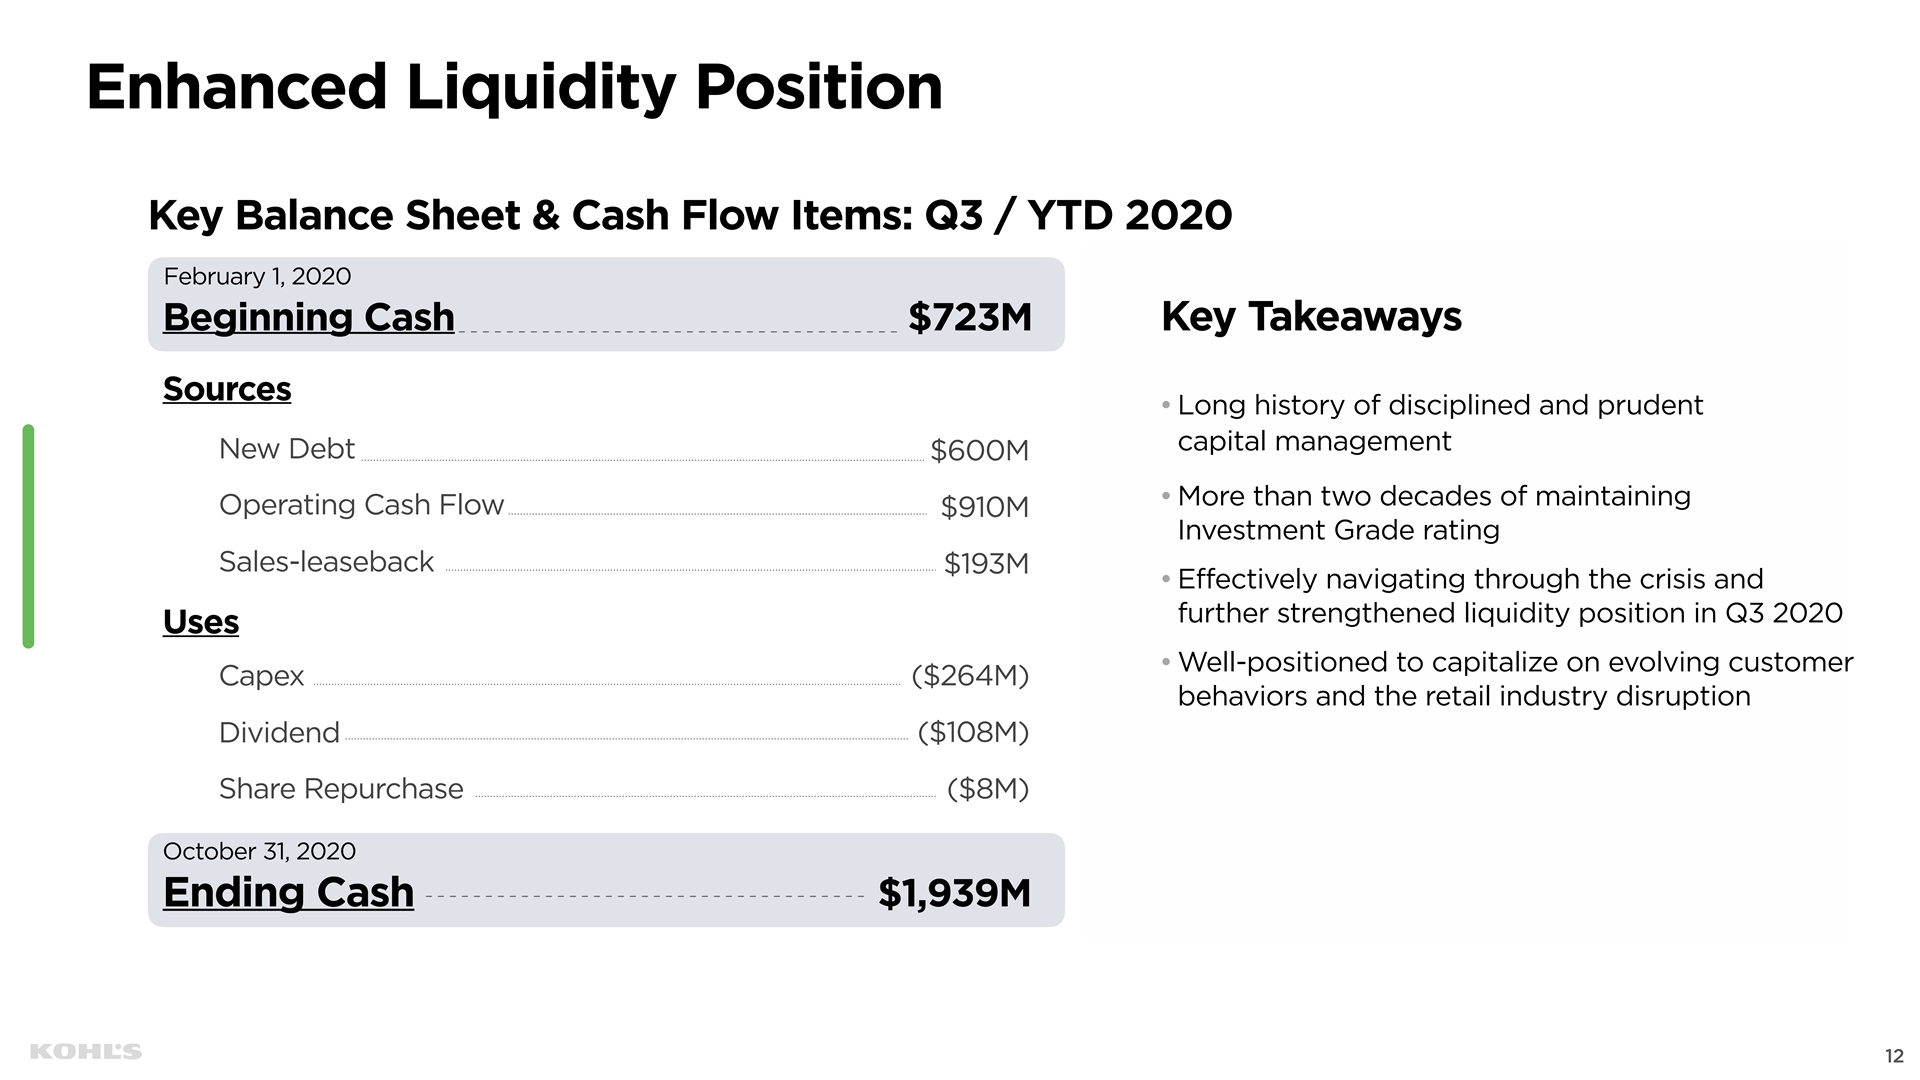
Enhanced Liquidity Position Key Balance Sheet & Cash Flow Items: Q3 / YTD 2020 February 1, 2020 Beginning Cash $723M Key Takeaways Sources • Long history of disciplined and prudent capital management New Debt $600M • More than two decades of maintaining Operating Cash Flow $910M Investment Grade rating Sales-leaseback $193M • Effectively navigating through the crisis and further strengthened liquidity position in Q3 2020 Uses • Well-positioned to capitalize on evolving customer Capex ($264M) behaviors and the retail industry disruption Dividend ($108M) Share Repurchase ($8M) October 31, 2020 Ending Cash $1,939M 12 Enhanced Liquidity Position Key Balance Sheet & Cash Flow Items: Q3 / YTD 2020 February 1, 2020 Beginning Cash $723M Key Takeaways Sources • Long history of disciplined and prudent capital management New Debt $600M • More than two decades of maintaining Operating Cash Flow $910M Investment Grade rating Sales-leaseback $193M • Effectively navigating through the crisis and further strengthened liquidity position in Q3 2020 Uses • Well-positioned to capitalize on evolving customer Capex ($264M) behaviors and the retail industry disruption Dividend ($108M) Share Repurchase ($8M) October 31, 2020 Ending Cash $1,939M 12
Q4 2020 Outlook 13 Q4 2020 Outlook 13
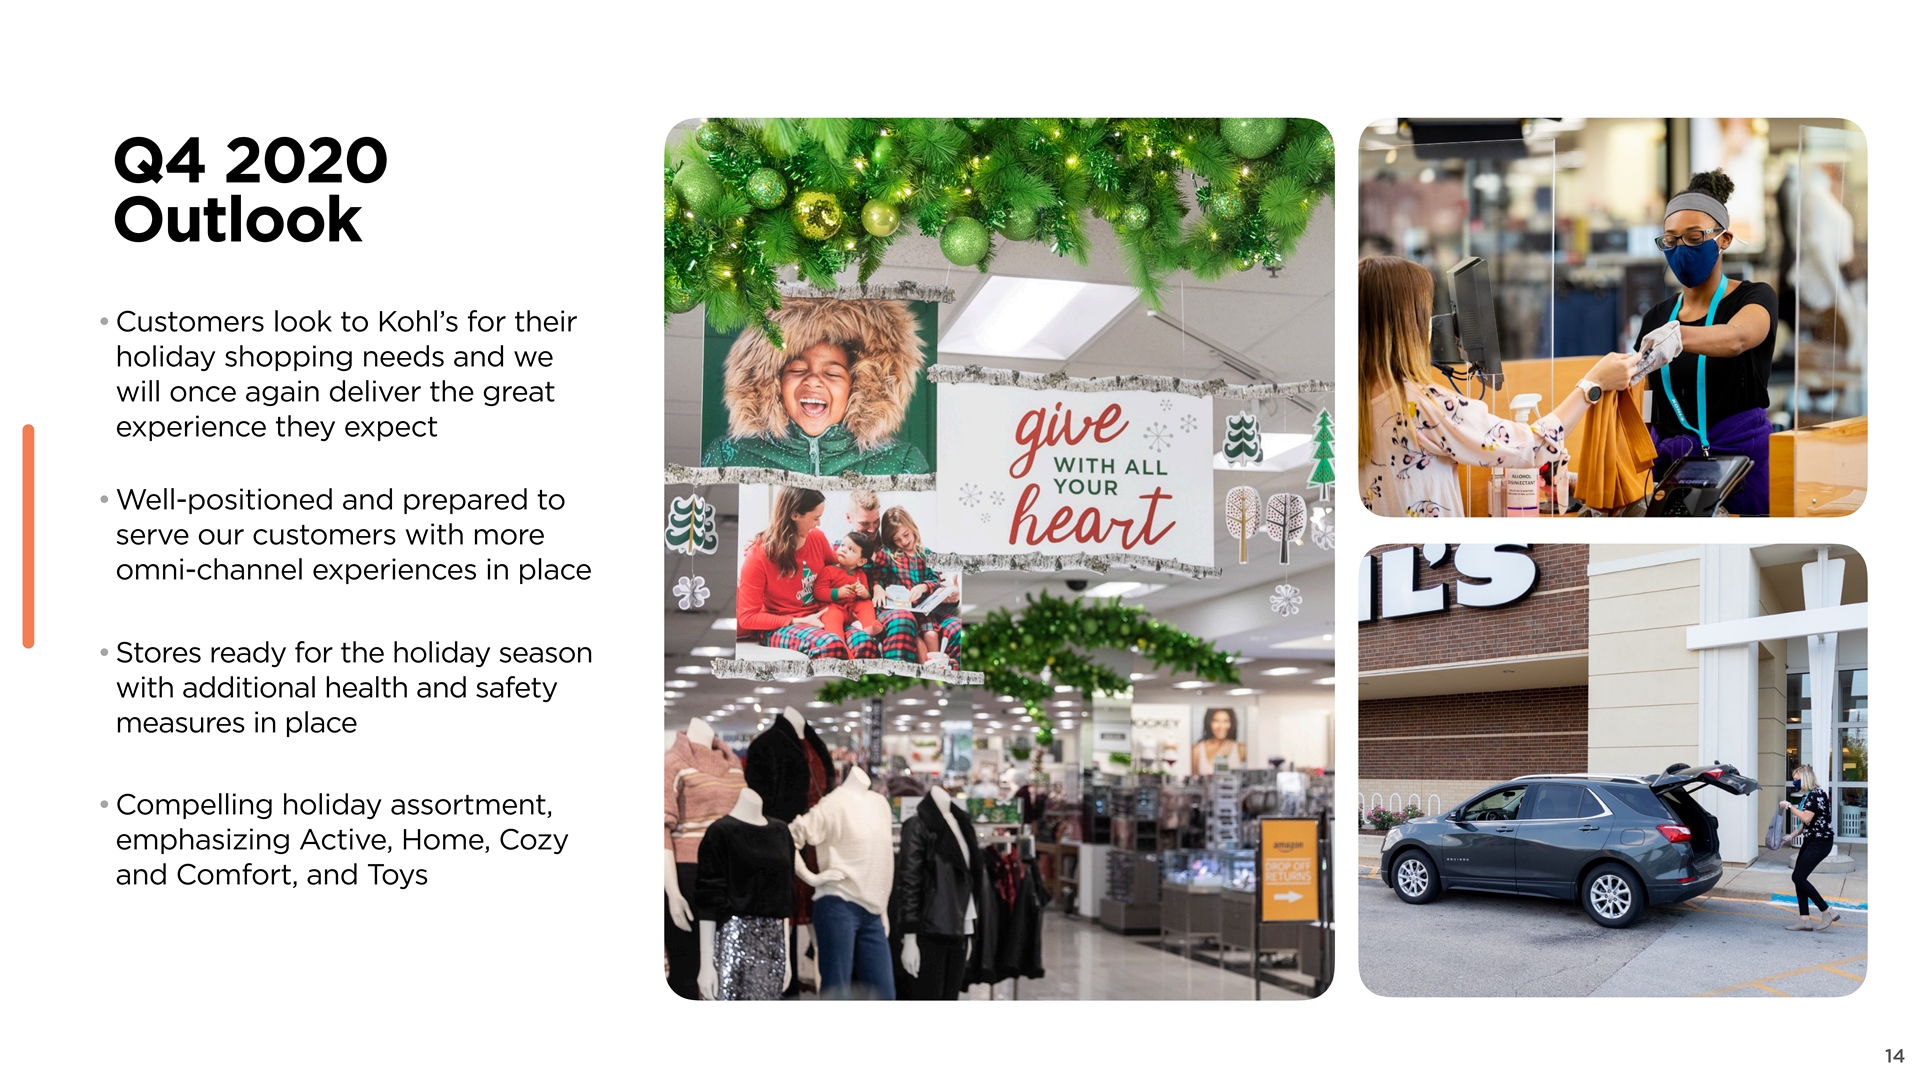
Q4 2020 Outlook • Customers look to Kohl’s for their holiday shopping needs and we will once again deliver the great experience they expect • Well-positioned and prepared to serve our customers with more omni-channel experiences in place • Stores ready for the holiday season with additional health and safety measures in place • Compelling holiday assortment, emphasizing Active, Home, Cozy and Comfort, and Toys 14Q4 2020 Outlook • Customers look to Kohl’s for their holiday shopping needs and we will once again deliver the great experience they expect • Well-positioned and prepared to serve our customers with more omni-channel experiences in place • Stores ready for the holiday season with additional health and safety measures in place • Compelling holiday assortment, emphasizing Active, Home, Cozy and Comfort, and Toys 14
Our Strategy 15 Our Strategy 15
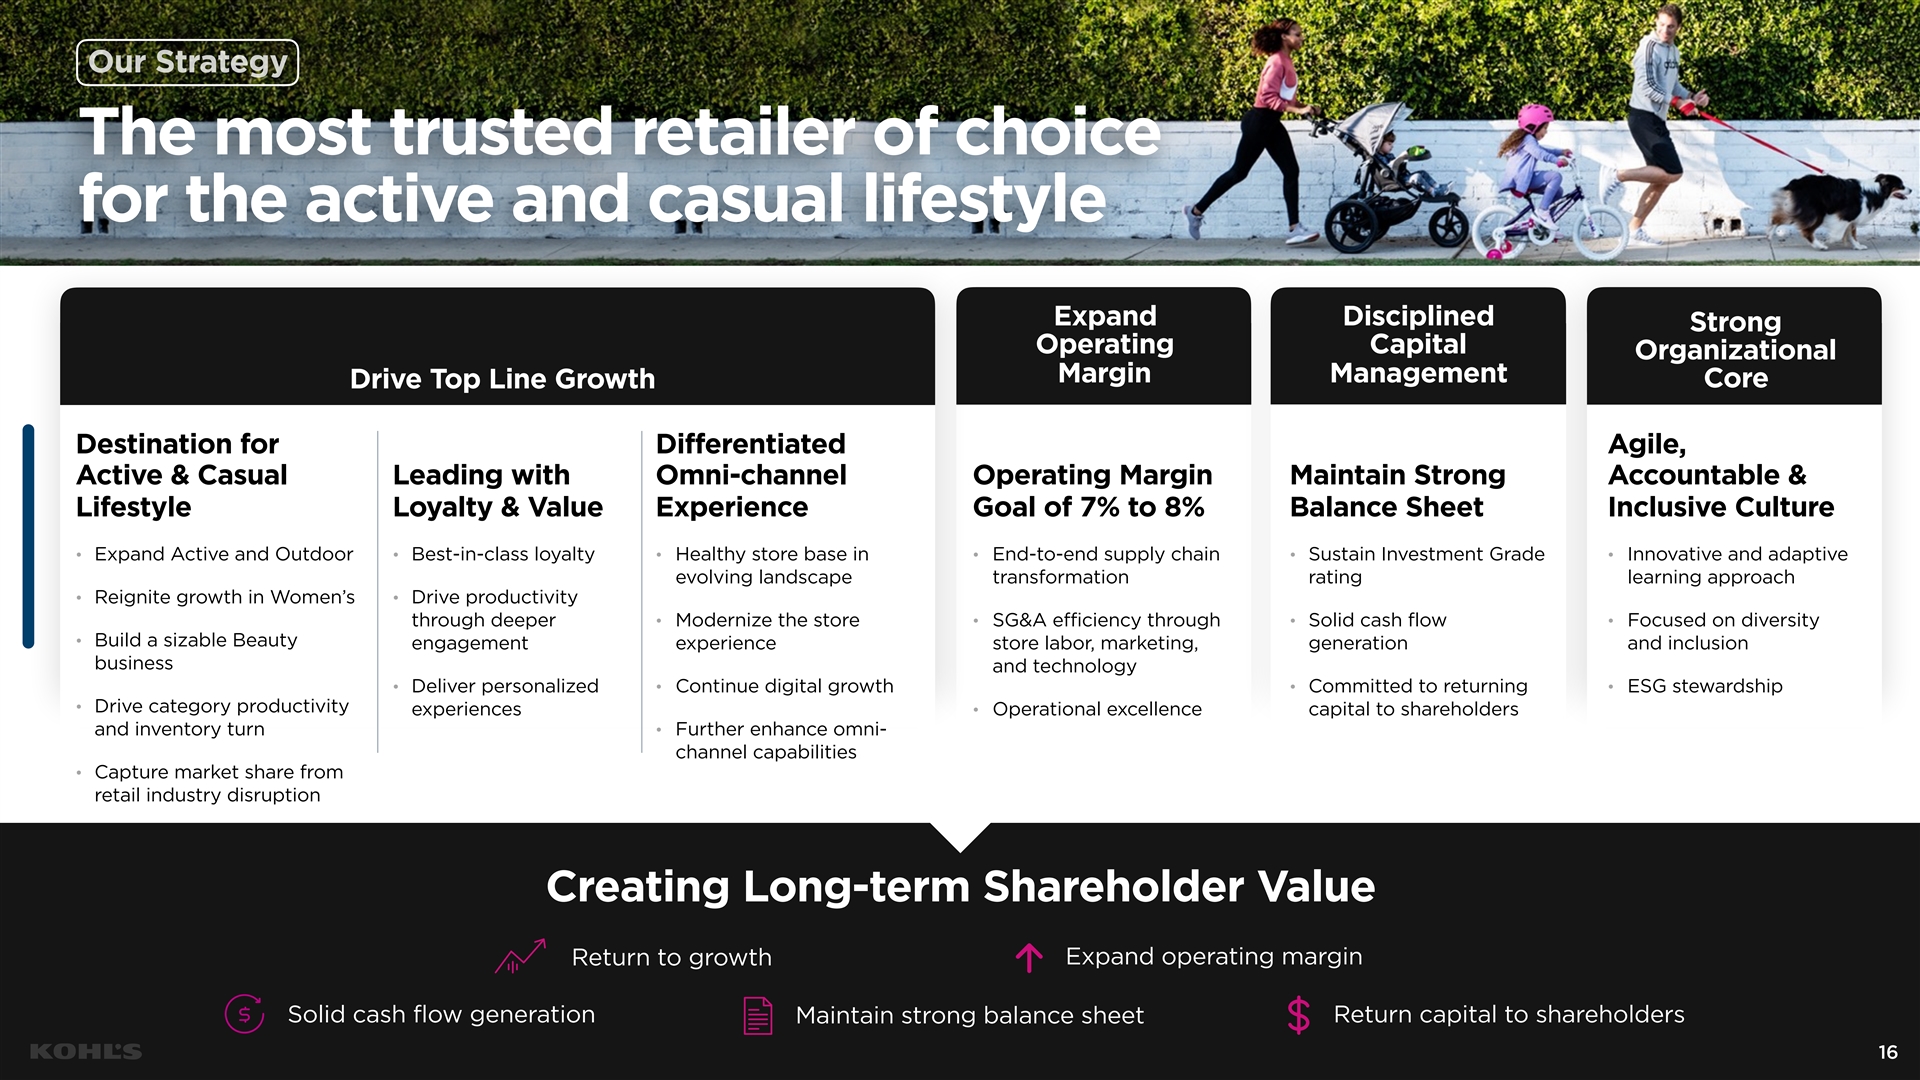
Our Strategy The most trusted retailer of choice for the active and casual lifestyle Expand Disciplined Strong Operating Capital Organizational Margin Management Core Drive Top Line Growth Destination for Differentiated Agile, Active & Casual Leading with Omni-channel Operating Margin Maintain Strong Accountable & Lifestyle Loyalty & Value Experience Goal of 7% to 8% Balance Sheet Inclusive Culture Expand Active and Outdoor Best-in-class loyalty Healthy store base in End-to-end supply chain Sustain Investment Grade Innovative and adaptive • • • • • • evolving landscape transformation rating learning approach Reignite growth in Women’s Drive productivity • • through deeper Modernize the store SG&A efficiency through Solid cash flow Focused on diversity • • • • Build a sizable Beauty • engagement experience store labor, marketing, generation and inclusion business and technology Deliver personalized Continue digital growth Committed to returning ESG stewardship • • • • Drive category productivity • experiences Operational excellence capital to shareholders • and inventory turn Further enhance omni- • channel capabilities Capture market share from • retail industry disruption Creating Long-term Shareholder Value Expand operating margin Return to growth Solid cash flow generation Return capital to shareholders Maintain strong balance sheet 16Our Strategy The most trusted retailer of choice for the active and casual lifestyle Expand Disciplined Strong Operating Capital Organizational Margin Management Core Drive Top Line Growth Destination for Differentiated Agile, Active & Casual Leading with Omni-channel Operating Margin Maintain Strong Accountable & Lifestyle Loyalty & Value Experience Goal of 7% to 8% Balance Sheet Inclusive Culture Expand Active and Outdoor Best-in-class loyalty Healthy store base in End-to-end supply chain Sustain Investment Grade Innovative and adaptive • • • • • • evolving landscape transformation rating learning approach Reignite growth in Women’s Drive productivity • • through deeper Modernize the store SG&A efficiency through Solid cash flow Focused on diversity • • • • Build a sizable Beauty • engagement experience store labor, marketing, generation and inclusion business and technology Deliver personalized Continue digital growth Committed to returning ESG stewardship • • • • Drive category productivity • experiences Operational excellence capital to shareholders • and inventory turn Further enhance omni- • channel capabilities Capture market share from • retail industry disruption Creating Long-term Shareholder Value Expand operating margin Return to growth Solid cash flow generation Return capital to shareholders Maintain strong balance sheet 16
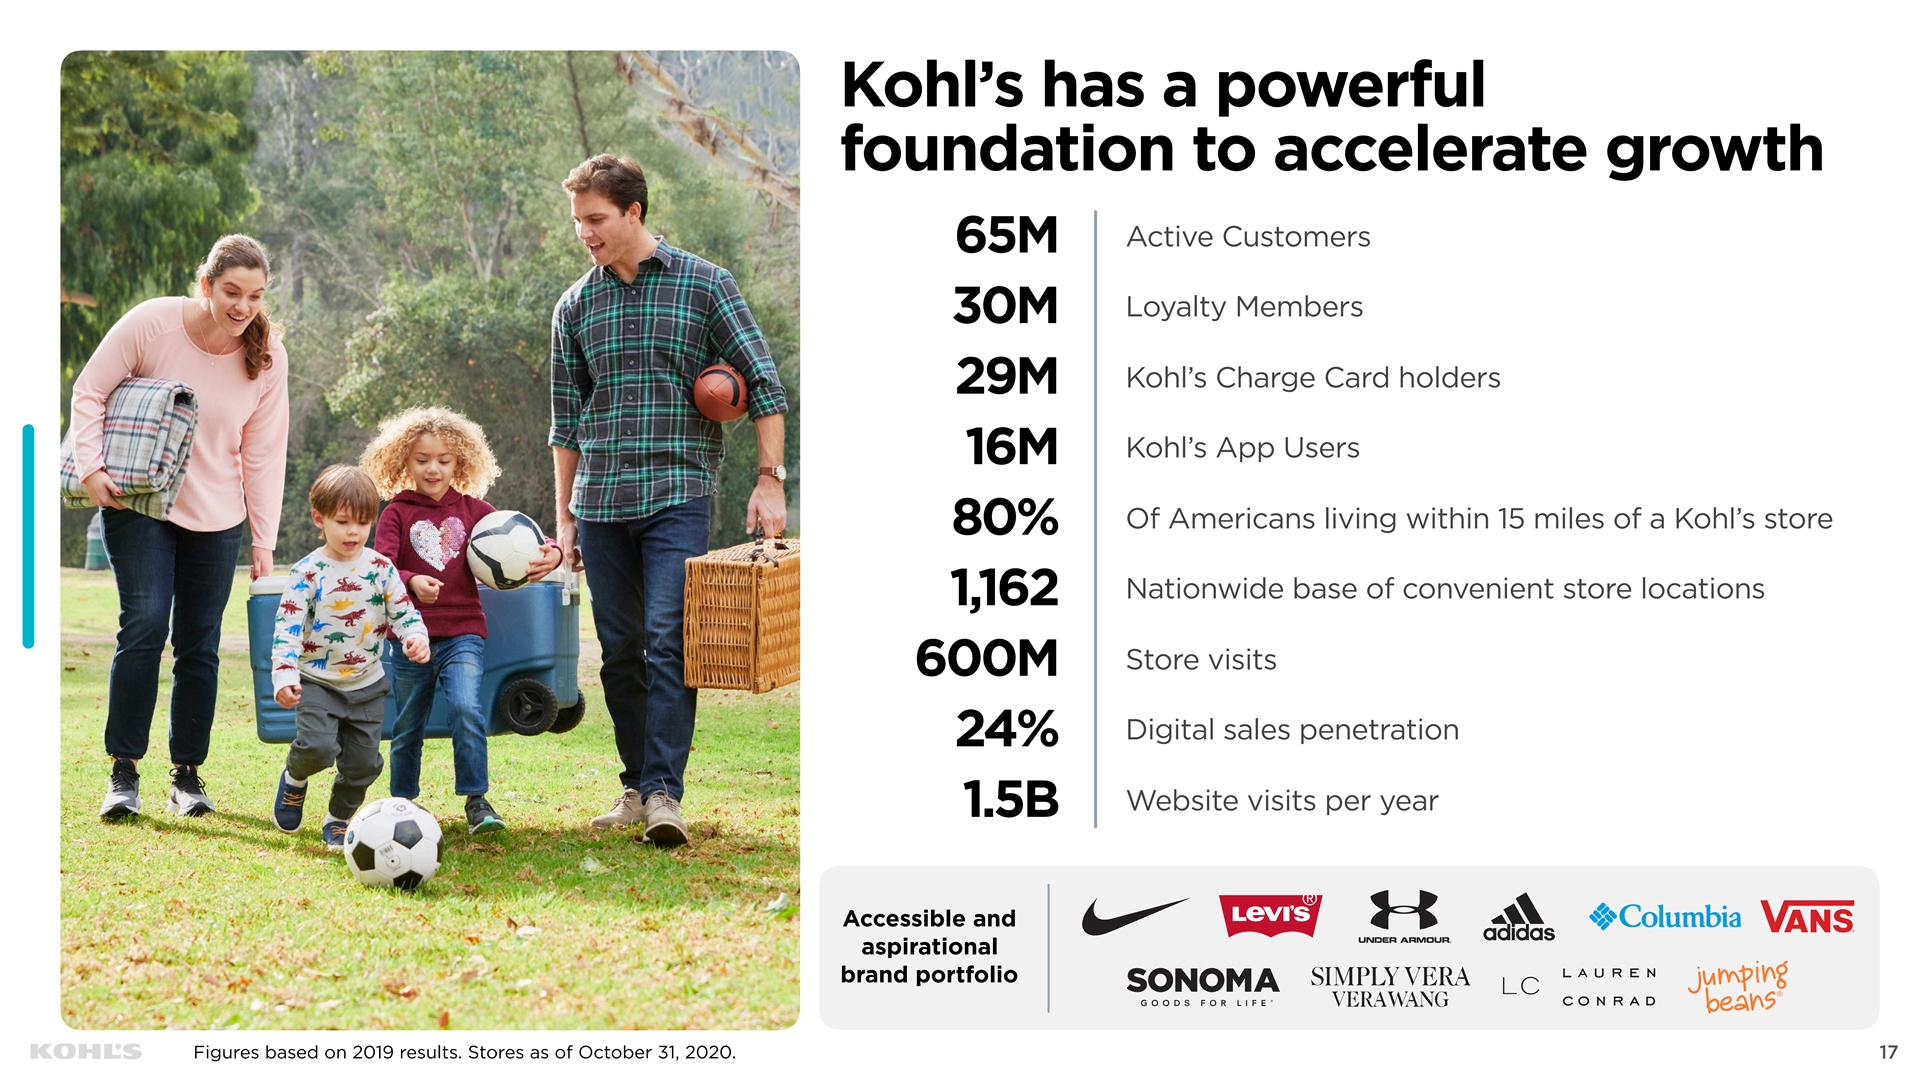
Kohl’s has a powerful foundation to accelerate growth Active Customers 65M Loyalty Members 30M Kohl’s Charge Card holders 29M Kohl’s App Users 16M Of Americans living within 15 miles of a Kohl’s store 80% Nationwide base of convenient store locations 1,162 Store visits 600M Digital sales penetration 24% Website visits per year 1.5B Accessible and aspirational brand portfolio Figures based on 2019 results. Stores as of October 31, 2020. 17Kohl’s has a powerful foundation to accelerate growth Active Customers 65M Loyalty Members 30M Kohl’s Charge Card holders 29M Kohl’s App Users 16M Of Americans living within 15 miles of a Kohl’s store 80% Nationwide base of convenient store locations 1,162 Store visits 600M Digital sales penetration 24% Website visits per year 1.5B Accessible and aspirational brand portfolio Figures based on 2019 results. Stores as of October 31, 2020. 17
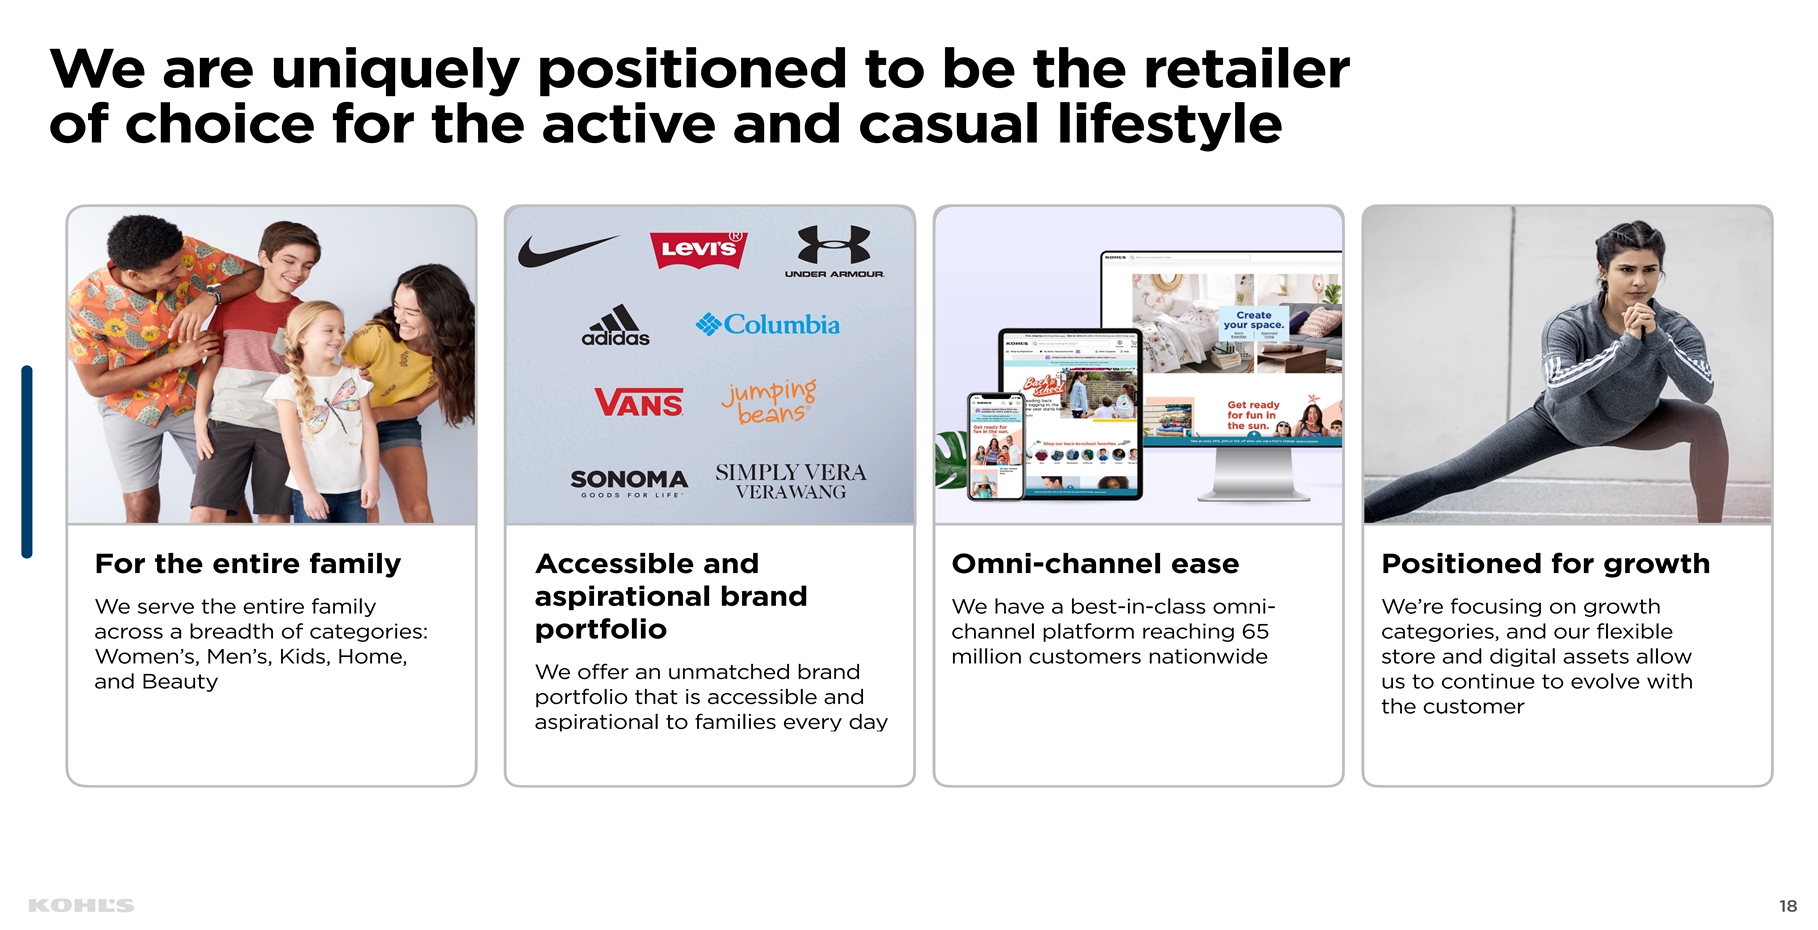
We are uniquely positioned to be the retailer of choice for the active and casual lifestyle For the entire family Accessible and Omni-channel ease Positioned for growth aspirational brand We serve the entire family We have a best-in-class omni- We’re focusing on growth across a breadth of categories: portfolio channel platform reaching 65 categories, and our flexible Women’s, Men’s, Kids, Home, million customers nationwide store and digital assets allow We offer an unmatched brand and Beauty us to continue to evolve with portfolio that is accessible and the customer aspirational to families every day 18 We are uniquely positioned to be the retailer of choice for the active and casual lifestyle For the entire family Accessible and Omni-channel ease Positioned for growth aspirational brand We serve the entire family We have a best-in-class omni- We’re focusing on growth across a breadth of categories: portfolio channel platform reaching 65 categories, and our flexible Women’s, Men’s, Kids, Home, million customers nationwide store and digital assets allow We offer an unmatched brand and Beauty us to continue to evolve with portfolio that is accessible and the customer aspirational to families every day 18
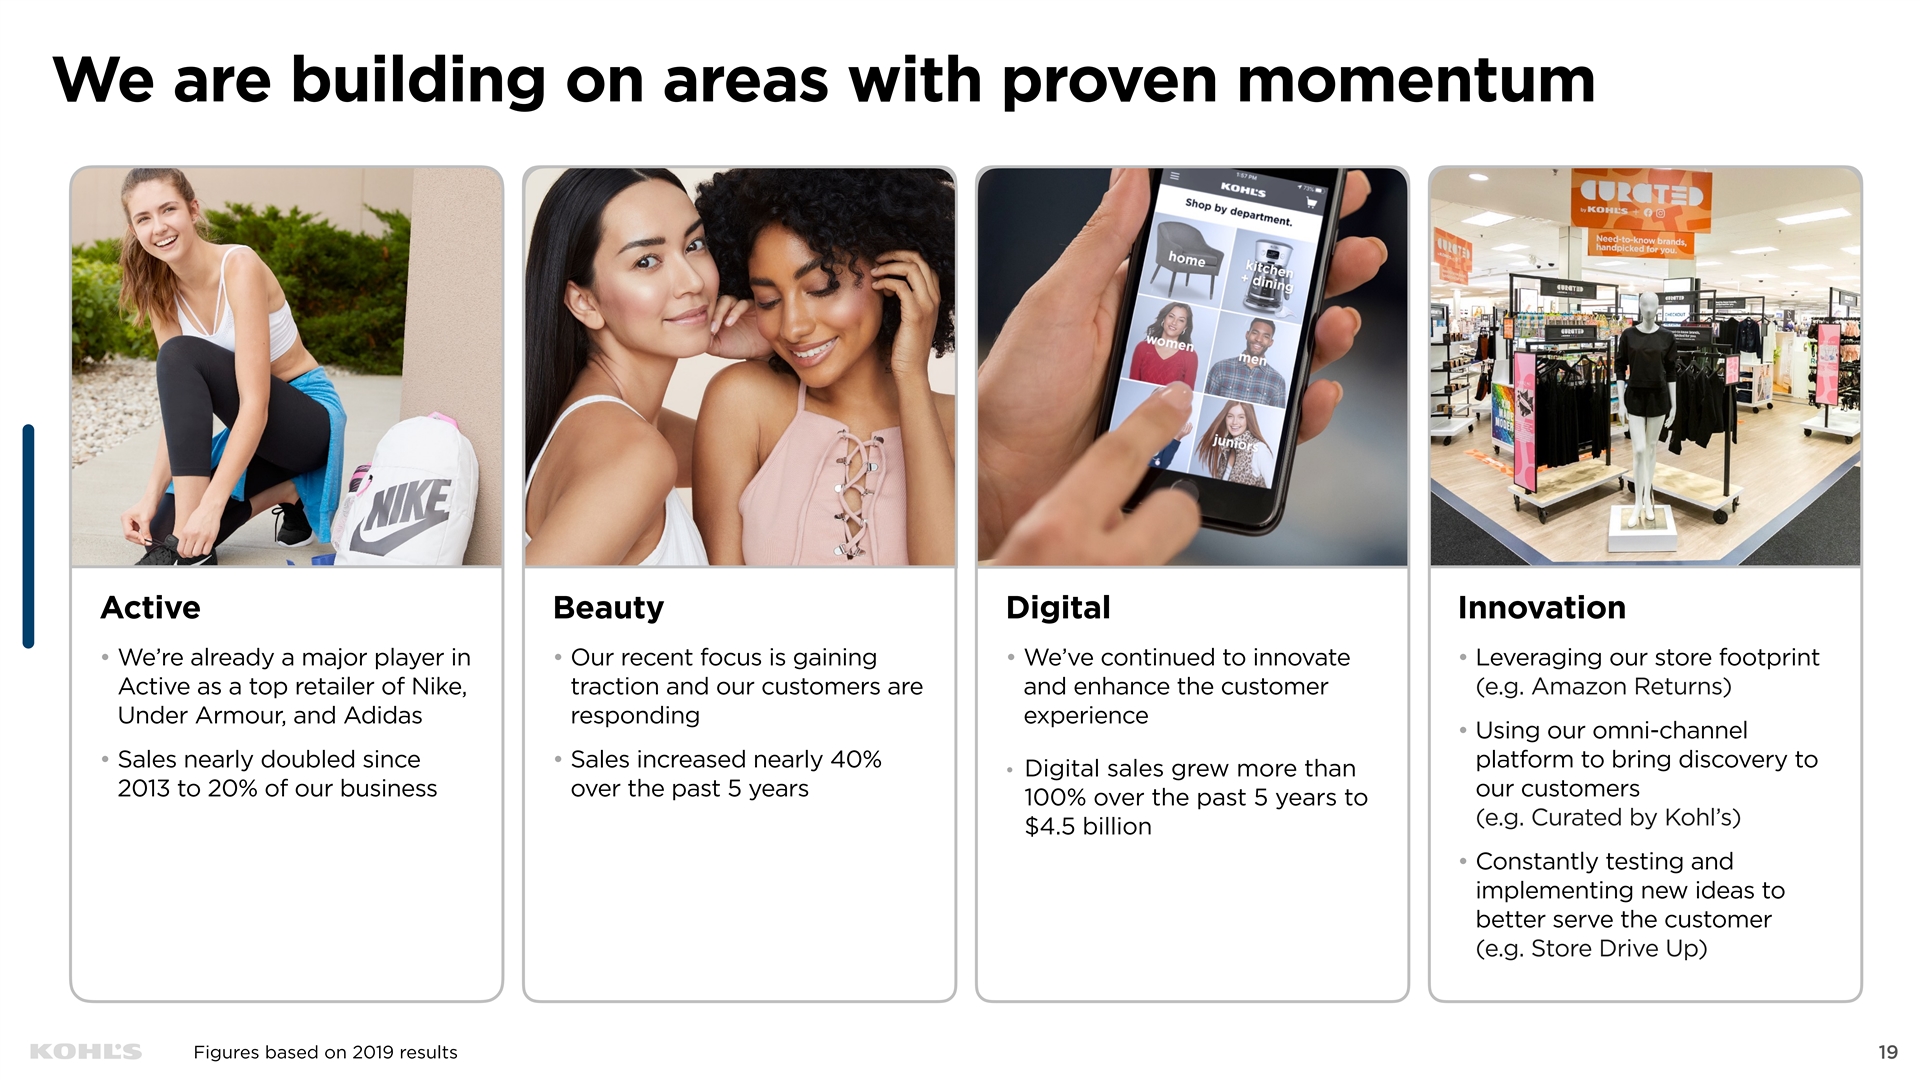
We are building on areas with proven momentum Active Beauty Digital Innovation • We’re already a major player in • Our recent focus is gaining • We’ve continued to innovate • Leveraging our store footprint Active as a top retailer of Nike, traction and our customers are and enhance the customer (e.g. Amazon Returns) Under Armour, and Adidas responding experience • Using our omni-channel • Sales nearly doubled since • Sales increased nearly 40% platform to bring discovery to Digital sales grew more than • 2013 to 20% of our business over the past 5 years our customers 100% over the past 5 years to (e.g. Curated by Kohl’s) $4.5 billion • Constantly testing and implementing new ideas to better serve the customer (e.g. Store Drive Up) Figures based on 2019 results 19We are building on areas with proven momentum Active Beauty Digital Innovation • We’re already a major player in • Our recent focus is gaining • We’ve continued to innovate • Leveraging our store footprint Active as a top retailer of Nike, traction and our customers are and enhance the customer (e.g. Amazon Returns) Under Armour, and Adidas responding experience • Using our omni-channel • Sales nearly doubled since • Sales increased nearly 40% platform to bring discovery to Digital sales grew more than • 2013 to 20% of our business over the past 5 years our customers 100% over the past 5 years to (e.g. Curated by Kohl’s) $4.5 billion • Constantly testing and implementing new ideas to better serve the customer (e.g. Store Drive Up) Figures based on 2019 results 19
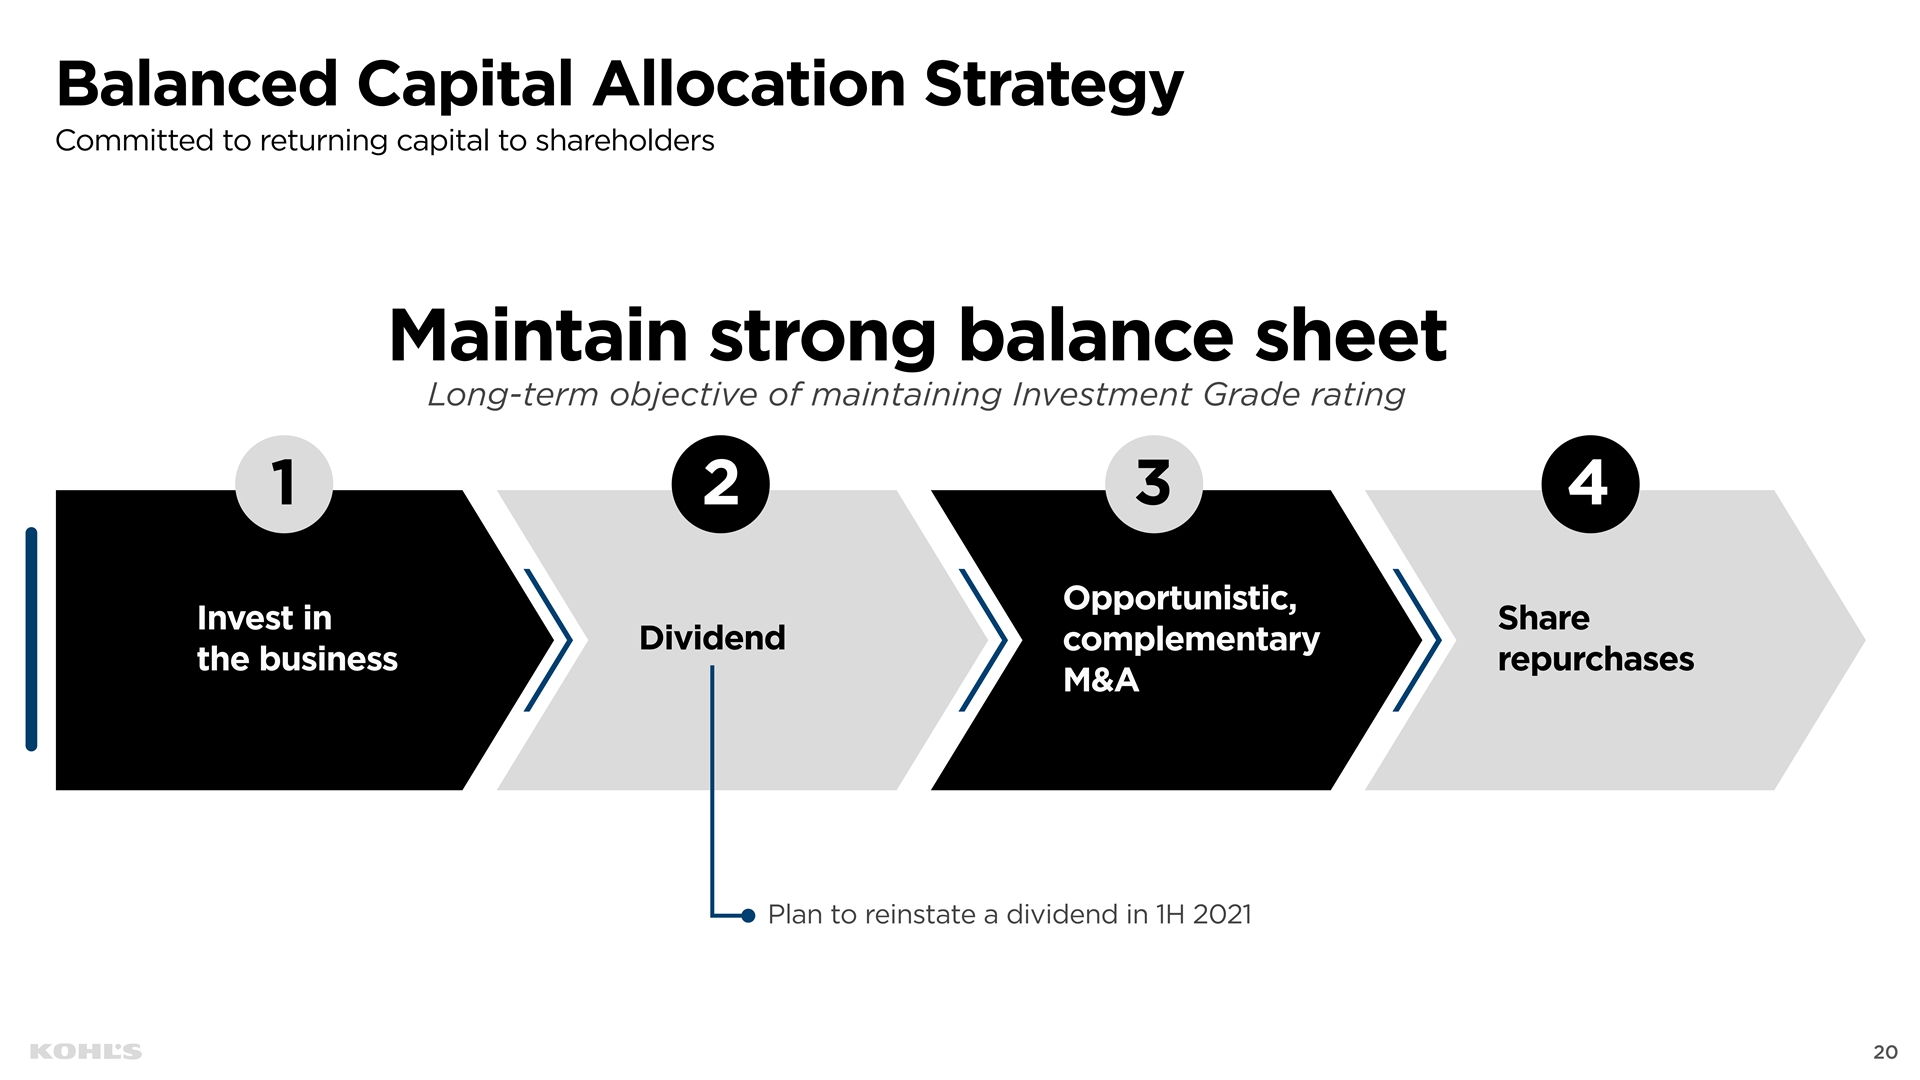
Balanced Capital Allocation Strategy Committed to returning capital to shareholders Maintain strong balance sheet Long-term objective of maintaining Investment Grade rating 1 2 3 4 Opportunistic, Invest in Share Dividend complementary the business repurchases M&A Plan to reinstate a dividend in 1H 2021 20Balanced Capital Allocation Strategy Committed to returning capital to shareholders Maintain strong balance sheet Long-term objective of maintaining Investment Grade rating 1 2 3 4 Opportunistic, Invest in Share Dividend complementary the business repurchases M&A Plan to reinstate a dividend in 1H 2021 20
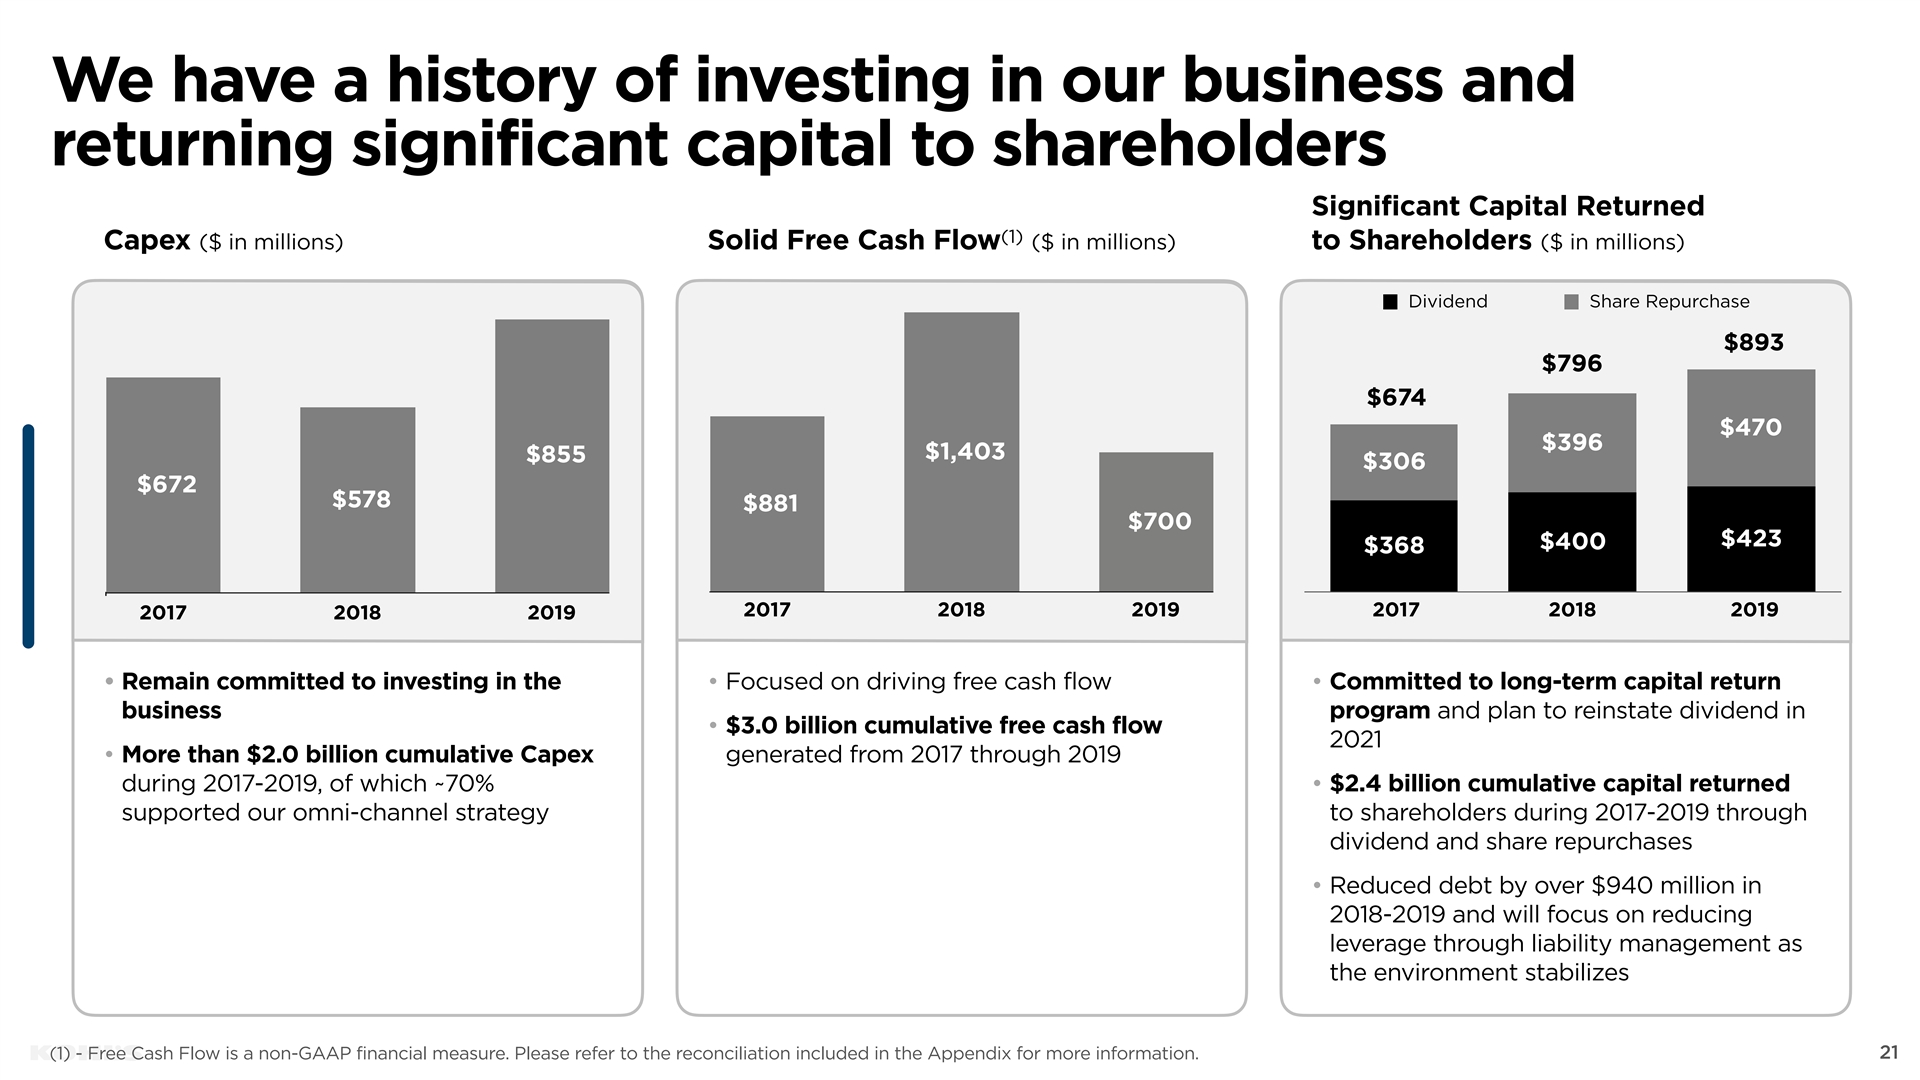
We have a history of investing in our business and returning significant capital to shareholders Significant Capital Returned (1) Capex ($ in millions) Solid Free Cash Flow ($ in millions) to Shareholders ($ in millions) Dividend Share Repurchase $893 $796 $674 $470 $396 $1,403 $855 $306 $672 $578 $881 $700 $423 $400 $368 2017 2018 2019 2017 2018 2019 2017 2018 2019 • Remain committed to investing in the • Focused on driving free cash flow • Committed to long-term capital return business program and plan to reinstate dividend in • $3.0 billion cumulative free cash flow 2021 • More than $2.0 billion cumulative Capex generated from 2017 through 2019 during 2017-2019, of which ~70% • $2.4 billion cumulative capital returned supported our omni-channel strategy to shareholders during 2017-2019 through dividend and share repurchases • Reduced debt by over $940 million in 2018-2019 and will focus on reducing leverage through liability management as the environment stabilizes (1) - Free Cash Flow is a non-GAAP financial measure. Please refer to the reconciliation included in the Appendix for more information. 21 We have a history of investing in our business and returning significant capital to shareholders Significant Capital Returned (1) Capex ($ in millions) Solid Free Cash Flow ($ in millions) to Shareholders ($ in millions) Dividend Share Repurchase $893 $796 $674 $470 $396 $1,403 $855 $306 $672 $578 $881 $700 $423 $400 $368 2017 2018 2019 2017 2018 2019 2017 2018 2019 • Remain committed to investing in the • Focused on driving free cash flow • Committed to long-term capital return business program and plan to reinstate dividend in • $3.0 billion cumulative free cash flow 2021 • More than $2.0 billion cumulative Capex generated from 2017 through 2019 during 2017-2019, of which ~70% • $2.4 billion cumulative capital returned supported our omni-channel strategy to shareholders during 2017-2019 through dividend and share repurchases • Reduced debt by over $940 million in 2018-2019 and will focus on reducing leverage through liability management as the environment stabilizes (1) - Free Cash Flow is a non-GAAP financial measure. Please refer to the reconciliation included in the Appendix for more information. 21
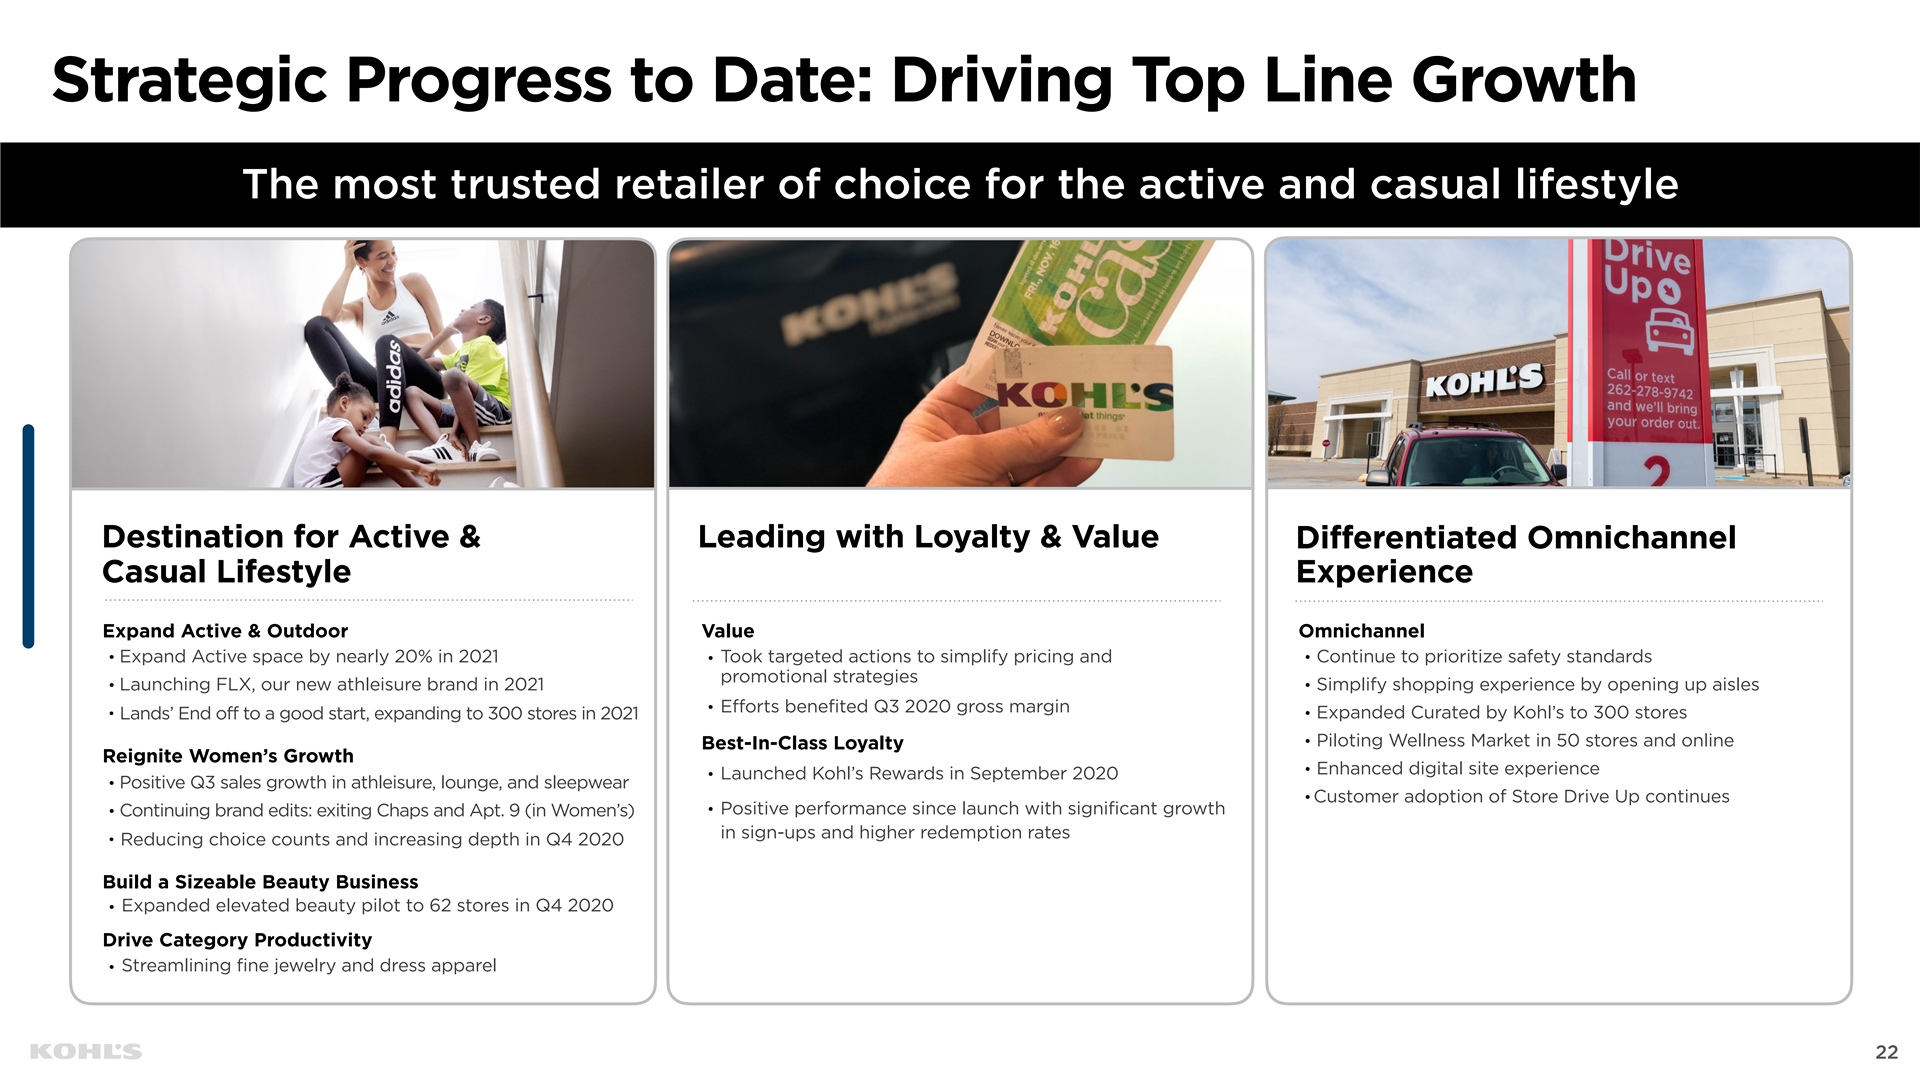
Strategic Progress to Date: Driving Top Line Growth The most trusted retailer of choice for the active and casual lifestyle Destination for Active & Leading with Loyalty & Value Differentiated Omnichannel Casual Lifestyle Experience Expand Active & Outdoor Value Omnichannel Expand Active space by nearly 20% in 2021 Took targeted actions to simplify pricing and Continue to prioritize safety standards • • • promotional strategies Launching FLX, our new athleisure brand in 2021 Simplify shopping experience by opening up aisles • • Efforts benefited Q3 2020 gross margin • Expanded Curated by Kohl’s to 300 stores • Lands’ End off to a good start, expanding to 300 stores in 2021 • Piloting Wellness Market in 50 stores and online • Best-In-Class Loyalty Reignite Women’s Growth Enhanced digital site experience • Launched Kohl’s Rewards in September 2020 • Positive Q3 sales growth in athleisure, lounge, and sleepwear • Customer adoption of Store Drive Up continues • Positive performance since launch with significant growth • Continuing brand edits: exiting Chaps and Apt. 9 (in Women’s) • in sign-ups and higher redemption rates • Reducing choice counts and increasing depth in Q4 2020 Build a Sizeable Beauty Business Expanded elevated beauty pilot to 62 stores in Q4 2020 • Drive Category Productivity Streamlining fine jewelry and dress apparel • 22 Strategic Progress to Date: Driving Top Line Growth The most trusted retailer of choice for the active and casual lifestyle Destination for Active & Leading with Loyalty & Value Differentiated Omnichannel Casual Lifestyle Experience Expand Active & Outdoor Value Omnichannel Expand Active space by nearly 20% in 2021 Took targeted actions to simplify pricing and Continue to prioritize safety standards • • • promotional strategies Launching FLX, our new athleisure brand in 2021 Simplify shopping experience by opening up aisles • • Efforts benefited Q3 2020 gross margin • Expanded Curated by Kohl’s to 300 stores • Lands’ End off to a good start, expanding to 300 stores in 2021 • Piloting Wellness Market in 50 stores and online • Best-In-Class Loyalty Reignite Women’s Growth Enhanced digital site experience • Launched Kohl’s Rewards in September 2020 • Positive Q3 sales growth in athleisure, lounge, and sleepwear • Customer adoption of Store Drive Up continues • Positive performance since launch with significant growth • Continuing brand edits: exiting Chaps and Apt. 9 (in Women’s) • in sign-ups and higher redemption rates • Reducing choice counts and increasing depth in Q4 2020 Build a Sizeable Beauty Business Expanded elevated beauty pilot to 62 stores in Q4 2020 • Drive Category Productivity Streamlining fine jewelry and dress apparel • 22
Appendix 23Appendix 23
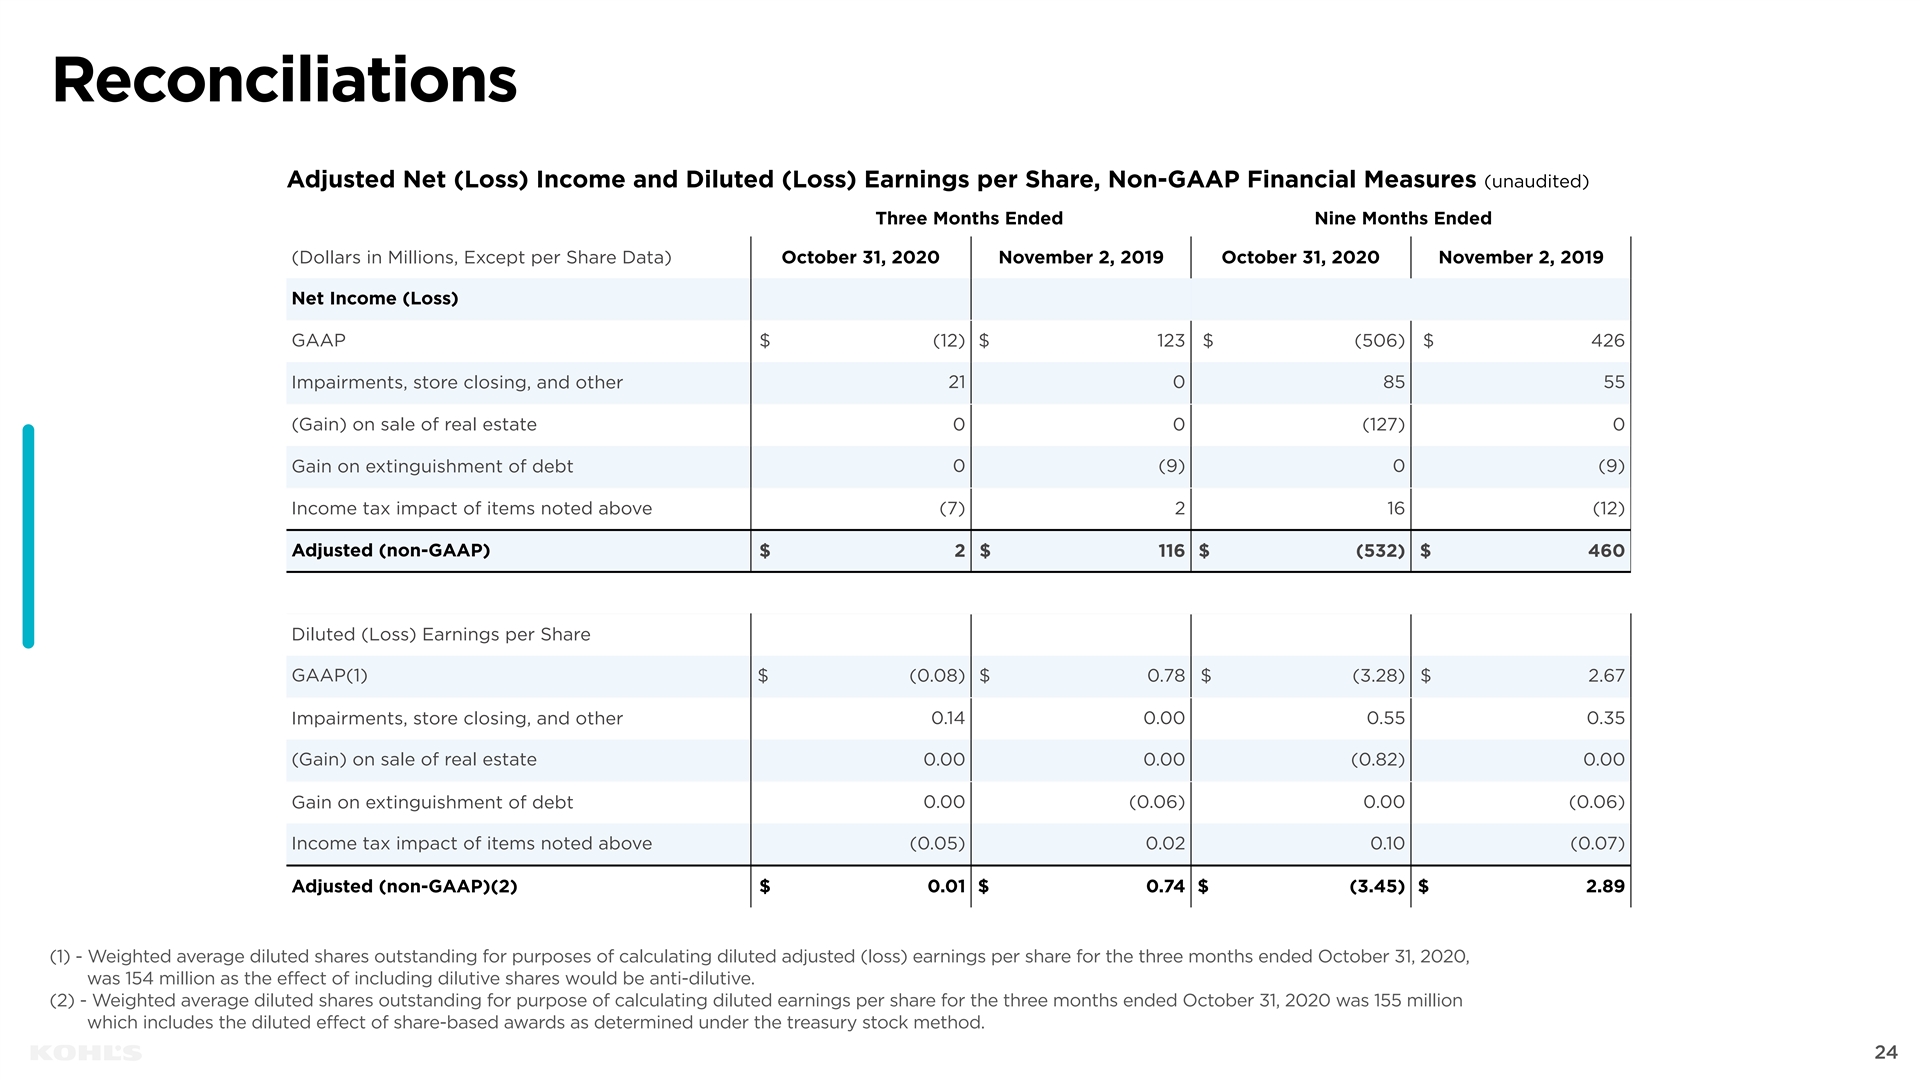
Reconciliations Adjusted Net (Loss) Income and Diluted (Loss) Earnings per Share, Non-GAAP Financial Measures (unaudited) Three Months Ended Nine Months Ended (Dollars in Millions, Except per Share Data) October 31, 2020 November 2, 2019 October 31, 2020 November 2, 2019 Net Income (Loss) GAAP $ (12) $ 123 $ (506) $ 426 Impairments, store closing, and other 21 0 85 55 (Gain) on sale of real estate 0 0 (127) 0 Gain on extinguishment of debt 0 (9) 0 (9) Income tax impact of items noted above (7) 2 16 (12) Adjusted (non-GAAP) $ 2 $ 116 $ (532) $ 460 Diluted (Loss) Earnings per Share GAAP(1) $ (0.08) $ 0.78 $ (3.28) $ 2.67 Impairments, store closing, and other 0.14 0.00 0.55 0.35 (Gain) on sale of real estate 0.00 0.00 (0.82) 0.00 Gain on extinguishment of debt 0.00 (0.06) 0.00 (0.06) Income tax impact of items noted above (0.05) 0.02 0.10 (0.07) Adjusted (non-GAAP)(2) $ 0.01 $ 0.74 $ (3.45) $ 2.89 (1) - Weighted average diluted shares outstanding for purposes of calculating diluted adjusted (loss) earnings per share for the three months ended October 31, 2020, was 154 million as the effect of including dilutive shares would be anti-dilutive. (2) - Weighted average diluted shares outstanding for purpose of calculating diluted earnings per share for the three months ended October 31, 2020 was 155 million which includes the diluted effect of share-based awards as determined under the treasury stock method. 24 Reconciliations Adjusted Net (Loss) Income and Diluted (Loss) Earnings per Share, Non-GAAP Financial Measures (unaudited) Three Months Ended Nine Months Ended (Dollars in Millions, Except per Share Data) October 31, 2020 November 2, 2019 October 31, 2020 November 2, 2019 Net Income (Loss) GAAP $ (12) $ 123 $ (506) $ 426 Impairments, store closing, and other 21 0 85 55 (Gain) on sale of real estate 0 0 (127) 0 Gain on extinguishment of debt 0 (9) 0 (9) Income tax impact of items noted above (7) 2 16 (12) Adjusted (non-GAAP) $ 2 $ 116 $ (532) $ 460 Diluted (Loss) Earnings per Share GAAP(1) $ (0.08) $ 0.78 $ (3.28) $ 2.67 Impairments, store closing, and other 0.14 0.00 0.55 0.35 (Gain) on sale of real estate 0.00 0.00 (0.82) 0.00 Gain on extinguishment of debt 0.00 (0.06) 0.00 (0.06) Income tax impact of items noted above (0.05) 0.02 0.10 (0.07) Adjusted (non-GAAP)(2) $ 0.01 $ 0.74 $ (3.45) $ 2.89 (1) - Weighted average diluted shares outstanding for purposes of calculating diluted adjusted (loss) earnings per share for the three months ended October 31, 2020, was 154 million as the effect of including dilutive shares would be anti-dilutive. (2) - Weighted average diluted shares outstanding for purpose of calculating diluted earnings per share for the three months ended October 31, 2020 was 155 million which includes the diluted effect of share-based awards as determined under the treasury stock method. 24
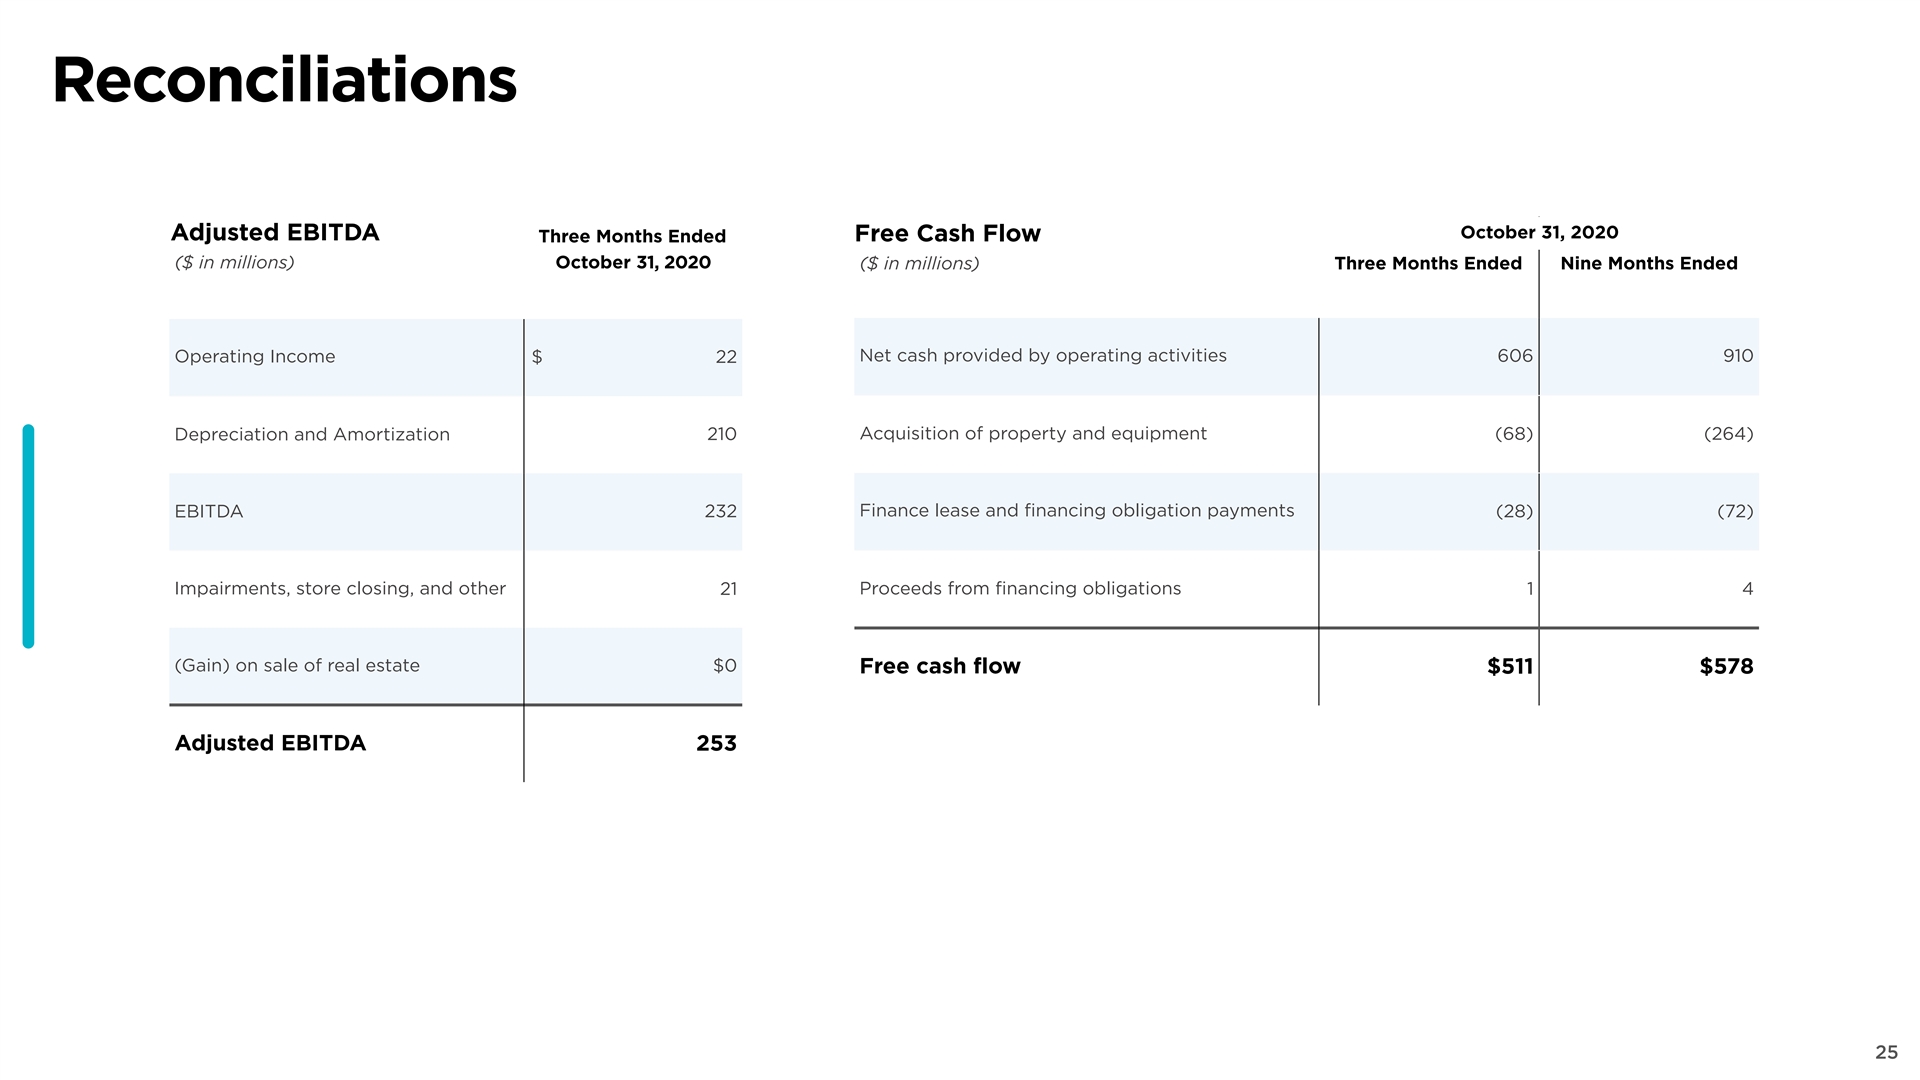
Reconciliations October 31, 2020 Adjusted EBITDA Free Cash Flow Three Months Ended ($ in millions) October 31, 2020 ($ in millions) Three Months Ended Nine Months Ended Net cash provided by operating activities Operating Income 606 910 $ 22 Acquisition of property and equipment Depreciation and Amortization 210 (68) (264) Finance lease and financing obligation payments EBITDA 232 (28) (72) Impairments, store closing, and other Proceeds from financing obligations 21 1 4 (Gain) on sale of real estate $0 Free cash flow $511 $578 Adjusted EBITDA 253 25 Reconciliations October 31, 2020 Adjusted EBITDA Free Cash Flow Three Months Ended ($ in millions) October 31, 2020 ($ in millions) Three Months Ended Nine Months Ended Net cash provided by operating activities Operating Income 606 910 $ 22 Acquisition of property and equipment Depreciation and Amortization 210 (68) (264) Finance lease and financing obligation payments EBITDA 232 (28) (72) Impairments, store closing, and other Proceeds from financing obligations 21 1 4 (Gain) on sale of real estate $0 Free cash flow $511 $578 Adjusted EBITDA 253 25