lasr-20220217
0001124796false4637 NW 18th AvenueCamasWashington98607360566-4460February 17, 2022February 17, 2022February 17, 2022February 17, 202200011247962022-02-172022-02-1700011247962020-11-052020-11-05


UNITED STATES
SECURITIES AND EXCHANGE COMMISSION
Washington, D.C. 20549
________________________________________________________
FORM 8-K
________________________________________________________

CURRENT REPORT
Pursuant to Section 13 OR 15(d) of The Securities Exchange Act of 1934

Date of Report (Date of earliest event reported): February 17, 2022
________________________________________________________
NLIGHT, INC.
(Exact name of registrant as specified in its charter)
________________________________________________________
Delaware001-3846291-2066376
(State or other jurisdiction of
incorporation or organization)
(Commission File Number)
(I.R.S. Employer
Identification Number)
4637 NW 18th Avenue
Camas, Washington
98607
(Address of principal executive offices)(Zip Code)
(360) 566-4460
(Registrant’s telephone number, including area code)

Not Applicable
(Former name or former address, if changed since last report)

Check the appropriate box below if the Form 8-K filing is intended to simultaneously satisfy the filing obligation of the registrant under any of the following provisions (see General Instruction A.2. below):
Written communications pursuant to Rule 425 under the Securities Act (17 CFR 230.425)
Soliciting material pursuant to Rule 14a-12 under the Exchange Act (17 CFR 240.14a-12)
Pre-commencement communications pursuant to Rule 14d-2(b) under the Exchange Act (17 CFR 240.14d-2(b))
Pre-commencement communications pursuant to Rule 13e-4(c) under the Exchange Act (17 CFR 240.13e-4(c))

Securities registered pursuant to Section 12(b) of the Act:
Title of Each ClassTrading SymbolName of Exchange on which Registered
Common Stock, par value
$0.0001 per share
LASRThe Nasdaq Stock Market LLC

Indicate by check mark whether the registrant is an emerging growth company as defined in Rule 405 of the Securities Act of 1933 (§230.405 of this chapter) or Rule 12b-2 of the Securities Exchange Act of 1934 (§240.12b-2 of this chapter).
                                     Emerging growth company 

If an emerging growth company, indicate by check mark if the registrant has elected not to use the extended transition period for complying with any new or revised financial accounting standards provided pursuant to Section 13(a) of the Exchange Act. ☐


Item 2.02. Results of Operations and Financial Condition.

On February 17, 2022, nLIGHT, Inc. (the "Company") announced its financial results for the three and twelve months ended December 31, 2021. The full text of the press release issued in connection with the announcement is furnished as Exhibit 99.1 to this Current Report on Form 8-K and is incorporated herein by reference.

On February 17, 2022 the Company also published earnings presentation slides related to its financial results for the three and twelve months ended December 31, 2021 for use in investor discussions. The presentation slides are furnished as Exhibit 99.2 to this Current Report on Form 8-K and are incorporated herein by reference.

The information included in Item 2.02 of this Current Report on Form 8-K (including Exhibits 99.1 and 99.2) shall not be deemed "filed" for purposes of Section 18 of the Securities Exchange Act of 1934, as amended (the "Exchange Act"), or otherwise subject to the liabilities of that Section, nor shall it be deemed incorporated by reference in any filing by the Company under the Securities Act of 1933, as amended, or the Exchange Act, except as expressly set forth by specific reference in such a filing.

Item 9.01.    Financial Statements and Exhibits

(d)    Exhibits
Exhibit No.Description
Earnings Release issued by nLIGHT, Inc. on February 17, 2022
Earnings Presentation slides dated February 17, 2022
104Cover Page Interactive Data File (embedded within the Inline XBRL document)


SIGNATURES

Pursuant to the requirements of the Securities Exchange Act of 1934, the registrant has duly caused this report to be signed on its behalf by the undersigned hereunto duly authorized.
NLIGHT, INC.
(Registrant)
Date:February 17, 2022
By:/s/ RAN BAREKET
Ran Bareket
Chief Financial Officer


lasr-20220217_d2

lasr-20220217_g1.jpg
Exhibit 99.1

nLIGHT, Inc. Announces Fourth Quarter and Full Year 2021 Results
Revenues of $270.1 million and gross margin of 28.6% for the full year 2021
Revenues of $67.5 million and gross margin of 26.6% for the fourth quarter of 2021

CAMAS, Wash., February 17, 2022 - nLIGHT, Inc. (Nasdaq: LASR), a leading provider of high-power semiconductor and fiber lasers used in the industrial, microfabrication, and aerospace and defense markets, today reported financial results for the fourth quarter and full year 2021.
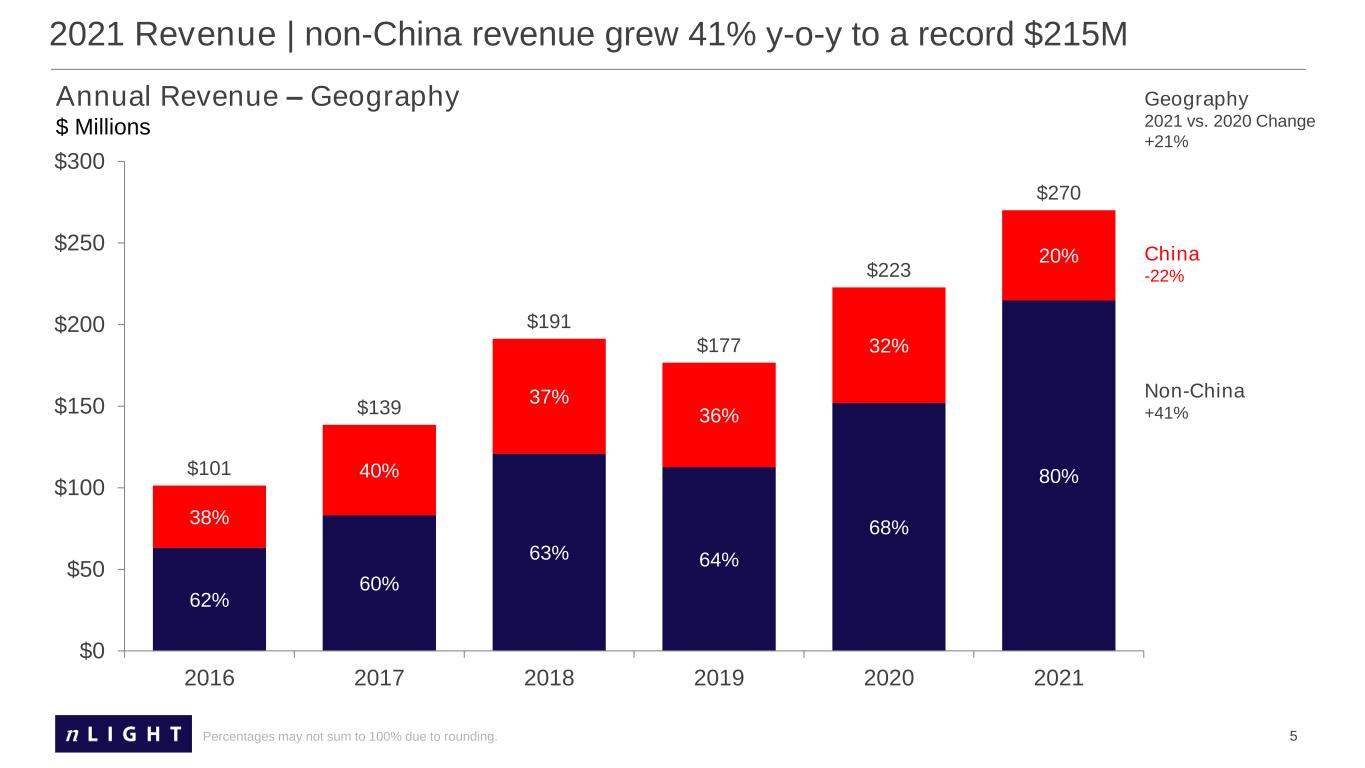
“nLIGHT delivered 21% year-over-year revenue growth in 2021, which was driven by a 41% year-over-year increase in sales to customers outside of China and growth in each of our end markets.” commented Scott Keeney, nLIGHT’s President and Chief Executive Officer. “While our geographic focus has shifted, our strategy remains focused on leveraging our vertically integrated business model to enable key growth markets.”

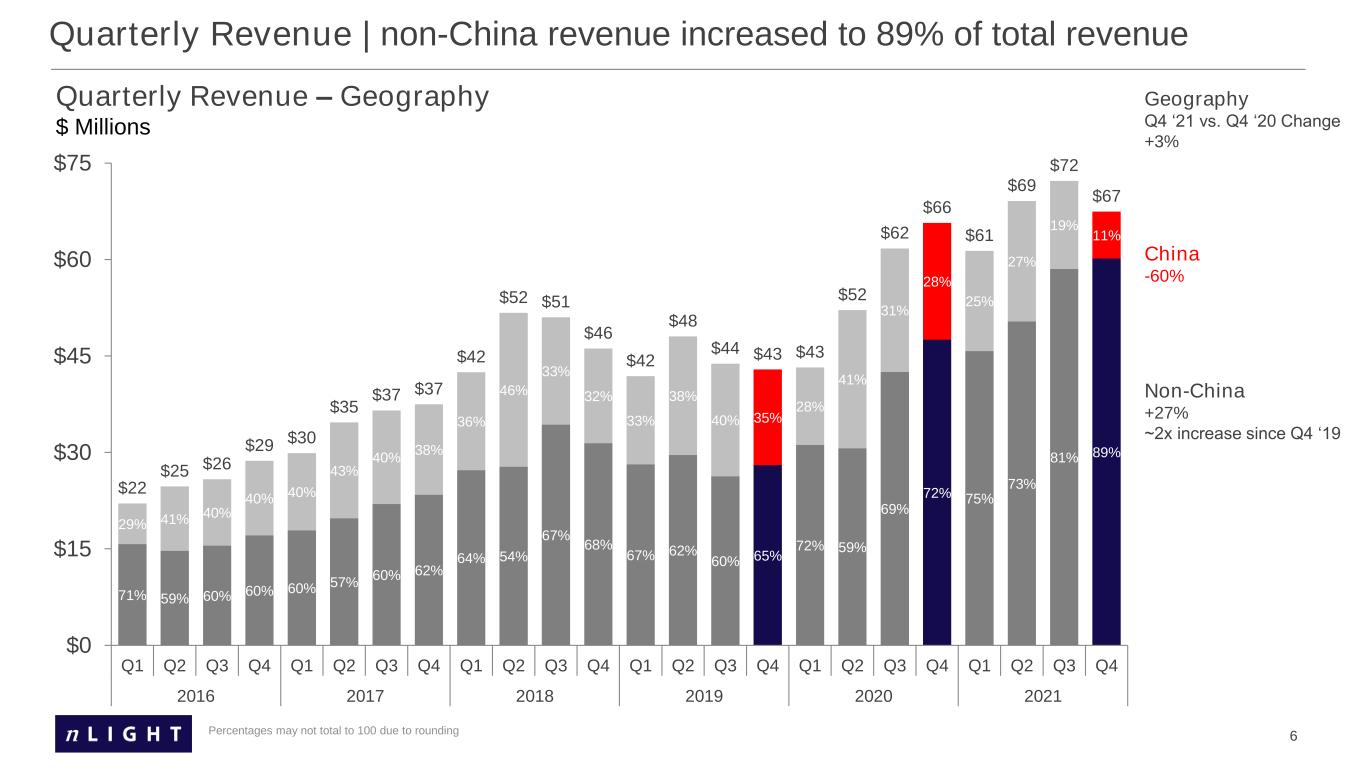
“In the fourth quarter of 2021, approximately 89% of our revenue was from customers outside of China, which grew 27% year-over-year. Total revenue for the fourth quarter of 2021 increased 3% year-over-year to $67.5 million, despite a 60% decrease in revenue from customers in China. Gross margin and Adjusted EBITDA were within the guidance range we provided in November. We continue to believe we are well-positioned to grow faster than the overall industry in the long-term.”


Full Year 2021 Financial Highlights
Year Ended December 31,
(In thousands, except percentages)20212020% Change
Revenues$270,146 $222,789 21.3 %
Gross margin28.6 %26.6 %
Loss from operations$(30,217)$(21,048)(43.6)%
Operating margin(11.2)%(9.4)%
Net loss$(29,669)$(20,932)(41.7)%
Adjusted EBITDA(1)
$22,562 $18,151 24.3 %
Adjusted EBITDA, as a percentage of revenues 8.4 %8.1 %
(1) A reconciliation of the non-GAAP information provided here to the most directly comparable GAAP metric has been provided in the financial statement tables included in this release.

Revenues of $270.1 million for the full year 2021 were up 21.3% compared to $222.8 million for the full year 2020. Gross margin was 28.6% for the full year 2021 compared to 26.6% for the full year 2020. GAAP net loss for the full year 2021 was $(29.7) million, or net loss of $(0.70) per diluted share, compared to net loss of $(20.9) million, or net loss of $(0.55) per diluted share, for the full year 2020. Non-GAAP net income for the full year 2021 was $10.7 million, or non-GAAP net income of $0.23 per diluted share, compared to non-GAAP net income of $7.3 million, or non-GAAP net income of $0.17 per diluted share, for the full year 2020. Reconciliations of the non-GAAP metrics presented here to the most directly comparable GAAP metrics have been provided in the tables included at the end of this release.


Fourth Quarter 2021 Financial Highlights
Three Months Ended December 31,
(In thousands, except percentages)20212020% Change
Revenues$67,453 $65,704 2.7 %
Gross margin26.6 %29.9 %
Loss from operations$(8,665)$(4,286)(102.2)%
Operating margin(12.8)%(6.5)%
Net loss$(8,750)$(4,517)(93.7)%
Adjusted EBITDA(1)
$3,071 $8,447 (63.6)%
Adjusted EBITDA, as a percentage of revenues 4.6 %12.9 %
(1) A reconciliation of the non-GAAP information provided here to the most directly comparable GAAP metric has been provided in the financial statement tables included in this release.

Revenues of $67.5 million for the fourth quarter of 2021 were up 2.7% compared to $65.7 million for the fourth quarter of 2020. Gross margin was 26.6% for the fourth quarter of 2021 compared to 29.9% for the fourth quarter of 2020. GAAP net loss for the fourth quarter of 2021 was $(8.8) million, or net loss of $(0.20) per diluted share, compared to net loss of $(4.5) million, or net loss of $(0.12) per diluted share, for the fourth quarter of 2020. Non-GAAP net loss for the fourth quarter of 2021 was $(0.2) million, or non-GAAP net loss of $(0.01) per diluted share, compared to non-GAAP net income of $5.2 million, or non-GAAP net income of $0.12 per diluted share, for the fourth quarter of 2020. Reconciliations of the non-GAAP metrics presented here to the most directly comparable GAAP metrics have been provided in the tables included at the end of this release.

Outlook
For the first quarter of 2022, nLIGHT expects revenues to be in the range of $61 million to $67 million, gross margin to be in the range of 21% to 25%, and Adjusted EBITDA to be approximately break-even.

We have not reconciled our outlook for Adjusted EBITDA because unrealized and realized foreign exchange gains and losses cannot be reasonably calculated or predicted nor can the probable significance be determined at this time. Accordingly, a reconciliation is not available without unreasonable effort.

Investor Conference Call at 2:00 p.m. Pacific Time, Thursday, February 17, 2022

Parties interested in listening to nLIGHT’s quarterly conference call may do so by dialing 1-833-535-2198 (U.S., toll-free) or +1-412-902-6775 (international and toll), with the conference title: nLIGHT Fourth Quarter 2021 Earnings. The call can also be accessed via the web by going to nLIGHT’s Investor Relations page at http://investors.nlight.net.

Use of Non-GAAP Financial Results

In addition to U.S. GAAP results, this press release contains non-GAAP financial results, including Adjusted EBITDA, non-GAAP net income (loss) and non-GAAP net income (loss) per share, basic and diluted. We use Adjusted EBITDA to help us evaluate our business, measure our performance, identify trends affecting our business, formulate business plans and make strategic decisions. In addition to our results determined in accordance with GAAP, we believe Adjusted EBITDA is a meaningful measure of performance as it is commonly utilized by us and the investment community to analyze operating performance in our industry. Similarly, we believe that providing non-GAAP net income (loss) and non-GAAP net income (loss) per share, basic and diluted, is useful to our investors as they present an informative supplemental view of our results from period to period by removing the effect of stock-based compensation expense and other non-recurring items. However, the non-GAAP metrics presented herein are specific to us and may not be comparable to similar metrics disclosed by other companies because of differing methods used by other companies in calculating them.


We define Adjusted EBITDA as net income (loss) adjusted for income tax expense (benefit), other non-operating income or expense, interest income or expense, depreciation and amortization, stock-based compensation, acquisition and integration-related costs, and other non-recurring items as determined by management, as applicable. We define non-GAAP net income (loss) as GAAP net income (loss) adjusted for stock-based compensation, amortization of purchased intangibles, acquisition and integration-related costs, and other non-recurring items as determined by management, as applicable. We define non-GAAP net income (loss) per share, basic and diluted, as non-GAAP net income (loss) divided by weighted-average shares outstanding during the respective period plus the dilutive effect of any common stock equivalents during the period in the case of non-GAAP net income (loss) per share, diluted.

Tables presenting the reconciliation of net loss to Adjusted EBITDA, as well as the reconciliation of GAAP to non-GAAP net income (loss) and GAAP to non-GAAP net income (loss) per share, basic and diluted, are included at the end of this press release.

Safe Harbor Statement

Certain statements in this release are “forward-looking statements” within the meaning of Section 27A of the Securities Act of 1933, as amended, Section 21E of the Securities Exchange Act of 1934, as amended, and the Private Securities Litigation Reform Act of 1995. Words such as “outlook,” “guidance,” “expects,” “intends,” “projects,” “plans,” “believes,” “estimates,” “targets,” “anticipates,” and similar expressions may identify these forward-looking statements. Examples of forward-looking statements include, but are not limited to, statements regarding expected revenues, gross margin, and Adjusted EBITDA, our business strategy and ability to grow our business, and our expectations regarding customer demand for our products, as well as any other statement that does not directly relate to any historical or current fact. Forward-looking statements are based on our current expectations and assumptions, which may not prove to be accurate. These statements are not guarantees and are subject to risks, uncertainties and changes in circumstances that are difficult to predict. Many factors could cause actual results to differ materially and adversely from these forward-looking statements, including but not limited to: (1)our ability to compete successfully in the markets for our products, (2) changes in the markets we serve or in the global economy, (3) our ability to increase our volumes and decrease our costs to offset potential declines in the average selling prices of our products, (4) rapid technological change in the markets that we participate in and our ability to develop and maintain products that can achieve market acceptance, (5) our ability to generate sufficient revenues to achieve or maintain profitability in the future, (6) our high levels of fixed costs and inventory and their effect on our gross profits and results of operations if demand for our products declines or we maintain excess inventory levels, (7) disruptions including pandemics, such as COVID-19, and their effect on our business, financial condition, or results of operations, (8) our manufacturing capacity and operations and their suitability for future levels of demand, (9) our reliance on a small number of customers for a significant portion of our revenues, (10) our ability to manage risks associated with international customers and operations, (11) the effect of current and potential tariffs and global trade policies on the cost of our products, (12) our ability to protect our proprietary technology and intellectual property rights, and (13) fluctuations in our quarterly results of operations and other operating measures. Additional information concerning these and other factors can be found in nLIGHT's filings with the Securities and Exchange Commission (the “SEC”), including other risks, relevant factors and uncertainties identified in the “Risk Factors” section of nLIGHT's most recent Annual Report on Form 10-K or subsequent filings with the SEC. nLIGHT undertakes no obligation to update publicly or revise any forward-looking statements contained herein to reflect future events or developments, except as required by law.

The nLIGHT logo and “nLIGHT” are registered trademarks or trademarks of nLIGHT, Inc. in various jurisdictions.

About nLIGHT

nLIGHT, Inc. is a leading provider of high-power semiconductor and fiber lasers for industrial, microfabrication, aerospace and defense applications. Our lasers are changing not only the way things are made but also the things that can be made. Headquartered in Camas, Washington, nLIGHT employs over 1,300 people with operations in the U.S., China, Finland, Korea and Italy. For more information, please visit www.nlight.net.

For more information, contact:
Joseph Corso
VP, Corporate Development and Investor Relations
nLIGHT, Inc.
(360) 566-4460
[email protected]


nLIGHT, Inc.
Consolidated Statements of Operations
(In thousands, except per share data)
(Unaudited)
Three Months Ended December 31,Year Ended December 31,
2021202020212020
Revenue:
Products$50,906 $51,690 $206,195 $184,841 
Development16,547 14,014 63,951 37,948 
Total revenue67,453 65,704 270,146 222,789 
Cost of revenue:
Products34,039 33,113 132,867 128,255 
Development15,472 12,944 59,972 35,170 
Total cost of revenue(1)
49,511 46,057 192,839 163,425 
Gross profit17,942 19,647 77,307 59,364 
Operating expenses:
Research and development(1)
13,984 12,028 54,814 41,164 
Sales, general, and administrative(1)
12,623 11,905 52,710 39,248 
Total operating expenses26,607 23,933 107,524 80,412 
Loss from operations(8,665)(4,286)(30,217)(21,048)
Other income (expense):
Interest income (expense), net(37)(44)(163)78 
Other income, net90 315 336 378 
Loss before income taxes(8,612)(4,015)(30,044)(20,592)
Income tax expense (benefit)138 502 (375)340 
Net loss$(8,750)$(4,517)$(29,669)$(20,932)
Net loss per share, basic $(0.20)$(0.12)$(0.70)$(0.55)
Net loss per share, diluted$(0.20)$(0.12)$(0.70)$(0.55)
Shares used in per share calculations:
Basic43,277 38,877 42,142 38,367 
Diluted43,277 38,877 42,142 38,367 
(1)Includes stock-based compensation as follows:
Three Months Ended December 31,Year Ended December 31,
2021202020212020
Cost of revenues$725 $432 $2,505 $1,621 
Research and development3,025 3,101 13,433 9,703 
Sales, general, and administrative4,238 5,448 21,782 14,140 
$7,988 $8,981 $37,720 $25,464 


nLIGHT, Inc.
Condensed Consolidated Balance Sheets
(In thousands)
(Unaudited)
As of
December 31, 2021December 31, 2020
Assets
Current assets:
     Cash and cash equivalents$146,534 $102,282 
     Accounts receivable, net41,574 31,820 
     Inventory73,746 54,706 
     Prepaid expenses and other current assets15,350 11,767 
          Total current assets277,204 200,575 
Restricted cash250 291 
Lease right-of-use assets17,048 12,302 
Property, plant and equipment, net56,101 44,480 
Intangible assets, net6,698 8,345 
Goodwill12,420 12,484 
Other assets, net3,897 5,167 
          Total assets$373,618 $283,644 
Liabilities and Stockholders’ Equity
Current liabilities:
     Accounts payable$26,347 $21,057 
     Accrued liabilities14,730 15,321 
     Deferred revenue1,629 2,528 
     Current portion of lease liabilities3,066 2,273 
     Current portion of long-term debt— 184 
          Total current liabilities45,772 41,363 
Non-current income taxes payable7,149 7,556 
Long-term lease liabilities14,612 10,375 
Long-term debt— 215 
Other long-term liabilities3,952 4,221 
     Total liabilities71,485 63,730 
Stockholders' equity:
     Common stock - par value15 15 
     Additional paid-in capital470,760 358,544 
     Accumulated other comprehensive loss(587)(259)
     Accumulated deficit(168,055)(138,386)
          Total stockholders’ equity302,133 219,914 
          Total liabilities and stockholders’ equity$373,618 $283,644 


nLIGHT, Inc.
Consolidated Statements of Cash Flows
(In thousands)
(Unaudited)
Year Ended December 31,
20212020
Cash flows from operating activities:
Net loss$(29,669)$(20,932)
Adjustments to reconcile net loss to net cash provided by (used in) operating activities:
Depreciation9,179 7,710 
Amortization5,880 5,975 
Reduction in carrying amount of right-of-use assets3,253 2,916 
Provision for (recoveries of) losses on accounts receivable(70)88 
Stock-based compensation37,720 25,464 
Deferred income taxes37 (11)
Loss on disposal of assets16 — 
Changes in operating assets and liabilities:
Accounts receivable, net(9,509)(4,009)
Inventory(18,994)(6,937)
Prepaid expenses and other current assets(3,630)(3,442)
Other assets, net(570)(3,463)
Accounts payable3,463 7,306 
Accrued and other long-term liabilities(199)2,269 
Deferred revenues(909)1,800 
Lease liabilities(2,934)(2,820)
Non-current income taxes payable(507)1,127 
Net cash provided by (used in) operating activities(7,443)13,041 
Cash flows from investing activities:
Acquisition of business, net of cash acquired(291)(190)
Purchases of property, plant and equipment(19,317)(23,416)
Acquisition of intangible assets and capitalization of patents(2,245)(933)
Net cash used in investing activities(21,853)(24,539)
Cash flows from financing activities:
Proceeds from public offerings, net of offering costs82,354 — 
Proceeds from term loan— 15,000 
Principal payments on term loan, debt and financing leases(428)(15,115)
Payment of contingent consideration related to acquisition(326)— 
Proceeds from employee stock plan purchases1,603 1,393 
Proceeds from stock option exercises1,145 1,375 
Tax payments related to stock award issuances(10,606)(6,420)
Net cash provided by (used in) financing activities73,742 (3,767)
Effect of exchange rate changes on cash(235)545 
Net increase (decrease) in cash, cash equivalents and restricted cash44,211 (14,720)
Cash, cash equivalents and restricted cash, beginning of period102,573 117,293 
Cash, cash equivalents and restricted cash, end of period$146,784 $102,573 
Supplemental disclosures:
Cash paid (received) for interest, net$117 $(311)
Cash paid for income taxes526 647 
Operating cash outflows from operating leases3,513 2,919 
Right-of-use assets obtained in exchange for lease liabilities8,012 15,127 
Accrued purchases of property, equipment and patents2,522 788 


nLIGHT, Inc.
Reconciliation of GAAP Financial Metrics to Non-GAAP
(In thousands, except per share data)
(Unaudited)

Reconciliation of Net Loss to Adjusted EBITDA
Three Months Ended December 31,Year Ended December 31,
2021202020212020
Net loss$(8,750)$(4,517)$(29,669)$(20,932)
Income tax expense (benefit)138 502 (375)340 
Other income, net(90)(315)(336)(378)
Interest (income) expense, net37 44 163 (78)
Depreciation and amortization3,748 3,752 15,059 13,685 
Stock-based compensation7,988 8,981 37,720 25,464 
Acquisition and integration-related costs— — — 50 
Adjusted EBITDA$3,071 $8,447 $22,562 $18,151 


Reconciliation of GAAP to Non-GAAP Net Income (Loss), and GAAP to Non-GAAP Net Income (Loss) per Share, Basic and Diluted

Three Months Ended December 31,Year Ended December 31,
2021202020212020
Net loss$(8,750)$(4,517)$(29,669)$(20,932)
Add back:
Stock-based compensation(1)
7,988 8,981 37,720 25,464 
Amortization of purchased intangibles (1)
518 716 2,671 2,724 
Acquisition and integration-related costs (1)
— — — 50 
Non-GAAP net income (loss)(244)5,180 10,722 7,306 
GAAP weighted-average shares outstanding43,277 38,877 42,142 38,367 
Participating securities— 653 699 544 
Non-GAAP weighted-average number of shares, basic43,277 39,530 42,841 38,911 
Dilutive effect of common stock equivalents— 4,654 4,341 4,228 
Non-GAAP weighted-average number of shares, diluted43,277 44,184 47,182 43,139 
Non-GAAP net income (loss) per share, basic$(0.01)$0.13 $0.25 $0.19 
Non-GAAP net income (loss) per share, diluted$(0.01)$0.12 $0.23 $0.17 
(1) There is no income tax effect related to the stock-based compensation, amortization of purchased intangibles, and acquisition and integration-related cost adjustments due to the full valuation allowance in the U.S.
This presentation contains nLIGHT, Inc. proprietary information. No part of it may be circulated, quoted, or reproduced for distribution without prior written approval from nLIGHT, Inc. Earnings Presentation Q4 2021 February 17, 2022


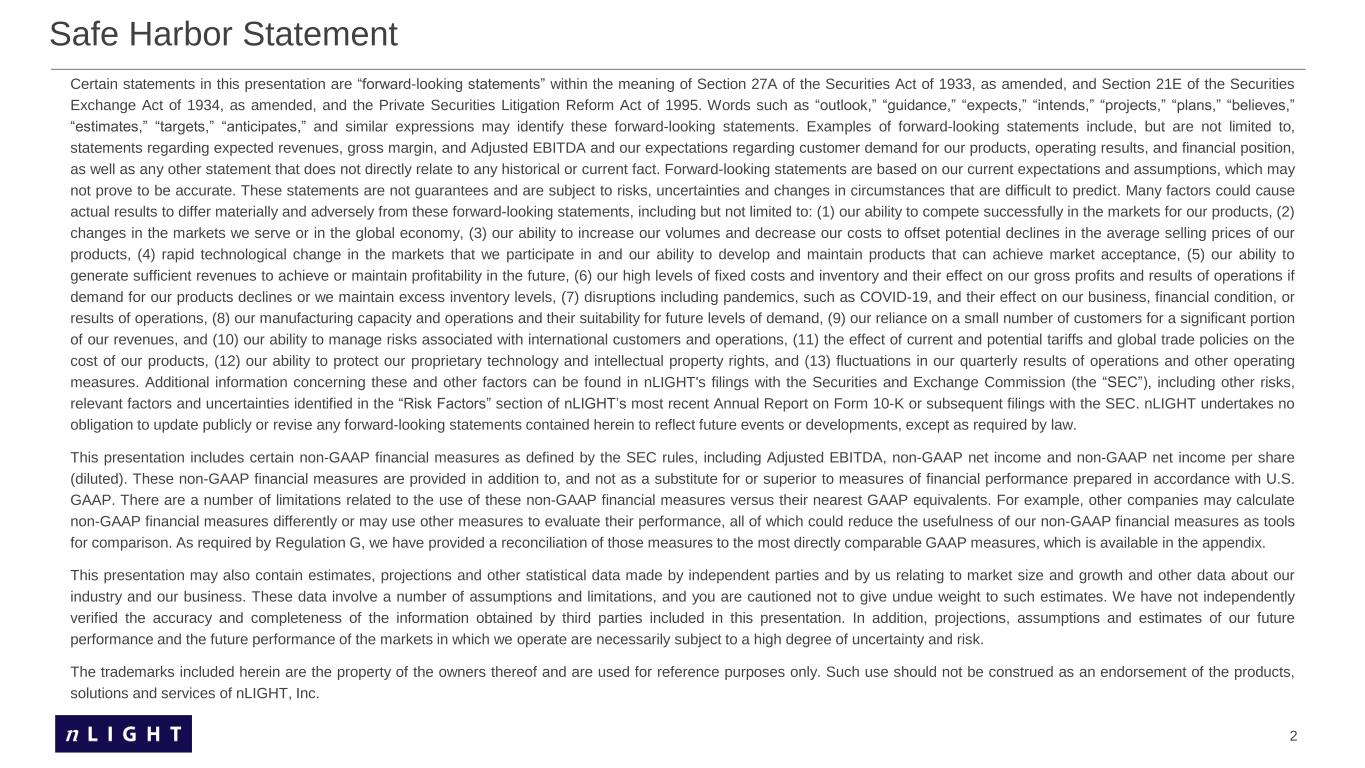
2 Certain statements in this presentation are “forward-looking statements” within the meaning of Section 27A of the Securities Act of 1933, as amended, and Section 21E of the Securities Exchange Act of 1934, as amended, and the Private Securities Litigation Reform Act of 1995. Words such as “outlook,” “guidance,” “expects,” “intends,” “projects,” “plans,” “believes,” “estimates,” “targets,” “anticipates,” and similar expressions may identify these forward-looking statements. Examples of forward-looking statements include, but are not limited to, statements regarding expected revenues, gross margin, and Adjusted EBITDA and our expectations regarding customer demand for our products, operating results, and financial position, as well as any other statement that does not directly relate to any historical or current fact. Forward-looking statements are based on our current expectations and assumptions, which may not prove to be accurate. These statements are not guarantees and are subject to risks, uncertainties and changes in circumstances that are difficult to predict. Many factors could cause actual results to differ materially and adversely from these forward-looking statements, including but not limited to: (1) our ability to compete successfully in the markets for our products, (2) changes in the markets we serve or in the global economy, (3) our ability to increase our volumes and decrease our costs to offset potential declines in the average selling prices of our products, (4) rapid technological change in the markets that we participate in and our ability to develop and maintain products that can achieve market acceptance, (5) our ability to generate sufficient revenues to achieve or maintain profitability in the future, (6) our high levels of fixed costs and inventory and their effect on our gross profits and results of operations if demand for our products declines or we maintain excess inventory levels, (7) disruptions including pandemics, such as COVID-19, and their effect on our business, financial condition, or results of operations, (8) our manufacturing capacity and operations and their suitability for future levels of demand, (9) our reliance on a small number of customers for a significant portion of our revenues, and (10) our ability to manage risks associated with international customers and operations, (11) the effect of current and potential tariffs and global trade policies on the cost of our products, (12) our ability to protect our proprietary technology and intellectual property rights, and (13) fluctuations in our quarterly results of operations and other operating measures. Additional information concerning these and other factors can be found in nLIGHT's filings with the Securities and Exchange Commission (the “SEC”), including other risks, relevant factors and uncertainties identified in the “Risk Factors” section of nLIGHT’s most recent Annual Report on Form 10-K or subsequent filings with the SEC. nLIGHT undertakes no obligation to update publicly or revise any forward-looking statements contained herein to reflect future events or developments, except as required by law. This presentation includes certain non-GAAP financial measures as defined by the SEC rules, including Adjusted EBITDA, non-GAAP net income and non-GAAP net income per share (diluted). These non-GAAP financial measures are provided in addition to, and not as a substitute for or superior to measures of financial performance prepared in accordance with U.S. GAAP. There are a number of limitations related to the use of these non-GAAP financial measures versus their nearest GAAP equivalents. For example, other companies may calculate non-GAAP financial measures differently or may use other measures to evaluate their performance, all of which could reduce the usefulness of our non-GAAP financial measures as tools for comparison. As required by Regulation G, we have provided a reconciliation of those measures to the most directly comparable GAAP measures, which is available in the appendix. This presentation may also contain estimates, projections and other statistical data made by independent parties and by us relating to market size and growth and other data about our industry and our business. These data involve a number of assumptions and limitations, and you are cautioned not to give undue weight to such estimates. We have not independently verified the accuracy and completeness of the information obtained by third parties included in this presentation. In addition, projections, assumptions and estimates of our future performance and the future performance of the markets in which we operate are necessarily subject to a high degree of uncertainty and risk. The trademarks included herein are the property of the owners thereof and are used for reference purposes only. Such use should not be construed as an endorsement of the products, solutions and services of nLIGHT, Inc. Safe Harbor Statement


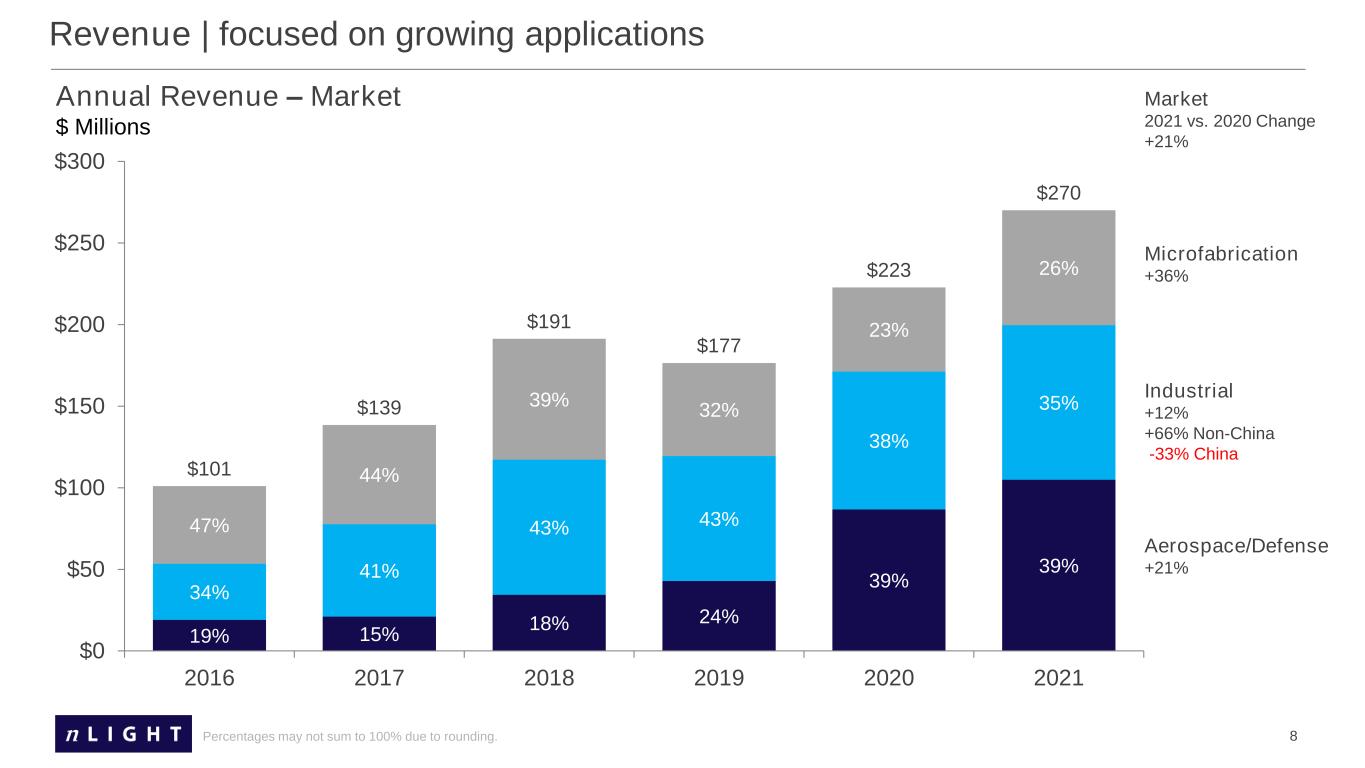
3 • Record annual revenues with 21% growth (year-over-year) – Full year growth (y-o-y) in all market segments (Microfabrication, Industrial, Aerospace and Defense) • Growth driven from key strategic areas – Industrial outside of China and Aerospace & Defense – 80% of 2021 revenue from outside of China – Revenue from Industrial customers outside of China increased by more than 65% in 2021 – Executed on key Directed Energy milestones • Investment in automated U.S. manufacturing capacity nLIGHT 2021 Business Highlights


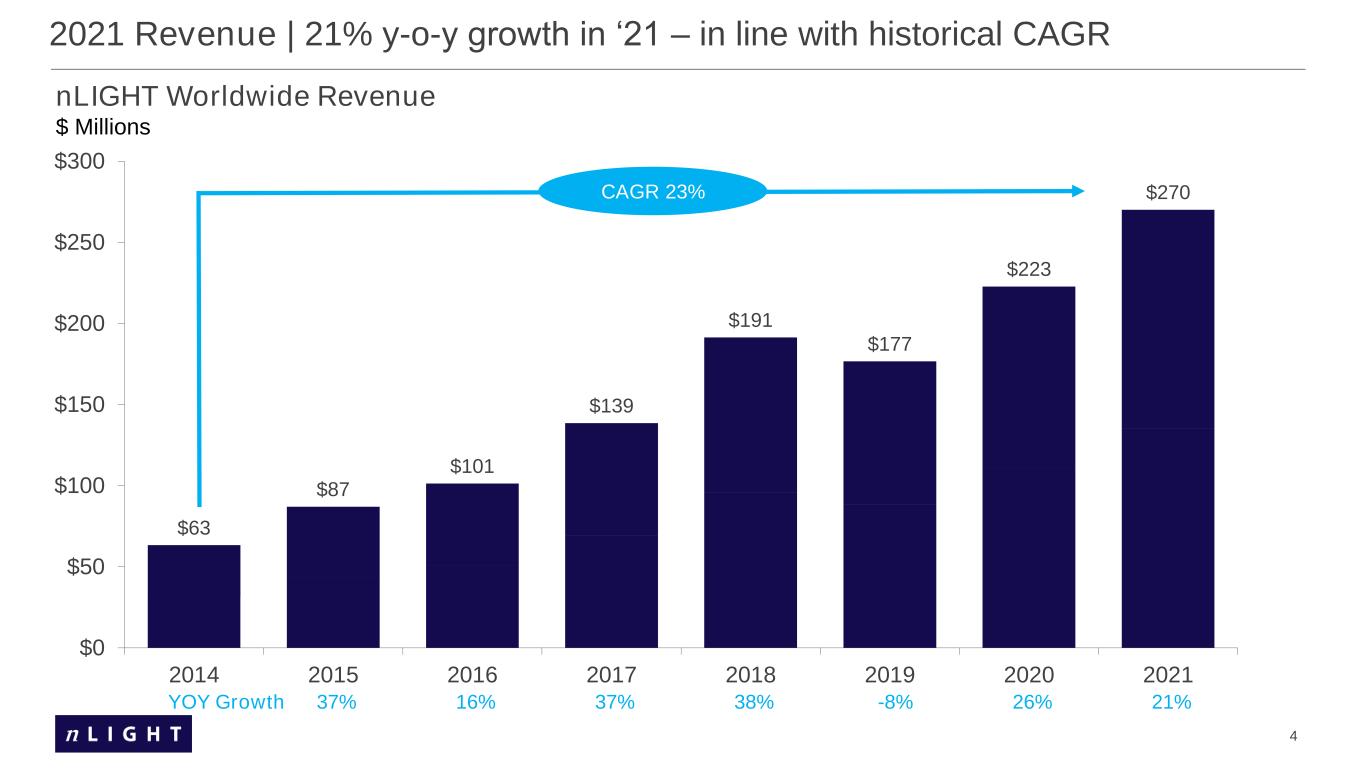
4 2021 Revenue | 21% y-o-y growth in ‘21 – in line with historical CAGR YOY Growth $63 $87 $101 $139 $191 $177 $223 $270 $0 $50 $100 $150 $200 $250 $300 2014 2015 2016 2017 2018 2019 2020 2021 T h o u s a n d s CAGR 23% 37% 16% 37% 38% -8% 26% 21% nLIGHT Worldwide Revenue $ Millions


5 62% 60% 63% 64% 68% 80% 38% 40% 37% 36% 32% 20% $101 $139 $191 $177 $223 $270 $0 $50 $100 $150 $200 $250 $300 2016 2017 2018 2019 2020 2021 Percentages may not sum to 100% due to rounding. 2021 Revenue | non-China revenue grew 41% y-o-y to a record $215M China -22% Non-China +41% Geography 2021 vs. 2020 Change +21% Annual Revenue – Geography $ Millions


6 71% 59% 60% 60% 60% 57% 60% 62% 64% 54% 67% 68% 67% 62% 60% 65% 72% 59% 69% 72% 75% 73% 81% 89% 29% 41% 40% 40% 40% 43% 40% 38% 36% 46% 33% 32% 33% 38% 40% 35% 28% 41% 31% 28% 25% 27% 19% 11% $22 $25 $26 $29 $30 $35 $37 $37 $42 $52 $51 $46 $42 $48 $44 $43 $43 $52 $62 $66 $61 $69 $72 $67 $0 $15 $30 $45 $60 $75 Q1 Q2 Q3 Q4 Q1 Q2 Q3 Q4 Q1 Q2 Q3 Q4 Q1 Q2 Q3 Q4 Q1 Q2 Q3 Q4 Q1 Q2 Q3 Q4 2016 2017 2018 2019 2020 2021 Quarterly Revenue – Geography $ Millions Quarterly Revenue | non-China revenue increased to 89% of total revenue Geography Q4 ‘21 vs. Q4 ‘20 Change +3% Percentages may not total to 100 due to rounding China -60% Non-China +27% ~2x increase since Q4 ‘19


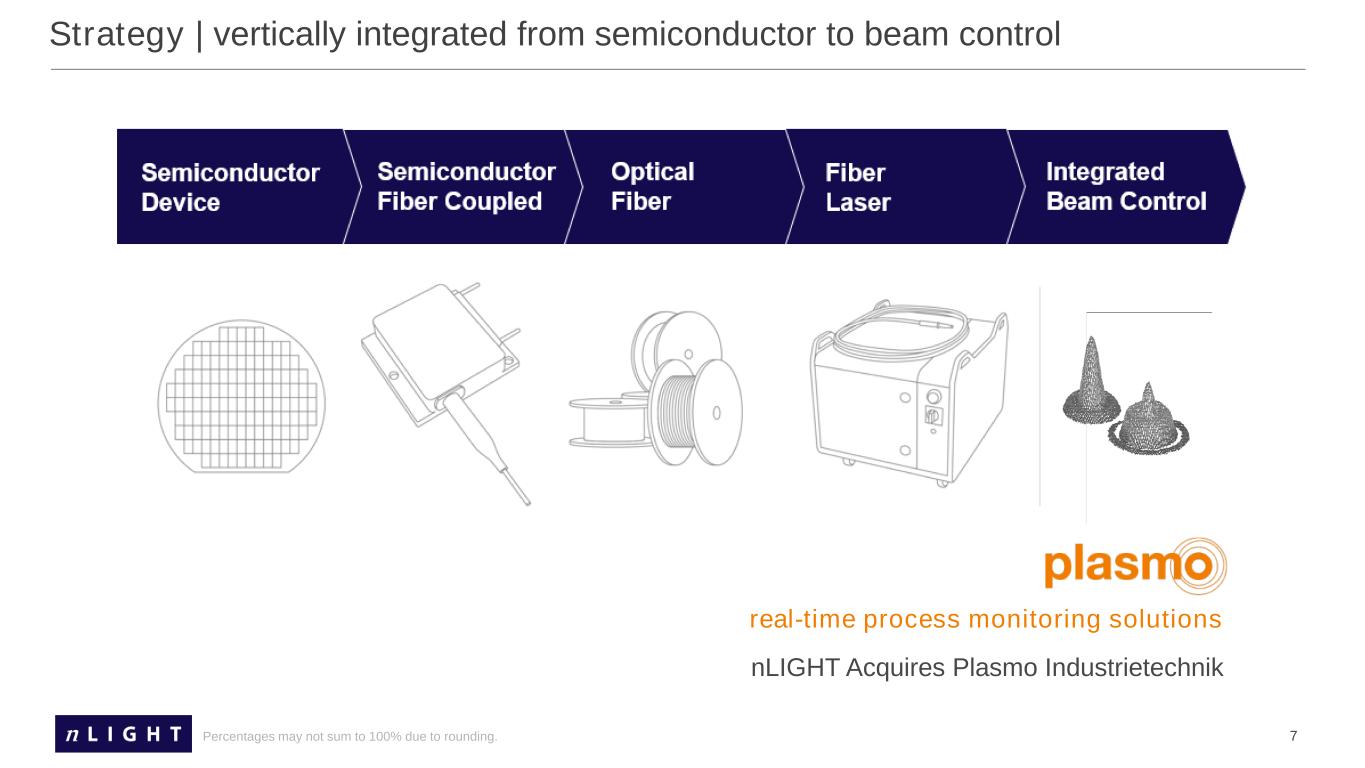
7Percentages may not sum to 100% due to rounding. Strategy | vertically integrated from semiconductor to beam control nLIGHT Acquires Plasmo Industrietechnik real-time process monitoring solutions


8 19% 15% 18% 24% 39% 39% 34% 41% 43% 43% 38% 35% 47% 44% 39% 32% 23% 26% $101 $139 $191 $177 $223 $270 $0 $50 $100 $150 $200 $250 $300 2016 2017 2018 2019 2020 2021 Percentages may not sum to 100% due to rounding. Revenue | focused on growing applications Microfabrication +36% Industrial +12% +66% Non-China -33% China Aerospace/Defense +21% Market 2021 vs. 2020 Change +21% Annual Revenue – Market $ Millions


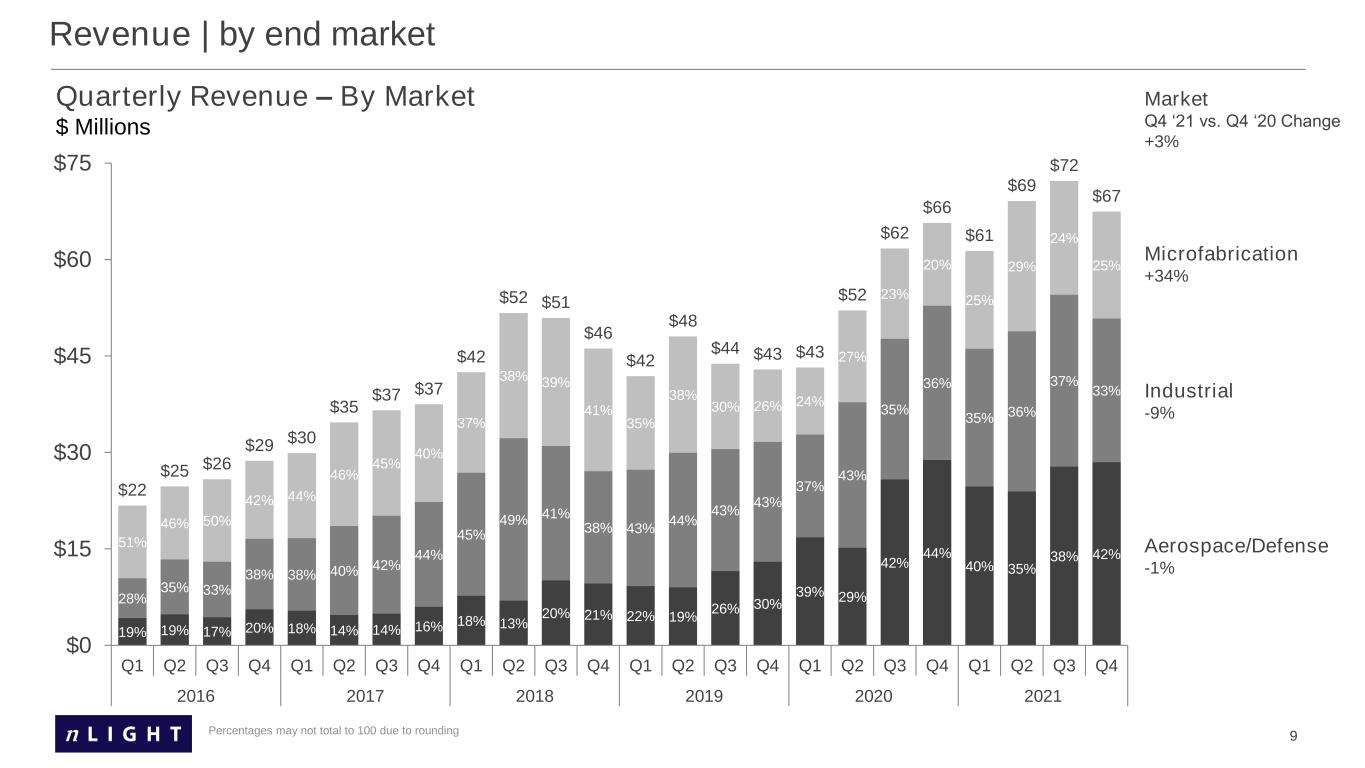
9 19% 19% 17% 20% 18% 14% 14% 16% 18% 13% 20% 21% 22% 19% 26% 30% 39% 29% 42% 44% 40% 35% 38% 42% 28% 35% 33% 38% 38% 40% 42% 44% 45% 49% 41% 38% 43% 44% 43% 43% 37% 43% 35% 36% 35% 36% 37% 33% 51% 46% 50% 42% 44% 46% 45% 40% 37% 38% 39% 41% 35% 38% 30% 26% 24% 27% 23% 20% 25% 29% 24% 25% $22 $25 $26 $29 $30 $35 $37 $37 $42 $52 $51 $46 $42 $48 $44 $43 $43 $52 $62 $66 $61 $69 $72 $67 $0 $15 $30 $45 $60 $75 Q1 Q2 Q3 Q4 Q1 Q2 Q3 Q4 Q1 Q2 Q3 Q4 Q1 Q2 Q3 Q4 Q1 Q2 Q3 Q4 Q1 Q2 Q3 Q4 2016 2017 2018 2019 2020 2021 Quarterly Revenue – By Market $ Millions Revenue | by end market Microfabrication +34% Industrial -9% Aerospace/Defense -1% Market Q4 ‘21 vs. Q4 ‘20 Change +3% Percentages may not total to 100 due to rounding


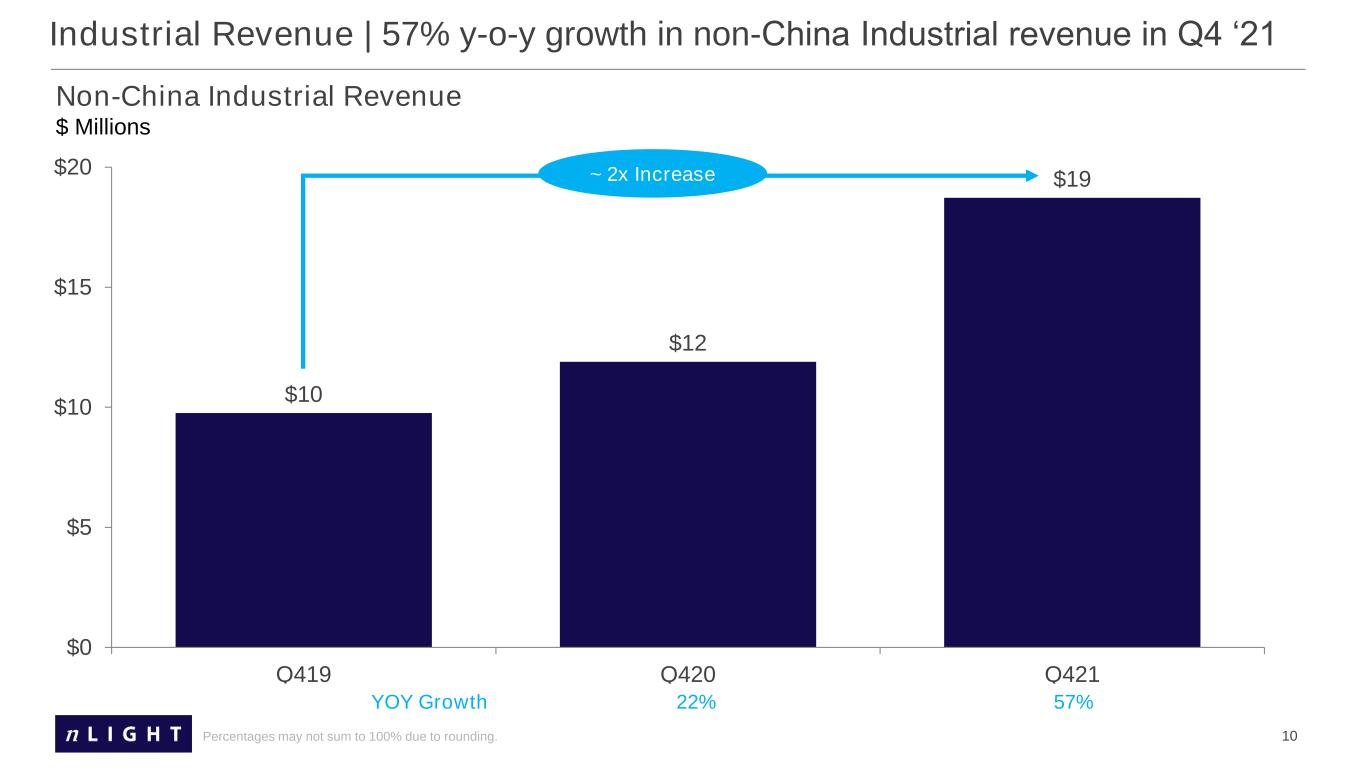
10 $10 $12 $19 $0 $5 $10 $15 $20 Q419 Q420 Q421 Percentages may not sum to 100% due to rounding. Industrial Revenue | 57% y-o-y growth in non-China Industrial revenue in Q4 ‘21 Non-China Industrial Revenue $ Millions YOY Growth 22% 57% ~ 2x Increase


Financial Update


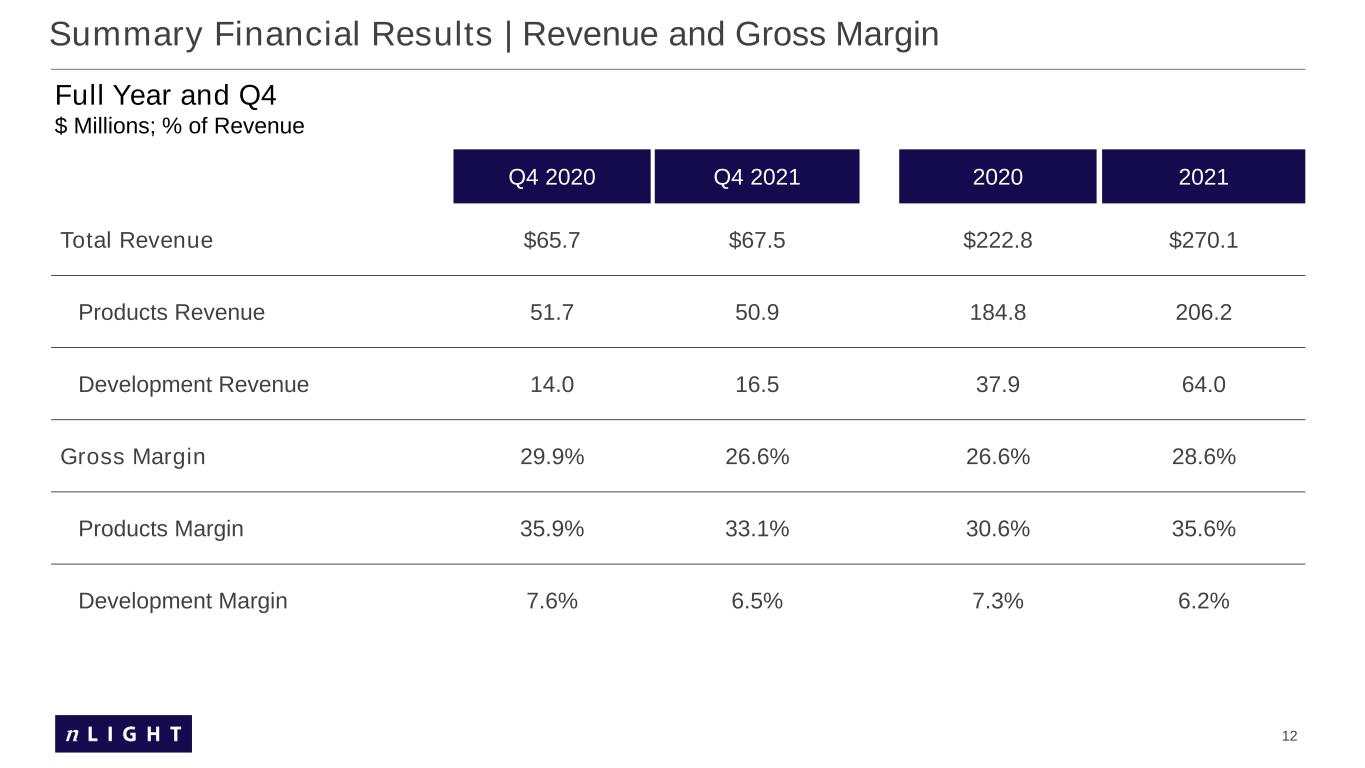
12 Summary Financial Results | Revenue and Gross Margin Full Year and Q4 $ Millions; % of Revenue Q4 2020 Q4 2021 2020 2021 Total Revenue $65.7 $67.5 $222.8 $270.1 Products Revenue 51.7 50.9 184.8 206.2 Development Revenue 14.0 16.5 37.9 64.0 Gross Margin 29.9% 26.6% 26.6% 28.6% Products Margin 35.9% 33.1% 30.6% 35.6% Development Margin 7.6% 6.5% 7.3% 6.2%


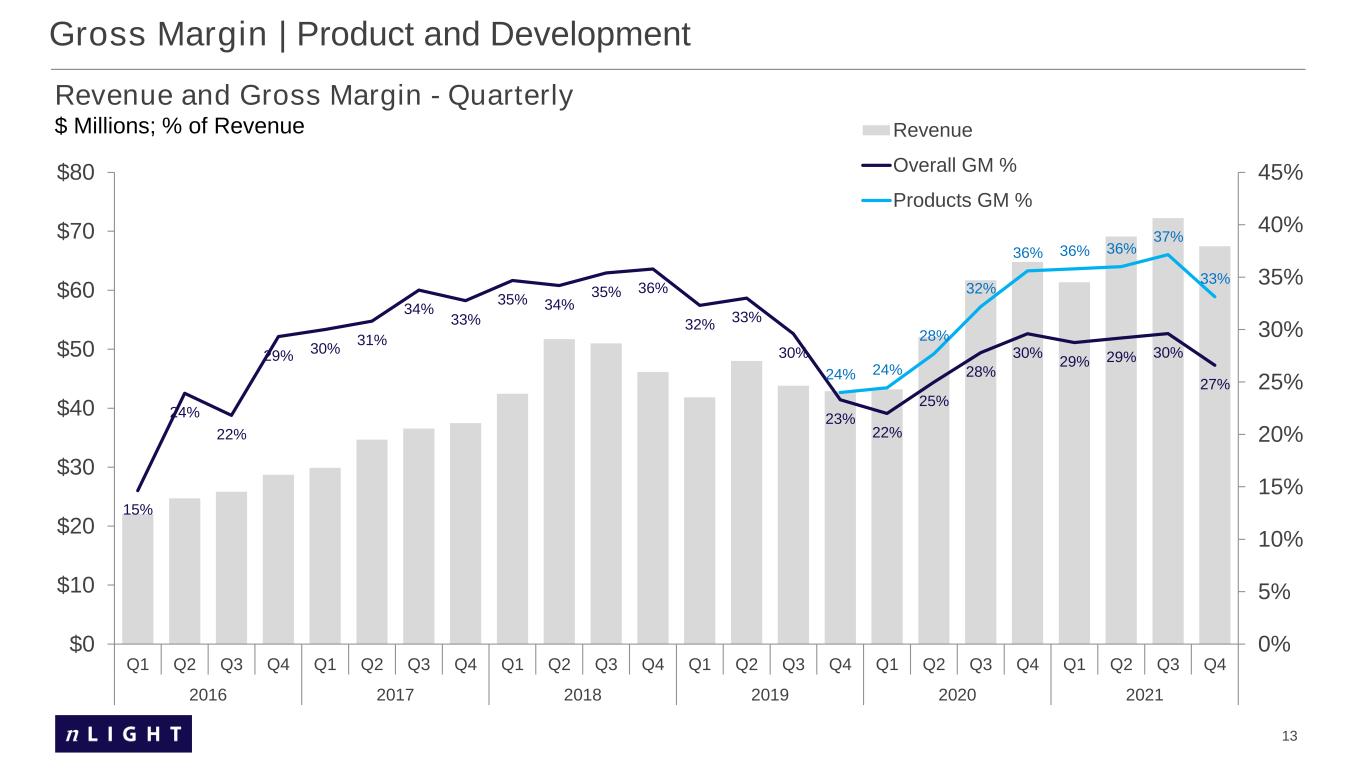
13 Gross Margin | Product and Development 15% 24% 22% 29% 30% 31% 34% 33% 35% 34% 35% 36% 32% 33% 30% 23% 22% 25% 28% 30% 29% 29% 30% 27% 24% 24% 28% 32% 36% 36% 36% 37% 33% 0% 5% 10% 15% 20% 25% 30% 35% 40% 45% $0 $10 $20 $30 $40 $50 $60 $70 $80 Q1 Q2 Q3 Q4 Q1 Q2 Q3 Q4 Q1 Q2 Q3 Q4 Q1 Q2 Q3 Q4 Q1 Q2 Q3 Q4 Q1 Q2 Q3 Q4 2016 2017 2018 2019 2020 2021 Revenue Overall GM % Products GM % Revenue and Gross Margin - Quarterly $ Millions; % of Revenue


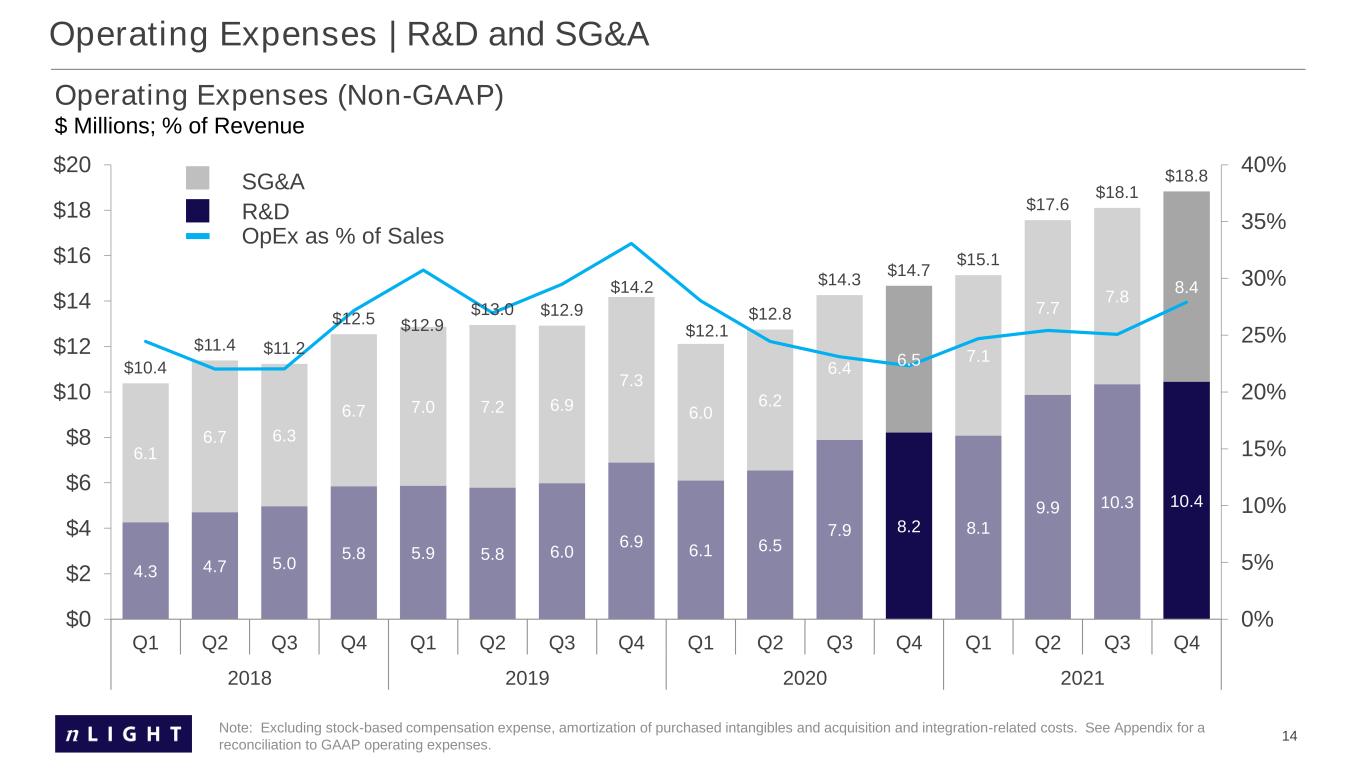
14 Operating Expenses (Non-GAAP) $ Millions; % of Revenue Note: Excluding stock-based compensation expense, amortization of purchased intangibles and acquisition and integration-related costs. See Appendix for a reconciliation to GAAP operating expenses. Operating Expenses | R&D and SG&A 4.3 4.7 5.0 5.8 5.9 5.8 6.0 6.9 6.1 6.5 7.9 8.2 8.1 9.9 10.3 10.4 6.1 6.7 6.3 6.7 7.0 7.2 6.9 7.3 6.0 6.2 6.4 6.5 7.1 7.7 7.8 8.4 $10.4 $11.4 $11.2 $12.5 $12.9 $13.0 $12.9 $14.2 $12.1 $12.8 $14.3 $14.7 $15.1 $17.6 $18.1 $18.8 0% 5% 10% 15% 20% 25% 30% 35% 40% $0 $2 $4 $6 $8 $10 $12 $14 $16 $18 $20 Q1 Q2 Q3 Q4 Q1 Q2 Q3 Q4 Q1 Q2 Q3 Q4 Q1 Q2 Q3 Q4 2018 2019 2020 2021 SG&A R&D OpEx as % of Sales


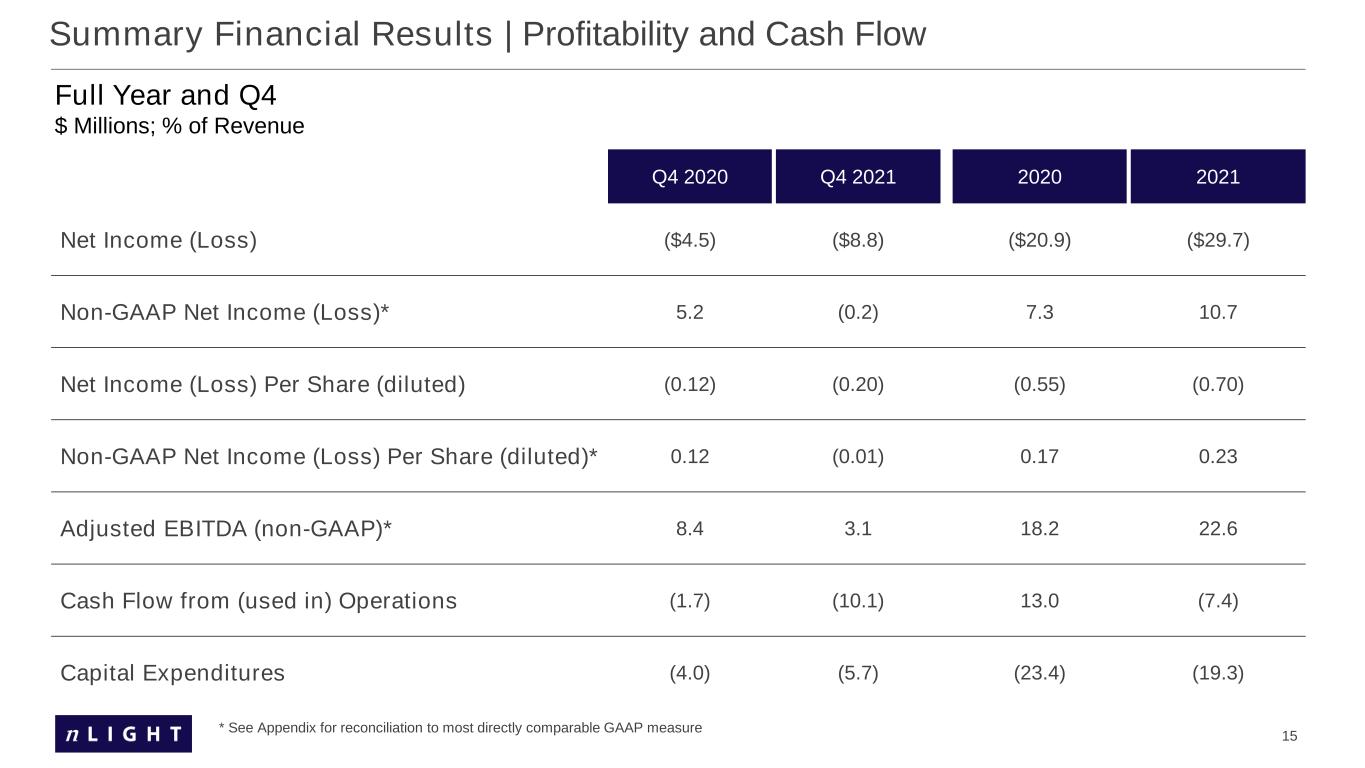
15 * See Appendix for reconciliation to most directly comparable GAAP measure Q4 2020 Q4 2021 2020 2021 Net Income (Loss) ($4.5) ($8.8) ($20.9) ($29.7) Non-GAAP Net Income (Loss)* 5.2 (0.2) 7.3 10.7 Net Income (Loss) Per Share (diluted) (0.12) (0.20) (0.55) (0.70) Non-GAAP Net Income (Loss) Per Share (diluted)* 0.12 (0.01) 0.17 0.23 Adjusted EBITDA (non-GAAP)* 8.4 3.1 18.2 22.6 Cash Flow from (used in) Operations (1.7) (10.1) 13.0 (7.4) Capital Expenditures (4.0) (5.7) (23.4) (19.3) Summary Financial Results | Profitability and Cash Flow Full Year and Q4 $ Millions; % of Revenue


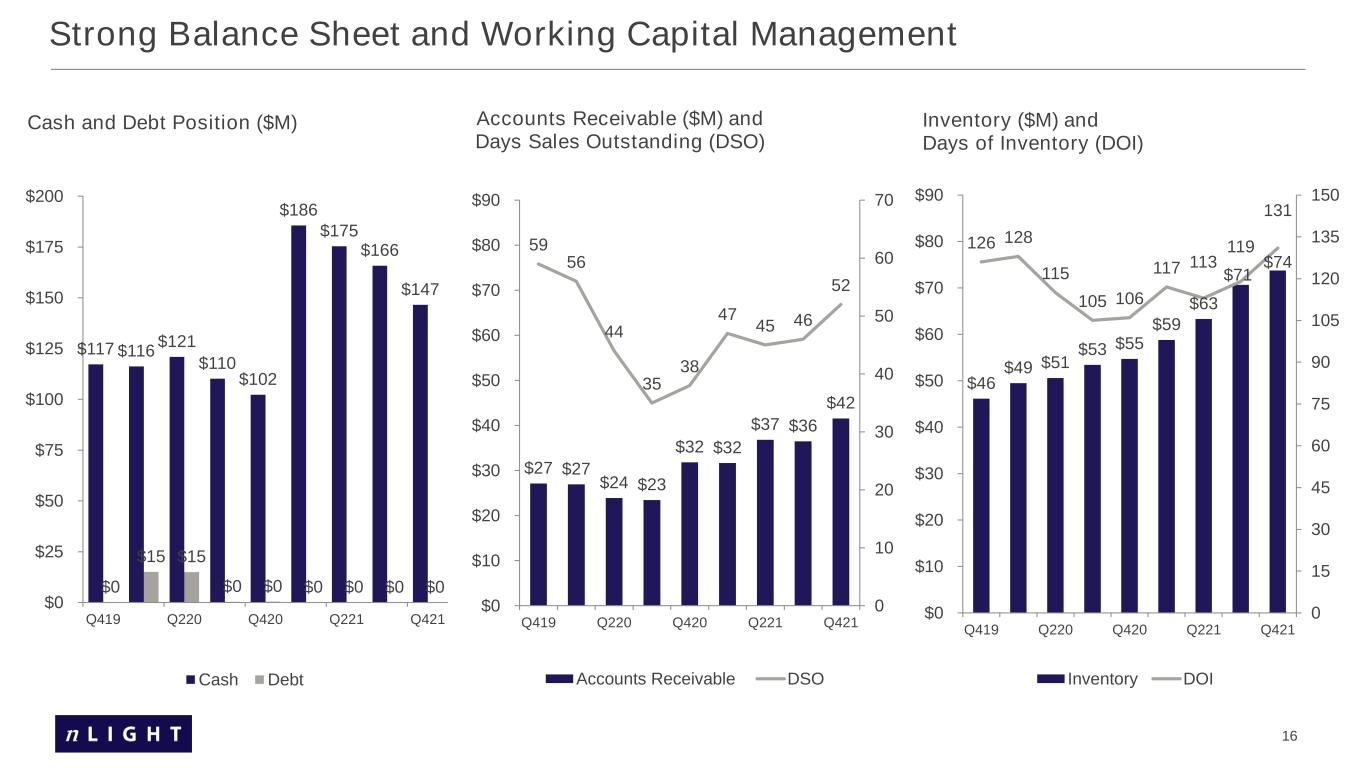
16 Strong Balance Sheet and Working Capital Management $46 $49 $51 $53 $55 $59 $63 $71 $74 126 128 115 105 106 117 113 119 131 0 15 30 45 60 75 90 105 120 135 150 $0 $10 $20 $30 $40 $50 $60 $70 $80 $90 Q419 Q220 Q420 Q221 Q421 Inventory ($M) and Days of Inventory (DOI) Inventory DOI $27 $27 $24 $23 $32 $32 $37 $36 $42 59 56 44 35 38 47 45 46 52 0 10 20 30 40 50 60 70 $0 $10 $20 $30 $40 $50 $60 $70 $80 $90 Q419 Q220 Q420 Q221 Q421 Accounts Receivable ($M) and Days Sales Outstanding (DSO) Accounts Receivable DSO $117 $116 $121 $110 $102 $186 $175 $166 $147 $0 $15 $15 $0 $0 $0 $0 $0 $0 $0 $25 $50 $75 $100 $125 $150 $175 $200 Q419 Q220 Q420 Q221 Q421 Cash and Debt Position ($M) Cash Debt


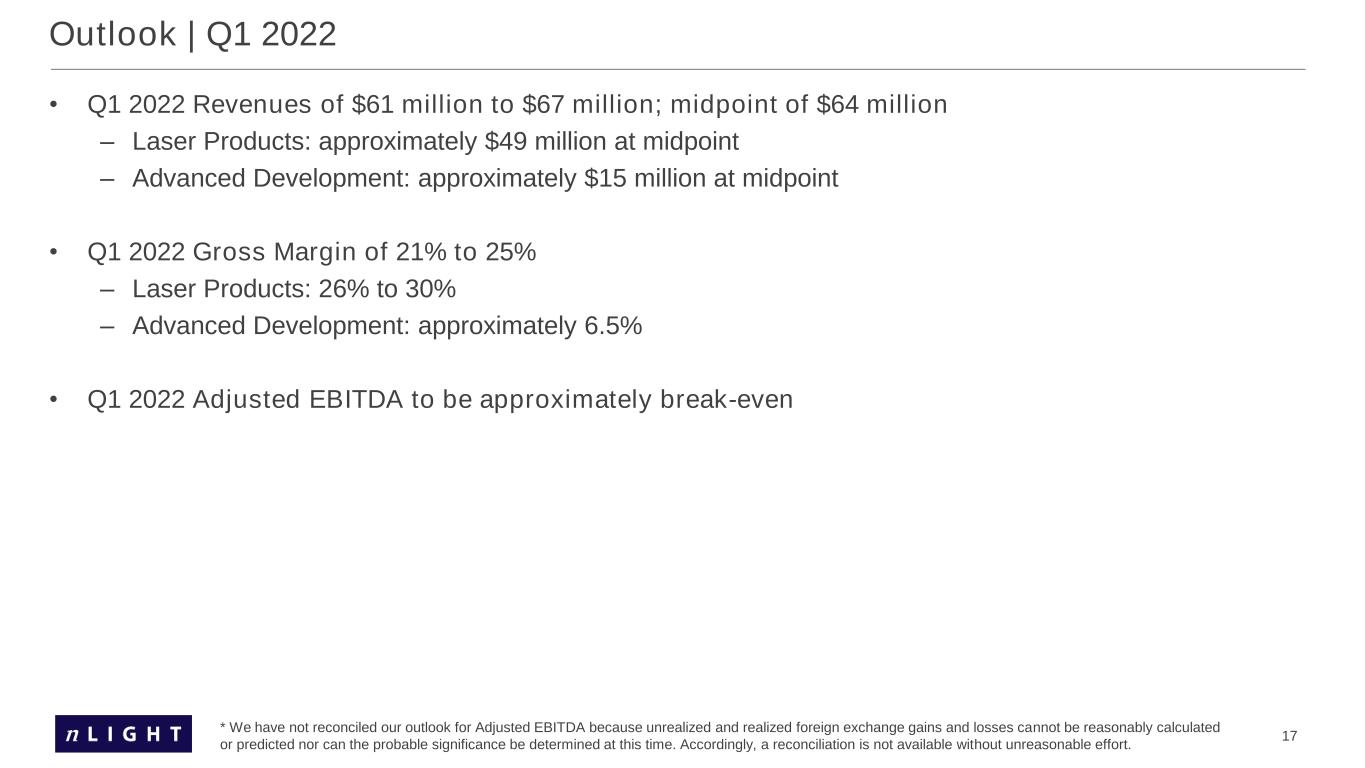
17 • Q1 2022 Revenues of $61 million to $67 million; midpoint of $64 million – Laser Products: approximately $49 million at midpoint – Advanced Development: approximately $15 million at midpoint • Q1 2022 Gross Margin of 21% to 25% – Laser Products: 26% to 30% – Advanced Development: approximately 6.5% • Q1 2022 Adjusted EBITDA to be approximately break-even Outlook | Q1 2022 * We have not reconciled our outlook for Adjusted EBITDA because unrealized and realized foreign exchange gains and losses cannot be reasonably calculated or predicted nor can the probable significance be determined at this time. Accordingly, a reconciliation is not available without unreasonable effort.


Appendix


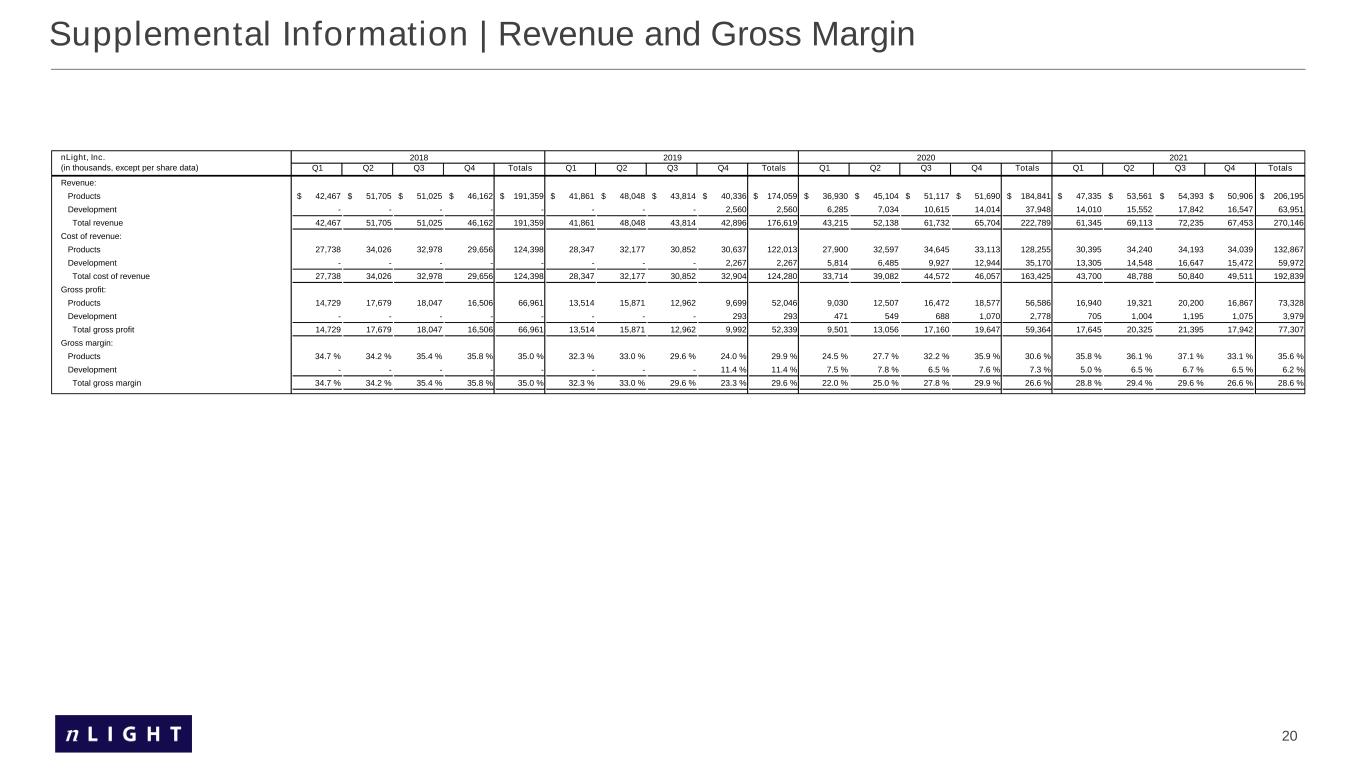
20 nLight, Inc. (in thousands, except per share data) Q1 Q2 Q3 Q4 Totals Q1 Q2 Q3 Q4 Totals Q1 Q2 Q3 Q4 Totals Q1 Q2 Q3 Q4 Totals Revenue: Products $ 42,467 $ 51,705 $ 51,025 $ 46,162 $ 191,359 $ 41,861 $ 48,048 $ 43,814 $ 40,336 $ 174,059 $ 36,930 $ 45,104 $ 51,117 $ 51,690 $ 184,841 $ 47,335 $ 53,561 $ 54,393 $ 50,906 $ 206,195 Development - - - - - - - - 2,560 2,560 6,285 7,034 10,615 14,014 37,948 14,010 15,552 17,842 16,547 63,951 Total revenue 42,467 51,705 51,025 46,162 191,359 41,861 48,048 43,814 42,896 176,619 43,215 52,138 61,732 65,704 222,789 61,345 69,113 72,235 67,453 270,146 Cost of revenue: Products 27,738 34,026 32,978 29,656 124,398 28,347 32,177 30,852 30,637 122,013 27,900 32,597 34,645 33,113 128,255 30,395 34,240 34,193 34,039 132,867 Development - - - - - - - - 2,267 2,267 5,814 6,485 9,927 12,944 35,170 13,305 14,548 16,647 15,472 59,972 Total cost of revenue 27,738 34,026 32,978 29,656 124,398 28,347 32,177 30,852 32,904 124,280 33,714 39,082 44,572 46,057 163,425 43,700 48,788 50,840 49,511 192,839 Gross profit: Products 14,729 17,679 18,047 16,506 66,961 13,514 15,871 12,962 9,699 52,046 9,030 12,507 16,472 18,577 56,586 16,940 19,321 20,200 16,867 73,328 Development - - - - - - - - 293 293 471 549 688 1,070 2,778 705 1,004 1,195 1,075 3,979 Total gross profit 14,729 17,679 18,047 16,506 66,961 13,514 15,871 12,962 9,992 52,339 9,501 13,056 17,160 19,647 59,364 17,645 20,325 21,395 17,942 77,307 Gross margin: Products 34.7 % 34.2 % 35.4 % 35.8 % 35.0 % 32.3 % 33.0 % 29.6 % 24.0 % 29.9 % 24.5 % 27.7 % 32.2 % 35.9 % 30.6 % 35.8 % 36.1 % 37.1 % 33.1 % 35.6 % Development - - - - - - - - 11.4 % 11.4 % 7.5 % 7.8 % 6.5 % 7.6 % 7.3 % 5.0 % 6.5 % 6.7 % 6.5 % 6.2 % Total gross margin 34.7 % 34.2 % 35.4 % 35.8 % 35.0 % 32.3 % 33.0 % 29.6 % 23.3 % 29.6 % 22.0 % 25.0 % 27.8 % 29.9 % 26.6 % 28.8 % 29.4 % 29.6 % 26.6 % 28.6 % 2018 2019 2020 2021 Supplemental Information | Revenue and Gross Margin


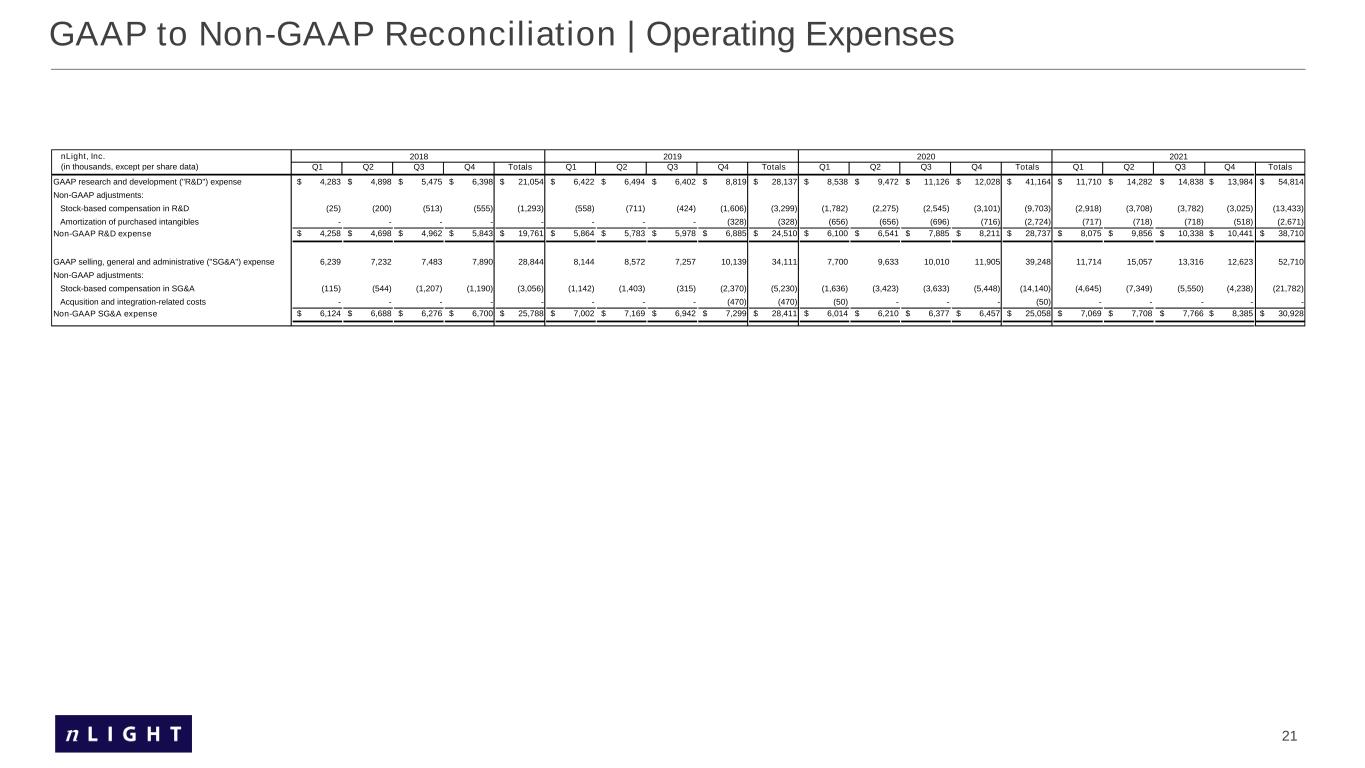
21 GAAP to Non-GAAP Reconciliation | Operating Expenses nLight, Inc. (in thousands, except per share data) Q1 Q2 Q3 Q4 Totals Q1 Q2 Q3 Q4 Totals Q1 Q2 Q3 Q4 Totals Q1 Q2 Q3 Q4 Totals GAAP research and development ("R&D") expense $ 4,283 $ 4,898 $ 5,475 $ 6,398 $ 21,054 $ 6,422 $ 6,494 $ 6,402 $ 8,819 $ 28,137 $ 8,538 $ 9,472 $ 11,126 $ 12,028 $ 41,164 $ 11,710 $ 14,282 $ 14,838 $ 13,984 $ 54,814 Non-GAAP adjustments: Stock-based compensation in R&D (25) (200) (513) (555) (1,293) (558) (711) (424) (1,606) (3,299) (1,782) (2,275) (2,545) (3,101) (9,703) (2,918) (3,708) (3,782) (3,025) (13,433) Amortization of purchased intangibles - - - - - - - - (328) (328) (656) (656) (696) (716) (2,724) (717) (718) (718) (518) (2,671) Non-GAAP R&D expense $ 4,258 $ 4,698 $ 4,962 $ 5,843 $ 19,761 $ 5,864 $ 5,783 $ 5,978 $ 6,885 $ 24,510 $ 6,100 $ 6,541 $ 7,885 $ 8,211 $ 28,737 $ 8,075 $ 9,856 $ 10,338 $ 10,441 $ 38,710 GAAP selling, general and administrative ("SG&A") expense 6,239 7,232 7,483 7,890 28,844 8,144 8,572 7,257 10,139 34,111 7,700 9,633 10,010 11,905 39,248 11,714 15,057 13,316 12,623 52,710 Non-GAAP adjustments: Stock-based compensation in SG&A (115) (544) (1,207) (1,190) (3,056) (1,142) (1,403) (315) (2,370) (5,230) (1,636) (3,423) (3,633) (5,448) (14,140) (4,645) (7,349) (5,550) (4,238) (21,782) Acqusition and integration-related costs - - - - - - - - (470) (470) (50) - - - (50) - - - - - Non-GAAP SG&A expense $ 6,124 $ 6,688 $ 6,276 $ 6,700 $ 25,788 $ 7,002 $ 7,169 $ 6,942 $ 7,299 $ 28,411 $ 6,014 $ 6,210 $ 6,377 $ 6,457 $ 25,058 $ 7,069 $ 7,708 $ 7,766 $ 8,385 $ 30,928 2018 2019 2020 2021


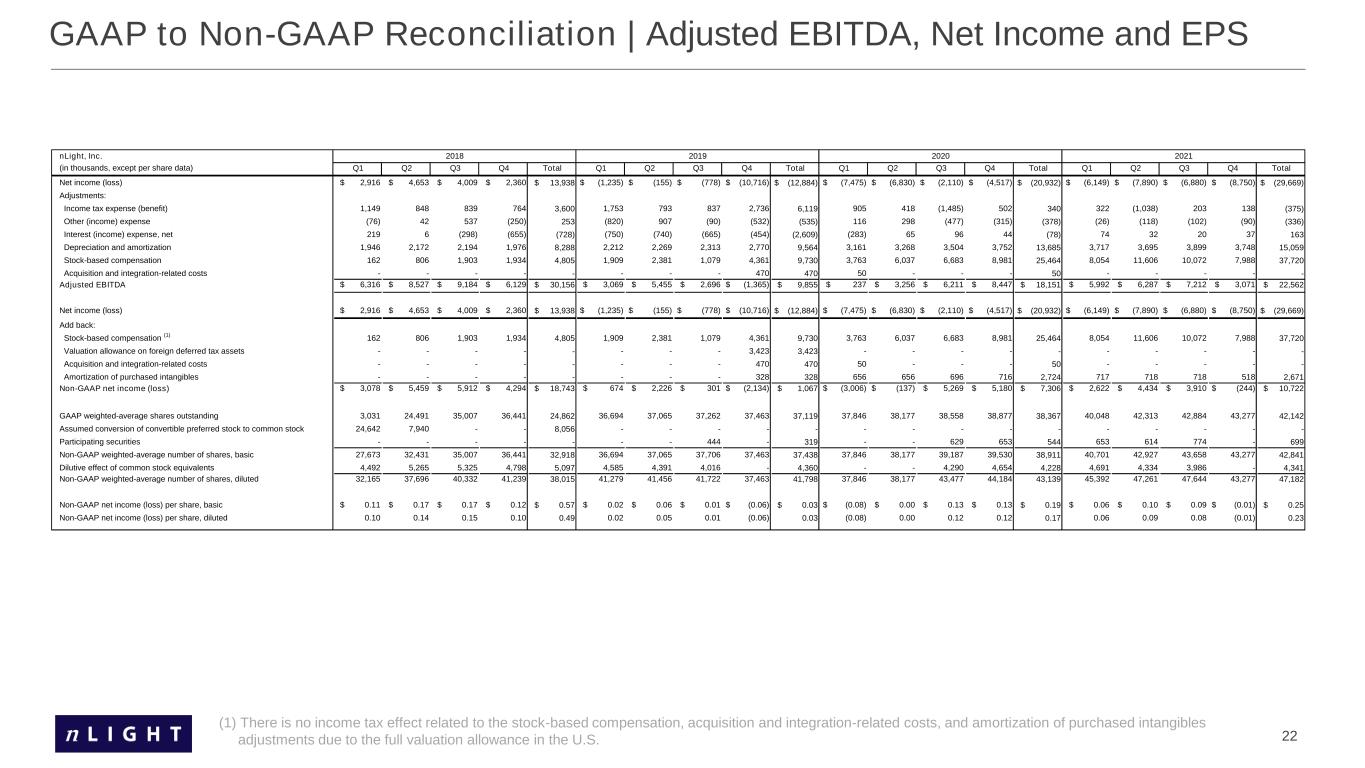
22 (1) There is no income tax effect related to the stock-based compensation, acquisition and integration-related costs, and amortization of purchased intangibles adjustments due to the full valuation allowance in the U.S. GAAP to Non-GAAP Reconciliation | Adjusted EBITDA, Net Income and EPS nLight, Inc. 2018 2019 2020 2021 (in thousands, except per share data) Q1 Q2 Q3 Q4 Total Q1 Q2 Q3 Q4 Total Q1 Q2 Q3 Q4 Total Q1 Q2 Q3 Q4 Total Net income (loss) $ 2,916 $ 4,653 $ 4,009 $ 2,360 $ 13,938 $ (1,235) $ (155) $ (778) $ (10,716) $ (12,884) $ (7,475) $ (6,830) $ (2,110) $ (4,517) $ (20,932) $ (6,149) $ (7,890) $ (6,880) $ (8,750) $ (29,669) Adjustments: Income tax expense (benefit) 1,149 848 839 764 3,600 1,753 793 837 2,736 6,119 905 418 (1,485) 502 340 322 (1,038) 203 138 (375) Other (income) expense (76) 42 537 (250) 253 (820) 907 (90) (532) (535) 116 298 (477) (315) (378) (26) (118) (102) (90) (336) Interest (income) expense, net 219 6 (298) (655) (728) (750) (740) (665) (454) (2,609) (283) 65 96 44 (78) 74 32 20 37 163 Depreciation and amortization 1,946 2,172 2,194 1,976 8,288 2,212 2,269 2,313 2,770 9,564 3,161 3,268 3,504 3,752 13,685 3,717 3,695 3,899 3,748 15,059 Stock-based compensation 162 806 1,903 1,934 4,805 1,909 2,381 1,079 4,361 9,730 3,763 6,037 6,683 8,981 25,464 8,054 11,606 10,072 7,988 37,720 Acquisition and integration-related costs - - - - - - - - 470 470 50 - - - 50 - - - - - Adjusted EBITDA $ 6,316 $ 8,527 $ 9,184 $ 6,129 $ 30,156 $ 3,069 $ 5,455 $ 2,696 $ (1,365) $ 9,855 $ 237 $ 3,256 $ 6,211 $ 8,447 $ 18,151 $ 5,992 $ 6,287 $ 7,212 $ 3,071 $ 22,562 Net income (loss) $ 2,916 $ 4,653 $ 4,009 $ 2,360 $ 13,938 $ (1,235) $ (155) $ (778) $ (10,716) $ (12,884) $ (7,475) $ (6,830) $ (2,110) $ (4,517) $ (20,932) $ (6,149) $ (7,890) $ (6,880) $ (8,750) $ (29,669) Add back: Stock-based compensation (1) 162 806 1,903 1,934 4,805 1,909 2,381 1,079 4,361 9,730 3,763 6,037 6,683 8,981 25,464 8,054 11,606 10,072 7,988 37,720 Valuation allowance on foreign deferred tax assets - - - - - - - - 3,423 3,423 - - - - - - - - - - Acquisition and integration-related costs - - - - - - - - 470 470 50 - - - 50 - - - - - Amortization of purchased intangibles - - - - - - - - 328 328 656 656 696 716 2,724 717 718 718 518 2,671 Non-GAAP net income (loss) $ 3,078 $ 5,459 $ 5,912 $ 4,294 $ 18,743 $ 674 $ 2,226 $ 301 $ (2,134) $ 1,067 $ (3,006) $ (137) $ 5,269 $ 5,180 $ 7,306 $ 2,622 $ 4,434 $ 3,910 $ (244) $ 10,722 GAAP weighted-average shares outstanding 3,031 24,491 35,007 36,441 24,862 36,694 37,065 37,262 37,463 37,119 37,846 38,177 38,558 38,877 38,367 40,048 42,313 42,884 43,277 42,142 Assumed conversion of convertible preferred stock to common stock 24,642 7,940 - - 8,056 - - - - - - - - - - - - - - - Participating securities - - - - - - - 444 - 319 - - 629 653 544 653 614 774 - 699 Non-GAAP weighted-average number of shares, basic 27,673 32,431 35,007 36,441 32,918 36,694 37,065 37,706 37,463 37,438 37,846 38,177 39,187 39,530 38,911 40,701 42,927 43,658 43,277 42,841 Dilutive effect of common stock equivalents 4,492 5,265 5,325 4,798 5,097 4,585 4,391 4,016 - 4,360 - - 4,290 4,654 4,228 4,691 4,334 3,986 - 4,341 Non-GAAP weighted-average number of shares, diluted 32,165 37,696 40,332 41,239 38,015 41,279 41,456 41,722 37,463 41,798 37,846 38,177 43,477 44,184 43,139 45,392 47,261 47,644 43,277 47,182 Non-GAAP net income (loss) per share, basic $ 0.11 $ 0.17 $ 0.17 $ 0.12 $ 0.57 $ 0.02 $ 0.06 $ 0.01 $ (0.06) $ 0.03 $ (0.08) $ 0.00 $ 0.13 $ 0.13 $ 0.19 $ 0.06 $ 0.10 $ 0.09 $ (0.01) $ 0.25 Non-GAAP net income (loss) per share, diluted 0.10 0.14 0.15 0.10 0.49 0.02 0.05 0.01 (0.06) 0.03 (0.08) 0.00 0.12 0.12 0.17 0.06 0.09 0.08 (0.01) 0.23

 
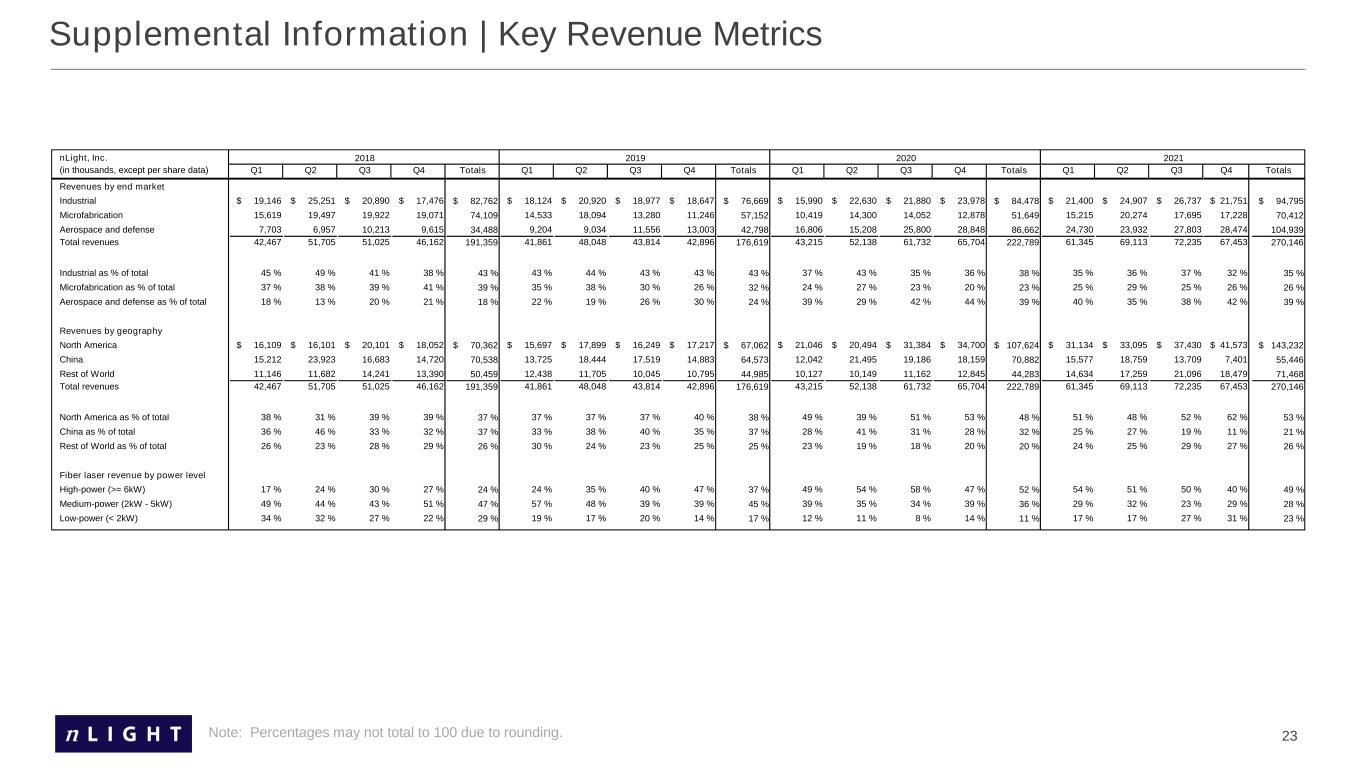
23 Supplemental Information | Key Revenue Metrics Note: Percentages may not total to 100 due to rounding. nLight, Inc. (in thousands, except per share data) Q1 Q2 Q3 Q4 Totals Q1 Q2 Q3 Q4 Totals Q1 Q2 Q3 Q4 Totals Q1 Q2 Q3 Q4 Totals Revenues by end market Industrial $ 19,146 $ 25,251 $ 20,890 $ 17,476 $ 82,762 $ 18,124 $ 20,920 $ 18,977 $ 18,647 $ 76,669 $ 15,990 $ 22,630 $ 21,880 $ 23,978 $ 84,478 $ 21,400 $ 24,907 $ 26,737 $ 21,751 $ 94,795 Microfabrication 15,619 19,497 19,922 19,071 74,109 14,533 18,094 13,280 11,246 57,152 10,419 14,300 14,052 12,878 51,649 15,215 20,274 17,695 17,228 70,412 Aerospace and defense 7,703 6,957 10,213 9,615 34,488 9,204 9,034 11,556 13,003 42,798 16,806 15,208 25,800 28,848 86,662 24,730 23,932 27,803 28,474 104,939 Total revenues 42,467 51,705 51,025 46,162 191,359 41,861 48,048 43,814 42,896 176,619 43,215 52,138 61,732 65,704 222,789 61,345 69,113 72,235 67,453 270,146 Industrial as % of total 45 % 49 % 41 % 38 % 43 % 43 % 44 % 43 % 43 % 43 % 37 % 43 % 35 % 36 % 38 % 35 % 36 % 37 % 32 % 35 % Microfabrication as % of total 37 % 38 % 39 % 41 % 39 % 35 % 38 % 30 % 26 % 32 % 24 % 27 % 23 % 20 % 23 % 25 % 29 % 25 % 26 % 26 % Aerospace and defense as % of total 18 % 13 % 20 % 21 % 18 % 22 % 19 % 26 % 30 % 24 % 39 % 29 % 42 % 44 % 39 % 40 % 35 % 38 % 42 % 39 % Revenues by geography North America $ 16,109 $ 16,101 $ 20,101 $ 18,052 $ 70,362 $ 15,697 $ 17,899 $ 16,249 $ 17,217 $ 67,062 $ 21,046 $ 20,494 $ 31,384 $ 34,700 $ 107,624 $ 31,134 $ 33,095 $ 37,430 $ 41,573 $ 143,232 China 15,212 23,923 16,683 14,720 70,538 13,725 18,444 17,519 14,883 64,573 12,042 21,495 19,186 18,159 70,882 15,577 18,759 13,709 7,401 55,446 Rest of World 11,146 11,682 14,241 13,390 50,459 12,438 11,705 10,045 10,795 44,985 10,127 10,149 11,162 12,845 44,283 14,634 17,259 21,096 18,479 71,468 Total revenues 42,467 51,705 51,025 46,162 191,359 41,861 48,048 43,814 42,896 176,619 43,215 52,138 61,732 65,704 222,789 61,345 69,113 72,235 67,453 270,146 North America as % of total 38 % 31 % 39 % 39 % 37 % 37 % 37 % 37 % 40 % 38 % 49 % 39 % 51 % 53 % 48 % 51 % 48 % 52 % 62 % 53 % China as % of total 36 % 46 % 33 % 32 % 37 % 33 % 38 % 40 % 35 % 37 % 28 % 41 % 31 % 28 % 32 % 25 % 27 % 19 % 11 % 21 % Rest of World as % of total 26 % 23 % 28 % 29 % 26 % 30 % 24 % 23 % 25 % 25 % 23 % 19 % 18 % 20 % 20 % 24 % 25 % 29 % 27 % 26 % Fiber laser revenue by power level High-power (>= 6kW) 17 % 24 % 30 % 27 % 24 % 24 % 35 % 40 % 47 % 37 % 49 % 54 % 58 % 47 % 52 % 54 % 51 % 50 % 40 % 49 % Medium-power (2kW - 5kW) 49 % 44 % 43 % 51 % 47 % 57 % 48 % 39 % 39 % 45 % 39 % 35 % 34 % 39 % 36 % 29 % 32 % 23 % 29 % 28 % Low-power (< 2kW) 34 % 32 % 27 % 22 % 29 % 19 % 17 % 20 % 14 % 17 % 12 % 11 % 8 % 14 % 11 % 17 % 17 % 27 % 31 % 23 % 2018 2019 2020 2021


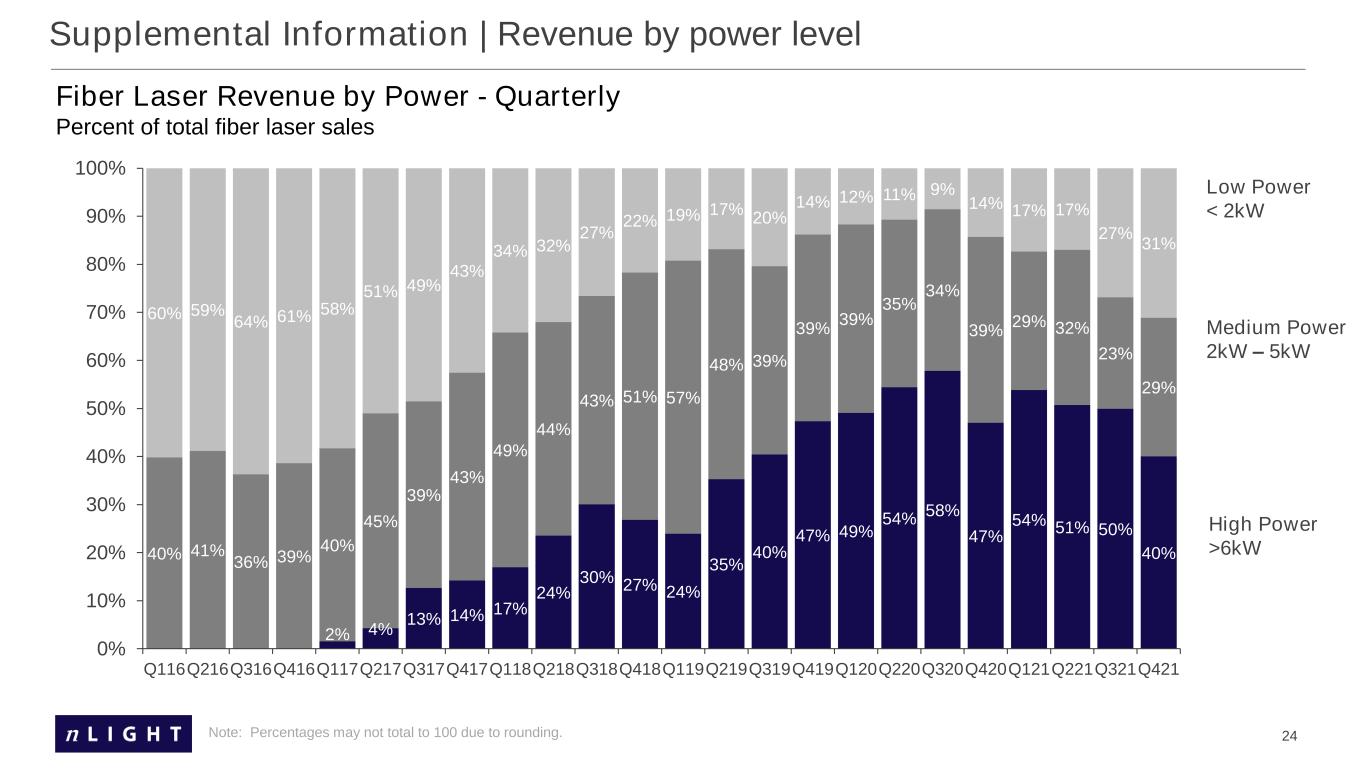
24 Supplemental Information | Revenue by power level 2% 4% 13% 14% 17% 24% 30% 27% 24% 35% 40% 47% 49% 54% 58% 47% 54% 51% 50% 40%40% 41% 36% 39% 40% 45% 39% 43% 49% 44% 43% 51% 57% 48% 39% 39% 39% 35% 34% 39% 29% 32% 23% 29% 60% 59% 64% 61% 58% 51% 49% 43% 34% 32% 27% 22% 19% 17% 20% 14% 12% 11% 9% 14% 17% 17% 27% 31% 0% 10% 20% 30% 40% 50% 60% 70% 80% 90% 100% Q116Q216Q316Q416Q117Q217Q317Q417Q118Q218Q318Q418Q119Q219Q319Q419Q120Q220Q320Q420Q121Q221Q321Q421 Fiber Laser Revenue by Power - Quarterly Percent of total fiber laser sales High Power >6kW Low Power < 2kW Medium Power 2kW – 5kW Note: Percentages may not total to 100 due to rounding.