Exhibit 99.1
FOR IMMEDIATE RELEASE |  | |||||||
Contact: Brian Hall, CFO | ||||||||
Phone: (574) 535-1125 | ||||||||
E Mail: [email protected] | ||||||||
LCI INDUSTRIES REPORTS SECOND QUARTER RESULTS
Increasing RV demand drives record June and July sales
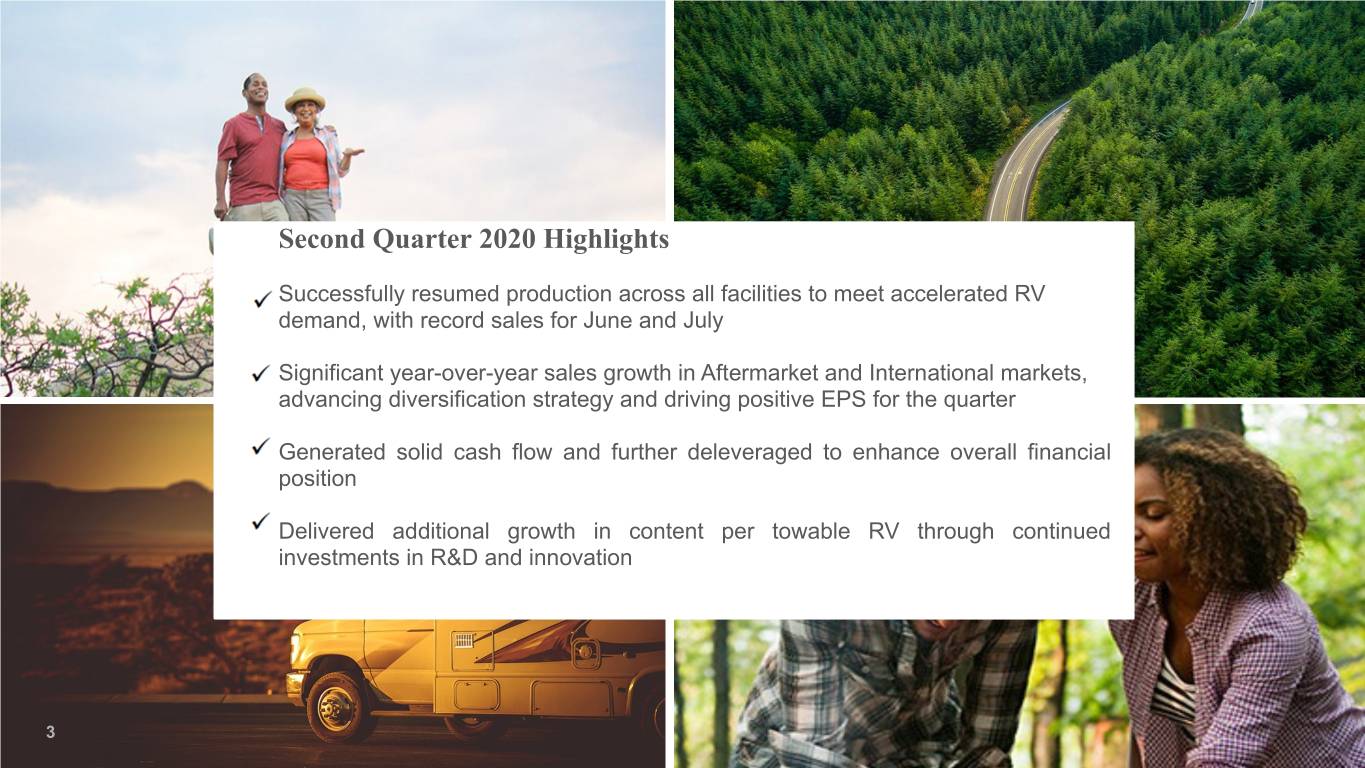
Second Quarter 2020 Highlights
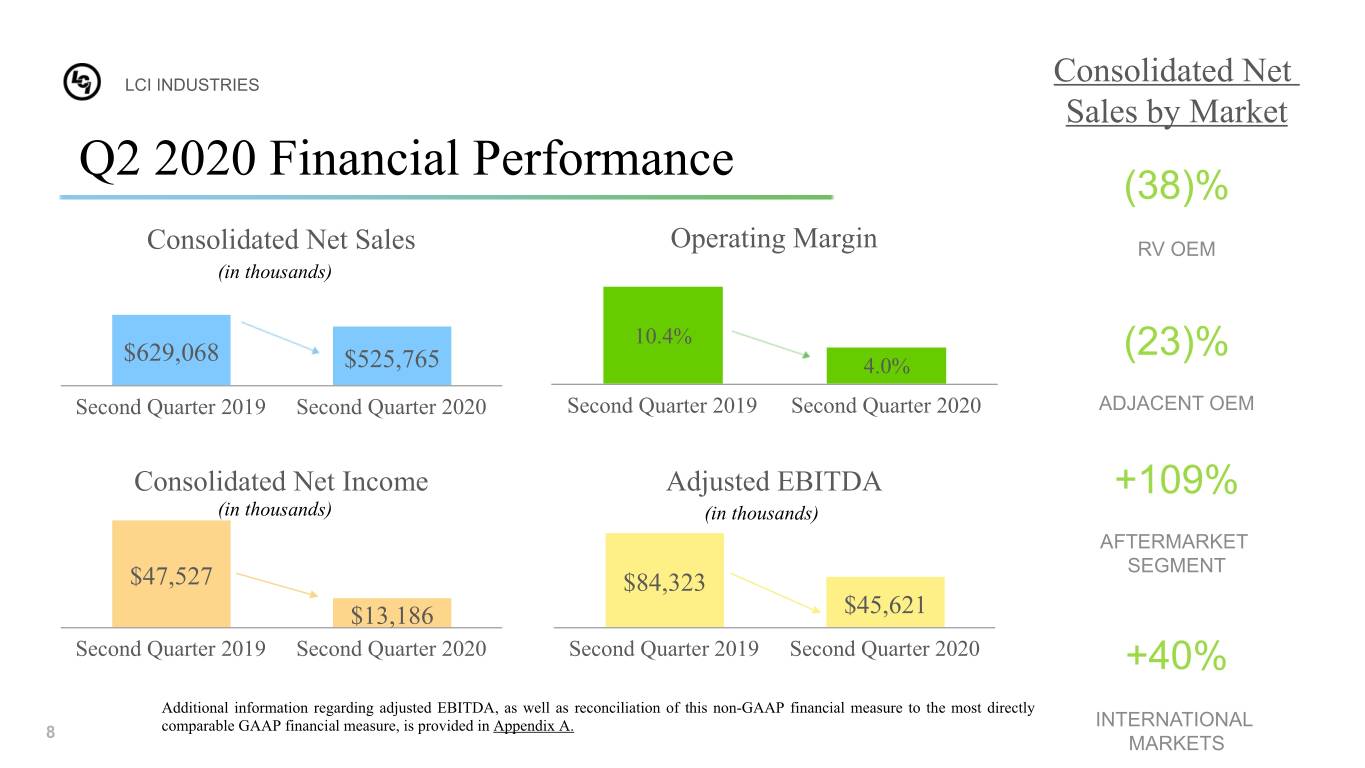
•Net sales of $525.8 million in the second quarter, a decrease of 16% year-over-year
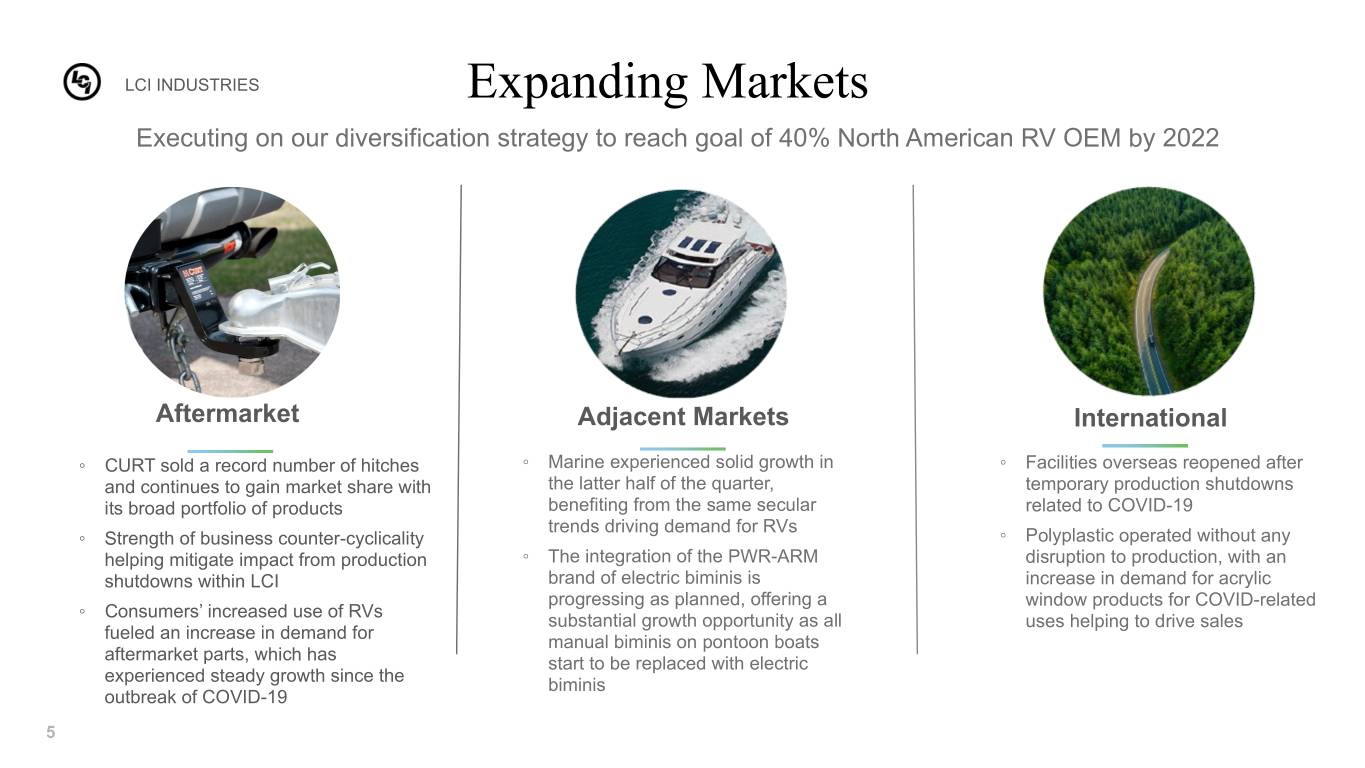
•Aftermarket Segment sales grew to $158.0 million in the second quarter, an increase of 109% year-over-year
•International sales grew to $44.1 million in the second quarter, an increase of 40% year-over-year
•Adjacent Industries OEM sales declined to $130.6 million in the second quarter, a decrease of 23% year-over-year
•North American RV OEM net sales were less than 52% of total net sales for the twelve months ended June 30, 2020
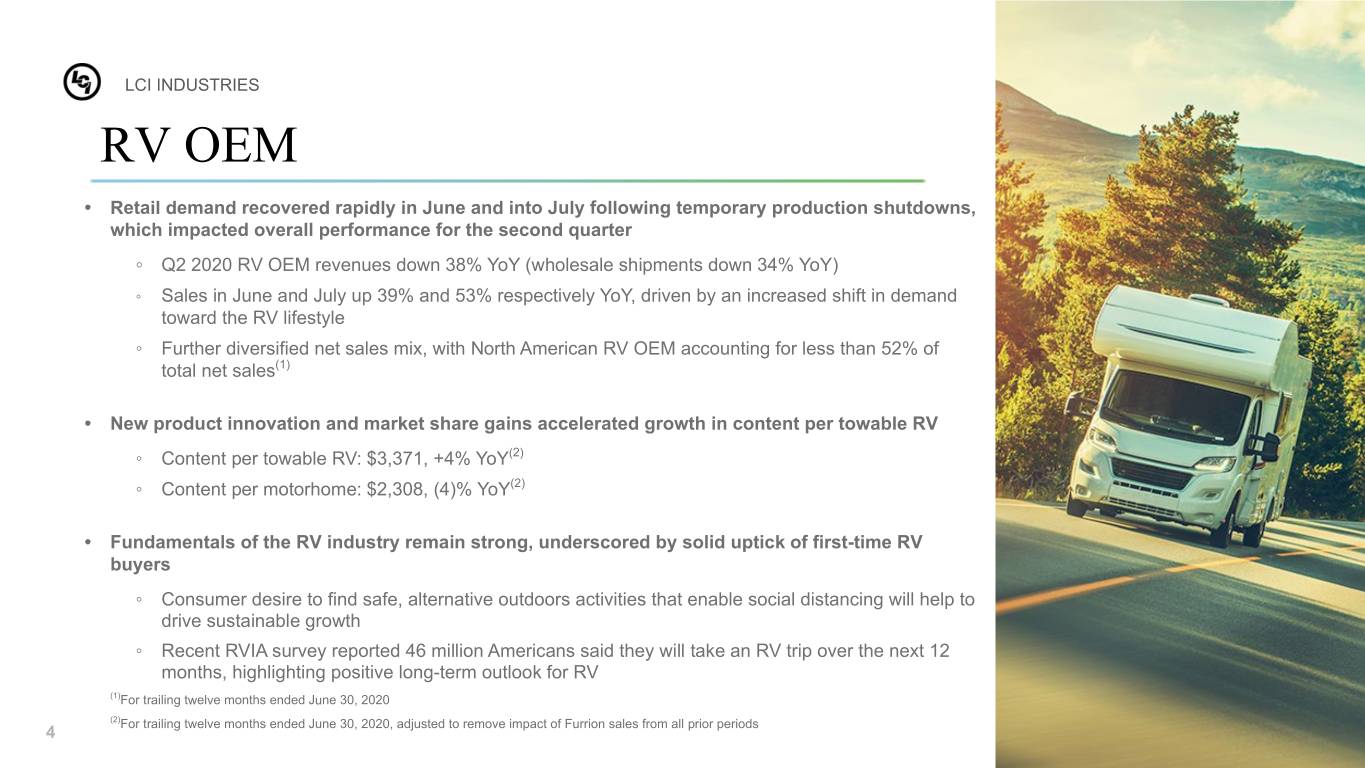
•Content per travel trailer and fifth-wheel RV, adjusted to remove Furrion sales from prior periods, increased $141 year-over-year, or 4%, to $3,371 for the twelve months ended June 30, 2020
•Net income declined $34.3 million, or 72.3%, to $13.2 million, or $0.52 per diluted share, in the second quarter
•Adjusted net income, adjusted for a noncash charge for inventory fair value step-up and the related tax impact, declined $33.8 million, or 71.2%, to $13.7 million, or $0.54 per diluted share, in the second quarter
•Adjusted EBITDA decreased $38.7 million, or 45.9%, to $45.6 million in the second quarter
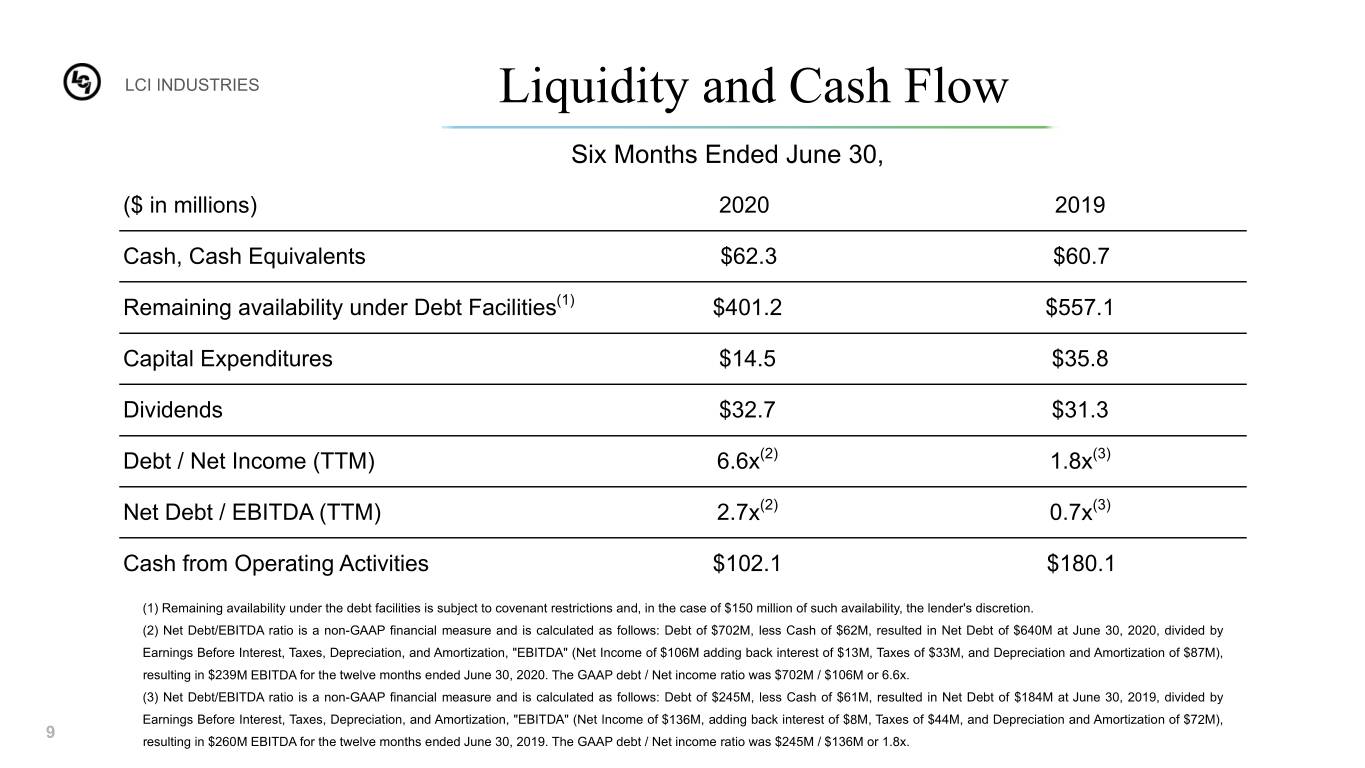
•Total debt decreased to $702.1 million at June 30, 2020 compared to $768.8 million at March 31, 2020, and cash decreased to $62.3 million at June 30, 2020 compared to $98.0 million at March 31, 2020
•Quarterly dividend of $0.65 per share paid totaling $16.3 million
Elkhart, Indiana - August 4, 2020 - LCI Industries (NYSE: LCII) which, through its wholly-owned subsidiary, Lippert Components, Inc. ("LCI"), supplies a broad array of highly engineered components for the leading original equipment manufacturers ("OEMs") in the recreation and transportation product markets, and the related aftermarkets of those industries, today reported second quarter 2020 results.
“Our teams showed tremendous execution during the second quarter. Amidst a very difficult operating environment, we captured accelerated demand for RV and marine products, as well as strength in the aftermarket. In a span of less than two months, we were able to go from a near total shutdown in April to a record sales month in June. This could not have happened without the focus and speed to react by our leaders and team members. Despite top-line impact caused by production shutdowns in response to the COVID pandemic, we made substantial progress on driving operational efficiencies in an effort to mitigate any long-term impact to the business as a result of the pandemic, highlighting the effectiveness of the cost management initiatives we put into place at the beginning of the quarter,” commented Jason Lippert, LCI Industries’ President and Chief Executive Officer.
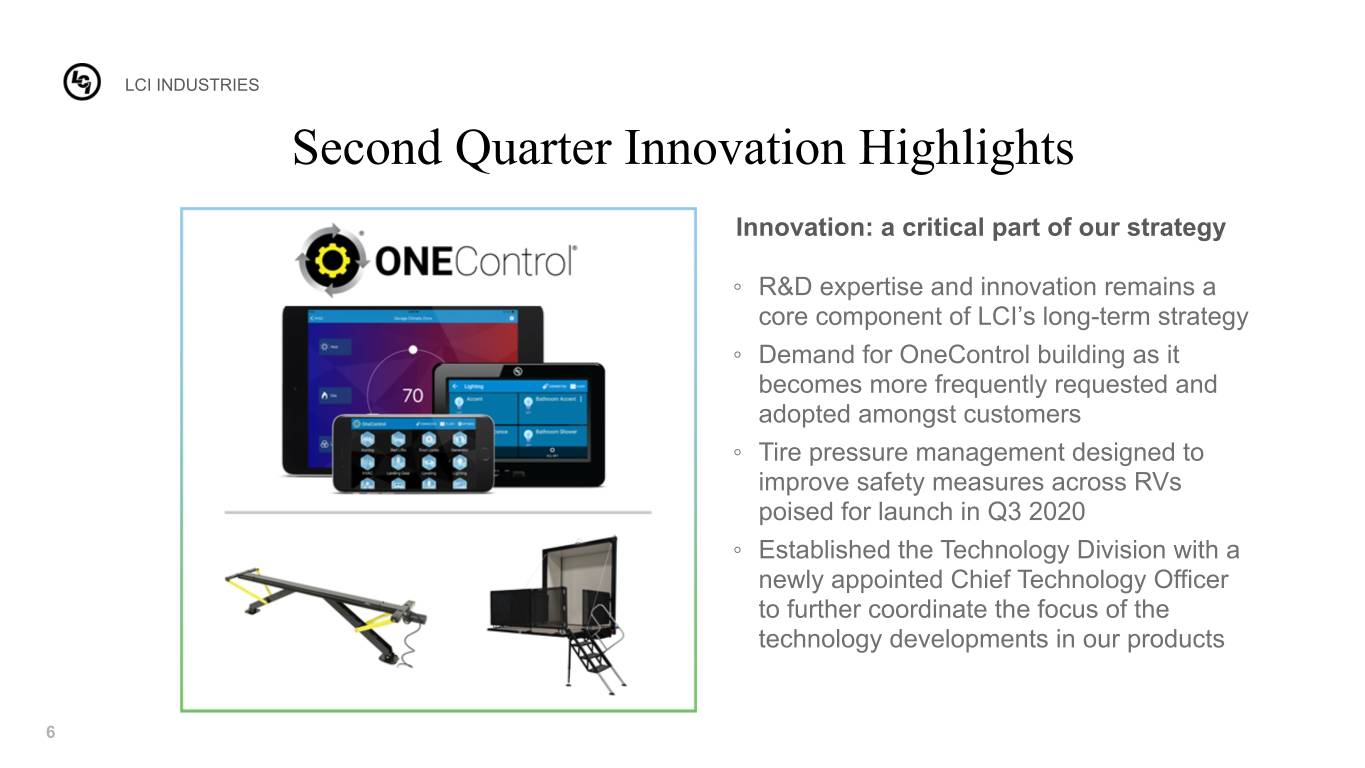
“We expect heightened RV demand to continue, signaling a paradigm shift for the industry as consumers are increasingly drawn into the RV lifestyle as a safe way to spend time with family in the outdoors. As a leader in innovation, LCI has a significant opportunity to further enhance its competitive position in the space,” Lippert continued. “Looking to the second half of 2020, we remain focused on executing on our diversification strategy, while at the same time, preparing to meet elevated RV demand. We stand committed to driving innovation across the business to further create value for our shareholders. In addition, I would like to thank our entire team, and in particular our operations and manufacturing groups, for juggling the demands of an extremely volatile operating
environment. To deliver strong results amidst these challenges was an amazing accomplishment, and a testament to the capabilities of LCI’s robust leadership.”
Second Quarter 2020 Results
Consolidated net sales for the second quarter of 2020 were $525.8 million, a decrease of 16 percent from 2019 second quarter net sales of $629.1 million. Net income in the second quarter of 2020 was $13.2 million, or $0.52 per diluted share, compared to net income of $47.5 million, or $1.89 per diluted share, in the second quarter of 2019. Adjusted net income in the second quarter of 2020 was $13.7 million, or $0.54 per diluted share. Adjusted EBITDA in the second quarter of 2020 was $45.6 million, compared to adjusted EBITDA of $84.3 million in the second quarter of 2019. Additional information regarding adjusted net income, adjusted diluted net income per common share, and adjusted EBITDA, as well as reconciliations of these non-GAAP financial measures to the most directly comparable GAAP financial measures, are provided in the "Supplementary Information - Reconciliation of Non-GAAP Measures" section below.
The decrease in year-over-year net sales for the second quarter of 2020 was primarily driven by the impact of customer shutdowns in response to the COVID-19 pandemic, partially offset by acquisitions and organic growth across the Company's aftermarket segment and international markets. Net sales from acquisitions completed by the Company contributed $103 million in the second quarter of 2020.
The Company's content per travel trailer and fifth-wheel RV, adjusted to remove Furrion sales from prior periods, for the twelve months ended June 30, 2020, increased $141 to $3,371, compared to $3,230 for the twelve months ended June 30, 2019. The content increase in towables was a result of organic growth, including new product introductions, partially offset by price reductions.
July 2020 Results
July 2020 consolidated net sales were approximately $280 million, up 53 percent from July 2019 as the significant increase in RV production continued into July with many manufacturers electing to produce during the typical holiday shutdown.
Income Taxes
The Company's effective tax rate was 22.8 percent for the quarter ended June 30, 2020, compared to 25.2 percent for the quarter ended June 30, 2019. The effective tax rate was lower primarily due to an increase in discrete benefits.
Balance Sheet and Other Items
At June 30, 2020, the Company's cash and cash equivalents balance was $62.3 million, up from the balance of $35.4 million at the beginning of the year. The Company generated cash flows from operations of $102.1 million and used $94.7 million for acquisitions, $32.7 million for dividend payments to shareholders, and $14.5 million in capital expenditures in the six months ended June 30, 2020. The Company's outstanding long-term indebtedness, including current maturities, was $702.1 million at June 30, 2020, and the Company remained in compliance with its debt covenants. The Company believes that its current liquidity is adequate to meet operating needs for the foreseeable future.
Conference Call & Webcast
LCI will host a conference call to discuss its second quarter results on Tuesday, August 4, 2020, at 8:30 a.m. Eastern time, which may be accessed by dialing (877) 668-4883 for participants in the U.S./Canada or (825) 312-2360 for participants outside the U.S./Canada using the required conference ID 7038939. Due to the high volume of companies reporting earnings at this time, please be prepared for hold times of up to 15 minutes when
dialing in to the call. In addition, an online, real-time webcast, as well as a supplemental earnings presentation, can be accessed on the Company's website, www.investors.lci1.com.
A replay of the conference call will be available for two weeks by dialing (800) 585-8367 for participants in the U.S./Canada or (416) 621-4642 for participants outside the U.S./Canada and referencing access code 7038939. A replay of the webcast will be available on the Company's website immediately following the conclusion of the call.
About LCI Industries
From over 90 manufacturing and distribution facilities located throughout North America and Europe, LCI Industries, through its wholly-owned subsidiary, LCI, supplies, domestically and internationally, a broad array of highly engineered components for the leading OEMs in the recreation and transportation product markets, consisting primarily of recreational vehicles and adjacent industries, including buses; trailers used to haul boats, livestock, equipment, and other cargo; trucks; boats; trains; manufactured homes; and modular housing. The Company also supplies engineered components to the related aftermarkets of these industries primarily by selling to retail dealers, wholesale distributors, and service centers. LCI's products include steel chassis and related components; axles and suspension solutions; slide-out mechanisms and solutions; thermoformed bath, kitchen, and other products; vinyl, aluminum, and frameless windows; manual, electric, and hydraulic stabilizer and leveling systems; entry, luggage, patio, and ramp doors; furniture and mattresses; electric and manual entry steps; awnings and awning accessories; towing products; truck accessories; electronic components; and other accessories. Additional information about LCI and its products can be found at www.lci1.com.
Forward-Looking Statements
This press release contains certain "forward-looking statements" with respect to our financial condition, results of operations, business strategies, operating efficiencies or synergies, competitive position, growth opportunities, acquisitions, plans and objectives of management, markets for the Company's common stock, the impact of legal proceedings, and other matters. Statements in this press release that are not historical facts are "forward-looking statements" for the purpose of the safe harbor provided by Section 21E of the Securities Exchange Act of 1934, as amended, and Section 27A of the Securities Act of 1933, as amended, and involve a number of risks and uncertainties.
Forward-looking statements, including, without limitation, those relating to our future business prospects, net sales, expenses and income (loss), capital expenditures, tax rate, cash flow, financial condition, liquidity, consumer demand, integration of acquisitions, R&D investments, and resumption or suspension of normal operations, whenever they occur in this press release are necessarily estimates reflecting the best judgment of the Company's senior management at the time such statements were made. There are a number of factors, many of which are beyond the Company's control, which could cause actual results and events to differ materially from those described in the forward-looking statements. These factors include, in addition to other matters described in this press release, the impacts of COVID-19, or other future pandemics, on the global economy and on the Company's customers, suppliers, employees, business and cash flows, pricing pressures due to domestic and foreign competition, costs and availability of, and tariffs on, raw materials (particularly steel and aluminum) and other components, seasonality and cyclicality in the industries to which we sell our products, availability of credit for financing the retail and wholesale purchase of products for which we sell our components, inventory levels of retail dealers and manufacturers, availability of transportation for products for which we sell our components, the financial condition of our customers, the financial condition of retail dealers of products for which we sell our components, retention and concentration of significant customers, the costs, pace of and successful integration of acquisitions and other growth initiatives, availability and costs of production facilities and labor, team member benefits, team member retention, realization and impact of expansion plans, efficiency improvements and cost reductions, the disruption of business resulting from natural disasters or other unforeseen events, the successful entry into new markets, the costs of compliance with environmental laws, laws of foreign jurisdictions in which we operate, other operational and financial risks related to conducting business internationally, and increased governmental regulation and oversight, information technology performance and security, the ability to protect intellectual property, warranty and product liability claims or product recalls, interest rates, oil and gasoline prices and availability, the impact of international, national and regional economic conditions and consumer confidence on the retail sale of products for which we sell
our components, and other risks and uncertainties discussed more fully under the caption "Risk Factors" in the Company's Annual Report on Form 10-K for the year ended December 31, 2019, and in the Company's subsequent filings with the Securities and Exchange Commission. Readers of this press release are cautioned not to place undue reliance on these forward-looking statements, since there can be no assurance that these forward-looking statements will prove to be accurate. The Company disclaims any obligation or undertaking to update forward-looking statements to reflect circumstances or events that occur after the date the forward-looking statements are made, except as required by law.
###
LCI INDUSTRIES
OPERATING RESULTS
(unaudited)
| Three Months Ended June 30, | Six Months Ended June 30, | Last Twelve | |||||||||||||||||||||||||||
| 2020 | 2019 | 2020 | 2019 | Months | |||||||||||||||||||||||||
| (In thousands, except per share amounts) | |||||||||||||||||||||||||||||
| Net sales | $ | 525,765 | $ | 629,068 | $ | 1,185,435 | $ | 1,221,240 | $ | 2,335,677 | |||||||||||||||||||
| Cost of sales | 397,023 | 480,415 | 898,088 | 939,993 | 1,790,375 | ||||||||||||||||||||||||
| Gross profit | 128,742 | 148,653 | 287,347 | 281,247 | 545,302 | ||||||||||||||||||||||||
| Selling, general and administrative expenses | 107,960 | 82,996 | 222,299 | 167,835 | 393,456 | ||||||||||||||||||||||||
| Operating profit | 20,782 | 65,657 | 65,048 | 113,412 | 151,846 | ||||||||||||||||||||||||
| Interest expense, net | 3,698 | 2,099 | 8,895 | 4,606 | 13,085 | ||||||||||||||||||||||||
| Income before income taxes | 17,084 | 63,558 | 56,153 | 108,806 | 138,761 | ||||||||||||||||||||||||
| Provision for income taxes | 3,898 | 16,031 | 14,753 | 26,913 | 32,745 | ||||||||||||||||||||||||
| Net income | $ | 13,186 | $ | 47,527 | $ | 41,400 | $ | 81,893 | $ | 106,016 | |||||||||||||||||||
| Net income per common share: | |||||||||||||||||||||||||||||
| Basic | $ | 0.52 | $ | 1.90 | $ | 1.65 | $ | 3.28 | $ | 4.23 | |||||||||||||||||||
| Diluted | $ | 0.52 | $ | 1.89 | $ | 1.64 | $ | 3.28 | $ | 4.21 | |||||||||||||||||||
| Weighted average common shares outstanding: | |||||||||||||||||||||||||||||
| Basic | 25,150 | 25,024 | 25,108 | 24,963 | 25,078 | ||||||||||||||||||||||||
| Diluted | 25,219 | 25,091 | 25,177 | 25,005 | 25,186 | ||||||||||||||||||||||||
| Depreciation and amortization | $ | 24,185 | $ | 18,666 | $ | 48,799 | $ | 37,115 | $ | 87,042 | |||||||||||||||||||
| Capital expenditures | $ | 6,594 | $ | 11,344 | $ | 14,549 | $ | 35,786 | $ | 36,965 | |||||||||||||||||||
LCI INDUSTRIES
SEGMENT RESULTS
(unaudited)
| Three Months Ended June 30, | Six Months Ended June 30, | Last Twelve | |||||||||||||||||||||||||||
| 2020 | 2019 | 2020 | 2019 | Months | |||||||||||||||||||||||||
| (In thousands) | |||||||||||||||||||||||||||||
| Net sales: | |||||||||||||||||||||||||||||
| OEM Segment: | |||||||||||||||||||||||||||||
| RV OEMs: | |||||||||||||||||||||||||||||
| Travel trailers and fifth-wheels | $ | 212,518 | $ | 343,051 | $ | 519,626 | $ | 659,922 | $ | 1,136,422 | |||||||||||||||||||
| Motorhomes | 24,713 | 41,357 | 62,800 | 86,357 | 132,066 | ||||||||||||||||||||||||
| Adjacent Industries OEMs | 130,581 | 168,960 | 317,743 | 338,869 | 638,434 | ||||||||||||||||||||||||
| Total OEM Segment net sales | 367,812 | 553,368 | 900,169 | 1,085,148 | 1,906,922 | ||||||||||||||||||||||||
| Aftermarket Segment: | |||||||||||||||||||||||||||||
| Total Aftermarket Segment net sales | 157,953 | 75,700 | 285,266 | 136,092 | 428,755 | ||||||||||||||||||||||||
| Total net sales | $ | 525,765 | $ | 629,068 | $ | 1,185,435 | $ | 1,221,240 | $ | 2,335,677 | |||||||||||||||||||
| Operating profit: | |||||||||||||||||||||||||||||
| OEM Segment | $ | 1,763 | $ | 52,679 | $ | 44,952 | $ | 93,087 | $ | 117,155 | |||||||||||||||||||
Aftermarket Segment (1) | 19,019 | 12,978 | 20,096 | 20,325 | 34,691 | ||||||||||||||||||||||||
| Total operating profit | $ | 20,782 | $ | 65,657 | $ | 65,048 | $ | 113,412 | $ | 151,846 | |||||||||||||||||||
| Depreciation and amortization: | |||||||||||||||||||||||||||||
| OEM Segment depreciation | $ | 11,489 | $ | 11,581 | $ | 23,549 | $ | 23,050 | $ | 46,519 | |||||||||||||||||||
| Aftermarket Segment depreciation | 3,442 | 1,382 | 6,582 | 2,491 | 9,671 | ||||||||||||||||||||||||
| Total depreciation | $ | 14,931 | $ | 12,963 | $ | 30,131 | $ | 25,541 | $ | 56,190 | |||||||||||||||||||
| OEM Segment amortization | $ | 6,320 | $ | 5,067 | $ | 12,743 | $ | 10,307 | $ | 23,223 | |||||||||||||||||||
| Aftermarket Segment amortization | 2,934 | 636 | 5,925 | 1,267 | 7,629 | ||||||||||||||||||||||||
| Total amortization | $ | 9,254 | $ | 5,703 | $ | 18,668 | $ | 11,574 | $ | 30,852 | |||||||||||||||||||
(1) June 30, 2020 results include a non-cash charge for inventory fair value step-up of $0.7 million for the second quarter of 2020 and $6.9 million for the first six months of 2020 related to CURT purchase accounting.
LCI INDUSTRIES
BALANCE SHEET INFORMATION
(unaudited)
| June 30, | December 31, | ||||||||||
| 2020 | 2019 | ||||||||||
| (In thousands) | |||||||||||
| ASSETS | |||||||||||
| Current assets | |||||||||||
| Cash and cash equivalents | $ | 62,272 | $ | 35,359 | |||||||
Accounts receivable, net of allowances of $5,503 and $3,144 at June 30, 2020 and December 31, 2019, respectively | 269,562 | 199,976 | |||||||||
| Inventories, net | 328,986 | 393,607 | |||||||||
| Prepaid expenses and other current assets | 36,471 | 41,849 | |||||||||
| Total current assets | 697,291 | 670,791 | |||||||||
| Fixed assets, net | 364,957 | 366,309 | |||||||||
| Goodwill | 418,839 | 351,114 | |||||||||
| Other intangible assets, net | 370,715 | 341,426 | |||||||||
| Operating lease right-of-use assets | 98,947 | 98,774 | |||||||||
| Other assets | 67,525 | 34,181 | |||||||||
| Total assets | $ | 2,018,274 | $ | 1,862,595 | |||||||
| LIABILITIES AND STOCKHOLDERS’ EQUITY | |||||||||||
| Current liabilities | |||||||||||
| Current maturities of long-term indebtedness | $ | 20,882 | $ | 17,883 | |||||||
| Accounts payable, trade | 124,399 | 99,262 | |||||||||
| Current portion of operating lease obligations | 23,651 | 21,693 | |||||||||
| Accrued expenses and other current liabilities | 140,939 | 132,420 | |||||||||
| Total current liabilities | 309,871 | 271,258 | |||||||||
| Long-term indebtedness | 681,242 | 612,906 | |||||||||
| Operating lease obligations | 78,932 | 79,848 | |||||||||
| Deferred taxes | 42,792 | 35,740 | |||||||||
| Other long-term liabilities | 88,807 | 62,171 | |||||||||
| Total liabilities | 1,201,644 | 1,061,923 | |||||||||
| Total stockholders’ equity | 816,630 | 800,672 | |||||||||
| Total liabilities and stockholders’ equity | $ | 2,018,274 | $ | 1,862,595 | |||||||
LCI INDUSTRIES
SUMMARY OF CASH FLOWS
(unaudited)
| Six Months Ended June 30, | |||||||||||
| 2020 | 2019 | ||||||||||
| (In thousands) | |||||||||||
| Cash flows from operating activities: | |||||||||||
| Net income | $ | 41,400 | $ | 81,893 | |||||||
| Adjustments to reconcile net income to cash flows provided by operating activities: | |||||||||||
| Depreciation and amortization | 48,799 | 37,115 | |||||||||
| Stock-based compensation expense | 7,404 | 7,848 | |||||||||
| Other non-cash items | 546 | 705 | |||||||||
| Changes in assets and liabilities, net of acquisitions of businesses: | |||||||||||
| Accounts receivable, net | (62,611) | (22,345) | |||||||||
| Inventories, net | 63,404 | 39,944 | |||||||||
| Prepaid expenses and other assets | (27,679) | 11,444 | |||||||||
| Accounts payable, trade | 20,917 | 11,567 | |||||||||
| Accrued expenses and other liabilities | 9,921 | 11,944 | |||||||||
| Net cash flows provided by operating activities | 102,101 | 180,115 | |||||||||
| Cash flows from investing activities: | |||||||||||
| Capital expenditures | (14,549) | (35,786) | |||||||||
| Acquisitions of businesses, net of cash acquired | (94,713) | (8,530) | |||||||||
| Other investing activities | 4,096 | 251 | |||||||||
| Net cash flows used in investing activities | (105,166) | (44,065) | |||||||||
| Cash flows from financing activities: | |||||||||||
| Vesting of stock-based awards, net of shares tendered for payment of taxes | (4,616) | (7,144) | |||||||||
| Proceeds from revolving credit facility borrowings | 276,542 | 305,288 | |||||||||
| Repayments under revolving credit facility borrowings | (197,330) | (354,981) | |||||||||
| Repayments under term loan and other borrowings | (9,554) | — | |||||||||
| Payment of dividends | (32,670) | (31,266) | |||||||||
| Other financing activities | (279) | (397) | |||||||||
| Net cash flows provided by (used in) financing activities | 32,093 | (88,500) | |||||||||
| Effect of exchange rate changes on cash and cash equivalents | (2,115) | (1,818) | |||||||||
| Net increase in cash and cash equivalents | 26,913 | 45,732 | |||||||||
| Cash and cash equivalents at beginning of period | 35,359 | 14,928 | |||||||||
| Cash and cash equivalents at end of period | $ | 62,272 | $ | 60,660 | |||||||
LCI INDUSTRIES
SUPPLEMENTARY INFORMATION
(unaudited)
| Three Months Ended | Six Months Ended | |||||||||||||||||||||||||||||||
| June 30, | June 30, | Last Twelve | ||||||||||||||||||||||||||||||
| 2020 | 2019 | 2020 | 2019 | Months | ||||||||||||||||||||||||||||
Industry Data(1) (in thousands of units): | ||||||||||||||||||||||||||||||||
| Industry Wholesale Production: | ||||||||||||||||||||||||||||||||
| Travel trailer and fifth-wheel RVs | 66.8 | 101.0 | 154.8 | 185.8 | 318.5 | |||||||||||||||||||||||||||
| Motorhome RVs | 6.9 | 12.7 | 17.0 | 25.5 | 38.2 | |||||||||||||||||||||||||||
| Industry Retail Sales: | ||||||||||||||||||||||||||||||||
| Travel trailer and fifth-wheel RVs | 111.6 | (2) | 138.8 | 184.6 | (2) | 216.2 | 366.1 | (2) | ||||||||||||||||||||||||
| Impact on dealer inventories | (44.8) | (2) | (37.8) | (29.8) | (2) | (30.4) | (47.6) | (2) | ||||||||||||||||||||||||
| Motorhome RVs | 9.4 | (2) | 15.6 | 18.2 | (2) | 25.2 | 38.8 | (2) | ||||||||||||||||||||||||
| Twelve Months Ended | ||||||||||||||||||||||||||||||||
| June 30, | ||||||||||||||||||||||||||||||||
| 2020 | 2019 | |||||||||||||||||||||||||||||||
LCI Content Per Industry Unit Produced: (3) | ||||||||||||||||||||||||||||||||
| Travel trailer and fifth-wheel RV | $ | 3,371 | $ | 3,230 | ||||||||||||||||||||||||||||
| Motorhome RV | $ | 2,308 | $ | 2,396 | ||||||||||||||||||||||||||||
| June 30, | December 31, | |||||||||||||||||||||||||||||||
| 2020 | 2019 | 2019 | ||||||||||||||||||||||||||||||
Balance Sheet Data (debt availability in millions): | ||||||||||||||||||||||||||||||||
Remaining availability under the debt facilities (4) | $ | 401.2 | $ | 557.1 | $ | 481.8 | ||||||||||||||||||||||||||
| Days sales in accounts receivable, based on last twelve months | 29.5 | 24.6 | 25.7 | |||||||||||||||||||||||||||||
| Inventory turns, based on last twelve months | 5.3 | 5.7 | 5.7 | |||||||||||||||||||||||||||||
| 2020 | ||||||||||||||||||||||||||||||||
| Estimated Full Year Data: | ||||||||||||||||||||||||||||||||
| Capital expenditures | $ 40 - $ 50 million | |||||||||||||||||||||||||||||||
| Depreciation and amortization | $ 95 - $ 105 million | |||||||||||||||||||||||||||||||
| Stock-based compensation expense | $ 13 - $ 18 million | |||||||||||||||||||||||||||||||
Annual tax rate | 25% - 27% | |||||||||||||||||||||||||||||||
(1) Industry wholesale production data for travel trailer and fifth-wheel RVs and motorhome RVs provided by the Recreation Vehicle Industry Association. Industry retail sales data provided by Statistical Surveys, Inc.
(2) June 2020 retail sales data for RVs has not been published yet, therefore 2020 retail data for RVs includes an estimate for June 2020 retail units. Retail sales data will likely be revised upwards in future months as various states report.
(3) The content figures presented were adjusted to remove Furrion sales from prior periods, as the Furrion distribution and supply agreement was terminated effective December 31, 2019.
(4) Remaining availability under the debt facilities is subject to covenant restrictions and, in the case of $150 million of such availability, the lender's discretion.
LCI INDUSTRIES
SUPPLEMENTARY INFORMATION
RECONCILIATION OF NON-GAAP MEASURES
(unaudited)
The following table reconciles net income to adjusted net income and diluted net income per common share to adjusted diluted net income per common share.
| Three Months Ended June 30, | Six Months Ended June 30, | ||||||||||||||||||||||
| 2020 | 2019 | 2020 | 2019 | ||||||||||||||||||||
| (In thousands, except per share amounts) | |||||||||||||||||||||||
| Net income | $ | 13,186 | $ | 47,527 | $ | 41,400 | $ | 81,893 | |||||||||||||||
| Non-cash charge for inventory fair value step-up | 654 | — | 6,898 | — | |||||||||||||||||||
| Income tax impact of inventory fair value step-up | (159) | — | (1,677) | — | |||||||||||||||||||
| Adjusted net income | $ | 13,681 | $ | 47,527 | $ | 46,621 | $ | 81,893 | |||||||||||||||
| Diluted net income per common share | $ | 0.52 | $ | 1.89 | $ | 1.64 | $ | 3.28 | |||||||||||||||
| Non-cash charge for inventory fair value step-up | 0.03 | — | 0.27 | — | |||||||||||||||||||
| Income tax impact of inventory fair value step-up | (0.01) | — | (0.07) | — | |||||||||||||||||||
| Adjusted diluted net income per common share | $ | 0.54 | $ | 1.89 | $ | 1.84 | $ | 3.28 | |||||||||||||||
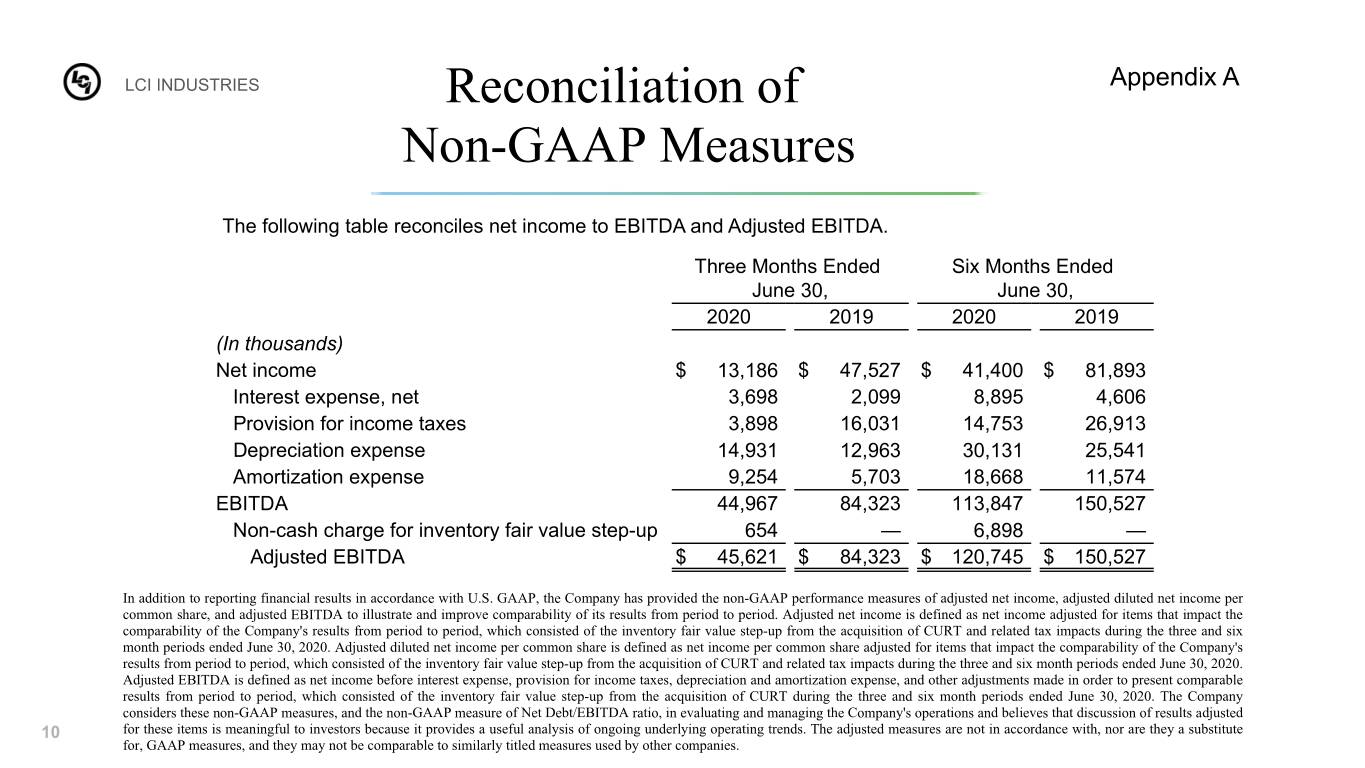
The following table reconciles net income to EBITDA and Adjusted EBITDA.
| Three Months Ended June 30, | Six Months Ended June 30, | ||||||||||||||||||||||
| 2020 | 2019 | 2020 | 2019 | ||||||||||||||||||||
| (In thousands) | |||||||||||||||||||||||
| Net income | $ | 13,186 | $ | 47,527 | $ | 41,400 | $ | 81,893 | |||||||||||||||
| Interest expense, net | 3,698 | 2,099 | 8,895 | 4,606 | |||||||||||||||||||
| Provision for income taxes | 3,898 | 16,031 | 14,753 | 26,913 | |||||||||||||||||||
| Depreciation expense | 14,931 | 12,963 | 30,131 | 25,541 | |||||||||||||||||||
| Amortization expense | 9,254 | 5,703 | 18,668 | 11,574 | |||||||||||||||||||
| EBITDA | 44,967 | 84,323 | 113,847 | 150,527 | |||||||||||||||||||
| Non-cash charge for inventory fair value step-up | 654 | — | 6,898 | — | |||||||||||||||||||
| Adjusted EBITDA | $ | 45,621 | $ | 84,323 | $ | 120,745 | $ | 150,527 | |||||||||||||||
In addition to reporting financial results in accordance with U.S. GAAP, the Company has provided the non-GAAP performance measures of adjusted net income, adjusted diluted net income per common share, and adjusted EBITDA to illustrate and improve comparability of its results from period to period. Adjusted net income is defined as net income adjusted for items that impact the comparability of the Company's results from period to period, which consisted of the inventory fair value step-up from the acquisition of CURT and related tax impacts during the three and six month periods ended June 30, 2020. Adjusted diluted net income per common share is defined as net income per common share adjusted for items that impact the comparability of the Company's results from period to period, which consisted of the inventory fair value step-up from the acquisition of CURT and related tax impacts during the three and six month periods ended June 30, 2020. Adjusted EBITDA is defined as net income before interest expense, provision for income taxes, depreciation and amortization expense, and other adjustments made in order to present comparable results from period to period, which consisted of the inventory fair value step-up from the acquisition of CURT during the three and six month periods ended June 30, 2020. The Company considers these non-GAAP measures in evaluating and managing the Company's operations and believes that discussion of results adjusted for these items is meaningful to investors because it provides a useful analysis of ongoing underlying operating trends. The adjusted measures are not in accordance with, nor are they a substitute for, GAAP measures, and they may not be comparable to similarly titled measures used by other companies.