loanDepot announces year-end and fourth quarter 2021 financial results
Successfully concludes its first year as a public company with a nationally-recognized and growing brand, increased diversification, and continued growth in market share during a year of changing market conditions
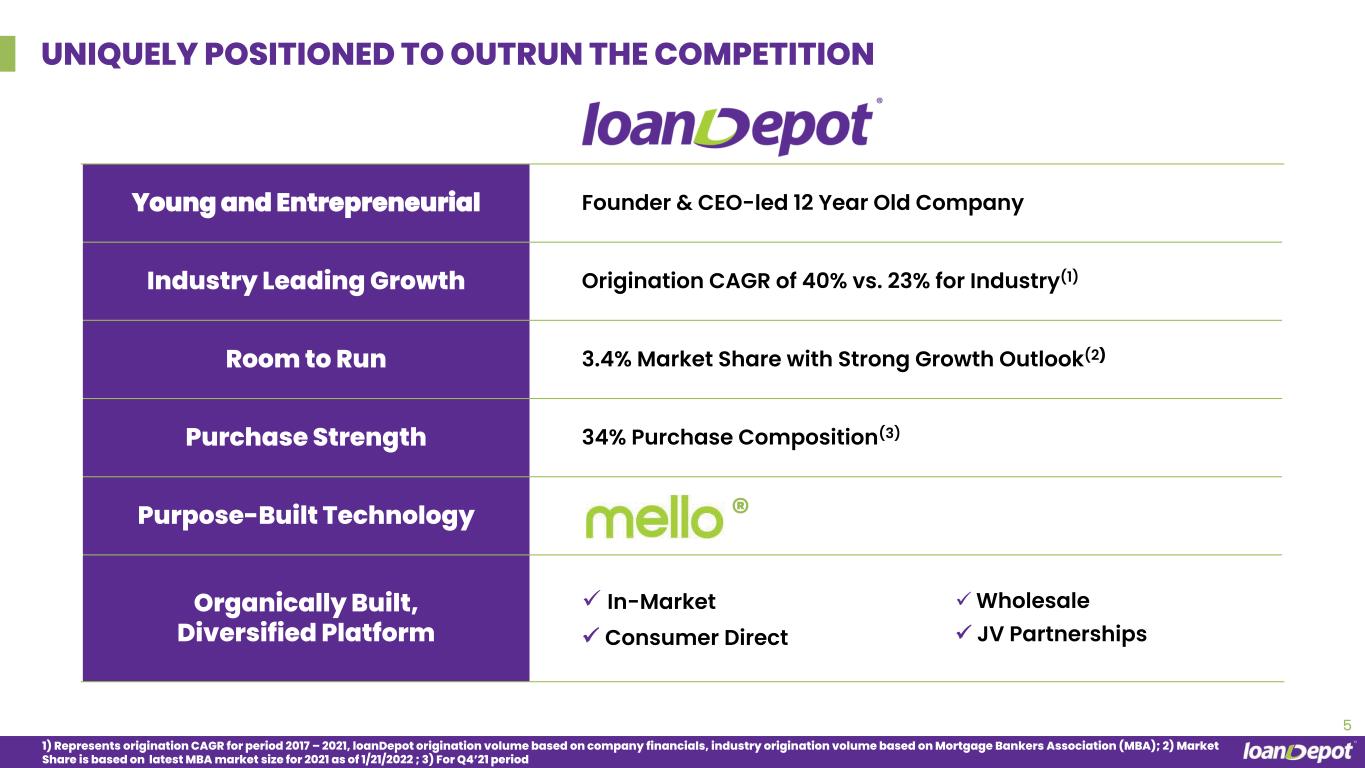
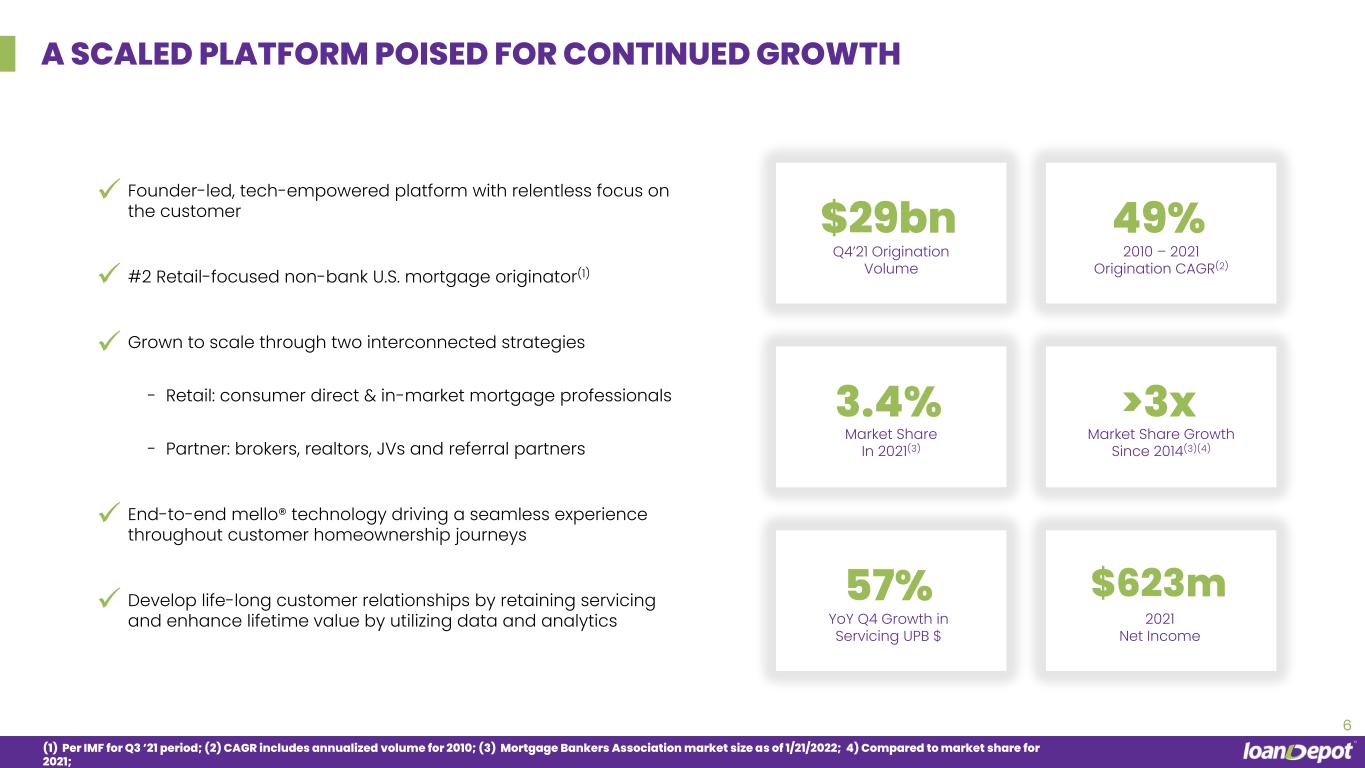
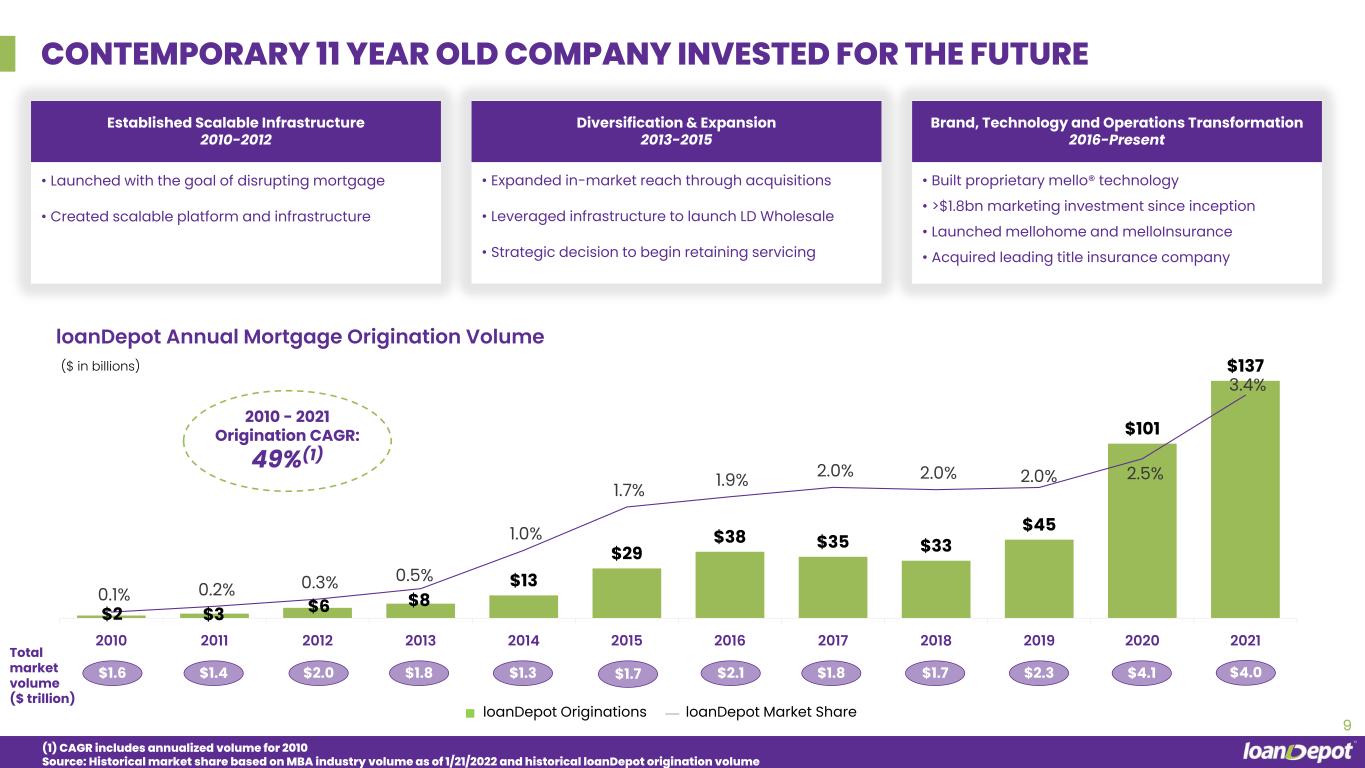
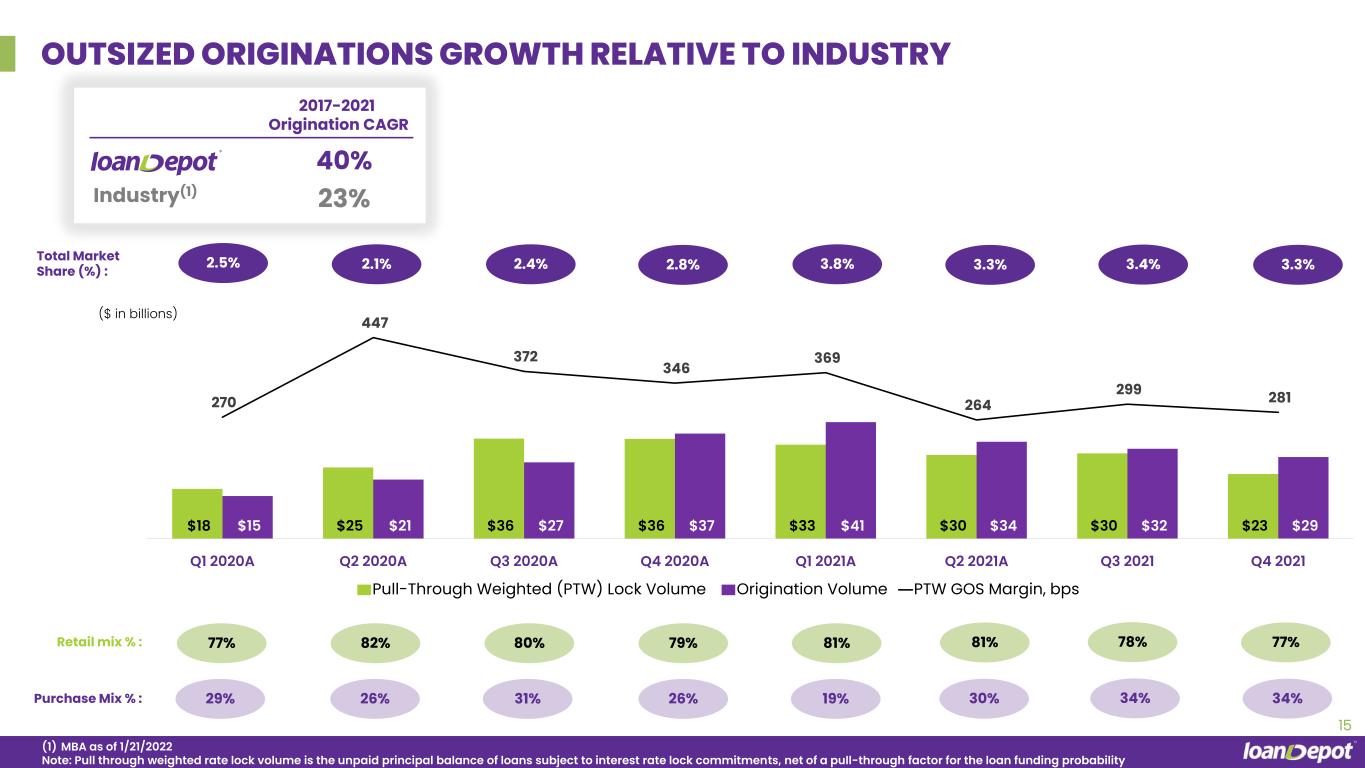
•Achieved market share growth of 3.4% for the full year 2021, up from 2.5% in 20201.
•Grew number of in-market retail loan officers by 18% and added four new joint venture partnerships during 2021, contributing to a corresponding 39% increase in purchase volume.
•Increased awareness for our nationally recognized brand by 80% through national advertising campaigns and successful partnerships with Major League Baseball and the Miami Marlins.
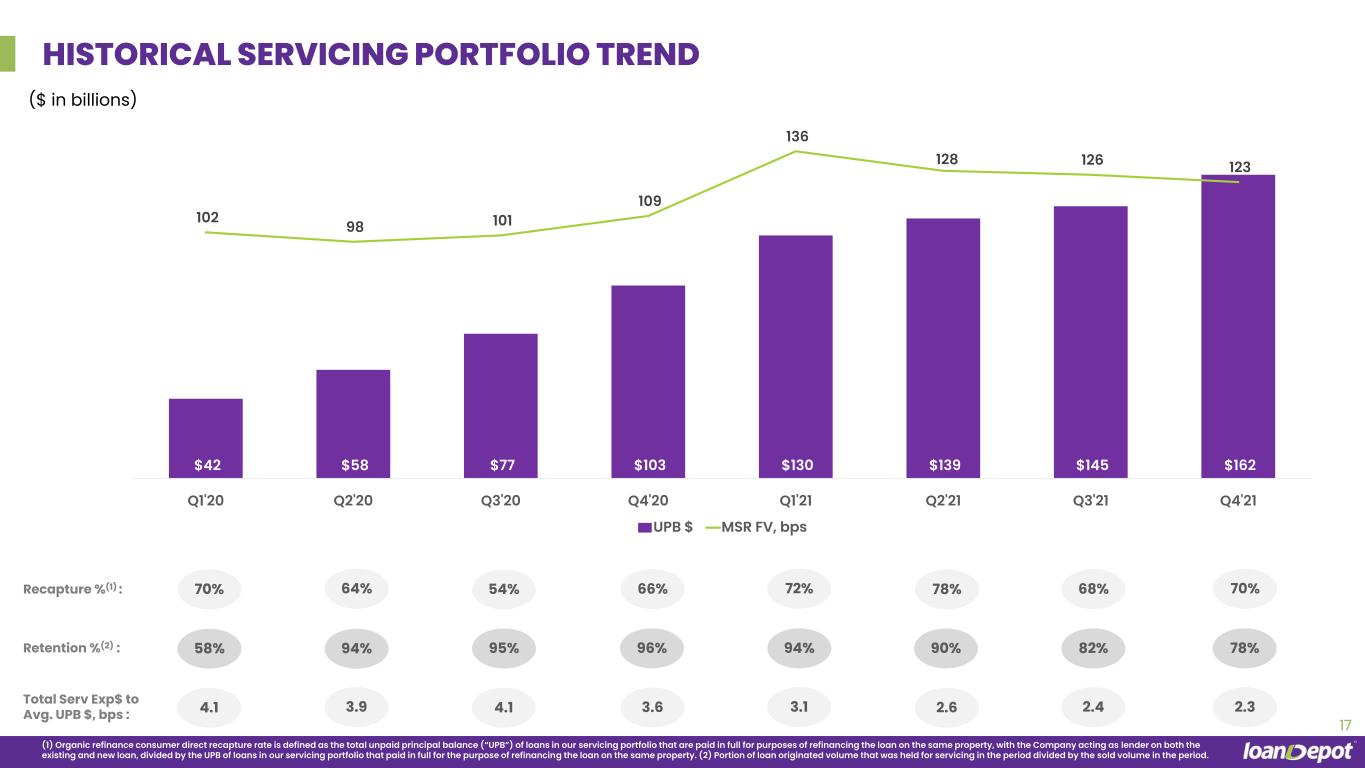
•Ended the year with a servicing portfolio of $162.1 billion in unpaid principal balance; continued to invest in building our in-house servicing platform, allowing us to maintain world-class service standards with our customers over the life of their loan and diversify our revenues.
•Returned capital to our shareholders with annual dividends totaling $0.85 per share2.
•Reported quarterly total revenue of $705.0 million, diluted earnings per share of $0.05 and adjusted diluted earnings per share of $0.09, reflecting lower rate lock volume and lower gain on sale margins, partially offset by lower expenses.
FOOTHILL RANCH, Calif., February 1, 2022 - loanDepot, Inc. (NYSE: LDI), (together with its subsidiaries, “loanDepot” or the “Company”), the innovative consumer lending and real estate services provider that is using its proprietary mello® technology to deliver best-in-class experiences to its customers, today announced results for year-end and the fourth quarter ended December 31, 2021.
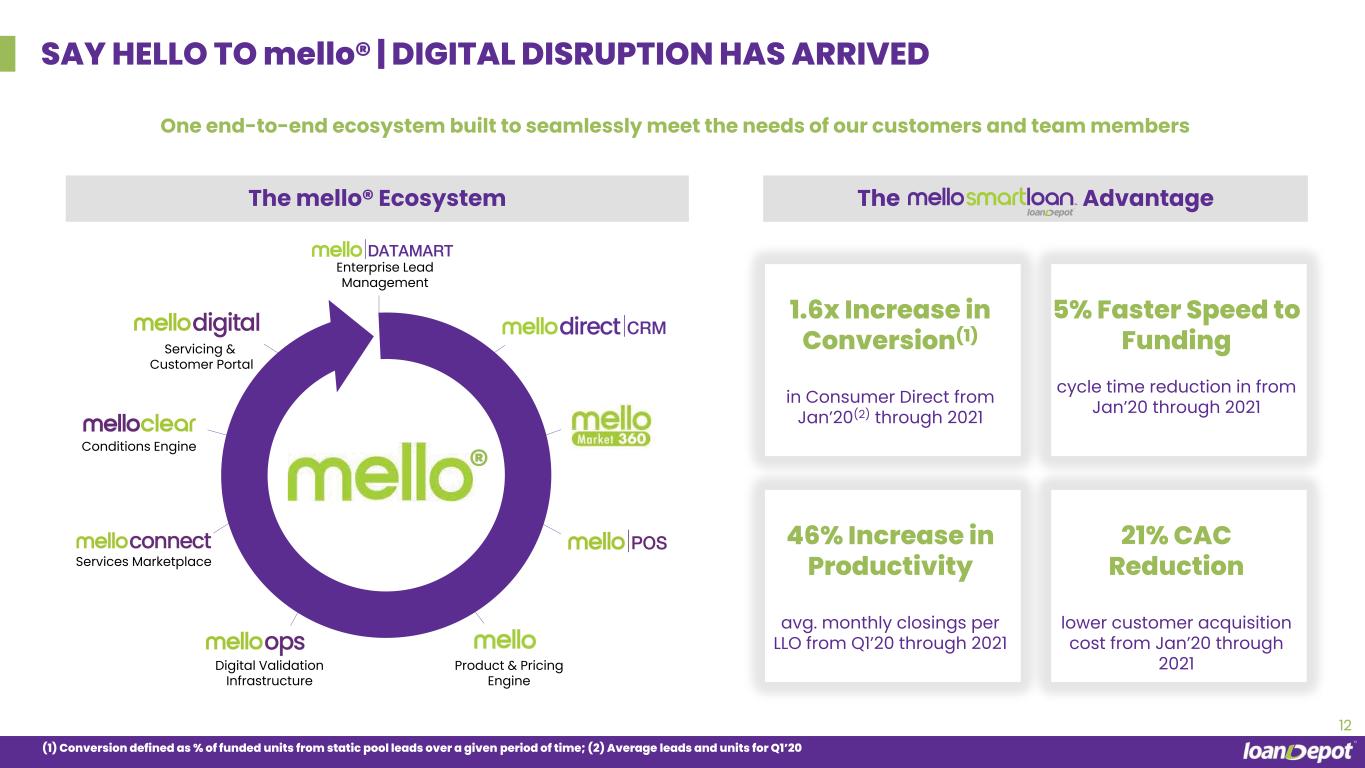
“2021 demonstrated the success of our strategy, successfully increasing market share during a period of changing market conditions,” said loanDepot Founder and CEO Anthony Hsieh. “Our industry is a cyclical one, and the market conditions we face today have been faced before by loanDepot’s experienced leadership team, the members of which have collectively navigated many housing and interest rate cycles over the last 35 years. Our business was purpose-built with periods of pressure in mind. Our proprietary tech stack, our intentionally diverse mix of channels and our sophisticated performance marketing machine mean we control our lead flow, our customer contact strategy and the point of loan origination. This is a critical competitive advantage, enabling us to pivot and adjust our production as market trends demand.
Conditions like those we enjoyed in 2020 are when loanDepot drives revenue, but the conditions we expect in 2022 present an incredible opportunity for us to capture market share. We are well positioned to demonstrate the long-term value of loanDepot by remaining focused on our strategic priorities while seizing market share from competitors that are less capable of withstanding these challenging conditions.”
“We are doing the necessary work to ensure our operations appropriately reflect these changing market dynamics. But we will continue to invest in technology to drive operational efficiencies, invest in our in-house servicing platform, and grow our in-market retail mortgage origination capabilities. We have all the necessary tools to seize market share even as total origination volume falls. We believe this will pay dividends when the market returns, as we will be poised to start the next cycle in a dominant competitive position.
1 Total market originations based on data as of January 21, 2022, from the Mortgage Bankers Association.
2 Total dividends include $0.612 per share special dividend announced on April 21. 2021.
1
Hsieh concluded, “The results of 2021 are only a preview of what’s to come as we leverage our brand, develop and apply innovative technology solutions, drive down costs and add more products and services to help our customers successfully navigate one of the most important financial transactions of their lives. We remain focused on our long-term strategy and vision to become the most trusted homeowner fulfillment company in the world. loanDepot represents an incredible value, and we are confident we will continue to increase our market share, serve our customers, employees, shareholders and communities while outperforming in the long term.”
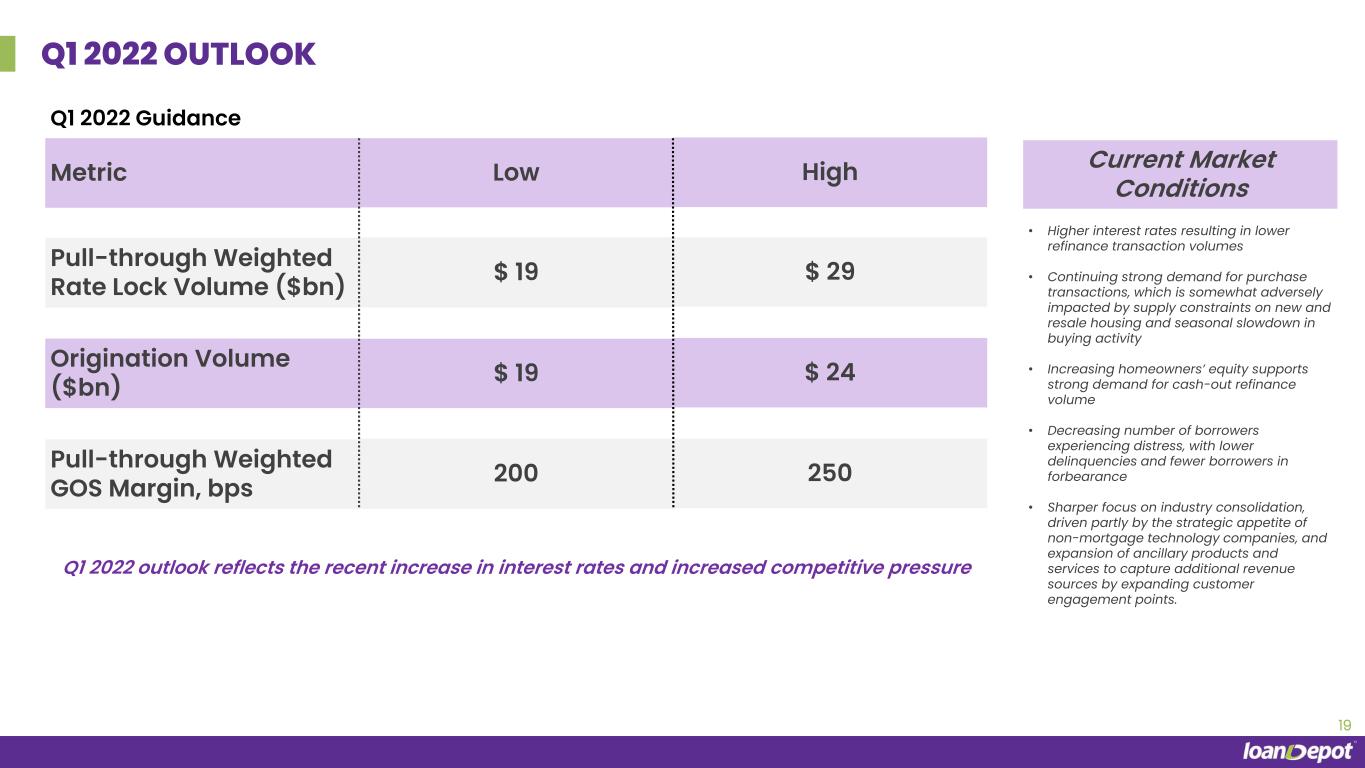
Current Market Conditions:
•Higher interest rates resulting in lower refinance transaction volumes.
•Continuing strong demand for purchase transactions, which is somewhat adversely impacted by supply constraints on new and resale housing and seasonal slowdown in buying activity.
•Increasing homeowner equity supports strong demand for cash-out refinance volume.
•Decreasing number of borrowers experiencing distress, with lower delinquencies and fewer borrowers in forbearance.
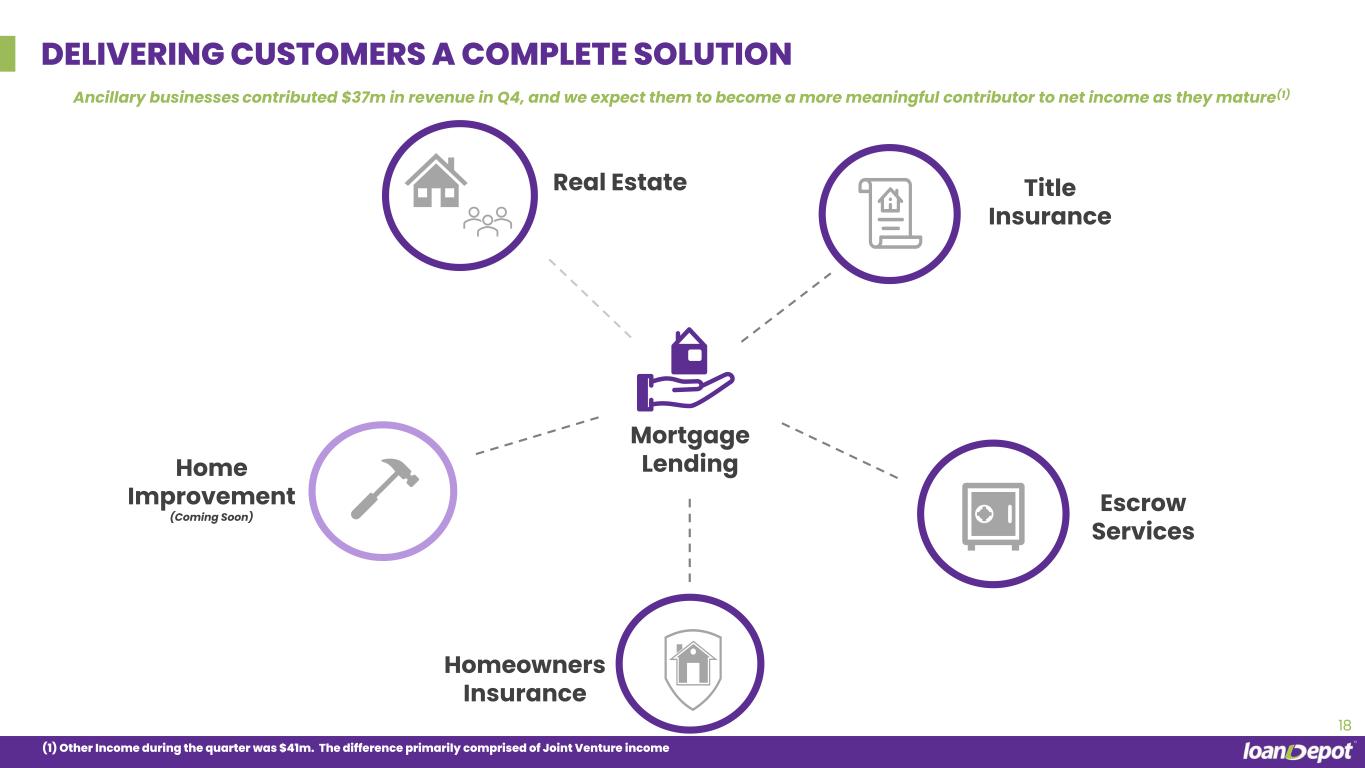
•Sharper focus on industry consolidation, driven partly by the strategic appetite of non-mortgage technology companies, and expansion of ancillary products and services to capture additional revenue sources by expanding customer engagement points.
Fourth Quarter Highlights:
Financial Summary
| Three Months Ended | Year Ended | ||||||||||||||||||||||||||||
| ($ in thousands) (Unaudited) | December 31, 2021 | September 30, 2021 | December 31, 2020 | December 31, 2021 | December 31, 2020 | ||||||||||||||||||||||||
| Rate lock volume | $ | 34,761,321 | $ | 43,673,515 | $ | 49,711,270 | $ | 166,263,478 | $ | 160,984,531 | |||||||||||||||||||
Pull through weighted lock volume(1) | 23,025,038 | 30,354,123 | 35,516,887 | 116,628,597 | 114,205,923 | ||||||||||||||||||||||||
| Loan origination volume | 29,041,625 | 31,985,805 | 37,395,352 | 137,000,747 | 100,760,151 | ||||||||||||||||||||||||
Gain on sale margin(2) | 2.23 | % | 2.84 | % | 3.29 | % | 2.61 | % | 4.13 | % | |||||||||||||||||||
Pull through weighted gain on sale margin(3) | 2.81 | % | 2.99 | % | 3.46 | % | 3.07 | % | 3.65 | % | |||||||||||||||||||
| Financial Results | |||||||||||||||||||||||||||||
| Total revenue | $ | 705,026 | $ | 923,756 | $ | 1,298,394 | $ | 3,724,704 | $ | 4,312,174 | |||||||||||||||||||
| Total expense | 694,133 | 744,771 | 750,433 | 3,058,187 | 2,296,816 | ||||||||||||||||||||||||
| Net income | 14,732 | 154,277 | 547,170 | 623,146 | 2,013,110 | ||||||||||||||||||||||||
Diluted EPS(4) | $ | 0.05 | $ | 0.40 | N/A | $ | 0.87 | N/A | |||||||||||||||||||||
Non-GAAP Financial Measures(5) | |||||||||||||||||||||||||||||
| Adjusted total revenue | $ | 723,642 | $ | 948,770 | $ | 1,252,767 | $ | 3,739,182 | $ | 4,253,276 | |||||||||||||||||||
| Adjusted net income | 28,907 | 147,533 | 375,755 | 555,576 | 1,486,137 | ||||||||||||||||||||||||
| Adjusted EBITDA | 63,747 | 238,261 | 530,424 | 869,368 | 2,084,905 | ||||||||||||||||||||||||
| Adjusted Diluted EPS | $ | 0.09 | $ | 0.46 | N/A | $ | 1.72 | N/A | |||||||||||||||||||||
(1)Pull through weighted rate lock volume is the unpaid principal balance of loans subject to interest rate lock commitments, net of a pull-through factor for the loan funding probability.
(2)Gain on sale margin represents the total of (i) gain on origination and sale of loans, net, and (ii) origination income, net, divided by loan origination volume during period.
(3)Pull through weighted gain on sale margin represents the total of (i) gain on origination and sale of loans, net, and (ii) origination income, net, divided by the pull through weighted rate lock volume.
2
(4)On February 11, 2021, the Company’s common stock began trading on the New York Stock Exchange. Since loanDepot did not have any shares outstanding prior to this date, earnings per share (“EPS”) information was not determinable. The diluted EPS calculation includes net income attributable to loanDepot, Inc. divided by the diluted weighted average shares of Class A and Class D common stock outstanding for the period after February 11, 2021.
(5)See “Non-GAAP Financial Measures” for a discussion of how we define and calculate Adjusted Total Revenue, Adjusted Net Income, Adjusted EBITDA, and Adjusted Diluted EPS and for a reconciliation of these metrics to their closest GAAP measure.
Fourth Quarter Operational Results
•Pull through weighted lock volume of $23.0 billion for the three months ended December 31, 2021 resulted in quarterly total revenue of $705.0 million, which represents a decrease of $218.7 million, or 24%, from the third quarter of 2021.
•Loan origination volume for the fourth quarter of 2021 was $29.0 billion, a decrease of $2.9 billion or 9% from the third quarter of 2021.
•Our Retail and Partner strategies delivered $10.0 billion of purchase loan originations and $19.0 billion of refinance loan originations during the fourth quarter of 2021.
•Net income for the fourth quarter of 2021 decreased to $14.7 million as compared to $154.3 million in the prior quarter. The quarter over quarter decrease was primarily driven by the decrease in rate lock volume and gain on sale margin, partially offset by a decrease in total expense.
•Primarily as a result of lower net income, adjusted EBITDA for the fourth quarter of 2021 decreased to $63.7 million as compared to $238.3 million for the third quarter of 2021. Adjusted EBITDA excludes the impact of fair value changes of our mortgage servicing rights, net of hedging results, and other non-core operating expenses.
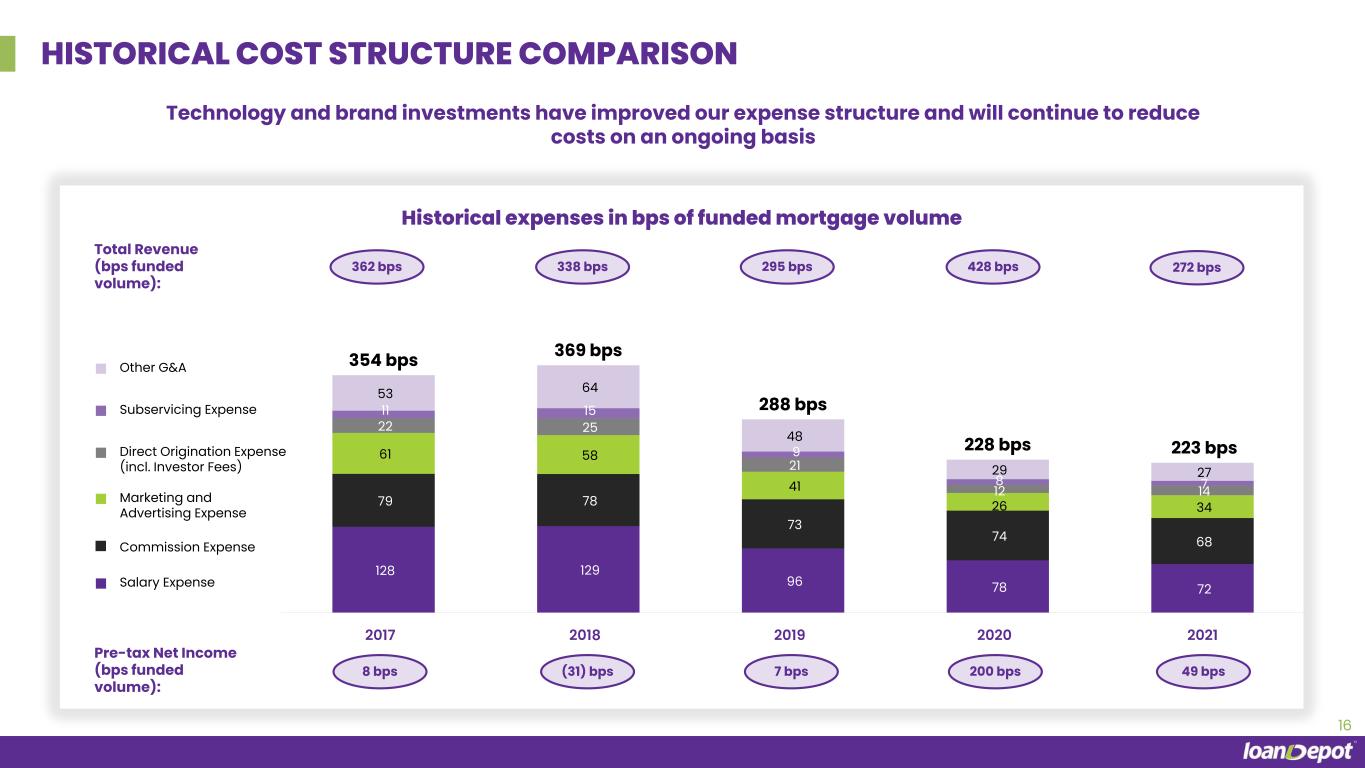
•Total expenses for the fourth quarter of 2021 decreased by $50.6 million, or 7% from the third quarter of 2021, due to lower personnel expenses, primarily lower commissions, and lower marketing expenses reflecting seasonal declines in spending.
Other Highlights
•Bolstered governance during 2021 by adding Mike Linton and Pamela Hughes Patenaude to our board of directors.
•Returned value to shareholders through a regular cash dividend of $0.08 per share paid on January 18, 2022, to shareholders of record on January 3, 2022.
•For the year ended December 31, 2021, our preliminary organic refinance consumer direct recapture rate3 increased to 72% as compared to the final recapture rate of 64% for the year ended December 31, 2020. This highlights the efficacy of our marketing efforts and the strength of our customer relationships, which includes our growing servicing portfolio that reached a record level of $162.1 billion in unpaid principal balance serviced as of December 31, 2021. This increase was against the backdrop of growing our servicing portfolio in-house and relying less on third party sub-servicing arrangements. We also recently announced that we are bringing the servicing of FHA, VA and USDA funded Ginnie Mae loans in-house.
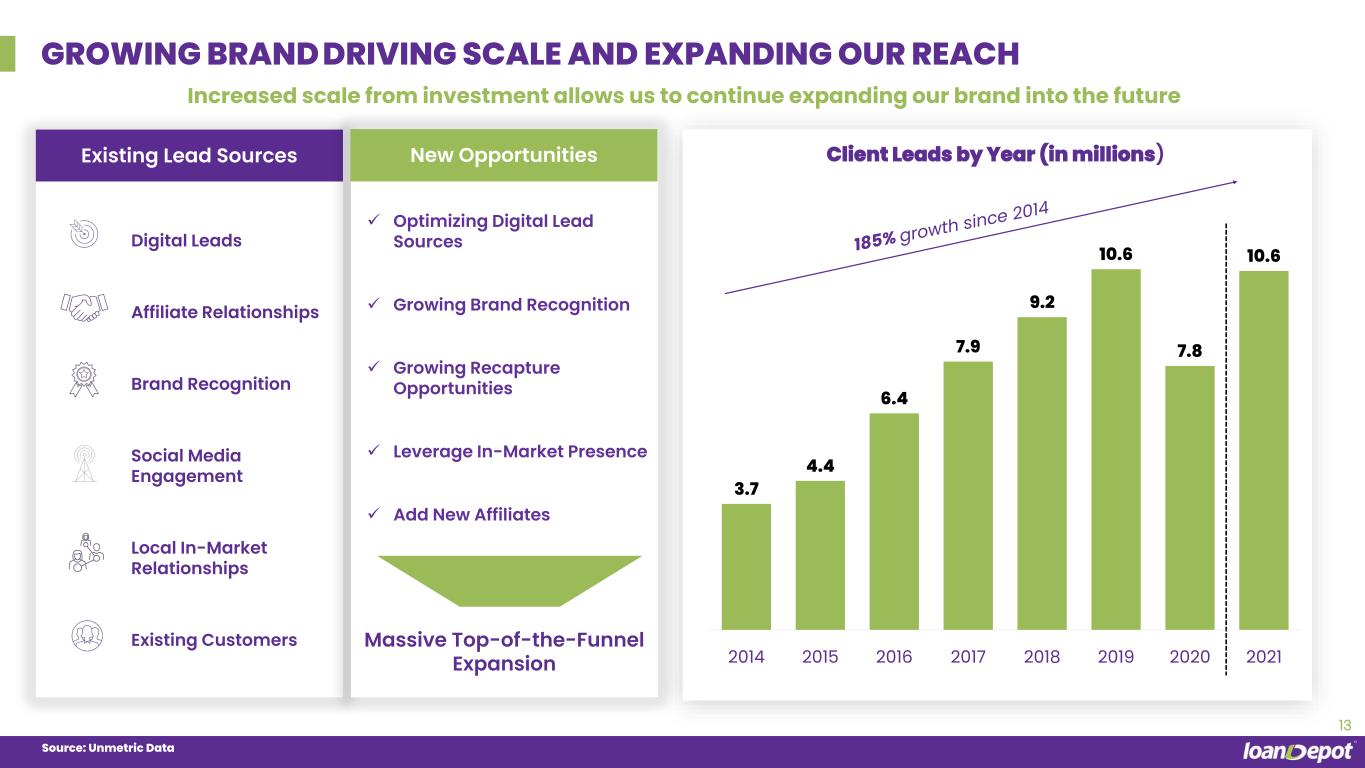
•We believe our position as the second largest independent retail mortgage brand4 grew even stronger in 2021, delivering approximately 14.4 billion linear TV household impressions and 876 million digital impressions during 2021. Our marketing reach resulted in an increase in website traffic of 51% over the previous year.
•Millions of consumers interacted with the loanDepot brand as the presenting sponsor of two of the nation’s preeminent sporting events - Major League Baseball’s American League Championship Series and National League Championship Series, both of which averaged approximately five million viewers per
3 We define organic refinance consumer direct recapture rate as the total unpaid principal balance (“UPB”) of loans in our servicing portfolio that are paid in full for purposes of refinancing the loan on the same property, with the Company acting as lender on both the existing and new loan, divided by the UPB of all loans in our servicing portfolio that paid in full for the purpose of refinancing the loan on the same property. The recapture rate is finalized following the publication date of this release when external data becomes available.
4 Based on data through September 30, 2021, published by Inside Mortgage Finance.
3
game over each six-game series. loanDepot was featured during 54 commercials played during both series and delivered more than 198 million impressions across MLB and club digital channels resulting in a 50% increase in brand awareness from viewers.
•Continued to deliver momentum in building our joint venture channel, which is an attractive source of purchase mortgage volume. We signed a national homebuilder JV partner in December, making it the fourth deal of the year, and bringing the total to ten JV partnerships.
Strategic Channel Overview
Our diverse origination strategy ensures we can serve customers in the way they want to be served, with the right mortgage professional, with the right product, at the right price, and at the right time. Complementing our origination strategy is our servicing portfolio, which ensures we can serve the customer through their entire mortgage journey.
Retail Channel
| Three Months Ended | Year Ended | |||||||||||||||||||||||||||||||
| ($ in thousands) (Unaudited) | December 31, 2021 | September 30, 2021 | December 31, 2020 | December 31, 2021 | December 31, 2020 | |||||||||||||||||||||||||||
| Volume data: | ||||||||||||||||||||||||||||||||
| Rate locks | $ | 27,751,625 | $ | 35,924,760 | $ | 40,066,201 | $ | 134,676,230 | $ | 132,448,124 | ||||||||||||||||||||||
| Loan originations | 22,461,394 | 24,938,035 | 29,665,251 | 108,708,990 | 80,256,667 | |||||||||||||||||||||||||||
| Gain on sale margin | 2.61 | % | 3.28 | % | 3.47 | % | 2.93 | % | 4.41 | % | ||||||||||||||||||||||
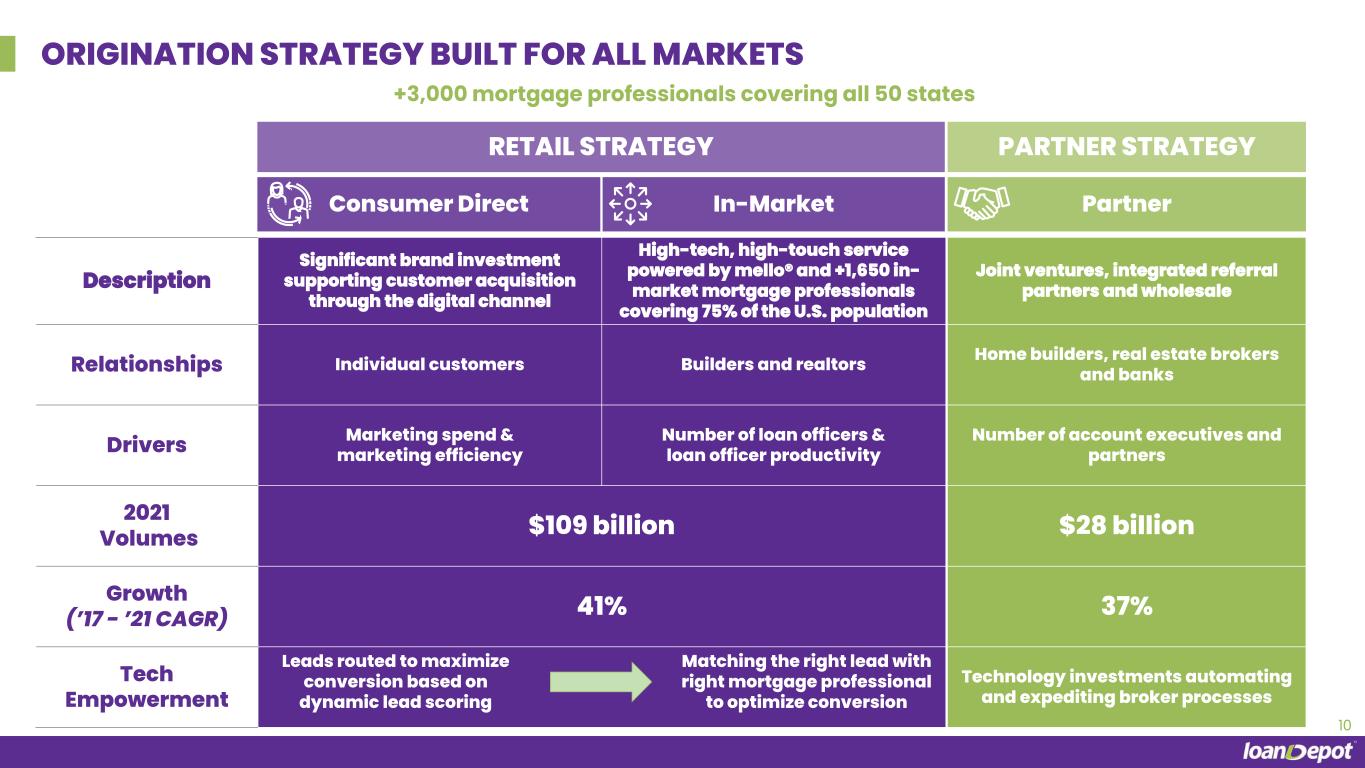
The Company employs more than 3,000 licensed mortgage loan professionals who work in our Retail Channel that reach customers through our organic marketing or their own relationships in either our proprietary call centers or local in-market branches. During the fourth quarter of 2021, our Retail Channel accounted for $22.5 billion, or 77%, of our loan originations.
Partner Channel
| Three Months Ended | Year Ended | |||||||||||||||||||||||||||||||
| ($ in thousands) (Unaudited) | December 31, 2021 | September 30, 2021 | December 31, 2020 | December 31, 2021 | December 31, 2020 | |||||||||||||||||||||||||||
| Volume data: | ||||||||||||||||||||||||||||||||
| Rate locks | $ | 7,009,696 | $ | 7,748,755 | $ | 9,645,069 | $ | 31,587,248 | $ | 28,536,407 | ||||||||||||||||||||||
| Loan originations | 6,580,231 | 7,047,770 | 7,730,101 | 28,291,757 | 20,503,484 | |||||||||||||||||||||||||||
| Gain on sale margin | 1.01 | % | 1.24 | % | 2.58 | % | 1.38 | % | 3.06 | % | ||||||||||||||||||||||
Our Partner Channel originates loans through our network of approved mortgage brokers, as well as a series of exclusive joint ventures with some of the nation’s largest homebuilders and depositories, who market our broad spectrum of products utilizing our innovative mello® technology platform to efficiently underwrite, process and fund mortgage loans, while delivering an exceptional customer experience. During the fourth quarter of 2021, our Partner Channel accounted for $6.6 billion, or 23%, of our loan originations. Margins in this channel have been adversely impacted by increased competitive pressures from some of the larger wholesale focused lenders.
The returns were complemented by $3.8 million of income recorded from our joint ventures for the fourth quarter of 2021, reflecting the wide variety of industry partners we work with in the channel.
4
Servicing
| Three Months Ended | Year Ended | |||||||||||||||||||||||||||||||
Servicing Revenue Data: ($ in thousands) (Unaudited) | December 31, 2021 | September 30, 2021 | December 31, 2020 | December 31, 2021 | December 31, 2020 | |||||||||||||||||||||||||||
| Changes in fair value: | ||||||||||||||||||||||||||||||||
| Due to changes in valuation inputs or assumptions | $ | (29,896) | $ | (3,461) | $ | 16,294 | $ | 68,399 | $ | (95,764) | ||||||||||||||||||||||
Other changes in fair value(1) | (98,516) | (99,230) | (80,007) | (421,624) | (200,546) | |||||||||||||||||||||||||||
| Realized gains (losses) on sales of servicing rights | (1,536) | (14,218) | (151) | (9,759) | (2,701) | |||||||||||||||||||||||||||
| Net gain (loss) from derivatives hedging servicing rights | 11,280 | (21,553) | 29,332 | (82,878) | 154,663 | |||||||||||||||||||||||||||
| Changes in fair value of servicing rights, net | $ | (118,668) | $ | (138,462) | $ | (34,532) | $ | (445,862) | $ | (144,348) | ||||||||||||||||||||||
| Servicing fee income | $ | 113,942 | $ | 102,429 | $ | 64,375 | $ | 393,680 | $ | 185,895 | ||||||||||||||||||||||
(1)Other changes in fair value include fallout and decay from loan payoffs and principal amortization.
| Three Months Ended | Year Ended | |||||||||||||||||||||||||||||||
Servicing Rights, at Fair Value: ($ in thousands) (Unaudited) | December 31, 2021 | September 30, 2021 | December 31, 2020 | December 31, 2021 | December 31, 2020 | |||||||||||||||||||||||||||
| Balance at beginning of period | $ | 1,836,694 | $ | 1,776,395 | $ | 776,993 | $ | 1,124,302 | $ | 444,443 | ||||||||||||||||||||||
| Additions | 307,712 | 345,882 | 411,282 | 1,610,596 | 986,050 | |||||||||||||||||||||||||||
| Sales proceeds, net | (16,592) | (182,892) | (260) | (382,271) | (9,881) | |||||||||||||||||||||||||||
| Changes in fair value: | ||||||||||||||||||||||||||||||||
| Due to changes in valuation inputs or assumptions | (29,896) | (3,461) | 16,294 | 68,399 | (95,764) | |||||||||||||||||||||||||||
| Other changes in fair value | (98,516) | (99,230) | (80,007) | (421,624) | (200,546) | |||||||||||||||||||||||||||
Balance at end of period (1) | $ | 1,999,402 | $ | 1,836,694 | $ | 1,124,302 | $ | 1,999,402 | $ | 1,124,302 | ||||||||||||||||||||||
(1)Balances are net of $7.3 million, $4.8 million, and $3.6 million of servicing rights liability as of December 31, 2021, September 30, 2021, and December 31, 2020, respectively.
5
| % Change | ||||||||||||||||||||||||||||||||
Servicing Portfolio Data: ($ in thousands) (Unaudited) | December 31, 2021 | September 30, 2021 | December 31, 2020 | Dec-21 vs Sep-21 | Dec-21 vs Dec-20 | |||||||||||||||||||||||||||
| Servicing portfolio (unpaid principal balance) | $ | 162,112,965 | $ | 145,305,182 | $ | 102,931,258 | 11.6 | % | 57.5 | % | ||||||||||||||||||||||
| Total servicing portfolio (units) | 524,992 | 469,019 | 342,600 | 11.9 | 53.2 | |||||||||||||||||||||||||||
| 60+ days delinquent ($) | $ | 1,510,261 | $ | 1,679,691 | $ | 2,162,585 | (10.1) | (30.2) | ||||||||||||||||||||||||
| 60+ days delinquent (%) | 0.9 | % | 1.2 | % | 2.1 | % | ||||||||||||||||||||||||||
| Servicing rights, net to UPB | 1.2 | % | 1.3 | % | 1.1 | % | ||||||||||||||||||||||||||
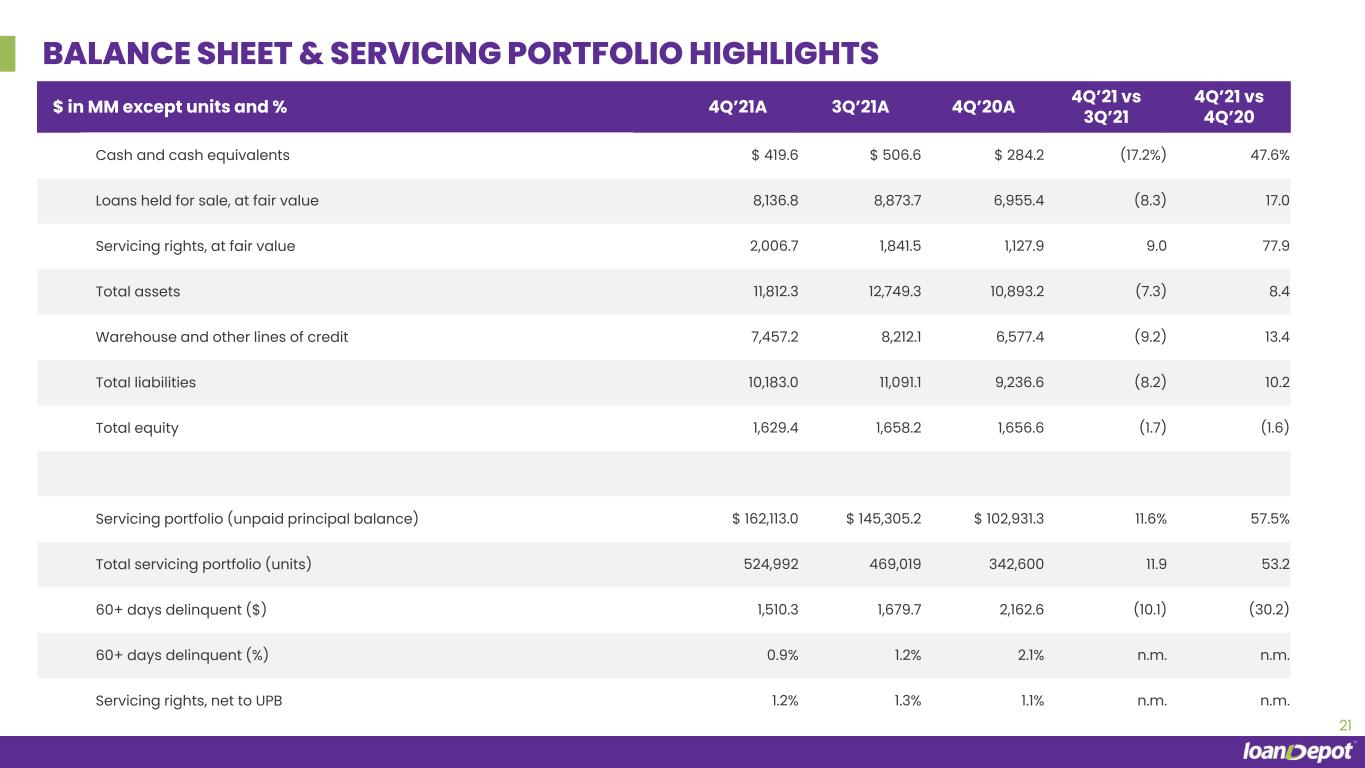
The increase in unpaid principal balance of our servicing portfolio was driven by servicing-retained loan sales. We continued to invest in growing our high-quality servicing portfolio, which is also a valuable origination source for us.
As of December 31, 2021, approximately 0.6%, or $1.0 billion, of our servicing portfolio was in active forbearance. This represents a decrease from 1.1%, or $1.6 billion as of September 30, 2021.
Balance Sheet Highlights
| % Change | ||||||||||||||||||||||||||||||||
($ in thousands) (Unaudited) | December 31, 2021 | September 30, 2021 | December 31, 2020 | Dec-21 vs Sep-21 | Dec-21 vs Dec-20 | |||||||||||||||||||||||||||
| Cash and cash equivalents | $ | 419,571 | $ | 506,608 | $ | 284,224 | (17.2) | % | 47.6 | % | ||||||||||||||||||||||
| Loans held for sale, at fair value | 8,136,817 | 8,873,736 | 6,955,424 | (8.3) | 17.0 | |||||||||||||||||||||||||||
| Servicing rights, at fair value | 2,006,712 | 1,841,512 | 1,127,866 | 9.0 | 77.9 | |||||||||||||||||||||||||||
| Total assets | 11,812,313 | 12,749,278 | 10,893,228 | (7.3) | 8.4 | |||||||||||||||||||||||||||
| Warehouse and other lines of credit | 7,457,199 | 8,212,142 | 6,577,429 | (9.2) | 13.4 | |||||||||||||||||||||||||||
| Total liabilities | 10,182,953 | 11,091,114 | 9,236,615 | (8.2) | 10.2 | |||||||||||||||||||||||||||
| Total equity | 1,629,360 | 1,658,164 | 1,656,613 | (1.7) | (1.6) | |||||||||||||||||||||||||||
The decrease in cash and cash equivalents from September 30, 2021 reflects the timing of increased restricted cash balances posted to our warehouse lines and derivative counterparties at quarter end. A decrease in loans held for sale at December 31, 2021, resulted in a corresponding decrease in the balance on our warehouse lines of credit as loans sold exceeded loan originations. Total funding capacity with our lending partners increased to $11.8 billion at December 31, 2021 from $11.1 billion at September 30, 2021. The funding capacity increase of $0.7 billion was primarily due to the addition of one new facility and the increase on an existing facility, partially offset by the expiration of one facility. Available borrowing capacity was $4.3 billion at December 31, 2021.
6
Consolidated Statements of Operations
| ($ in thousands) | Three Months Ended | Year Ended | |||||||||||||||||||||||||||
| December 31, 2021 | September 30, 2021 | December 31, 2020 | December 31, 2021 | December 31, 2020 | |||||||||||||||||||||||||
| (Unaudited) | (Unaudited) | ||||||||||||||||||||||||||||
| REVENUES: | |||||||||||||||||||||||||||||
| Interest income | $ | 74,854 | $ | 71,020 | $ | 44,730 | $ | 262,478 | $ | 142,879 | |||||||||||||||||||
| Interest expense | (53,327) | (56,785) | (42,562) | (218,457) | (131,443) | ||||||||||||||||||||||||
| Net interest income | 21,527 | 14,235 | 2,168 | 44,021 | 11,436 | ||||||||||||||||||||||||
| Gain on origination and sale of loans, net | 566,022 | 821,275 | 1,138,847 | 3,213,351 | 3,905,986 | ||||||||||||||||||||||||
| Origination income, net | 81,433 | 86,601 | 91,253 | 362,257 | 258,807 | ||||||||||||||||||||||||
| Servicing fee income | 113,942 | 102,429 | 64,375 | 393,680 | 185,895 | ||||||||||||||||||||||||
| Change in fair value of servicing rights, net | (118,668) | (138,462) | (34,532) | (445,862) | (144,348) | ||||||||||||||||||||||||
| Other income | 40,770 | 37,678 | 36,283 | 157,257 | 94,398 | ||||||||||||||||||||||||
| Total net revenues | 705,026 | 923,756 | 1,298,394 | 3,724,704 | 4,312,174 | ||||||||||||||||||||||||
| EXPENSES: | |||||||||||||||||||||||||||||
| Personnel expense | 406,739 | 449,152 | 508,638 | 1,929,752 | 1,531,371 | ||||||||||||||||||||||||
| Marketing and advertising expense | 111,860 | 131,971 | 90,709 | 467,590 | 264,337 | ||||||||||||||||||||||||
| Direct origination expense | 46,712 | 49,559 | 36,127 | 193,264 | 124,754 | ||||||||||||||||||||||||
| General and administrative expense | 64,980 | 50,013 | 51,146 | 214,965 | 171,712 | ||||||||||||||||||||||||
| Occupancy expense | 9,487 | 9,686 | 9,826 | 38,443 | 39,262 | ||||||||||||||||||||||||
| Depreciation and amortization | 9,715 | 8,688 | 8,547 | 35,541 | 35,669 | ||||||||||||||||||||||||
| Subservicing expense | 22,337 | 22,879 | 29,556 | 99,068 | 81,710 | ||||||||||||||||||||||||
| Other interest expense | 22,303 | 22,823 | 15,884 | 79,564 | 48,001 | ||||||||||||||||||||||||
| Total expenses | 694,133 | 744,771 | 750,433 | 3,058,187 | 2,296,816 | ||||||||||||||||||||||||
| Income before income taxes | 10,893 | 178,985 | 547,961 | 666,517 | 2,015,358 | ||||||||||||||||||||||||
| Income tax (benefit) expense | (3,839) | 24,708 | 791 | 43,371 | 2,248 | ||||||||||||||||||||||||
| Net income | 14,732 | 154,277 | 547,170 | 623,146 | 2,013,110 | ||||||||||||||||||||||||
| Net income attributable to noncontrolling interests | 6,119 | 102,802 | 547,170 | 509,622 | 2,013,110 | ||||||||||||||||||||||||
| Net income attributable to loanDepot, Inc. | $ | 8,613 | $ | 51,475 | $ | — | $ | 113,524 | $ | — | |||||||||||||||||||
| Basic EPS | $ | 0.06 | $ | 0.40 | N/A | $ | 0.87 | N/A | |||||||||||||||||||||
| Diluted EPS | $ | 0.05 | $ | 0.40 | N/A | $ | 0.87 | N/A | |||||||||||||||||||||
7
Consolidated Balance Sheets
| ($ in thousands) | December 31, 2021 | September 30, 2021 | December 31, 2020 | ||||||||||||||
| (Unaudited) | |||||||||||||||||
| ASSETS | |||||||||||||||||
| Cash and cash equivalents | $ | 419,571 | $ | 506,608 | $ | 284,224 | |||||||||||
| Restricted cash | 201,025 | 97,805 | 204,465 | ||||||||||||||
| Accounts receivable, net | 56,183 | 68,050 | 138,122 | ||||||||||||||
| Loans held for sale, at fair value | 8,136,817 | 8,873,736 | 6,955,424 | ||||||||||||||
| Derivative assets, at fair value | 194,665 | 341,359 | 647,939 | ||||||||||||||
| Servicing rights, at fair value | 2,006,712 | 1,841,512 | 1,127,866 | ||||||||||||||
| Trading securities, at fair value | 72,874 | 56,412 | — | ||||||||||||||
| Property and equipment, net | 104,262 | 103,556 | 85,002 | ||||||||||||||
| Operating lease right-of-use asset | 55,646 | 58,002 | 66,433 | ||||||||||||||
| Prepaid expenses and other assets | 140,315 | 108,720 | 77,241 | ||||||||||||||
| Loans eligible for repurchase | 363,373 | 632,722 | 1,246,158 | ||||||||||||||
| Investments in joint ventures | 18,553 | 18,353 | 17,528 | ||||||||||||||
| Goodwill and other intangible assets, net | 42,317 | 42,443 | 42,826 | ||||||||||||||
| Total assets | $ | 11,812,313 | $ | 12,749,278 | $ | 10,893,228 | |||||||||||
| LIABILITIES AND EQUITY | |||||||||||||||||
| LIABILITIES: | |||||||||||||||||
| Warehouse and other lines of credit | $ | 7,457,199 | $ | 8,212,142 | $ | 6,577,429 | |||||||||||
| Accounts payable and accrued expenses | 624,444 | 715,615 | 446,370 | ||||||||||||||
| Derivative liabilities, at fair value | 37,797 | 48,899 | 168,169 | ||||||||||||||
| Liability for loans eligible for repurchase | 363,373 | 632,722 | 1,246,158 | ||||||||||||||
| Operating lease liability | 71,932 | 72,985 | 86,023 | ||||||||||||||
| Debt obligations, net | 1,628,208 | 1,408,751 | 712,466 | ||||||||||||||
| Total liabilities | 10,182,953 | 11,091,114 | 9,236,615 | ||||||||||||||
| EQUITY: | |||||||||||||||||
| Total equity | 1,629,360 | 1,658,164 | 1,656,613 | ||||||||||||||
| Total liabilities and equity | $ | 11,812,313 | $ | 12,749,278 | $ | 10,893,228 | |||||||||||
8
Loan Origination and Sales Data
($ in thousands) (Unaudited) | Three Months Ended | Year Ended | |||||||||||||||||||||||||||||||||
| December 31, 2021 | September 30, 2021 | December 31, 2020 | December 31, 2021 | December 31, 2020 | |||||||||||||||||||||||||||||||
| Loan origination volume by type: | |||||||||||||||||||||||||||||||||||
| Conventional conforming | $ | 21,405,365 | $ | 23,621,149 | $ | 31,389,431 | $ | 108,129,659 | $ | 79,960,680 | |||||||||||||||||||||||||
| FHA/VA/USDA | 4,287,947 | 4,784,112 | 5,013,338 | 18,385,497 | 17,584,601 | ||||||||||||||||||||||||||||||
| Jumbo | 2,962,898 | 3,049,321 | 591,739 | 9,072,305 | 1,821,700 | ||||||||||||||||||||||||||||||
| Other | 385,415 | 531,223 | 400,844 | 1,413,286 | 1,393,170 | ||||||||||||||||||||||||||||||
| Total | $ | 29,041,625 | $ | 31,985,805 | $ | 37,395,352 | $ | 137,000,747 | $ | 100,760,151 | |||||||||||||||||||||||||
| Loan origination volume by channel: | |||||||||||||||||||||||||||||||||||
| Retail | $ | 22,461,394 | $ | 24,938,035 | $ | 29,665,251 | $ | 108,708,990 | $ | 80,256,666 | |||||||||||||||||||||||||
| Partnership | 6,580,231 | 7,047,770 | 7,730,101 | 28,291,757 | 20,503,485 | ||||||||||||||||||||||||||||||
| Total | $ | 29,041,625 | $ | 31,985,805 | $ | 37,395,352 | $ | 137,000,747 | $ | 100,760,151 | |||||||||||||||||||||||||
| Loan origination volume by purpose: | |||||||||||||||||||||||||||||||||||
| Purchase | $ | 10,013,662 | $ | 11,008,399 | $ | 9,813,921 | $ | 39,321,538 | $ | 28,301,076 | |||||||||||||||||||||||||
| Refinance | 19,027,963 | 20,977,406 | 27,581,431 | 97,679,209 | 72,459,075 | ||||||||||||||||||||||||||||||
| Total | $ | 29,041,625 | $ | 31,985,805 | $ | 37,395,352 | $ | 137,000,747 | $ | 100,760,151 | |||||||||||||||||||||||||
| Loans sold: | |||||||||||||||||||||||||||||||||||
| Servicing retained | $ | 22,996,748 | $ | 26,520,547 | $ | 33,989,511 | $ | 117,934,385 | $ | 87,186,118 | |||||||||||||||||||||||||
| Servicing released | 6,673,702 | 5,672,551 | 1,394,979 | 18,148,290 | 10,353,541 | ||||||||||||||||||||||||||||||
| Total | $ | 29,670,450 | $ | 32,193,098 | $ | 35,384,490 | $ | 136,082,675 | $ | 97,539,659 | |||||||||||||||||||||||||
| Loan origination margins: | |||||||||||||||||||||||||||||||||||
| Gain on sale margin | 2.23 | % | 2.84 | % | 3.29 | % | 2.61 | % | 4.13 | % | |||||||||||||||||||||||||
Fourth Quarter Earnings Call
Management will host a conference call and live webcast today at 11:00 a.m. ET on loanDepot’s Investor Relations website, investors.loandepot.com, to discuss its earnings results.
The conference call can also be accessed by dialing (888) 440-6385 using conference ID number 2021948. Please call five minutes in advance to ensure that you are connected prior to the call. A replay of the webcast and transcript will also be made available on the Investor Relations website following the conclusion of the event, or can be accessed by dialing (800) 770-2030 using conference ID number 2021948.
For more information about loanDepot, please visit the company’s Investor Relations website: investors.loandepot.com.
9
Non-GAAP Financial Measures
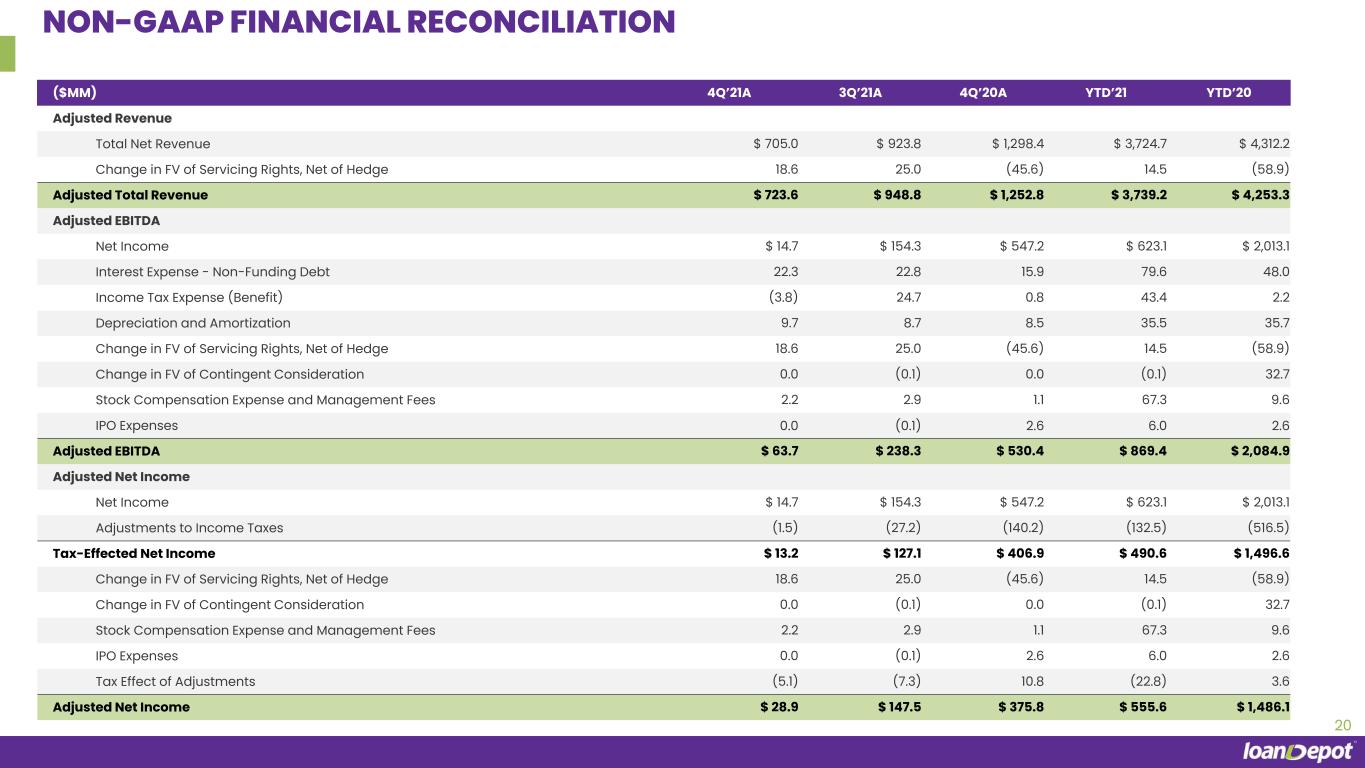
To provide investors with information in addition to our results as determined by GAAP, we disclose Adjusted Total Revenue, Adjusted Net Income, Adjusted Diluted EPS, and Adjusted EBITDA as non-GAAP measures. We believe Adjusted Total Revenue, Adjusted Net Income, Adjusted Diluted EPS, and Adjusted EBITDA provide useful information to investors regarding our results of operations because each measure assists both investors and management in analyzing and benchmarking the performance and value of our business. They facilitate company-to-company operating performance comparisons by backing out potential differences caused by variations in hedging strategies, changes in valuations, capital structures (affecting net interest expense), taxation, the age and book depreciation of facilities (affecting relative depreciation expense) and the amortization of intangibles, which may vary for different companies for reasons unrelated to operating performance, as well as certain historical cost (benefit) items which may vary for different companies for reasons unrelated to operating performance. These measures are not financial measures calculated in accordance with GAAP and should not be considered as a substitute for revenue, net income, or any other operating performance measure calculated in accordance with GAAP, and may not be comparable to a similarly titled measure reported by other companies.
We define “Adjusted Total Revenue” as total revenues, net of the change in fair value of mortgage servicing rights (“MSRs”) and the related hedging gains and losses. We define “Adjusted Net Income” as tax-effected earnings before change in fair value of contingent consideration, stock compensation expense and management fees, IPO expense, and the change in fair value of MSRs, net of the related hedging gains and losses, and the tax effects of those adjustments. We define “Adjusted Diluted EPS” as Adjusted Net Income divided by the diluted weighted average number of shares of Class A common stock and Class D common stock outstanding for the applicable period, which assumes the proforma exchange of all outstanding Class C common shares for shares of Class A common stock. We define “Adjusted EBITDA” as earnings before interest expense and amortization of debt issuance costs on non-funding debt, income taxes, depreciation and amortization, change in fair value of MSRs, net of the related hedging gains and losses, change in fair value of contingent consideration, stock compensation expense and management fees, and IPO related expense. Adjustments for income taxes are made to reflect historical results of operations on the basis that it was taxed as a corporation under the Internal Revenue Code, and therefore subject to U.S. federal, state and local income taxes. We exclude from each of these non-GAAP measures the change in fair value of MSRs and related hedging gains and losses as this represents a non-cash non-realized adjustment to our total revenues, reflecting changes in assumptions including discount rates and prepayment speed assumptions, mostly due to changes in market interest rates, which is not indicative of our performance or results of operations. We also exclude stock compensation expense, which is a non-cash expense, management fees and IPO expenses as management does not consider these costs to be indicative of our performance or results of operations. Adjusted EBITDA includes interest expense on funding facilities, which are recorded as a component of “net interest income (expense)”, as these expenses are a direct operating expense driven by loan origination volume. By contrast, interest and amortization expense on non-funding debt is a function of our capital structure and is therefore excluded from Adjusted EBITDA.
Adjusted Total Revenue, Adjusted Net Income, Adjusted Diluted EPS, and Adjusted EBITDA have limitations as analytical tools, and you should not consider them in isolation or as a substitute for analysis of our results as reported under U.S. GAAP. Some of these limitations are:
•they do not reflect every cash expenditure, future requirements for capital expenditures or contractual commitments;
•Adjusted EBITDA does not reflect the significant interest expense or the cash requirements necessary to service interest or principal payment on our debt;
•although depreciation and amortization are non-cash charges, the assets being depreciated and amortized will often have to be replaced or require improvements in the future, and Adjusted Total Revenue,
10
Adjusted Net Income, and Adjusted EBITDA do not reflect any cash requirement for such replacements or improvements; and
•they are not adjusted for all non-cash income or expense items that are reflected in our statements of cash flows.
Because of these limitations, Adjusted Total Revenue, Adjusted Net Income, Adjusted Diluted EPS, and Adjusted EBITDA are not intended as alternatives to total revenue, net income (loss), net income attributable to the Company, or Diluted EPS or as an indicator of our operating performance and should not be considered as measures of discretionary cash available to us to invest in the growth of our business or as measures of cash that will be available to us to meet our obligations. We compensate for these limitations by using Adjusted Total Revenue, Adjusted Net Income, Adjusted Diluted EPS, and Adjusted EBITDA along with other comparative tools, together with U.S. GAAP measurements, to assist in the evaluation of operating performance. See below for a reconciliation of these non-GAAP measures to their most comparable U.S. GAAP measures.
Reconciliation of Total Revenue to Adjusted Total Revenue ($ in thousands) (Unaudited) | Three Months Ended | Year Ended | ||||||||||||||||||||||||||||||
| December 31, 2021 | September 30, 2021 | December 31, 2020 | December 31, 2021 | December 31, 2020 | ||||||||||||||||||||||||||||
| (Unaudited) | (Unaudited) | |||||||||||||||||||||||||||||||
| Total net revenue | $ | 705,026 | $ | 923,756 | $ | 1,298,394 | $ | 3,724,704 | $ | 4,312,174 | ||||||||||||||||||||||
Change in fair value of servicing rights, net of hedging gains and losses(1) | 18,616 | 25,014 | (45,627) | 14,478 | (58,898) | |||||||||||||||||||||||||||
| Adjusted total revenue | $ | 723,642 | $ | 948,770 | $ | 1,252,767 | $ | 3,739,182 | $ | 4,253,276 | ||||||||||||||||||||||
(1)Represents the change in the fair value of servicing rights attributable to changes in assumptions, net of hedging gains and losses.
11
Reconciliation of Net Income to Adjusted Net Income ($ in thousands) (Unaudited) | Three Months Ended | Year Ended | ||||||||||||||||||||||||||||||
| December 31, 2021 | September 30, 2021 | December 31, 2020 | December 31, 2021 | December 31, 2020 | ||||||||||||||||||||||||||||
| Net income attributable to loanDepot, Inc. | $ | 8,613 | $ | 51,475 | $ | — | $ | 113,524 | $ | — | ||||||||||||||||||||||
Net income from the pro forma conversion of Class C common shares to Class A common shares (1) | 6,119 | 102,802 | 547,170 | 509,622 | 2,013,110 | |||||||||||||||||||||||||||
| Net income | $ | 14,732 | $ | 154,277 | $ | 547,170 | $ | 623,146 | $ | 2,013,110 | ||||||||||||||||||||||
Adjustments to the provision for income taxes(2) | (1,512) | (27,171) | (140,249) | (132,502) | (516,485) | |||||||||||||||||||||||||||
| Tax-effected net income | 13,220 | 127,106 | 406,921 | 490,644 | 1,496,625 | |||||||||||||||||||||||||||
Change in fair value of servicing rights, net of hedging gains and losses(3) | 18,616 | 25,014 | (45,627) | 14,478 | (58,898) | |||||||||||||||||||||||||||
| Change in fair value - contingent consideration | — | (77) | — | (77) | 32,650 | |||||||||||||||||||||||||||
| Stock compensation expense and management fees | 2,220 | 2,882 | 1,099 | 67,304 | 9,565 | |||||||||||||||||||||||||||
| IPO expenses | — | (54) | 2,560 | 6,041 | 2,560 | |||||||||||||||||||||||||||
Tax effect of adjustments(4) | (5,149) | (7,338) | 10,802 | (22,814) | 3,635 | |||||||||||||||||||||||||||
| Adjusted net income | $ | 28,907 | $ | 147,533 | $ | 375,755 | $ | 555,576 | $ | 1,486,137 | ||||||||||||||||||||||
(1)Reflects net income to Class A common stock and Class D common stock from the pro forma exchange of Class C common stock.
(2)loanDepot, Inc. is subject to federal, state and local income taxes. Adjustments to income tax (benefit) reflect the effective income tax rates below, and the pro forma assumption that loanDepot, Inc. owns 100% of LD Holdings.
| Three Months Ended | Year Ended | ||||||||||||||||||||||||||||||||||
| December 31, 2021 | September 30, 2021 | December 31, 2020 | December 31, 2021 | December 31, 2020 | |||||||||||||||||||||||||||||||
| Statutory U.S. federal income tax rate | 21.00 | % | 21.00 | % | 21.00 | % | 21.00 | % | 21.00 | % | |||||||||||||||||||||||||
| State and local income taxes (net of federal benefit) | 3.71 | % | 5.43 | % | 4.74 | % | 5.00 | % | 4.74 | % | |||||||||||||||||||||||||
| Effective income tax rate | 24.71 | % | 26.43 | % | 25.74 | % | 26.00 | % | 25.74 | % | |||||||||||||||||||||||||
(3)Represents the change in the fair value of servicing rights attributable to changes in assumptions, net of hedging gains and losses.
(4)Amounts represent the income tax effect of (a) change in fair value of servicing rights, net of hedging gains and losses, (b) change in fair value of contingent consideration (c) stock compensation expense and management fees, and (d) IPO expense at the aforementioned effective income tax rates.
12
Reconciliation of Adjusted Diluted Weighted Average Shares Outstanding to Diluted Weighted Average Shares Outstanding(1) ($ in thousands except per share) (Unaudited) | Three Months Ended | Year Ended | ||||||||||||||||||
| December 31, 2021 | September 30, 2021 | December 31, 2021 | ||||||||||||||||||
| Net income attributable to loanDepot, Inc. | $ | 8,613 | $ | 51,475 | $ | 113,524 | ||||||||||||||
| Adjusted net income | 28,907 | 147,533 | 555,576 | |||||||||||||||||
| Share Data: | ||||||||||||||||||||
| Diluted weighted average shares of Class A and Class D common stock outstanding | 135,187,530 | 130,297,565 | 129,998,894 | |||||||||||||||||
Assumed pro forma conversion of Class C shares to Class A common stock (2) | 185,521,379 | 191,579,524 | 192,465,222 | |||||||||||||||||
| Adjusted diluted weighted average shares outstanding | 320,708,909 | 321,877,089 | 322,464,116 | |||||||||||||||||
| Diluted EPS | $ | 0.05 | $ | 0.40 | $ | 0.87 | ||||||||||||||
| Adjusted Diluted EPS | 0.09 | 0.46 | 1.72 | |||||||||||||||||
(1)This non-GAAP measure was not applicable for the three months or year ended December 31, 2020 as the IPO and reorganization transaction had not yet occurred.
(2)Reflects the assumed pro forma conversion of all outstanding shares of Class C common stock to Class A common stock.
Reconciliation of Net Income to Adjusted EBITDA ($ in thousands) (Unaudited) | Three Months Ended | Year Ended | ||||||||||||||||||||||||||||||
| December 31, 2021 | September 30, 2021 | December 31, 2020 | December 31, 2021 | December 31, 2020 | ||||||||||||||||||||||||||||
| Net income | $ | 14,732 | $ | 154,277 | $ | 547,170 | $ | 623,146 | $ | 2,013,110 | ||||||||||||||||||||||
Interest expense - non-funding debt (1) | 22,303 | 22,823 | 15,884 | 79,564 | 48,001 | |||||||||||||||||||||||||||
| Income tax (benefit) expense | (3,839) | 24,708 | 791 | 43,371 | 2,248 | |||||||||||||||||||||||||||
| Depreciation and amortization | 9,715 | 8,688 | 8,547 | 35,541 | 35,669 | |||||||||||||||||||||||||||
Change in fair value of servicing rights, net of hedging gains and losses(2) | 18,616 | 25,014 | (45,627) | 14,478 | (58,898) | |||||||||||||||||||||||||||
| Change in fair value - contingent consideration | — | (77) | — | (77) | 32,650 | |||||||||||||||||||||||||||
| Stock compensation expense and management fees | 2,220 | 2,882 | 1,099 | 67,304 | 9,565 | |||||||||||||||||||||||||||
| IPO expense | — | (54) | 2,560 | 6,041 | 2,560 | |||||||||||||||||||||||||||
| Adjusted EBITDA | $ | 63,747 | $ | 238,261 | $ | 530,424 | $ | 869,368 | $ | 2,084,905 | ||||||||||||||||||||||
(1)Represents other interest expense, which includes amortization of debt issuance costs, in the Company’s consolidated statement of operations.
(2)Represents the change in the fair value of servicing rights attributable to changes in assumptions, net of hedging gains and losses.
13
Forward-Looking Statements
This press release may contain "forward-looking statements," which reflect loanDepot's current views with respect to, among other things, its operations and financial performance. You can identify these statements by the use of words such as "outlook," "potential," "continue," "may," "seek," "approximately," "predict," "believe," "expect," "plan," "intend," "estimate" or "anticipate" and similar expressions or the negative versions of these words or comparable words, as well as future or conditional verbs such as "will," "should," "would" and "could." These forward-looking statements are based on current available operating, financial, economic and other information, and are not guarantees of future performance and are subject to risks, uncertainties and assumptions, including the risks in the "Risk Factors" section of loanDepot, Inc.'s Annual Report on Form 10-K for the year ended December 31, 2020, which are difficult to predict. Therefore, current plans, anticipated actions, financial results, as well as the anticipated development of the industry, may differ materially from what is expressed or forecasted in any forward-looking statement. loanDepot does not undertake any obligation to publicly update or revise any forward-looking statement to reflect future events or circumstances, except as required by applicable law.
About loanDepot
loanDepot (NYSE: LDI) is a digital commerce company committed to serving its customers throughout the home ownership journey. Since its launch in 2010, loanDepot has revolutionized the mortgage industry with a digital-first approach that makes it easier, faster and less stressful to purchase or refinance a home. Today, as the nation's second largest retail mortgage lender, loanDepot enables customers to achieve the American dream of homeownership through a broad suite of lending and real estate services that simplify one of life's most complex transactions. With headquarters in Southern California and offices nationwide, loanDepot is committed to serving the communities in which its team lives and works through a variety of local, regional and national philanthropic efforts.
Investor Relations Contact:
Gerhard Erdelji
Senior Vice President, Investor Relations
(949) 822-4074
Media Contact:
Rebecca Anderson
Senior Vice President, Communications & Public Relations
(949) 822-4024
LDI-IR
14