lnc-20250731
0000059558FALSE00000595582025-07-312025-07-310000059558us-gaap:CommonStockMember2025-07-312025-07-310000059558us-gaap:SeriesDPreferredStockMember2025-07-312025-07-31

UNITED STATES
SECURITIES AND EXCHANGE COMMISSION
Washington, D.C. 20549
FORM 8-K
CURRENT REPORT
Pursuant to Section 13 or 15(d) of the Securities Exchange Act of 1934

July 31, 2025
Date of Report (Date of earliest event reported)

                  Lincoln National Corporation             
(Exact name of registrant as specified in its charter)


Indiana1-602835-1140070
(State or other jurisdiction(Commission(IRS Employer
of incorporation)File Number)Identification No.)


150 N. Radnor Chester Road, Radnor, PA 19087
(Address of principal executive offices) (Zip Code)

Registrant’s telephone number, including area code: (484) 583-1400

Check the appropriate box below if the Form 8-K filing is intended to simultaneously satisfy the filing obligation of the registrant under any of the following provisions:

Written communications pursuant to Rule 425 under the Securities Act (17 CFR 230.425)

Soliciting material pursuant to Rule 14a-12 under the Exchange Act (17 CFR 240.14a-12)

Pre-commencement communications pursuant to Rule 14d-2(b) under the Exchange Act (17 CFR 240.14d-2(b))
Pre-commencement communications pursuant to Rule 13e-4(c) under the Exchange Act (17 CFR 240.13e-4(c))

Securities registered pursuant to Section 12(b) of the Act:
Title of each classTrading symbol(s)Name of each exchange on which registered
Common StockLNCNew York Stock Exchange
Depositary Shares, each representing a 1/1000th interest in a share of 9.000% Non-Cumulative Preferred Stock, Series D
LNC PRDNew York Stock Exchange
__________________________________

Indicate by check mark whether the registrant is an emerging growth company as defined in Rule 405 of the Securities Act of 1933 (§230.405 of this chapter) or Rule 12b-2 of the Securities Exchange Act of 1934 (§240.12b-2 of this chapter).

Emerging growth company 

If an emerging growth company, indicate by check mark if the registrant has elected not to use the extended transition period for complying with any new or revised financial accounting standards provided pursuant to Section 13(a) of the Exchange Act.   


Item 2.02. Results of Operations and Financial Condition.

On July 31, 2025, Lincoln National Corporation (the “Company”) issued a press release announcing its financial results for the quarter ended June 30, 2025, a copy of which is attached as Exhibit 99.1 and is incorporated herein by reference. The Company’s statistical supplement for the quarter ended June 30, 2025, is attached as Exhibit 99.2 and is incorporated herein by reference.

The information, including exhibits attached hereto, furnished under this Item 2.02 shall not be deemed “filed” for the purposes of Section 18 of the Securities Exchange Act of 1934, as amended (the “Exchange Act”), or otherwise subject to the liabilities of that Section. The information in this Current Report shall not be incorporated by reference into any registration statement or other document pursuant to the Securities Act of 1933, as amended (the “Securities Act”), except as otherwise expressly stated in such filing.

Item 7.01. Regulation FD Disclosure.

On July 31, 2025, in connection with the Company’s second quarter 2025 earnings conference call scheduled for the same date, the Company made available on its website a second quarter 2025 earnings supplement presentation dated July 31, 2025, a copy of which is attached hereto as Exhibit 99.3 and is incorporated herein by reference.

This presentation is being furnished under this Item 7.01 and shall not be deemed “filed” for the purposes of Section 18 of the Exchange Act or otherwise subject to the liabilities of that Section. The information in Exhibit 99.3 shall not be incorporated by reference into any registration statement or other document pursuant to the Securities Act, except as otherwise expressly stated in such filing.

Item 9.01. Financial Statements and Exhibits.

(d)Exhibits.
The following exhibits are being furnished with this Form 8-K.
Exhibit
Number
Description
99.1
99.2
99.3
104Cover Page Interactive Data File (embedded within the Inline XBRL document).


SIGNATURES
Pursuant to the requirements of the Securities Exchange Act of 1934, the Registrant has duly caused this report to be signed on its behalf by the undersigned hereunto duly authorized.

LINCOLN NATIONAL CORPORATION
By/s/ Adam Cohen
Name:Adam Cohen
Title:Senior Vice President, Chief Accounting Officer and Treasurer


Date: July 31, 2025


'image_0a.jpg     For Immediate Release
image_1a.jpg


Lincoln Financial Reports 2025 Second Quarter Results
____________________________________

Radnor, PA, July 31, 2025: Lincoln Financial (NYSE: LNC) today reported financial results for the second quarter ended June 30, 2025.
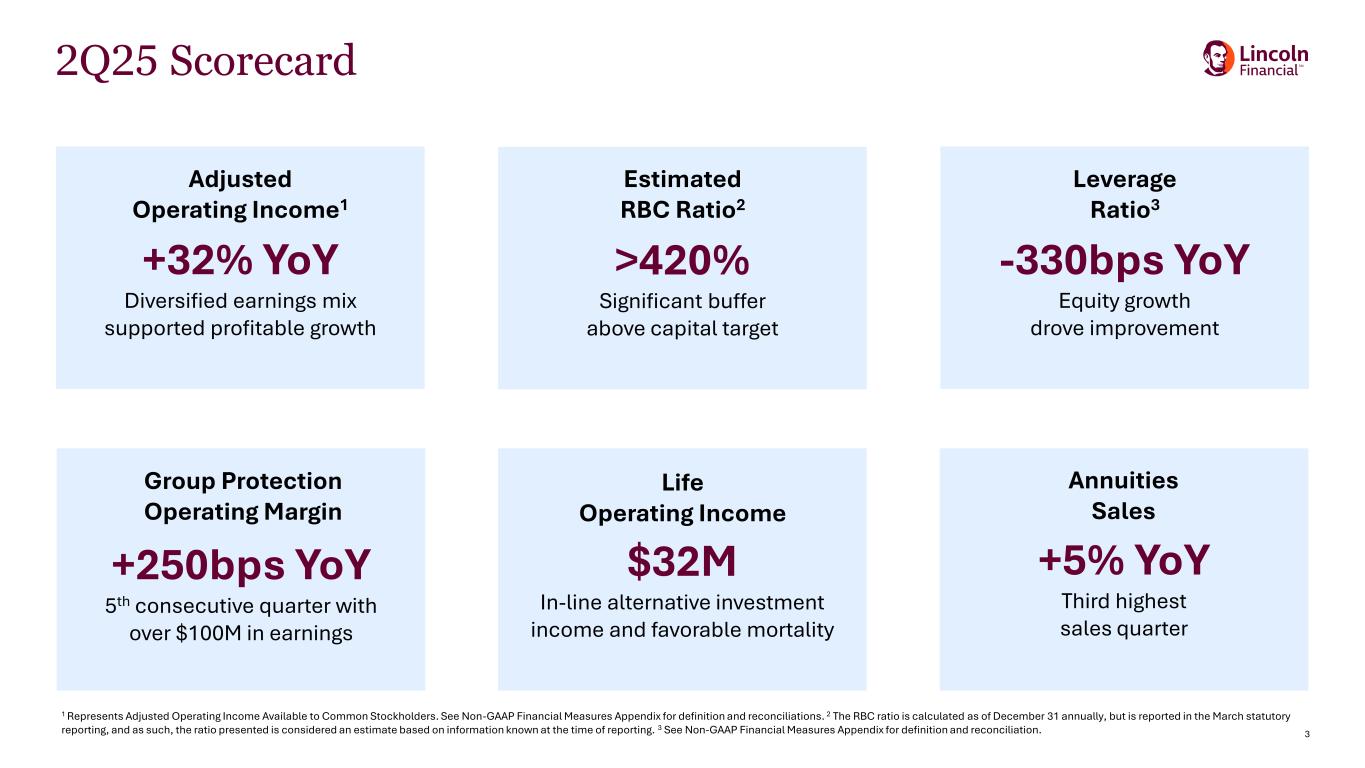
Strong performance in the quarter was driven by an increasingly diversified earnings mix and disciplined execution on strategic and financial objectives.
Second quarter net income (loss) available to common stockholders was $688 million, or $3.80 per diluted share.
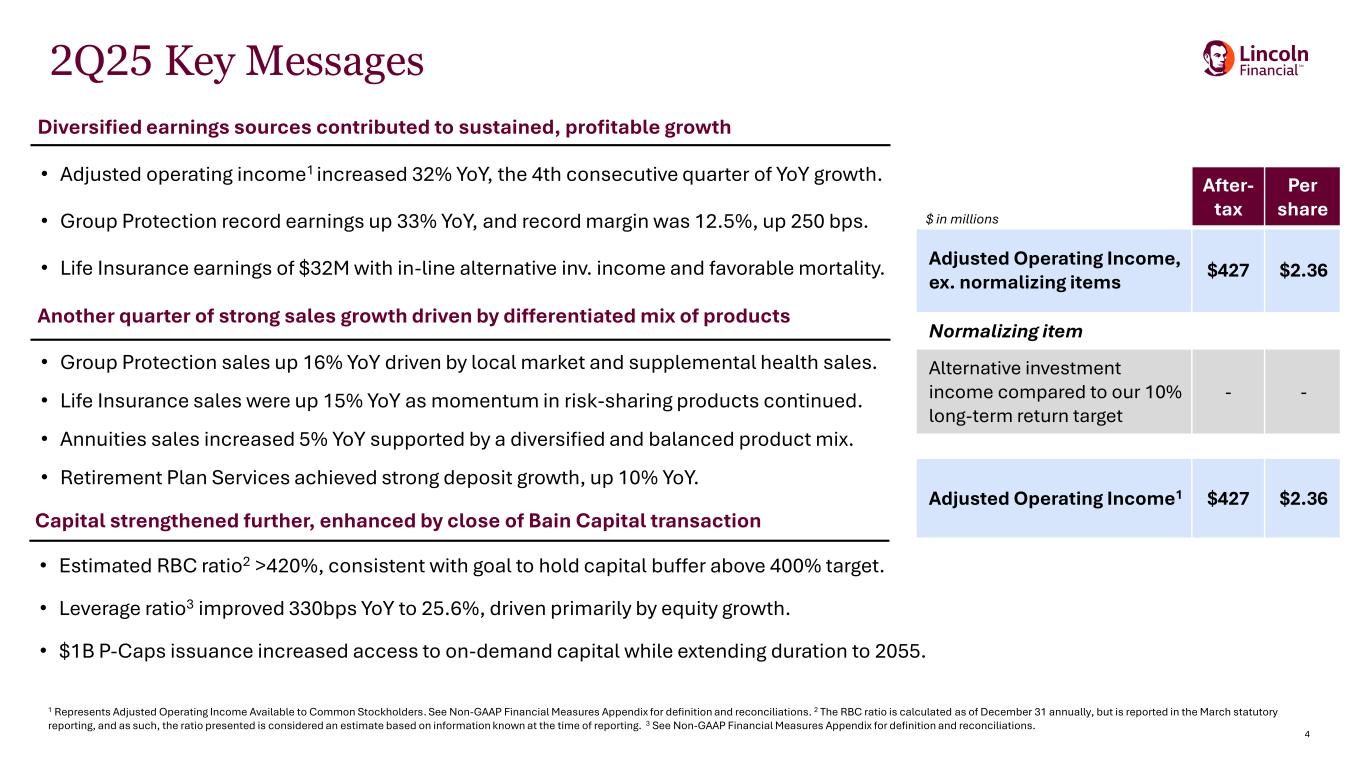
Second quarter adjusted operating income (loss) available to common stockholders was $427 million, or $2.36 per diluted share.
The primary difference between net income (loss) and adjusted operating income (loss) resulted from a $0.3 billion net after-tax gain, or $1.77 per diluted share, primarily due to the non-economic impacts of changes in market risk benefits.
Closed transaction with Bain Capital, a partnership expected to support acceleration of strategic priorities.

"Our second-quarter performance was strong and reflected the significant progress we have made in executing our strategy to reposition Lincoln for sustainable, long-term value creation," said Ellen Cooper, Chairman, President and CEO of Lincoln Financial. "Group Protection delivered a record quarter for earnings and its highest-ever margin. Annuities generated its third-highest sales quarter, supported by a more diverse and balanced product mix. Retirement Plan Services saw an increase in total deposits resulting from strong first-year sales growth. Life Insurance delivered positive earnings, driven by favorable mortality and improved expenses.

"With a more balanced business mix, greater capital flexibility, and a disciplined focus on generating profitable growth with attractive risk-adjusted returns, we are well positioned to build on this momentum and unlock Lincoln's full potential."


1


Business Highlights

imagea.jpg
Our 2025 second-quarter results reflected the benefits of a more diverse earnings mix and continued execution against strategic initiatives by each business.

Retail Solutions
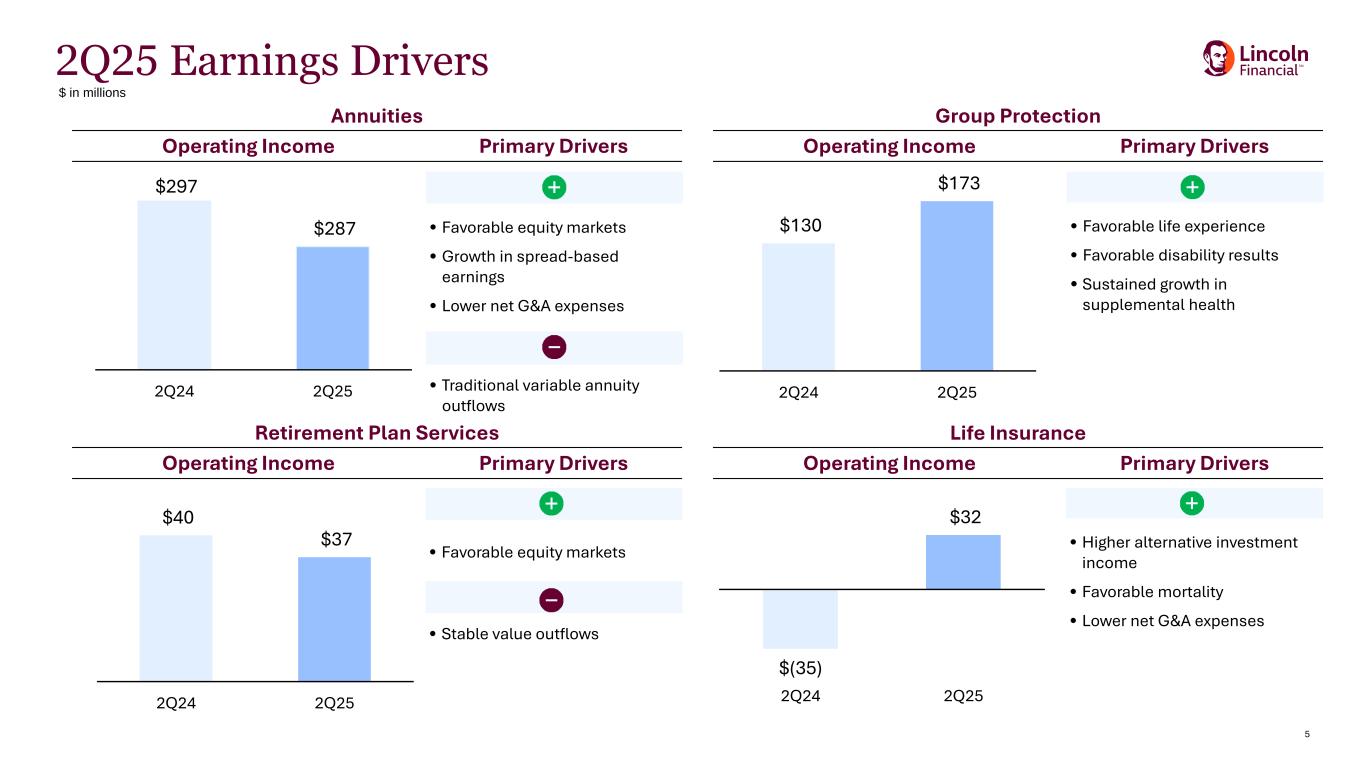
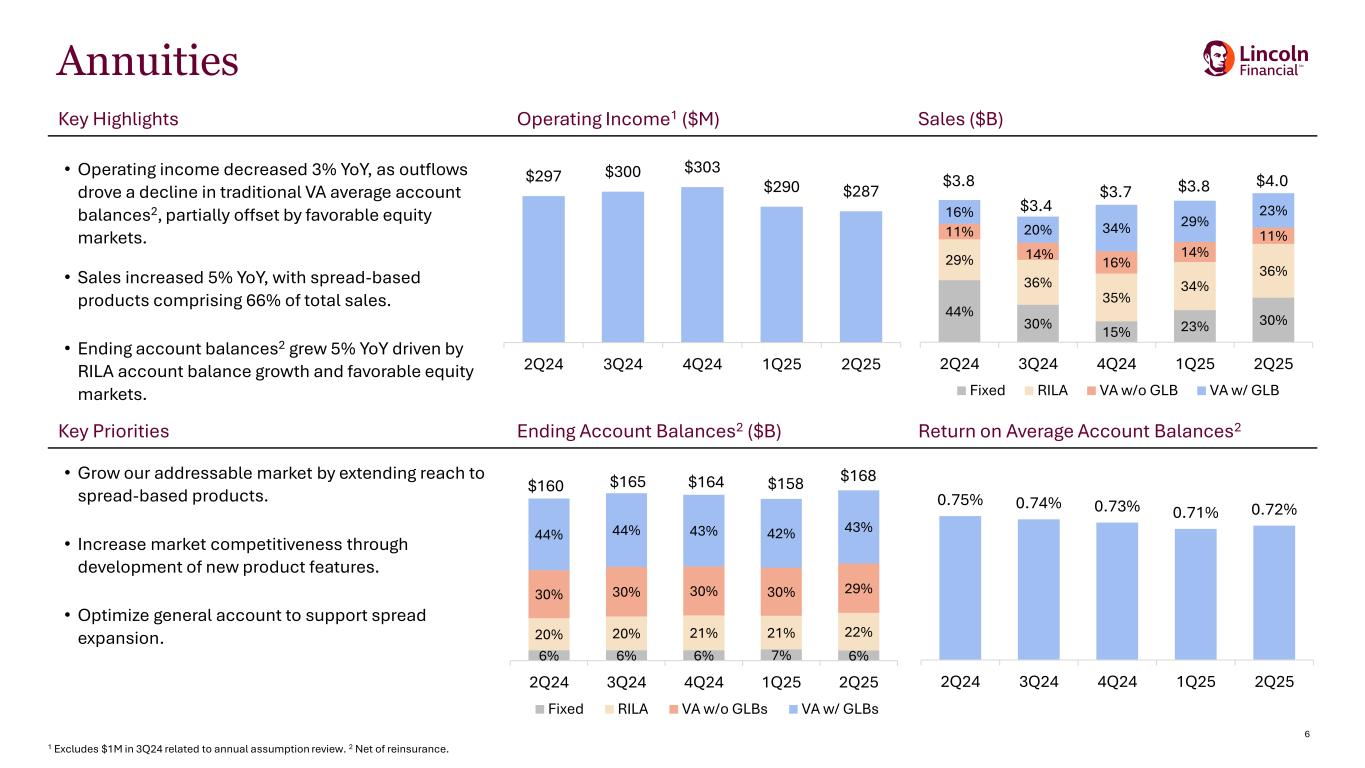
Annuities reported operating income of $287 million, down 3% compared to the prior-year quarter, as outflows drove a decline in traditional variable annuities average account balances, partially offset by favorable equity markets. Annuities generated sales of $4.0 billion, up 5% year over year, with over $1 billion of sales in each of its primary product categories, a reflection of our diversified product offering. Spread-based products accounted for 66% of total sales in the quarter.

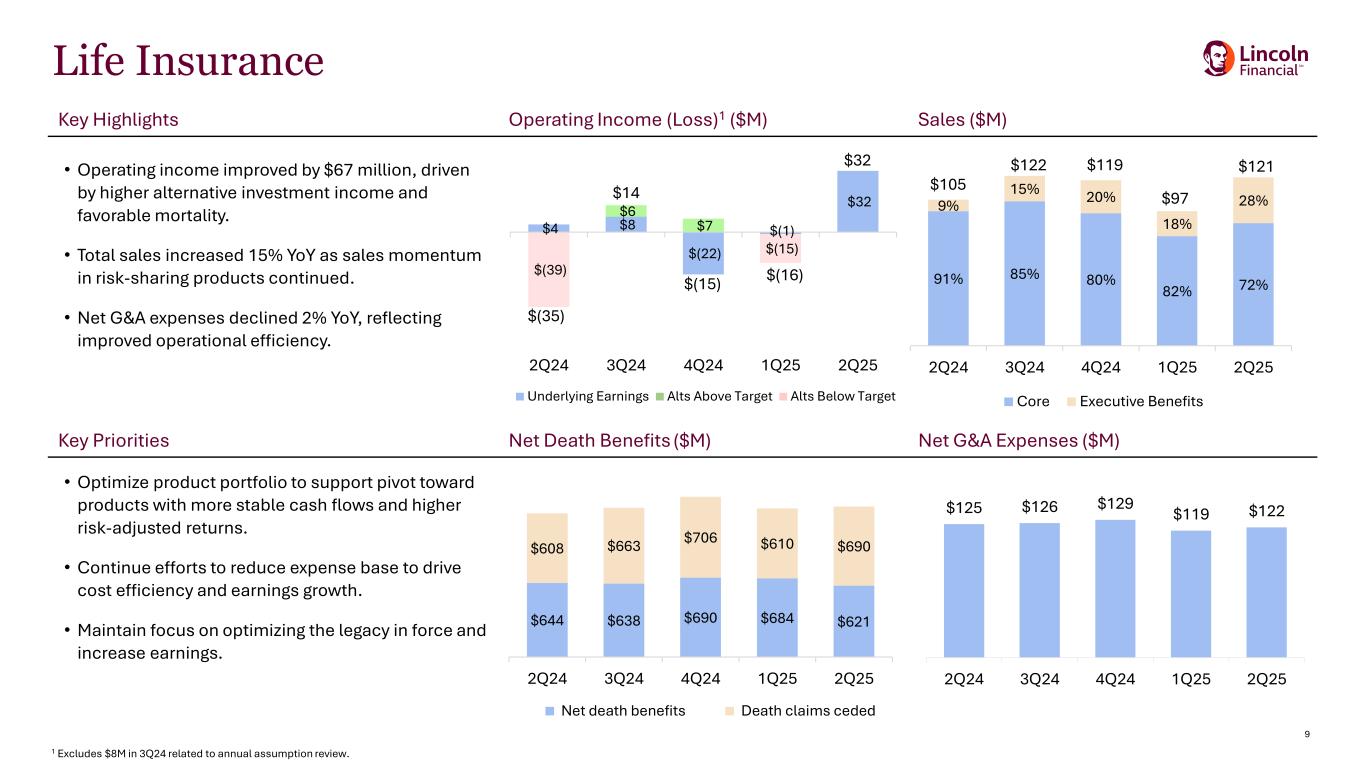
Life Insurance reported operating income of $32 million, a $67 million increase from the prior-year quarter, driven by higher alternative investment income and favorable mortality. Alternative investment income returns were in line with our annual target in the second quarter. Total sales were $121 million, 15% higher than the prior-year period, as momentum in sales of risk-sharing products continued.

Workplace Solutions
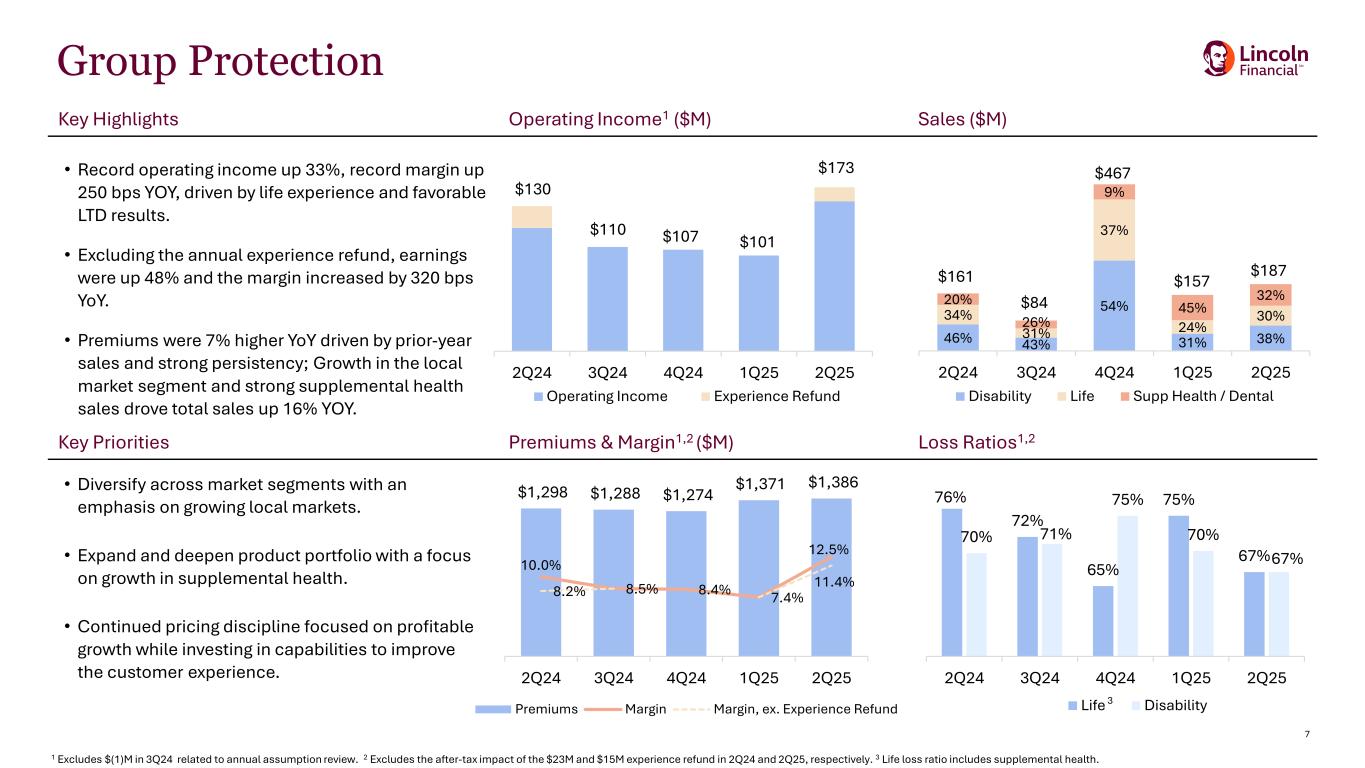
Group Protection reported operating income of $173 million, up 33% compared to the prior-year quarter, and a margin of 12.5%, up 250 basis points over the same period. This improvement was driven by life experience and favorable long-term disability results. Premiums were 7% higher year over year, resulting from prior-year sales and strong persistency. Sales of $187 million were 16% higher year over year, driven by growth in the local market segment and strong supplemental health sales.

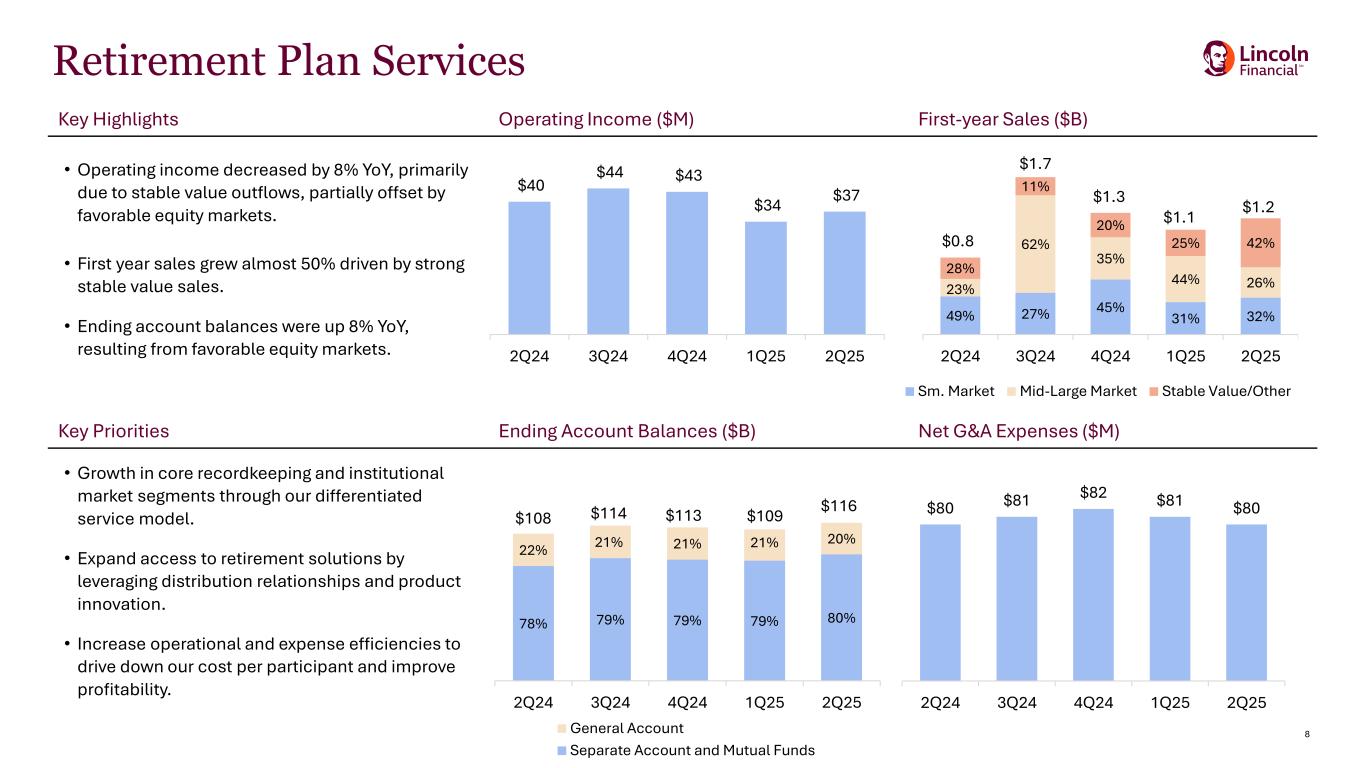
Retirement Plan Services reported operating income of $37 million in the quarter, down 8% year over year, primarily due to stable value outflows, partially offset by favorable equity markets. Net outflows were $0.6 billion, compared to $0.2 billion in the year-ago quarter, as plan terminations were partially offset by continued strength in first-year sales. Total deposits were $3.6 billion in the quarter, 10% higher than the prior-year period, driven by almost 50% first-year sales growth.

2


Earnings Summary
imagea.jpg
(in millions, except per share data)For the Three Months EndedFor the Six Months Ended
6/30/2024 (1)
6/30/25
6/30/24 (1)
6/30/25
Net income (loss)$895 $699 $2,116 $(23)
Net income (loss) available to common stockholders — diluted884 688 2,073 (69)
Net income (loss) per diluted share available to common stockholders(2)
$5.11 $3.80 $12.03 $(0.39)
Adjusted income (loss) from operations335 438 580 752 
Adjusted income (loss) from operations available to common stockholders324 427 534 706 
Adjusted income (loss) from operations per diluted share available to common stockholders$1.87 $2.36 $3.10 $3.97 

(1) Prior period amounts have been recast to conform to the current period presentation.
(2) In periods where a net loss is presented, basic shares are used in the diluted EPS and adjusted diluted EPS calculations, as using diluted shares would result in a lower loss per share.


Reconciliation of Net Income (Loss) to Adjusted Income (Loss) from Operations(1)
imagea.jpg
(in millions)For the Three Months EndedFor the Six Months Ended
6/30/24 (1)
6/30/25
6/30/24 (1)
6/30/25
Net income (loss) available to common stockholders — diluted$884 $688 $2,073 $(69)
Less:
Preferred stock dividends declared(11)(11)(46)(46)
Adjusted for deferred units of LNC stock in our deferred compensation plans— — — 
Net income (loss)895 699 2,116 (23)
Less:
Net annuity product features, pre-tax(2)
252 405 1,702 (687)
Net life insurance product features, pre-tax(58)(128)(15)
Credit loss-related adjustments, pre-tax(34)(25)(36)(53)
Investment gains (losses), pre-tax(230)(81)(311)(183)
Changes in the fair value of reinsurance-related embedded derivatives,
 trading securities and certain mortgage loans, pre-tax(2)
201 14 395 (76)
Gains (losses) on other non-financial assets - sale of
subsidiaries/businesses, pre-tax(2)
584 — 584 — 
Other items, pre-tax(2)
(33)75 (219)40 
Income tax benefit (expense) related to the above pre-tax items(184)(69)(451)199 
Adjusted income (loss) from operations$335 $438 $580 $752 
Adjusted income (loss) from operations available to common stockholders$324 $427 $534 $706 

(1) See the definition of Adjusted Income (Loss) from Operations at the back of this press release for revisions made to the definition in the third quarter of 2024 and further explanation of reconciliation line items. Prior period amounts have been recast to conform to the current period presentation.
(2) Refer to the full reconciliation at the back of this release for footnotes.


3


Variable Investment Income
imagea.jpg
Alternative Investment Income, after-tax(1)
For the Three Months EndedFor the Six Months Ended
(in millions)6/30/249/30/2412/31/243/31/256/30/256/30/246/30/25
Annuities$$$$$$$
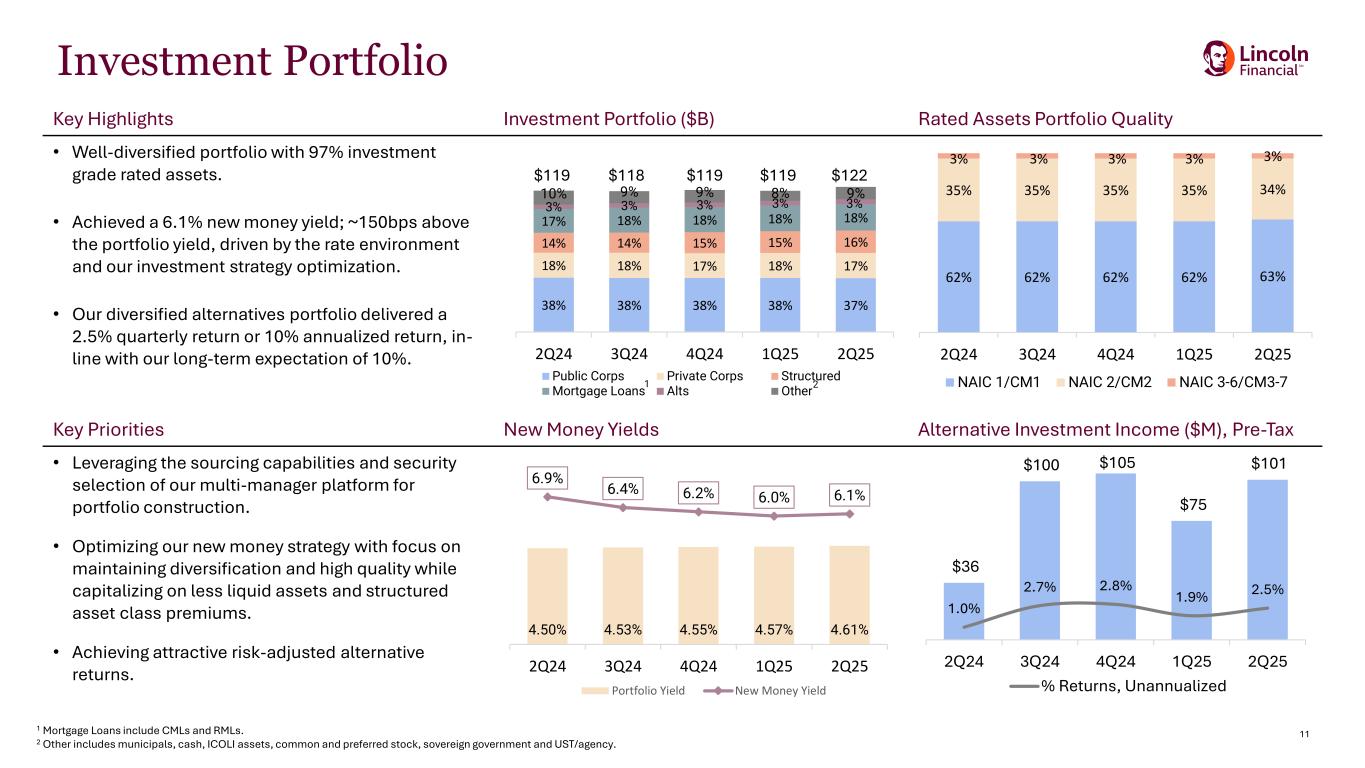
Life Insurance26 73 76 55 74 84 129 
Group Protection
Retirement Plan Services— 
Other Operations— — — — — — 
Consolidated$28 $79 $83 $59 $80 $90 $139 

(1) Excludes alternative investment income on investments supporting our modified coinsurance and coinsurance with funds withheld agreements as we have limited economic interest in those investments.

Prepayment Income, after-tax
For the Three Months Ended
For the Six Months Ended
(in millions)
6/30/249/30/2412/31/243/31/256/30/256/30/246/30/25
Annuities
$— $— $$— $$$
Life Insurance
— 
Group Protection
— — — 
Retirement Plan Services
— — — — — 
Other Operations
— — — — — — — 
Consolidated
$2 $4 $5 $1 $4 $4 $5 

Items Impacting Segment and Other Operations Results
imagea.jpg
For the Three Months Ended June 30, 2025
(in millions)
Annuities
Life Insurance
Group Protection
Retirement Plan Services
Other Operations
After-tax impacts:
Alternative investment income compared to return target(1)
$— $— $— $— $— 
Prepayment income(2)
— — — 
Annual assumption review
— — — — — 
Tax items— — — — — 
Other— — — — — 
Total impact
$3 $ $1 $ $ 

For the Three Months Ended June 30, 2024
(in millions)
Annuities
Life Insurance
Group Protection
Retirement Plan Services
Other Operations
After-tax impacts:
Alternative investment income compared to return target(1)
$(1)$(39)$(1)$— $— 
Prepayment income(2)
— — — — 
Annual assumption review
— — — — — 
Tax items— — — — — 
Other— — — — — 
Total impact
$(1)$(37)$(1)$ $ 

(1) Alternative investment income comparison to return target assumes a 10% annual return on the alternative investment portfolio.
(2) Prepayment income is actual income reported in the quarter.


4


Capital and Liquidity
imagea.jpg
As of or For the Three Months Ended
(in millions, except percent and per share data)6/30/249/30/2412/31/243/31/256/30/25
Holding company available liquidity(1)
$463 $459 $463 $466 $466 
RBC ratio(2)
>420%>420%433 %>420%>420%
Book value per share (BVPS), including AOCI$40.78 $46.97 $42.60 $41.96 $44.91 
Book value per share, excluding AOCI(3)
$66.37 $62.67 $72.06 $67.04 $67.95 
Adjusted book value per share(3)
$68.51 $70.04 $72.34 $73.19 $72.77 

(1) Holding company available liquidity presented as of 6/30/24, 9/30/24 and 12/31/24 does not include the $300 million prefunding of a 2025 maturity.
(2) The RBC ratio is calculated annually as of December 31, but is reported in the March statutory reporting, and as such, the quarterly ratios presented for 6/30/24, 9/30/24, 3/31/25, and 6/30/2025 are considered estimates based on information known at the time of reporting.
(3) Refer to the reconciliation to book value per share, including AOCI, at the back of this release.

Annuities
imagea.jpg
(in millions, except ROA data)As of or For the Three Months EndedAs of or For the Six Months Ended
6/30/249/30/2412/31/243/31/256/30/25Change6/30/246/30/25Change
Total operating revenues$1,209 $1,195 $1,223 $1,198 $1,214 0.4 %$2,477 $2,412 (2.6)%
Total operating expenses858 836 864 858 876 2.1 %1,808 1,734 (4.1)%
Income (loss) from operations before taxes351 359 359 340 338 (3.7)%669 678 1.3 %
Federal income tax expense (benefit)54 58 56 50 51 (5.6)%113 101 (10.6)%
Income (loss) from operations$297 $301 $303 $290 $287 (3.4)%$556 $577 3.8 %
Income (loss) from operations, excluding impact of annual assumption review$297 $300 $303 $290 $287 (3.4)%$556 $577 3.8 %
Total sales$3,817 $3,375 $3,689 $3,789 $4,019 5.3 %$6,663 $7,807 17.2 %
Net flows$(954)$(1,637)$(1,891)$(1,676)$(1,162)(21.8)%$(2,946)$(2,838)3.7 %
Average account balances, net of reinsurance$158,370 $161,680 $165,424 $163,688 $159,806 0.9 %$156,531 $161,877 3.4 %
Return on average account balances (bps)75 74 73 71 72 71 71 

Income from operations was $287 million for the second quarter, down 3% compared to the prior-year quarter, as outflows drove a decline in traditional variable annuities average account balances, partially offset by favorable equity markets.
Total sales were $4.0 billion in the quarter, increasing 5% compared to the prior year. Spread-based products comprised 66% of total sales.
Net outflows were approximately $1.2 billion in the quarter, compared to net outflows of $1.0 billion in the prior-year quarter, with higher outflows driven by partial withdrawals.
Average account balances, net of reinsurance, were $160 billion, increasing 1% over the prior-year quarter. This result was primarily due to growth in RILA, partially offset by a decline in traditional variable annuities.
5


Life Insurance
imagea.jpg
(in millions)As of or For the Three Months EndedAs of or For the Six Months Ended
6/30/249/30/2412/31/243/31/256/30/25Change6/30/246/30/25Change
Total operating revenues$1,511 $1,589 $1,608 $1,587 $1,602 6.0 %$3,052 $3,188 4.5 %
Total operating expenses1,562 1,568 1,634 1,619 1,568 0.4 %3,153 3,186 1.0 %
Income (loss) from operations before taxes(51)21 (26)(32)34 166.7 %(101)102.0 %
Federal income tax expense (benefit)(16)(1)(11)(16)112.5 %(31)(14)54.8 %
Income (loss) from operations$(35)$22 $(15)$(16)$32 191.4 %$(70)$16 122.9 %
Income (loss) from operations, excluding the impact of annual assumption review$(35)$14 $(15)$(16)$32 191.4 %$(70)$16 122.9 %
Average account balances, net of reinsurance$43,230 $44,055 $44,746 $44,390 $45,651 5.6 %$42,755 $45,020 5.3 %
Total sales$105 $122 $119 $97 $121 15.2 %$197 $218 10.7 %

Income from operations was $32 million, compared to a loss of $35 million in the prior-year quarter, resulting from higher alternative investment income and favorable mortality.
Total sales were $121 million, up 15% compared to the prior-year quarter, as sales momentum in risk-sharing products continued.
Average account balances, net of reinsurance, were $46 billion, up 6% versus the prior-year quarter.


6


Group Protection
imagea.jpg
(in millions, except margin data)As of or For the Three Months EndedAs of or For the Six Months Ended
6/30/249/30/2412/31/243/31/256/30/25Change6/30/246/30/25Change
Total operating revenues$1,441 $1,432 $1,418 $1,521 $1,538 6.7 %$2,867 $3,059 6.7 %
Total operating expenses1,276 1,295 1,282 1,393 1,319 3.4 %2,601 2,712 4.3 %
Income (loss) from operations before taxes165 137 136 128 219 32.7 %266 347 30.5 %
Federal income tax expense (benefit)35 28 29 27 46 31.4 %56 73 30.4 %
Income (loss) from operations$130 $109 $107 $101 $173 33.1 %$210 $274 30.5 %
Income (loss) from operations, excluding the impact of annual assumption review$130 $110 $107 $101 $173 33.1 %$210 $274 30.5 %
Insurance premiums$1,298 $1,288 $1,274 $1,371 $1,386 6.8 %$2,583 $2,757 6.7 %
Total sales$161 $84 $467 $157 $187 16.1 %$306 $344 12.4 %
Total loss ratio70.1 %71.4 %71.0 %72.4 %65.9 %72.5 %69.2 %
Operating margin(1)
10.0 %8.4 %8.4 %7.4 %12.5 %8.1 %9.9 %
Operating margin, excluding the impact of annual assumption review10.0 %8.5 %8.4 %7.4 %12.5 %8.1 %9.9 %

(1) Operating margin is calculated by dividing income (loss) from operations by insurance premiums.

Income from operations was $173 million in the quarter, 33% higher than the prior-year quarter, and the operating margin improved by 250 basis points to 12.5%. Life experience and favorable long-term disability results drove the year-over-year improvement.
Insurance premiums were $1.4 billion in the quarter, increasing 7% year over year due to prior-year sales and strong persistency.
Sales increased 16% year over year, driven by growth in the local market segment and strong supplemental health sales.
The total loss ratio was 65.9%, 420 basis points lower than the prior-year quarter, driven by life experience and favorable long-term disability results.


7


Retirement Plan Services
imagea.jpg
(in millions, except ROA data)As of or For the Three Months EndedAs of or For the Six Months Ended
6/30/249/30/2412/31/243/31/256/30/25Change6/30/246/30/25Change
Total operating revenues$327 $335 $337 $327 $331 1.2 %$649 $658 1.4 %
Total operating expenses281 286 288 289 289 2.8 %561 578 3.0 %
Income (loss) from operations before taxes46 49 49 38 42 (8.7)%88 80 (9.1)%
Federal income tax expense (benefit)(16.7)%12 (25.0)%
Income (loss) from operations$40 $44 $43 $34 $37 (7.5)%$76 $71 (6.6)%
Deposits$3,282 $4,180 $3,473 $4,115 $3,594 9.5 %$7,085 $7,709 8.8 %
Net flows$(197)$651 $(732)$(2,184)$(585)NM$194 $(2,768)NM
Average account balances$106,374 $110,550 $113,711 $113,075 $111,734 5.0 %$104,518 $112,772 7.9 %
Return on average account balances (bps)15161512131513

Income from operations was $37 million in the quarter, down 8% compared to the prior year, primarily due to stable value outflows, partially offset by favorable equity markets.
Net outflows were $0.6 billion, primarily due to plan terminations, partially offset by continued strength in first-year sales.
Total deposits were $3.6 billion, 10% higher than the prior-year quarter, driven by significant first-year sales growth of nearly 50%.
Average account balances were $112 billion, increasing 5% from the prior year.

Other Operations

imagea.jpg
(in millions)As of or For the Three Months EndedAs of or For the Six Months Ended
6/30/249/30/2412/31/243/31/256/30/25Change
6/30/24(1)
6/30/25Change
Total operating revenues$39 $52 $42 $52 $41 5.1 %$66 $94 42.4 %
Total operating expenses161 157 160 164 157 (2.5)%308 322 4.5 %
Income (loss) from operations before taxes(122)(105)(118)(112)(116)4.9 %(242)(228)5.8 %
Federal income tax expense (benefit)(25)(21)(23)(17)(25)0.0%(50)(42)16.0 %
Income (loss) from operations(2)
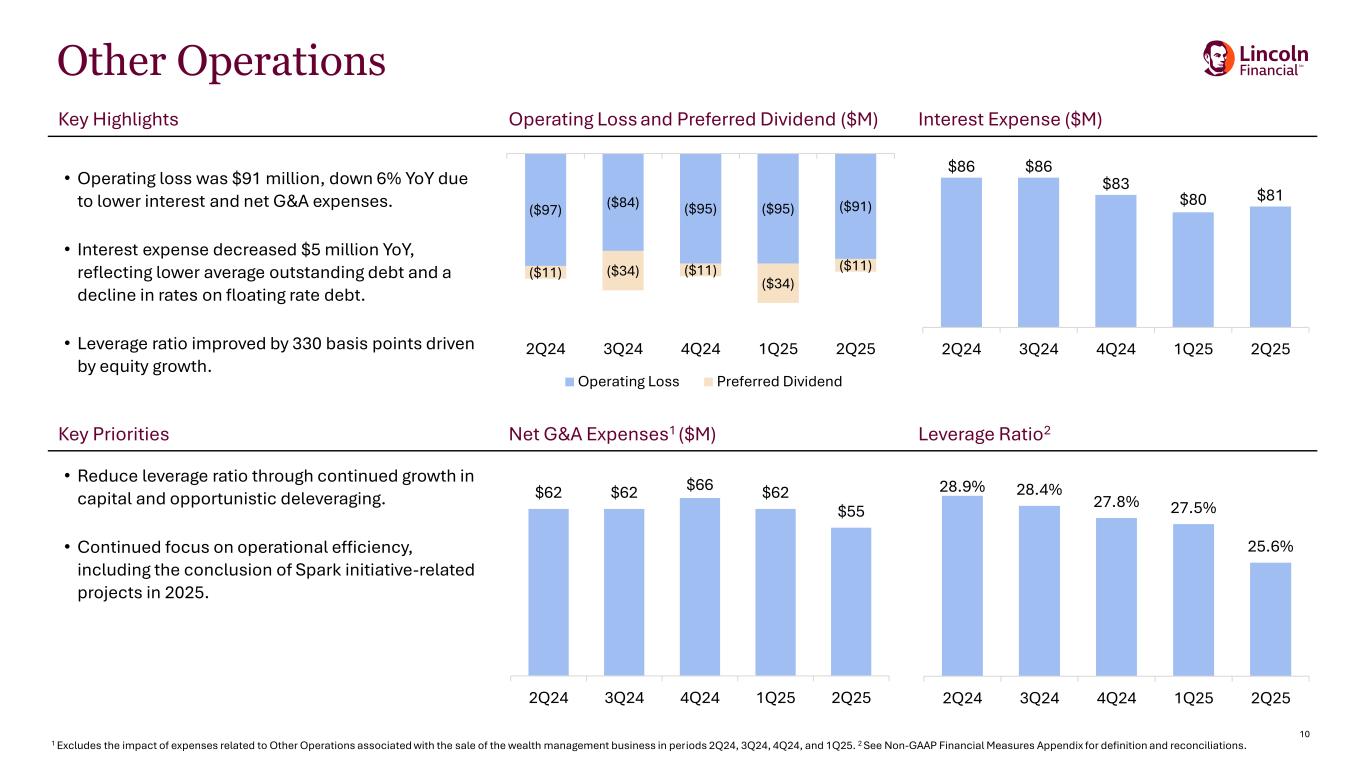
$(97)$(84)$(95)$(95)$(91)6.2 %$(192)$(186)3.1 %

(1) The six-month period ended June 30, 2024 has been recast to conform to the revised definition of income (loss) from operations. See Definitions of Non-GAAP Measures at the back of this press release.             
(2) Income (loss) from operations does not include preferred dividends.


8


Unrealized Gains and Losses
imagea.jpg

The company reported a net unrealized loss of $9.1 billion (pre-tax) on its available-for-sale securities as of June 30, 2025, compared to a net unrealized loss of $10.5 billion (pre-tax) as of June 30, 2024. The year-over-year decrease was primarily due to lower Treasury rates.

The tables attached to this release define and reconcile the non-GAAP measures adjusted income (loss) from operations, adjusted income (loss) from operations available to common stockholders, book value per share excluding AOCI, and adjusted book value per share to net income (loss), net income (loss) available to common stockholders, and book value per share including AOCI, calculated in accordance with GAAP.

This press release contains statements that are forward-looking, and actual results may differ materially. Please see the Forward-looking Statements – Cautionary Language at the end of this release for factors that may cause actual results to differ materially from the company’s current expectations.

For other financial information, please refer to the company’s second quarter 2025 statistical supplement and second quarter 2025 earnings supplement, which are available in the investor relations section of its website http://www.lincolnfinancial.com/investor.

Conference Call Information
Lincoln Financial will discuss the company’s second quarter results with the investment community in a call beginning at 8:00 a.m. Eastern Time on Thursday, July 31, 2025.

The call will be broadcast live through the company’s website at www.lincolnfinancial.com/webcast. Please log on to the webcast at least 15 minutes prior to the start of the call to download and install any necessary streaming media software. A replay of the call will be available by 10:30 a.m. Eastern Time on July 31, 2025, at www.lincolnfinancial.com/webcast.


9


About Lincoln Financial
Lincoln Financial helps people confidently plan for their vision of a successful financial future. As of December 31, 2024, approximately 17 million customers trust our guidance and solutions across four core businesses – annuities, life insurance, group protection, and retirement plan services. As of June 30, 2025, the company had $331 billion in end-of-period account balances, net of reinsurance. Headquartered in Radnor, PA., Lincoln Financial is the marketing name for Lincoln National Corporation (NYSE: LNC) and its affiliates. Learn more at LincolnFinancial.com.
Contacts:
Tina MadonSarah Boxler
Investor RelationsMedia Relations
[email protected][email protected]


10


Non-GAAP Measures

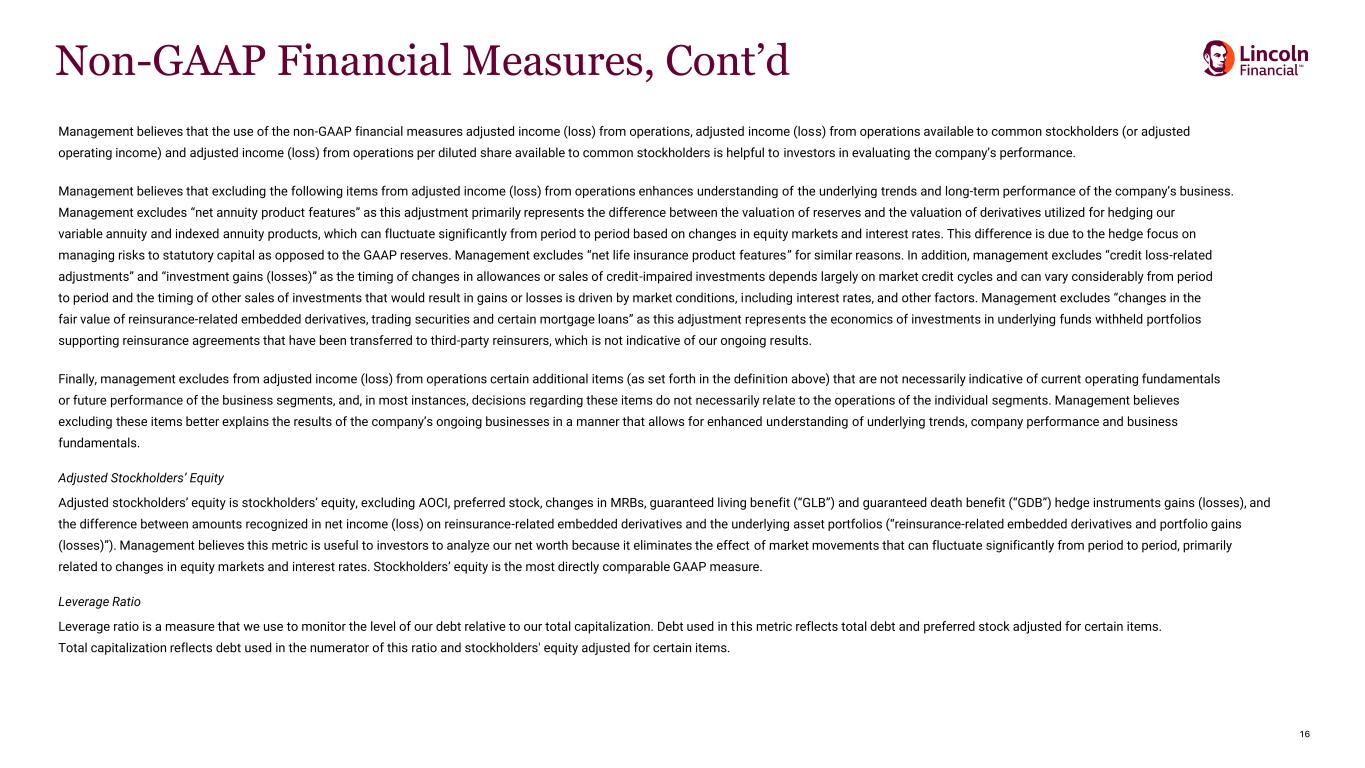
Management believes that the use of the non-GAAP financial measures adjusted income (loss) from operations, adjusted income (loss) from operations available to common stockholders (or adjusted operating income (loss)) and adjusted income (loss) from operations per diluted share available to common stockholders is helpful to investors in evaluating the company’s performance.

Management believes that excluding the following items from adjusted income (loss) from operations enhances understanding of the underlying trends and long-term performance of the company’s business. Management excludes “net annuity product features” as this adjustment primarily represents the difference between the valuation of reserves and the valuation of derivatives utilized for hedging our variable annuity and indexed annuity products, which can fluctuate significantly from period to period based on changes in equity markets and interest rates. This difference is due to the hedge focus on managing risks to statutory capital as opposed to the GAAP reserves. Management excludes “net life insurance product features” for similar reasons. In addition, management excludes “credit loss-related adjustments” and “investment gains (losses)” as the timing of changes in allowances or sales of credit-impaired investments depends largely on market credit cycles and can vary considerably from period to period and the timing of other sales of investments that would result in gains or losses is driven by market conditions, including interest rates, and other factors. Management excludes “changes in the fair value of reinsurance-related embedded derivatives, trading securities and certain mortgage loans” as this adjustment represents the economics of investments in underlying funds withheld portfolios supporting reinsurance agreements that have been transferred to third-party reinsurers, which is not indicative of our ongoing results.

Finally, management excludes from adjusted income (loss) from operations certain additional items (as set forth in the definition below) that are not necessarily indicative of current operating fundamentals or future performance of the business segments, and, in most instances, decisions regarding these items do not necessarily relate to the operations of the individual segments. Management believes excluding these items better explains the results of the company’s ongoing businesses in a manner that allows for enhanced understanding of underlying trends, company performance and business fundamentals.

Management also believes that the use of the non-GAAP financial measures book value per share, excluding accumulated other comprehensive income (“AOCI”), and adjusted book value per share enables investors to analyze the amount of our net worth that is attributable to our business operations. Book value per share, excluding AOCI is useful to investors because it eliminates the effect of items that can fluctuate significantly from period to period, primarily based on changes in interest rates. Adjusted book value per share is useful to investors because it eliminates the effect of items that can fluctuate significantly from period to period, primarily based on changes in equity markets and interest rates.

For the historical periods, reconciliations of non-GAAP measures used in this press release to the most directly comparable GAAP measure may be included in this Appendix to the press release and/or are included in the Statistical Supplements for the corresponding periods contained in the Earnings section of the Investor Relations page on our website: http://www.lincolnfinancial.com/investor.

Definitions of Non-GAAP Measures Used in this Press Release

Adjusted income (loss) from operations, adjusted income (loss) from operations available to common stockholders, book value per share, excluding AOCI, and adjusted book value per share, as used in the press release, are non-GAAP financial measures and do not replace GAAP net income (loss), net income (loss) available to common stockholders, and book value per share, including AOCI, the most directly comparable GAAP measures.

Adjusted Income (Loss) from Operations

In the third quarter of 2024, we revised our definition of adjusted income (loss) from operations to exclude the impact of certain additional items that are not indicative of the ongoing operations of the business and may obscure trends in the underlying performance of the Company. The presentation of prior period adjusted income (loss) from operations was recast for such third quarter 2024 revisions to conform to the current period presentation.

11


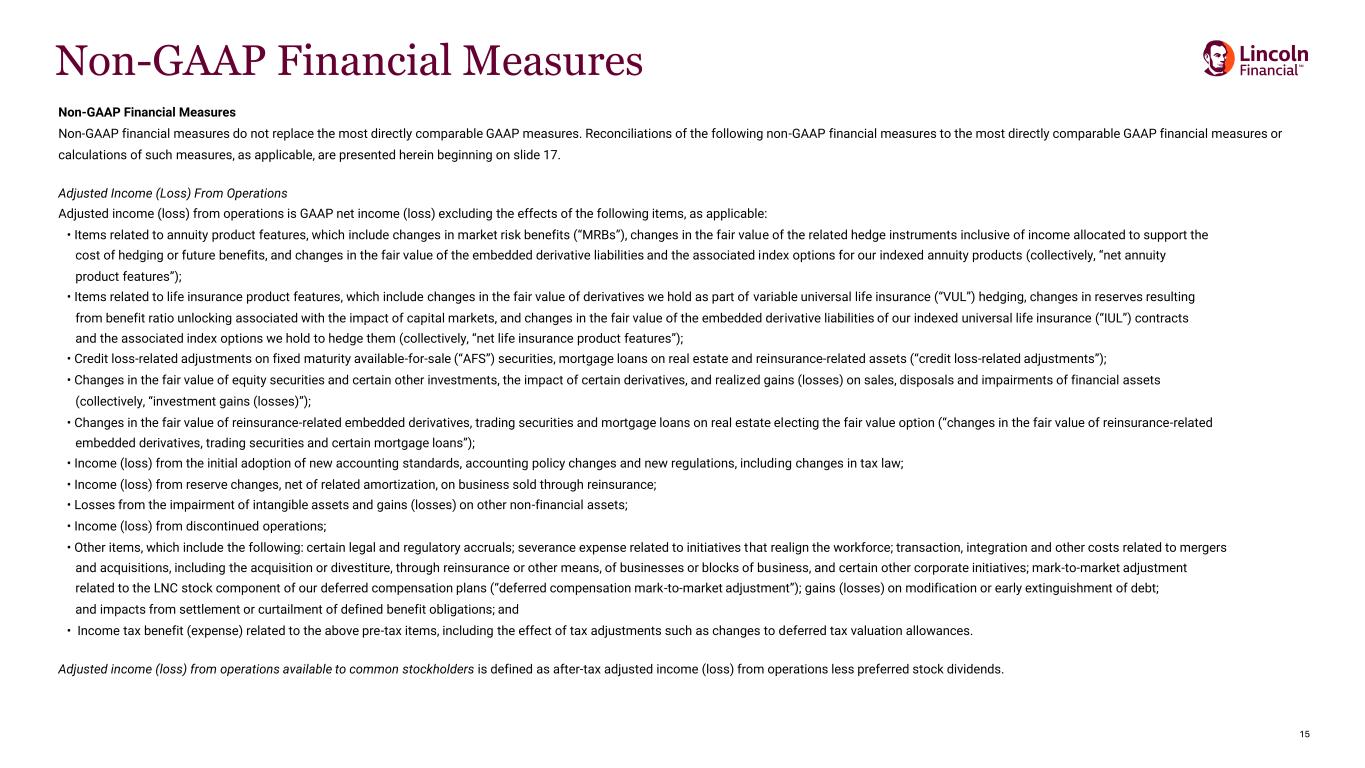
Adjusted income (loss) from operations is GAAP net income (loss) excluding the following items, as applicable:

Items related to annuity product features, which include changes in market risk benefits (“MRBs”), changes in the fair value of the related hedge instruments inclusive of income allocated to support the cost of hedging or future benefits, and changes in the fair value of the embedded derivative liabilities and the associated index options for our indexed annuity products (collectively, “net annuity product features”);
Items related to life insurance product features, which include changes in the fair value of derivatives we hold as part of VUL hedging, changes in reserves resulting from benefit ratio unlocking associated with the impact of capital markets, and changes in the fair value of the embedded derivative liabilities of our IUL contracts and the associated index options we hold to hedge them (collectively, “net life insurance product features”);
Credit loss-related adjustments on fixed maturity AFS securities, mortgage loans on real estate and reinsurance-related assets (“credit loss-related adjustments”);
Changes in the fair value of equity securities and certain other investments, the impact of certain derivatives, and realized gains (losses) on sales, disposals and impairments of financial assets (collectively, “investment gains (losses)”);
Changes in the fair value of reinsurance-related embedded derivatives, trading securities and mortgage loans on real estate electing the fair value option (“changes in the fair value of reinsurance-related embedded derivatives, trading securities and certain mortgage loans”);
Income (loss) from the initial adoption of new accounting standards, accounting policy changes and new regulations, including changes in tax law;
Income (loss) from reserve changes, net of related amortization, on business sold through reinsurance;
Losses from the impairment of intangible assets and gains (losses) on other non-financial assets;
Income (loss) from discontinued operations;
Other items, which include the following: certain legal and regulatory accruals; severance expense related to initiatives that realign the workforce; transaction, integration and other costs related to mergers and acquisitions, including the acquisition or divestiture, through reinsurance or other means, of businesses or blocks of business, and certain other corporate initiatives; mark-to-market adjustment related to the LNC stock component of our deferred compensation plans (“deferred compensation mark-to-market adjustment”); gains (losses) on modification or early extinguishment of debt; and impacts from settlement or curtailment of defined benefit obligations; and
Income tax benefit (expense) related to the above pre-tax items, including the effect of tax adjustments such as changes to deferred tax valuation allowances.

Adjusted Income (Loss) from Operations Available to Common Stockholders

Adjusted income (loss) from operations available to common stockholders is defined as after-tax adjusted income (loss) from operations less preferred stock dividends.

Book Value Per Share, Excluding AOCI

Book value per share, excluding AOCI, is calculated based upon a non-GAAP financial measure.
It is calculated by dividing (a) stockholders’ equity, excluding AOCI and preferred stock, by (b) common shares outstanding.
Book value per share is the most directly comparable GAAP measure.

12


Adjusted Book Value Per Share

Adjusted book value per share is calculated based upon a non-GAAP financial measure.
It is calculated by dividing (a) stockholders’ equity, excluding AOCI, preferred stock, changes in MRBs, guaranteed living benefit (“GLB”) and guaranteed death benefit (“GDB”) hedge instruments gains (losses), and the difference between amounts recognized in net income (loss) on reinsurance-related embedded derivatives and the underlying asset portfolios (“reinsurance-related embedded derivatives and portfolio gains (losses)”) by (b) common shares outstanding.
Book value per share is the most directly comparable GAAP measure.

Other Definitions

Holding Company Available Liquidity

Holding company available liquidity consists of cash and invested cash, excluding cash held as collateral, and certain short-term investments that can be readily converted into cash, net of commercial paper outstanding.

Sales

Sales as reported consist of the following:
Annuities and Retirement Plan Services – deposits from new and existing customers;
Universal life insurance (“UL”), indexed universal life insurance (“IUL”), variable universal life insurance (“VUL”) – first-year commissionable premiums plus 5% of excess premiums received;
MoneyGuard® linked-benefit products – MoneyGuard® (UL) and MoneyGuard Market Advantage® (VUL), 150% of commissionable premiums;
Executive Benefits – insurance and corporate-owned UL and VUL, first-year commissionable premiums plus 5% of excess premium received, and single premium bank-owned UL and VUL, 15% of single premium deposits;
Term – 100% of annualized first-year premiums; and
Group Protection – annualized first-year premiums from new policies.
13


Lincoln National Corporation
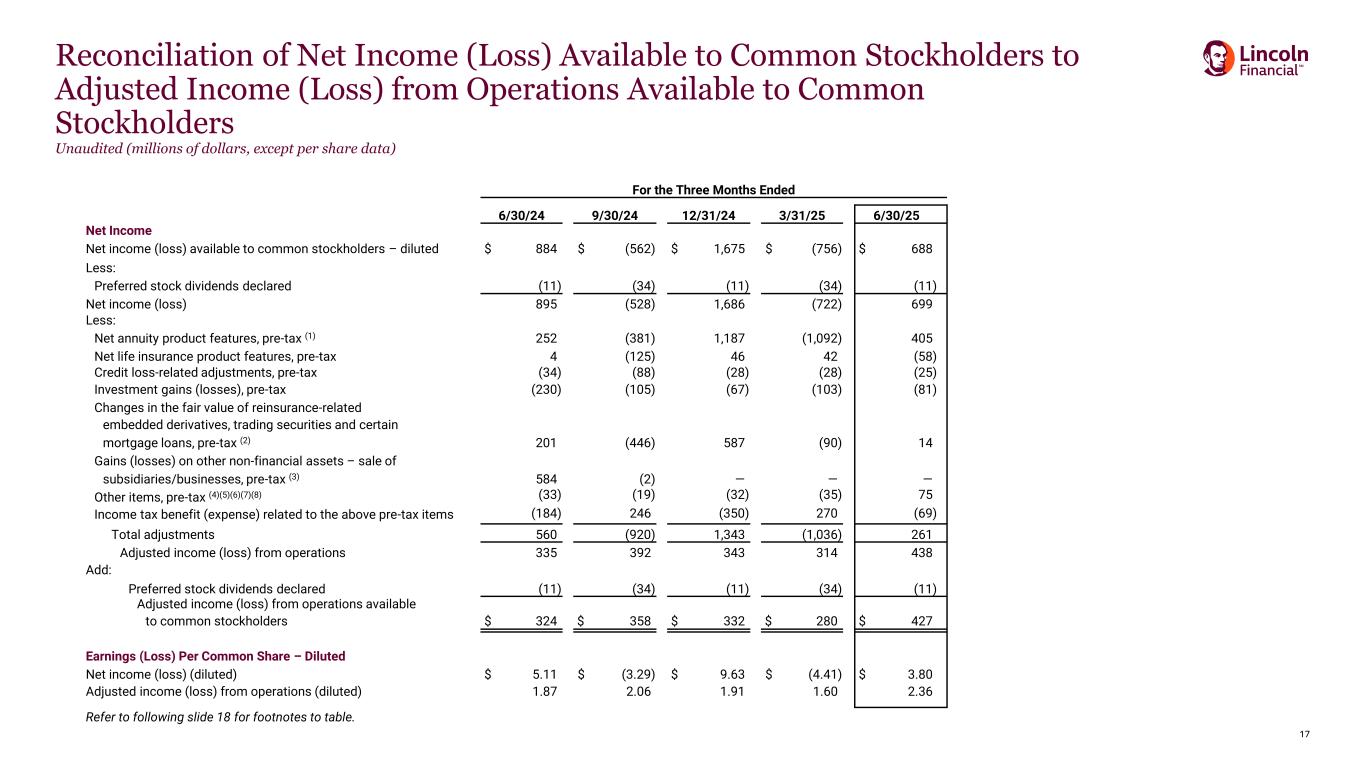
Reconciliation of Net Income (Loss) to Adjusted Income (Loss) from Operations and
Average Stockholders' Equity to Adjusted Average Stockholders' Equity

For theFor the
(in millions, except per share data)Three Months EndedSix Months Ended
June 30,June 30,
2025
2024 (1)
2025
2024 (1)
Net Income (Loss) Available to Common
Stockholders – Diluted$688 $884 $(69)$2,073 
Less:
Preferred stock dividends declared(11)(11)(46)(46)
Adjustment for deferred units of LNC stock in our
deferred compensation plans —  
Net Income (Loss)699 895 (23)2,116 
Less:
Net annuity product features, pre-tax (2)
405 252 (687)1,702 
Net life insurance product features, pre-tax(58)(15)(128)
Credit loss-related adjustments, pre-tax(25)(34)(53)(36)
Investment gains (losses), pre-tax(81)(230)(183)(311)
Changes in the fair value of reinsurance-related
embedded derivatives, trading securities and certain
mortgage loans, pre-tax (3)
14 201 (76)395 
Gains (losses) on other non-financial assets – sale of
subsidiaries/businesses, pre-tax (4)
 584  584 
Other items, pre-tax (5)(6)(7)(8)(9)
75 (33)40 (219)
Income tax benefit (expense) related
to the above pre-tax items(69)(184)199 (451)
Total adjustments261 560 (775)1,536 
Adjusted Income (Loss) from Operations$438 $335 $752 $580 
Add:
Preferred stock dividends declared(11)(11)(46)(46)
Adjusted Income (Loss) from Operations Available to Common Stockholders$427 $324 $706 $534 
Earnings (Loss) Per Common Share – Diluted (10)
Net income (loss)$3.80 $5.11 $(0.39)$12.03 
Adjusted income (loss) from operations2.36 1.87 3.97 3.10 
Stockholders’ Equity, Average
Stockholders' equity$8,871 $7,747 $8,551 $7,483 
Less:
Preferred stock986 986 986 986 
AOCI(4,349)(4,160)(4,510)(3,937)
Stockholders’ equity, excluding AOCI and preferred stock12,234 10,921 12,075 10,434 
Changes in MRBs2,501 2,624 2,575 2,227 
GLB and GDB hedge instruments gains (losses)(3,297)(2,723)(3,162)(2,551)
Reinsurance-related embedded derivatives and portfolio gains (losses)(191)(372)(182)(465)
Adjusted average stockholders' equity$13,221 $11,392 $12,844 $11,223 
(1)    Prior period amounts have been recast to conform to the current period presentation. See definitions of Non-GAAP measures earlier in this release.
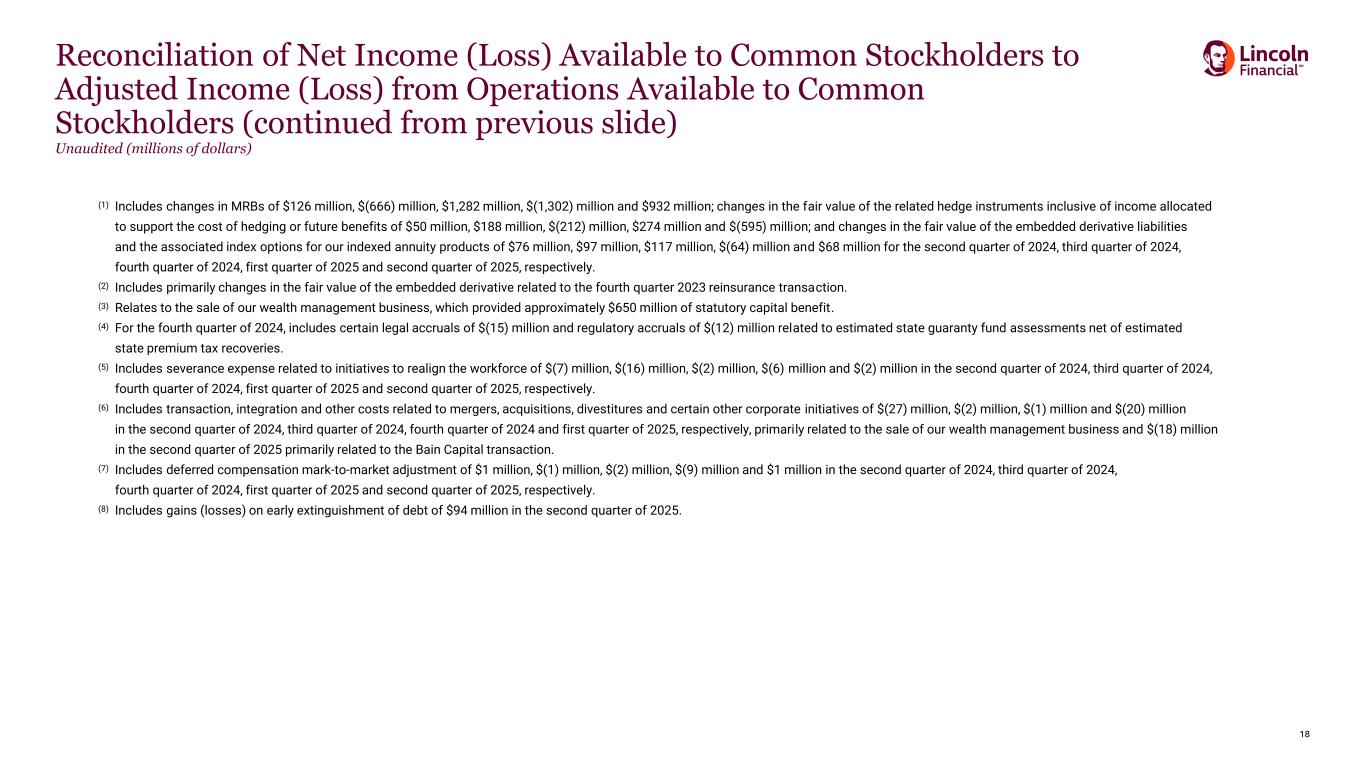
(2)    For the three months ended June 30, 2025 and 2024, includes changes in MRBs of $932 million and $126 million, respectively; changes in the fair value of the related hedge instruments inclusive of income allocated to support the cost of hedging or future benefits of $(595) million and $50 million, respectively; and changes in the fair value of the embedded derivative liabilities and the associated index options for our indexed annuity products of $68 million and $76 million, respectively. For the six months ended June 30, 2025 and 2024, includes changes in MRBs of $(370) million and $2,021 million, respectively; changes in the fair value of the related hedge instruments inclusive of income allocated to support the cost of hedging or future benefits of $(321) million and $(537) million, respectively; and changes in the fair value of the embedded derivative liabilities and the associated index options for our indexed annuity products of $4 million and $218 million, respectively.
14


(3)    Includes primarily changes in the fair value of the embedded derivative related to the fourth quarter 2023 reinsurance transaction.
(4)    Relates to the sale of our wealth management business, which provided approximately $650 million of statutory capital benefit.
(5)    Includes $(114) million for the six months ended June 30, 2024, primarily related to the settlement of cost of insurance litigation in the first quarter of 2024.
(6)    Includes severance expense related to initiatives to realign the workforce of $(2) million and $(7) million for the three months ended June 30, 2025 and 2024, respectively, and $(8) million and $(56) million for the six months ended June 30, 2025 and 2024, respectively.
(7)    Includes transaction, integration and other costs related to mergers, acquisitions, divestitures and certain other corporate initiatives for the three months ended June 30, 2025 and 2024, respectively, of $(18) million primarily related to the Bain Capital transaction and $(27) million related to the sale of our wealth management business; and for the six months ended June 30, 2025 and 2024, respectively, of $(38) million related to the Bain Capital transaction and the sale of our wealth management business and $(37) million primarily related to the sale of our wealth management business.
(8)    Includes deferred compensation mark-to-market adjustment of $1 million for the three months ended June 30, 2025 and 2024, and $(8) million and $(12) million for the six months ended June 30, 2025 and 2024, respectively.
(9)    Includes gains (losses) on early extinguishment of debt of $94 million for the three and six months ended June 30, 2025.
(10)    In periods where a net loss or adjusted loss from operations is presented, basic shares are used in the diluted EPS and adjusted EPS calculations, as the use of diluted shares would result in a lower loss per share.


Lincoln National Corporation
Reconciliation of Book Value per Share
As of the Three Months Ended
6/30/249/30/2412/31/243/31/256/30/25
Book Value Per Common Share             
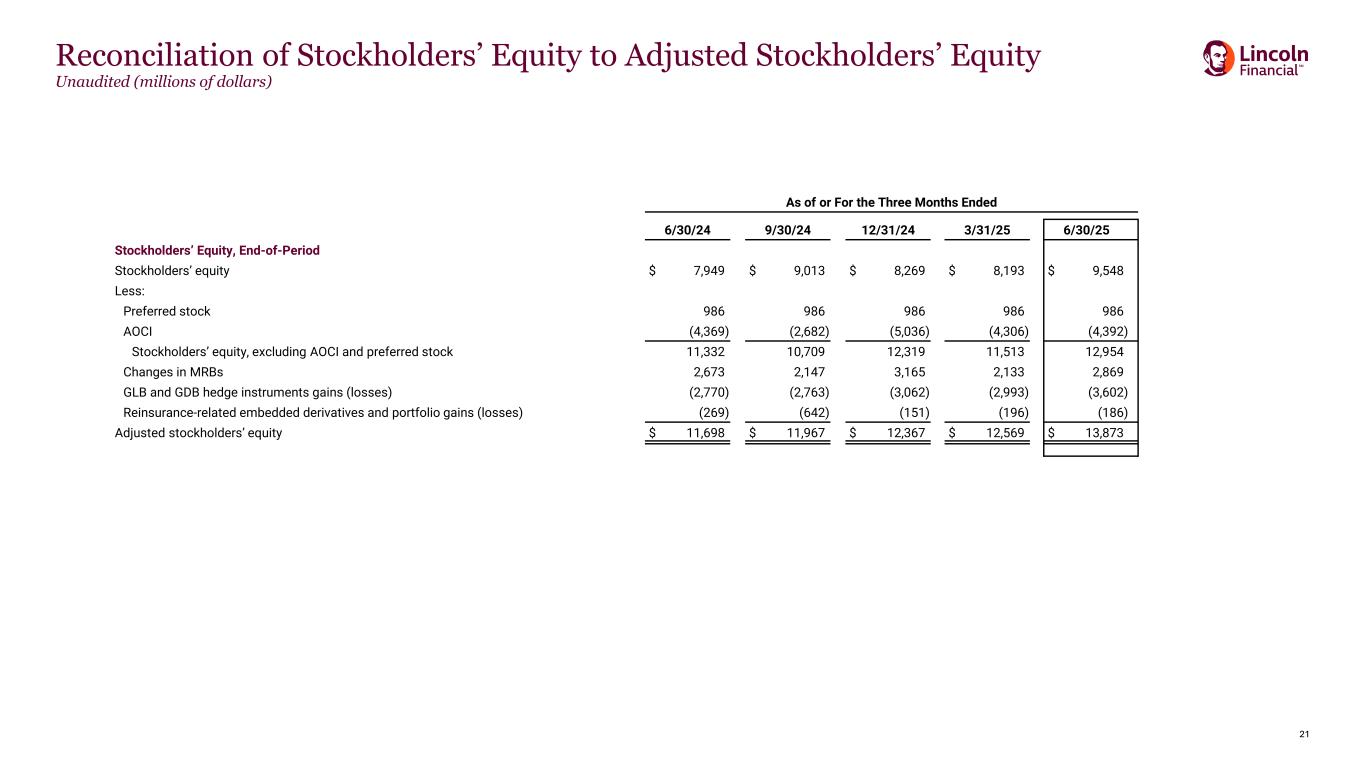
Book value per share$40.78 $46.97 $42.60 $41.96 $44.91 
Less:
AOCI(25.59)(15.70)(29.46)(25.08)(23.04)
Book value per share, excluding AOCI66.37 62.67 72.06 67.04 67.95 
Less:
Changes in MRBs15.66 12.56 18.51 12.42 15.05 
GLB and GDB hedge instruments gains (losses)(16.22)(16.17)(17.91)(17.43)(18.89)
Reinsurance-related embedded derivatives and portfolio gains (losses)(1.58)(3.76)(0.88)(1.14)(0.98)
Adjusted book value per share$68.51 $70.04 $72.34 $73.19 $72.77 


15


Lincoln National Corporation
Digest of Earnings

For theFor the
(in millions, except per share data)Three Months EndedSix Months Ended
June 30,June 30,
2025202420252024
Revenues$4,044 $5,153 $8,735 $9,269 
Net Income (Loss)$699 $895 $(23)$2,116 
Preferred stock dividends declared(11)(11)(46)(46)
Adjustment for deferred units of LNC stock in our
deferred compensation plans (1)
 —  
Net Income (Loss) Available to Common
Stockholders – Diluted$688 $884 $(69)$2,073 
Net Income (Loss) Per Common Share – Basic$3.88 $5.18 $(0.39)$12.16 
Net Income (Loss) Per Common Share – Diluted (2)
$3.80 $5.11 $(0.39)$12.03 
Average Shares – Basic177,175,326 170,620,161174,264,554 170,335,077
Average Shares – Diluted180,602,665 172,892,566177,033,874 172,363,656

(1)    We exclude deferred units of LNC stock that are antidilutive from our diluted earnings per share calculation.
(2)    In periods where a net loss or adjusted loss from operations is presented, basic shares are used in the diluted EPS and adjusted diluted EPS calculations, as the use of diluted shares would result in a lower loss per share.


16


FORWARD-LOOKING STATEMENTS – CAUTIONARY LANGUAGE

Certain statements made in this press release and in other written or oral statements made by Lincoln or on Lincoln’s behalf are “forward-looking statements” within the meaning of the Private Securities Litigation Reform Act of 1995 (“PSLRA”). A forward-looking statement is a statement that is not a historical fact and, without limitation, includes any statement that may predict, forecast, indicate or imply future results, performance or achievements. Forward-looking statements may contain words like: “anticipate,” “believe,” “estimate,” “expect,” “project,” “shall,” “will” and other words or phrases with similar meaning in connection with a discussion of future operating or financial performance. In particular, these include statements relating to future actions, trends in Lincoln’s businesses, prospective services or products, future performance or financial results and the outcome of contingencies, such as legal proceedings. Lincoln claims the protection afforded by the safe harbor for forward-looking statements provided by the PSLRA.

Forward-looking statements are subject to risks and uncertainties. Actual results could differ materially from those expressed in or implied by such forward-looking statements due to a variety of factors, including:

Weak general economic and business conditions that may affect demand for our products, account balances, investment results, guaranteed benefit liabilities, premium levels and claims experience;
Adverse global capital and credit market conditions that may affect our ability to raise capital, if necessary, and may cause us to realize impairments on investments and certain intangible assets, including goodwill and the valuation allowance against deferred tax assets, which may reduce future earnings and/or affect our financial condition and ability to raise additional capital or refinance existing debt as it matures;
The inability of our subsidiaries to pay dividends to the holding company in sufficient amounts, which could harm the holding company’s ability to meet its obligations;
Legislative, regulatory or tax changes, both domestic and foreign, that affect: the cost of, or demand for, our subsidiaries’ products; the required amount of reserves and/or surplus; our ability to conduct business; our affiliate reinsurance arrangements; and restrictions on the payment of revenue sharing and 12b-1 distribution fees;
Changes in tax law or the interpretation of or application of existing tax laws that could impact our tax costs and the products that we sell;
The impact of regulations adopted by the Securities and Exchange Commission (“SEC”), the Department of Labor or other federal or state regulators or self-regulatory organizations that could adversely affect our distribution model and sales of our products and result in additional disclosure and other requirements related to the sale and delivery of our products;
The impact of new and emerging rules, laws and regulations relating to privacy, cybersecurity and artificial intelligence that may lead to increased compliance costs, reputation risk and/or changes in business practices;
Increasing scrutiny and evolving expectations and regulations regarding ESG matters that may adversely affect our reputation and our investment portfolio;
Actions taken by reinsurers to raise rates on in-force business;
Declines in or sustained low interest rates causing a reduction in investment income, the interest margins of our businesses and demand for our products;
Rapidly increasing or sustained high interest rates that may negatively affect our profitability, value of our investment portfolio and capital position and may cause policyholders to surrender annuity and life insurance policies, thereby causing realized investment losses;
The impact of the implementation of the provisions of the European Market Infrastructure Regulation relating to the regulation of derivatives transactions;
The initiation of legal or regulatory proceedings against us, and the outcome of any legal or regulatory proceedings, such as: adverse actions related to present or past business practices common in businesses in which we compete; adverse decisions in significant actions including, but not limited to, actions brought by federal and state authorities and class action cases; new decisions that result in changes in law; and unexpected trial court rulings;
A decline or continued volatility in the equity markets causing a reduction in the sales of our subsidiaries’ products; a reduction of asset-based fees that our subsidiaries charge on various investment and insurance products; and an increase in liabilities related to guaranteed benefit riders, which are accounted for as market risk benefits, of our subsidiaries’ variable annuity products;
Ineffectiveness of our risk management policies and procedures, including our various hedging strategies;
A deviation in actual experience regarding future policyholder behavior, mortality, morbidity, interest rates or equity market returns from the assumptions used in pricing our subsidiaries’ products and in establishing related insurance reserves, which may reduce future earnings;
Changes in accounting principles that may affect our consolidated financial statements;
Lowering of one or more of our debt ratings issued by nationally recognized statistical rating organizations and the adverse effect such action may have on our ability to raise capital and on our liquidity and financial condition;
Lowering of one or more of the insurer financial strength ratings of our insurance subsidiaries and the adverse effect such action may have on the premium writings, policy retention, and profitability of our insurance subsidiaries and liquidity;
Significant credit, accounting, fraud, corporate governance or other issues that may adversely affect the value of certain financial assets, as well as counterparties to which we are exposed to credit risk, requiring that we realize losses on financial assets;
Interruption in or failure of the telecommunication, information technology or other operational systems of the company or the third parties on whom we rely or failure to safeguard the confidentiality or privacy of sensitive data on such systems, including from cyberattacks or other breaches in security of such systems;
The effect of acquisitions and divestitures, including the inability to realize the anticipated benefits of acquisitions and dispositions of businesses and potential operating difficulties and unforeseen liabilities relating thereto, as well as the effect of restructurings, product withdrawals and other unusual items;
The inability to realize or sustain the benefits we expect from, greater than expected investments in, and the potential impact of efforts related to, our strategic initiatives;
The adequacy and collectability of reinsurance that we have obtained;
Pandemics, acts of terrorism, war or other man-made and natural catastrophes that may adversely impact liabilities for policyholder claims and adversely affect our businesses and the cost and availability of reinsurance;
Competitive conditions, including pricing pressures, new product offerings and the emergence of new competitors, that may affect the level of premiums and fees that our subsidiaries can charge for their products;
The unknown effect on our subsidiaries’ businesses resulting from evolving market preferences and the changing demographics of our client base; and
The unanticipated loss of key management or wholesalers.
17


The risks and uncertainties included here are not exhaustive. Our most recent Form 10-K, as well as other reports that we file with the SEC, include additional factors that could affect our businesses and financial performance. Moreover, we operate in a rapidly changing and competitive environment. New risk factors emerge from time to time, and it is not possible for management to predict all such risk factors.

Further, it is not possible to assess the effect of all risk factors on our businesses or the extent to which any factor, or combination of factors, may cause actual results to differ materially from those contained in any forward-looking statements. Given these risks and uncertainties, investors should not place undue reliance on forward-looking statements as a prediction of actual results. In addition, Lincoln disclaims any obligation to correct or update any forward-looking statements to reflect events or circumstances that occur after the date of this press release.

The reporting of Risk-Based Capital (“RBC”) measures is not intended for the purpose of ranking any insurance company or for use in connection with any marketing, advertising or promotional activities.
18

lncrefreshedsmalllogoa.jpg

lncswoopgraphica.jpg


Statistical Supplement

Second Quarter 2025


lncrefreshedsmalllogoa.jpg
Lincoln Financial
Table of Contents
Notes .................................................................................................................................................................................................................................................................
1-3
Credit Ratings ...................................................................................................................................................................................................................................................
Consolidated
Consolidated Statements of Income (Loss) ................................................................................................................................................................................................
Consolidated Balance Sheets .......................................................................................................................................................................................................................
6-7
Earnings, Shares and Return on Equity .........................................................................................................................................................................................................
Key Stakeholder Metrics ...............................................................................................................................................................................................................................
Select Earnings Drivers By Segment ............................................................................................................................................................................................................
Sales By Segment ..........................................................................................................................................................................................................................................
Operating Revenues and General and Administrative Expenses By Segment and Other Operations......................................................................................................
Operating Commissions and Other Expenses .............................................................................................................................................................................................
Select Earnings and Operational Data from Business Segments and Other Operations
Annuities .........................................................................................................................................................................................................................................................
Life Insurance ................................................................................................................................................................................................................................................
Group Protection ............................................................................................................................................................................................................................................
Retirement Plan Services ..............................................................................................................................................................................................................................
DAC and Account Balance Roll Forwards
Consolidated DAC, VOBA, DSI and DFEL Roll Forwards ..............................................................................................................................................................................
Account Balance Roll Forwards:
Annuities ......................................................................................................................................................................................................................................................
20-21
Life Insurance ..............................................................................................................................................................................................................................................
Retirement Plan Services ............................................................................................................................................................................................................................
Investment Information
Fixed-Income Asset Class .............................................................................................................................................................................................................................
Fixed-Income Credit Quality ..........................................................................................................................................................................................................................
GAAP to Non-GAAP Reconciliations
Select GAAP to Non-GAAP Reconciliations .................................................................................................................................................................................................
26-30


Table of Contents
lncrefreshedsmalllogoa.jpg

Lincoln Financial
Notes
Non-GAAP Measures
Non-GAAP measures do not replace the most directly comparable GAAP measures, and we have included detailed reconciliations herein beginning on page 26.
In the third quarter of 2024, we revised our definition of adjusted income (loss) from operations to exclude the impact of certain additional items that are not indicative of the ongoing operations of
the business and may obscure trends in the underlying performance of the Company. The six month period ended June 30, 2024, has been recast for such third quarter 2024 revisions to conform to
the current period presentation.
Adjusted Income (Loss) From Operations
Adjusted income (loss) from operations is GAAP net income (loss) excluding the effects of the following items, as applicable:
• Items related to annuity product features, which include changes in market risk benefits (“MRBs”), changes in the fair value of the related hedge instruments inclusive of income allocated to support the
cost of hedging or future benefits, and changes in the fair value of the embedded derivative liabilities and the associated index options for our indexed annuity products (collectively, “net annuity
product features”);
• Items related to life insurance product features, which include changes in the fair value of derivatives we hold as part of variable universal life insurance (“VUL”) hedging, changes in reserves resulting
from benefit ratio unlocking associated with the impact of capital markets, and changes in the fair value of the embedded derivative liabilities of our indexed universal life insurance (“IUL”) contracts
and the associated index options we hold to hedge them (collectively, “net life insurance product features”);
• Credit loss-related adjustments on fixed maturity available-for-sale (“AFS”) securities, mortgage loans on real estate and reinsurance-related assets (“credit loss-related adjustments”);
• Changes in the fair value of equity securities and certain other investments, the impact of certain derivatives, and realized gains (losses) on sales, disposals and impairments of financial assets
(collectively, “investment gains (losses)”);
• Changes in the fair value of reinsurance-related embedded derivatives, trading securities and mortgage loans on real estate electing the fair value option (“changes in the fair value of reinsurance-related
embedded derivatives, trading securities and certain mortgage loans”);
• Income (loss) from the initial adoption of new accounting standards, accounting policy changes and new regulations, including changes in tax law;
• Income (loss) from reserve changes, net of related amortization, on business sold through reinsurance;
• Losses from the impairment of intangible assets and gains (losses) on other non-financial assets;
• Income (loss) from discontinued operations;
• Other items, which include the following: certain legal and regulatory accruals; severance expense related to initiatives that realign the workforce; transaction, integration and other costs related to mergers
and acquisitions, including the acquisition or divestiture, through reinsurance or other means, of businesses or blocks of business, and certain other corporate initiatives; mark-to-market adjustment
related to the LNC stock component of our deferred compensation plans (“deferred compensation mark-to-market adjustment”); gains (losses) on modification or early extinguishment of debt;
and impacts from settlement or curtailment of defined benefit obligations; and
• Income tax benefit (expense) related to the above pre-tax items, including the effect of tax adjustments such as changes to deferred tax valuation allowances.
Adjusted income (loss) from operations available to common stockholders is defined as after-tax adjusted income (loss) from operations less preferred stock dividends.
Adjusted Operating Revenues
Adjusted operating revenues represent GAAP revenues excluding the effects of the following items, as applicable:
• Changes in the fair value of the derivative instruments we hold to hedge guaranteed living benefit (“GLB”) and guaranteed death benefit (“GDB”) riders inclusive of income allocated to support the cost of
hedging or future benefits, and changes in the fair value of the embedded derivative liabilities and the associated index options for our indexed annuity and IUL products (“revenue adjustments from
annuity and life insurance product features”);
• Credit loss-related adjustments;
• Investment gains (losses);
• Changes in the fair value of reinsurance-related embedded derivatives, trading securities and certain mortgage loans;
• Revenue adjustments from the initial adoption of new accounting standards;
• Amortization of deferred gains arising from reserve changes on business sold through reinsurance; and
• Gains (losses) on other non-financial assets.

1

Table of Contents
lncrefreshedsmalllogoa.jpg
Lincoln Financial
Notes
Non-GAAP Measures, Continued
Management believes that the use of the non-GAAP financial measures adjusted income (loss) from operations, adjusted income (loss) from operations available to common stockholders, adjusted
income (loss) from operations per diluted share available to common stockholders and adjusted operating revenues is helpful to investors in evaluating the company’s performance.
Management believes that excluding the following items from adjusted income (loss) from operations enhances understanding of the underlying trends and long-term performance of the company’s business.
Management excludes “net annuity product features” as this adjustment primarily represents the difference between the valuation of reserves and the valuation of derivatives utilized for hedging our
variable annuity and indexed annuity products, which can fluctuate significantly from period to period based on changes in equity markets and interest rates. This difference is due to the hedge focus on
managing risks to statutory capital as opposed to the GAAP reserves. Management excludes “net life insurance product features” for similar reasons. In addition, management excludes “credit loss-related
adjustments” and “investment gains (losses)” as the timing of changes in allowances or sales of credit-impaired investments depends largely on market credit cycles and can vary considerably from period
to period and the timing of other sales of investments that would result in gains or losses is driven by market conditions, including interest rates, and other factors. Management excludes “changes in the
fair value of reinsurance-related embedded derivatives, trading securities and certain mortgage loans” as this adjustment represents the economics of investments in underlying funds withheld portfolios
supporting reinsurance agreements that have been transferred to third-party reinsurers, which is not indicative of our ongoing results.
Finally, management excludes from adjusted income (loss) from operations certain additional items (as set forth in the definition above) that are not necessarily indicative of current operating fundamentals
or future performance of the business segments, and, in most instances, decisions regarding these items do not necessarily relate to the operations of the individual segments. Management believes
excluding these items better explains the results of the company’s ongoing businesses in a manner that allows for enhanced understanding of underlying trends, company performance and business
fundamentals.
Stockholders’ Equity, Excluding AOCI and Preferred Stock
Stockholders’ equity, excluding accumulated other comprehensive income (loss) (“AOCI”) and preferred stock is stockholders’ equity, excluding AOCI and preferred stock. Management believes this metric is
useful to investors to analyze our net worth because it eliminates market movements that can fluctuate significantly from period to period, primarily related to changes in interest rates. Stockholders’ equity
is the most directly comparable GAAP measure.
Adjusted Stockholders’ Equity
Adjusted stockholders’ equity is stockholders’ equity, excluding AOCI, preferred stock, changes in MRBs, GLB and GDB hedge instruments gains (losses), and the difference between amounts
recognized in net income (loss) on reinsurance-related embedded derivatives and the underlying asset portfolios (“reinsurance-related embedded derivatives and portfolio gains (losses)”). Management
believes this metric is useful to investors to analyze our net worth because it eliminates the effect of market movements that can fluctuate significantly from period to period, primarily related to changes
in equity markets and interest rates. Stockholders’ equity is the most directly comparable GAAP measure.
Book Value per Share, Excluding AOCI
Book value per share, excluding AOCI, is calculated by dividing stockholders’ equity, excluding AOCI and preferred stock, by common shares outstanding. Management believes that using book value
per share, excluding AOCI enables investors to analyze the amount of our net worth that is attributable to our business operations. Book value per share, excluding AOCI, is useful to investors because
it eliminates the effect of items that can fluctuate significantly from period to period, primarily based on changes in interest rates. Book value per share is the most directly comparable GAAP measure.
Adjusted Book Value per Share
Adjusted book value per share is calculated by dividing adjusted stockholders’ equity by common shares outstanding. Management believes that using adjusted book value per share enables investors to
analyze the amount of our net worth that is attributable to our business operations. Adjusted book value per share is useful to investors because it eliminates the effect of items that can fluctuate
significantly from period to period, primarily based on changes in equity markets and interest rates. Book value per share is the most directly comparable GAAP measure.
Adjusted Income (Loss) From Operations Available to Common Stockholders, Excluding AOCI and Preferred Stock ROE
Adjusted income (loss) from operations available to common stockholders, excluding AOCI and preferred stock ROE is calculated by dividing annualized adjusted income (loss) from operations available
to common stockholders by average stockholders’ equity, excluding AOCI and preferred stock. Management believes this metric is useful to investors because it eliminates the effect of market movements
on ROE that can fluctuate significantly from period to period, primarily related to changes in interest rates. Net income (loss) ROE is the most directly comparable GAAP measure.
2

Table of Contents
lncrefreshedsmalllogoa.jpg
Lincoln Financial
Notes
Non-GAAP Measures, Continued
Adjusted Income (Loss) From Operations ROE
Adjusted income (loss) from operations ROE is calculated by dividing annualized adjusted income (loss) from operations available to common stockholders by adjusted average stockholders’ equity.
Management believes this metric is useful to investors because it eliminates the effect of market movements on ROE that can fluctuate significantly from period to period, primarily related to changes
in equity markets and interest rates. Net income (loss) ROE is the most directly comparable GAAP measure.
Computations
• The quarterly financial information for the current year may not sum to the corresponding year-to-date amount as both are rounded to millions.
• The financial ratios reported herein are calculated using whole dollars instead of dollars rounded to millions.
• We exclude deferred units of LNC stock that are antidilutive from our diluted net income (loss) earnings per share calculation. In addition, for any period where a net loss or adjusted loss from operations
   is experienced, shares used in the diluted EPS calculation represent basic shares, as the use of diluted shares would result in a lower loss per share.
Definitions
Holding company available liquidity consists of cash and invested cash, excluding cash held as collateral, and certain short-term investments that can be readily converted into cash, net of commercial paper
outstanding.
Return on equity (“ROE”) measures how efficiently we generate profits from the resources provided by our net assets. See adjusted income (loss) from operations ROE above and adjusted income (loss) from
operations available to common stockholders, excluding AOCI and preferred stock ROE on page 2 for further information on how these metrics are calculated. Management evaluates consolidated ROE by both
including and excluding the effect of average goodwill.
Leverage ratio is a measure that we use to monitor the level of our debt relative to our total capitalization. Debt used in this metric reflects total debt and preferred stock adjusted for certain items.
Total capitalization reflects debt used in the numerator of this ratio and stockholders' equity adjusted for certain items.
Sales as reported consist of the following:
• Annuities and Retirement Plan Services – deposits from new and existing customers;
• Universal life insurance (“UL”), IUL, VUL – first-year commissionable premiums plus 5% of excess premiums received;
MoneyGuard® linked-benefit products – MoneyGuard® (UL) and MoneyGuard Market AdvantageSM (VUL), 150% of commissionable premiums;
• Executive Benefits – insurance and corporate-owned UL and VUL, first-year commissionable premiums plus 5% of excess premium received, and single premium bank-owned UL and VUL, 15% of
single premium deposits;
• Term – 100% of annualized first-year premiums; and
• Group Protection – annualized first-year premiums from new policies.
Statistical Supplement is Dated
This document is dated July 31, 2025, and has not been updated since that date. Lincoln Financial does not intend to update this document.
3

Table of Contents
lncrefreshedsmalllogoa.jpg
Lincoln Financial
Credit Ratings
Ratings as of July 31, 2025
Standard
AM BestFitchMoody's& Poor's
Senior Debt Ratingsbbb+BBB+Baa2BBB+
Financial Strength Ratings
The Lincoln National Life Insurance CompanyAA+A2A+
First Penn-Pacific Life Insurance CompanyAA+A2A-
Lincoln Life & Annuity Company of New YorkAA+A2A+
Investor Inquiries May Be Directed To:
Tina Madon, Senior Vice President,
Investor Relations
Email: [email protected]
Phone: 800-237-2920


4

Table of Contents
lncrefreshedsmalllogoa.jpg
Lincoln Financial
Consolidated Statements of Income (Loss)
Unaudited (millions of dollars, except per share data)
For the Three Months EndedFor the Six Months Ended
6/30/249/30/2412/31/243/31/256/30/25Change6/30/246/30/25Change
Revenues
Insurance premiums$1,625 $1,614 $1,586 $1,676 $1,682 3.5 %$3,226 $3,358 4.1 %
Fee income1,339 1,352 1,387 1,365 1,340 0.1 %2,662 2,706 1.7 %
Net investment income1,332 1,411 1,435 1,457 1,466 10.1 %2,679 2,924 9.1 %
Realized gain (loss)663 (431)470 11 (641)NM230 (631)NM
Other revenues194 165 185 182 197 1.5 %472 378 -19.9 %
Total revenues5,153 4,111 5,063 4,691 4,044 -21.5 %9,269 8,735 -5.8 %
Expenses
Benefits2,008 1,937 1,970 2,068 1,994 -0.7 %4,011 4,062 1.3 %
Interest credited853 880 888 890 916 7.4 %1,675 1,805 7.8 %
Market risk benefit (gain) loss(136)657 (1,291)1,293 (940)NM(2,043)353 117.3 %
Policyholder liability remeasurement (gain) loss(105)(50)(23)(59)(88)16.2 %(117)(146)-24.8 %
Commissions and other expenses1,351 1,304 1,336 1,368 1,327 -1.8 %2,951 2,695 -8.7 %
Interest and debt expense86 86 83 80 (13)NM167 67 -59.9 %
Total expenses4,057 4,814 2,963 5,640 3,196 -21.2 %6,644 8,836 33.0 %
Income (loss) before taxes1,096 (703)2,100 (949)848 -22.6 %2,625 (101)NM
Federal income tax expense (benefit)201 (175)414 (227)149 -25.9 %509 (78)NM
Net income (loss)895 (528)1,686 (722)699 -21.9 %2,116 (23)NM
Preferred stock dividends declared(11)(34)(11)(34)(11)0.0%(46)(46)0.0%
Adjustment for deferred units of LNC stock
in our deferred compensation plans— — — — — NM— -100.0 %
Net income (loss) available to common
stockholders – diluted$884 $(562)$1,675 $(756)$688 -22.2 %$2,073 $(69)NM
Earnings (Loss) Per Common Share – Diluted
Net income (loss)$5.11 $(3.29)$9.63 $(4.41)$3.80 -25.6 %$12.03 $(0.39)NM
5

Table of Contents
lncrefreshedsmalllogoa.jpg
Lincoln Financial
Consolidated Balance Sheets
Unaudited (millions of dollars)
As of
6/30/249/30/2412/31/243/31/256/30/25Change
ASSETS
Investments:
Fixed maturity available-for-sale (“AFS”) securities, net of allowance for
credit losses:
Corporate bonds$67,313 $70,234 $66,450 $66,885 $67,371 0.1%
U.S. government bonds389 398 391 538 564 45.0%
State and municipal bonds2,564 2,567 2,371 2,350 2,254 -12.1%
Foreign government bonds260 252 237 239 239 -8.1%
Residential mortgage-backed securities1,795 1,882 1,863 1,941 2,063 14.9%
Commercial mortgage-backed securities1,542 1,643 1,665 1,830 1,972 27.9%
Asset-backed securities13,072 13,444 13,880 14,241 14,658 12.1%
Hybrid and redeemable preferred securities239 262 254 273 265 10.9%
Total fixed maturity AFS securities, net of allowance for credit losses87,174 90,682 87,111 88,297 89,386 2.5%
Trading securities2,201 2,206 2,025 1,984 1,909 -13.3%
Equity securities295 293 294 345 341 15.6%
Mortgage loans on real estate, net of allowance for credit losses20,152 20,856 21,083 21,558 21,996 9.2%
Policy loans2,513 2,510 2,476 2,529 2,552 1.6%
Derivative investments8,608 9,522 9,677 7,849 8,349 -3.0%
Other investments5,652 5,743 6,588 6,653 6,611 17.0%
Total investments126,595 131,812 129,254 129,215 131,144 3.6%
Cash and invested cash5,475 6,013 5,801 4,284 7,143 30.5%
Deferred acquisition costs, value of business acquired and deferred sales inducements12,435 12,475 12,537 12,563 12,604 1.4%
Reinsurance recoverables, net of allowance for credit losses29,126 29,233 28,750 28,580 28,440 -2.4%
Deposit assets, net of allowance for credit losses30,330 30,938 30,776 31,048 31,754 4.7%
Market risk benefit assets4,754 4,565 4,860 4,157 4,577 -3.7%
Accrued investment income1,135 1,160 1,108 1,134 1,136 0.1%
Goodwill1,144 1,144 1,144 1,144 1,144 0.0%
Other assets8,340 8,017 8,163 8,267 8,181 -1.9%
Separate account assets165,199 171,483 168,438 162,506 172,942 4.7%
Total assets$384,533 $396,840 $390,831 $382,898 $399,065 3.8%
6

Table of Contents
lncrefreshedsmalllogoa.jpg
Lincoln Financial
Consolidated Balance Sheets
Unaudited (millions of dollars)
As of
6/30/249/30/2412/31/243/31/256/30/25Change
LIABILITIES AND STOCKHOLDERS’ EQUITY
Liabilities
Policyholder account balances$124,113 $125,968 $126,197 $125,262 $129,209 4.1 %
Future contract benefits38,560 41,169 39,807 40,665 41,053 6.5 %
Funds withheld reinsurance liabilities17,044 17,595 16,907 16,838 16,700 -2.0 %
Market risk benefit liabilities1,275 1,272 1,046 1,306 1,205 -5.5 %
Deferred front-end loads6,306 6,517 6,730 6,910 7,119 12.9 %
Payables for collateral on investments11,114 10,570 10,020 8,282 8,466 -23.8 %
Short-term debt450 300 300 — — -100.0 %
Long-term debt by rating agency leverage definitions:
Operating (see note (1) on page 9 for details)
867 867 868 868 868 0.1 %
Financial4,849 5,030 4,988 5,000 4,899 1.0 %
Other liabilities6,807 7,056 7,261 7,068 7,056 3.7 %
Separate account liabilities165,199 171,483 168,438 162,506 172,942 4.7 %
Total liabilities376,584 387,827 382,562 374,705 389,517 3.4 %
Stockholders’ Equity
Preferred stock986 986 986 986 986 0.0%
Common stock4,641 4,660 4,674 4,703 5,545 19.5 %
Retained earnings6,691 6,049 7,645 6,810 7,409 10.7 %
Accumulated other comprehensive income (loss):
Unrealized investment gain (loss)(5,253)(3,565)(5,601)(5,078)(4,750)9.6 %
Market risk benefit non-performance risk gain (loss)409 781 146 464 114 -72.1 %
Policyholder liability discount rate remeasurement gain (loss)795 422 744 633 569 -28.4 %
Foreign currency translation adjustment(27)(18)(29)(24)(14)48.1 %
Funded status of employee benefit plans(293)(302)(296)(301)(311)-6.1 %
Total accumulated other comprehensive income (loss)(4,369)(2,682)(5,036)(4,306)(4,392)-0.5 %
Total stockholders’ equity7,949 9,013 8,269 8,193 9,548 20.1 %
Total liabilities and stockholders’ equity$384,533 $396,840 $390,831 $382,898 $399,065 3.8 %
7

Table of Contents
lncrefreshedsmalllogoa.jpg
Lincoln Financial
Earnings, Shares and Return on Equity
Unaudited (millions of dollars, except per share data)
As of or For the Three Months EndedAs of or For the Six Months Ended
6/30/249/30/2412/31/243/31/256/30/25Change6/30/246/30/25Change
Income (Loss)
Net income (loss)$895 $(528)$1,686 $(722)$699 -21.9 %$2,116 $(23)NM
Pre-tax adjusted income (loss) from operations (1)
389 461 400 362 517 32.9 %680 879 29.3 %
After-tax adjusted income (loss) from operations (1)(2)
335 392 343 314 438 30.7 %580 752 29.7 %
Adjusted operating tax rate (1)
13.7 %15.0 %14.1 %13.3 %15.4 %14.7 %14.4 %
Adjusted income (loss) from operations available to
common stockholders (1)
324 358 332 280 427 31.8 %534 706 32.2 %
ROE
Net income (loss) ROE46.2 %-24.9 %78.1 %-35.1 %31.5 %56.6 %-0.5 %
Adjusted income (loss) from operations available to common
stockholders, excluding AOCI and preferred stock ROE (1)
11.9 %13.0 %11.5 %9.4 %14.0 %10.2 %11.7 %
Adjusted income (loss) from operations ROE (1)
11.4 %12.1 %10.9 %9.0 %12.9 %9.5 %11.0 %
Per Common Share
Net income (loss) (diluted)$5.11 $(3.29)$9.63 $(4.41)$3.80 -25.6 %$12.03 $(0.39)NM
Adjusted income (loss) from operations (diluted) (1)(3)
1.87 2.06 1.91 1.60 2.36 26.2 %3.10 3.97 28.1 %
Dividends declared during the period0.45 0.45 0.45 0.45 0.45 0.0%0.90 0.90 0.0%
Book Value Per Common Share
Book value per share$40.78 $46.97 $42.60 $41.96 $44.91 10.1 %$40.78 $44.91 10.1 %
Book value per share, excluding AOCI (4)
66.37 62.67 72.06 67.04 67.95 2.4 %66.37 67.95 2.4 %
Adjusted book value per share (4)
68.51 70.04 72.34 73.19 72.77 6.2 %68.51 72.77 6.2 %
Common Shares
End-of-period – basic170.7 170.9 171.0 171.7 190.6 11.7 %170.7 190.6 11.7 %
Average for the period – basic170.6 170.8 170.9 171.3 177.2 3.9 %170.3 174.3 2.3 %
End-of-period – diluted (1)
173.4 173.6 174.1 175.3 194.0 11.9 %173.4 194.0 11.9 %
Average for the period – diluted (1)
172.9 173.6 174.0 174.7 180.6 4.5 %172.4 177.7 3.1 %
(1) The six month period ended June 30, 2024, has been recast to conform to the current period presentation. See page 1 for further information.
(2) See reconciliation to net income (loss) on page 26.
(3) See reconciliation to earnings (loss) per common share – diluted on page 28.
(4) See reconciliation to stockholders’ equity and book value per common share on page 30.
8

Table of Contents
lncrefreshedsmalllogoa.jpg
Lincoln Financial
Key Stakeholder Metrics
Unaudited (millions of dollars, except per share data)
As of or For the Three Months EndedFor the Six Months Ended
6/30/249/30/2412/31/243/31/256/30/25Change6/30/246/30/25Change
Cash Returned to Common Stockholders – Common Dividends$77 $77 $77 $77 $77 0.0%$153 $154 0.7 %
Cash Returned to Preferred Stockholders – Preferred Dividends$11 $34 $11 $34 $11 0.0%$46 $46 0.0%
Leverage Ratio
Short-term debt$450 $300 $300 $— $— -100.0 %
Long-term debt5,716 5,897 5,856 5,868 5,767 0.9 %
Total debt6,166 6,197 6,156 5,868 5,767 -6.5 %
Preferred stock986 986 986 986 986 0.0%
Total debt and preferred stock7,152 7,183 7,142 6,854 6,753 -5.6 %
Less:
Operating debt (1)
867 867 868 868 868 0.1 %
Pre-funding of upcoming debt maturities300 300 300 — — -100.0 %
25% of capital securities and subordinated notes302 302 302 302 247 -18.2 %
50% of preferred stock493 493 493 493 493 0.0%
Carrying value of fair value hedges and other items123 153 111 122 119 -3.3 %
Total numerator$5,067 $5,068 $5,068 $5,069 $5,026 -0.8 %
Adjusted stockholders’ equity (2)
$11,698 $11,967 $12,367 $12,569 $13,873 18.6 %
Add:
25% of capital securities and subordinated notes302 302 302 302 247 -18.2 %
50% of preferred stock493 493 493 493 493 0.0%
Total numerator5,067 5,068 5,068 5,069 5,026 -0.8 %
Total denominator$17,560 $17,830 $18,230 $18,433 $19,639 11.8 %
Leverage ratio28.9 %28.4 %27.8 %27.5 %25.6 %
Holding Company Available Liquidity (3)
$763 $759 $763 $466 $466 -38.9 %
(1) We have categorized as operating debt the senior notes issued in October 2007 and June 2010 because the proceeds were used as a long-term structured solution to reduce
     the strain on increasing statutory reserves associated with secondary guarantee UL and term policies.
(2) See reconciliation to stockholders’ equity on page 30.
(3) Includes pre-funding of upcoming debt maturities.
9

Table of Contents
lncrefreshedsmalllogoa.jpg
Lincoln Financial
Select Earnings Drivers By Segment
Unaudited (millions of dollars)
For the Three Months EndedFor the Six Months Ended
6/30/249/30/2412/31/243/31/256/30/25Change6/30/246/30/25Change
Annuities
Operating revenues$1,209 $1,195 $1,223 $1,198 $1,214 0.4 %$2,477 $2,412 -2.6 %
Deposits3,823 3,383 3,692 3,799 4,024 5.3 %6,672 7,823 17.3 %
Net flows(954)(1,637)(1,891)(1,676)(1,162)-21.8 %(2,946)(2,838)3.7 %
Average account balances, net of reinsurance158,370 161,680 165,424 163,688 159,806 0.9 %156,531 161,877 3.4 %
Alternative investment income (1)
200.0 %50.0 %
Life Insurance
Operating revenues$1,511 $1,589 $1,608 $1,587 $1,602 6.0 %$3,052 $3,188 4.5 %
Deposits1,230 1,262 1,402 1,218 1,281 4.1 %2,438 2,500 2.5 %
Net flows751 738 930 569 633 -15.7 %1,492 1,202 -19.4 %
Average account balances, net of reinsurance43,230 44,055 44,746 44,390 45,651 5.6 %42,755 45,020 5.3 %
Average in-force face amount1,085,383 1,083,176 1,080,074 1,074,858 1,069,688 -1.4 %1,086,394 1,072,273 -1.3 %
Alternative investment income (1)
32 92 96 70 94 193.8 %106 163 53.8 %
Group Protection
Operating revenues$1,441 $1,432 $1,418 $1,521 $1,538 6.7 %$2,867 $3,059 6.7 %
Insurance premiums1,298 1,288 1,274 1,371 1,386 6.8 %2,583 2,757 6.7 %
Alternative investment income (1)
100.0 %50.0 %
Retirement Plan Services
Operating revenues$327 $335 $337 $327 $331 1.2 %$649 $658 1.4 %
Deposits3,282 4,180 3,473 4,115 3,594 9.5 %7,085 7,709 8.8 %
Net flows(197)651 (732)(2,184)(585)NM194 (2,768)NM
Average account balances106,374 110,550 113,711 113,075 111,734 5.0 %104,518 112,772 7.9 %
Alternative investment income (1)
100.0 %100.0 %
Consolidated
Adjusted operating revenues (2)
$4,527 $4,603 $4,628 $4,685 $4,726 4.4 %$9,111 $9,411 3.3 %
Deposits8,335 8,825 8,567 9,132 8,899 6.8 %16,195 18,032 11.3 %
Net flows(400)(248)(1,693)(3,291)(1,114)NM(1,260)(4,404)NM
Average account balances, net of reinsurance307,974 316,285 323,881 321,153 317,191 3.0 %303,804 319,669 5.2 %
Alternative investment income (1)
36 100 105 75 101 180.6 %114 176 54.4 %
(1) Excludes alternative investment income on investments supporting our modified coinsurance and coinsurance with funds withheld agreements as we have a limited
    economic interest in the investments.
(2) See reconciliation to total revenues on page 27.
10

Table of Contents
lncrefreshedsmalllogoa.jpg
Lincoln Financial
Sales By Segment
Unaudited (millions of dollars)
For the Three Months EndedFor the Six Months Ended
6/30/249/30/2412/31/243/31/256/30/25Change6/30/246/30/25Change
Sales
Annuities:
RILA$1,096 $1,203 $1,285 $1,292 $1,447 32.0 %$2,038 $2,739 34.4 %
Fixed1,667 1,009 560 863 1,221 -26.8 %2,637 2,083 -21.0 %
Traditional variable with GLBs634 691 1,243 1,099 935 47.5 %1,179 2,033 72.4 %
Traditional variable without GLBs420 472 601 535 416 -1.0 %809 952 17.7 %
Total Annuities$3,817 $3,375 $3,689 $3,789 $4,019 5.3 %$6,663 $7,807 17.2 %
Life Insurance:
IUL/UL$25 $32 $26 $24 $28 12.0 %$43 $52 20.9 %
MoneyGuard®
34 35 35 28 29 -14.7 %58 58 0.0%
VUL19 22 21 15 15 -21.1 %43 30 -30.2 %
Term18 15 13 13 15 -16.7 %37 28 -24.3 %
Executive Benefits18 24 17 34 277.8 %16 50 212.5 %
Total Life Insurance$105 $122 $119 $97 $121 15.2 %$197 $218 10.7 %
Group Protection:
Life$81 $42 $184 $101 $104 28.4 %$167 $205 22.8 %
Disability74 36 253 48 70 -5.4 %125 118 -5.6 %
Dental30 13 116.7 %14 21 50.0 %
Total Group Protection$161 $84 $467 $157 $187 16.1 %$306 $344 12.4 %
Percent employee-paid50.0 %52.8 %34.3 %72.3 %58.7 %59.6 %64.9 %
Retirement Plan Services:
First-year sales$821 $1,652 $1,273 $1,104 $1,222 48.8 %$1,949 $2,326 19.3 %
Recurring deposits2,461 2,528 2,200 3,011 2,372 -3.6 %5,136 5,383 4.8 %
Total Retirement Plan Services$3,282 $4,180 $3,473 $4,115 $3,594 9.5 %$7,085 $7,709 8.8 %
11

Table of Contents
lncrefreshedsmalllogoa.jpg
Lincoln Financial
Operating Revenues and General and Administrative Expenses By Segment and Other Operations
Unaudited (millions of dollars)
For the Three Months EndedFor the Six Months Ended
6/30/249/30/2412/31/243/31/256/30/25Change6/30/246/30/25Change
Operating Revenues
Annuities$1,209 $1,195 $1,223 $1,198 $1,214 0.4 %$2,477 $2,412 -2.6 %
Life Insurance1,511 1,589 1,608 1,587 1,602 6.0 %3,052 3,188 4.5 %
Group Protection1,441 1,432 1,418 1,521 1,538 6.7 %2,867 3,059 6.7 %
Retirement Plan Services327 335 337 327 331 1.2 %649 658 1.4 %
Other Operations39 52 42 52 41 5.1 %66 94 42.4 %
Total adjusted operating revenues$4,527 $4,603 $4,628 $4,685 $4,726 4.4 %$9,111 $9,411 3.3 %
General and Administrative Expenses,
Net of Amounts Capitalized
Annuities$112 $103 $112 $108 $110 -1.8 %$246 $218 -11.4 %
Life Insurance125 126 129 119 122 -2.4 %256 241 -5.9 %
Group Protection193 195 195 202 206 6.7 %380 408 7.4 %
Retirement Plan Services80 81 82 81 80 0.0%161 161 0.0%
Other Operations (1)
64 67 70 65 55 -14.1 %120 120 0.0%
Total (1)
$574 $572 $588 $575 $573 -0.2 %$1,163 $1,148 -1.3 %
General and Administrative Expenses,
Net of Amounts Capitalized, as a Percentage
of Operating Revenues
Annuities9.3 %8.6 %9.2 %9.0 %9.1 %9.9 %9.0 %
Life Insurance8.3 %7.9 %8.0 %7.5 %7.6 %8.4 %7.6 %
Group Protection13.4 %13.6 %13.8 %13.3 %13.4 %13.3 %13.3 %
Retirement Plan Services24.4 %24.3 %24.3 %24.9 %24.1 %24.8 %24.5 %
Total (1)
12.7 %12.4 %12.7 %12.3 %12.1 %12.8 %12.2 %
(1) The six month period ended June 30, 2024, has been recast to conform to the current period presentation. See page 1 for further information.
12

Table of Contents
lncrefreshedsmalllogoa.jpg

Lincoln Financial
Operating Commissions and Other Expenses
Unaudited (millions of dollars)
For the Three Months EndedFor the Six Months Ended
6/30/249/30/2412/31/243/31/256/30/25Change6/30/246/30/25Change
Operating Commissions and
Other Expenses Incurred
General and administrative expenses (1)
$638 $632 $650 $629 $627 -1.7 %$1,278 $1,256 -1.7 %
Commissions561 546 575 558 570 1.6 %1,200 1,127 -6.1 %
Taxes, licenses and fees (1)
76 80 75 98 80 5.3 %168 178 6.0 %
Interest and debt expense86 86 83 80 81 -5.8 %167 161 -3.6 %
Expenses associated with reserve financing
and letters of credit28 32 36 32 33 17.9 %58 65 12.1 %
Total adjusted operating commissions and
other expenses incurred (1)
1,389 1,376 1,419 1,397 1,391 0.1 %2,871 2,787 -2.9 %
Less Amounts Capitalized
General and administrative expenses(64)(60)(62)(54)(54)15.6 %(115)(108)6.1 %
Commissions(224)(236)(263)(238)(252)-12.5 %(428)(490)-14.5 %
Taxes, licenses and fees(7)(8)(7)(9)(7)0.0%(16)(16)0.0%
Total amounts capitalized(295)(304)(332)(301)(313)-6.1 %(559)(614)-9.8 %
Total expenses incurred, net of amounts
capitalized, excluding amortization (1)
1,094 1,072 1,087 1,096 1,078 -1.5 %2,312 2,173 -6.0 %
Amortization
Amortization of DAC, VOBA and other intangibles (2)
274 299 302 309 307 12.0 %544 617 13.4 %
Total operating commissions and
 other expenses (1)(2)
$1,368 $1,371 $1,389 $1,405 $1,385 1.2 %$2,856 $2,790 -2.3 %
(1) The six month period ended June 30, 2024, has been recast to conform to the current period presentation. See page 1 for further information.
(2) Effective in the third quarter of 2024, we collapsed the amortization of deferred gain (loss) on business sold through reinsurance line item, reclassifying the deferred gain
    amortization to other revenues and presenting the amortization of deferred loss within operating expenses. For prior periods, the amortization of deferred gain (loss)
    on business sold through reinsurance is presented on a net basis within other revenues.


13

Table of Contents
lncrefreshedsmalllogoa.jpg
Lincoln Financial
Annuities – Select Earnings and Operational Data
Unaudited (millions of dollars)
As of or For the
As of or For the Three Months EndedSix Months Ended
6/30/249/30/2412/31/243/31/256/30/25Change6/30/246/30/25Change
Income (Loss) from Operations
Operating revenues:
Insurance premiums$34 $38 $29 $21 $28 -17.6 %$60 $50 -16.7 %
Fee income (1)
587 601 612 591 575 -2.0 %1,167 1,166 -0.1 %
Net investment income435 442 462 466 487 12.0 %855 953 11.5 %
Other revenues153 114 120 120 124 -19.0 %395 243 -38.5 %
Total operating revenues1,209 1,195 1,223 1,198 1,214 0.4 %2,477 2,412 -2.6 %
Operating expenses:
Benefits38 38 40 29 37 -2.6 %64 66 3.1 %
Interest credited377 399 407 419 439 16.4 %729 858 17.7 %
Policyholder liability remeasurement (gain) loss— — (1)(5)NM(6)NM
Commissions incurred269 285 307 298 292 8.6 %523 590 12.8 %
Other expenses incurred180 136 157 145 142 -21.1 %489 286 -41.5 %
Amounts capitalized(115)(129)(155)(147)(144)-25.2 %(213)(291)-36.6 %
Amortization107 107 108 115 115 7.5 %213 231 8.5 %
Total operating expenses858 836 864 858 876 2.1 %1,808 1,734 -4.1 %
Income (loss) from operations before taxes351 359 359 340 338 -3.7 %669 678 1.3 %
Federal income tax expense (benefit)54 58 56 50 51 -5.6 %113 101 -10.6 %
Income (loss) from operations$297 $301 $303 $290 $287 -3.4 %$556 $577 3.8 %
Effective Federal Income Tax Rate15.4 %16.3 %15.7 %14.7 %15.2 %16.8 %15.0 %
Return on Average Account Balances, Net of
 Reinsurance (bps)75 74 73 71 72 (3)71 71 — 
Account Balances, Net of Reinsurance –
End-of-Period
RILA account balances$31,633 $33,245 $34,310 $33,527 $36,256 14.6 %$31,633 $36,256 14.6 %
Fixed account balances10,251 10,349 10,352 10,415 10,727 4.6 %10,251 10,727 4.6 %
Traditional variable account balances with GLBs70,664 72,664 70,756 67,101 71,527 1.2 %70,664 71,527 1.2 %
Traditional variable account balances without GLBs47,321 48,899 48,193 47,371 49,283 4.1 %47,321 49,283 4.1 %
Total account balances$159,869 $165,157 $163,611 $158,414 $167,793 5.0 %$159,869 $167,793 5.0 %
Percent traditional variable account balances with GLBs44.2 %44.0 %43.2 %42.4 %42.6 %44.2 %42.6 %
Fee Income, Gross of Hedge Allowance$787 $802 $811 $790 $775 -1.5 %$1,567 $1,565 -0.1 %
Net Investment Income, Net of Reinsurance (2)
403 412 438 443 465 15.4 %793 908 14.5 %
Interest Credited, Net of Reinsurance (2)
254 270 282 290 300 18.1 %498 590 18.5 %
(1) Fee income is reported net of the hedge allowance, which represents fees allocated to net annuity product features to support the cost of hedging.
(2) Net investment income and interest credited are both reported gross of reinsurance. Reinsurance impacts are settled through other revenues.
14

Table of Contents
lncrefreshedsmalllogoa.jpg
Lincoln Financial
Life Insurance – Select Earnings and Operational Data
Unaudited (millions of dollars)
As of or For the
As of or For the Three Months EndedSix Months Ended
6/30/249/30/2412/31/243/31/256/30/25Change6/30/246/30/25Change
Income (Loss) from Operations
Operating revenues:
Insurance premiums$293 $286 $283 $283 $267 -8.9 %$580 $550 -5.2 %
Fee income677 672 694 698 688 1.6 %1,349 1,386 2.7 %
Net investment income533 597 593 571 602 12.9 %1,114 1,172 5.2 %
Operating realized gain (loss)(2)(2)(2)(2)(1)50.0 %(3)(3)0.0%
Other revenues (1)
10 36 40 37 46 NM12 83 NM
Total operating revenues1,511 1,589 1,608 1,587 1,602 6.0 %3,052 3,188 4.5 %
Operating expenses:
Benefits948 895 961 994 926 -2.3 %1,876 1,920 2.3 %
Interest credited299 302 300 287 289 -3.3 %592 576 -2.7 %
Policyholder liability remeasurement (gain) loss16 42 45 30 87.5 %75 38 -49.3 %
Commissions incurred113 120 115 99 111 -1.8 %226 210 -7.1 %
Other expenses incurred193 198 198 194 191 -1.0 %398 384 -3.5 %
Amounts capitalized(133)(140)(137)(115)(128)3.8 %(266)(243)8.6 %
Amortization of DAC and VOBA126 127 128 128 125 -0.8 %252 254 0.8 %
Amortization of deferred loss on business
sold through reinsurance (1)
— 24 24 24 24 NM— 47 NM
Total operating expenses1,562 1,568 1,634 1,619 1,568 0.4 %3,153 3,186 1.0 %
Income (loss) from operations before taxes(51)21 (26)(32)34 166.7 %(101)102.0 %
Federal income tax expense (benefit)(16)(1)(11)(16)112.5 %(31)(14)54.8 %
Income (loss) from operations$(35)$22 $(15)$(16)$32 191.4 %$(70)$16 122.9 %
Effective Federal Income Tax Rate31.2 %NM41.2 %47.9 %5.2 %30.4 %NM
Average Account Balances, Net of Reinsurance$43,230 $44,055 $44,746 $44,390 $45,651 5.6 %$42,755 $45,020 5.3 %
In-Force Face Amount
UL and other$365,030 $364,766 $363,950 $361,480 $360,617 -1.2 %$365,030 $360,617 -1.2 %
Term insurance719,485 717,071 714,362 709,924 707,355 -1.7 %719,485 707,355 -1.7 %
Total in-force face amount$1,084,515 $1,081,837 $1,078,312 $1,071,404 $1,067,972 -1.5 %$1,084,515 $1,067,972 -1.5 %
(1) Effective in the third quarter of 2024, we collapsed the amortization of deferred gain (loss) on business sold through reinsurance line item, reclassifying the deferred gain
    amortization to other revenues and presenting the amortization of deferred loss within operating expenses. For prior periods, the amortization of deferred gain (loss)
    on business sold through reinsurance is presented on a net basis within other revenues.
15

Table of Contents
lncrefreshedsmalllogoa.jpg

Lincoln Financial
Group Protection – Select Earnings and Operational Data
Unaudited (millions of dollars)
As of or For the
As of or For the Three Months EndedSix Months Ended
6/30/249/30/2412/31/243/31/256/30/25Change6/30/246/30/25Change
Income (Loss) from Operations
Operating revenues:
Insurance premiums$1,298 $1,288 $1,274 $1,371 $1,386 6.8 %$2,583 $2,757 6.7 %
Net investment income88 87 87 89 94 6.8 %173 183 5.8 %
Other revenues55 57 57 61 58 5.5 %111 119 7.2 %
Total operating revenues1,441 1,432 1,418 1,521 1,538 6.7 %2,867 3,059 6.7 %
Operating expenses:
Benefits1,032 1,007 970 1,064 1,017 -1.5 %2,062 2,082 1.0 %
Interest credited— 0.0%— -100.0 %
Policyholder liability remeasurement (gain) loss(124)(88)(68)(70)(104)16.1 %(191)(174)8.9 %
Commissions incurred113 114 125 133 139 23.0 %222 272 22.5 %
Other expenses incurred260 255 249 261 263 1.2 %507 523 3.2 %
Amounts capitalized(42)(30)(34)(32)(35)16.7 %(71)(67)5.6 %
Amortization36 36 37 37 38 5.6 %70 76 8.6 %
Total operating expenses1,276 1,295 1,282 1,393 1,319 3.4 %2,601 2,712 4.3 %
Income (loss) from operations before taxes165 137 136 128 219 32.7 %266 347 30.5 %
Federal income tax expense (benefit)35 28 29 27 46 31.4 %56 73 30.4 %
Income (loss) from operations$130 $109 $107 $101 $173 33.1 %$210 $274 30.5 %
Effective Federal Income Tax Rate21.0 %21.0 %21.0 %21.0 %21.0 %21.0 %21.0 %
Operating Margin (1)
10.0 %8.4 %8.4 %7.4 %12.5 %8.1 %9.9 %
Loss Ratios by Product Line
Life75.6 %68.1 %64.7 %75.2 %67.2 %75.8 %71.2 %
Disability65.9 %73.2 %75.0 %70.1 %64.2 %70.0 %67.1 %
Dental78.9 %79.0 %73.3 %79.0 %80.4 %77.7 %79.7 %
Total70.1 %71.4 %71.0 %72.4 %65.9 %72.5 %69.2 %
(1) Operating margin is calculated by dividing income (loss) from operations by insurance premiums.
16

Table of Contents
lncrefreshedsmalllogoa.jpg
Lincoln Financial
Retirement Plan Services – Select Earnings and Operational Data
Unaudited (millions of dollars)
As of or For the
As of or For the Three Months EndedSix Months Ended
6/30/249/30/2412/31/243/31/256/30/25Change6/30/246/30/25Change
Income (Loss) from Operations
Operating revenues:
Fee income$72 $74 $76 $72 $72 0.0%$142 $144 1.4 %
Net investment income247 253 253 251 252 2.0 %491 503 2.4 %
Other revenues-12.5 %16 11 -31.3 %
Total operating revenues327 335 337 327 331 1.2 %649 658 1.4 %
Operating expenses:
Interest credited168 170 172 170 174 3.6 %335 344 2.7 %
Commissions incurred26 28 27 27 28 7.7 %49 55 12.2 %
Other expenses incurred87 88 90 91 87 0.0%178 179 0.6 %
Amounts capitalized(5)(5)(6)(4)(5)0.0%(10)(9)10.0 %
Amortization0.0%0.0%
Total operating expenses281 286 288 289 289 2.8 %561 578 3.0 %
Income (loss) from operations before taxes46 49 49 38 42 -8.7 %88 80 -9.1 %
Federal income tax expense (benefit)-16.7 %12 -25.0 %
Income (loss) from operations$40 $44 $43 $34 $37 -7.5 %$76 $71 -6.6 %
Effective Federal Income Tax Rate13.2 %10.0 %13.5 %11.8 %12.3 %13.1 %12.1 %
Return on Average Account Balances (bps)15 16 15 12 13 (2)15 13 (2)
Net Flows by Market
Small Market$43 $11 $(34)$(79)$28 -34.9 %$11 $(51)NM
Mid - Large Market206 1,069 (178)(1,732)(200)NM1,053 (1,933)NM
Multi-Fund® and Other
(446)(429)(520)(373)(413)7.4 %(870)(784)9.9 %
Net Flows – Trailing Twelve Months$(410)$513 $112 $(2,462)$(2,850)NM$(410)$(2,850)NM
Base Spreads, Excluding Variable
Investment Income (1)
1.03 %1.05 %1.01 %1.03 %0.99 %(4)1.02 %1.01 %(1)
(1) Variable investment income consists of commercial mortgage loan prepayment and bond make-whole premiums.
17

Table of Contents
lncrefreshedsmalllogoa.jpg

Lincoln Financial
Other Operations – Select Earnings and Operational Data
Unaudited (millions of dollars)
As of or For the Three Months EndedFor the Six Months Ended
6/30/249/30/2412/31/243/31/256/30/25Change
6/30/24 (1)
6/30/25Change
Other Operations
Operating revenues:
Insurance premiums$$$— $— $— -100.0 %$$-66.7 %
Net investment income27 34 33 41 25 -7.4 %43 67 55.8 %
Other revenues11 17 11 16 45.5 %20 26 30.0 %
Total operating revenues39 52 42 52 41 5.1 %66 94 42.4 %
Operating expenses:
Benefits(3)50.0 %11 10 -9.1 %
Interest credited13 13 62.5 %17 27 58.8 %
Policyholder liability remeasurement (gain) loss— — — 0.0%— NM
Other expenses incurred62 66 68 66 56 -9.7 %113 123 8.8 %
Interest and debt expense86 86 83 80 81 -5.8 %167 161 -3.6 %
Total operating expenses161 157 160 164 157 -2.5 %308 322 4.5 %
Income (loss) from operations before taxes(122)(105)(118)(112)(116)4.9 %(242)(228)5.8 %
Federal income tax expense (benefit)(25)(21)(23)(17)(25)0.0%(50)(42)16.0 %
Income (loss) from operations$(97)$(84)$(95)$(95)$(91)6.2 %$(192)$(186)3.1 %
(1) The six month period ended June 30, 2024, has been recast to conform to the current period presentation. See page 1 for further information.
18

Table of Contents
lncrefreshedsmalllogoa.jpg
Lincoln Financial
Consolidated – DAC, VOBA, DSI and DFEL Roll Forwards
Unaudited (millions of dollars)
For the Three Months EndedFor the Six Months Ended
6/30/249/30/2412/31/243/31/256/30/25Change6/30/246/30/25Change
DAC, VOBA and DSI
Balance as of beginning-of-period$12,405 $12,435 $12,475 $12,537 $12,563 1.3 %$12,397 $12,537 1.1 %
Deferrals299 309 334 304 318 6.4 %572 623 8.9 %
Operating amortization(269)(269)(272)(278)(277)-3.0 %(534)(556)-4.1 %
Balance as of end-of-period$12,435 $12,475 $12,537 $12,563 $12,604 1.4 %$12,435 $12,604 1.4 %
DFEL
Balance as of beginning-of-period$6,099 $6,306 $6,517 $6,730 $6,910 13.3 %$5,901 $6,730 14.0 %
Deferrals284 289 295 284 300 5.6 %556 584 5.0 %
Operating amortization(77)(78)(82)(104)(91)-18.2 %(151)(195)-29.1 %
Balance as of end-of-period$6,306 $6,517 $6,730 $6,910 $7,119 12.9 %$6,306 $7,119 12.9 %
DAC, VOBA, DSI and DFEL
Balance as of End-of-Period, After-Tax$4,842 $4,707 $4,588 $4,466 $4,333 -10.5 %$4,842 $4,333 -10.5 %
19

Table of Contents
lncrefreshedsmalllogoa.jpg
Lincoln Financial
Annuities – Account Balance Roll Forwards
Unaudited (millions of dollars)
For the Three Months EndedFor the Six Months Ended
6/30/249/30/2412/31/243/31/256/30/25Change6/30/246/30/25Change
Traditional Variable Annuities
Balance as of beginning-of-period$119,485 $117,990 $121,568 $118,954 $114,477 -4.2 %$114,963 $118,954 3.5 %
Gross deposits1,054 1,163 1,844 1,634 1,351 28.2 %1,988 2,985 50.2 %
Full surrenders and deaths(2,303)(2,382)(2,185)(2,165)(1,952)15.2 %(4,446)(4,117)7.4 %
Other contract benefits(1,130)(1,172)(1,503)(1,513)(1,499)-32.7 %(2,261)(3,012)-33.2 %
Net flows(2,379)(2,391)(1,844)(2,044)(2,100)11.7 %(4,719)(4,144)12.2 %
Policyholder assessments(650)(666)(666)(652)(639)1.7 %(1,294)(1,292)0.2 %
Change in market value and reinvestment1,534 6,635 (104)(1,781)9,077 NM9,040 7,297 -19.3 %
Balance as of end-of-period, gross117,990 121,568 118,954 114,477 120,815 2.4 %117,990 120,815 2.4 %
Account balances reinsured(5)(5)(5)(5)(5)0.0%(5)(5)0.0%
Balance as of end-of-period, net$117,985 $121,563 $118,949 $114,472 $120,810 2.4 %$117,985 $120,810 2.4 %
RILA
Balance as of beginning-of-period$30,100 $31,633 $33,245 $34,310 $33,527 11.4 %$27,533 $34,310 24.6 %
Gross deposits1,096 1,203 1,285 1,292 1,447 32.0 %2,038 2,739 34.4 %
Full surrenders and deaths(138)(326)(671)(721)(811)NM(253)(1,532)NM
Other contract benefits(14)(18)(120)(129)(127)NM(56)(256)NM
Net flows944 859 494 442 509 -46.1 %1,729 951 -45.0 %
Policyholder assessments(3)(3)(4)(5)(4)-33.3 %(6)(8)-33.3 %
Change in market value and reinvestment288 325 375 346 341 18.4 %535 686 28.2 %
Change in fair value of embedded derivative instruments and other304 431 200 (1,566)1,883 NM1,842 317 -82.8 %
Balance as of end-of-period, gross$31,633 $33,245 $34,310 $33,527 $36,256 14.6 %$31,633 $36,256 14.6 %
20

Table of Contents
lncrefreshedsmalllogoa.jpg
Lincoln Financial
Annuities – Account Balance Roll Forwards
Unaudited (millions of dollars)
For the Three Months EndedFor the Six Months Ended
6/30/249/30/2412/31/243/31/256/30/25Change6/30/246/30/25Change
Fixed Annuities
Balance as of beginning-of-period$25,162 $25,837 $26,359 $25,963 $26,039 3.5 %$25,355 $25,963 2.4 %
Gross deposits1,673 1,017 563 873 1,226 -26.7 %2,646 2,099 -20.7 %
Full surrenders and deaths(1,020)(949)(873)(743)(619)39.3 %(2,234)(1,363)39.0 %
Other contract benefits(172)(173)(231)(204)(178)-3.5 %(368)(381)-3.5 %
Net flows481 (105)(541)(74)429 -10.8 %44 355 NM
Policyholder assessments(14)(14)(16)(15)(15)-7.1 %(31)(30)3.2 %
Reinvested interest credited199 211 209 210 228 14.6 %382 438 14.7 %
Change in fair value of embedded derivative instruments
and other430 (48)(45)151 NM87 106 21.8 %
Balance as of end-of-period, gross25,837 26,359 25,963 26,039 26,832 3.9 %25,837 26,832 3.9 %
Account balances reinsured(15,586)(16,010)(15,611)(15,624)(16,105)-3.3 %(15,586)(16,105)-3.3 %
Balance as of end-of-period, net$10,251 $10,349 $10,352 $10,415 $10,727 4.6 %$10,251 $10,727 4.6 %
Total
Balance as of beginning-of-period$174,747 $175,460 $181,172 $179,227 $174,043 -0.4 %$167,851 $179,227 6.8 %
Gross deposits3,823 3,383 3,692 3,799 4,024 5.3 %6,672 7,823 17.3 %
Full surrenders and deaths(3,461)(3,657)(3,729)(3,629)(3,382)2.3 %(6,933)(7,012)-1.1 %
Other contract benefits(1,316)(1,363)(1,854)(1,846)(1,804)-37.1 %(2,685)(3,649)-35.9 %
Net flows(954)(1,637)(1,891)(1,676)(1,162)-21.8 %(2,946)(2,838)3.7 %
Policyholder assessments(667)(683)(686)(672)(658)1.3 %(1,331)(1,330)0.1 %
Change in market value, reinvestment and interest credited2,021 7,171 480 (1,225)9,646 NM9,957 8,421 -15.4 %
Change in fair value of embedded derivative instruments
and other313 861 152 (1,611)2,034 NM1,929 423 -78.1 %
Balance as of end-of-period, gross175,460 181,172 179,227 174,043 183,903 4.8 %175,460 183,903 4.8 %
Account balances reinsured(15,591)(16,015)(15,616)(15,629)(16,110)-3.3 %(15,591)(16,110)-3.3 %
Balance as of end-of-period, net$159,869 $165,157 $163,611 $158,414 $167,793 5.0 %$159,869 $167,793 5.0 %
21

Table of Contents
lncrefreshedsmalllogoa.jpg
Lincoln Financial
Life Insurance – Account Balance Roll Forwards
Unaudited (millions of dollars)
For the Three Months EndedFor the Six Months Ended
6/30/249/30/2412/31/243/31/256/30/25Change6/30/246/30/25Change
General Account
Balance as of beginning-of-period$37,006 $36,848 $36,692 $36,599 $36,220 -2.1 %$37,180 $36,599 -1.6 %
Gross deposits893 899 977 865 847 -5.2 %1,743 1,713 -1.7 %
Withdrawals and deaths(389)(369)(342)(445)(372)4.4 %(753)(818)-8.6 %
Net flows504 530 635 420 475 -5.8 %990 895 -9.6 %
Transfers between general and separate accounts74 30 53 14 49 -33.8 %113 63 -44.2 %
Policyholder assessments(1,130)(1,129)(1,137)(1,104)(1,102)2.5 %(2,254)(2,205)2.2 %
Reinvested interest credited368 375 365 356 360 -2.2 %733 715 -2.5 %
Change in fair value of embedded derivative instruments
and other26 38 (9)(65)114 NM86 49 -43.0 %
Balance as of end-of-period, gross36,848 36,692 36,599 36,220 36,116 -2.0 %36,848 36,116 -2.0 %
Account balances reinsured(15,467)(15,301)(15,147)(14,965)(14,816)4.2 %(15,467)(14,816)4.2 %
Balance as of end-of-period, net$21,381 $21,391 $21,452 $21,255 $21,300 -0.4 %$21,381 $21,300 -0.4 %
Separate Account
Balance as of beginning-of-period$27,007 $27,381 $28,921 $28,841 $28,106 4.1 %25,150 $28,841 14.7 %
Gross deposits337 363 425 353 434 28.8 %695 787 13.2 %
Withdrawals and deaths(90)(155)(130)(204)(276)NM(193)(480)NM
Net flows247 208 295 149 158 -36.0 %502 307 -38.8 %
Transfers between general and separate accounts(76)(30)(53)(14)(48)36.8 %(113)(63)44.2 %
Policyholder assessments(247)(248)(253)(246)(248)-0.4 %(493)(494)-0.2 %
Change in market value and reinvestment450 1,610 (69)(624)2,648 NM2,335 2,025 -13.3 %
Balance as of end-of-period, gross27,381 28,921 28,841 28,106 30,616 11.8 %27,381 30,616 11.8 %
Account balances reinsured(5,371)(5,593)(5,521)(5,354)(4,621)14.0 %(5,371)(4,621)14.0 %
Balance as of end-of-period, net$22,010 $23,328 $23,320 $22,752 $25,995 18.1 %$22,010 $25,995 18.1 %
Total
Balance as of beginning-of-period$64,013 $64,229 $65,613 $65,440 $64,326 0.5 %$62,330 $65,440 5.0 %
Gross deposits1,230 1,262 1,402 1,218 1,281 4.1 %2,438 2,500 2.5 %
Withdrawals and deaths(479)(524)(472)(649)(648)-35.3 %(946)(1,298)-37.2 %
Net flows751 738 930 569 633 -15.7 %1,492 1,202 -19.4 %
Transfers between general and separate accounts(2)— — — 150.0 %— — NM
Policyholder assessments(1,377)(1,377)(1,390)(1,350)(1,350)2.0 %(2,747)(2,699)1.7 %
Change in market value and reinvestment818 1,985 296 (268)3,008 267.7 %3,068 2,740 -10.7 %
Change in fair value of embedded derivative instruments
and other26 38 (9)(65)114 NM86 49 -43.0 %
Balance as of end-of-period, gross64,229 65,613 65,440 64,326 66,732 3.9 %64,229 66,732 3.9 %
Account balances reinsured(20,838)(20,894)(20,668)(20,319)(19,437)6.7 %(20,838)(19,437)6.7 %
Balance as of end-of-period, net$43,391 $44,719 $44,772 $44,007 $47,295 9.0 %$43,391 $47,295 9.0 %
22

Table of Contents
lncrefreshedsmalllogoa.jpg
Lincoln Financial
Retirement Plan Services – Account Balance Roll Forwards
Unaudited (millions of dollars)
For the Three Months EndedFor the Six Months Ended
6/30/249/30/2412/31/243/31/256/30/25Change6/30/246/30/25Change
General Account
Balance as of beginning-of-period$23,586 $23,598 $23,727 $23,619 $23,479 -0.5 %$23,784 $23,619 -0.7 %
Gross deposits846 944 826 811 1,109 31.1 %1,636 1,921 17.4 %
Withdrawals(1,072)(1,095)(1,125)(1,330)(1,103)-2.9 %(2,275)(2,433)-6.9 %
Net flows(226)(151)(299)(519)102.7 %(639)(512)19.9 %
Transfers between fixed and variable accounts69 110 22 211 44 -36.2 %120 254 111.7 %
Policyholder assessments(3)(4)(4)(4)(4)-33.3 %(7)(8)-14.3 %
Reinvested interest credited172 174 173 172 175 1.7 %340 347 2.1 %
Balance as of end-of-period$23,598 $23,727 $23,619 $23,479 $23,700 0.4 %$23,598 $23,700 0.4 %
Separate Account and Mutual Funds
Balance as of beginning-of-period$83,226 $84,274 $90,069 $88,962 $85,754 3.0 %$77,201 $88,962 15.2 %
Gross deposits2,436 3,236 2,647 3,304 2,485 2.0 %5,449 5,788 6.2 %
Withdrawals(2,407)(2,434)(3,080)(4,969)(3,076)-27.8 %(4,616)(8,044)-74.3 %
Net flows29 802 (433)(1,665)(591)NM833 (2,256)NM
Transfers between fixed and variable accounts(69)(106)(19)(200)(54)21.7 %(104)(253)NM
Policyholder assessments(66)(70)(72)(69)(69)-4.5 %(130)(138)-6.2 %
Change in market value and reinvestment1,154 5,169 (583)(1,274)7,643 NM6,474 6,368 -1.6 %
Balance as of end-of-period$84,274 $90,069 $88,962 $85,754 $92,683 10.0 %$84,274 $92,683 10.0 %
Total
Balance as of beginning-of-period$106,812 $107,872 $113,796 $112,581 $109,233 2.3 %$100,985 $112,581 11.5 %
Gross deposits3,282 4,180 3,473 4,115 3,594 9.5 %7,085 7,709 8.8 %
Withdrawals(3,479)(3,529)(4,205)(6,299)(4,179)-20.1 %(6,891)(10,477)-52.0 %
Net flows(197)651 (732)(2,184)(585)NM194 (2,768)NM
Transfers between fixed and variable accounts— 11 (10)NM16 -93.8 %
Policyholder assessments(69)(74)(76)(73)(73)-5.8 %(137)(146)-6.6 %
Change in market value and reinvestment1,326 5,343 (410)(1,102)7,818 NM6,814 6,715 -1.5 %
Balance as of end-of-period$107,872 $113,796 $112,581 $109,233 $116,383 7.9 %$107,872 $116,383 7.9 %
23

Table of Contents
lncrefreshedsmalllogoa.jpg
Lincoln Financial
Fixed-Income Asset Class
Unaudited (millions of dollars)
As of 6/30/24As of 12/31/24As of 6/30/25
Amount%Amount%Amount%
Fixed Maturity AFS Securities, Net of Modified Coinsurance and Funds Withheld
Investments and Allowance for Credit Losses, at Amortized Cost (1)
Industry corporate bonds:
Financial services$12,552 14.4 %$12,728 14.6 %$12,685 14.4 %
Basic industry2,916 3.4 %2,840 3.3 %2,868 3.2 %
Capital goods5,486 6.3 %5,490 6.3 %5,507 6.2 %
Communications2,850 3.3 %2,798 3.2 %2,752 3.1 %
Consumer cyclical5,291 6.1 %5,408 6.2 %5,351 6.0 %
Consumer non-cyclical12,751 14.6 %12,485 14.4 %12,438 14.1 %
Energy2,547 2.9 %2,472 2.8 %2,486 2.8 %
Technology4,135 4.8 %3,882 4.5 %4,042 4.6 %
Transportation3,147 3.6 %3,124 3.6 %3,216 3.6 %
Industrial other2,151 2.4 %2,183 2.5 %2,268 2.6 %
Utilities11,283 13.0 %11,194 12.9 %11,399 12.9 %
Government-related entities1,211 1.4 %1,170 1.3 %1,133 1.3 %
Residential mortgage-backed securities ("RMBS")
Agency backed1,546 1.7 %1,608 1.8 %1,709 1.9 %
Non-agency backed322 0.4 %328 0.4 %383 0.4 %
Commercial mortgage-backed securities ("CMBS")1,629 1.9 %1,724 2.0 %1,987 2.2 %
Asset-backed securities ("ABS")
Collateralized loan obligations ("CLOs")8,354 9.6 %8,189 9.4 %8,161 9.2 %
Other ABS5,021 5.7 %5,864 6.7 %6,542 7.4 %
Municipals2,797 3.2 %2,647 3.0 %2,511 2.8 %
United States and foreign government7271.0 %7110.8 %8721.0 %
Hybrid & redeemable preferred securities226 0.3 %235 0.3 %248 0.3 %
Total fixed maturity AFS securities, net of modified coinsurance and funds withheld
investments and allowance for credit losses, at amortized cost86,942 100.0 %87,080 100.0 %88,558 100.0 %
Trading Securities, Net of Modified Coinsurance and Funds Withheld Investments517 511 506 
Equity Securities, Net of Modified Coinsurance and Funds Withheld Investments252 264 307 
Total fixed maturity AFS, trading and equity securities, net of modified coinsurance and funds
withheld investments and allowance for credit losses, at amortized cost87,711 87,855 89,371 
Modified coinsurance and funds withheld investments12,646 11,992 11,426 
Total fixed maturity AFS, trading and equity securities$100,357 $99,847 $100,797 
(1) Net investment income and net gains (losses) related to assets held by us to support certain modified coinsurance and funds withheld agreements are included in periodic payments
     to or from the reinsurers, resulting in the economic benefits of these assets flowing to the reinsurers. Accordingly, these assets have been excluded from summaries provided on
     page 24 and page 25 as we have a limited economic interest in the assets.
24

Table of Contents
lncrefreshedsmalllogoa.jpg
Lincoln Financial
Fixed-Income Credit Quality
Unaudited (millions of dollars)
As of 6/30/24As of 12/31/24As of 6/30/25
Amount%Amount%Amount%
Fixed Maturity AFS Securities, Net of Modified Coinsurance and Funds Withheld Investments
and Allowance for Credit Losses, at Amortized Cost (1)
NAIC 1 (AAA-A)$51,419 59.1 %$51,922 59.6 %$53,585 60.4 %
NAIC 2 (BBB)32,686 37.6 %32,198 37.0 %31,935 36.1 %
Total investment grade84,105 96.7 %84,120 96.6 %85,520 96.5 %
NAIC 3 (BB)1,000 1.2 %907 1.1 %934 1.1 %
NAIC 4 (B)1,767 2.0 %1,857 2.1 %1,952 2.2 %
NAIC 5 (CCC and lower)65 0.1 %109 0.1 %78 0.1 %
NAIC 6 (in or near default)0.0 %87 0.1 %74 0.1 %
Total below investment grade2,837 3.3 %2,960 3.4 %3,038 3.5 %
Total$86,942 100.0 %$87,080 100.0 %$88,558 100.0 %
Commercial Mortgage Loans, Net of Modified Coinsurance and Funds Withheld Investments,
at Amortized Cost (1)(2)
CM1 (AAA-A)$13,515 78.1 %$13,450 77.2 %$13,329 76.3 %
CM2 (BBB)3,758 21.7 %3,873 22.2 %4,083 23.4 %
CM3-7 (BB and lower) (3)
40 0.2 %99 0.6 %61 0.3 %
Total$17,313 100.0 %$17,422 100.0 %$17,473 100.0 %
Total Fixed Maturity AFS Securities and Commercial Mortgage Loans, Net of Modified
Coinsurance and Funds Withheld Investments, at Amortized Cost (1)(2)
AAA-A$64,934 62.2 %$65,372 62.6 %$66,914 63.1 %
BBB36,444 35.0 %36,071 34.5 %36,018 34.0 %
BB and lower2,877 2.8 %3,059 2.9 %3,099 2.9 %
Total$104,255 100.0 %$104,502 100.0 %$106,031 100.0 %
(1) Ratings are based upon the designations determined and provided by the National Association of Insurance Commissioners (“NAIC”) or based upon ratings from credit rating
     agencies to derive the NAIC designation.
(2) CM ratings reflect the risk-based capital risk category for commercial mortgage loans. Letter ratings are assumed NAIC equivalent ratings where NAIC 1 = CM1, NAIC 2 = CM2
     and NAIC 3-6 = CM3-7.
(3) Includes mortgage fund limited partnerships classified as CM3 that are included in "Other Investments" on the Consolidated Balance Sheets.
25

Table of Contents
lncrefreshedsmalllogoa.jpg
Lincoln Financial
Select GAAP to Non-GAAP Reconciliations
Unaudited (millions of dollars)
For the Three Months EndedFor the Six Months Ended
6/30/249/30/2412/31/243/31/256/30/25Change
6/30/24 (1)
6/30/25Change
Net Income
Net income (loss) available to common stockholders – diluted$884 $(562)$1,675 $(756)$688 -22.2 %$2,073 $(69)NM
Less:
Preferred stock dividends declared(11)(34)(11)(34)(11)0.0%(46)(46)0.0%
Adjustment for deferred units of LNC stock
in our deferred compensation plans— — — — — NM— -100 %
Net income (loss)895 (528)1,686 (722)699 -21.9 %2,116 (23)NM
Less:
Net annuity product features, pre-tax (2)
252 (381)1,187 (1,092)405 60.7 %1,702 (687)NM
Net life insurance product features, pre-tax(125)46 42 (58)NM(128)(15)88 %
Credit loss-related adjustments, pre-tax(34)(88)(28)(28)(25)26.5 %(36)(53)-47 %
Investment gains (losses), pre-tax(230)(105)(67)(103)(81)64.8 %(311)(183)41 %
Changes in the fair value of reinsurance-related
embedded derivatives, trading securities and certain
mortgage loans, pre-tax (3)
201 (446)587 (90)14 -93.0 %395 (76)NM
Gains (losses) on other non-financial assets – sale of
subsidiaries/businesses, pre-tax (4)
584 (2)— — — -100.0 %584 — -100 %
Other items, pre-tax (5)(6)(7)(8)(9)
(33)(19)(32)(35)75 NM(219)40 118.3 %
Income tax benefit (expense) related to the above pre-tax items(184)246 (350)270 (69)62.5 %(451)199 144.1 %
Total adjustments560 (920)1,343 (1,036)261 -53.4 %1,536 (775)NM
Adjusted income (loss) from operations335 392 343 314 438 30.7 %580 752 30 %
Add:
Preferred stock dividends declared(11)(34)(11)(34)(11)0.0%(46)(46)0.0%
Adjusted income (loss) from operations available
to common stockholders$324 $358 $332 $280 $427 31.8 %$534 $706 32 %
(1)
The six month period ended June 30, 2024, has been recast to conform to the current period presentation. See page 1 for further information.
(2)
Includes changes in MRBs of $1,895 million, $126 million, $(666) million, $1,282 million, $(1,302) million and $932 million; changes in the fair value of the related hedge instruments
inclusive of income allocated to support the cost of hedging or future benefits of $(587) million, $50 million, $188 million, $(212) million, $274 million and $(595) million; and
changes in the fair value of the embedded derivative liabilities and the associated index options for our indexed annuity products of $142 million, $76 million, $97 million,
$117 million, $(64) million and $68 million for the first quarter of 2024, second quarter of 2024, third quarter of 2024, fourth quarter of 2024, first quarter of 2025 and second
quarter of 2025, respectively.
(3)
Includes primarily changes in the fair value of the embedded derivative related to the fourth quarter 2023 reinsurance transaction.
(4)
Relates to the sale of our wealth management business, which provided approximately $650 million of statutory capital benefit.
(5)
For the first quarter of 2024, includes certain legal accruals of $(114) million primarily related to the settlement of cost of insurance litigation; for the fourth quarter of 2024, includes
certain legal accruals of $(15) million and regulatory accruals of $(12) million related to estimated state guaranty fund assessments net of estimated state premium tax recoveries.
(continued on the next page)
26

Table of Contents
lncrefreshedsmalllogoa.jpg
Lincoln Financial
Select GAAP to Non-GAAP Reconciliations
Unaudited (millions of dollars)
(continued from the previous page)

(6)
Includes severance expense related to initiatives to realign the workforce of $(49) million, $(7) million, $(16) million, $(2) million, $(6) million and $(2) million in the first quarter of 2024,
second quarter of 2024, third quarter of 2024, fourth quarter of 2024, first quarter of 2025 and second quarter of 2025, respectively.
(7)
Includes transaction, integration and other costs related to mergers, acquisitions, divestitures and certain other corporate initiatives of $(10) million, $(27) million, $(2) million, $(1)
million and $(20) million in the first quarter of 2024, second quarter of 2024, third quarter of 2024, fourth quarter of 2024 and first quarter of 2025, respectively, primarily related
to the sale of our wealth management business and $(18) million in the second quarter of 2025 primarily related to the Bain Capital transaction.
(8)
Includes deferred compensation mark-to-market adjustment of $(13) million, $1 million, $(1) million, $(2) million, $(9) million and $1 million in the first quarter of 2024,
second quarter of 2024, third quarter of 2024, fourth quarter of 2024, first quarter of 2025 and second quarter of 2025, respectively.
(9)
Includes gains (losses) on early extinguishment of debt of $94 million in the second quarter of 2025.
For the Three Months EndedFor the Six Months Ended
6/30/249/30/2412/31/243/31/256/30/25Change6/30/246/30/25Change
Revenues
Total revenues$5,153 $4,111 $5,063 $4,691 $4,044 -21.5 %$9,269 $8,735 -5.8 %
Less:
Revenue adjustments from annuity
and life insurance product features105 149 (57)227 (590)NM(474)(364)23.2 %
Credit loss-related adjustments(34)(88)(28)(28)(25)26.5 %(36)(53)-47.2 %
Investment gains (losses)(230)(105)(67)(103)(81)64.8 %(311)(183)41.2 %
Changes in the fair value of reinsurance-related
embedded derivatives, trading securities and certain
mortgage loans (1)
201 (446)587 (90)14 -93.0 %395 (76)NM
Gains (losses) on other non-financial assets – sale of
subsidiaries/businesses (2)
584 (2)— — — -100.0 %584 — -100.0 %
Adjusted operating revenues$4,527 $4,603 $4,628 $4,685 $4,726 4.4 %$9,111 $9,411 3.3 %
(1) Includes primarily changes in the fair value of the embedded derivative related to the fourth quarter 2023 reinsurance transaction.
(2) Relates to the sale of our wealth management business, which provided approximately $650 million of statutory capital benefit.
27

Table of Contents
lncrefreshedsmalllogoa.jpg
Lincoln Financial
Select GAAP to Non-GAAP Reconciliations
Unaudited
For the Three Months EndedFor the Six Months Ended
Earnings (Loss) Per Common Share – Diluted6/30/249/30/2412/31/243/31/256/30/25Change
6/30/24 (1)
6/30/25Change
Net income (loss)$5.11 $(3.29)$9.63 $(4.41)$3.80 -25.6 %$12.03 $(0.39)NM
Less:
Net annuity product features, pre-tax (2)
1.46 (2.23)6.83 (6.36)2.24 53.4 %9.89 (3.94)NM
Net life insurance product features, pre-tax0.02 (0.73)0.27 0.25 (0.32)NM(0.75)(0.08)89.3 %
Credit loss-related adjustments, pre-tax(0.20)(0.53)(0.16)(0.17)(0.14)30.0 %(0.21)(0.31)-47.6 %
Investment gains (losses), pre-tax(1.33)(0.61)(0.38)(0.60)(0.45)66.2 %(1.80)(1.05)41.7 %
Changes in the fair value of reinsurance-related
embedded derivatives, trading securities and certain
 mortgage loans, pre-tax1.16 (2.61)3.37 (0.53)0.08 -93.1 %2.29 (0.43)NM
Gains (losses) on other non-financial assets – sale of
subsidiaries/businesses, pre-tax3.38 (0.01)— — — -100.0 %3.39 — -100.0 %
Other items, pre-tax (3)(4)(5)(6)(7)
(0.19)(0.11)(0.19)(0.20)0.42 NM(1.27)0.23 118.1 %
Income tax benefit (expense) related
 to the above pre-tax items(1.06)1.44 (2.02)1.57 (0.39)63.2 %(2.61)1.14 143.7 %
Adjustment attributable to using different average
diluted shares for adjusted income (loss) from
operations as compared to net income (loss) (8)
— 0.04 — 0.03 — NM— 0.08 NM
Adjusted income (loss) from operations$1.87 $2.06 $1.91 $1.60 $2.36 26.2 %$3.10 $3.97 28.1 %

(continued on the next page)


28

Table of Contents
lncrefreshedsmalllogoa.jpg
Lincoln Financial
Select GAAP to Non-GAAP Reconciliations
Unaudited

(continued from the previous page)

(1)
The six month period ended June 30, 2024 has been recast to conform to the current period presentation. See page 1 for further information.
(2)
Includes changes in MRBs of $0.73, $(3.90), $7.38, $(7.59), $5.15, $11.74 and $(2.12); changes in the fair value of the related hedge instruments inclusive of income allocated to
support the cost of hedging or future benefits of $0.29, $1.10, $(1.22), $1.60, $(3.29), $(3.11) and $(1.84); changes in the fair value of the embedded derivative liabilities and the
associated index options for our indexed annuity products of $0.44, $0.57, $0.67, $(0.37), $0.38, $1.26 and $0.02 for the second quarter of 2024, third quarter of 2024, fourth
quarter of 2024, first quarter of 2025, second quarter of 2025, six months ended 2024 and six months ended 2025, respectively.
(3)
For the fourth quarter of 2024, includes certain legal accruals of $(0.09) and regulatory accruals of $(0.07) related to estimated state guaranty fund assessments net of
estimated state premium tax recoveries. For the six months ended 2024, includes certain legal accrual of $(0.65) primarily related to the settlement of cost of insurance litigation.
(4)
Includes severance expense related to initiatives to realign the workforce of $(0.04), $(0.09), $(0.01), $(0.03), $(0.01), $(0.33) and $(0.05) in the second quarter of 2024,
third quarter of 2024, fourth quarter of 2024, first quarter of 2025, second quarter of 2025, six months ended 2024 and six months ended 2025, respectively.
(5)
Includes transaction, integration and other costs related to mergers, acquisitions, divestitures and certain other corporate initiatives of $(0.15), $(0.01), $(0.01) and $(0.12)
in the second quarter of 2024, third quarter of 2024, fourth quarter of 2024 and first quarter of 2025, respectively, primarily related to the sale of our wealth management
business; $(0.10) in the second quarter of 2025 primarily related to the Bain Capital transaction; $(0.22) in the six months ended 2024 primarily related to the sale of our
wealth management business; $(0.22) in the six months ended 2025 primarily related to the Bain Capital transaction and the sale of our wealth management business.
(6)
Includes deferred compensation mark-to-market adjustment of $(0.01), $(0.01), $(0.05), $0.01, $(0.07) and $(0.04) in the third quarter of 2024, fourth quarter of 2024, first
quarter of 2025, second quarter of 2025, six months ended 2024 and six months ended 2025, respectively.
(7)
Includes gains (losses) on early extinguishment of debt of $0.52 and $0.54 in the second quarter of 2025 and six months ended 2025, respectively.
(8)
In periods where net loss or adjusted loss from operations is presented, basic shares are used in the diluted EPS and adjusted diluted EPS calculations, as the use of diluted
 shares would result in a lower loss per share. Due to reporting adjusted income (loss) from operations per common share on a different share basis than net income (loss)
per common share, we have included an adjustment to reconcile the two metrics.
29

Table of Contents
lncrefreshedsmalllogoa.jpg
Lincoln Financial
Select GAAP to Non-GAAP Reconciliations
Unaudited (millions of dollars, except per share data)
For the Three Months EndedFor the Six Months Ended
6/30/249/30/2412/31/243/31/256/30/25Change6/30/246/30/25Change
Stockholders’ Equity, End-of-Period
Stockholders’ equity$7,949 $9,013 $8,269 $8,193 $9,548 20.1 %$7,949 $9,548 20.1 %
Less:
Preferred stock986 986 986 986 986 0.0%986 986 0.0%
AOCI(4,369)(2,682)(5,036)(4,306)(4,392)-0.5 %(4,369)(4,392)-0.5 %
Stockholders’ equity, excluding AOCI and preferred stock11,332 10,709 12,319 11,513 12,954 14.3 %11,332 12,954 14.3 %
Changes in MRBs2,673 2,147 3,165 2,133 2,869 7.3 %2,673 2,869 7.3 %
GLB and GDB hedge instruments gains (losses)(2,770)(2,763)(3,062)(2,993)(3,602)-30.0 %(2,770)(3,602)-30.0 %
Reinsurance-related embedded derivatives and portfolio gains (losses)(269)(642)(151)(196)(186)30.9 %(269)(186)30.9 %
Adjusted stockholders’ equity$11,698 $11,967 $12,367 $12,569 $13,873 18.6 %$11,698 $13,873 18.6 %
Stockholders’ Equity, Average
Stockholders’ equity$7,747 $8,481 $8,641 $8,231 $8,871 14.5 %$7,483 $8,551 14.3 %
Less:
Preferred stock986 986 986 986 986 0.0%986 986 0.0%
AOCI(4,160)(3,526)(3,860)(4,671)(4,349)-4.5 %(3,937)(4,510)-14.6 %
Stockholders’ equity, excluding AOCI and preferred stock10,921 11,021 11,515 11,916 12,234 12.0 %10,434 12,075 15.7 %
Changes in MRBs2,624 2,410 2,656 2,649 2,501 -4.7 %2,227 2,575 15.6 %
GLB and GDB hedge instruments gains (losses)(2,723)(2,767)(2,913)(3,027)(3,297)-21.1 %(2,551)(3,162)-24.0 %
Reinsurance-related embedded derivatives and portfolio gains (losses)(372)(455)(396)(173)(191)48.7 %(465)(182)60.9 %
Adjusted average stockholders' equity$11,392 $11,833 $12,168 $12,467 $13,221 16.1 %$11,223 $12,844 14.4 %
Book Value Per Common Share
Book value per share$40.78 $46.97 $42.60 $41.96 $44.91 10.1 %$40.78 $44.91 10.1 %
Less:
AOCI(25.59)(15.70)(29.46)(25.08)(23.04)10.0 %(25.59)(23.04)10.0 %
Book value per share, excluding AOCI66.37 62.67 72.06 67.04 67.95 2.4 %66.37 67.95 2.4 %
Less:
Changes in MRBs15.66 12.56 18.51 12.42 15.05 -3.9 %15.66 15.05 -3.9 %
GLB and GDB hedge instruments gains (losses)(16.22)(16.17)(17.91)(17.43)(18.89)-16.5 %(16.22)(18.89)-16.5 %
Reinsurance-related embedded derivatives and portfolio gains (losses)(1.58)(3.76)(0.88)(1.14)(0.98)38.0 %(1.58)(0.98)38.0 %
Adjusted book value per share$68.51 $70.04 $72.34 $73.19 $72.77 6.2 %$68.51 $72.77 6.2 %
30
Earnings Supplement Second Quarter 2025 July 31, 2025


2 Forward-Looking Statements – Cautionary Language Certain statements made in this press release and in other written or oral statements made by Lincoln or on Lincoln’s behalf are “forward-looking statements” within the meaning of the Private Securities Litigation Reform Act of 1995 (“PSLRA”). A forward-looking statement is a statement that is not a historical fact and, without limitation, includes any statement that may predict, forecast, indicate or imply future results, performance or achievements. Forward-looking statements may contain words like: “anticipate,” “believe,” “estimate,” “expect,” “project,” “shall,” “will” and other words or phrases with similar meaning in connection with a discussion of future operating or financial performance. In particular, these include statements relating to future actions, trends in Lincoln’s businesses, prospective services or products, future performance or financial results and the outcome of contingencies, such as legal proceedings. Lincoln claims the protection afforded by the safe harbor for forward-looking statements provided by the PSLRA. Forward-looking statements are subject to risks and uncertainties. Actual results could differ materially from those expressed in or implied by such forward-looking statements due to a variety of factors, including: • Weak general economic and business conditions that may affect demand for our products, account balances, investment results, guaranteed benefit liabilities, premium levels and claims experience; • Adverse global capital and credit market conditions that may affect our ability to raise capital, if necessary, and may cause us to realize impairments on investments and certain intangible assets, including goodwill and the valuation allowance against deferred tax assets, which may reduce future earnings and/or affect our financial condition and ability to raise additional capital or refinance existing debt as it matures; • The inability of our subsidiaries to pay dividends to the holding company in sufficient amounts, which could harm the holding company’s ability to meet its obligations; • Legislative, regulatory or tax changes, both domestic and foreign, that affect: the cost of, or demand for, our subsidiaries’ products; the required amount of reserves and/or surplus; our ability to conduct business; our affiliate reinsurance arrangements; and restrictions on the payment of revenue sharing and 12b-1 distribution fees; • Changes in tax law or the interpretation of or application of existing tax laws that could impact our tax costs and the products that we sell; • The impact of regulations adopted by the Securities and Exchange Commission (“SEC”), the Department of Labor or other federal or state regulators or self-regulatory organizations that could adversely affect our distribution model and sales of our products and result in additional disclosure and other requirements related to the sale and delivery of our products; • The impact of new and emerging rules, laws and regulations relating to privacy, cybersecurity and artificial intelligence that may lead to increased compliance costs, reputation risk and/or changes in business practices; • Increasing scrutiny and evolving expectations and regulations regarding ESG matters that may adversely affect our reputation and our investment portfolio; • Actions taken by reinsurers to raise rates on in-force business; • Declines in or sustained low interest rates causing a reduction in investment income, the interest margins of our businesses and demand for our products; • Rapidly increasing or sustained high interest rates that may negatively affect our profitability, value of our investment portfolio and capital position and may cause policyholders to surrender annuity and life insurance policies, thereby causing realized investment losses; • The impact of the implementation of the provisions of the European Market Infrastructure Regulation relating to the regulation of derivatives transactions; • The initiation of legal or regulatory proceedings against us, and the outcome of any legal or regulatory proceedings, such as: adverse actions related to present or past business practices common in businesses in which we compete; adverse decisions in significant actions including, but not limited to, actions brought by federal and state authorities and class action cases; new decisions that result in changes in law; and unexpected trial court rulings; • A decline or continued volatility in the equity markets causing a reduction in the sales of our subsidiaries’ products; a reduction of asset-based fees that our subsidiaries charge on various investment and insurance products; and an increase in liabilities related to guaranteed benefit riders, which are accounted for as market risk benefits, of our subsidiaries’ variable annuity products; • Ineffectiveness of our risk management policies and procedures, including our various hedging strategies; • A deviation in actual experience regarding future policyholder behavior, mortality, morbidity, interest rates or equity market returns from the assumptions used in pricing our subsidiaries’ products and in establishing related insurance reserves, which may reduce future earnings; • Changes in accounting principles that may affect our consolidated financial statements; • Lowering of one or more of our debt ratings issued by nationally recognized statistical rating organizations and the adverse effect such action may have on our ability to raise capital and on our liquidity and financial condition; • Lowering of one or more of the insurer financial strength ratings of our insurance subsidiaries and the adverse effect such action may have on the premium writings, policy retention, and profitability of our insurance subsidiaries and liquidity; • Significant credit, accounting, fraud, corporate governance or other issues that may adversely affect the value of certain financial assets, as well as counterparties to which we are exposed to credit risk, requiring that we realize losses on financial assets; • Interruption in or failure of the telecommunication, information technology or other operational systems of the company or the third parties on whom we rely or failure to safeguard the confidentiality or privacy of sensitive data on such systems, including from cyberattacks or other breaches in security of such systems; • The effect of acquisitions and divestitures, including the inability to realize the anticipated benefits of acquisitions and dispositions of businesses and potential operating difficulties and unforeseen liabilities relating thereto, as well as the effect of restructurings, product withdrawals and other unusual items; • The inability to realize or sustain the benefits we expect from, greater than expected investments in, and the potential impact of efforts related to, our strategic initiatives; • The adequacy and collectability of reinsurance that we have obtained; • Pandemics, acts of terrorism, war or other man-made and natural catastrophes that may adversely impact liabilities for policyholder claims and adversely affect our businesses and the cost and availability of reinsurance; • Competitive conditions, including pricing pressures, new product offerings and the emergence of new competitors, that may affect the level of premiums and fees that our subsidiaries can charge for their products; • The unknown effect on our subsidiaries’ businesses resulting from evolving market preferences and the changing demographics of our client base; and • The unanticipated loss of key management or wholesalers. The risks and uncertainties included here are not exhaustive. Our most recent Form 10-K, as well as other reports that we file with the SEC, include additional factors that could affect our businesses and financial performance. Moreover, we operate in a rapidly changing and competitive environment. New risk factors emerge from time to time, and it is not possible for management to predict all such risk factors. Further, it is not possible to assess the effect of all risk factors on our businesses or the extent to which any factor, or combination of factors, may cause actual results to differ materially from those contained in any forward-looking statements. Given these risks and uncertainties, investors should not place undue reliance on forward-looking statements as a prediction of actual results. In addition, Lincoln disclaims any obligation to correct or update any forward-looking statements to reflect events or circumstances that occur after the date of this press release. The reporting of Risk-Based Capital (“RBC”) measures is not intended for the purpose of ranking any insurance company or for use in connection with any marketing, advertising or promotional activities.


3 >420% Significant buffer above capital target 1 Represents Adjusted Operating Income Available to Common Stockholders. See Non-GAAP Financial Measures Appendix for definition and reconciliations. 2 The RBC ratio is calculated as of December 31 annually, but is reported in the March statutory reporting, and as such, the ratio presented is considered an estimate based on information known at the time of reporting. 3 See Non-GAAP Financial Measures Appendix for definition and reconciliation. 2Q25 Scorecard -330bps YoY Equity growth drove improvement +32% YoY Diversified earnings mix supported profitable growth +5% YoY Third highest sales quarter +250bps YoY 5th consecutive quarter with over $100M in earnings $32M In-line alternative investment income and favorable mortality Adjusted Operating Income1 Leverage Ratio3 Annuities Sales Life Operating Income Group Protection Operating Margin Estimated RBC Ratio2


4 • Group Protection sales up 16% YoY driven by local market and supplemental health sales. • Life Insurance sales were up 15% YoY as momentum in risk-sharing products continued. • Annuities sales increased 5% YoY supported by a diversified and balanced product mix. • Retirement Plan Services achieved strong deposit growth, up 10% YoY. $ in millions After- tax Per share Adjusted Operating Income, ex. normalizing items $427 $2.36 Normalizing item Alternative investment income compared to our 10% long-term return target - - Adjusted Operating Income1 $427 $2.36 2Q25 Key Messages 1 Represents Adjusted Operating Income Available to Common Stockholders. See Non-GAAP Financial Measures Appendix for definition and reconciliations. 2 The RBC ratio is calculated as of December 31 annually, but is reported in the March statutory reporting, and as such, the ratio presented is considered an estimate based on information known at the time of reporting. 3 See Non-GAAP Financial Measures Appendix for definition and reconciliations. Diversified earnings sources contributed to sustained, profitable growth • Adjusted operating income1 increased 32% YoY, the 4th consecutive quarter of YoY growth. • Group Protection record earnings up 33% YoY, and record margin was 12.5%, up 250 bps. • Life Insurance earnings of $32M with in-line alternative inv. income and favorable mortality. Another quarter of strong sales growth driven by differentiated mix of products Capital strengthened further, enhanced by close of Bain Capital transaction • Estimated RBC ratio2 >420%, consistent with goal to hold capital buffer above 400% target. • Leverage ratio3 improved 330bps YoY to 25.6%, driven primarily by equity growth. • $1B P-Caps issuance increased access to on-demand capital while extending duration to 2055.


5 Annuities Group Protection Operating Income Primary Drivers Operating Income Primary Drivers Retirement Plan Services Life Insurance Operating Income Primary Drivers Operating Income Primary Drivers • Favorable life experience • Favorable disability results • Sustained growth in supplemental health 2Q25 Earnings Drivers $ in millions • Favorable equity markets • Growth in spread-based earnings • Lower net G&A expenses • Traditional variable annuity outflows • Favorable equity markets • Stable value outflows • Higher alternative investment income • Favorable mortality • Lower net G&A expenses $297 $287 2Q24 2Q25 $130 $173 2Q24 2Q25 $40 $37 2Q24 2Q25 $(35) $32 2Q24 2Q25


6 Key Highlights Operating Income1 ($M) Sales ($B) • Operating income decreased 3% YoY, as outflows drove a decline in traditional VA average account balances2, partially offset by favorable equity markets. • Sales increased 5% YoY, with spread-based products comprising 66% of total sales. • Ending account balances2 grew 5% YoY driven by RILA account balance growth and favorable equity markets. Key Priorities Ending Account Balances2 ($B) Return on Average Account Balances2 • Grow our addressable market by extending reach to spread-based products. • Increase market competitiveness through development of new product features. • Optimize general account to support spread expansion. 6% 6% 6% 7% 6% 20% 20% 21% 21% 22% 30% 30% 30% 30% 29% 44% 44% 43% 42% 43% 2Q24 3Q24 4Q24 1Q25 2Q25 Fixed RILA VA w/o GLBs VA w/ GLBs $160 $165 $164 $158 $168 Annuities 0.75% 0.74% 0.73% 0.71% 0.72% 2Q24 3Q24 4Q24 1Q25 2Q25 $297 $300 $303 $290 $287 2Q24 3Q24 4Q24 1Q25 2Q25 44% 30% 15% 23% 30% 29% 36% 35% 34% 36% 11% 14% 16% 14% 11% 16% 20% 34% 29% 23% 2Q24 3Q24 4Q24 1Q25 2Q25 Fixed RILA VA w/o GLB VA w/ GLB $3.8 $4.0 $3.4 1 Excludes $1M in 3Q24 related to annual assumption review. 2 Net of reinsurance. $3.7 $3.8


7 Key Highlights Operating Income1 ($M) Sales ($M) • Record operating income up 33%, record margin up 250 bps YOY, driven by life experience and favorable LTD results. • Excluding the annual experience refund, earnings were up 48% and the margin increased by 320 bps YoY. • Premiums were 7% higher YoY driven by prior-year sales and strong persistency; Growth in the local market segment and strong supplemental health sales drove total sales up 16% YOY. Key Priorities Premiums & Margin1,2 ($M) Loss Ratios1,2 • Diversify across market segments with an emphasis on growing local markets. • Expand and deepen product portfolio with a focus on growth in supplemental health. • Continued pricing discipline focused on profitable growth while investing in capabilities to improve the customer experience. $1,298 $1,288 $1,274 $1,371 $1,386 10.0% 8.4% 7.4% 12.5% 8.2% 8.5% 11.4% 0.0% 2.0% 4.0% 6.0% 8.0% 10.0% 12.0% 14.0% 16.0% 18.0% 20.0% $- $200 $400 $600 $800 $1,000 $1,200 $1,400 2Q24 3Q24 4Q24 1Q25 2Q25 Premiums Margin Margin, ex. Experience Refund Group Protection 46% 43% 54% 31% 38% 34% 31% 37% 24% 30% 20% 26% 9% 45% 32% 2Q24 3Q24 4Q24 1Q25 2Q25 Disability Life Supp Health / Dental 76% 72% 65% 75% 67% 70% 71% 75% 70% 67% 2Q24 3Q24 4Q24 1Q25 2Q25 Life Disability $467 $161 $84 1 Excludes $(1)M in 3Q24 related to annual assumption review. 2 Excludes the after-tax impact of the $23M and $15M experience refund in 2Q24 and 2Q25, respectively. 3 Life loss ratio includes supplemental health. 3 2Q24 3Q24 4Q24 1Q25 2Q25 Operating Income Experience Refund $130 $110 $107 $101 $157 $173 $187


8 Retirement Plan Services Key Highlights Operating Income ($M) First-year Sales ($B) • Operating income decreased by 8% YoY, primarily due to stable value outflows, partially offset by favorable equity markets. • First year sales grew almost 50% driven by strong stable value sales. • Ending account balances were up 8% YoY, resulting from favorable equity markets. Key Priorities Ending Account Balances ($B) Net G&A Expenses ($M) • Growth in core recordkeeping and institutional market segments through our differentiated service model. • Expand access to retirement solutions by leveraging distribution relationships and product innovation. • Increase operational and expense efficiencies to drive down our cost per participant and improve profitability. 78% 79% 79% 79% 80% 22% 21% 21% 21% 20% $108 $114 $113 $109 $116 2Q24 3Q24 4Q24 1Q25 2Q25 General Account Separate Account and Mutual Funds $40 $44 $43 $34 $37 2Q24 3Q24 4Q24 1Q25 2Q25 $80 $81 $82 $81 $80 2Q24 3Q24 4Q24 1Q25 2Q25 49% 27% 45% 31% 32% 23% 62% 35% 44% 26% 28% 11% 20% 25% 42% 2Q24 3Q24 4Q24 1Q25 2Q25 Sm. Market Mid-Large Market Stable Value/Other $1.7 $1.3 $0.8 $1.1 $1.2


9 Key Highlights Operating Income (Loss)1 ($M) Sales ($M) • Operating income improved by $67 million, driven by higher alternative investment income and favorable mortality. • Total sales increased 15% YoY as sales momentum in risk-sharing products continued. • Net G&A expenses declined 2% YoY, reflecting improved operational efficiency. Key Priorities Net Death Benefits ($M) Net G&A Expenses ($M) • Optimize product portfolio to support pivot toward products with more stable cash flows and higher risk-adjusted returns. • Continue efforts to reduce expense base to drive cost efficiency and earnings growth. • Maintain focus on optimizing the legacy in force and increase earnings. 92% 91% 85% 80% 83% 8% 9% 15% 20% 17% 13% 8% 14% 19% 13% 19% 14% 1Q24 2Q24 3Q24 4Q24 1Q25 Underlying Earnings Alts Above Target Alts Below Target $125 $126 $129 $119 $122 2Q24 3Q24 4Q24 1Q25 2Q25 $4 $8 $(22) $(1) $32 $(39) $6 $7 $(15) 2Q24 3Q24 4Q24 1Q25 2Q25 $644 $638 $690 $684 $621 $608 $663 $706 $610 $690 2Q24 3Q24 4Q24 1Q25 2Q25 Net death benefits Death claims ceded $(15) $(35) $14 1 Excludes $8M in 3Q24 related to annual assumption review. $(16) Life Insurance $32 91% 85% 80% 82% 72% 9% 15% 20% 18% 28% $105 $122 $119 $97 $121 2Q24 3Q24 4Q24 1Q25 2Q25 Core Executive Benefits


10 Key Highlights Operating Loss and Preferred Dividend ($M) Interest Expense ($M) • Operating loss was $91 million, down 6% YoY due to lower interest and net G&A expenses. • Interest expense decreased $5 million YoY, reflecting lower average outstanding debt and a decline in rates on floating rate debt. • Leverage ratio improved by 330 basis points driven by equity growth. Key Priorities Net G&A Expenses1 ($M) Leverage Ratio2 • Reduce leverage ratio through continued growth in capital and opportunistic deleveraging. • Continued focus on operational efficiency, including the conclusion of Spark initiative-related projects in 2025. Other Operations ($97) ($84) ($95) ($95) ($91) ($11) ($34) ($11) ($34) ($11) 2Q24 3Q24 4Q24 1Q25 2Q25 Operating Loss Preferred Dividend $86 $86 $83 $80 $81 2Q24 3Q24 4Q24 1Q25 2Q25 28.9% 28.4% 27.8% 27.5% 25.6% 2Q24 3Q24 4Q24 1Q25 2Q25 $62 $62 $66 $62 $55 2Q24 3Q24 4Q24 1Q25 2Q25 1 Excludes the impact of expenses related to Other Operations associated with the sale of the wealth management business in periods 2Q24, 3Q24, 4Q24, and 1Q25. 2 See Non-GAAP Financial Measures Appendix for definition and reconciliations.


11 38% 38% 38% 38% 37% 18% 18% 17% 18% 17% 14% 14% 15% 15% 16% 17% 18% 18% 18% 18% 3% 3% 3% 3% 3% 10% 9% 9% 8% 9% 2Q24 3Q24 4Q24 1Q25 2Q25 Public Corps Private Corps Structured Mortgage Loans Alts Other Investment Portfolio Key Highlights Investment Portfolio ($B) Rated Assets Portfolio Quality • Well-diversified portfolio with 97% investment grade rated assets. • Achieved a 6.1% new money yield; ~150bps above the portfolio yield, driven by the rate environment and our investment strategy optimization. • Our diversified alternatives portfolio delivered a 2.5% quarterly return or 10% annualized return, in- line with our long-term expectation of 10%. Key Priorities New Money Yields Alternative Investment Income ($M), Pre-Tax • Leveraging the sourcing capabilities and security selection of our multi-manager platform for portfolio construction. • Optimizing our new money strategy with focus on maintaining diversification and high quality while capitalizing on less liquid assets and structured asset class premiums. • Achieving attractive risk-adjusted alternative returns. $119 $118 $119 $119 1 2 $122 62% 62% 62% 62% 63% 35% 35% 35% 35% 34% 3% 3% 3% 3% 3% 2Q24 3Q24 4Q24 1Q25 2Q25 NAIC 1/CM1 NAIC 2/CM2 NAIC 3-6/CM3-7 4.50% 4.53% 4.55% 4.57% 4.61% 6.9% 6.4% 6.2% 6.0% 6.1% 2Q24 3Q24 4Q24 1Q25 2Q25 Portfolio Yield New Money Yield $36 $100 $105 $75 $101 1.0% 2.7% 2.8% 1.9% 2.5% 2Q24 3Q24 4Q24 1Q25 2Q25 % Returns, Unannualized 1 Mortgage Loans include CMLs and RMLs. 2 Other includes municipals, cash, ICOLI assets, common and preferred stock, sovereign government and UST/agency.


12 Appendix


13 Industrial Other 2% Energy 2% Municipal 2% Communications 2% Basic Industry 2% Transportation 3% Alts 3% Technology 3% Consumer Cyclical 5% Capital Goods 5% Other2 7% Utilities 9% Consumer Non- Cyclical 10% Financials 7% Banking 4% Structured 16% CMLs 14% RMLs 4% Investment Portfolio High quality and well-diversified portfolio1 The portfolio is well-positioned • Long-term investment strategy is tightly aligned with our liability profile and positioned for various economic cycles. • 97% investment grade, the portfolio remains high quality, providing flexibility to further add incremental yield. • Well positioned to further optimize the portfolio asset allocation given high-quality asset mix and shift toward shorter duration liabilities. $122B Average A- Rated Portfolio allocation by asset class 1 Data on slide is as of June 30, 2025. 2 Other includes cash, ICOLI assets, common and preferred stock, sovereign government and UST/agency. Note: All information regarding LNC’s investment portfolio in this earnings supplement excludes assets related to certain modified coinsurance and coinsurance with funds withheld transactions. The modified coinsurance and funds withheld reinsurance agreements investment portfolio has counterparty protections in place including investment guidelines, as well as additional support including trusts and letters of credit that were established to meet LNC’s risk management objectives.


14 Non-GAAP Financial Measures Appendix


15 Non-GAAP Financial Measures Non-GAAP Financial Measures Non-GAAP financial measures do not replace the most directly comparable GAAP measures. Reconciliations of the following non-GAAP financial measures to the most directly comparable GAAP financial measures or calculations of such measures, as applicable, are presented herein beginning on slide 17. Adjusted Income (Loss) From Operations Adjusted income (loss) from operations is GAAP net income (loss) excluding the effects of the following items, as applicable: • Items related to annuity product features, which include changes in market risk benefits (“MRBs”), changes in the fair value of the related hedge instruments inclusive of income allocated to support the cost of hedging or future benefits, and changes in the fair value of the embedded derivative liabilities and the associated index options for our indexed annuity products (collectively, “net annuity product features”); • Items related to life insurance product features, which include changes in the fair value of derivatives we hold as part of variable universal life insurance (“VUL”) hedging, changes in reserves resulting from benefit ratio unlocking associated with the impact of capital markets, and changes in the fair value of the embedded derivative liabilities of our indexed universal life insurance (“IUL”) contracts and the associated index options we hold to hedge them (collectively, “net life insurance product features”); • Credit loss-related adjustments on fixed maturity available-for-sale (“AFS”) securities, mortgage loans on real estate and reinsurance-related assets (“credit loss-related adjustments”); • Changes in the fair value of equity securities and certain other investments, the impact of certain derivatives, and realized gains (losses) on sales, disposals and impairments of financial assets (collectively, “investment gains (losses)”); • Changes in the fair value of reinsurance-related embedded derivatives, trading securities and mortgage loans on real estate electing the fair value option (“changes in the fair value of reinsurance-related embedded derivatives, trading securities and certain mortgage loans”); • Income (loss) from the initial adoption of new accounting standards, accounting policy changes and new regulations, including changes in tax law; • Income (loss) from reserve changes, net of related amortization, on business sold through reinsurance; • Losses from the impairment of intangible assets and gains (losses) on other non-financial assets; • Income (loss) from discontinued operations; • Other items, which include the following: certain legal and regulatory accruals; severance expense related to initiatives that realign the workforce; transaction, integration and other costs related to mergers and acquisitions, including the acquisition or divestiture, through reinsurance or other means, of businesses or blocks of business, and certain other corporate initiatives; mark-to-market adjustment related to the LNC stock component of our deferred compensation plans (“deferred compensation mark-to-market adjustment”); gains (losses) on modification or early extinguishment of debt; and impacts from settlement or curtailment of defined benefit obligations; and • Income tax benefit (expense) related to the above pre-tax items, including the effect of tax adjustments such as changes to deferred tax valuation allowances. Adjusted income (loss) from operations available to common stockholders is defined as after-tax adjusted income (loss) from operations less preferred stock dividends.


16 Non-GAAP Financial Measures, Cont’d Management believes that the use of the non-GAAP financial measures adjusted income (loss) from operations, adjusted income (loss) from operations available to common stockholders (or adjusted operating income) and adjusted income (loss) from operations per diluted share available to common stockholders is helpful to investors in evaluating the company’s performance. Management believes that excluding the following items from adjusted income (loss) from operations enhances understanding of the underlying trends and long-term performance of the company’s business. Management excludes “net annuity product features” as this adjustment primarily represents the difference between the valuation of reserves and the valuation of derivatives utilized for hedging our variable annuity and indexed annuity products, which can fluctuate significantly from period to period based on changes in equity markets and interest rates. This difference is due to the hedge focus on managing risks to statutory capital as opposed to the GAAP reserves. Management excludes “net life insurance product features” for similar reasons. In addition, management excludes “credit loss-related adjustments” and “investment gains (losses)” as the timing of changes in allowances or sales of credit-impaired investments depends largely on market credit cycles and can vary considerably from period to period and the timing of other sales of investments that would result in gains or losses is driven by market conditions, including interest rates, and other factors. Management excludes “changes in the fair value of reinsurance-related embedded derivatives, trading securities and certain mortgage loans” as this adjustment represents the economics of investments in underlying funds withheld portfolios supporting reinsurance agreements that have been transferred to third-party reinsurers, which is not indicative of our ongoing results. Finally, management excludes from adjusted income (loss) from operations certain additional items (as set forth in the definition above) that are not necessarily indicative of current operating fundamentals or future performance of the business segments, and, in most instances, decisions regarding these items do not necessarily relate to the operations of the individual segments. Management believes excluding these items better explains the results of the company’s ongoing businesses in a manner that allows for enhanced understanding of underlying trends, company performance and business fundamentals. Adjusted Stockholders’ Equity Adjusted stockholders’ equity is stockholders’ equity, excluding AOCI, preferred stock, changes in MRBs, guaranteed living benefit (“GLB”) and guaranteed death benefit (“GDB”) hedge instruments gains (losses), and the difference between amounts recognized in net income (loss) on reinsurance-related embedded derivatives and the underlying asset portfolios (“reinsurance-related embedded derivatives and portfolio gains (losses)”). Management believes this metric is useful to investors to analyze our net worth because it eliminates the effect of market movements that can fluctuate significantly from period to period, primarily related to changes in equity markets and interest rates. Stockholders’ equity is the most directly comparable GAAP measure. Leverage Ratio Leverage ratio is a measure that we use to monitor the level of our debt relative to our total capitalization. Debt used in this metric reflects total debt and preferred stock adjusted for certain items. Total capitalization reflects debt used in the numerator of this ratio and stockholders' equity adjusted for certain items.


17 Reconciliation of Net Income (Loss) Available to Common Stockholders to Adjusted Income (Loss) from Operations Available to Common Stockholders Unaudited (millions of dollars, except per share data) For the Three Months Ended 6/30/24 9/30/24 12/31/24 3/31/25 6/30/25 Net Income Net income (loss) available to common stockholders – diluted $ 884 $ (562) $ 1,675 $ (756) $ 688 Less: Preferred stock dividends declared (11) (34) (11) (34) (11) Net income (loss) 895 (528) 1,686 (722) 699 Less: Net annuity product features, pre-tax (1) 252 (381) 1,187 (1,092) 405 Net life insurance product features, pre-tax 4 (125) 46 42 (58) Credit loss-related adjustments, pre-tax (34) (88) (28) (28) (25) Investment gains (losses), pre-tax (230) (105) (67) (103) (81) Changes in the fair value of reinsurance-related embedded derivatives, trading securities and certain mortgage loans, pre-tax (2) 201 (446) 587 (90) 14 Gains (losses) on other non-financial assets – sale of subsidiaries/businesses, pre-tax (3) 584 (2) — — — Other items, pre-tax (4)(5)(6)(7)(8) (33) (19) (32) (35) 75 Income tax benefit (expense) related to the above pre-tax items (184) 246 (350) 270 (69) Total adjustments 560 (920) 1,343 (1,036) 261 Adjusted income (loss) from operations 335 392 343 314 438 Add: Preferred stock dividends declared (11) (34) (11) (34) (11) Adjusted income (loss) from operations available to common stockholders $ 324 $ 358 $ 332 $ 280 $ 427 Earnings (Loss) Per Common Share – Diluted Net income (loss) (diluted) $ 5.11 $ (3.29) $ 9.63 $ (4.41) $ 3.80 Adjusted income (loss) from operations (diluted) 1.87 2.06 1.91 1.60 2.36 Refer to following slide 18 for footnotes to table.


18 Reconciliation of Net Income (Loss) Available to Common Stockholders to Adjusted Income (Loss) from Operations Available to Common Stockholders (continued from previous slide) Unaudited (millions of dollars) (1) Includes changes in MRBs of $126 million, $(666) million, $1,282 million, $(1,302) million and $932 million; changes in the fair value of the related hedge instruments inclusive of income allocated to support the cost of hedging or future benefits of $50 million, $188 million, $(212) million, $274 million and $(595) million; and changes in the fair value of the embedded derivative liabilities and the associated index options for our indexed annuity products of $76 million, $97 million, $117 million, $(64) million and $68 million for the second quarter of 2024, third quarter of 2024, fourth quarter of 2024, first quarter of 2025 and second quarter of 2025, respectively. (2) Includes primarily changes in the fair value of the embedded derivative related to the fourth quarter 2023 reinsurance transaction. (3) Relates to the sale of our wealth management business, which provided approximately $650 million of statutory capital benefit. (4) For the fourth quarter of 2024, includes certain legal accruals of $(15) million and regulatory accruals of $(12) million related to estimated state guaranty fund assessments net of estimated state premium tax recoveries. (5) Includes severance expense related to initiatives to realign the workforce of $(7) million, $(16) million, $(2) million, $(6) million and $(2) million in the second quarter of 2024, third quarter of 2024, fourth quarter of 2024, first quarter of 2025 and second quarter of 2025, respectively. (6) Includes transaction, integration and other costs related to mergers, acquisitions, divestitures and certain other corporate initiatives of $(27) million, $(2) million, $(1) million and $(20) million in the second quarter of 2024, third quarter of 2024, fourth quarter of 2024 and first quarter of 2025, respectively, primarily related to the sale of our wealth management business and $(18) million in the second quarter of 2025 primarily related to the Bain Capital transaction. (7) Includes deferred compensation mark-to-market adjustment of $1 million, $(1) million, $(2) million, $(9) million and $1 million in the second quarter of 2024, third quarter of 2024, fourth quarter of 2024, first quarter of 2025 and second quarter of 2025, respectively. (8) Includes gains (losses) on early extinguishment of debt of $94 million in the second quarter of 2025.


19 Reconciliation of Adjusted Income (Loss) from Operations Available to Common Stockholders to Adjusted Income (Loss) from Operations Available to Common Stockholders, excluding Significant Items Unaudited (millions of dollars) For the Three Months Ended 6/30/24 9/30/24 12/31/24 3/31/25 6/30/25 Adjusted income from operations available to common stockholders1 $324 $358 $332 $280 $427 Significant items: Annual assumption review - (8) - - - Total significant items - (8) - - - Adjusted income from operations available to common stockholders, excluding significant items $324 $350 $332 $280 $427 (1) See reconciliation to Net Income (Loss) Available to Common Stockholders on slide 17.


20 Leverage Ratio Unaudited (millions of dollars) As of or For the Three Months Ended 6/30/24 9/30/24 12/31/24 3/31/25 6/30/25 Leverage Ratio Short-term debt $ 450 $ 300 $ 300 $ — $ — Long-term debt 5,716 5,897 5,856 5,868 5,767 Total debt 6,166 6,197 6,156 5,868 5,767 Preferred stock 986 986 986 986 986 Total debt and preferred stock 7,152 7,183 7,142 6,854 6,753 Less: Operating debt (1) 867 867 868 868 868 Pre-funding of upcoming debt maturities 300 300 300 — — 25% of capital securities and subordinated notes 302 302 302 302 247 50% of preferred stock 493 493 493 493 493 Carrying value of fair value hedges and other items 123 153 111 122 119 Total numerator $ 5,067 $ 5,068 $ 5,068 $ 5,069 $ 5,026 Adjusted stockholders’ equity (2) $ 11,698 $ 11,967 $ 12,367 $ 12,569 $ 13,873 Add: 25% of capital securities and subordinated notes 302 302 302 302 247 50% of preferred stock 493 493 493 493 493 Total numerator 5,067 5,068 5,068 5,069 5,026 Total denominator $ 17,560 $ 17,830 $ 18,230 $ 18,433 $ 19,639 Leverage ratio 28.9 % 28.4 % 27.8 % 27.5 % 25.6 % (1) We have categorized as operating debt the senior notes issued in October 2007 and June 2010 because the proceeds were used as a long-term structured solution to reduce the strain on increasing statutory reserves associated with secondary guarantee universal life insurance and term policies. (2) See reconciliation to stockholders’ equity on slide 21.


21 Reconciliation of Stockholders’ Equity to Adjusted Stockholders’ Equity Unaudited (millions of dollars) As of or For the Three Months Ended 6/30/24 9/30/24 12/31/24 3/31/25 6/30/25 Stockholders’ Equity, End-of-Period Stockholders’ equity $ 7,949 $ 9,013 $ 8,269 $ 8,193 $ 9,548 Less: Preferred stock 986 986 986 986 986 AOCI (4,369) (2,682) (5,036) (4,306) (4,392) Stockholders’ equity, excluding AOCI and preferred stock 11,332 10,709 12,319 11,513 12,954 Changes in MRBs 2,673 2,147 3,165 2,133 2,869 GLB and GDB hedge instruments gains (losses) (2,770) (2,763) (3,062) (2,993) (3,602) Reinsurance-related embedded derivatives and portfolio gains (losses) (269) (642) (151) (196) (186) Adjusted stockholders’ equity $ 11,698 $ 11,967 $ 12,367 $ 12,569 $ 13,873