Exhibit 99.1
|
|
18135 BURKE ST. OMAHA, NE 68022 TEL: 402-829-6800 FAX: 402-829-6836 |

For further information, contact:
| LINDSAY CORPORATION: | THREE PART ADVISORS: | |
| Brian Ketcham | Hala Elsherbini | |
| Senior Vice President & Chief Financial Officer | 214-442-0016 | |
| 402-827-6579 | ||
Lindsay Corporation Reports Fiscal 2021 Second Quarter Results
| • | Second quarter operating income increased 83 percent on a 26 percent increase in revenues |
| • | Improved agricultural market conditions drive improved Irrigation performance |
| • | Infrastructure results fueled by increase in Road Zipper System® sales and leases |
OMAHA, Neb., April 6, 2021—Lindsay Corporation (NYSE: LNN), a leading global manufacturer and distributor of irrigation and infrastructure equipment and technology, today announced results for its second quarter of fiscal 2021, which ended on February 28, 2021.
Second Quarter Summary
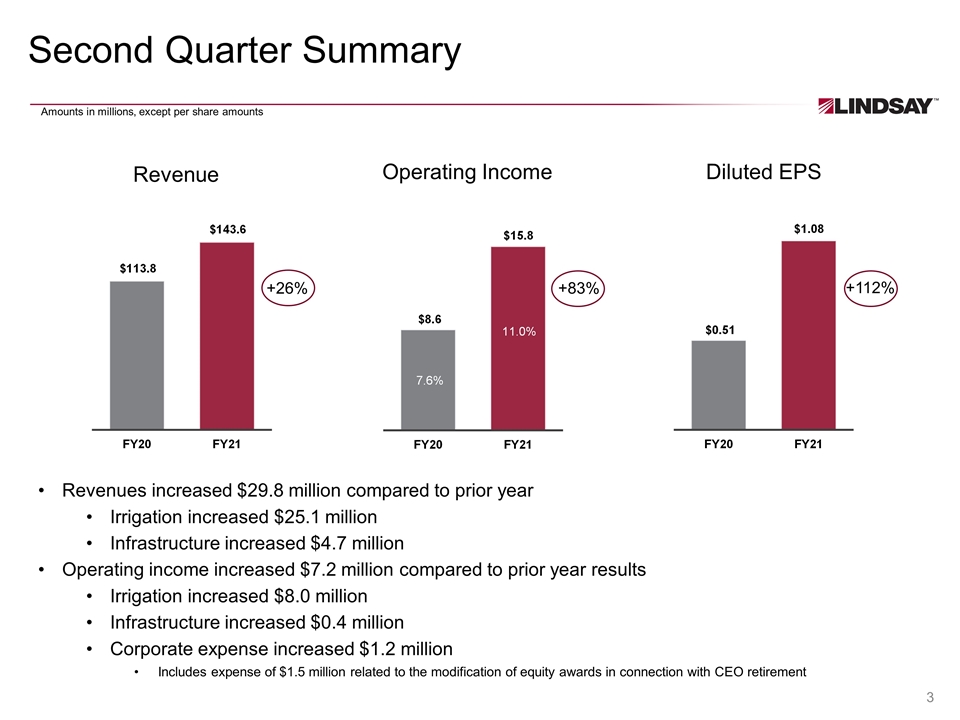
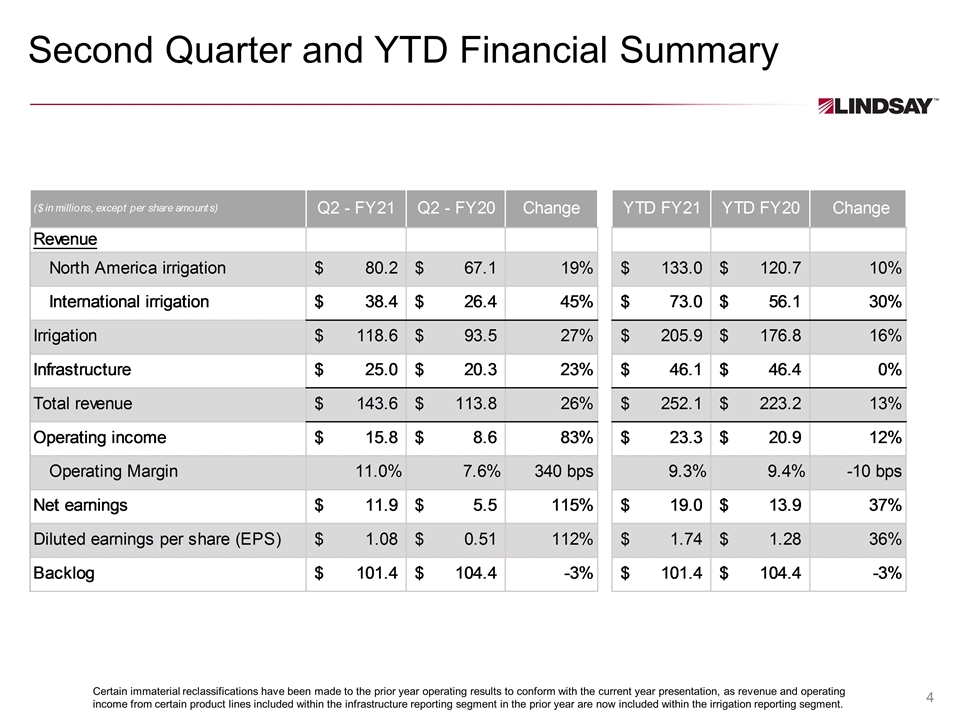
Revenues for the second quarter of fiscal 2021 were $143.6 million, an increase of $29.8 million, or 26 percent, compared to revenues of $113.8 million in the prior year second quarter. Net earnings for the quarter were $11.9 million, or $1.08 per diluted share, compared with net earnings of $5.5 million, or $0.51 per diluted share, for the prior year second quarter.
“Second quarter results were aided by improved agricultural market conditions as commodity prices reached their highest level in several years. We experienced strong demand for irrigation equipment throughout the quarter in North America as well as most international markets,” said Randy Wood, President and Chief Executive Officer. “Improved results in our infrastructure business resulted from higher Road Zipper System® sales and lease revenue,” Mr. Wood continued.
Second Quarter Segment Results
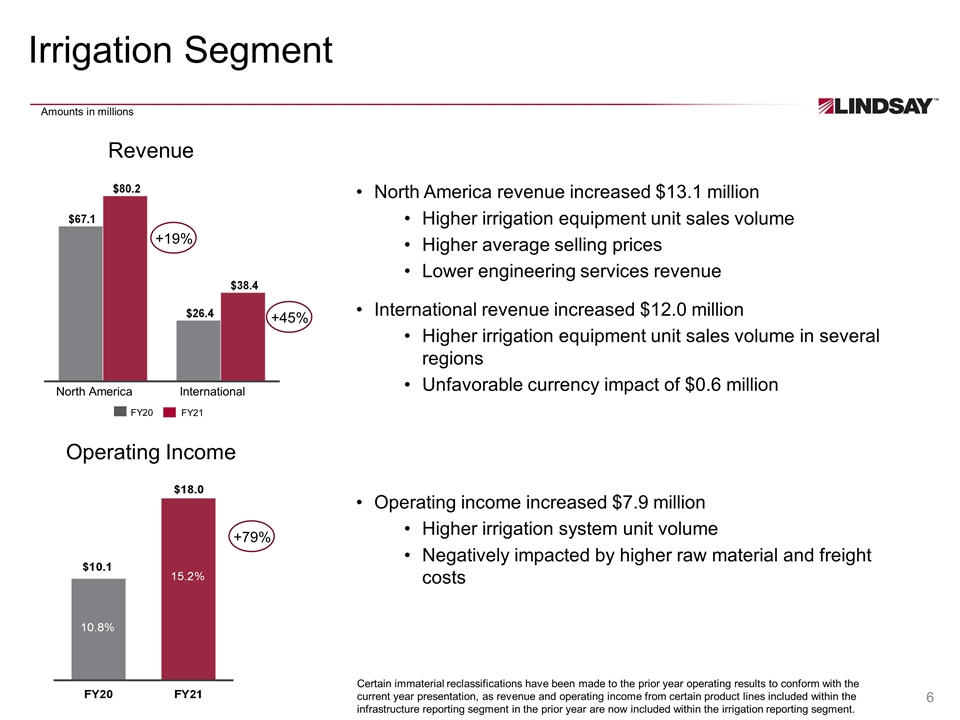
Irrigation segment revenues for the second quarter of fiscal 2021 increased $25.1 million, or 27 percent, to $118.6 million compared to $93.5 million in the prior year second quarter. North America irrigation revenues increased $13.1 million, or 19 percent, to $80.2 million compared to the prior year second quarter. The increase resulted primarily from higher irrigation equipment unit sales volume and higher average selling prices. The increase was partially offset by revenue from engineering project services in the prior year that did not repeat. International irrigation revenues of $38.4 million increased $12.0 million, or 45 percent, compared to the prior year second quarter. The increase resulted from higher unit sales volumes in several international markets.
Irrigation segment operating income was $18.0 million, an increase of $7.9 million, or 79 percent, compared to the prior year second quarter. Operating margin was 15.2 percent of sales, compared to 10.8 percent of sales in the prior year second quarter. The increase resulted primarily from the impact of higher irrigation system unit volume and was partially offset by the impact of higher raw material and freight costs.
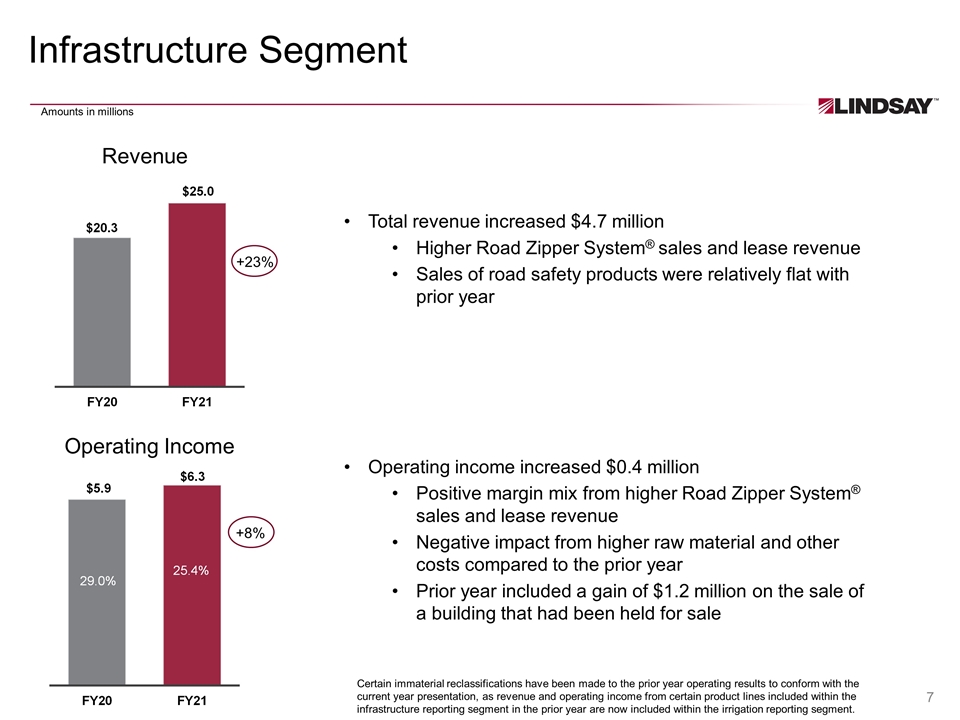
Infrastructure segment revenues for the second quarter of fiscal 2021 increased $4.7 million, or 23 percent, to $25.0 million, compared to $20.3 million in the prior year second quarter. The increase resulted primarily from higher Road Zipper System® sales and lease revenue.
Infrastructure segment operating income was $6.3 million, an increase of $0.4 million, or 8 percent, compared to the prior year second quarter. Operating margin was 25.4 percent of sales, compared to 29.0 percent of sales in the prior year second quarter. Prior year operating income included a gain of $1.2 million on the sale of a building that had been held for sale.
The backlog of unfilled orders at February 28, 2021 was $101.4 million compared with $104.4 million at February 29, 2020. Included in these backlogs are amounts of $2.7 million and $5.5 million, respectively, that are not expected to be fulfilled within the subsequent twelve months. The decrease in backlog is due to two large infrastructure orders in the prior year totaling $38 million that did not repeat, while order backlogs in North America and international irrigation are higher compared to the prior year.
Outlook
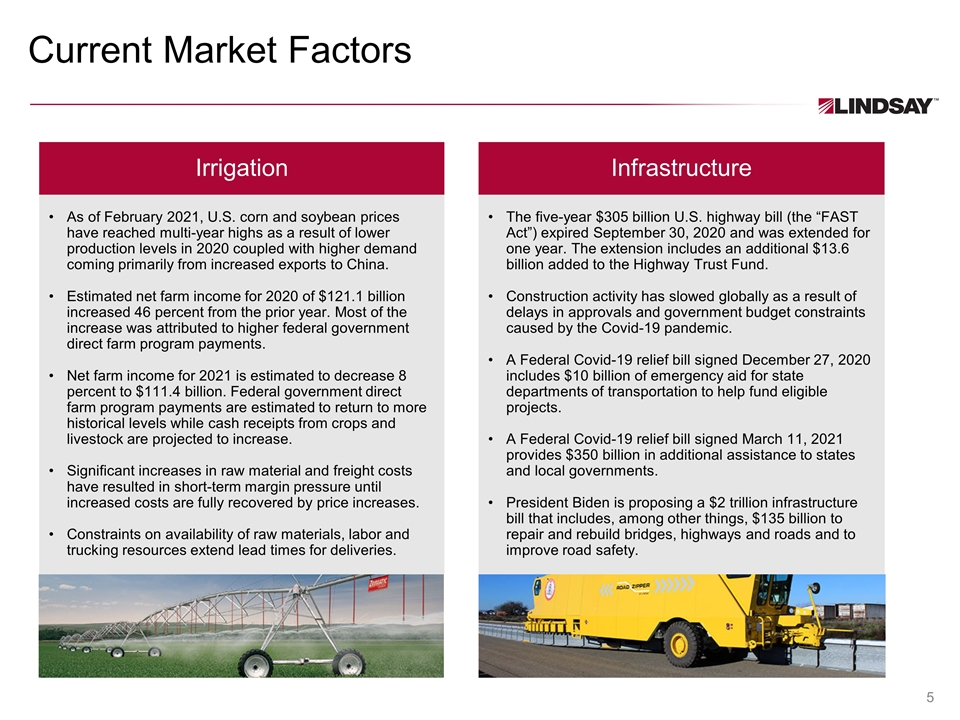
“Solid agricultural market fundamentals set the stage for improved irrigation equipment demand for the balance of the year. Significantly higher raw material and freight costs, along with supply chain constraints, continue to present challenges but our teams have been effective in working through these issues,” said Mr. Wood. “In our infrastructure business, while our sales pipeline remains robust, we expect continued coronavirus-related delays in road construction activity and projects.
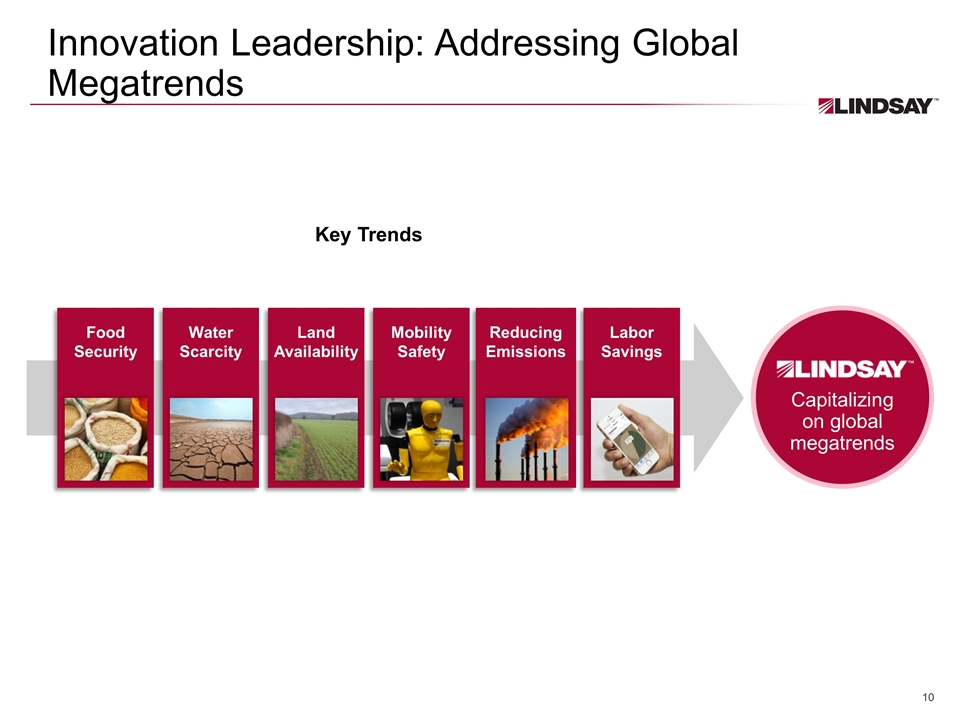
Mr. Wood continued, “Our financial position remains strong, providing support for our innovation growth strategy across our businesses that address global megatrends and provide solutions that improve customer profitability and assist in their sustainability efforts.”
Second Quarter Conference Call
Lindsay’s fiscal 2021 second quarter investor conference call is scheduled for 11:00 a.m. Eastern Time today. Interested investors may participate in the call by dialing (833) 535-2202 in the U.S., or (412) 902-6745 internationally, and requesting the Lindsay Corporation call. Additionally, the conference call will be simulcast live on the Internet and can be accessed via the investor relations section of the Company’s Web site, www.lindsay.com. Replays of the conference call will remain on our Web site through the next quarterly earnings release. The Company will have a slide presentation available to augment management’s formal presentation, which will also be accessible via the Company’s Web site.
About the Company
Lindsay Corporation (NYSE: LNN) is a leading global manufacturer and distributor of irrigation and infrastructure equipment and technology. Established in 1955, the company has been at the forefront of research and development of innovative solutions to meet the food, fuel, fiber and transportation needs of the world’s rapidly growing population. The Lindsay family of irrigation brands includes Zimmatic® center pivot and lateral move agricultural irrigation systems and FieldNET® remote irrigation management and scheduling technology, as well as irrigation consulting and design and industrial IoT solutions. Also a global leader in the transportation industry, Lindsay Transportation Solutions manufactures equipment to improve road safety and keep traffic moving on the world’s roads, bridges and tunnels, through the Barrier Systems®, Road Zipper® and Snoline™ brands. For more information about Lindsay Corporation, visit www.lindsay.com.
Concerning Forward-looking Statements
This release contains forward-looking statements that are subject to risks and uncertainties and which reflect management’s current beliefs and estimates of future economic circumstances, industry conditions, Company performance and financial results. You can find a discussion of many of these risks and uncertainties in the annual, quarterly and current reports that the Company files with the Securities and Exchange Commission. Forward-looking statements include information concerning possible or assumed future results of operations and planned financing of the Company and those statements preceded by, followed by or including the words “anticipate,” “estimate,” “believe,” “intend,” “expect,” “outlook,” “could,” “may,” “should,” “will,” or similar expressions. For these statements, the Company claims the protection of the safe harbor for forward-looking statements contained in the Private Securities Litigation Reform Act of 1995. The Company undertakes no obligation to update any forward-looking information contained in this press release.
2
LINDSAY CORPORATION AND SUBSIDIARIES
CONDENSED CONSOLIDATED STATEMENTS OF EARNINGS
(Unaudited)
| Three months ended | Six months ended | |||||||||||||||
| (in thousands, except per share amounts) |
February 28, 2021 |
February 29, 2020 |
February 28, 2021 |
February 29, 2020 |
||||||||||||
| Operating revenues |
$ | 143,577 | $ | 113,788 | $ | 252,062 | $ | 223,181 | ||||||||
| Cost of operating revenues |
102,403 | 80,382 | 179,480 | 155,701 | ||||||||||||
|
|
|
|
|
|
|
|
|
|||||||||
| Gross profit |
41,174 | 33,406 | 72,582 | 67,480 | ||||||||||||
|
|
|
|
|
|
|
|
|
|||||||||
| Operating expenses: |
||||||||||||||||
| Selling expense |
7,778 | 8,192 | 15,110 | 14,684 | ||||||||||||
| General and administrative expense |
14,275 | 13,167 | 27,727 | 24,971 | ||||||||||||
| Engineering and research expense |
3,312 | 3,405 | 6,402 | 6,907 | ||||||||||||
|
|
|
|
|
|
|
|
|
|||||||||
| Total operating expenses |
25,365 | 24,764 | 49,239 | 46,562 | ||||||||||||
|
|
|
|
|
|
|
|
|
|||||||||
| Operating income |
15,809 | 8,642 | 23,343 | 20,918 | ||||||||||||
| Other (expense) income: |
||||||||||||||||
| Interest expense |
(1,205 | ) | (1,191 | ) | (2,406 | ) | (2,377 | ) | ||||||||
| Interest income |
268 | 389 | 571 | 1,004 | ||||||||||||
| Other expense, net |
(311 | ) | (973 | ) | (65 | ) | (1,423 | ) | ||||||||
|
|
|
|
|
|
|
|
|
|||||||||
| Total other (expense) income |
(1,248 | ) | (1,775 | ) | (1,900 | ) | (2,796 | ) | ||||||||
|
|
|
|
|
|
|
|
|
|||||||||
| Earnings before income taxes |
14,561 | 6,867 | 21,443 | 18,122 | ||||||||||||
| Income tax expense |
2,685 | 1,351 | 2,472 | 4,261 | ||||||||||||
|
|
|
|
|
|
|
|
|
|||||||||
| Net earnings |
$ | 11,876 | $ | 5,516 | $ | 18,971 | $ | 13,861 | ||||||||
|
|
|
|
|
|
|
|
|
|||||||||
| Earnings per share: |
||||||||||||||||
| Basic |
$ | 1.09 | $ | 0.51 | $ | 1.75 | $ | 1.28 | ||||||||
| Diluted |
$ | 1.08 | $ | 0.51 | $ | 1.74 | $ | 1.28 | ||||||||
| Shares used in computing earnings per share: |
||||||||||||||||
| Basic |
10,884 | 10,825 | 10,865 | 10,810 | ||||||||||||
| Diluted |
10,981 | 10,857 | 10,934 | 10,843 | ||||||||||||
| Cash dividends declared per share |
$ | 0.32 | $ | 0.31 | $ | 0.64 | $ | 0.62 | ||||||||
3
LINDSAY CORPORATION AND SUBSIDIARIES
SUMMARY OPERATING RESULTS
(Unaudited)
| Three months ended | Six months ended | |||||||||||||||
| (in thousands) |
February 28, 2021 |
February 29, 2020 |
February 28, 2021 |
February 29, 2020 |
||||||||||||
| Operating revenues: |
||||||||||||||||
| Irrigation: |
||||||||||||||||
| North America |
$ | 80,178 | $ | 67,088 | 132,968 | $ | 120,675 | |||||||||
| International |
38,394 | 26,406 | 72,961 | 56,145 | ||||||||||||
|
|
|
|
|
|
|
|
|
|||||||||
| Irrigation segment |
118,572 | 93,494 | $ | 205,929 | $ | 176,820 | ||||||||||
| Infrastructure segment |
25,005 | 20,294 | 46,133 | 46,361 | ||||||||||||
|
|
|
|
|
|
|
|
|
|||||||||
| Total operating revenues |
$ | 143,577 | $ | 113,788 | $ | 252,062 | $ | 223,181 | ||||||||
|
|
|
|
|
|
|
|
|
|||||||||
| Operating income (loss): |
||||||||||||||||
| Irrigation segment |
$ | 18,045 | $ | 10,084 | $ | 28,678 | $ | 19,867 | ||||||||
| Infrastructure segment |
6,341 | 5,888 | 10,597 | 14,630 | ||||||||||||
| Corporate |
(8,577 | ) | (7,330 | ) | (15,932 | ) | (13,579 | ) | ||||||||
|
|
|
|
|
|
|
|
|
|||||||||
| Total operating income |
$ | 15,809 | $ | 8,642 | $ | 23,343 | $ | 20,918 | ||||||||
|
|
|
|
|
|
|
|
|
|||||||||
The Company manages its business activities in two reportable segments as follows:
Irrigation - This reporting segment includes the manufacture and marketing of center pivot, lateral move and hose reel irrigation systems and large diameter steel tubing as well as various innovative technology solutions such as GPS positioning and guidance, variable rate irrigation, remote irrigation management and scheduling technology, irrigation consulting and design and industrial IoT solutions.
Infrastructure – This reporting segment includes the manufacture and marketing of moveable barriers, specialty barriers, crash cushions and end terminals, and road marking and road safety equipment.
Certain immaterial reclassifications have been made to the prior year operating results to conform with current year presentation, as revenues and operating income from certain product lines previously included within the Infrastructure reporting segment are now included within the Irrigation reporting segment.
4
LINDSAY CORPORATION AND SUBSIDIARIES
CONDENSED CONSOLIDATED BALANCE SHEETS
(Unaudited)
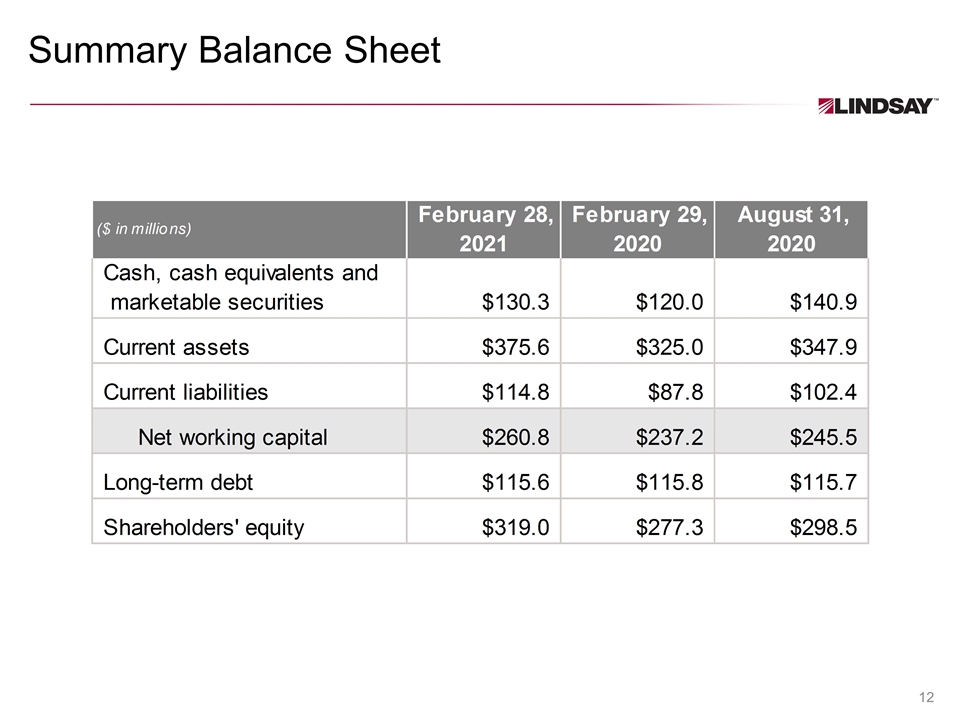
| (in thousands) |
February 28, 2021 |
February 29, 2020 |
August 31, 2020 |
|||||||||
| ASSETS |
||||||||||||
| Current assets: |
||||||||||||
| Cash and cash equivalents |
$ | 110,775 | $ | 101,272 | $ | 121,403 | ||||||
| Marketable securities |
19,555 | 18,740 | 19,511 | |||||||||
| Receivables, net |
94,211 | 80,468 | 84,604 | |||||||||
| Inventories, net |
121,566 | 105,454 | 104,792 | |||||||||
| Other current assets, net |
29,509 | 19,083 | 17,625 | |||||||||
|
|
|
|
|
|
|
|||||||
| Total current assets |
375,616 | 325,017 | 347,935 | |||||||||
|
|
|
|
|
|
|
|||||||
| Property, plant, and equipment, net |
89,221 | 68,762 | 79,581 | |||||||||
| Intangibles, net |
22,383 | 23,162 | 23,477 | |||||||||
| Goodwill |
68,087 | 64,338 | 68,004 | |||||||||
| Operating lease right-of-use assets |
20,173 | 27,257 | 27,457 | |||||||||
| Deferred income tax assets |
10,347 | 10,162 | 9,935 | |||||||||
| Other noncurrent assets, net |
10,821 | 15,632 | 14,137 | |||||||||
|
|
|
|
|
|
|
|||||||
| Total assets |
$ | 596,648 | $ | 534,330 | $ | 570,526 | ||||||
|
|
|
|
|
|
|
|||||||
| LIABILITIES AND SHAREHOLDERS’ EQUITY |
||||||||||||
| Current liabilities: |
||||||||||||
| Accounts payable |
$ | 39,934 | $ | 33,307 | $ | 29,554 | ||||||
| Current portion of long-term debt |
215 | 211 | 195 | |||||||||
| Other current liabilities |
74,687 | 54,303 | 72,646 | |||||||||
|
|
|
|
|
|
|
|||||||
| Total current liabilities |
114,836 | 87,821 | 102,395 | |||||||||
|
|
|
|
|
|
|
|||||||
| Pension benefits liabilities |
6,182 | 5,868 | 6,374 | |||||||||
| Long-term debt |
115,599 | 115,765 | 115,682 | |||||||||
| Operating lease liabilities |
20,174 | 25,919 | 25,862 | |||||||||
| Deferred income tax liabilities |
900 | 839 | 889 | |||||||||
| Other noncurrent liabilities |
19,933 | 20,791 | 20,806 | |||||||||
|
|
|
|
|
|
|
|||||||
| Total liabilities |
277,624 | 257,003 | 272,008 | |||||||||
|
|
|
|
|
|
|
|||||||
| Shareholders’ equity: |
||||||||||||
| Preferred stock |
— | — | — | |||||||||
| Common stock |
18,990 | 18,918 | 18,918 | |||||||||
| Capital in excess of stated value |
84,206 | 74,645 | 77,686 | |||||||||
| Retained earnings |
511,728 | 481,890 | 499,724 | |||||||||
| Less treasury stock - at cost |
(277,238 | ) | (277,238 | ) | (277,238 | ) | ||||||
| Accumulated other comprehensive loss, net |
(18,662 | ) | (20,888 | ) | (20,572 | ) | ||||||
|
|
|
|
|
|
|
|||||||
| Total shareholders’ equity |
319,024 | 277,327 | 298,518 | |||||||||
|
|
|
|
|
|
|
|||||||
| Total liabilities and shareholders’ equity |
$ | 596,648 | $ | 534,330 | $ | 570,526 | ||||||
|
|
|
|
|
|
|
|||||||
5
LINDSAY CORPORATION AND SUBSIDIARIES
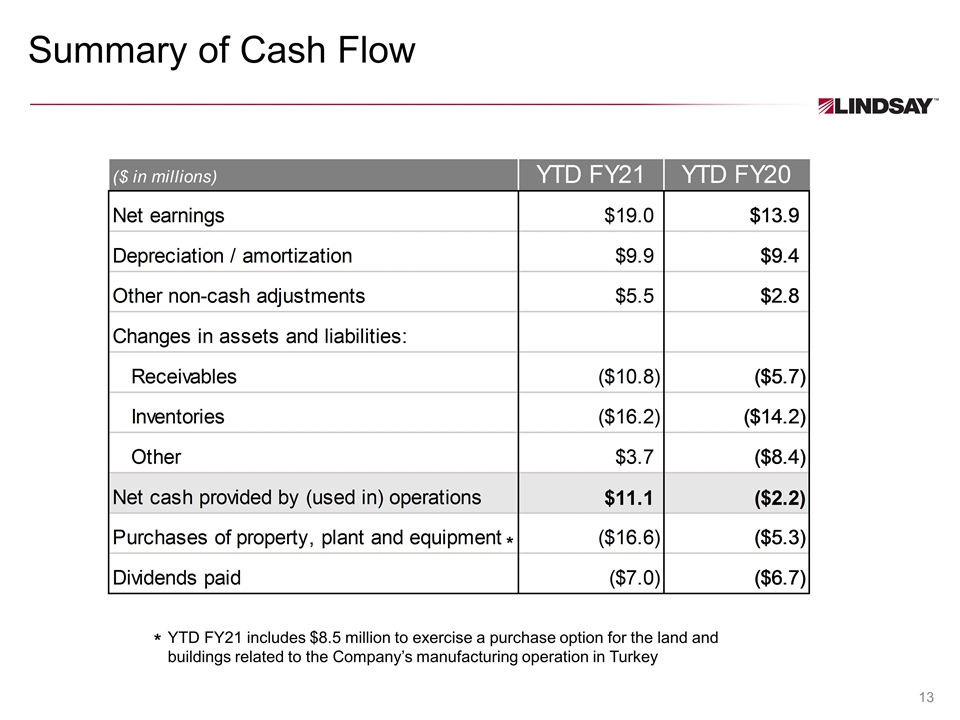
CONDENSED CONSOLIDATED STATEMENTS OF CASH FLOWS
(Unaudited)
| Six months ended | ||||||||
| (in thousands) |
February 28, 2021 |
February 29, 2020 |
||||||
| CASH FLOWS FROM OPERATING ACTIVITIES: |
||||||||
| Net earnings |
$ | 18,971 | $ | 13,861 | ||||
| Adjustments to reconcile net earnings to net cash provided by (used in) operating activities: |
||||||||
| Depreciation and amortization |
9,878 | 9,418 | ||||||
| Gain on sale of assets held-for-sale |
— | (1,191 | ) | |||||
| Provision for uncollectible accounts receivable |
246 | 213 | ||||||
| Deferred income taxes |
206 | 1,806 | ||||||
| Share-based compensation expense |
4,047 | 2,575 | ||||||
| Unrealized foreign currency transaction (gain) loss |
(754 | ) | 1,515 | |||||
| Other, net |
1,804 | (2,153 | ) | |||||
| Changes in assets and liabilities: |
||||||||
| Receivables |
(10,769 | ) | (5,716 | ) | ||||
| Inventories |
(16,245 | ) | (14,153 | ) | ||||
| Other current assets |
(9,492 | ) | (4,539 | ) | ||||
| Accounts payable |
10,962 | 3,540 | ||||||
| Other current liabilities |
334 | (2,183 | ) | |||||
| Other noncurrent assets and liabilities |
1,940 | (5,178 | ) | |||||
|
|
|
|
|
|||||
| Net cash provided by (used in) operating activities |
11,128 | (2,185 | ) | |||||
|
|
|
|
|
|||||
| CASH FLOWS FROM INVESTING ACTIVITIES: |
||||||||
| Purchases of property, plant, and equipment |
(16,556 | ) | (5,335 | ) | ||||
| Proceeds from sale of property and equipment held-for-sale |
— | 3,955 | ||||||
| Purchases of marketable securities available-for-sale |
(8,313 | ) | (19,978 | ) | ||||
| Proceeds from maturities of marketable securities available-for-sale |
8,043 | 1,250 | ||||||
| Other investing activities, net |
(860 | ) | 1,092 | |||||
|
|
|
|
|
|||||
| Net cash used in investing activities |
(17,686 | ) | (19,016 | ) | ||||
|
|
|
|
|
|||||
| CASH FLOWS FROM FINANCING ACTIVITIES: |
||||||||
| Proceeds from exercise of stock options |
3,814 | 1,545 | ||||||
| Common stock withheld for payroll tax obligations |
(1,269 | ) | (1,111 | ) | ||||
| Principal payments on long-term debt |
(88 | ) | (104 | ) | ||||
| Dividends paid |
(6,967 | ) | (6,711 | ) | ||||
|
|
|
|
|
|||||
| Net cash used in financing activities |
(4,510 | ) | (6,381 | ) | ||||
|
|
|
|
|
|||||
| Effect of exchange rate changes on cash and cash equivalents |
440 | 1,650 | ||||||
| Net change in cash and cash equivalents |
(10,628 | ) | (25,932 | ) | ||||
| Cash and cash equivalents, beginning of period |
121,403 | 127,204 | ||||||
|
|
|
|
|
|||||
| Cash and cash equivalents, end of period |
$ | 110,775 | $ | 101,272 | ||||
|
|
|
|
|
|||||
6