Exhibit 99.1
February 26, 2020
For 6:00 am ET Release
LOWE’S REPORTS FOURTH QUARTER SALES AND EARNINGS RESULTS
-- Diluted Earnings Per Share of $0.66 --
-- Adjusted Diluted Earnings Per Share1 of $0.94 --
-- Provides Fiscal 2020 Business Outlook --
-- Expects Strong Adjusted Operating Income1 Growth of 8 to 12 percent in 2020 --
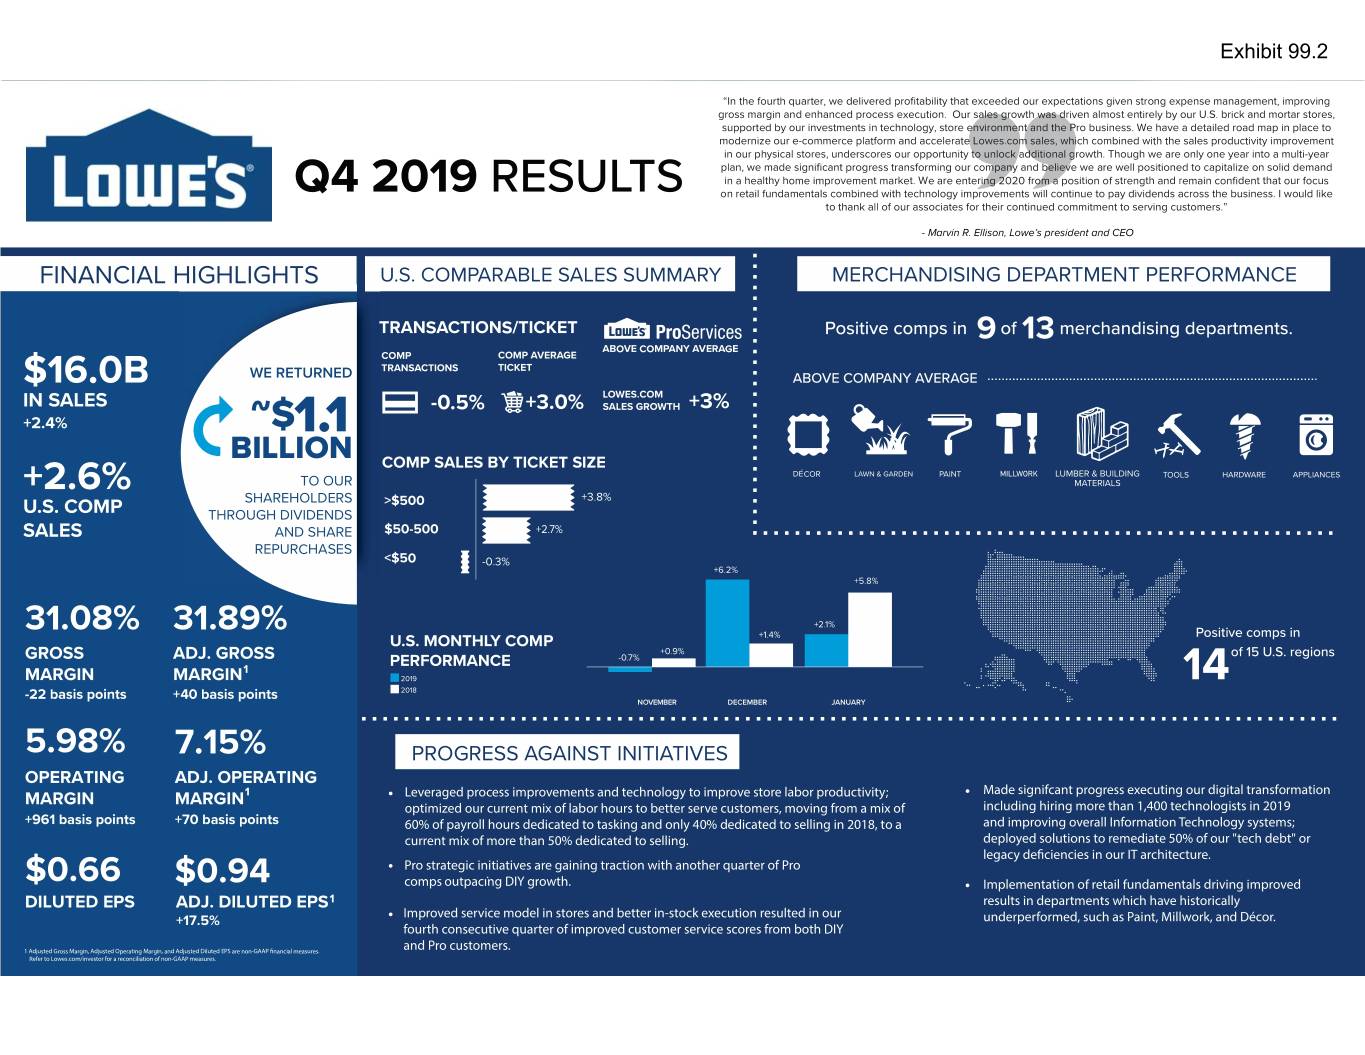
MOORESVILLE, N.C. – Lowe’s Companies, Inc. (NYSE: LOW) today reported net earnings of $509 million and diluted earnings per share of $0.66 for the quarter ended Jan. 31, 2020, which included pre-tax operating costs and charges of $185 million further described below, compared to a net loss of $824 million and diluted loss per share of ($1.03) in the fourth quarter of 2018. Excluding the impact of these charges, adjusted diluted earnings per share1 increased 17.5 percent to $0.94 from adjusted diluted earnings per share1 of $0.80 in the fourth quarter of 2018.
The pre-tax operating costs and charges referenced above resulted from the company’s previously disclosed strategic review of its Canadian operations and closure of its Mexico business, resulting in pre-tax operating costs and charges of $185 million consisting of inventory liquidation, accelerated depreciation and amortization, severance and other costs.
Sales for the fourth quarter were $16.0 billion compared to $15.6 billion in the fourth quarter of 2018, and comparable sales increased 2.5 percent. Comparable sales for the U.S. home improvement business increased 2.6 percent for the fourth quarter.
“In the fourth quarter, we delivered profitability that exceeded our expectations given strong expense management, improving gross margin and enhanced process execution. Our sales growth was driven almost entirely by our U.S. brick and mortar stores, supported by our investments in technology, store environment and the Pro business. We have a detailed road map in place to modernize our e-commerce platform and accelerate Lowes.com sales, which combined with the sales productivity improvement in our physical stores, underscores our opportunity to unlock additional growth,” commented Marvin R. Ellison, Lowe’s president and CEO.
“Though we are only one year into a multi-year plan, we made significant progress transforming our company and believe we are well positioned to capitalize on solid demand in a healthy home improvement market. We are entering 2020 from a position of strength and remain confident that our focus on retail fundamentals combined with technology improvements will continue to pay dividends across the business. I would like to thank all of our associates for their continued commitment to serving customers,” added Ellison.
1 Adjusted diluted earnings per share, adjusted operating income and adjusted operating margin are non-GAAP financial measures. Refer to the “Non-GAAP Financial Measures Reconciliation” section of this release for additional information as well as reconciliations between the Company’s GAAP and non-GAAP financial results.
Delivering on its commitment to return excess cash to shareholders, the Company repurchased $670 million of stock under its share repurchase program and paid $423 million in dividends in the fourth quarter.
As of Jan 31, 2020, Lowe’s operated 1,977 home improvement and hardware stores in the United States and Canada representing 208.2 million square feet of retail selling space.
A conference call to discuss fourth quarter 2019 operating results is scheduled for today (Wednesday, Feb. 26) at 9:00 am ET. The conference call will be available by webcast and can be accessed by visiting Lowe’s website at www.Lowes.com/investor and clicking on Lowe’s Fourth Quarter 2019 Earnings Conference Call Webcast. Supplemental slides will be available approximately 15 minutes prior to the start of the conference call. A replay of the call will be archived on Lowes.com/investor until May 20, 2020.
Fiscal Year 2020 (comparisons to fiscal year 2019)
| |
• | Total sales growth of approximately 2.5 to 3.0 percent. |
| |
• | Comparable sales growth of approximately 3.0 to 3.5 percent. |
| |
• | Operating income growth of approximately 12 to 16 percent. |
| |
• | Adjusted operating income1 growth of approximately 8 to 12 percent. |
| |
• | Operating income as a percentage of sales (operating margin) increase of approximately 80 to 100 basis points. |
| |
• | Adjusted operating income1 as a percentage of sales (adjusted operating margin1) increase of approximately 50 to 70 basis points. |
| |
• | Effective income tax rate and adjusted effective income tax rate of approximately 24.5%. |
| |
• | Target leverage ratio of 2.75x, therefore the Company expects to repurchase approximately $5 billion of stock. |
| |
• | Diluted earnings per share of $6.38 to $6.58. |
| |
• | Adjusted diluted earnings per share1 of $6.45 to $6.65. |
|
|
Disclosure Regarding Forward-Looking Statements |
This press release includes “forward-looking statements” within the meaning of the Private Securities Litigation Reform Act of 1995. Statements including words such as “believe”, “expect”, “anticipate”, “plan”, “desire”, “project”, “estimate”, “intend”, “will”, “should”, “could”, “would”, “may”, “strategy”, “potential”, “opportunity” and similar expressions are forward-looking statements. Forward-looking statements involve estimates, expectations, projections, goals, forecasts, assumptions, risks and uncertainties. Forward-looking statements include, but are not limited to, statements about future financial and operating results, Lowe’s plans, objectives, business outlook, priorities, expectations and intentions, expectations for sales growth, comparable sales, earnings and performance, shareholder value, capital expenditures, cash flows, the housing market, the home improvement industry, demand for services, share repurchases, Lowe’s strategic initiatives, including those relating to acquisitions and dispositions by Lowe’s and the expected impact of such transactions on our strategic and operational plans and financial results, and any statement of an assumption underlying any of the foregoing and other statements that are not historical facts. Although we believe that the expectations, opinions, projections and comments reflected in these forward-looking statements are reasonable, such statements involve risks and uncertainties and we can give no assurance that such statements will prove to be correct. Actual results may differ materially from those expressed or implied in such statements.
A wide variety of potential risks, uncertainties and other factors could materially affect our ability to achieve the results either expressed or implied by these forward-looking statements including, but not limited to, changes in general economic conditions, such as the rate of unemployment, interest rate and currency fluctuations, fuel and other energy costs, slower growth in personal income, changes in consumer spending, changes in the rate of housing turnover, the availability of consumer credit and of mortgage financing, inflation or deflation of commodity prices, recently enacted or proposed tariffs, and disruptions caused by our recent management and key personnel changes, and other factors that can negatively affect our customers, as well as our ability to: (i) respond to adverse trends in the housing industry, a reduced rate of growth in household formation, and slower rates of growth in housing renovation and repair activity, as well as uneven recovery in commercial building activity; (ii) secure, develop, and otherwise implement new technologies and processes necessary to realize the benefits of our strategic initiatives focused on omni-channel sales and marketing presence and enhance our efficiency, and otherwise successfully execute on our strategy and implement our strategic initiatives, including acquisitions, dispositions and the closing of certain stores and facilities; (iii) attract, train, and retain highly-qualified associates; (iv) manage our business effectively as we adapt our operating model to meet the changing expectations of our customers; (v) maintain, improve, upgrade and protect
our critical information systems from system outages, data security breaches, ransomware and other cyber threats; (vi) respond to fluctuations in the prices and availability of services, supplies, and products; (vii) respond to the growth and impact of competition; (viii) address changes in existing or new laws or regulations that affect consumer credit, employment/labor, trade, product safety, transportation/logistics, energy costs, health care, tax, environmental issues or privacy and data protection; (ix) positively and effectively manage our public image and reputation and respond appropriately to unanticipated failures to maintain a high level of product and service quality that could result in a negative impact on customer confidence and adversely affect sales; and (x) effectively manage our relationships with selected suppliers of brand name products and key vendors and service providers, including third party installers. In addition, we could experience impairment losses and other charges if either the actual results of our operating stores are not consistent with the assumptions and judgments we have made in estimating future cash flows and determining asset fair values, or we are required to reduce the carrying amount of our investment in certain unconsolidated entities. With respect to acquisitions and dispositions, potential risks include the effect of such transactions on Lowe’s and the target company’s or operating business’s strategic relationships, operating results and businesses generally; our ability to integrate or divest personnel, labor models, financial, IT and other systems successfully; disruption of our ongoing business and distraction of management; hiring additional management and other critical personnel; increasing or decreasing the scope, geographic diversity and complexity of our operations; significant integration or disposition costs or unknown liabilities; and failure to realize the expected benefits of the transaction. For more information about these and other risks and uncertainties that we are exposed to, you should read the “Risk Factors” and “Management’s Discussion and Analysis of Financial Condition and Results of Operations—Critical Accounting Policies and Estimates” included in our most recent Annual Report on Form 10-K filed with the U.S. Securities and Exchange Commission (the “SEC”) and the description of material changes thereto, if any, included in our Quarterly Reports on Form 10-Q or subsequent filings with the SEC.
The forward-looking statements contained in this news release are expressly qualified in their entirety by the foregoing cautionary statements. The foregoing list of important factors that may affect future results is not exhaustive. When relying on forward-looking statements to make decisions, investors and others should carefully consider the foregoing factors and other uncertainties and potential events. All such forward-looking statements are based upon data available as of the date of this release or other specified date and speak only as of such date. All subsequent written and oral forward-looking statements attributable to us or any person acting on our behalf about any of the matters covered in this release are qualified by these cautionary statements and in the “Risk Factors” included in our most recent Annual Report on Form 10-K and the description of material changes thereto, if any, included in our Quarterly Reports on Form 10-Q or subsequent filings with the SEC. We expressly disclaim any obligation to update or revise any forward-looking statement, whether as a result of new information, change in circumstances, future events or otherwise, except as may be required by law.
Lowe’s Companies, Inc. (NYSE: LOW) is a FORTUNE® 50 home improvement company serving approximately 18 million customers a week in the United States and Canada. With fiscal year 2019 sales of $72.1 billion, Lowe’s and its related businesses operate or service more than 2,200 home improvement and hardware stores and employ approximately 300,000 associates. Founded in 1946 and based in Mooresville, N.C., Lowe’s supports the communities it serves through programs focused on creating safe, affordable housing and helping to develop the next generation of skilled trade experts. For more information, visit Lowes.com.
###
|
| | | |
Contacts: | Shareholders’/Analysts’ Inquiries: | | Media Inquiries: |
| Heather Hollander | | Jackie Pardini Hartzell |
| 704-758-3579 | | 704-758-4317 |
| | | |
Lowe’s Companies, Inc.
Consolidated Statements of Current and Retained Earnings (Unaudited)
In Millions, Except Per Share and Percentage Data
|
| | | | | | | | | | | | | | | | | | | | | | | | | | | |
| Three Months Ended | | Year Ended |
| January 31, 2020 | | February 1, 2019 | | January 31, 2020 | | February 1, 2019 |
Current Earnings | Amount | | % Sales | | Amount | | % Sales | | Amount | | % Sales | | Amount | | % Sales |
Net sales | $ | 16,027 |
| | 100.00 |
| | $ | 15,647 |
| | 100.00 |
| | $ | 72,148 |
| | 100.00 |
| | $ | 71,309 |
| | 100.00 |
|
Cost of sales | 11,046 |
| | 68.92 |
| | 10,749 |
| | 68.70 |
| | 49,205 |
| | 68.20 |
| | 48,401 |
| | 67.88 |
|
Gross margin | 4,981 |
| | 31.08 |
| | 4,898 |
| | 31.30 |
| | 22,943 |
| | 31.80 |
| | 22,908 |
| | 32.12 |
|
Expenses: | | | | | | | | | | | | | | | |
Selling, general and administrative | 3,685 |
| | 22.99 |
| | 5,097 |
| | 32.58 |
| | 15,367 |
| | 21.30 |
| | 17,413 |
| | 24.41 |
|
Depreciation and amortization | 338 |
| | 2.11 |
| | 368 |
| | 2.35 |
| | 1,262 |
| | 1.75 |
| | 1,477 |
| | 2.07 |
|
Operating income/(loss) | 958 |
| | 5.98 |
| | (567 | ) | | (3.63 | ) | | 6,314 |
| | 8.75 |
| | 4,018 |
| | 5.64 |
|
Interest - net | 183 |
| | 1.14 |
| | 158 |
| | 1.00 |
| | 691 |
| | 0.96 |
| | 624 |
| | 0.88 |
|
Pre-tax earnings/(loss) | 775 |
| | 4.84 |
| | (725 | ) | | (4.63 | ) | | 5,623 |
| | 7.79 |
| | 3,394 |
| | 4.76 |
|
Income tax provision | 266 |
| | 1.66 |
| | 99 |
| | 0.64 |
| | 1,342 |
| | 1.86 |
| | 1,080 |
| | 1.52 |
|
Net earnings/(loss) | $ | 509 |
| | 3.18 |
| | $ | (824 | ) | | (5.27 | ) | | $ | 4,281 |
| | 5.93 |
| | $ | 2,314 |
| | 3.24 |
|
| | | | | | | | | | | | | | | |
| | | | | | | | | | | | | | | |
Weighted average common shares outstanding - basic | 763 |
| | | | 801 |
| | | | 777 |
| | | | 811 |
| | |
Basic earnings/(loss) per common share (1) | $ | 0.67 |
| | | | $ | (1.03 | ) | | | | $ | 5.49 |
| | | | $ | 2.84 |
| | |
Weighted average common shares outstanding - diluted | 764 |
| | | | 801 |
| | | | 778 |
| | | | 812 |
| | |
Diluted earnings/(loss) per common share (1) | $ | 0.66 |
| | | | $ | (1.03 | ) | | | | $ | 5.49 |
| | | | $ | 2.84 |
| | |
Cash dividends per share | $ | 0.55 |
| | | | $ | 0.48 |
| | | | $ | 2.13 |
| | | | $ | 1.85 |
| | |
| | | | | | | | | | | | | | | |
Retained Earnings | | | | | | | | | | | | | | | |
Balance at beginning of period | $ | 2,238 |
| | | | $ | 5,156 |
| | | | $ | 3,452 |
| | | | $ | 5,425 |
| | |
Cumulative effect of accounting change | — |
| | | | — |
| | | | (263 | ) | | | | 33 |
| | |
Net earnings/(loss) | 509 |
| | | | (824 | ) | | | | 4,281 |
| | | | 2,314 |
| | |
Cash dividends declared | (420 | ) | | | | (385 | ) | | | | (1,653 | ) | | | | (1,500 | ) | | |
Share repurchases | (600 | ) | | | | (495 | ) | | | | (4,090 | ) | | | | (2,820 | ) | | |
Balance at end of period | $ | 1,727 |
| | | | $ | 3,452 |
| | | | $ | 1,727 |
| | | | $ | 3,452 |
| | |
| | | | | | | | | | | | | | | |
| |
(1) | Under the two-class method, earnings per share is calculated using net earnings allocable to common shares, which is derived by reducing net earnings by the earnings allocable to participating securities. Net earnings allocable to common shares used in the basic and diluted earnings per share calculation were $508 million for the three months ended January 31, 2020 and ($825) million for the three months ended February 1, 2019. Net earnings allocable to common shares used in the basic and diluted earnings per share calculation were $4,268 million for the year ended January 31, 2020 and $2,307 million for the year ended February 1, 2019. |
Lowe’s Companies, Inc.
Consolidated Statements of Comprehensive Income (Unaudited)
In Millions, Except Percentage Data
|
| | | | | | | | | | | | | | | | | | | | | | | | | | | |
| Three Months Ended | | Year Ended |
| January 31, 2020 | | February 1, 2019 | | January 31, 2020 | | February 1, 2019 |
| Amount | | % Sales | | Amount | | % Sales | | Amount | | % Sales | | Amount | | % Sales |
Net earnings/(loss) | $ | 509 |
| | 3.18 |
| | $ | (824 | ) | | (5.27 | ) | | $ | 4,281 |
| | 5.93 |
| | $ | 2,314 |
| | 3.24 |
|
Foreign currency translation adjustments - net of tax | 34 |
| | 0.21 |
| | (46 | ) | | (0.27 | ) | | 94 |
| | 0.13 |
| | (221 | ) | | (0.30 | ) |
Other | (6 | ) | | (0.04 | ) | | 2 |
| | — |
| | (21 | ) | | (0.03 | ) | | 1 |
| | — |
|
Other comprehensive income/(loss) | 28 |
| | 0.17 |
| | (44 | ) | | (0.27 | ) | | 73 |
| | 0.10 |
| | (220 | ) | | (0.30 | ) |
Comprehensive income/(loss) | $ | 537 |
| | 3.35 |
| | $ | (868 | ) | | (5.54 | ) | | $ | 4,354 |
| | 6.03 |
| | $ | 2,094 |
| | 2.94 |
|
| | | | | | | | | | | | | | | |
Lowe’s Companies, Inc.
Consolidated Balance Sheets
In Millions, Except Par Value Data |
| | | | | | | | | | |
| | | (Unaudited) | | |
| | | January 31, 2020 | | February 1, 2019 |
Assets | | | | | |
Current assets: | | | | | |
Cash and cash equivalents | | | $ | 716 |
| | $ | 511 |
|
Short-term investments | | | 160 |
| | 218 |
|
Merchandise inventory - net | | | 13,179 |
| | 12,561 |
|
Other current assets | | | 1,263 |
| | 938 |
|
Total current assets | | | 15,318 |
| | 14,228 |
|
Property, less accumulated depreciation | | | 18,669 |
| | 18,432 |
|
Operating lease right-of-use assets | | | 3,891 |
| | — |
|
Long-term investments | | | 372 |
| | 256 |
|
Deferred income taxes - net | | | 216 |
| | 294 |
|
Goodwill | | | 303 |
| | 303 |
|
Other assets | | | 702 |
| | 995 |
|
Total assets | | | $ | 39,471 |
| | $ | 34,508 |
|
| | | | | |
Liabilities and shareholders' equity | | | | | |
Current liabilities: | | | | | |
Short-term borrowings | | | $ | 1,941 |
| | $ | 722 |
|
Current maturities of long-term debt | | | 597 |
| | 1,110 |
|
Current operating lease liabilities | | | 501 |
| | — |
|
Accounts payable | | | 7,659 |
| | 8,279 |
|
Accrued compensation and employee benefits | | | 684 |
| | 662 |
|
Deferred revenue | | | 1,219 |
| | 1,299 |
|
Other current liabilities | | | 2,581 |
| | 2,425 |
|
Total current liabilities | | | 15,182 |
| | 14,497 |
|
Long-term debt, excluding current maturities | | | 16,768 |
| | 14,391 |
|
Noncurrent operating lease liabilities | | | 3,943 |
| | — |
|
Deferred revenue - extended protection plans | | | 894 |
| | 827 |
|
Other liabilities | | | 712 |
| | 1,149 |
|
Total liabilities | | | 37,499 |
| | 30,864 |
|
| | | | | |
Shareholders' equity: | | | | | |
Preferred stock - $5 par value, none issued | | | — |
| | — |
|
Common stock - $0.50 par value; | | | |
| | |
Shares issued and outstanding | | | |
| | |
January 31, 2020 | 763 |
| | |
| | |
February 1, 2019 | 801 |
| | 381 |
| | 401 |
|
Capital in excess of par value | |
| | — |
| | — |
|
Retained earnings | |
| | 1,727 |
| | 3,452 |
|
Accumulated other comprehensive loss | |
| | (136 | ) | | (209 | ) |
Total shareholders' equity | | | 1,972 |
| | 3,644 |
|
Total liabilities and shareholders' equity | | | $ | 39,471 |
| | $ | 34,508 |
|
| |
| | |
| | |
Lowe’s Companies, Inc.
Consolidated Statements of Cash Flows (Unaudited)
In Millions |
| | | | | | | |
| Year Ended |
| January 31, 2020 | | February 1, 2019 |
Cash flows from operating activities: | | | |
Net earnings | $ | 4,281 |
| | $ | 2,314 |
|
Adjustments to reconcile net earnings to net cash provided by operating activities: | | | |
Depreciation and amortization | 1,410 |
| | 1,607 |
|
Noncash lease expense | 468 |
| | — |
|
Deferred income taxes | 177 |
| | (151 | ) |
Loss on property and other assets - net | 117 |
| | 630 |
|
Impairment of goodwill | — |
| | 952 |
|
Loss on cost method and equity method investments | 12 |
| | 9 |
|
Share-based payment expense | 98 |
| | 74 |
|
Changes in operating assets and liabilities: | | | |
Merchandise inventory - net | (600 | ) | | (1,289 | ) |
Other operating assets | (376 | ) | | (110 | ) |
Accounts payable | (637 | ) | | 1,720 |
|
Other operating liabilities | (654 | ) | | 437 |
|
Net cash provided by operating activities | 4,296 |
| | 6,193 |
|
| | | |
Cash flows from investing activities: | | | |
Purchases of investments | (743 | ) | | (1,373 | ) |
Proceeds from sale/maturity of investments | 695 |
| | 1,393 |
|
Capital expenditures | (1,484 | ) | | (1,174 | ) |
Proceeds from sale of property and other long-term assets | 163 |
| | 76 |
|
Other - net | — |
| | (2 | ) |
Net cash used in investing activities | (1,369 | ) | | (1,080 | ) |
| | | |
Cash flows from financing activities: | |
| | |
|
Net change in commercial paper | 220 |
| | (415 | ) |
Net proceeds from issuance of debt | 3,972 |
| | — |
|
Repayment of long-term debt | (1,113 | ) | | (326 | ) |
Proceeds from issuance of common stock under share-based payment plans | 118 |
| | 114 |
|
Cash dividend payments | (1,618 | ) | | (1,455 | ) |
Repurchase of common stock | (4,313 | ) | | (3,037 | ) |
Other - net | (1 | ) | | (5 | ) |
Net cash used in financing activities | (2,735 | ) | | (5,124 | ) |
| | | |
Effect of exchange rate changes on cash | 1 |
| | (12 | ) |
| | | |
Net increase/(decrease) in cash and cash equivalents,
including cash classified within current assets held for sale | 193 |
| | (23 | ) |
Less: Net decrease/increase in cash classified within current
assets held for sale | 12 |
| | (54 | ) |
Net increase/(decrease) in cash and cash equivalents | 205 |
| | (77 | ) |
Cash and cash equivalents, beginning of period | 511 |
| | 588 |
|
Cash and cash equivalents, end of period | $ | 716 |
| | $ | 511 |
|
| | | |
Lowe’s Companies, Inc.
Non-GAAP Financial Measures Reconciliation (Unaudited)
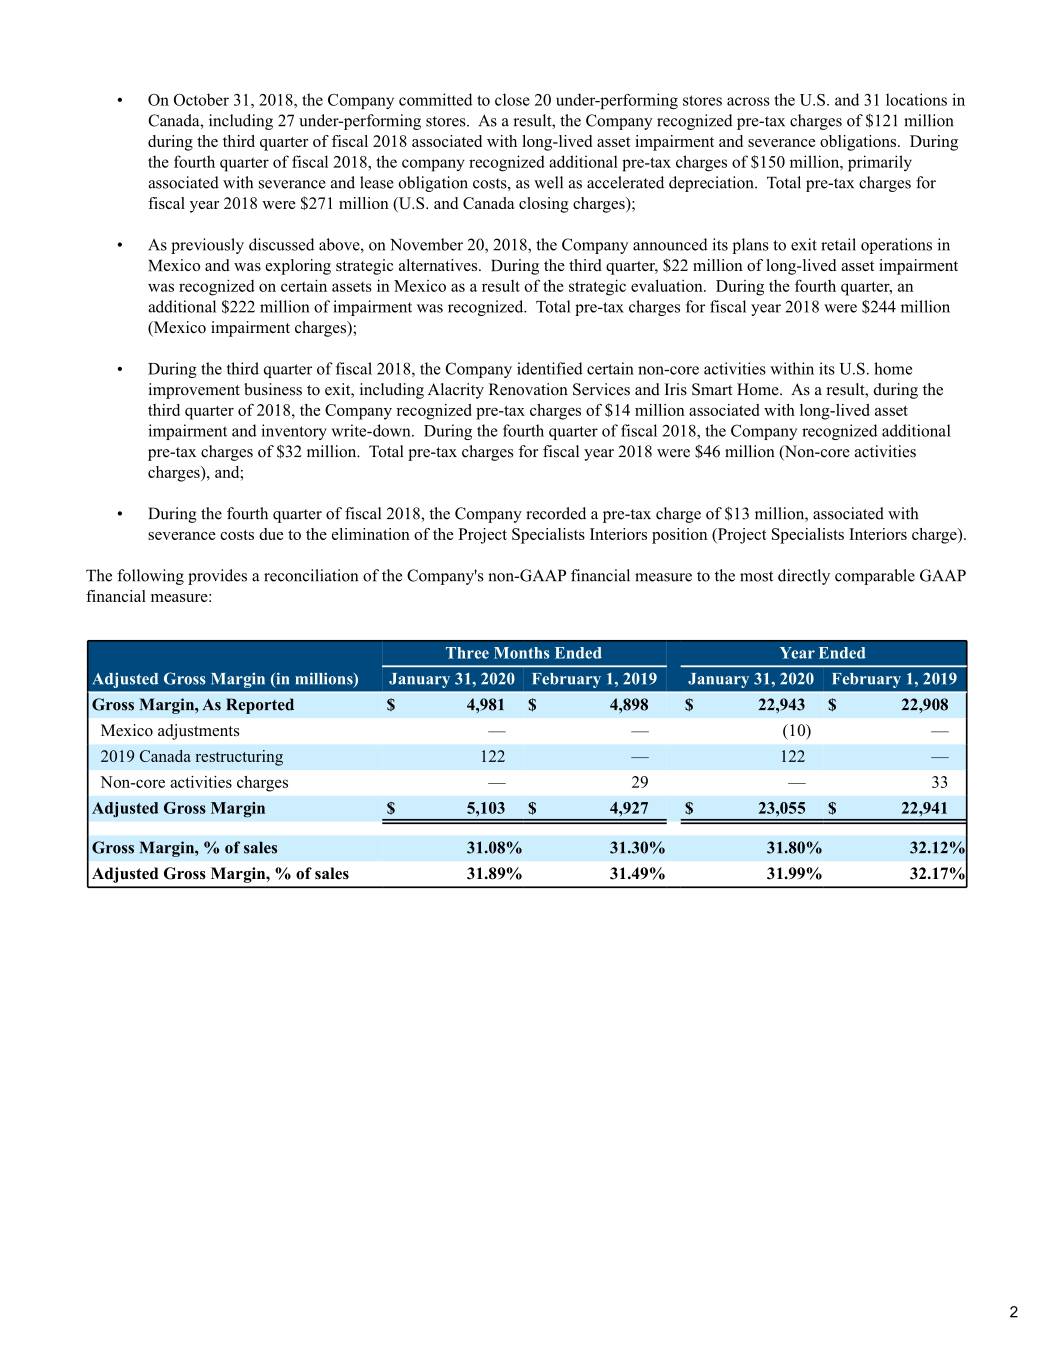
To provide additional transparency, the Company has presented the non-GAAP financial measure of adjusted earnings per share to exclude the impact of certain discrete items, as further described below, not contemplated in Lowe’s Business Outlook for 2019 to assist the user in understanding performance relative to that Business Outlook.
In addition, in the Business Outlook for fiscal 2020, the Company has provided a comparison to the non-GAAP financial measure of adjusted operating income and adjusted operating margin for fiscal 2019, which excludes the impact of certain discrete items, as further described below, not contemplated in Lowe's Business Outlook for 2019, to assist the user in further understanding the Company's forecasted performance for fiscal 2020 in comparison to fiscal 2019.
The Company believes these non-GAAP financial measures provide useful insight for analysts and investors in evaluating the company’s operational performance.
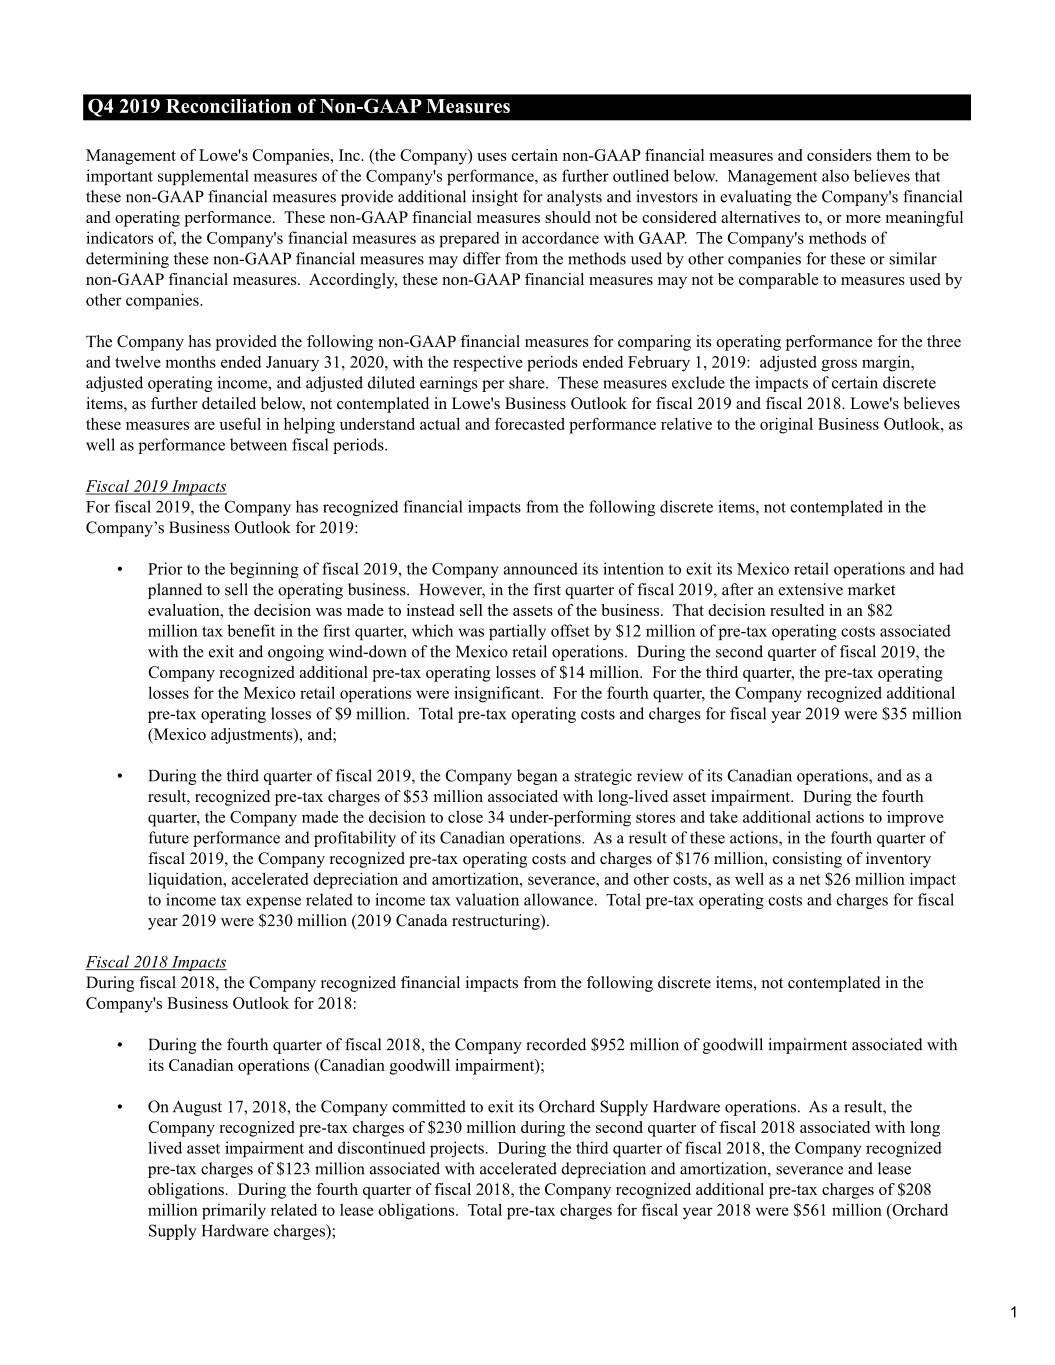
Fiscal 2019 Impacts
For fiscal 2019, the Company has recognized financial impacts from the following discrete items, not contemplated in the Company’s Business Outlook for 2019:
| |
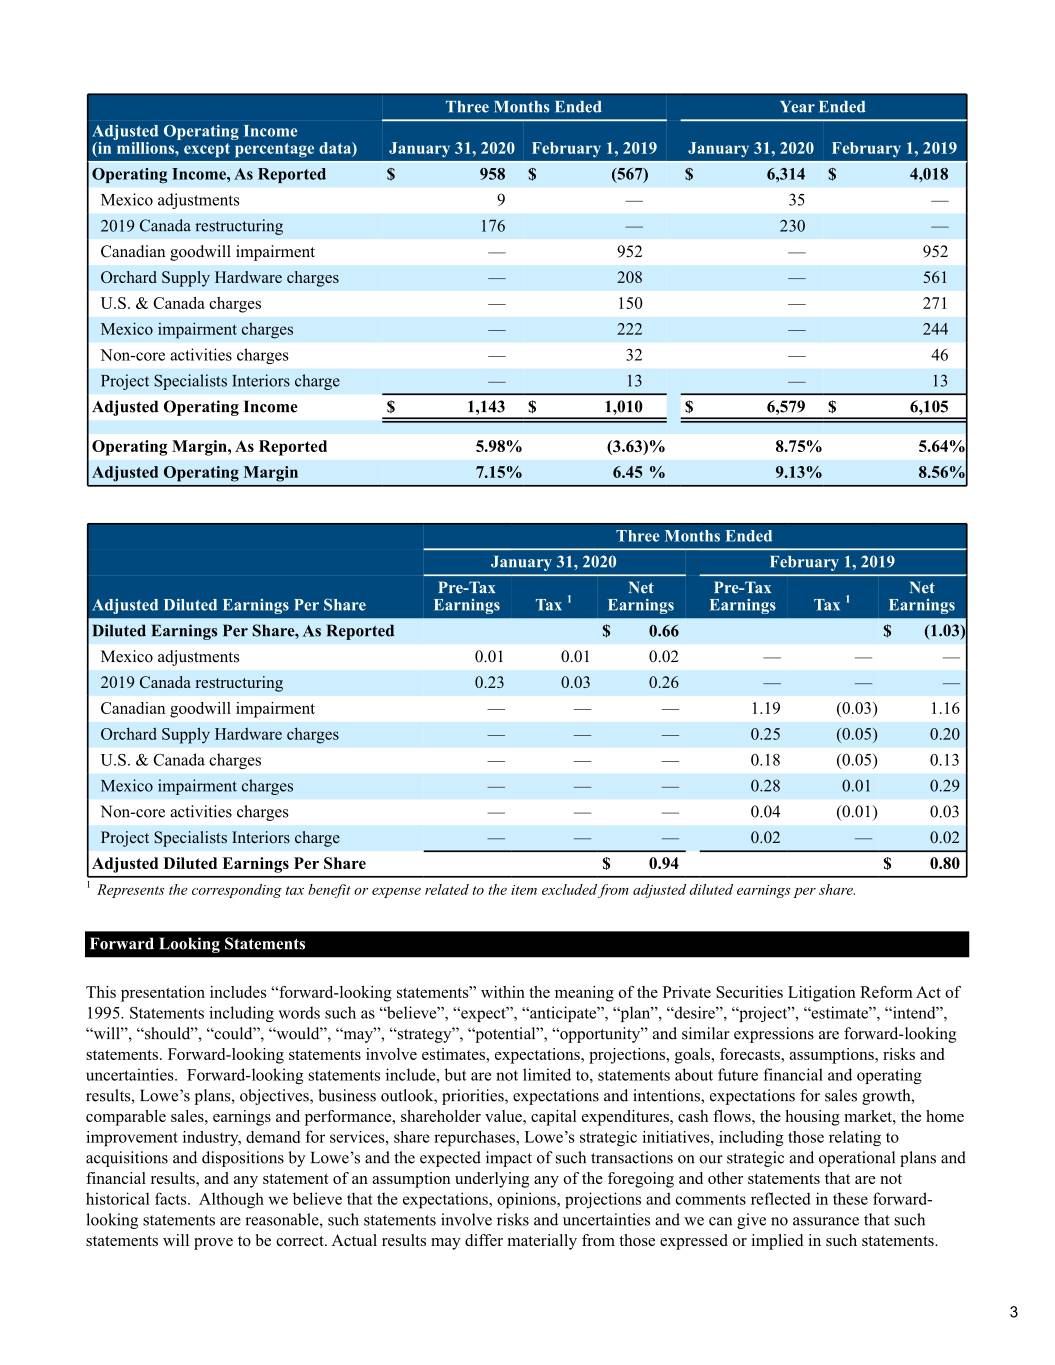
• | Prior to the beginning of fiscal 2019, the Company announced its intention to exit its Mexico retail operations and had planned to sell the operating business. However, in the first quarter of 2019, after an extensive market evaluation, the decision was made to instead sell the assets of the business. That decision resulted in an $82 million tax benefit in the first quarter, partially offset by $12 million in pre-tax operating losses associated with the exit and ongoing wind-down of Mexico retail operations. During the second quarter of fiscal 2019, the Company recognized pre-tax operating losses of $14 million. For the third quarter, pre-tax operating losses for the Mexico retail operations were insignificant. For the fourth quarter, pre-tax operating losses totaled $9 million. Total pre-tax operating costs and charges for fiscal year 2019 were $35 million (Mexico adjustments), and; |
| |
• | During the third quarter of fiscal 2019, the Company began a strategic review of its Canadian operations, and as a result recognized pre-tax charges of $53 million associated with long-lived asset impairment. In addition, the Company announced on November 20, 2019, additional actions to improve future performance and profitability of its Canadian operations. In the fourth quarter, the Company recognized $176 million of pre-tax operating costs and charges related to inventory liquidation, accelerated depreciation and amortization, severance and other costs, as well as a net $26 million impact to income tax expense related to income tax valuation allowance. Total pre-tax operating costs and charges for fiscal year 2019 were $230 million (2019 Canada restructuring). |
Fiscal 2018 Impacts
During fiscal 2018, the Company recognized financial impacts from the following discrete items, not contemplated in the Company's Business Outlook for 2018:
| |
• | During the fourth quarter of fiscal 2018, the Company recorded $952 million of goodwill impairment associated with its Canadian operations (Canadian goodwill impairment); |
| |
• | On August 17, 2018, the Company committed to exit its Orchard Supply Hardware operations. As a result, the Company recognized pre-tax charges of $230 million during the second quarter of fiscal 2018 associated with long-lived asset impairments and discontinued projects. During the third quarter of fiscal 2018, the Company recognized pre-tax charges of $123 million associated with accelerated depreciation and amortization, severance and lease obligations. During the fourth quarter of fiscal 2018, the Company recognized additional pre-tax charges of $208 million primarily related to lease obligations. Total pre-tax charges for fiscal year 2018 were $561 million (Orchard Supply Hardware charges); |
| |
• | On October 31, 2018, the Company committed to close 20 under-performing stores across the U.S. and 31 locations in Canada, including 27 under-performing stores. As a result, the Company recognized pre-tax charges of $121 million during the third quarter of fiscal 2018 associated with long-lived asset impairment and severance obligations. During the fourth quarter of fiscal 2018, the company recognized additional pre-tax charges of $150 million, primarily associated with severance and lease obligation costs, as well as accelerated depreciation. Total pre-tax charges for fiscal year 2018 were $271 million (U.S. and Canada store closure charges); |
| |
• | On November 20, 2018, the Company announced its plans to exit retail operations in Mexico and is exploring strategic alternatives. During the third quarter, $22 million of long-lived asset impairment was recognized on certain assets in Mexico as a result of the strategic evaluation. During the fourth quarter, an additional $222 million of impairment was recognized. Total charges for fiscal year 2018 were $244 million (Mexico impairment charges); |
| |
• | During the third quarter of fiscal 2018, the Company identified certain non-core activities within its U.S. home improvement business to exit, including Alacrity Renovation Services and Iris Smart Home. As a result, during the third quarter of 2018, the company recognized pre-tax charges of $14 million associated with long-lived asset impairment and inventory write-down. During the fourth quarter of fiscal 2018, the Company recognized additional pre-tax charges of $32 million. Total pre-tax charges for fiscal year 2018 were $46 million (Non-core activities charges), and; |
| |
• | During the fourth quarter of fiscal 2018, the Company recorded a pre-tax charge of $13 million, associated with severance costs due to the elimination of the Project Specialists Interiors position (Project Specialists Interiors charge). |
Adjusted diluted earnings per share, adjusted operating income, and adjusted operating margin should not be considered an alternative to, or more meaningful indicator of, the Company’s measures as prepared in accordance with GAAP. The Company’s methods of determining these non-GAAP financial measures may differ from the method used by other companies for this or similar non-GAAP financial measures. Accordingly, these non-GAAP measures may not be comparable to the measures used by other companies.
Detailed reconciliations between the Company’s GAAP and non-GAAP financial results are shown below and available on the Company’s website at www.lowes.com/investor.
|
| | | | | | | | | | | | | | | | | | | |
| Three Months Ended |
| (Unaudited) | | (Unaudited) |
| January 31, 2020 | | February 1, 2019 |
(in millions, except per share data) | Pre-Tax Earnings | | Tax | | Net Earnings | | Pre-Tax Earnings | | Tax | | Net Earnings |
Diluted earnings per share, as reported | | | | | $ | 0.66 |
| | | | | | $ | (1.03 | ) |
Non-GAAP adjustments - per share impacts | | | | | | | | | | | |
Mexico adjustments | 0.01 |
| | 0.01 |
| | 0.02 |
| | — |
| | — |
| | — |
|
2019 Canada restructuring | 0.23 |
| | 0.03 |
| | 0.26 |
| | — |
| | — |
| | — |
|
Canadian goodwill impairment | — |
| | — |
| | — |
| | 1.19 |
| | (0.03 | ) | | 1.16 |
|
Orchard Supply Hardware charges | — |
| | — |
| | — |
| | 0.25 |
| | (0.05 | ) | | 0.20 |
|
U.S. & Canada charges | — |
| | — |
| | — |
| | 0.18 |
| | 0.05 |
| | 0.13 |
|
Mexico impairment charges | — |
| | — |
| | — |
| | 0.28 |
| | 0.01 |
| | 0.29 |
|
Non-core activities charges | — |
| | — |
| | — |
| | 0.04 |
| | (0.01 | ) | | 0.03 |
|
Project Specialists Interiors charge | — |
| | — |
| | — |
| | 0.02 |
| | — |
| | 0.02 |
|
Adjusted diluted earnings per share | | | | | $ | 0.94 |
| | | | | | $ | 0.80 |
|
|
| | | | | | | | | | | | | | | | | | | |
| Fiscal 2020 Lowe’s Business Outlook |
| Low End of Guidance Range | | High End of Guidance Range |
(in millions, except per share data) | Pre-Tax Earnings | | Tax | | Net Earnings | | Pre-Tax Earnings | | Tax | | Net Earnings |
Forecasted diluted earnings per share | | | | | $ | 6.38 |
| | | | | | $ | 6.58 |
|
Non-GAAP adjustments - per share impacts | | | | | | | | | | | |
2019 Canada restructuring | 0.09 |
| | (0.02 | ) | | 0.07 |
| | 0.09 |
| | (0.02 | ) | | 0.07 |
|
Forecasted adjusted diluted earnings per share | | | | | $ | 6.45 |
| | | | | | $ | 6.65 |
|
|
| | | |
| Year Ended |
| (Unaudited) |
(in millions, except operating margin) | January 31, 2020 |
Operating income, as reported | $ | 6,314 |
|
Non-GAAP adjustments | |
Mexico adjustments | 35 |
|
2019 Canada restructuring | 230 |
|
Adjusted operating income | $ | 6,579 |
|
Adjusted operating margin | 9.13 | % |
| |