Masimo Reports Second Quarter 2023 Financial Results
Second Quarter 2023 Highlights
| | | | | | | | | | | | | | | |
| | | | | | | |
| • | | Consolidated revenue was $455.3 million; | | | | |
| • | | Healthcare revenue was $281.1 million; | | | | |
| • | | Non-healthcare revenue was $174.2 million; | | | | |
| | | | | | | |
| | | | | | | |
| | | | | | | |
| • | | GAAP net income per diluted share was $0.29; and | | | | |
| | | | | | | |
| • | | Non-GAAP net income per diluted share was $0.62. | | | | |
| | | | | | | |
| | | | | | | |
| | | | | | | |
| | | | | | | |
Irvine, California, August 8, 2023 - Masimo Corporation (Nasdaq: MASI) today announced its financial results for the second quarter of 2023, ended July 1, 2023.
Second Quarter 2023 Financial Results
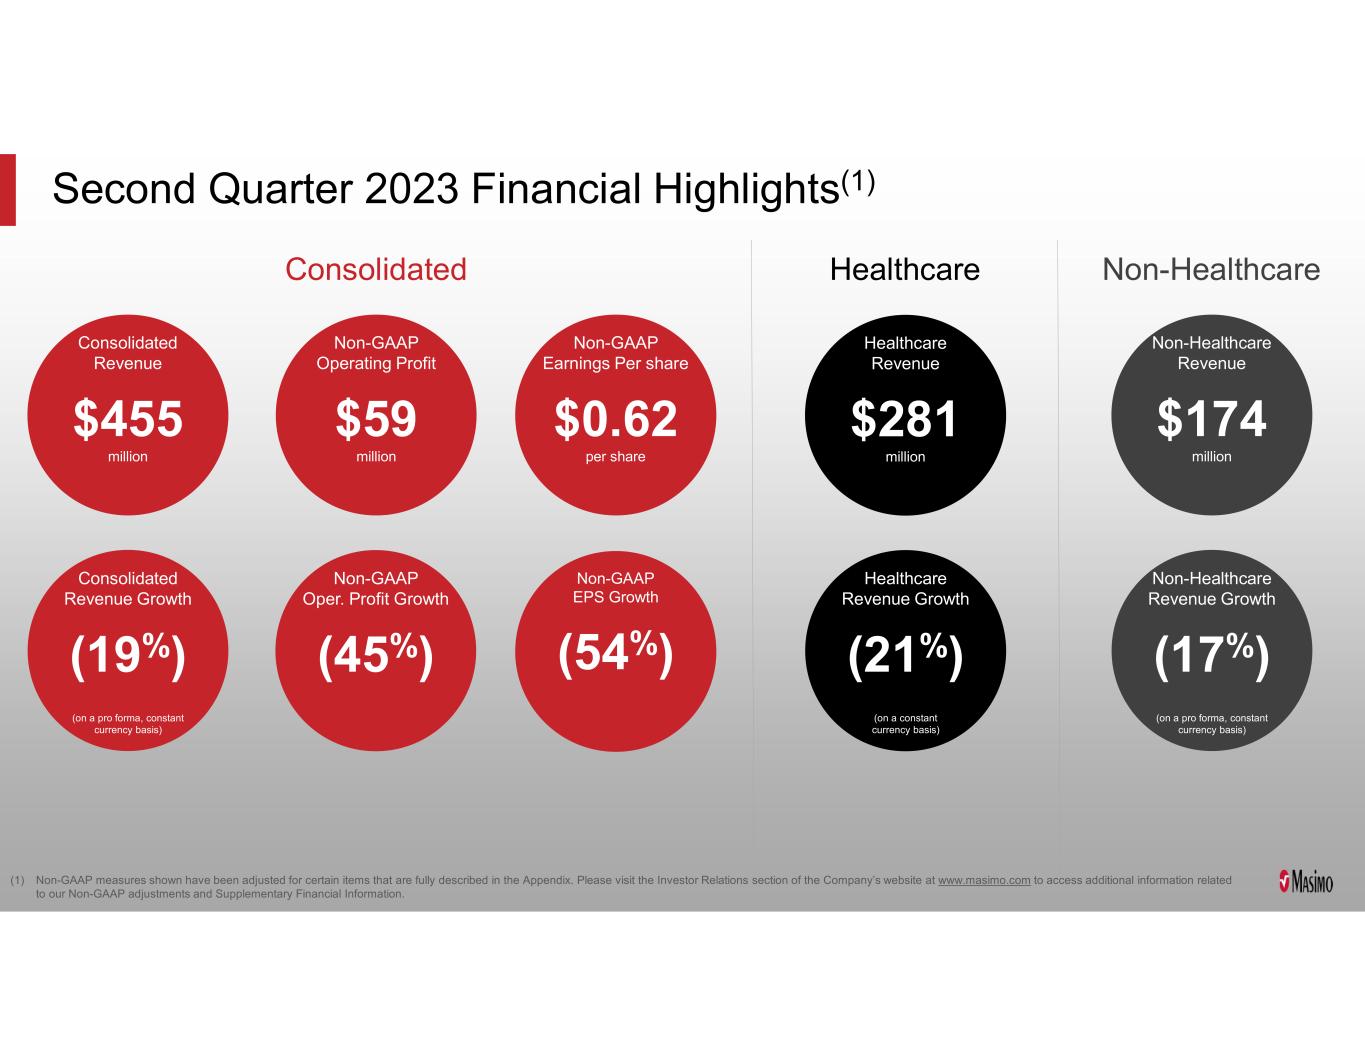
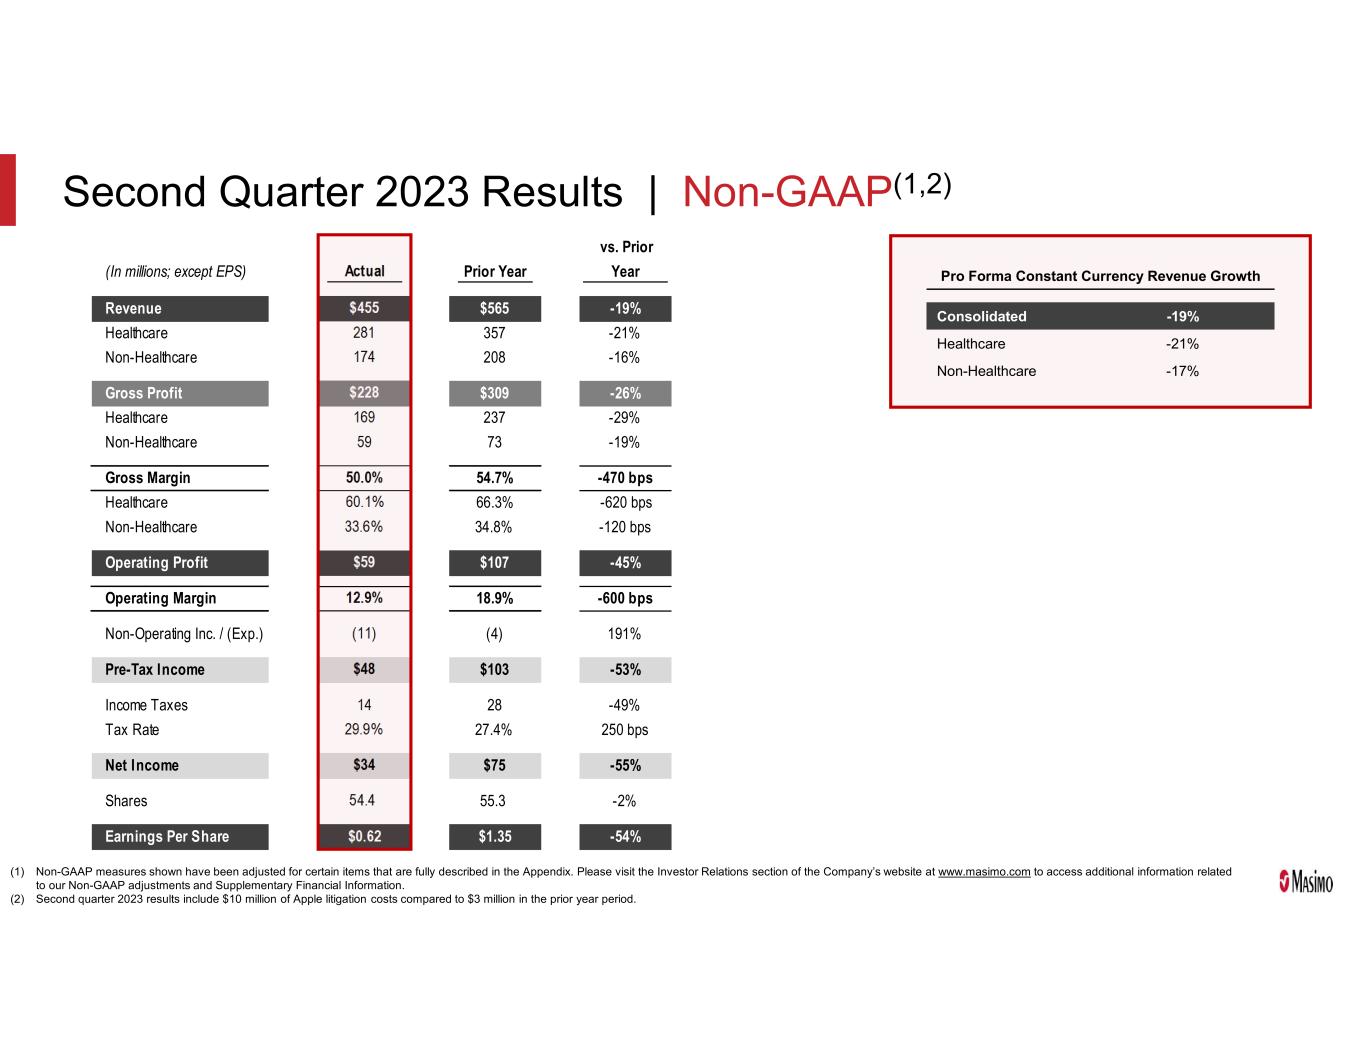
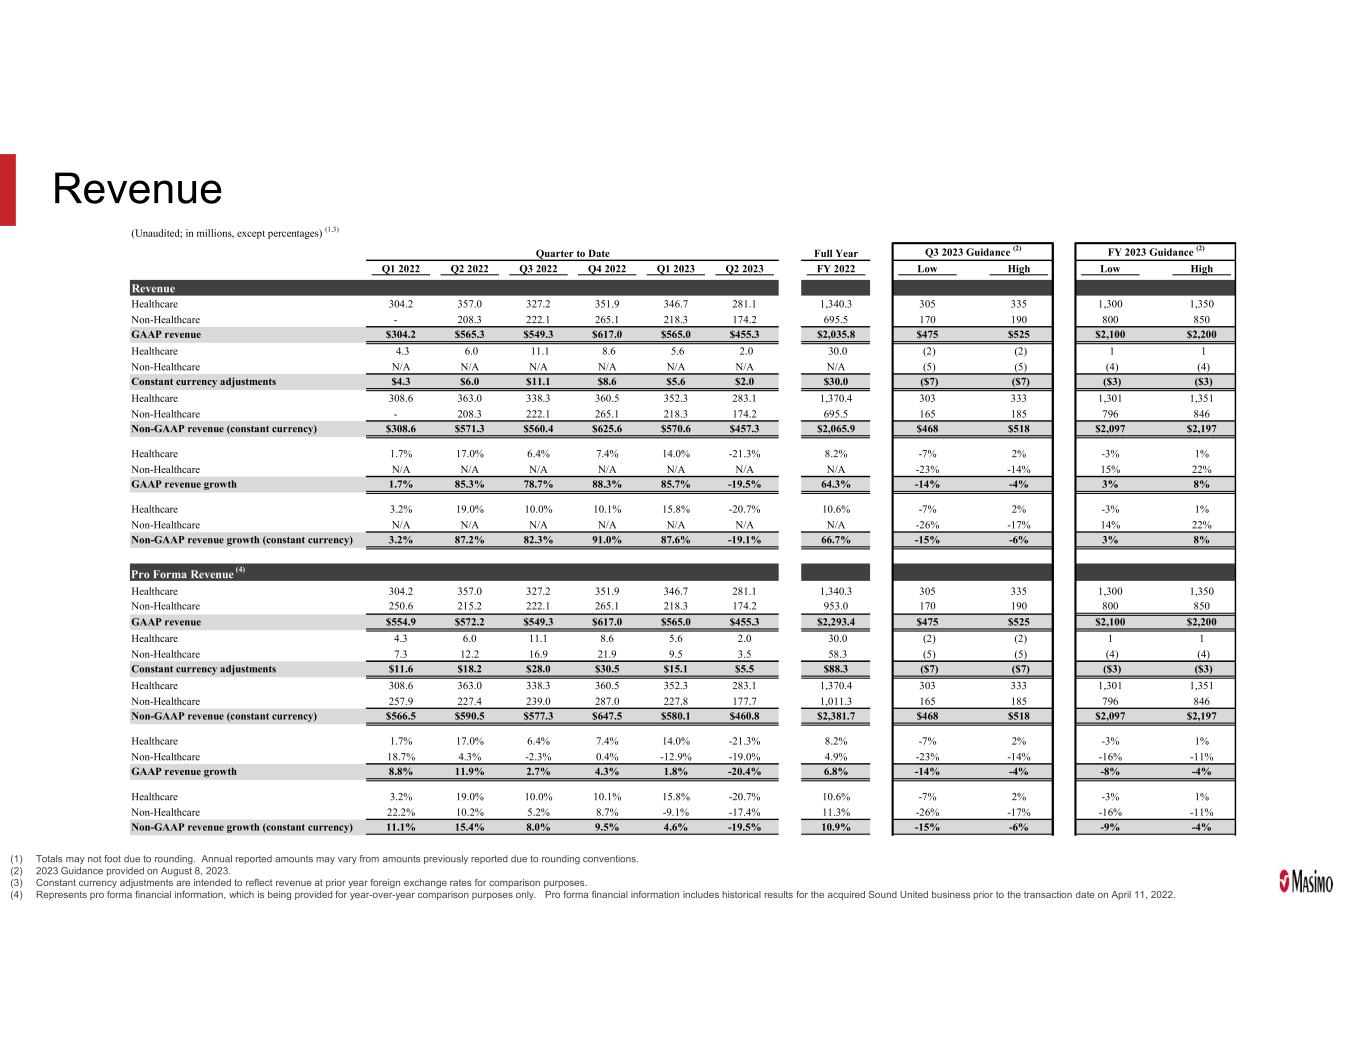
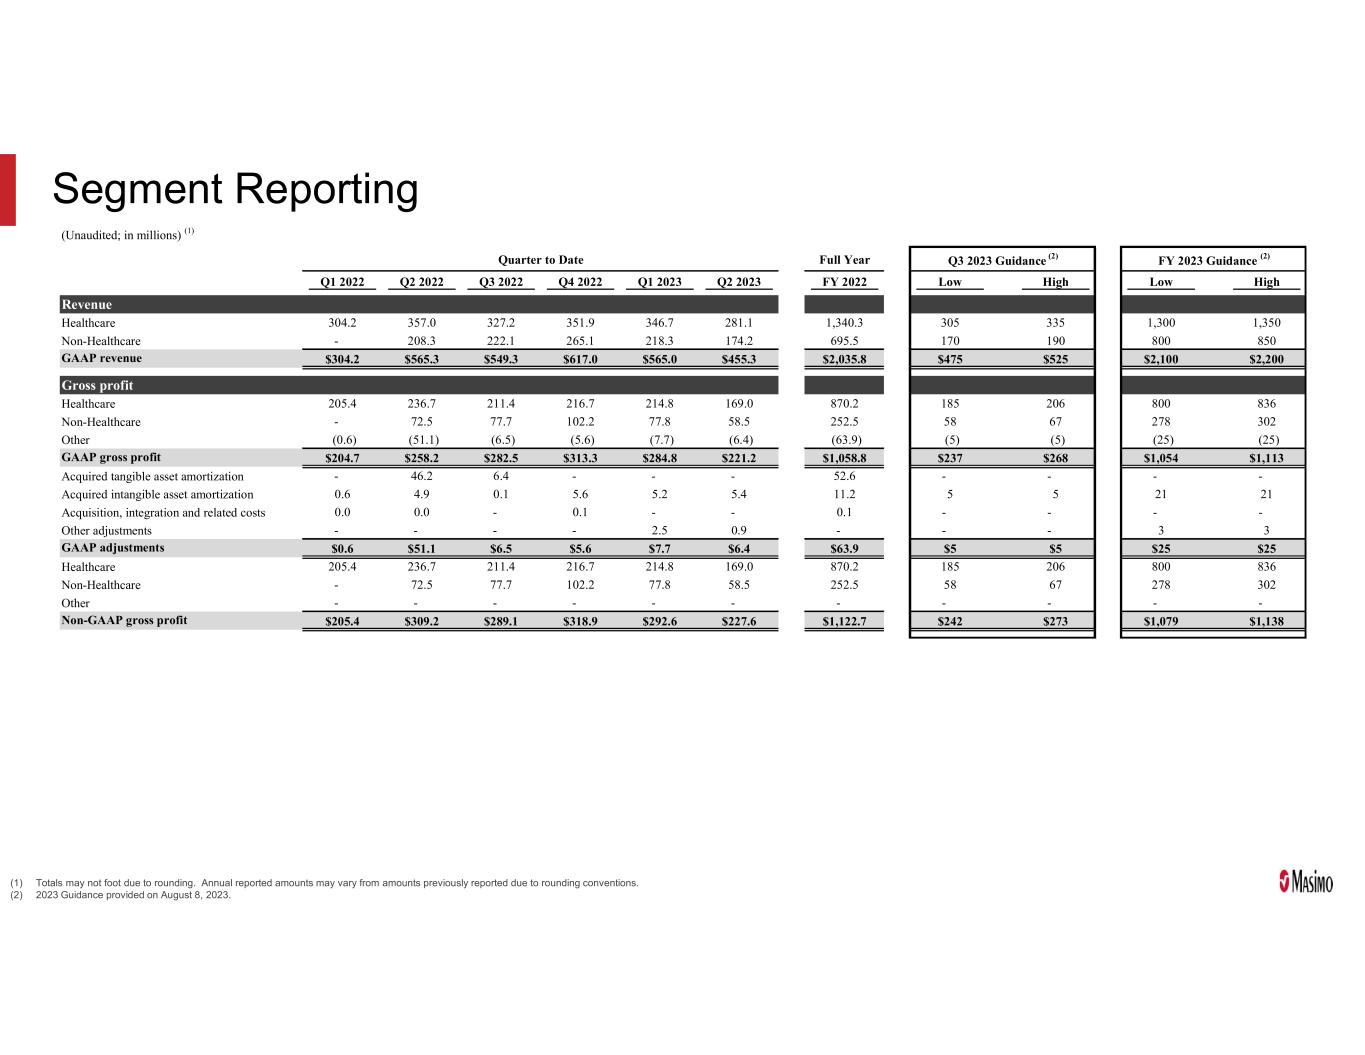
Consolidated revenue was $455.3 million, comprised of healthcare revenue of $281.1 million and non-healthcare revenue of $174.2 million.
Shipments of noninvasive technology boards and instruments were 64,100.
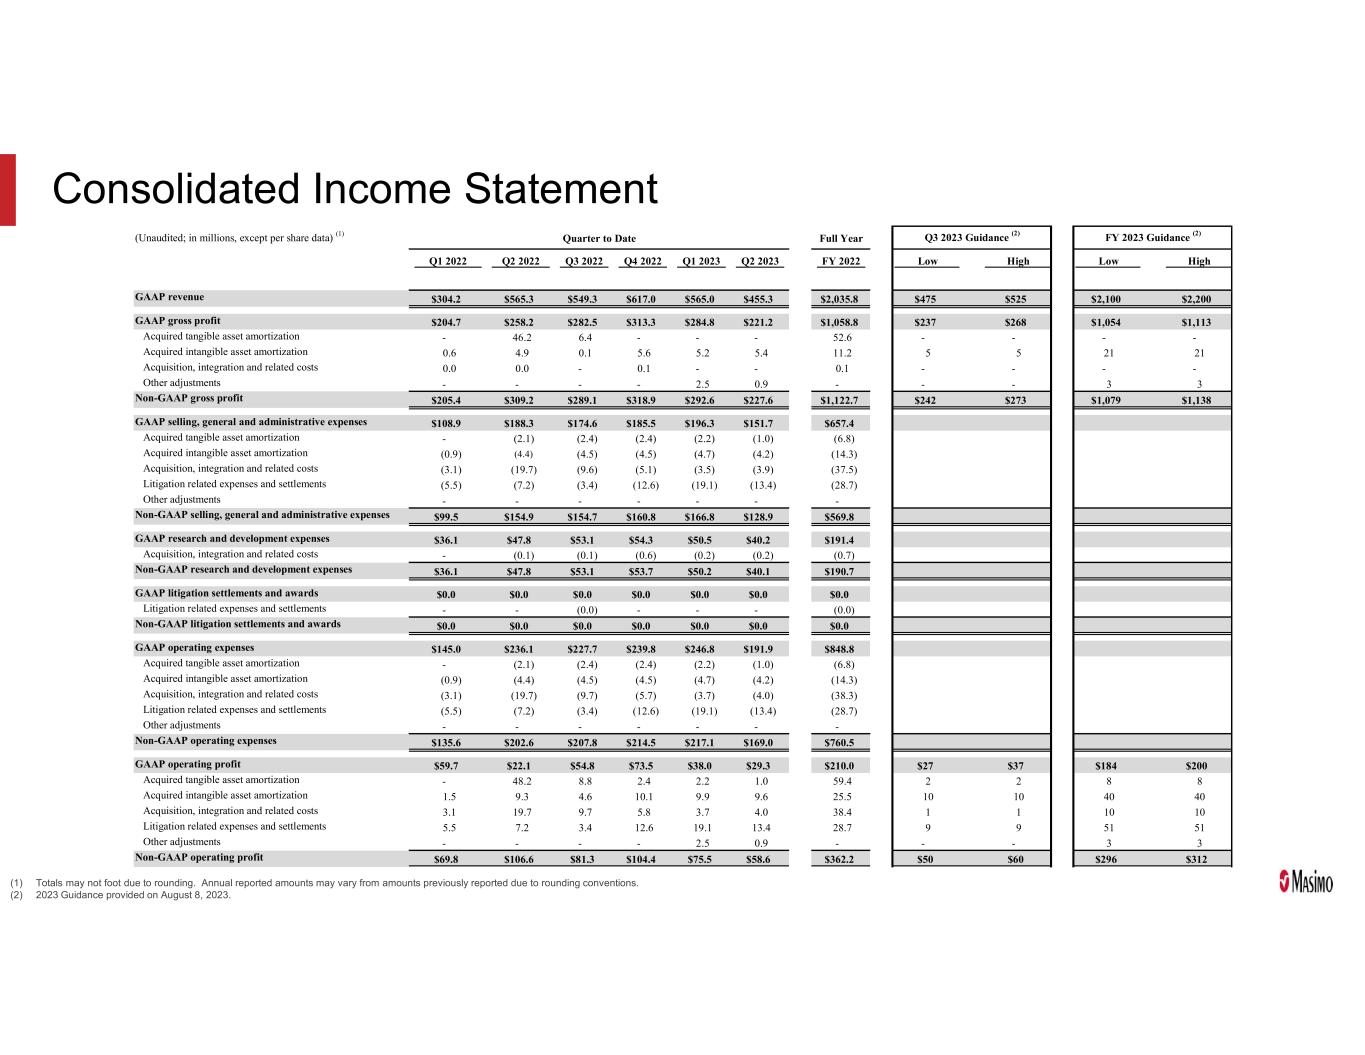
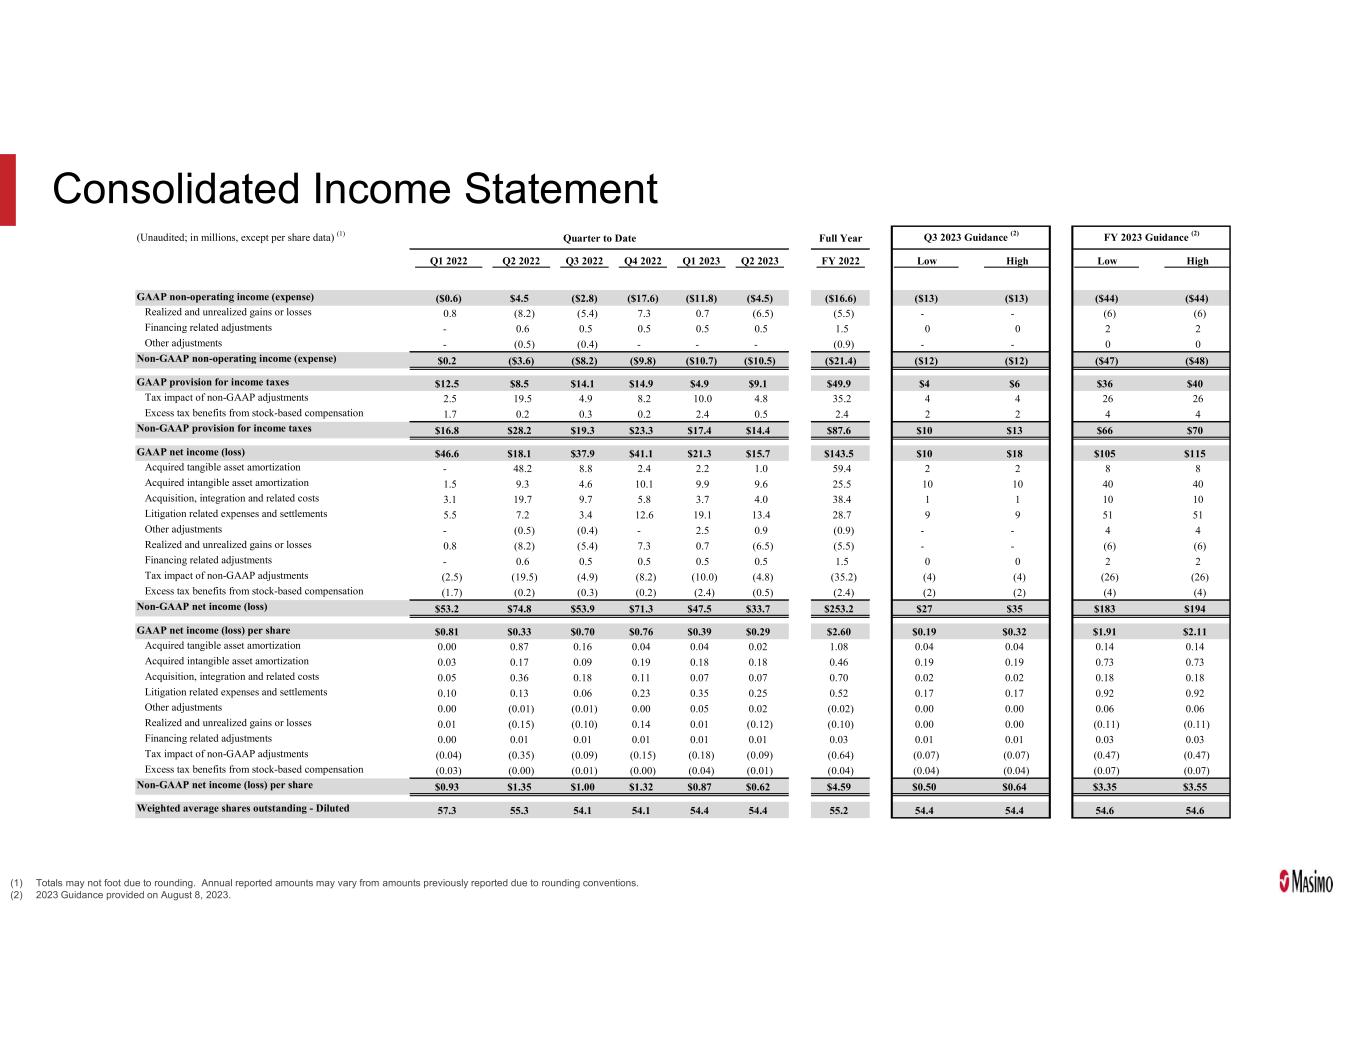
Consolidated GAAP operating income was $29.3 million. Consolidated non-GAAP operating income was $58.6 million. Consolidated GAAP net income was $15.7 million, or $0.29 per diluted share. Consolidated non-GAAP net income was $33.7 million, or $0.62 per diluted share.
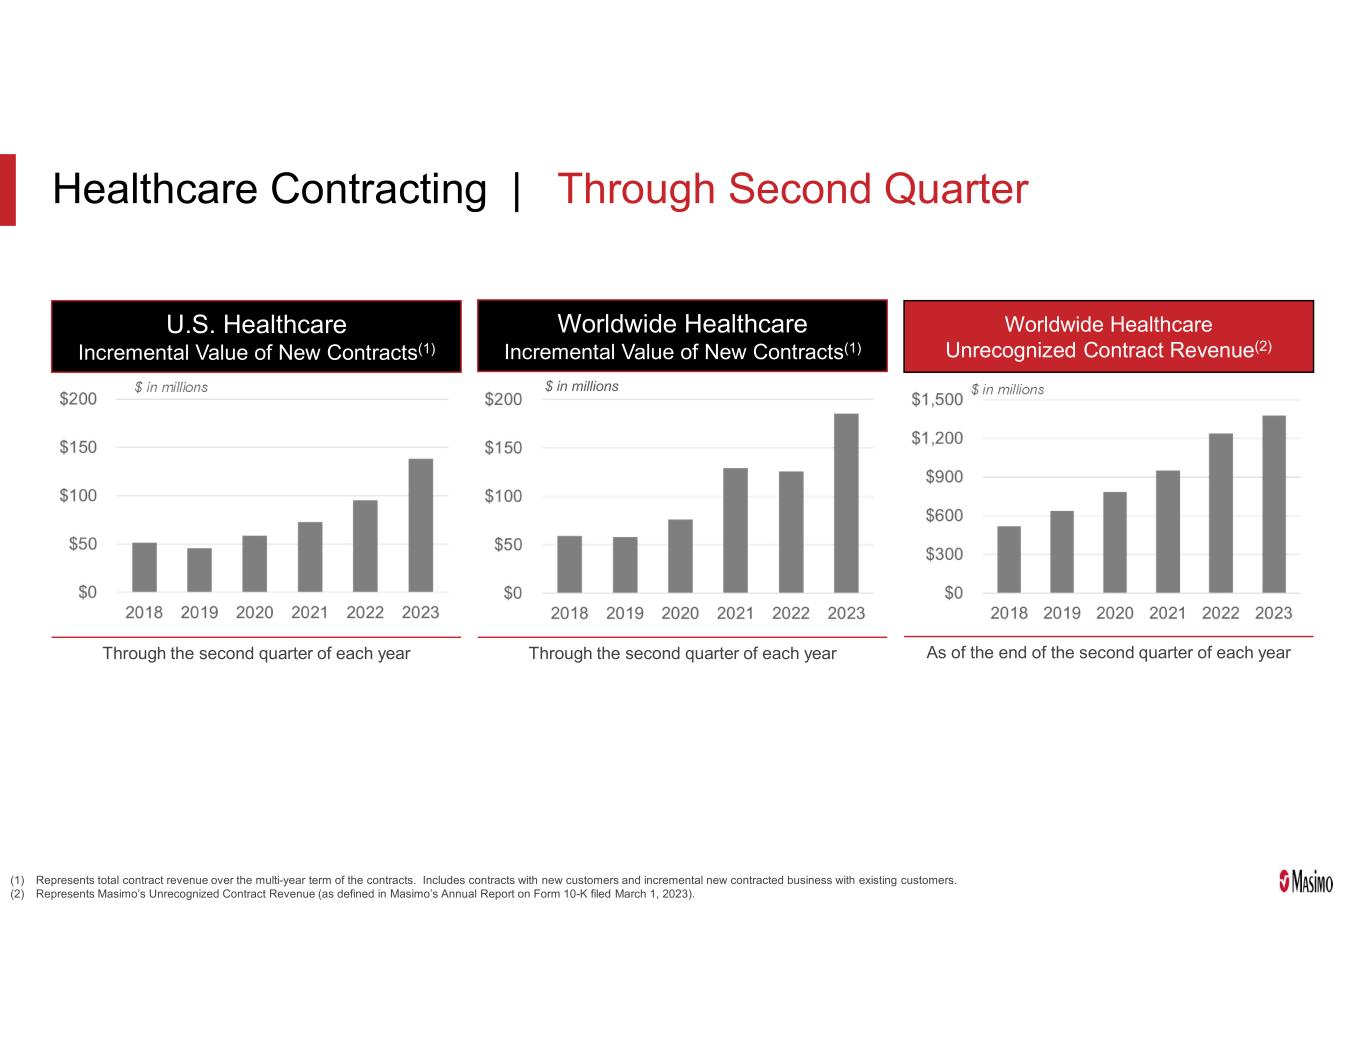
Joe Kiani, Chairman and Chief Executive Officer of Masimo, said, “Second quarter 2023 was a tale of two realities. Our healthcare revenues and earnings declined sequentially and annually, but we gained new hospital customers at a record level, despite strong results in the prior three years, and retained existing hospital customers. We are disappointed with our results this quarter. Our updated guidance assumes inpatient volumes will not return to the levels we expected this year and we will not receive some of the new large orders we are expecting for W1™, Rad-G™ and Rad-97™. I want to emphasize that because of our growth in market share the past few years, and our innovative new products, we remain optimistic about Masimo’s future.”
For additional financial details, please visit the Investor Relations section of the Company’s website at investor.masimo.com to access the second quarter 2023 earnings presentation materials.
Updated Third-Quarter 2023 and Full-Year 2023 Financial Guidance
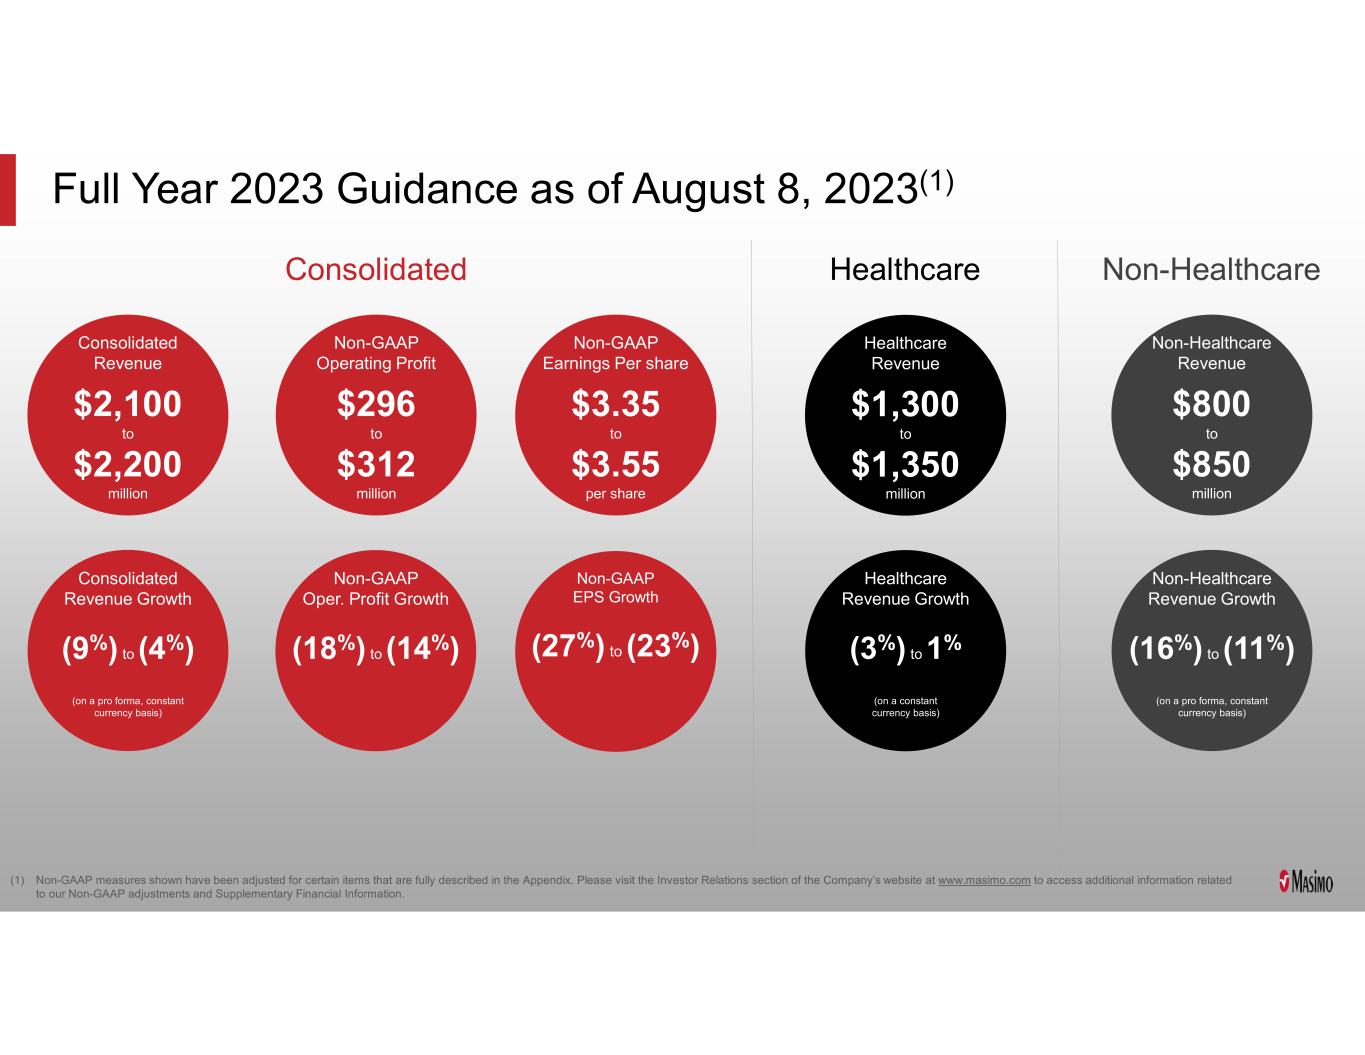
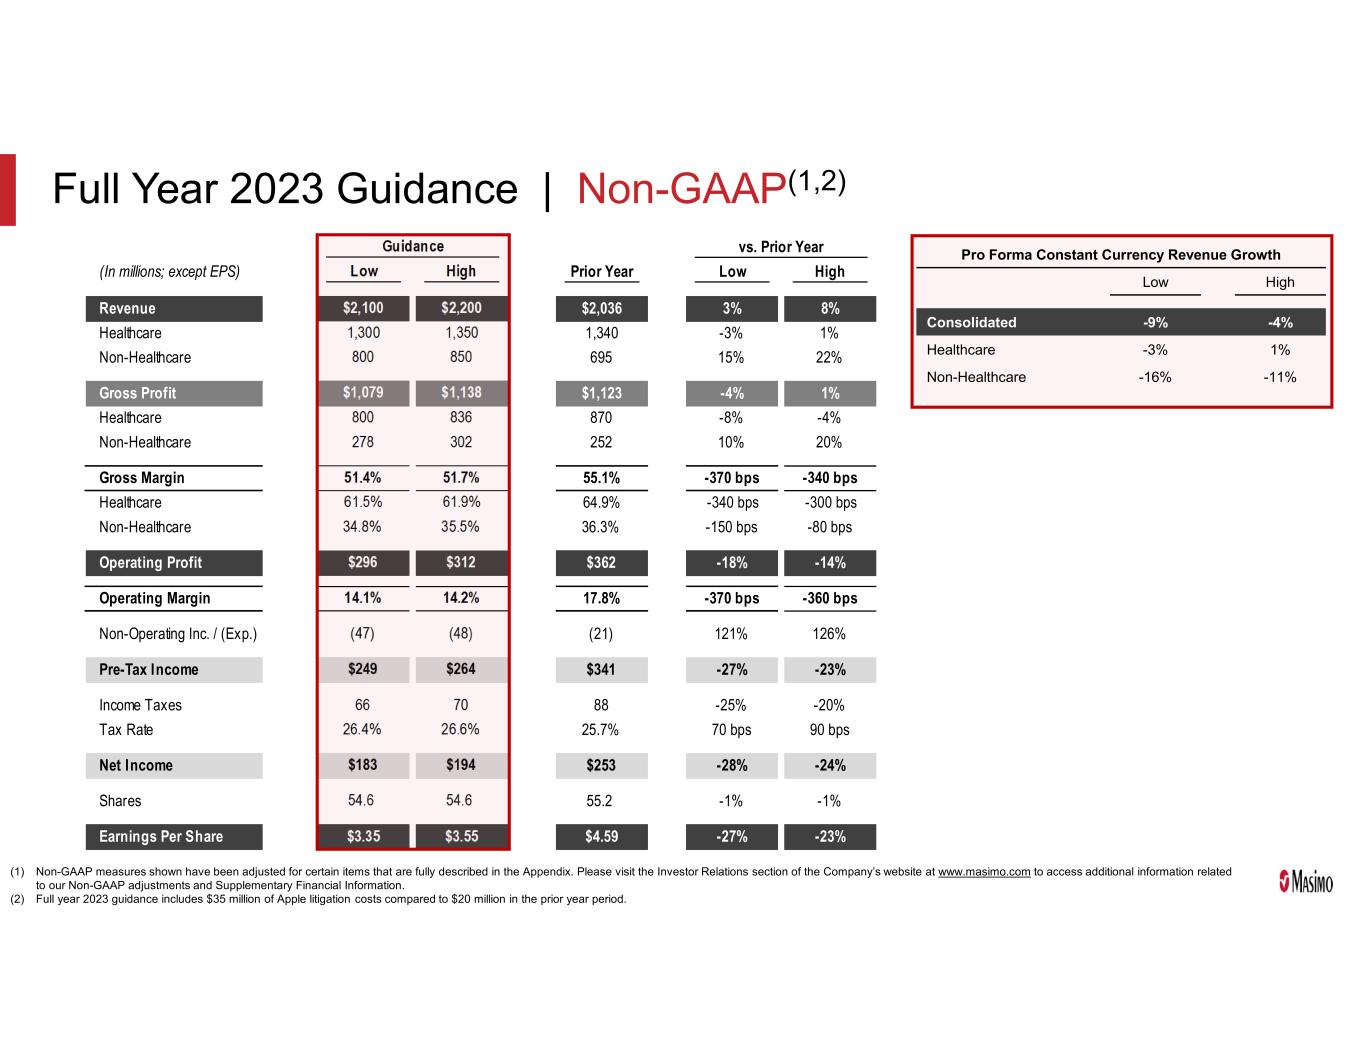
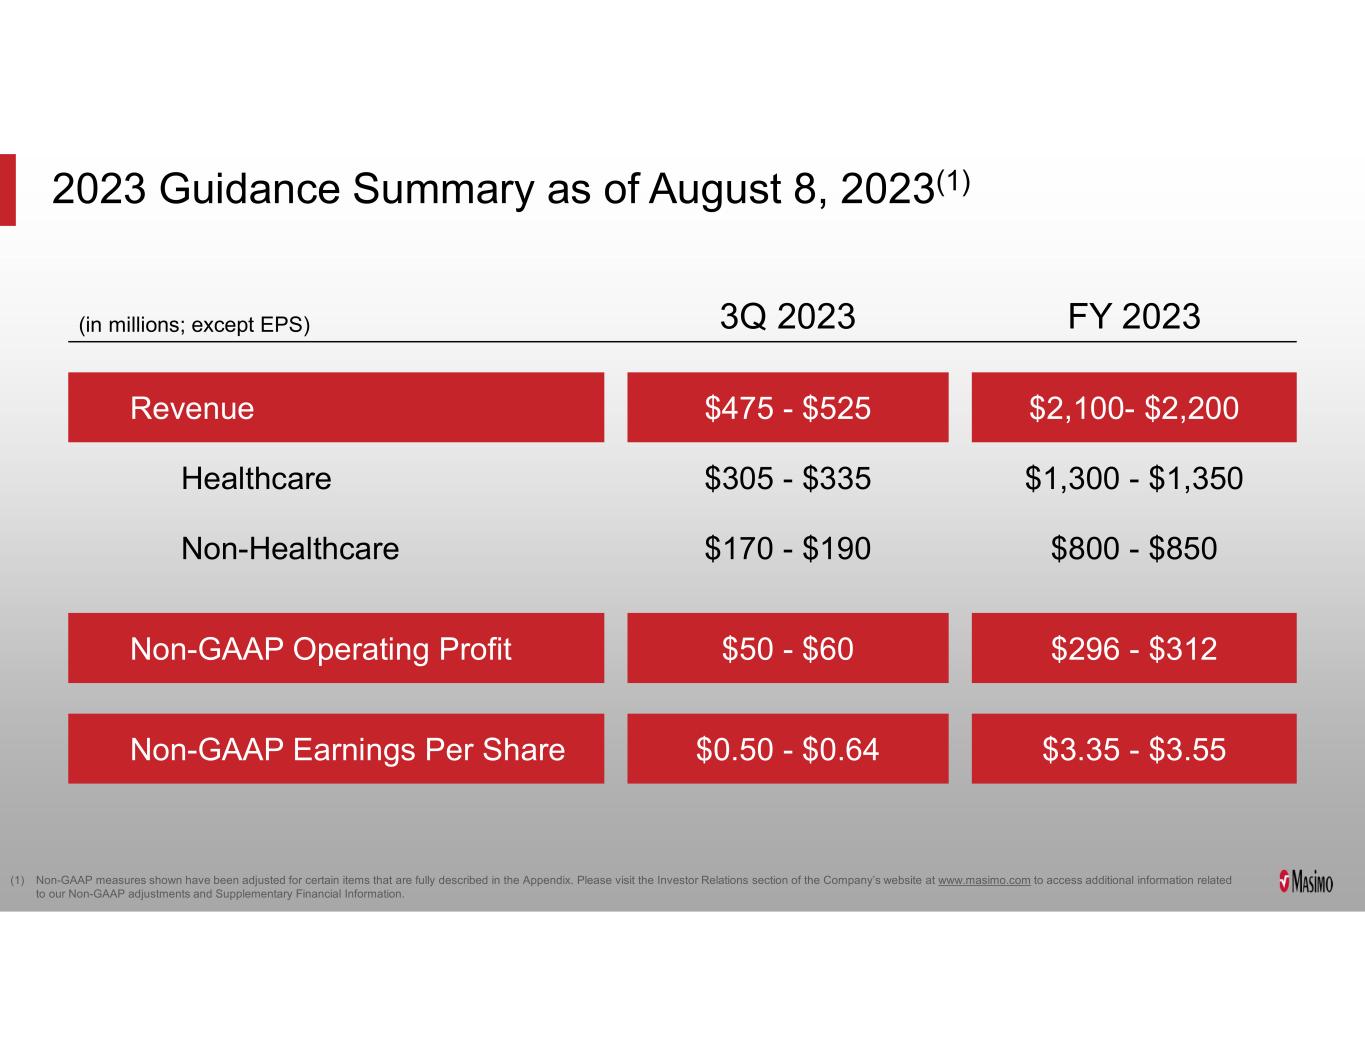
The Company provided the following updated estimates for its third-quarter 2023 and full-year financial guidance:
| | | | | | | | | | | | | | | | | | | | | | | | | | |
| | Guidance |
| | Third-Quarter 2023(1) | | Updated Full-Year 2023(1) |
| (in millions, except earnings per diluted share) | | GAAP | | Non-GAAP | | GAAP | | Non-GAAP |
| Consolidated revenue | | $475 to $525 | | $475 to $525 | | $2,100 to $2,200 | | $2,100 to $2,200 |
| | | | | | | | |
| | | | | | | | |
| | | | | | | | |
| | | | | | | | |
| Healthcare revenue | | $305 to $335 | | $305 to $335 | | $1,300 to $1,350 | | $1,300 to $1,350 |
| Non-healthcare revenue | | $170 to $190 | | $170 to $190 | | $800 to $850 | | $800 to $850 |
| Consolidated operating income | | $27 to $37 | | $50 to $60 | | $184 to $200 | | $296 to $312 |
| Consolidated net income per diluted share | | $0.19 to $0.32 | | $0.50 to $0.64 | | $1.91 to $2.11 | | $3.35 to $3.55 |
| | | | | | | | |
| | | | | | | | |
______________
(1) Guidance provided August 8, 2023.
•For the healthcare segment, third-quarter 2023 revenue guidance includes year-over-year foreign currency tailwinds of $2 million and full-year 2023 revenue guidance includes year-over-year foreign currency headwinds of $1 million.
Supplementary Non-GAAP Financial Information
For additional non-GAAP financial details, please visit the Investor Relations section of the Company’s website at investor.masimo.com to access Supplementary Financial Information.
Non-GAAP Financial Measures
The non-GAAP financial measures contained herein are a supplement to the corresponding financial measures prepared in accordance with U.S. GAAP. The non-GAAP financial measures presented exclude the items described below. Management believes that adjustments for these items assist investors in making comparisons of period-to-period operating results. Furthermore, management also believes that these items are not indicative of the Company’s on-going operating performance. These non-GAAP financial measures have certain limitations in that they do not reflect all of the costs associated with the operations of the Company’s business as determined in accordance with GAAP.
Therefore, investors should consider non-GAAP financial measures in addition to, and not as a substitute for, or as superior to, measures of financial performance prepared in accordance with GAAP. The non-GAAP financial measures presented by the Company may be different from the non-GAAP financial measures used by other companies.
The Company has presented the following non-GAAP measures to assist investors in understanding the Company’s net operating results on an on-going basis: (i) constant currency revenue growth %, (ii) non-GAAP net income, (iii) non-GAAP (net income) earnings per diluted share and (iv) non-GAAP operating income/margin. These non-GAAP financial measures may also assist investors in making comparisons of the Company’s operating results with those of other companies. Management believes constant currency revenue growth, non-GAAP operating income/margin, non-GAAP net income and non-GAAP earnings per diluted share are important measures in the evaluation of the Company’s performance and uses these measures to better understand and evaluate our business.
The non-GAAP financial measures reflect adjustments for the following items:
Constant currency revenue adjustments
Some of our sales agreements with foreign customers provide for payment in currencies other than the U.S. Dollar. These foreign currency revenues, when converted into U.S. Dollars, can vary significantly from period-to-period depending on the average and quarter-end exchange rates during a respective period. We believe that comparing these foreign currency denominated revenues by holding the exchange rates constant with the prior year period is useful to management and investors in evaluating our revenue growth rates on a period-to-period basis. We anticipate that fluctuations in foreign exchange rates and the related constant currency adjustments for calculation of our revenue growth rate will continue to occur in future periods.
Acquisition, integration and related costs
These transactions represent gains, losses, and other related costs associated with acquisitions, integrations, investments, divestitures, assets impairments, and in-process research and development.
Acquired tangible asset amortization
These transactions represent amortization expense in connection with business or assets acquisitions associated with acquired tangible assets and asset valuation step-ups.
Acquired intangible asset amortization
These transactions represent amortization expense in connection with business or assets acquisitions associated with acquired intangible assets including, but not limited to customer relationships, intellectual property, trade names and non-competition agreements.
Litigation related expenses, settlements and awards
These transactions represent gains, losses, and other related costs associated with certain litigation matters, which can vary in their characteristics, frequency and significance to our operating results.
Other adjustments
In the event there are gains, losses and other adjustments which impact period-to-period comparability and do not represent the underlying ongoing results of the business, the Company may choose to exclude these from non-GAAP earnings.
Realized and unrealized gains or losses
These transactions represent gains, losses, and other related costs associated with foreign currency denominated transactions and investments. Changes in the underlying currency rates relative to the U.S. Dollar may result in realized and unrealized foreign currency gains and losses between the time these receivables and payables arise and the time that they are settled in cash. Unrealized and realized gains and losses on investments may impact the Company’s reported results of operations for a period. These items are highly variable, difficult to predict and outside the control of those responsible for the underlying operations of the business. Other items also included here are mark-to-market gains and losses of derivative contracts that are not designated as hedging instruments or the ineffective portions of cash flow hedges.
Tax impact of non-GAAP adjustments
In order to reflect the tax effected impact of the non-GAAP adjustments, the Company will adjust the non-GAAP earnings by the approximate tax impact of these adjustments.
Excess tax benefits from stock-based compensation expense
GAAP requires that excess tax benefits recognized on stock-based compensation expense be reflected in our provision for income taxes rather than paid-in capital. As these excess tax benefits may be highly variable from period-to-period, the Company may choose to exclude these tax benefits from non-GAAP earnings to facilitate comparability between periods and with peers.
Financing related adjustments
The Company may enter into various financial arrangements whereby costs are incurred and certain instrument features are valued and expensed accordingly but are not necessarily indicative of the on-going cash flow generation of the Company and therefore excludes these costs from non-GAAP earnings. For GAAP earnings per diluted share purposes, the Company cannot reflect the anti-dilutive impact, if applicable, in its diluted shares calculations. However, the Company believes that reflecting the anti-dilutive impact of these instruments in non-GAAP earnings per diluted share provides management and investors with useful information in evaluating the financial performance of the Company on a per share basis.
Second Quarter 2023 Actuals versus Second Quarter 2022 Actuals
| | | | | | | | | | | | | | | | | | | | | | | | | | | |
RECONCILIATION OF HEALTHCARE GAAP TO NON-GAAP CONSTANT CURRENCY REVENUE(1): |
| | | | | Three Months Ended | | |
| (in millions, except percentages) | | July 1,
2023 | | July 2,
2022 | | | | |
| GAAP healthcare revenue | | $ | 281.1 | | | $ | 357.0 | | | | | |
| | | | | | | | | | | |
| | | | | | | | |
| Constant currency revenue adjustments | | 2.0 | | | N/A | | | | |
| | | | | | | | | | |
| | | | | | | | | | | |
| Non-GAAP healthcare constant currency revenue | | $ | 283.1 | | | $ | 357.0 | | | | | |
| | | | | | | | | | | |
| | | | | | | | | | | | | | | | | | | | | | | | |
| | GAAP healthcare revenue growth % | | (21.3) | % | | | | | | |
| | Non-GAAP healthcare constant currency revenue growth % | | (20.7) | % | | | | | | |
__________________
(1) May not foot due to rounding.
| | | | | | | | | | | | | | | | | | | | | | | | |
RECONCILIATION OF GAAP TO NON-GAAP CONSOLIDATED OPERATING INCOME(1): |
| | | | Three Months Ended | | |
| | | | July 1,
2023 | | July 2,
2022 | | | | |
| (in millions) | | $ | | $ | | | | |
| GAAP operating income | | $ | 29.3 | | | $ | 22.1 | | | | | |
| Non-GAAP adjustments: | | | | | | | | |
| | | | | | | | | |
| Acquired tangible asset amortization | | 1.0 | | | 48.2 | | | | | |
| Acquired intangible asset amortization | | 9.6 | | | 9.3 | | | | | |
| Acquisition, integration and related costs | | 4.0 | | | 19.7 | | | | | |
| Litigation related expenses, settlements and awards(2) | | 13.4 | | | 7.2 | | | | | |
| Other adjustments | | 0.9 | | | — | | | | | |
| | Total non-GAAP adjustments | | 29.0 | | | 84.5 | | | | | |
| Non-GAAP operating income | | $ | 58.6 | | | $ | 106.6 | | | | | |
__________________
(1) May not foot due to rounding.
(2) Includes legal expenses associated with the Apple ITC proceedings and governance-related matters.
| | | | | | | | | | | | | | | | | | | | | | | | | | | | | |
RECONCILIATION OF GAAP TO NON-GAAP NET INCOME AND NET INCOME PER DILUTED SHARE(1): |
| | | Three Months Ended |
| | | July 1,
2023 | | July 2,
2022 |
| (in millions, except per diluted share amounts) | | $ | | Per Diluted Share | | $ | | Per Diluted Share |
| GAAP net income | | $ | 15.7 | | | $ | 0.29 | | | $ | 18.1 | | | $ | 0.33 | |
| Non-GAAP adjustments: | | | | | | | | |
| Acquired tangible asset amortization | | 1.0 | | | 0.02 | | | 48.2 | | | 0.87 | |
| Acquired intangible asset amortization | | 9.6 | | | 0.18 | | | 9.3 | | | 0.17 | |
| Acquisition, integration and related costs | | 4.0 | | | 0.07 | | | 19.7 | | | 0.36 | |
| Litigation related expenses, settlements and awards(2) | | 13.4 | | | 0.25 | | | 7.2 | | | 0.13 | |
| Other adjustments | | 0.9 | | | 0.02 | | | (0.5) | | | (0.01) | |
| Realized and unrealized gains or losses | | (6.5) | | | (0.12) | | | (8.2) | | | (0.15) | |
| Financing related adjustments | | 0.5 | | | 0.01 | | | 0.6 | | | 0.01 | |
| Tax impact of non-GAAP adjustments | | (4.8) | | | (0.09) | | | (19.5) | | | (0.35) | |
| Excess tax benefits from stock-based compensation expense | | (0.5) | | | (0.01) | | | (0.2) | | | (0.00) |
| Total non-GAAP adjustments | | 17.7 | | | 0.32 | | | 56.6 | | | 1.02 | |
| Non-GAAP net income | | $ | 33.7 | | | $ | 0.62 | | | $ | 74.8 | | | $ | 1.35 | |
| Weighted average shares outstanding-diluted | | | | 54.4 | | | | | 55.3 | |
__________________
(1) May not foot due to rounding.
(2) Includes legal expenses associated with the Apple ITC proceedings and governance-related matters.
Updated Third-Quarter 2023 and Full-Year 2023 Financial Guidance
| | | | | | | | | | | | | | | | | | | | |
RECONCILIATION OF HEALTHCARE GAAP TO NON-GAAP CONSTANT CURRENCY REVENUE(1): |
| | | | Guidance(2) |
| (in millions, except percentages) | | Third-Quarter 2023 | | Updated
Full-Year 2023 |
| GAAP healthcare revenue | | $305 to $335 | | $1,300 to $1,350 |
| | | | |
| Constant currency revenue adjustments | | (2) | | | 1 | |
| | | | | | |
| Non-GAAP healthcare constant currency revenue | | $303 to $333 | | $1,301 to $1,351 |
| | | | | | | | | | | | | | | | | | | | |
| GAAP healthcare revenue growth % | | (7)% to 2% | | (3)% to 1% |
| Non-GAAP healthcare constant currency revenue growth % | | (7)% to 2% | | (3)% to 1% |
__________________
(1) May not foot due to rounding.
(2) Guidance provided August 8, 2023.
| | | | | | | | | | | | | | | | | | | | |
RECONCILIATION OF GAAP TO NON-GAAP CONSOLIDATED OPERATING INCOME(1): |
| | | Guidance(2) |
| (in millions) | | Third-Quarter 2023 | | Updated
Full-Year 2023 |
| GAAP operating income | | $27 to $37 | | $184 to $200 |
| Non-GAAP adjustments: | | | | |
| | | | | |
| Acquired tangible asset amortization | | 2 | | | 8 | |
| Acquired intangible asset amortization | | 10 | | | 40 | |
| Acquisition, integration and related costs | | 1 | | | 10 | |
| Litigation related expenses, settlements and awards(3) | | 9 | | | 51 | |
| Other adjustments(3) | | — | | | 3 | |
| | Total non-GAAP adjustments | | 23 | | | 112 | |
| Non-GAAP operating income | | $50 to $60 | | $296 to $312 |
__________________
(1) May not foot due to rounding.
(2) Guidance provided August 8, 2023.
(3) Includes legal expenses associated with the Apple ITC proceedings and governance-related matters.
| | | | | | | | | | | | | | | | | | | | | | | | | | | | | |
RECONCILIATION OF GAAP TO NON-GAAP NET INCOME AND NET INCOME PER DILUTED SHARE(1): |
| | | Guidance(2) |
| | | Third-Quarter 2023 | | Updated
Full-Year 2023 |
| (in millions, except per diluted share amounts) | $ | | Per Diluted Share | | $ | | Per Diluted Share |
| GAAP net income | | $10 to $18 | | $0.19 to $0.32 | | $105 to $115 | | $1.91 to $2.11 |
| Non-GAAP adjustments: | | | | | | | | |
| Acquired tangible asset amortization | | 2 | | | 0.04 | | | 8 | | | 0.14 | |
| Acquired intangible asset amortization | | 10 | | | 0.19 | | | 40 | | | 0.73 | |
| Acquisition, integration and related costs | | 1 | | | 0.02 | | | 10 | | | 0.18 | |
| Litigation related expenses, settlements and awards(3) | | 9 | | | 0.17 | | | 51 | | | 0.92 | |
| Other adjustments | | — | | | 0.00 | | 4 | | | 0.06 | |
| Realized and unrealized gains or losses | | — | | | 0.00 | | (6) | | | (0.11) | |
| Financing related adjustments | | — | | | 0.01 | | 2 | | | 0.03 | |
| Tax impact of non-GAAP adjustments | | (4) | | | (0.07) | | | (26) | | | (0.47) | |
| Excess tax benefits from stock-based compensation expense | | (2) | | | (0.04) | | | (4) | | | (0.07) | |
| Total non-GAAP adjustments | | 17 | | | 0.31 | | | 79 | | | 1.43 | |
| Non-GAAP net income | | $27 to $35 | | $0.50 to $0.64 | | $183 to $194 | | $3.35 to $3.55 |
| Weighted average shares outstanding-diluted | | | 54.4 | | | | | 54.6 | |
__________________
(1) May not foot due to rounding.
(2) Guidance provided August 8, 2023.
(3) Includes legal expenses associated with the Apple ITC proceedings and governance-related matters.
Conference Call:
The conference call to review the results will begin at 1:30 p.m. PT today (4:30 p.m. ET) and will be hosted by Joe Kiani, Chairman and Chief Executive Officer, and Micah Young, Executive Vice President and Chief Financial Officer.
To register for the conference call and receive the dial-in number, please use the link below. Upon registering, each participant will be provided with call details and a registrant ID number.
Conference Call Registration Link:
https://conferencingportals.com/event/nUSpRIEm
A replay of the webcast and conference call will be available shortly after the conclusion of the call and will be archived on the Company’s website.
About Masimo
Masimo (Nasdaq: MASI) is a global technology company that develops and produces a wide array of industry-leading monitoring technologies, including innovative measurements, sensors, patient monitors, and automation and connectivity solutions. In addition, Masimo Consumer Audio is home to eight iconic audio brands, including Bowers & Wilkins®, Denon®, Marantz®, and Polk Audio®. Our mission is to improve life, improve patient outcomes; and reduce the cost of care. Masimo SET® Measure-through Motion and Low Perfusion™ pulse oximetry, introduced in 1995, has been shown in over 100 independent and objective studies to outperform other pulse oximetry technologies. Masimo SET® has also been shown to help clinicians reduce severe retinopathy of prematurity in neonates, improve CCHD screening in newborns, and, when used for continuous monitoring with Masimo Patient SafetyNet™ in post-surgical wards, reduce rapid response team activations, ICU transfers, and costs. Masimo SET® is estimated to be used on more than 200 million patients in leading hospitals and other healthcare settings around the world, and is the primary pulse oximetry at 9 of the top 10 hospitals as ranked in the 2022-23 U.S. News and World Report Best Hospitals Honor Roll. In 2005, Masimo introduced rainbow® Pulse CO-Oximetry technology, allowing noninvasive and continuous monitoring of blood constituents that previously could only be measured invasively and intermittently, including total hemoglobin (SpHb®), oxygen content (SpOC™), carboxyhemoglobin (SpCO®), methemoglobin (SpMet®), Pleth Variability Index (Pvi®), RPVi™ (rainbow® Pvi), and Oxygen Reserve Index (Ori™). In 2013, Masimo introduced the Root® Patient Monitoring and Connectivity Platform, built from the ground up to be as flexible and expandable as possible to facilitate the addition of other Masimo and third-party monitoring technologies; key Masimo additions include Next Generation SedLine® Brain Function Monitoring, O3® Regional Oximetry, and ISA™ Capnography with NomoLine® sampling lines. Masimo’s family of continuous and spot-check monitoring Pulse CO-Oximeters® includes devices designed for use in a variety of clinical and non-clinical scenarios, including tetherless, wearable technology, such as Radius-7®, Radius-PPG® and Radius VSM™, portable devices like Rad-67®, fingertip pulse oximeters like MightySat® Rx, and devices available for use both in the hospital and at home, such as Rad-97®. Masimo hospital and home automation and connectivity solutions are centered around Root and the Masimo Hospital Automation™ platform, and include Iris® Gateway, iSirona™, Patient SafetyNet, Replica®, Halo ION, UniView®, UniView :60™, and Masimo SafetyNet™. Masimo’s growing portfolio of health and wellness solutions include Radius T™ and the Masimo W1™ watch, Stork™, Opioid Halo™, Bridge™, and PerL™. Additional information about Masimo and its products may be found at www.masimo.com. Published clinical studies on Masimo products can be found at www.masimo.com/evidence/featured-studies/feature/.
ORi, RPVi, and Radius VSM have not received FDA 510(k) clearance and are not available for sale in the United States. The use of the trademark Patient SafetyNet is under license from University HealthSystem Consortium.
Forward-Looking Statements
All statements other than statements of historical facts included in this press release that address activities, events or developments that we expect, believe or anticipate will or may occur in the future are forward-looking statements including our expectations regarding our updated third-quarter 2023 and full-year financial guidance, including consolidated revenue, healthcare revenue. non-healthcare revenue, consolidated operating income and consolidated earnings per diluted share; our ability to manage cost structure to preserve profitability; our expectations regarding the pace of recovery in inpatient volumes and weakness in the high-end consumer audio market, our contracting activity and new products and our ability to rebound and achieve long-term growth targets. These forward-looking statements are based on management’s current expectations and beliefs and are subject to uncertainties and factors, all of which are difficult to predict and many of which are beyond our control and could cause actual results to differ materially and adversely from those described in the forward-looking statements. These risks include, but are not limited to, those related to: our dependence on Masimo SET® and Masimo rainbow SET™ products and technologies for substantially all of our revenue; any failure in protecting our intellectual property exposure to competitors’ assertions of intellectual property claims; the highly competitive nature of the markets in which we sell our products and technologies; any failure to continue developing innovative products and technologies; our ability to successfully integrate Sound United’s brands into our business; our ability to address and expand into new markets; the lack of acceptance of any of our current or future products and technologies; obtaining regulatory approval of our current and future products and technologies; the risk that the implementation of our international realignment will not continue to produce anticipated operational and financial benefits, including a continued lower effective tax rate; the loss of our customers; the failure to retain and recruit senior management; product liability claims exposure; a failure to obtain expected returns from the amount of intangible assets we have recorded; the maintenance of our brand; the amount and type of equity awards that we may grant to employees and service providers in the future; our ongoing litigation and related matters; and other factors discussed in the “Risk Factors” section of our most recent periodic reports filed with the Securities and Exchange Commission (“SEC”), including our most recent Form 10-K and Form 10-Q, all of which you may obtain for free on the SEC’s website at www.sec.gov. Although we believe that the expectations reflected in our forward-looking statements are reasonable, we do not know whether our expectations will prove correct. You are cautioned not to place undue reliance on these forward-looking statements, which speak only as of the date hereof, even if subsequently made available by us on our website or otherwise. We do not undertake any obligation to update, amend or clarify these forward-looking statements, whether as a result of new information, future events or otherwise, except as may be required under applicable securities laws.
# # #
Masimo, SET, Signal Extraction Technology, Improving Patient Outcome and Reducing Cost of Care... by Taking Noninvasive Monitoring to New Sites and Applications, rainbow, SpHb, SpOC, SpCO, SpMet, PVI and ORI are trademarks or registered trademarks of Masimo Corporation.
| | | | | | | | | | | |
MASIMO CORPORATION CONDENSED CONSOLIDATED BALANCE SHEETS (unaudited, in millions) |
| July 1,
2023 | | December 31,
2022 |
| ASSETS | | | |
| Current assets | | | |
| Cash and cash equivalents | $ | 150.7 | | | $ | 202.9 | |
| | | |
| Accounts receivable, net of allowance for credit losses | 348.8 | | | 445.9 | |
| Inventories | 542.6 | | | 501.0 | |
| Other current assets | 166.1 | | | 158.8 | |
| Total current assets | 1,208.2 | | | 1,308.6 | |
| Lease receivable, non-current | 77.5 | | | 73.1 | |
| Deferred costs and other contract assets | 42.3 | | | 41.9 | |
| Property and equipment, net | 410.0 | | | 402.5 | |
| | | |
| Customer relationships, net | 182.0 | | | 201.6 | |
| Acquired technologies, net | 144.3 | | | 160.1 | |
| Other intangible assets, net | 100.2 | | | 98.9 | |
| Trademarks | 239.2 | | | 262.0 | |
| Goodwill | 410.9 | | | 445.4 | |
| Deferred tax assets | 88.4 | | | 102.5 | |
| Other non-current assets | 108.2 | | | 114.0 | |
| Total assets | $ | 3,011.2 | | | $ | 3,210.6 | |
LIABILITIES AND STOCKHOLDERS’ EQUITY | | | |
| Current liabilities | | | |
| Accounts payable | $ | 265.5 | | | $ | 276.8 | |
| Accrued compensation | 50.2 | | | 89.3 | |
| Deferred revenue and other contract liabilities, current | 73.7 | | | 80.6 | |
| Other current liabilities | 182.5 | | | 183.3 | |
| Total current liabilities | 571.9 | | | 630.0 | |
| Long-term debt | 888.8 | | | 941.6 | |
| Deferred tax liabilities | 118.9 | | | 163.6 | |
| | | |
| Other non-current liabilities | 123.3 | | | 136.5 | |
| Total liabilities | 1,702.9 | | | 1,871.7 | |
| Commitments and contingencies | | | |
| Stockholders’ equity | | | |
| | | |
| Preferred stock | — | | | — | |
| Common stock | 0.1 | | | 0.1 | |
| Treasury stock | (1,169.2) | | | (1,169.2) | |
| Additional paid-in capital | 773.7 | | | 782.2 | |
| Accumulated other comprehensive (loss) income | (47.6) | | | 11.5 | |
| Retained earnings | 1,751.3 | | | 1,714.3 | |
| | | |
| | | |
| Total stockholders’ equity | 1,308.3 | | | 1,338.9 | |
| Total liabilities and stockholders’ equity | $ | 3,011.2 | | | $ | 3,210.6 | |
| | | | | | | | | | | | | | | | | | | | | | | |
MASIMO CORPORATION CONDENSED CONSOLIDATED STATEMENTS OF OPERATIONS (unaudited, in millions, except per share amounts) |
| Three Months Ended | | Six Months Ended |
| July 1,
2023 | | July 2,
2022 | | July 1,
2023 | | July 2,
2022 |
| | | | | | | |
| | | | | | | |
| | | | | | | |
| Revenue | $ | 455.3 | | | $ | 565.3 | | | $ | 1,020.3 | | | $ | 869.5 | |
| Cost of goods sold | 234.1 | | | 307.1 | | | 514.3 | | | 406.6 | |
| Gross profit | 221.2 | | | 258.2 | | | 506.0 | | | 462.9 | |
| Operating expenses: | | | | | | | |
| Selling, general and administrative | 151.7 | | | 188.3 | | | 348.0 | | | 297.2 | |
| Research and development | 40.2 | | | 47.8 | | | 90.7 | | | 83.9 | |
| | | | | | | |
| Total operating expenses | 191.9 | | | 236.1 | | | 438.7 | | | 381.1 | |
| Operating income | 29.3 | | | 22.1 | | | 67.3 | | | 81.8 | |
| Non-operating (loss) income | (4.5) | | | 4.5 | | | (16.3) | | | 3.9 | |
| Income before provision for income taxes | 24.8 | | | 26.6 | | | 51.0 | | | 85.7 | |
| Provision for income taxes | 9.1 | | | 8.5 | | | 14.0 | | | 21.0 | |
| Net income | $ | 15.7 | | | $ | 18.1 | | | $ | 37.0 | | | $ | 64.7 | |
| | | | | | | |
| | | | | | | |
| | | | | | | |
| | | | | | | |
| | | | | | | |
| | | | | | | |
| | | | | | | |
| Net income per share: | | | | | | | |
| Basic | $ | 0.30 | | | $ | 0.34 | | | $ | 0.70 | | | $ | 1.18 | |
| Diluted | $ | 0.29 | | | $ | 0.33 | | | $ | 0.68 | | | $ | 1.15 | |
| | | | | | | |
| Weighted-average shares used in per share calculations: | | | | | | | |
| Basic | 52.8 | | | 53.9 | | | 52.7 | | | 54.7 | |
| Diluted | 54.4 | | | 55.3 | | | 54.3 | | | 56.4 | |
The following table presents details of the stock-based compensation (benefit) expense that is included in each functional line item in the condensed consolidated statements of operations (in millions):
| | | | | | | | | | | | | | | | | | | | | | | |
| Three Months Ended | | Six Months Ended |
| July 1,
2023 | | July 2,
2022 | | July 1,
2023 | | July 2,
2022 |
| Cost of goods sold | $ | 0.2 | | | $ | 0.3 | | | $ | 0.5 | | | $ | 0.5 | |
| Selling, general and administrative | (8.8) | | | 12.8 | | | (4.6) | | | 20.2 | |
| Research and development | — | | | 4.2 | | | 2.8 | | | 7.5 | |
| Total | $ | (8.6) | | | $ | 17.3 | | | $ | (1.3) | | | $ | 28.2 | |
| | | | | | | | | | | |
MASIMO CORPORATION CONDENSED CONSOLIDATED STATEMENTS OF CASH FLOWS (unaudited, in millions) |
| Six Months Ended |
| July 1,
2023 | | July 2,
2022 |
| Cash flows from operating activities: | | | |
| Net income | $ | 37.0 | | | $ | 64.7 | |
| Adjustments to reconcile net income to net cash provided by operating activities: | | | |
| Depreciation and amortization | 51.3 | | | 79.9 | |
| Stock-based compensation (benefit) expense | (1.3) | | | 28.2 | |
| Gain on disposal of equipment, intangibles and other assets | — | | | 0.3 | |
| | | |
| Provision for credit losses | 0.5 | | | 0.9 | |
| | | |
| Amortization of debt issuance cost | 0.9 | | | — | |
| Changes in operating assets and liabilities: | | | |
| Decrease (increase) in accounts receivable | 95.9 | | | (44.7) | |
| Increase in inventories | (45.5) | | | (67.8) | |
| Increase in other current assets | (8.8) | | | (8.2) | |
| Increase in lease receivable, net | (4.4) | | | (1.7) | |
| Increase in deferred costs and other contract assets | (0.4) | | | (21.6) | |
| | | |
| Increase in other non-current assets | (24.4) | | | (0.3) | |
| (Decrease) increase in accounts payable | (11.8) | | | 40.4 | |
| Decrease in accrued compensation | (39.0) | | | (22.6) | |
| Decrease in accrued liabilities | (19.7) | | | (7.2) | |
| Increase (decrease) in income tax payable | 5.0 | | | (18.5) | |
| (Decrease) increase in deferred revenue and other contract-related liabilities | (6.8) | | | 4.8 | |
| | | |
| Decrease in other non-current liabilities | (4.5) | | | (1.0) | |
| Net cash provided by operating activities | 24.0 | | | 25.6 | |
| Cash flows from investing activities: | | | |
| | | |
| | | |
| Purchases of property and equipment, net | (20.4) | | | (30.0) | |
| Increase in intangible assets | (19.9) | | | (10.5) | |
| Business combinations, net of cash acquired | 7.5 | | | (985.5) | |
| Other strategic investing activities | (0.7) | | | (1.2) | |
| Net cash used in investing activities | (33.5) | | | (1,027.2) | |
| Cash flows from financing activities: | | | |
| Borrowings under line of credit | 79.0 | | | 927.0 | |
| Repayments on line of credit | (112.4) | | | (0.1) | |
| | | |
| Debt issuance costs | — | | | (8.9) | |
| | | |
| | | |
| Proceeds from issuance of common stock | 6.0 | | | 4.6 | |
| Payroll tax withholdings on behalf of employees for vested equity awards | (12.7) | | | (25.4) | |
| Repurchases of common stock | — | | | (401.4) | |
| | | |
| Net cash (used in) provided by financing activities | (40.1) | | | 495.8 | |
| Effect of foreign currency exchange rates on cash | (1.4) | | | (22.0) | |
| Net decrease in cash, cash equivalents and restricted cash | (51.0) | | | (527.8) | |
| Cash, cash equivalents and restricted cash at beginning of period | 209.6 | | | 748.4 | |
| Cash, cash equivalents and restricted cash at end of period | $ | 158.6 | | | $ | 220.6 | |
| | | |