masi-20240507
0000937556false00009375562024-05-072024-05-07

UNITED STATES
SECURITIES AND EXCHANGE COMMISSION
WASHINGTON, D.C. 20549
________________________________________________
FORM 8-K
________________________________________________
CURRENT REPORT
Pursuant to Section 13 or 15(d) of the
Securities Exchange Act of 1934
Date of Report (Date of earliest event reported): May 7, 2024
masimologoq32019b.jpg
MASIMO CORPORATION
(Exact name of registrant as specified in its charter)
________________________________________________
DE001-3364233-0368882
(State or other jurisdiction
of incorporation)
(Commission
File Number)
(IRS Employer
Identification No.)
52 DiscoveryIrvine,CA92618
(Address of Principal Executive Offices)(Zip Code)
(949)
297-7000
Registrant’s telephone number, including area code:
Not Applicable
(Former name or former address, if changed since last report)
Check the appropriate box below if the Form 8-K filing is intended to simultaneously satisfy the filing obligation of the registrant under any of the following provisions:
Written communications pursuant to Rule 425 under the Securities Act (17 CFR 230.425)
Soliciting material pursuant to Rule 14a-12 under the Exchange Act (17 CFR 240.14a-12)
Pre-commencement communications pursuant to Rule 14d-2(b) under the Exchange Act (17 CFR 240.14d-2 (b))
Pre-commencement communications pursuant to Rule 13e-4(c) under the Exchange Act (17 CFR 240.13e-4(c))
Securities Registered pursuant to Section 12(b) of the Act:
Title of each classTrading Symbol(s)Name of each exchange on which registered
Common Stock, $0.001 par valueMASIThe Nasdaq Stock Market LLC
Indicate by check mark whether the registrant is an emerging growth company as defined in Rule 405 of the Securities Act of 1933(§230.405 of this chapter) or Rule 12b-2 of the Securities Exchange Act of 1934 (§240.12b-2 of this chapter).
Emerging growth company
If an emerging growth company, indicate by check mark if the registrant has elected not to use the extended transition period for complying with any new or revised financial accounting standards provided pursuant to Section 13(a) of the Exchange Act.


Item 2.02.Results of Operations and Financial Condition.
On May 7, 2024, Masimo Corporation (the “Company”) issued a press release announcing its financial results for the quarter ended March 30, 2024. A copy of the press release is furnished as Exhibit 99.1 to this Current Report.
In accordance with General Instructions B.2 of Form 8-K, the information in Item 2.02 of this Current Report on Form 8-K shall not be deemed “filed” for purposes of Section 18 of the Securities Exchange Act of 1934, as amended (the “Exchange Act”), or otherwise subject to the liability of that section, and shall not be incorporated by reference into any registration statement or other document filed under the Securities Act of 1933, as amended (the “Securities Act”), or the Exchange Act, except as shall be expressly set forth by specific reference in such filing.
Item 7.01.Regulation FD Disclosure.
In connection with the Company’s conference call scheduled to be held on May 7, 2024, the Company’s Chief Financial Officer will review supplemental information regarding the Company’s financial results for the first quarter ended March 30, 2024, as well as the Company’s updated outlook for fiscal 2024. The Company is making available to investors supplemental financial information by fiscal quarter for fiscal years 2022 and 2023, along with the first quarter of 2024, pursuant to the materials furnished as Exhibit 99.2 to this Current Report.
In accordance with General Instructions B.2 of Form 8-K, the information in Item 7.01 of this Current Report on Form 8-K shall not be deemed “filed” for purposes of Section 18 of the Exchange Act, or otherwise subject to the liability of that section, and shall not be incorporated by reference into any registration statement or other document filed under the Securities Act or the Exchange Act, except as shall be expressly set forth by specific reference in such filing.
Item 9.01.Financial Statements and Exhibits.
(d) The following items are filed as exhibits to the Current Report on Form 8-K.
Exhibit
 No.
Description
99.1
99.2
104Cover Page Interactive Data File (embedded within the Inline XBRL document)


SIGNATURES
Pursuant to the requirements of the Securities Exchange Act of 1934, Masimo Corporation has duly caused this report to be signed on its behalf by the undersigned, thereunto duly authorized.
 
MASIMO CORPORATION
Date: May 7, 2024By:
/s/ MICAH YOUNG
Micah Young
Executive Vice President & Chief Financial Officer
(Principal Financial Officer)


Exhibit 99.1
masimologoq2020a.jpg
Masimo Reports First Quarter 2024 Financial Results
First Quarter 2024 Highlights:
Consolidated revenue was $492.8 million;
Healthcare revenue was $339.6 million;
Non-healthcare revenue was $153.2 million;
GAAP net income per diluted share was $0.35; and
Non-GAAP net income per diluted share was $0.77.
Irvine, California, May 7, 2024 - Masimo Corporation (Nasdaq: MASI) today announced its financial results for the first quarter ended March 30, 2024.
First Quarter 2024 Results:
Consolidated revenue was $492.8 million, comprised of healthcare revenue of $339.6 million and non-healthcare revenue of $153.2 million.
Excluding handheld and fingertip pulse oximeters, shipments of noninvasive technology boards and instruments were 50,400.
Consolidated GAAP operating income was $34.0 million. Consolidated non-GAAP operating income was $67.9 million. Consolidated GAAP net income was $18.9 million, or $0.35 per diluted share. Consolidated non-GAAP net income was $41.9 million, or $0.77 per diluted share.
Joe Kiani, Chairman and Chief Executive Officer of Masimo, said, “It’s good to see that our business is reaching a steady state after a period of robust growth during Covid and the wake of volatility that followed. Healthcare revenues were at the high end of our guidance range, driven by strong sensors orders in the U.S. and Europe. Our team’s incredible effort and success in moving the bulk of our sensor manufacturing from Mexico to Malaysia yielded improved gross margins ahead of schedule for healthcare. Based on our first quarter results and a more positive outlook for 2024, we are increasing our guidance for healthcare revenues and non-GAAP EPS. At the behest of the majority of our shareholders, we are pursuing a separation of our consumer business. Management is working diligently to finalize the proposed structure and options for our board of directors to review. I am hopeful that we can create two businesses that can each achieve great results, and together improve life.”
For additional financial details, please visit the Investor Relations section of the Company’s website at investor.masimo.com to access the first quarter 2024 earnings presentation materials.
Second Quarter 2024 and Updated Full-Year 2024 Financial Guidance:
The Company provided the following estimates for its second quarter 2024 and updated full-year 2024 guidance:
Q2 2024
Guidance(1)
Updated Full-Year
 2024 Guidance(1)
(in millions, except earnings per diluted share)GAAP
Non-GAAP
 (Updated Definition)(2)
GAAP
Non-GAAP
 (Updated Definition)(2)
Consolidated revenue$480 to $510$480 to $510$2,055 to $2,165$2,055 to $2,165
Healthcare revenue$330 to $340$330 to $340$1,355 to $1,385$1,355 to $1,385
Non-healthcare revenue$150 to $170$150 to $170$700 to $780$700 to $780
Consolidated operating income$33 to $38$67 to $72$189 to $204$309 to $324
Consolidated earnings per diluted share$0.26 to $0.33$0.73 to $0.79$1.91 to $2.08$3.54 to $3.70
______________
(1)    Guidance provided May 7, 2024.

-1-


(2)    Effective fiscal year 2024, we have updated our non-GAAP financial measures to exclude the impact of all expenses related to our ongoing litigation with Apple. Masimo had previously only excluded the expenses related to the U.S. International Trade Commission litigation against Apple. Masimo believes all Apple litigation expenses are unique in nature and not indicative of the Company’s on-going operating performance and has therefore excluded them from our non-GAAP financial measures.
Supplementary Non-GAAP Financial Information
For additional non-GAAP financial details, please visit the Investor Relations section of the Company’s website at investor.masimo.com to access Supplementary Financial Information.
Non-GAAP Financial Measures
The non-GAAP financial measures contained herein are a supplement to the corresponding financial measures prepared in accordance with U.S. GAAP. The non-GAAP financial measures presented exclude the items described below. Management believes that adjustments for these items assist investors in making comparisons of period-to-period operating results. Furthermore, management also believes that these items are not indicative of the Company’s on-going operating performance. These non-GAAP financial measures have certain limitations in that they do not reflect all of the costs associated with the operations of the Company’s business as determined in accordance with GAAP.
Therefore, investors should consider non-GAAP financial measures in addition to, and not as a substitute for, or as superior to, measures of financial performance prepared in accordance with GAAP. The non-GAAP financial measures presented by the Company may be different from the non-GAAP financial measures used by other companies.
The Company has presented the following non-GAAP measures to assist investors in understanding the Company’s net operating results on an on-going basis: (i) constant currency revenue growth percentage, (ii) non-GAAP net income (prior definition and updated definition), (iii) non-GAAP (net income) earnings per diluted share (prior definition and updated definition) and (iv) non-GAAP operating income/margin (prior definition and updated definition). These non-GAAP financial measures may also assist investors in making comparisons of the Company’s operating results with those of other companies. Management believes constant currency revenue growth, non-GAAP operating income/margin, non-GAAP net income and non-GAAP earnings per diluted share are important measures in the evaluation of the Company’s performance and uses these measures to better understand and evaluate our business.
The non-GAAP financial measures reflect adjustments for the following items:
Constant currency revenue adjustments
Some of our sales agreements with foreign customers provide for payment in currencies other than the U.S. Dollar. These foreign currency revenues, when converted into U.S. Dollars, can vary significantly from period-to-period depending on the average and quarter-end exchange rates during a respective period. We believe that comparing these foreign currency denominated revenues by holding the exchange rates constant with the prior year period is useful to management and investors in evaluating our revenue growth rates on a period-to-period basis. We anticipate that fluctuations in foreign exchange rates and the related constant currency adjustments for calculation of our revenue growth rate will continue to occur in future periods.
Acquired tangible asset amortization
These transactions represent amortization expense in connection with business or assets acquisitions associated with acquired tangible assets and asset valuation step-ups.
Business transition and related costs
These transactions represent gains, losses, and other related costs associated with business transition plans. These items may include but are not limited to severance, relocation, consulting, leasehold exit costs, asset impairment, and other related costs to rationalize our operational footprint and optimize business results.
Acquired intangible asset amortization
These transactions represent amortization expense in connection with business or assets acquisitions associated with acquired intangible assets including, but not limited to customer relationships, intellectual property, trade names and non-competition agreements.
Acquisition, integration and related costs
These transactions represent gains, losses, and other related costs associated with acquisitions, integrations, investments, divestitures, assets impairments, and in-process research and development.
-2-


Litigation related expenses and settlements (prior definition)
These transactions represent gains, losses, and other related costs associated with certain litigation matters, which can vary in their characteristics, frequency and significance to our operating results.
Litigation related expenses and settlements (updated definition)
We have been engaged in various legal proceedings against Apple since January 2020, including various proceedings in the federal courts, various proceedings in the U.S. Patent and Trademark Office (the “PTO proceedings”), and a proceeding in the U.S. International Trade Commission (the “ITC proceeding”). Although we previously excluded only expenses relating to the ITC proceeding from the definition of “Litigation related expenses and settlements”, beginning with the first quarter of 2024, we have revised the definition of “Litigation related expenses and settlements” to exclude not only expenses relating to the ITC proceeding, but also all other Apple litigation expenses, including those relating to the federal court proceedings and the PTO proceedings. We believe all of the Apple litigation expenses are unique in nature and not indicative of the Company’s on-going operating performance, and this updated definition will provide more useful information to investors by facilitating period-to-period comparisons of our financial performance that otherwise may be obscured by the significant fluctuations in Apple-related litigation expenses.
Other adjustments
In the event there are gains, losses and other adjustments which impact period-to-period comparability and do not represent the underlying ongoing results of the business, the Company may choose to exclude these from non-GAAP earnings.
Realized and unrealized gains or losses
These transactions represent gains, losses, and other related costs associated with foreign currency denominated transactions and investments. Changes in the underlying currency rates relative to the U.S. Dollar may result in realized and unrealized foreign currency gains and losses between the time these receivables and payables arise and the time that they are settled in cash. Unrealized and realized gains and losses on investments may impact the Company’s reported results of operations for a period. These items are highly variable, difficult to predict and outside the control of those responsible for the underlying operations of the business. Other items also included here are mark-to-market gains and losses of derivative contracts that are not designated as hedging instruments or the ineffective portions of cash flow hedges.
Financing related adjustments
The Company may enter into various financial arrangements whereby costs are incurred and certain instrument features are valued and expensed accordingly but are not necessarily indicative of the on-going cash flow generation of the Company and therefore excludes these costs from non-GAAP earnings. For GAAP earnings per diluted share purposes, the Company cannot reflect the anti-dilutive impact, if applicable, in its diluted shares calculations. However, the Company believes that reflecting the anti-dilutive impact of these instruments in non-GAAP earnings per diluted share provides management and investors with useful information in evaluating the financial performance of the Company on a per share basis.
Tax impact of non-GAAP adjustments
In order to reflect the tax effected impact of the non-GAAP adjustments, the Company will adjust the non-GAAP earnings by the approximate tax impact of these adjustments.
Excess tax benefits from stock-based compensation expense
GAAP requires that excess tax benefits recognized on stock-based compensation expense be reflected in our provision for income taxes rather than paid-in capital. As these excess tax benefits may be highly variable from period-to-period, the Company may choose to exclude these tax benefits from non-GAAP earnings to facilitate comparability between periods and with peers.


-3-


First Quarter 2024 Actuals versus First Quarter 2023 Actuals:
RECONCILIATION OF HEALTHCARE GAAP TO NON-GAAP CONSTANT CURRENCY REVENUE(1):
Three Months Ended
(in millions, except percentages)March 30,
2024
April 1,
2023
GAAP healthcare revenue$339.6 $346.7 
Constant currency revenue adjustments1.5 N/A
Non-GAAP healthcare constant currency revenue$341.1 $346.7 
GAAP healthcare revenue growth %(2.1)%
Non-GAAP healthcare constant currency revenue growth %(1.6)%
__________________
(1)      May not foot due to rounding.
RECONCILIATION OF NON-HEALTHCARE GAAP TO NON-GAAP CONSTANT CURRENCY REVENUE(1):
Three Months Ended
(in millions, except percentages)March 30,
2024
April 1,
2023
GAAP non-healthcare revenue$153.2 $218.3 
Constant currency revenue adjustments1.0 N/A
Non-GAAP non-healthcare constant currency revenue$154.2 $218.3 
GAAP healthcare revenue growth %(29.8)%
Non-GAAP healthcare constant currency revenue growth %(29.4)%
__________________
(1)      May not foot due to rounding.

RECONCILIATION OF GAAP TO NON-GAAP CONSOLIDATED OPERATING INCOME(1):
Three Months Ended
(in millions)March 30,
2024
April 1,
2023
GAAP operating income$34.0 $38.0 
Non-GAAP adjustments:
Acquired tangible asset amortization0.8 2.2 
Acquired intangible asset amortization9.3 9.9 
Acquisition, integration and related costs6.0 3.7 
Business transition and related costs8.8 — 
Litigation related expenses, settlements and awards(2.3)19.1 
Other adjustments3.1 2.5 
Total non-GAAP adjustments25.8 37.5 
Non-GAAP operating income (prior definition)$59.9 $75.5 
Litigation related expenses and settlements8.1 11.6 
Non-GAAP operating income (updated definition)$67.9 $87.1 
__________________
(1)     May not foot due to rounding.

-4-


RECONCILIATION OF GAAP TO NON-GAAP NET INCOME AND NET INCOME PER DILUTED SHARE(1):
Three Months Ended
March 30,
2024
April 1,
2023
(in millions, except per diluted share amounts)$Per Diluted Share$Per Diluted Share
GAAP net income$18.9 $0.35 $21.3 $0.39 
Non-GAAP adjustments:
Acquired tangible asset amortization0.8 0.02 2.2 0.04 
Acquired intangible asset amortization9.3 0.17 9.9 0.18 
Acquisition, integration and related costs6.0 0.11 3.7 0.07 
Business transition and related costs8.8 0.16 — — 
Litigation related expenses, settlements and awards(2.3)(0.04)19.1 0.35 
Other adjustments3.1 0.06 2.5 0.05 
Realized and unrealized gains or losses(2.1)(0.04)0.7 0.01 
Financing related adjustments0.5 0.01 0.5 0.01 
Tax impact of non-GAAP adjustments(6.1)(0.11)(10.0)(0.18)
Excess tax benefits from stock-based compensation expense
(1.3)(0.02)(2.4)(0.04)
Total non-GAAP adjustments16.8 0.31 26.2 0.48 
Non-GAAP net income (prior definition)$35.8 $0.66 $47.5 $0.87 
Litigation related expenses and settlements8.1 0.15 11.6 0.21 
Tax impact of non-GAAP adjustments(1.9)(0.04)(2.7)(0.05)
Non-GAAP net income (updated definition)$41.9 $0.77 $56.3 $1.03 
Weighted average shares outstanding-diluted54.2 54.4 
__________________
(1)      May not foot due to rounding.


-5-


Second Quarter 2024 and Updated Full-Year 2024 Financial Guidance:
RECONCILIATION OF GAAP TO NON-GAAP CONSOLIDATED OPERATING INCOME(1):
(in millions)
Q2 2024
 Guidance(2)
Updated
Full-Year 2024 Guidance(2)
GAAP operating income$33 to $38$189 to $204
Non-GAAP adjustments:
Acquired tangible asset amortization
Acquired intangible asset amortization37 
Acquisition, integration and related costs12 
Business transition and related costs19 
Litigation related expenses, settlements and awards13 
Other adjustments— 
Total non-GAAP adjustments26 88 
Non-GAAP operating income (prior definition)$59 to $64$277 to $292
Litigation related expenses and settlements32 
Non-GAAP operating income (updated definition)$67 to $72$309 to $324
__________________
(1)    May not foot due to rounding.
(2)    Guidance provided May 7, 2024.
RECONCILIATION OF GAAP TO NON-GAAP NET INCOME AND NET INCOME PER DILUTED SHARE(1):
Q2 2024
 Guidance(2)
Updated
Full-Year 2024
Guidance(2)
(in millions, except per diluted share amounts)$Per Diluted Share$Per Diluted Share
GAAP net income$14 to $18$0.26 to $0.33$105 to $114$1.91 to $2.08
Non-GAAP adjustments:
Acquired tangible asset amortization0.02 0.06 
Acquired intangible asset amortization0.17 37 0.68 
Acquisition, integration and related costs0.05 12 0.21 
Business transition and related costs0.15 19 0.35 
Litigation related expenses, settlements and awards0.08 13 0.24 
Other adjustments— 0.000.06 
Realized and unrealized gains or losses— 0.00(2)(0.05)
Financing related adjustments— 0.010.03 
Tax impact of non-GAAP adjustments(6) (0.12)(20)(0.36) to (0.37)
Excess tax benefits from stock-based compensation expense
— (0.01)(3)(0.05)
Total non-GAAP adjustments19 0.35 65 1.18 to 1.19
Non-GAAP net income (prior definition)$34 to $38$0.61 to $0.68$171 to $179$3.10 to $3.26
Litigation related expenses and settlements0.15 32 0.58 
Tax impact of non-GAAP adjustments(2)(0.03)(8)(0.14)
Non-GAAP net income (updated definition)$40 to $44$0.73 to $0.79$195 to $203$3.54 to $3.70
Weighted average shares outstanding-diluted54.9 54.9 
__________________
(1)     May not foot due to rounding.
(2)    Guidance provided May 7, 2024.

-6-


Conference Call:
The conference call to review Masimo’s complete financial results for the first quarter ended March 30, 2024 will begin at 1:30 p.m. PT today (4:30 p.m. ET) on May 7, 2024 and will be hosted by Joe Kiani, Chairman and Chief Executive Officer, and Micah Young, Executive Vice President and Chief Financial Officer. A live webcast of the conference call will be available online from the investor relations page of the Company’s corporate website at www.masimo.com.
To register for the conference call and receive the dial-in number, please use the link below. Upon registering, each participant will be provided with call details and a registrant ID number.
Conference Call Registration Link:
https://registrations.events/direct/Q4I407288
A replay of the webcast and conference call will be available shortly after the conclusion of the call and will be archived on the Company’s website.
-7-


About Masimo
Masimo (Nasdaq: MASI) is a global technology company that develops and produces a wide array of industry-leading monitoring technologies, including innovative measurements, sensors, patient monitors, and automation and connectivity solutions. In addition, Masimo Consumer Audio is home to eight iconic audio brands, including Bowers & Wilkins®, Denon®, Marantz®, and Polk Audio®. Our mission is to improve life, improve patient outcomes; and reduce the cost of care. Masimo SET® Measure-through Motion and Low Perfusion pulse oximetry, introduced in 1995, has been shown in over 100 independent and objective studies to outperform other pulse oximetry technologies. Masimo SET® has also been shown to help clinicians reduce severe retinopathy of prematurity in neonates, improve CCHD screening in newborns, and, when used for continuous monitoring with Masimo Patient SafetyNet in post-surgical wards, reduce rapid response team activations, ICU transfers, and costs. Masimo SET® is estimated to be used on more than 200 million patients in leading hospitals and other healthcare settings around the world, and is the primary pulse oximetry at 9 of the top 10 hospitals as ranked in the 2022-23 U.S. News and World Report Best Hospitals Honor Roll. In 2005, Masimo introduced rainbow® Pulse CO-Oximetry technology, allowing noninvasive and continuous monitoring of blood constituents that previously could only be measured invasively and intermittently, including total hemoglobin (SpHb®), oxygen content (SpOC), carboxyhemoglobin (SpCO®), methemoglobin (SpMet®), Pleth Variability Index (Pvi®), RPVi (rainbow® Pvi), and Oxygen Reserve Index (Ori). In 2013, Masimo introduced the Root® Patient Monitoring and Connectivity Platform, built from the ground up to be as flexible and expandable as possible to facilitate the addition of other Masimo and third-party monitoring technologies; key Masimo additions include Next Generation SedLine® Brain Function Monitoring, O3® Regional Oximetry, and ISA Capnography with NomoLine® sampling lines. Masimo’s family of continuous and spot-check monitoring Pulse CO-Oximeters® includes devices designed for use in a variety of clinical and non-clinical scenarios, including tetherless, wearable technology, such as Radius-7®, Radius-PPG® and Radius VSM, portable devices like Rad-67®, fingertip pulse oximeters like MightySat® Rx, and devices available for use both in the hospital and at home, such as Rad-97®. Masimo hospital and home automation and connectivity solutions are centered around Root and the Masimo Hospital Automation platform, and include Iris® Gateway, iSirona, Patient SafetyNet, Replica®, Halo ION, UniView®, UniView :60, and Masimo SafetyNet. Masimo’s growing portfolio of health and wellness solutions include Radius T and the Masimo W1 watch, Stork, Opioid Halo™, Bridge, and PerL. Additional information about Masimo and its products may be found at www.masimo.com. Published clinical studies on Masimo products can be found at www.masimo.com/evidence/featured-studies/feature/.
RPVi has not received FDA 510(k) clearance and is not available for sale in the United States. The use of the trademark Patient SafetyNet is under license from University HealthSystem Consortium.
Forward-Looking Statements
All statements other than statements of historical facts included in this press release that address activities, events or developments that we expect, believe or anticipate will or may occur in the future are forward-looking statements including, in particular, the statements about our expectations regarding our second-quarter 2024 and updated full-year 2024 financial guidance, including GAAP and non-GAAP consolidated revenue, healthcare revenue. Non-healthcare revenue, consolidated operating income and consolidated earnings per diluted share; the proposed separation of Masimo’s consumer business, including the potential timing and structure thereof and the expectation that the proposed separation will maximize shareholder value or be the best path for success; our ability to manage cost structure to preserve profitability; our expectations regarding the pace of recovery in inpatient volumes and weakness in the high-end consumer audio market, our contracting activity and new products and our ability to rebound and achieve long-term growth targets. These forward-looking statements are based on management’s current expectations and beliefs and are subject to uncertainties and factors, all of which are difficult to predict and many of which are beyond our control and could cause actual results to differ materially and adversely from those described in the forward-looking statements. These risks include, but are not limited to, those related to: our dependence on Masimo SET® and Masimo rainbow SET products and technologies for substantially all of our revenue; any failure in protecting our intellectual property exposure to competitors’ assertions of intellectual property claims; the highly competitive nature of the markets in which we sell our products and technologies; any failure to continue developing innovative products and technologies; our ability to successfully integrate Sound United’s brands into our business; our ability to address and expand into new markets; the lack of acceptance of any of our current or future products and technologies; obtaining regulatory approval of our current and future products and technologies; the risk that the implementation of our international realignment will not continue to produce anticipated operational and financial benefits, including a continued lower effective tax rate; the loss of our customers; the failure to retain and recruit senior management; product liability claims exposure; a failure to obtain expected returns from the amount of intangible assets we have recorded; the maintenance of our brand; the amount and type of equity awards that we may grant to employees and service providers in the future; our ongoing litigation and related matters; the ability to effect any potential separation of our consumer business described above and to meet any of the conditions related thereto; the approval of any such potential separation by Masimo’s board of directors; the ability of any separated businesses to be successful; potential uncertainty during the pendency of any such potential separation that could affect Masimo’s financial performance; the possibility that any potential separation will not be completed within the anticipated time period or at all; the possibility that any such potential separation will not achieve its intended benefits; the possibility of disruption, including changes to existing business relationships, disputes, litigation or unanticipated costs in connection with any such potential separation; the impact on our employees; the uncertainty of the expected financial performance of Masimo prior to and following completion of any such potential separation; negative effects of the announcement or pendency of any such potential separation on the market price of Masimo’s securities and/or on the financial performance of Masimo; evolving legal, regulatory and tax regimes; changes in general economic and/or industry specific conditions; actions by third parties, including government agencies; and other factors discussed in the “Risk Factors” section of our most recent periodic reports filed with the Securities and Exchange Commission (“SEC”), including our most recent Form 10-K and Form 10-Q, all of which you may obtain for free on the SEC’s website at www.sec.gov. Although we believe that the expectations reflected in our forward-looking statements are reasonable, we do not know whether our expectations will prove correct. You are cautioned not to place undue reliance on these forward-looking statements, which speak only as of the date hereof, even if subsequently made available by us on our website or otherwise. We do not undertake any obligation to update, amend or clarify these forward-looking statements, whether as a result of new information, future events or otherwise, except as may be required under applicable securities laws.
# # #
Investor Contact: Eli KammermanMedia Contact: Evan Lamb
(949) 297-7077(949) 396-3376
[email protected][email protected]
Masimo, SET, Signal Extraction Technology, Improving Patient Outcome and Reducing Cost of Care... by Taking Noninvasive Monitoring to New Sites and Applications, rainbow, SpHb, SpOC, SpCO, SpMet, PVI and ORI are trademarks or registered trademarks of Masimo Corporation.
-8-


MASIMO CORPORATION
CONDENSED CONSOLIDATED BALANCE SHEETS
(unaudited, in millions)
March 30,
2024
December 30,
2023
ASSETS
Current assets
Cash and cash equivalents$157.6 $163.0 
Accounts receivable, net of allowance for credit losses330.7 355.5 
Inventories506.1 545.0 
Assets held for sale11.4 — 
Other current assets159.8 168.4 
Total current assets1,165.6 1,231.9 
Lease receivable, non-current70.3 71.4 
Deferred costs and other contract assets57.9 57.3 
Property and equipment, net415.0 424.4 
Customer relationships, net169.3 177.7 
Acquired technologies, net119.9 129.4 
Other intangible assets, net124.0 112.8 
Trademarks222.7 232.4 
Goodwill396.0 407.7 
Deferred tax assets107.1 107.2 
Other non-current assets109.9 89.3 
Total assets$2,957.7 $3,041.5 
LIABILITIES AND STOCKHOLDERS EQUITY
Current liabilities
Accounts payable$203.1 $251.5 
Accrued compensation65.2 62.6 
Deferred revenue and other contract liabilities, current70.0 87.3 
Other current liabilities165.9 162.4 
Total current liabilities504.2 563.8 
Long-term debt841.4 871.7 
Deferred tax liabilities106.9 111.7 
Other non-current liabilities140.0 129.5 
Total liabilities1,592.5 1,676.7 
Commitments and contingencies
Stockholders’ equity
Common stock0.1 0.1 
Treasury stock(1,169.2)(1,169.2)
Additional paid-in capital794.9 783.4 
Accumulated other comprehensive loss(75.3)(45.3)
Retained earnings1,814.7 1,795.8 
Total stockholders’ equity1,365.2 1,364.8 
Total liabilities and stockholders’ equity$2,957.7 $3,041.5 


-9-


MASIMO CORPORATION
 CONDENSED CONSOLIDATED STATEMENTS OF OPERATIONS
(unaudited, in millions, except per share amounts)
Three Months Ended
March 30,
2024
April 1,
2023
Revenue$492.8 $565.0 
Cost of goods sold251.1 280.2 
Gross profit241.7 284.8 
Operating expenses:
Selling, general and administrative159.9 196.3 
Research and development47.8 50.5 
Total operating expenses207.7 246.8 
Operating income34.0 38.0 
Non-operating loss(9.1)(11.8)
Income before provision for income taxes24.9 26.2 
Provision for income taxes6.0 4.9 
Net income$18.9 $21.3 
Net income per share:
Basic$0.36 $0.40 
Diluted$0.35 $0.39 
Weighted-average shares used in per share calculations:
Basic53.0 52.6 
Diluted54.2 54.4 
The following table presents details of the stock-based compensation (benefit) expense that is included in each functional line item in the condensed consolidated statements of operations (in millions):
Three Months Ended
March 30,
2024
April 1,
2023
Cost of goods sold$0.2 $0.3 
Selling, general and administrative5.6 4.2 
Research and development3.8 2.8 
Total$9.6 $7.3 


-10-


MASIMO CORPORATION
CONDENSED CONSOLIDATED STATEMENTS OF CASH FLOWS
(unaudited, in millions)
Three Months Ended
March 30,
2024
April 1,
2023
Cash flows from operating activities:
Net income$18.9 $21.3 
Adjustments to reconcile net income to net cash provided by operating activities:
Depreciation and amortization24.3 26.1 
Stock-based compensation expense9.6 7.3 
Provision for credit losses0.1 0.4 
Amortization of debt issuance cost0.5 0.5 
Changes in operating assets and liabilities:
Decrease (increase) in accounts receivable22.4 34.8 
Decrease (increase) in inventories23.9 (7.1)
Decrease (increase) in other current assets7.0 (5.9)
Decrease (increase) in lease receivable, net0.7 (8.8)
Decrease (increase) in deferred costs and other contract assets(0.6)(1.0)
Decrease (increase) in other non-current assets(0.8)(2.7)
Increase (decrease) in accounts payable(40.6)(27.1)
Increase (decrease) in accrued compensation3.2 (16.5)
Increase (decrease) in accrued liabilities2.3 (21.8)
Increase (decrease) in income tax payable(5.8)(8.3)
Increase (decrease) in deferred revenue and other contract-related liabilities(13.9)0.9 
Increase (decrease) in other non-current liabilities(5.4)8.3 
Net cash provided by (used in) operating activities45.8 0.4 
Cash flows from investing activities:
Purchases of property and equipment, net(8.2)(8.5)
Increase in intangible assets(10.6)(9.7)
Business combinations, net of cash acquired— 7.5 
Other strategic investing activities(0.1)(0.4)
Net cash (used in) provided by investing activities(18.9)(11.1)
Cash flows from financing activities:
Borrowings under line of credit64.0 44.4 
Repayments on line of credit(92.3)(72.4)
Proceeds from issuance of common stock7.1 4.9 
Payroll tax withholdings on behalf of employees for vested equity awards(5.3)(12.1)
Net cash (used in) provided by financing activities(26.5)(35.2)
Effect of foreign currency exchange rates on cash(4.6)17.4 
Net decrease in cash, cash equivalents and restricted cash(4.2)(28.5)
Cash, cash equivalents and restricted cash at beginning of period168.2 209.6 
Cash, cash equivalents and restricted cash at end of period$164.0 $181.1 

-11-
1 First Quarter 2024 Earnings May 7, 2024


2 Safe Harbor Statement This presentation contains forward-looking statements within the meaning of federal securities laws, including, among others, statements about our expectations, plans, strategies or prospects. We generally use the words “may,” “will,” “expect,” “believe,” “anticipate,” “plan,” “estimate,” “project,” “assume,” “guide,” “target,” “forecast,” “see,” “seek,” “can,” “should,” “could,” “would,” “intend,” “predict,” “potential,” “strategy,” “is confident that,” “future,” “opportunity,” “work toward,” and similar expressions to identify forward-looking statements. All statements other than statements of historical or current fact are, or may be deemed to be, forward-looking statements. Such statements are based upon the current beliefs, expectations and assumptions of management and are subject to significant risks, uncertainties and changes in circumstances that could cause actual results to differ materially from the forward-looking statements. Forward-looking statements speak only as of the date they are made, and we disclaim any intention or obligation to update or revise any forward-looking statements, whether as a result of new information, future events or otherwise. Readers of this presentation are cautioned not to rely on these forward-looking statements, since there can be no assurance that these forward- looking statements will prove to be accurate. This cautionary statement is applicable to all forward-looking statements contained in this presentation. The risks and uncertainties that may cause actual results to differ materially from Masimo’s current expectations are more fully described in Masimo’s reports filed with the U.S. Securities and Exchange Commission (SEC), including our most recent Form 10-K and Form 10-Q. Copies of these filings, as well as subsequent filings, are available online at www.sec.gov, www.masimo.com or upon request. The non-GAAP financial measures contained herein are a supplement to the corresponding financial measures prepared in accordance with U.S. GAAP. The non- GAAP financial measures presented exclude certain items that are more fully described in the Appendix. Management believes that adjustments for these items assist investors in making comparisons of period-to-period operating results. Furthermore, management also believes that these items are not indicative of the Company’s on-going core operating performance. These non-GAAP financial measures have certain limitations in that they do not reflect all of the costs associated with the operations of the Company’s business as determined in accordance with GAAP. Therefore, investors should consider non-GAAP financial measures in addition to, and not as a substitute for, or as superior to, measures of financial performance prepared in accordance with GAAP. The non-GAAP financial measures presented by the Company may be different from the non-GAAP financial measures used by other companies. The Company has presented the following non- GAAP financial measures to assist investors in understanding the Company’s core net operating results on an on-going basis: non-GAAP revenue (constant currency), pro-forma non-GAAP revenue (constant currency), pro-forma non-GAAP revenue growth (constant currency), non-GAAP gross profit/margin %, non- GAAP SG&A expense (prior definition and updated definition), non-GAAP R&D expense, non-GAAP litigation settlements and awards, non-GAAP impairment charge, non-GAAP operating expense % (prior definition and updated definition), non-GAAP operating profit/margin % (prior definition and updated definition), non- GAAP non-operating income (expense), non-GAAP provision for income taxes (prior definition and updated definition), non-GAAP net income (loss) (prior definition and updated definition), non-GAAP net income (loss) per share (prior definition and updated definition). This presentation also includes certain preliminary estimated information of a potential separation for illustrative and informational purposes and further adjusted for separation items. See “Disclaimer Regarding Potential Separation” on the next slide for additional information. These non-GAAP financial measures may also assist investors in making comparisons of the company’s core operating results with those of other companies. Management believes these non-GAAP financial measures are important in the evaluation of the Company’s performance and uses these measures to better understand and evaluate our business. For additional financial details, including GAAP to non-GAAP reconciliations, please visit the Investor Relations section of the Company’s website at www.masimo.com to access Supplementary Financial Information.


3 Disclaimer Regarding Potential Separation On March 22, 2024, Masimo announced that its Board of Directors has authorized management to evaluate a proposed separation of the company’s consumer business (the “Potential Separation”). Masimo’s Board of Directors and management are in the process of evaluating the proposed structure of the Potential Separation. Slide 7 of this presentation entitled “Preliminary Estimate: Financial Impact of a Potential Separation” (“Slide 7”) includes an estimate of the financial impact of the Potential Separation; however, the estimate is being provided solely for illustrative and informational purposes and does not purport to contain or present all information relating to any Potential Separation. Moreover, the method, structure, timing and terms of any Potential Separation are still under consideration and have not been determined, approved or finalized, and the final method, structure, timing and terms of any Potential Separation, including the separation of assets and liabilities, may differ materially from what is presented and estimated on Slide 7. There can be no assurance that any Potential Separation that may be implemented will be similar in structure to the structure illustrated on Slide 7, that any Potential Separation may be effected at all or the timing of any Potential Separation. Additionally, the estimate on Slide 7 is an illustrative projection that was calculated using the midpoint of Masimo’s 2024 consolidated guidance, which is based on management’s current expectations and beliefs, but is subject to uncertainty and risks, and also relies on a number of assumptions and adjustments as described on Slide 7. Accordingly, all of the information on Slide 7 is a “forward-looking statement” as described on Slide 2 of this presentation entitled “Safe Harbor Statement”. Investors are strongly cautioned not to place undue reliance on these forward-looking statements, including in respect of the financial or operating outlook for the potential separated businesses (including, without limitation, the realization of any expected efficiencies or cost savings). The forward-looking statements on Slide 7 are subject to risks and uncertainties, all of which are difficult to predict and many of which are beyond our control and could cause the actual results of any Potential Separation to differ materially and adversely from those illustrated on Slide 7 as a result of various risk factors, including, but not limited to: risks related to the ability to effect or complete any Potential Separation on the terms described on Slide 7, or at all, and to meet any of the conditions related thereto; the approval of any Potential Separation by Masimo’s Board of Directors; the ability of the separated businesses to be successful; expectations around the financial impact of any Potential Separation; potential uncertainty during the pendency of any Potential Separation that could affect Masimo’s financial performance; the possibility that any Potential Separation will not be completed within the anticipated time period or at all; the possibility that any Potential Separation will not achieve its intended benefits; the possibility of disruption, including changes to existing business relationships, disputes, litigation or unanticipated costs in connection with any Potential Separation; the impact that any Potential Separation may have on our employees; the uncertainty of the expected financial performance of Masimo prior to and following completion of any Potential Separation; negative effects of the announcement or pendency of any Potential Separation on the market price of Masimo’s securities and/or on the financial performance of Masimo; evolving legal, regulatory and tax regimes; changes in general economic and/or industry specific conditions; actions by third parties, including government agencies; as well as other factors more fully described in Masimo’s reports filed with the U.S. Securities and Exchange Commission (SEC), including our most recent Form 10-K and Form 10-Q. Copies of these filings, as well as subsequent filings, are available online at www.sec.gov, www.masimo.com or upon request. Except as required by applicable law, Masimo assumes no obligation to, and expressly disclaims any duty or obligation to, provide any additional or updated information or to update any forward-looking statements, whether as a result of new information, future events or results, or otherwise. Nothing in this presentation will, under any circumstances (including by reason of this presentation remaining available and not being superseded or replaced by any other presentation or publication with respect to Masimo or the Potential Separation), create an implication that there has been no change in the affairs of Masimo or any Potential Separation since the date of this presentation.


4 Financial Overview


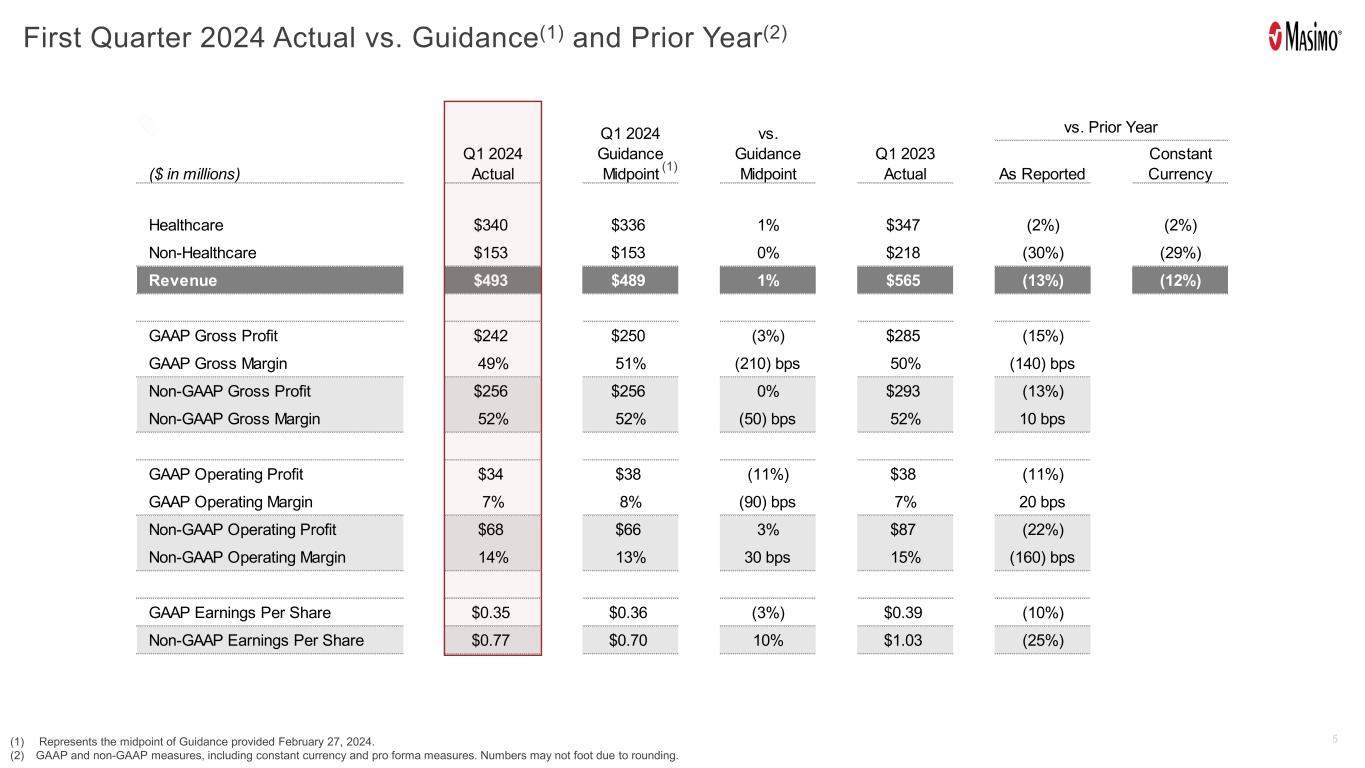
5 As Reported Constant Currency Healthcare $340 $336 1% $347 (2%) (2%) Non-Healthcare $153 $153 0% $218 (30%) (29%) Revenue $493 $489 1% $565 (13%) (12%) GAAP Gross Profit $242 $250 (3%) $285 (15%) GAAP Gross Margin 49% 51% (210) bps 50% (140) bps Non-GAAP Gross Profit $256 $256 0% $293 (13%) Non-GAAP Gross Margin 52% 52% (50) bps 52% 10 bps GAAP Operating Profit $34 $38 (11%) $38 (11%) GAAP Operating Margin 7% 8% (90) bps 7% 20 bps Non-GAAP Operating Profit $68 $66 3% $87 (22%) Non-GAAP Operating Margin 14% 13% 30 bps 15% (160) bps GAAP Earnings Per Share $0.35 $0.36 (3%) $0.39 (10%) Non-GAAP Earnings Per Share $0.77 $0.70 10% $1.03 (25%) vs. Prior Year ($ in millions) Q1 2024 Actual Q1 2023 Actual Q1 2024 Guidance Midpoint vs. Guidance Midpoint First Quarter 2024 Actual vs. Guidance(1) and Prior Year(2) (1) Represents the midpoint of Guidance provided February 27, 2024. (2) GAAP and non-GAAP measures, including constant currency and pro forma measures. Numbers may not foot due to rounding. (1)


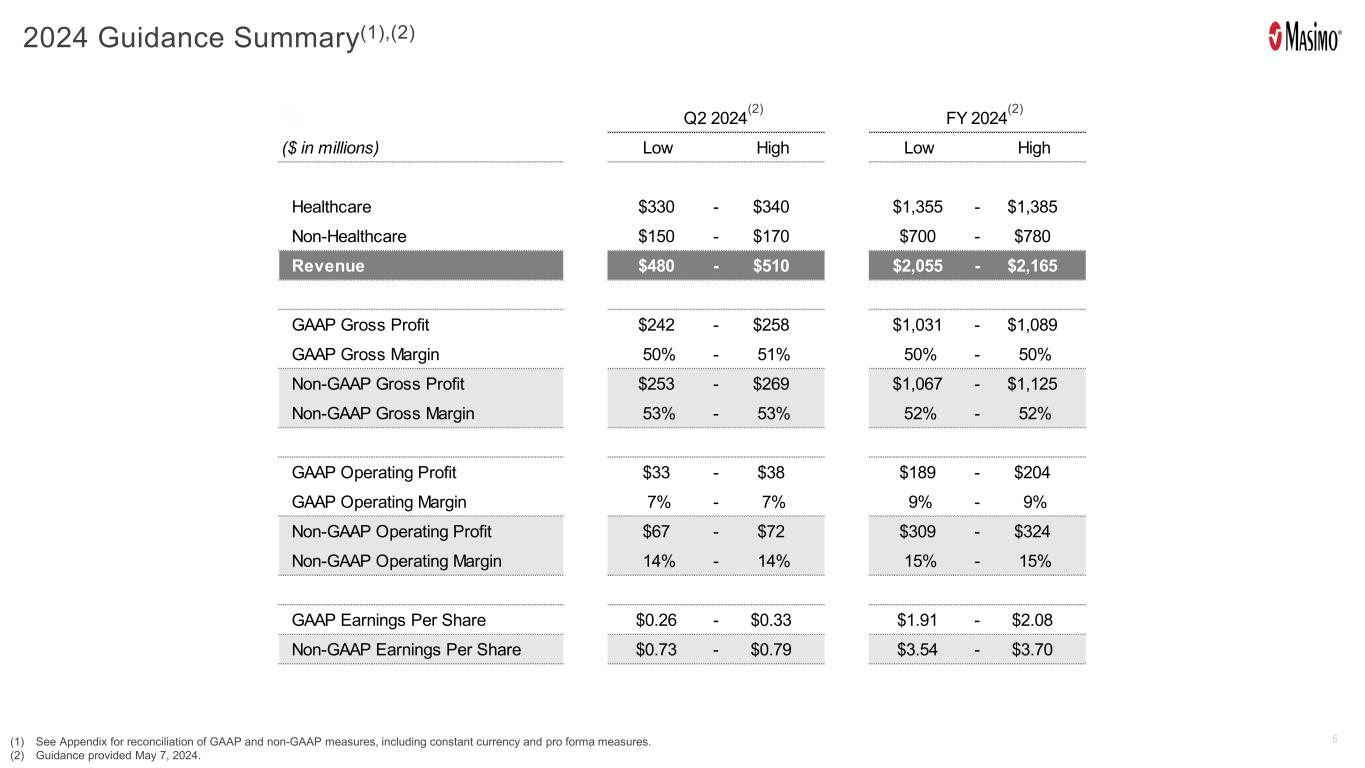
6 ($ in millions) Low High Low High Healthcare $330 - $340 $1,355 - $1,385 Non-Healthcare $150 - $170 $700 - $780 Revenue $480 - $510 $2,055 - $2,165 GAAP Gross Profit $242 - $258 $1,031 - $1,089 GAAP Gross Margin 50% - 51% 50% - 50% Non-GAAP Gross Profit $253 - $269 $1,067 - $1,125 Non-GAAP Gross Margin 53% - 53% 52% - 52% GAAP Operating Profit $33 - $38 $189 - $204 GAAP Operating Margin 7% - 7% 9% - 9% Non-GAAP Operating Profit $67 - $72 $309 - $324 Non-GAAP Operating Margin 14% - 14% 15% - 15% GAAP Earnings Per Share $0.26 - $0.33 $1.91 - $2.08 Non-GAAP Earnings Per Share $0.73 - $0.79 $3.54 - $3.70 FY 2024Q2 2024 (1) See Appendix for reconciliation of GAAP and non-GAAP measures, including constant currency and pro forma measures. (2) Guidance provided May 7, 2024. 2024 Guidance Summary(1),(2) (2) (2)


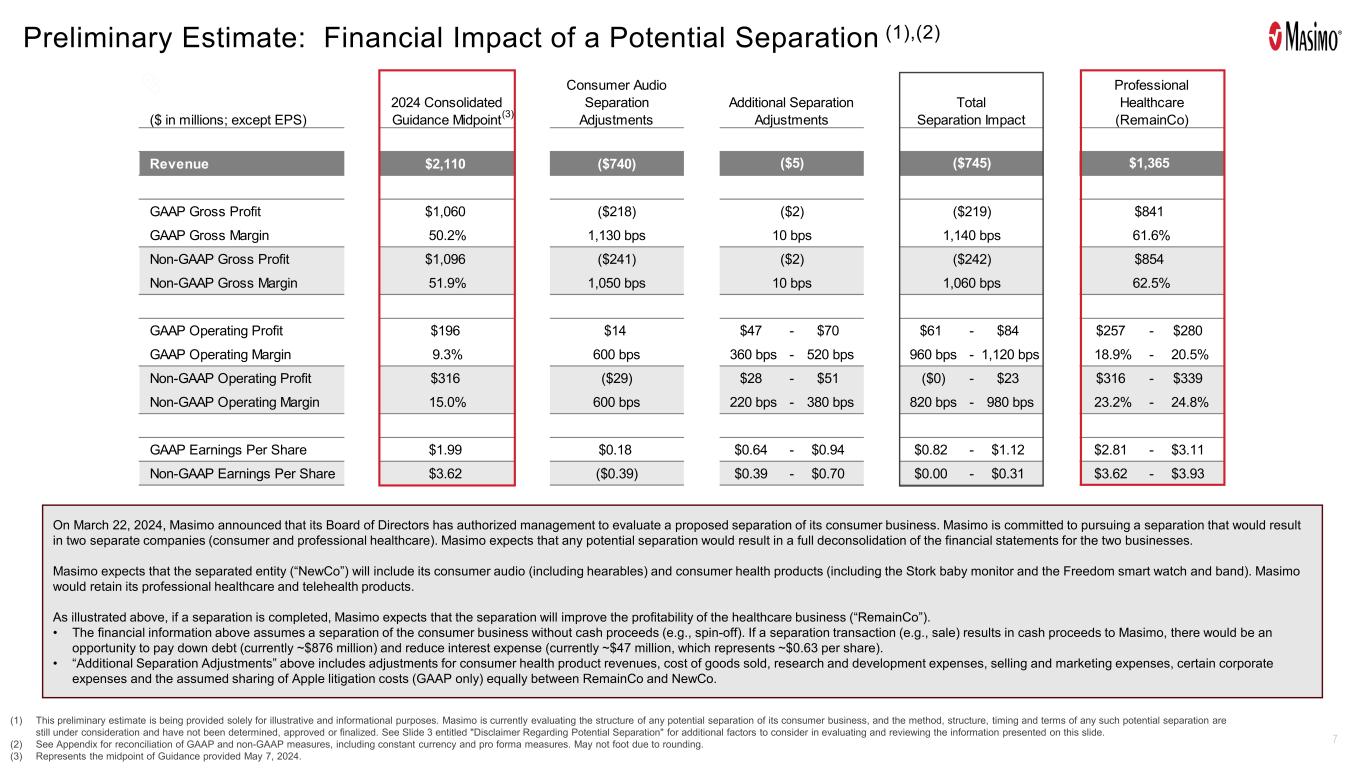
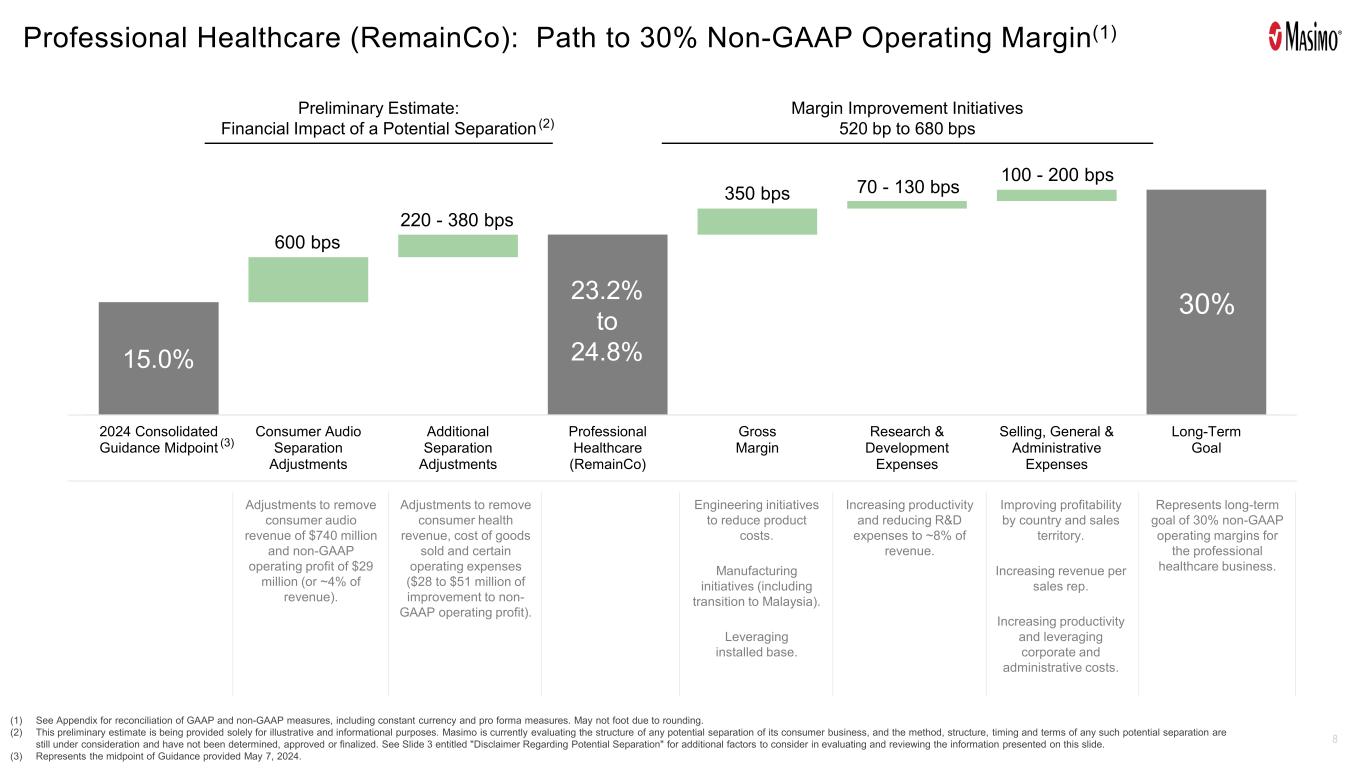
7 ($ in millions; except EPS) Revenue $2,110 ($740) GAAP Gross Profit $1,060 ($218) GAAP Gross Margin 50.2% 1,130 bps Non-GAAP Gross Profit $1,096 ($241) Non-GAAP Gross Margin 51.9% 1,050 bps GAAP Operating Profit $196 $14 $47 - $70 $61 - $84 $257 - $280 GAAP Operating Margin 9.3% 600 bps 360 bps - 520 bps 960 bps - 1,120 bps 18.9% - 20.5% Non-GAAP Operating Profit $316 ($29) $28 - $51 ($0) - $23 $316 - $339 Non-GAAP Operating Margin 15.0% 600 bps 220 bps - 380 bps 820 bps - 980 bps 23.2% - 24.8% GAAP Earnings Per Share $1.99 $0.18 $0.64 - $0.94 $0.82 - $1.12 $2.81 - $3.11 Non-GAAP Earnings Per Share $3.62 ($0.39) $0.39 - $0.70 $0.00 - $0.31 $3.62 - $3.93 ($5) ($745) $1,365 2024 Consolidated Guidance Midpoint Consumer Audio Separation Adjustments Additional Separation Adjustments Total Separation Impact Professional Healthcare (RemainCo) ($2) ($219) $841 10 bps 1,140 bps 61.6% ($2) ($242) $854 10 bps 1,060 bps 62.5% Preliminary Estimate: Financial Impact of a Potential Separation (1),(2) (3) (1) This preliminary estimate is being provided solely for illustrative and informational purposes. Masimo is currently evaluating the structure of any potential separation of its consumer business, and the method, structure, timing and terms of any such potential separation are still under consideration and have not been determined, approved or finalized. See Slide 3 entitled "Disclaimer Regarding Potential Separation" for additional factors to consider in evaluating and reviewing the information presented on this slide. (2) See Appendix for reconciliation of GAAP and non-GAAP measures, including constant currency and pro forma measures. May not foot due to rounding. (3) Represents the midpoint of Guidance provided May 7, 2024. On March 22, 2024, Masimo announced that its Board of Directors has authorized management to evaluate a proposed separation of its consumer business. Masimo is committed to pursuing a separation that would result in two separate companies (consumer and professional healthcare). Masimo expects that any potential separation would result in a full deconsolidation of the financial statements for the two businesses. Masimo expects that the separated entity (“NewCo”) will include its consumer audio (including hearables) and consumer health products (including the Stork baby monitor and the Freedom smart watch and band). Masimo would retain its professional healthcare and telehealth products. As illustrated above, if a separation is completed, Masimo expects that the separation will improve the profitability of the healthcare business (“RemainCo”). • The financial information above assumes a separation of the consumer business without cash proceeds (e.g., spin-off). If a separation transaction (e.g., sale) results in cash proceeds to Masimo, there would be an opportunity to pay down debt (currently ~$876 million) and reduce interest expense (currently ~$47 million, which represents ~$0.63 per share). • “Additional Separation Adjustments” above includes adjustments for consumer health product revenues, cost of goods sold, research and development expenses, selling and marketing expenses, certain corporate expenses and the assumed sharing of Apple litigation costs (GAAP only) equally between RemainCo and NewCo.


8 Professional Healthcare (RemainCo): Path to 30% Non-GAAP Operating Margin(1) (1) See Appendix for reconciliation of GAAP and non-GAAP measures, including constant currency and pro forma measures. May not foot due to rounding. (2) This preliminary estimate is being provided solely for illustrative and informational purposes. Masimo is currently evaluating the structure of any potential separation of its consumer business, and the method, structure, timing and terms of any such potential separation are still under consideration and have not been determined, approved or finalized. See Slide 3 entitled "Disclaimer Regarding Potential Separation" for additional factors to consider in evaluating and reviewing the information presented on this slide. (3) Represents the midpoint of Guidance provided May 7, 2024. 2024 Consolidated Guidance Midpoint Consumer Audio Separation Adjustments Additional Separation Adjustments Professional Healthcare (RemainCo) Gross Margin Research & Development Expenses Selling, General & Administrative Expenses Long-Term Goal Preliminary Estimate: Financial Impact of a Potential Separation (3) Margin Improvement Initiatives 520 bp to 680 bps 15.0% 600 bps 220 - 380 bps 350 bps 70 - 130 bps 100 - 200 bps 23.2% to 24.8% 30% (2) Engineering initiatives to reduce product costs. Manufacturing initiatives (including transition to Malaysia). Leveraging installed base. Increasing productivity and reducing R&D expenses to ~8% of revenue. Improving profitability by country and sales territory. Increasing revenue per sales rep. Increasing productivity and leveraging corporate and administrative costs. Adjustments to remove consumer audio revenue of $740 million and non-GAAP operating profit of $29 million (or ~4% of revenue). Adjustments to remove consumer health revenue, cost of goods sold and certain operating expenses ($28 to $51 million of improvement to non- GAAP operating profit). Represents long-term goal of 30% non-GAAP operating margins for the professional healthcare business.


9 Professional Healthcare


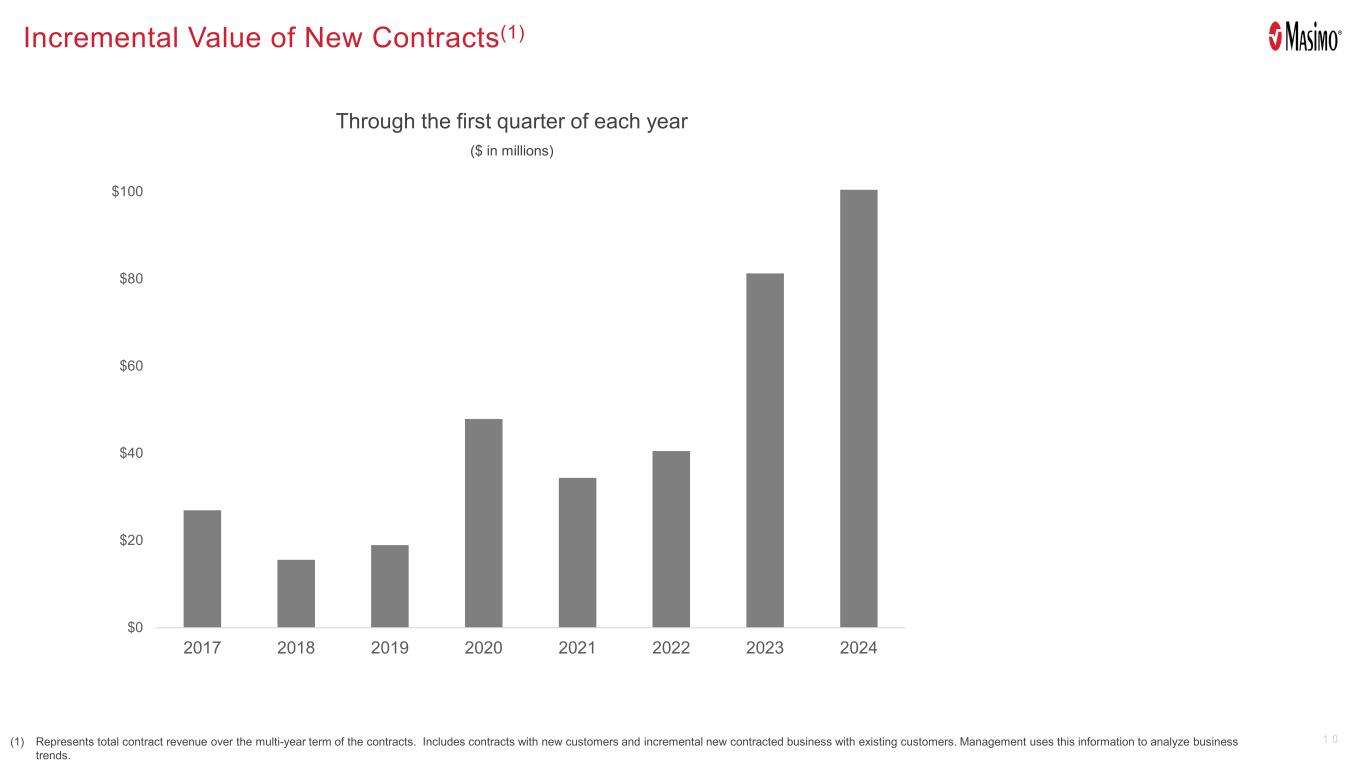
1 0 $0 $20 $40 $60 $80 $100 2017 2018 2019 2020 2021 2022 2023 2024 (1) Represents total contract revenue over the multi-year term of the contracts. Includes contracts with new customers and incremental new contracted business with existing customers. Management uses this information to analyze business trends. Incremental Value of New Contracts(1) Through the first quarter of each year ($ in millions)


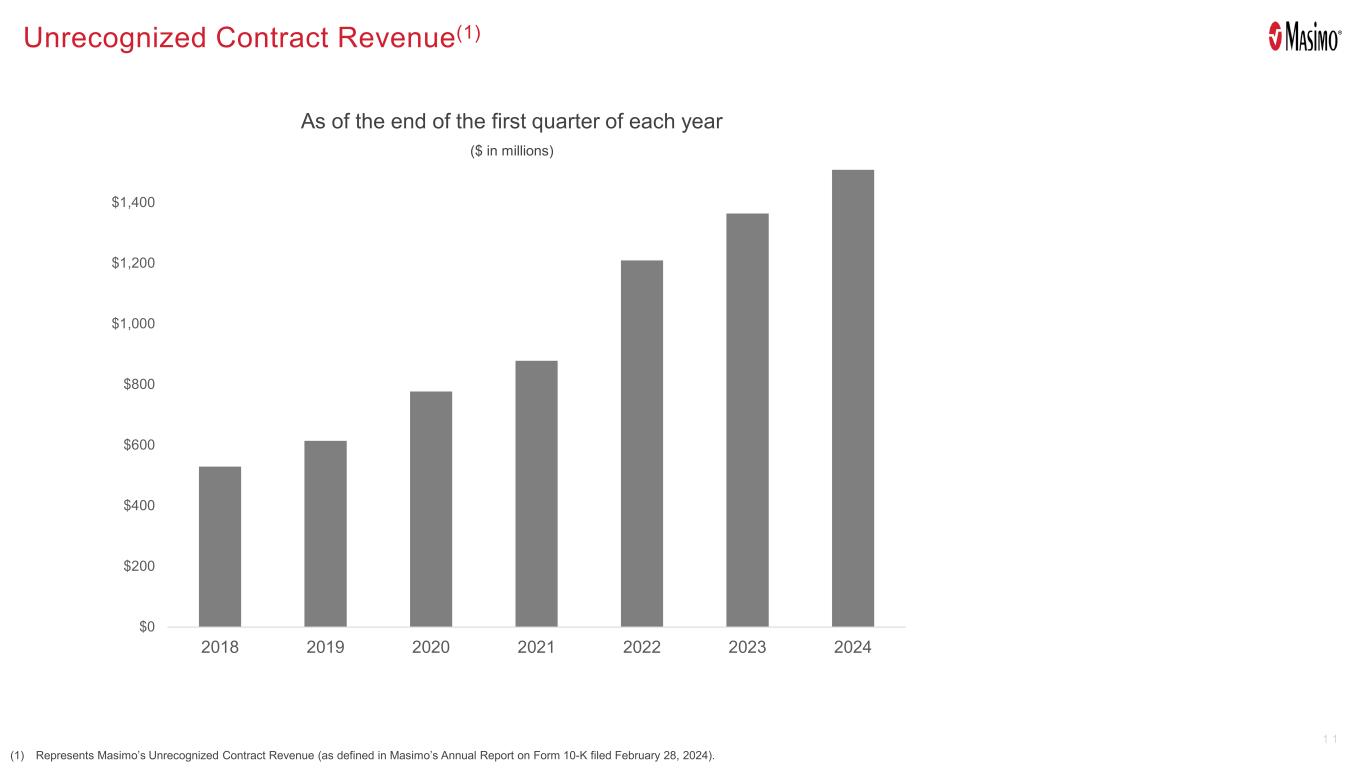
1 1 $0 $200 $400 $600 $800 $1,000 $1,200 $1,400 2018 2019 2020 2021 2022 2023 2024 (1) Represents Masimo’s Unrecognized Contract Revenue (as defined in Masimo’s Annual Report on Form 10-K filed February 28, 2024). Unrecognized Contract Revenue(1) As of the end of the first quarter of each year ($ in millions)


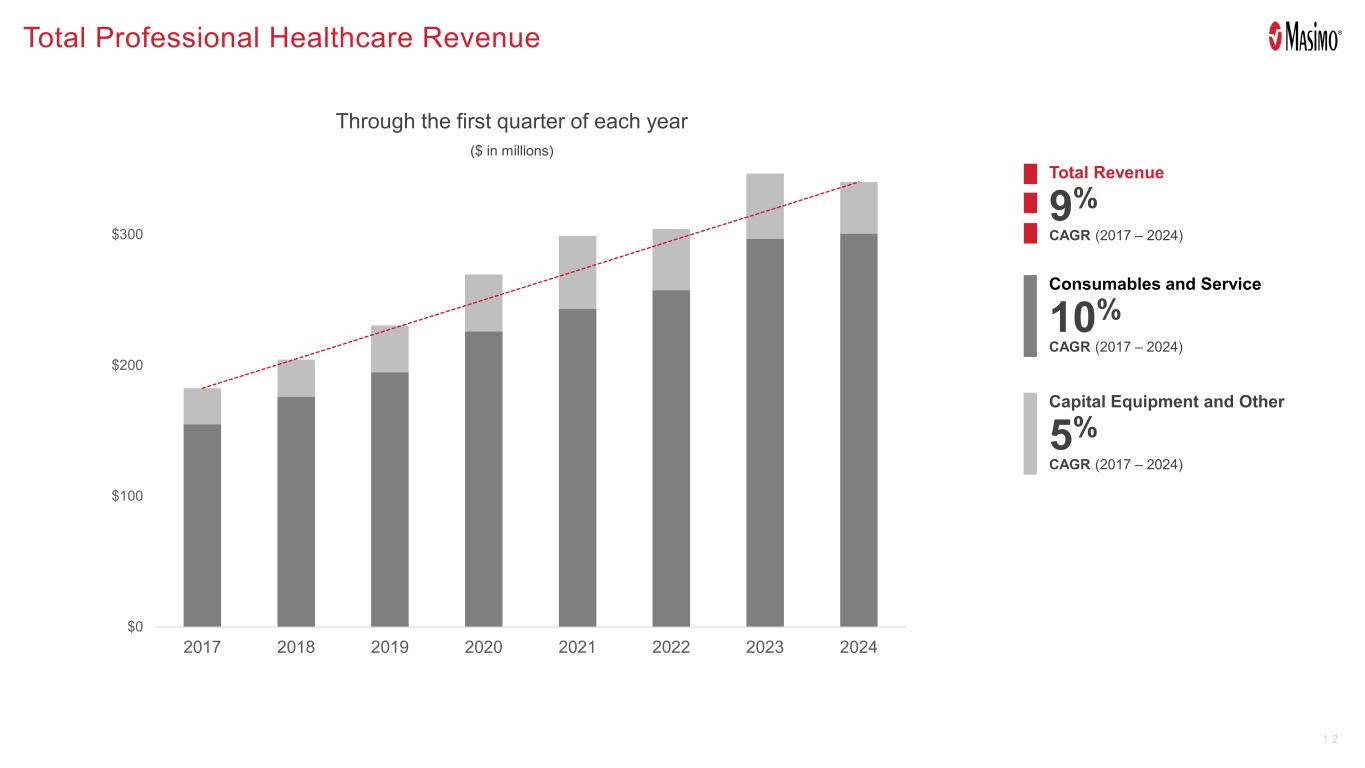
1 2 $0 $100 $200 $300 2017 2018 2019 2020 2021 2022 2023 2024 Total Professional Healthcare Revenue 9% CAGR (2017 – 2024) Total Revenue 10% CAGR (2017 – 2024) Consumables and Service 5% CAGR (2017 – 2024) Capital Equipment and Other Through the first quarter of each year ($ in millions)


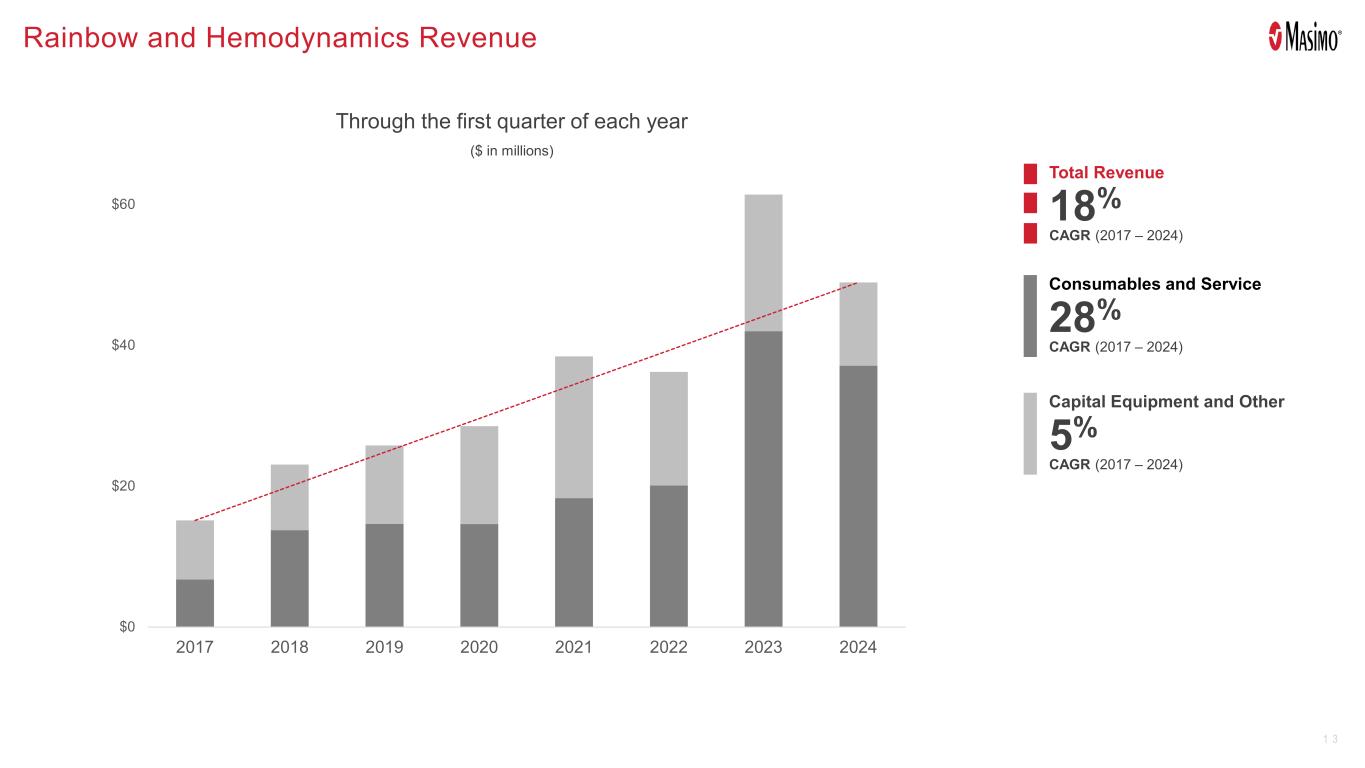
1 3 $0 $20 $40 $60 2017 2018 2019 2020 2021 2022 2023 2024 Rainbow and Hemodynamics Revenue 18% CAGR (2017 – 2024) Total Revenue 28% CAGR (2017 – 2024) Consumables and Service 5% CAGR (2017 – 2024) Capital Equipment and Other Through the first quarter of each year ($ in millions)


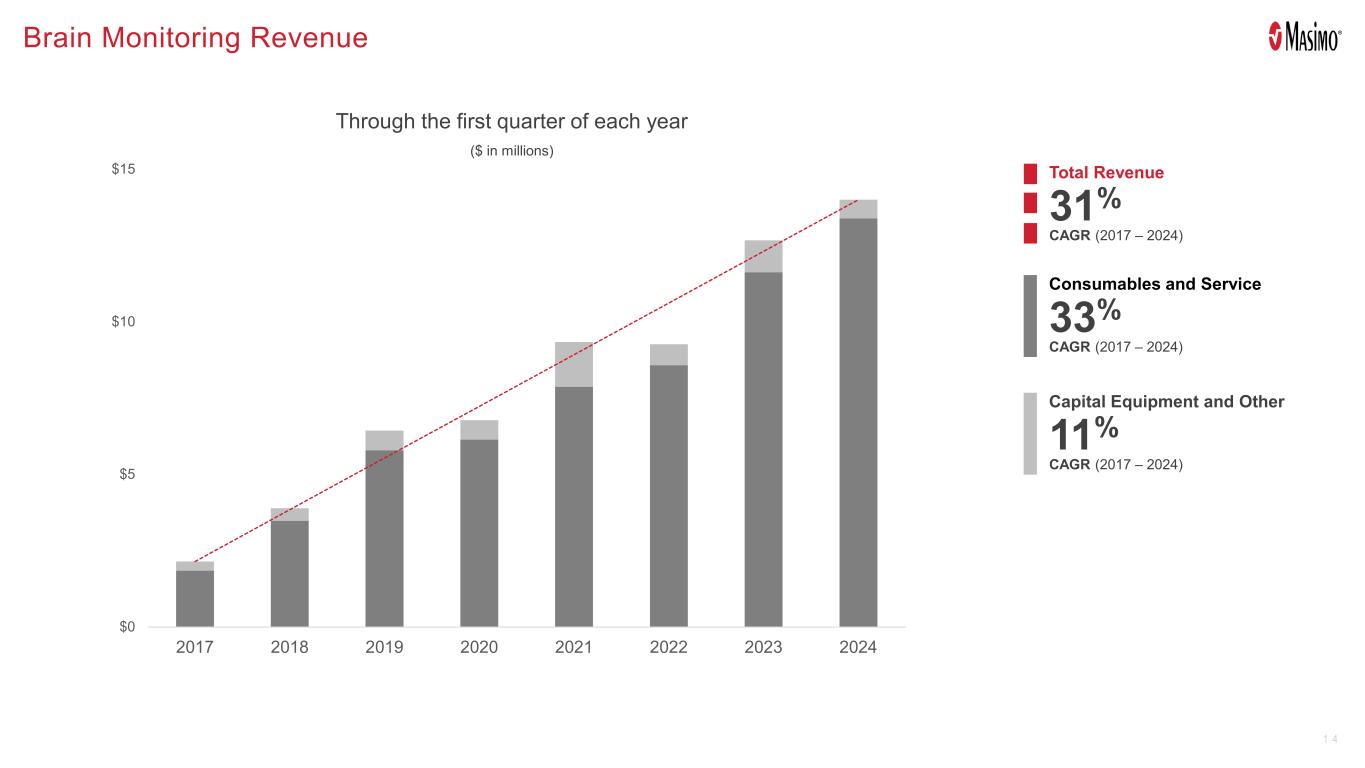
1 4 $0 $5 $10 $15 2017 2018 2019 2020 2021 2022 2023 2024 Brain Monitoring Revenue 31% CAGR (2017 – 2024) Total Revenue 33% CAGR (2017 – 2024) Consumables and Service 11% CAGR (2017 – 2024) Capital Equipment and Other Through the first quarter of each year ($ in millions)


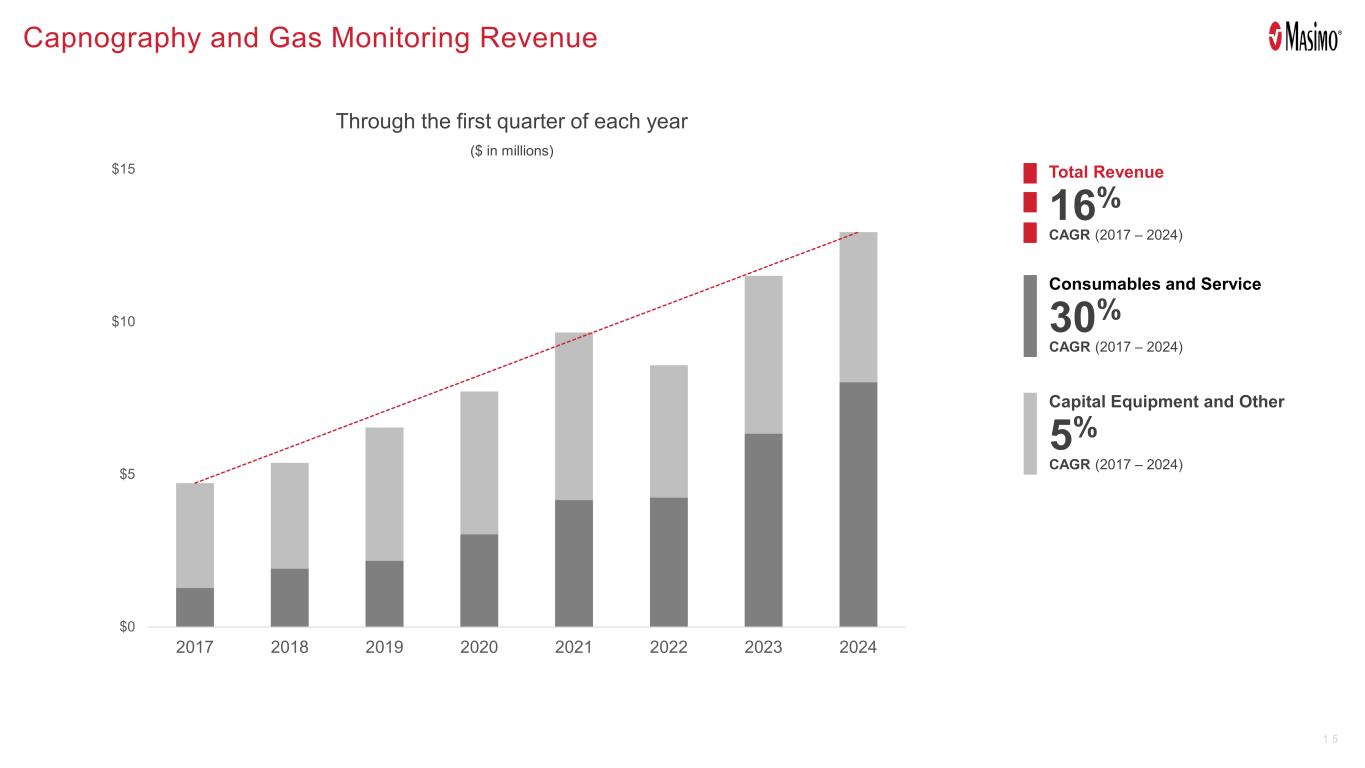
1 5 $0 $5 $10 $15 2017 2018 2019 2020 2021 2022 2023 2024 Capnography and Gas Monitoring Revenue 16% CAGR (2017 – 2024) Total Revenue 30% CAGR (2017 – 2024) Consumables and Service 5% CAGR (2017 – 2024) Capital Equipment and Other Through the first quarter of each year ($ in millions)


1 6 Consumer Audio


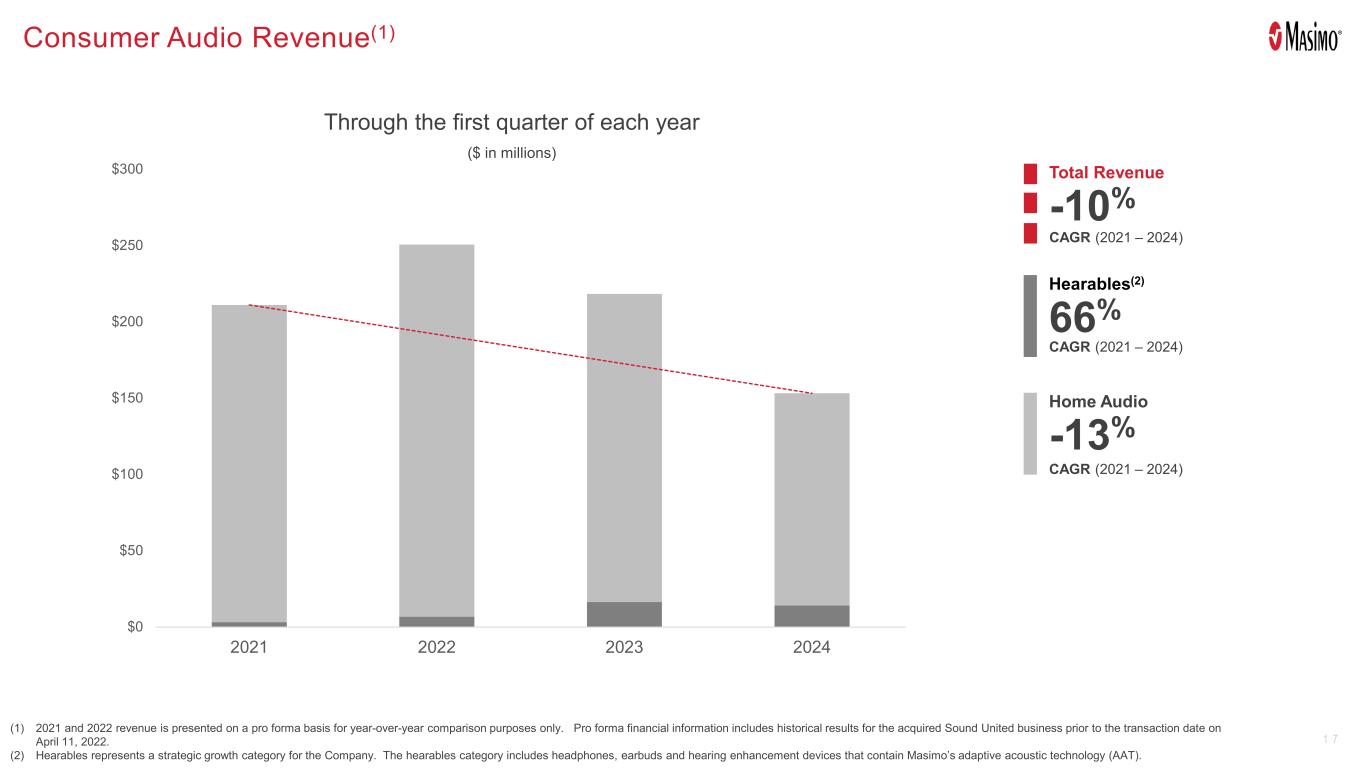
1 7 $0 $50 $100 $150 $200 $250 $300 2021 2022 2023 2024 Consumer Audio Revenue(1) -10% CAGR (2021 – 2024) Total Revenue CAGR (2021 – 2024) Hearables(2) -13% CAGR (2021 – 2024) Home Audio (1) 2021 and 2022 revenue is presented on a pro forma basis for year-over-year comparison purposes only. Pro forma financial information includes historical results for the acquired Sound United business prior to the transaction date on April 11, 2022. (2) Hearables represents a strategic growth category for the Company. The hearables category includes headphones, earbuds and hearing enhancement devices that contain Masimo’s adaptive acoustic technology (AAT). 66% Through the first quarter of each year ($ in millions)


1 8 Hearables and Wearables


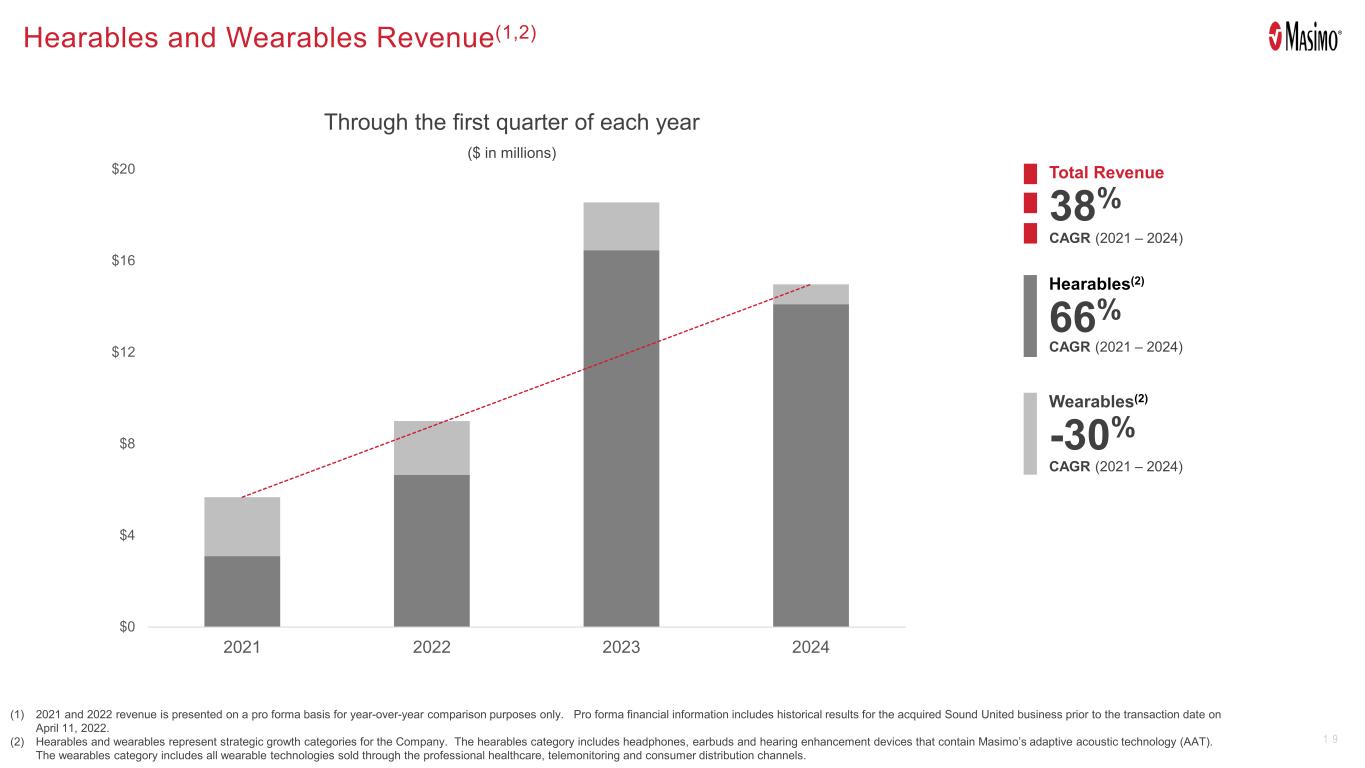
1 9 $0 $4 $8 $12 $16 $20 2021 2022 2023 2024 Hearables and Wearables Revenue(1,2) 38% CAGR (2021 – 2024) Total Revenue 66% CAGR (2021 – 2024) Hearables(2) -30% CAGR (2021 – 2024) Wearables(2) (1) 2021 and 2022 revenue is presented on a pro forma basis for year-over-year comparison purposes only. Pro forma financial information includes historical results for the acquired Sound United business prior to the transaction date on April 11, 2022. (2) Hearables and wearables represent strategic growth categories for the Company. The hearables category includes headphones, earbuds and hearing enhancement devices that contain Masimo’s adaptive acoustic technology (AAT). The wearables category includes all wearable technologies sold through the professional healthcare, telemonitoring and consumer distribution channels. Through the first quarter of each year ($ in millions)


2 0 Appendix GAAP to Non-GAAP Reconciliations


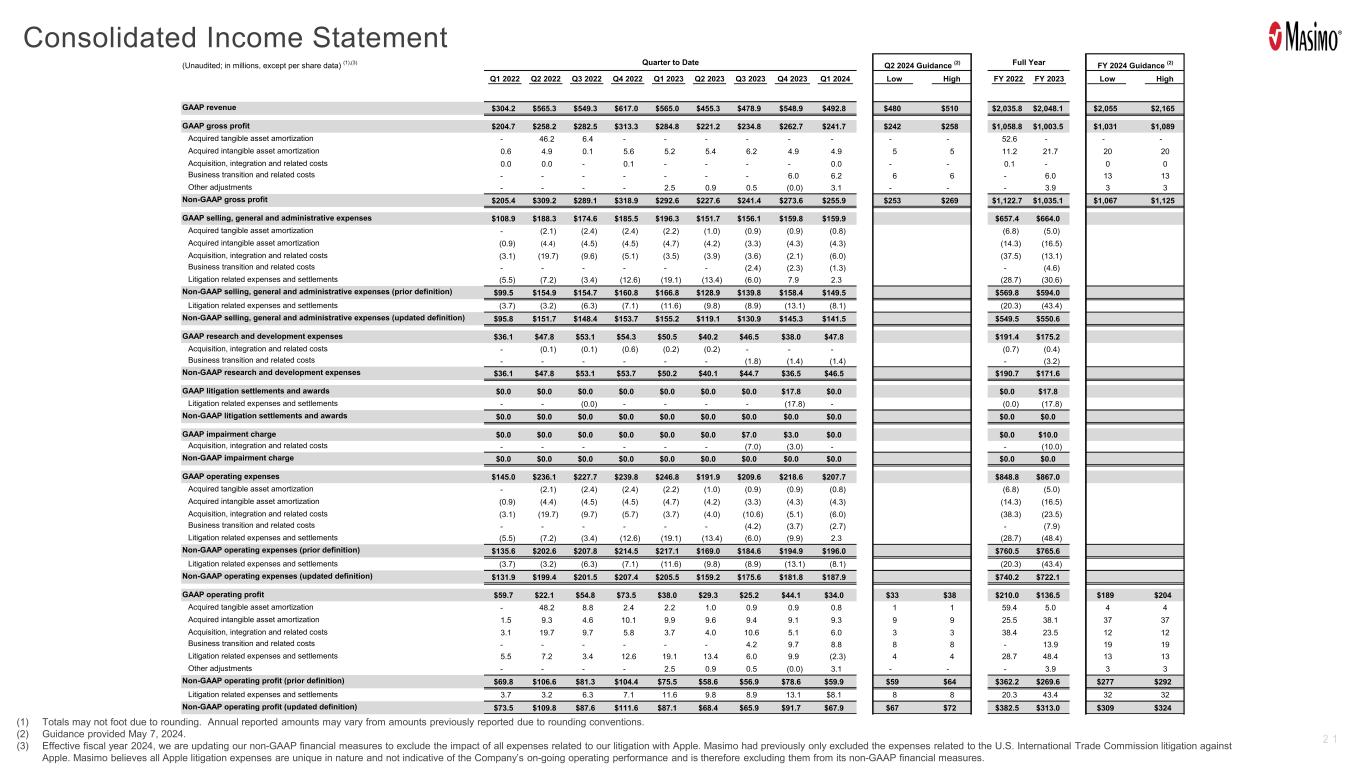
2 1 Consolidated Income Statement (1) Totals may not foot due to rounding. Annual reported amounts may vary from amounts previously reported due to rounding conventions. (2) Guidance provided May 7, 2024. (3) Effective fiscal year 2024, we are updating our non-GAAP financial measures to exclude the impact of all expenses related to our litigation with Apple. Masimo had previously only excluded the expenses related to the U.S. International Trade Commission litigation against Apple. Masimo believes all Apple litigation expenses are unique in nature and not indicative of the Company’s on-going operating performance and is therefore excluding them from its non-GAAP financial measures. (Unaudited; in millions, except per share data) (1),(3) Quarter to Date Q2 2024 Guidance (2) Full Year FY 2024 Guidance (2) Q1 2022 Q2 2022 Q3 2022 Q4 2022 Q1 2023 Q2 2023 Q3 2023 Q4 2023 Q1 2024 Low High FY 2022 FY 2023 Low High GAAP revenue $304.2 $565.3 $549.3 $617.0 $565.0 $455.3 $478.9 $548.9 $492.8 $480 $510 $2,035.8 $2,048.1 $2,055 $2,165 GAAP gross profit $204.7 $258.2 $282.5 $313.3 $284.8 $221.2 $234.8 $262.7 $241.7 $242 $258 $1,058.8 $1,003.5 $1,031 $1,089 Acquired tangible asset amortization - 46.2 6.4 - - - - - - - - 52.6 - - - Acquired intangible asset amortization 0.6 4.9 0.1 5.6 5.2 5.4 6.2 4.9 4.9 5 5 11.2 21.7 20 20 Acquisition, integration and related costs 0.0 0.0 - 0.1 - - - - 0.0 - - 0.1 - 0 0 Business transition and related costs - - - - - - - 6.0 6.2 6 6 - 6.0 13 13 Other adjustments - - - - 2.5 0.9 0.5 (0.0) 3.1 - - - 3.9 3 3 Non-GAAP gross profit $205.4 $309.2 $289.1 $318.9 $292.6 $227.6 $241.4 $273.6 $255.9 $253 $269 $1,122.7 $1,035.1 $1,067 $1,125 GAAP selling, general and administrative expenses $108.9 $188.3 $174.6 $185.5 $196.3 $151.7 $156.1 $159.8 $159.9 $657.4 $664.0 Acquired tangible asset amortization - (2.1) (2.4) (2.4) (2.2) (1.0) (0.9) (0.9) (0.8) (6.8) (5.0) Acquired intangible asset amortization (0.9) (4.4) (4.5) (4.5) (4.7) (4.2) (3.3) (4.3) (4.3) (14.3) (16.5) Acquisition, integration and related costs (3.1) (19.7) (9.6) (5.1) (3.5) (3.9) (3.6) (2.1) (6.0) (37.5) (13.1) Business transition and related costs - - - - - - (2.4) (2.3) (1.3) - (4.6) Litigation related expenses and settlements (5.5) (7.2) (3.4) (12.6) (19.1) (13.4) (6.0) 7.9 2.3 (28.7) (30.6) Non-GAAP selling, general and administrative expenses (prior definition) $99.5 $154.9 $154.7 $160.8 $166.8 $128.9 $139.8 $158.4 $149.5 $569.8 $594.0 Litigation related expenses and settlements (3.7) (3.2) (6.3) (7.1) (11.6) (9.8) (8.9) (13.1) (8.1) (20.3) (43.4) Non-GAAP selling, general and administrative expenses (updated definition) $95.8 $151.7 $148.4 $153.7 $155.2 $119.1 $130.9 $145.3 $141.5 $549.5 $550.6 GAAP research and development expenses $36.1 $47.8 $53.1 $54.3 $50.5 $40.2 $46.5 $38.0 $47.8 $191.4 $175.2 Acquisition, integration and related costs - (0.1) (0.1) (0.6) (0.2) (0.2) - - - (0.7) (0.4) Business transition and related costs - - - - - - (1.8) (1.4) (1.4) - (3.2) Non-GAAP research and development expenses $36.1 $47.8 $53.1 $53.7 $50.2 $40.1 $44.7 $36.5 $46.5 $190.7 $171.6 GAAP litigation settlements and awards $0.0 $0.0 $0.0 $0.0 $0.0 $0.0 $0.0 $17.8 $0.0 $0.0 $17.8 Litigation related expenses and settlements - - (0.0) - - - - (17.8) - (0.0) (17.8) Non-GAAP litigation settlements and awards $0.0 $0.0 $0.0 $0.0 $0.0 $0.0 $0.0 $0.0 $0.0 $0.0 $0.0 GAAP impairment charge $0.0 $0.0 $0.0 $0.0 $0.0 $0.0 $7.0 $3.0 $0.0 $0.0 $10.0 Acquisition, integration and related costs - - - - - - (7.0) (3.0) - - (10.0) Non-GAAP impairment charge $0.0 $0.0 $0.0 $0.0 $0.0 $0.0 $0.0 $0.0 $0.0 $0.0 $0.0 GAAP operating expenses $145.0 $236.1 $227.7 $239.8 $246.8 $191.9 $209.6 $218.6 $207.7 $848.8 $867.0 Acquired tangible asset amortization - (2.1) (2.4) (2.4) (2.2) (1.0) (0.9) (0.9) (0.8) (6.8) (5.0) Acquired intangible asset amortization (0.9) (4.4) (4.5) (4.5) (4.7) (4.2) (3.3) (4.3) (4.3) (14.3) (16.5) Acquisition, integration and related costs (3.1) (19.7) (9.7) (5.7) (3.7) (4.0) (10.6) (5.1) (6.0) (38.3) (23.5) Business transition and related costs - - - - - - (4.2) (3.7) (2.7) - (7.9) Litigation related expenses and settlements (5.5) (7.2) (3.4) (12.6) (19.1) (13.4) (6.0) (9.9) 2.3 (28.7) (48.4) Non-GAAP operating expenses (prior definition) $135.6 $202.6 $207.8 $214.5 $217.1 $169.0 $184.6 $194.9 $196.0 $760.5 $765.6 Litigation related expenses and settlements (3.7) (3.2) (6.3) (7.1) (11.6) (9.8) (8.9) (13.1) (8.1) (20.3) (43.4) Non-GAAP operating expenses (updated definition) $131.9 $199.4 $201.5 $207.4 $205.5 $159.2 $175.6 $181.8 $187.9 $740.2 $722.1 GAAP operating profit $59.7 $22.1 $54.8 $73.5 $38.0 $29.3 $25.2 $44.1 $34.0 $33 $38 $210.0 $136.5 $189 $204 Acquired tangible asset amortization - 48.2 8.8 2.4 2.2 1.0 0.9 0.9 0.8 1 1 59.4 5.0 4 4 Acquired intangible asset amortization 1.5 9.3 4.6 10.1 9.9 9.6 9.4 9.1 9.3 9 9 25.5 38.1 37 37 Acquisition, integration and related costs 3.1 19.7 9.7 5.8 3.7 4.0 10.6 5.1 6.0 3 3 38.4 23.5 12 12 Business transition and related costs - - - - - - 4.2 9.7 8.8 8 8 - 13.9 19 19 Litigation related expenses and settlements 5.5 7.2 3.4 12.6 19.1 13.4 6.0 9.9 (2.3) 4 4 28.7 48.4 13 13 Other adjustments - - - - 2.5 0.9 0.5 (0.0) 3.1 - - - 3.9 3 3 Non-GAAP operating profit (prior definition) $69.8 $106.6 $81.3 $104.4 $75.5 $58.6 $56.9 $78.6 $59.9 $59 $64 $362.2 $269.6 $277 $292 Litigation related expenses and settlements 3.7 3.2 6.3 7.1 11.6 9.8 8.9 13.1 $8.1 8 8 20.3 43.4 32 32 Non-GAAP operating profit (updated definition) $73.5 $109.8 $87.6 $111.6 $87.1 $68.4 $65.9 $91.7 $67.9 $67 $72 $382.5 $313.0 $309 $324


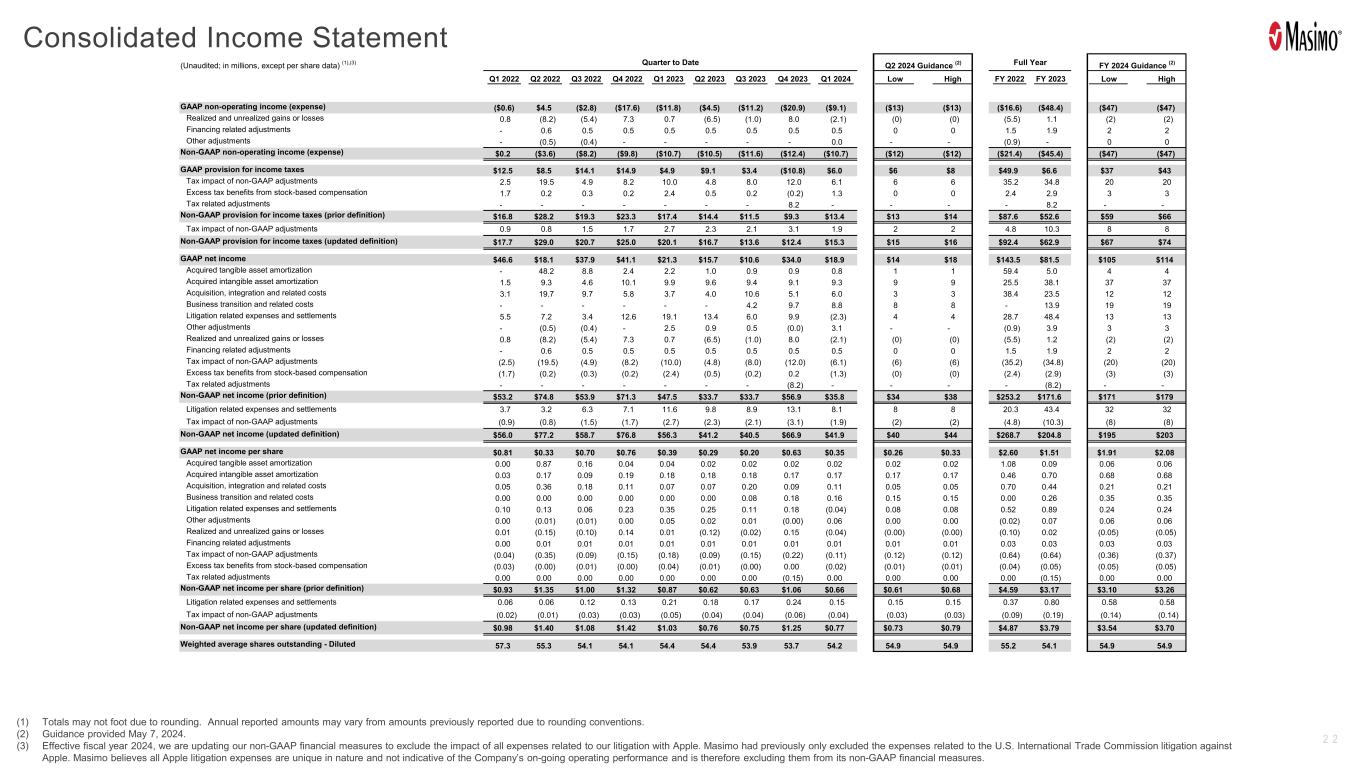
2 2 Consolidated Income Statement (1) Totals may not foot due to rounding. Annual reported amounts may vary from amounts previously reported due to rounding conventions. (2) Guidance provided May 7, 2024. (3) Effective fiscal year 2024, we are updating our non-GAAP financial measures to exclude the impact of all expenses related to our litigation with Apple. Masimo had previously only excluded the expenses related to the U.S. International Trade Commission litigation against Apple. Masimo believes all Apple litigation expenses are unique in nature and not indicative of the Company’s on-going operating performance and is therefore excluding them from its non-GAAP financial measures. (Unaudited; in millions, except per share data) (1),(3) Quarter to Date Q2 2024 Guidance (2) Full Year FY 2024 Guidance (2) Q1 2022 Q2 2022 Q3 2022 Q4 2022 Q1 2023 Q2 2023 Q3 2023 Q4 2023 Q1 2024 Low High FY 2022 FY 2023 Low High GAAP non-operating income (expense) ($0.6) $4.5 ($2.8) ($17.6) ($11.8) ($4.5) ($11.2) ($20.9) ($9.1) ($13) ($13) ($16.6) ($48.4) ($47) ($47) Realized and unrealized gains or losses 0.8 (8.2) (5.4) 7.3 0.7 (6.5) (1.0) 8.0 (2.1) (0) (0) (5.5) 1.1 (2) (2) Financing related adjustments - 0.6 0.5 0.5 0.5 0.5 0.5 0.5 0.5 0 0 1.5 1.9 2 2 Other adjustments - (0.5) (0.4) - - - - - 0.0 - - (0.9) - 0 0 Non-GAAP non-operating income (expense) $0.2 ($3.6) ($8.2) ($9.8) ($10.7) ($10.5) ($11.6) ($12.4) ($10.7) ($12) ($12) ($21.4) ($45.4) ($47) ($47) GAAP provision for income taxes $12.5 $8.5 $14.1 $14.9 $4.9 $9.1 $3.4 ($10.8) $6.0 $6 $8 $49.9 $6.6 $37 $43 Tax impact of non-GAAP adjustments 2.5 19.5 4.9 8.2 10.0 4.8 8.0 12.0 6.1 6 6 35.2 34.8 20 20 Excess tax benefits from stock-based compensation 1.7 0.2 0.3 0.2 2.4 0.5 0.2 (0.2) 1.3 0 0 2.4 2.9 3 3 Tax related adjustments - - - - - - - 8.2 - - - - 8.2 - - Non-GAAP provision for income taxes (prior definition) $16.8 $28.2 $19.3 $23.3 $17.4 $14.4 $11.5 $9.3 $13.4 $13 $14 $87.6 $52.6 $59 $66 Tax impact of non-GAAP adjustments 0.9 0.8 1.5 1.7 2.7 2.3 2.1 3.1 1.9 2 2 4.8 10.3 8 8 Non-GAAP provision for income taxes (updated definition) $17.7 $29.0 $20.7 $25.0 $20.1 $16.7 $13.6 $12.4 $15.3 $15 $16 $92.4 $62.9 $67 $74 GAAP net income $46.6 $18.1 $37.9 $41.1 $21.3 $15.7 $10.6 $34.0 $18.9 $14 $18 $143.5 $81.5 $105 $114 Acquired tangible asset amortization - 48.2 8.8 2.4 2.2 1.0 0.9 0.9 0.8 1 1 59.4 5.0 4 4 Acquired intangible asset amortization 1.5 9.3 4.6 10.1 9.9 9.6 9.4 9.1 9.3 9 9 25.5 38.1 37 37 Acquisition, integration and related costs 3.1 19.7 9.7 5.8 3.7 4.0 10.6 5.1 6.0 3 3 38.4 23.5 12 12 Business transition and related costs - - - - - - 4.2 9.7 8.8 8 8 - 13.9 19 19 Litigation related expenses and settlements 5.5 7.2 3.4 12.6 19.1 13.4 6.0 9.9 (2.3) 4 4 28.7 48.4 13 13 Other adjustments - (0.5) (0.4) - 2.5 0.9 0.5 (0.0) 3.1 - - (0.9) 3.9 3 3 Realized and unrealized gains or losses 0.8 (8.2) (5.4) 7.3 0.7 (6.5) (1.0) 8.0 (2.1) (0) (0) (5.5) 1.2 (2) (2) Financing related adjustments - 0.6 0.5 0.5 0.5 0.5 0.5 0.5 0.5 0 0 1.5 1.9 2 2 Tax impact of non-GAAP adjustments (2.5) (19.5) (4.9) (8.2) (10.0) (4.8) (8.0) (12.0) (6.1) (6) (6) (35.2) (34.8) (20) (20) Excess tax benefits from stock-based compensation (1.7) (0.2) (0.3) (0.2) (2.4) (0.5) (0.2) 0.2 (1.3) (0) (0) (2.4) (2.9) (3) (3) Tax related adjustments - - - - - - - (8.2) - - - - (8.2) - - Non-GAAP net income (prior definition) $53.2 $74.8 $53.9 $71.3 $47.5 $33.7 $33.7 $56.9 $35.8 $34 $38 $253.2 $171.6 $171 $179 Litigation related expenses and settlements 3.7 3.2 6.3 7.1 11.6 9.8 8.9 13.1 8.1 8 8 20.3 43.4 32 32 Tax impact of non-GAAP adjustments (0.9) (0.8) (1.5) (1.7) (2.7) (2.3) (2.1) (3.1) (1.9) (2) (2) (4.8) (10.3) (8) (8) Non-GAAP net income (updated definition) $56.0 $77.2 $58.7 $76.8 $56.3 $41.2 $40.5 $66.9 $41.9 $40 $44 $268.7 $204.8 $195 $203 GAAP net income per share $0.81 $0.33 $0.70 $0.76 $0.39 $0.29 $0.20 $0.63 $0.35 $0.26 $0.33 $2.60 $1.51 $1.91 $2.08 Acquired tangible asset amortization 0.00 0.87 0.16 0.04 0.04 0.02 0.02 0.02 0.02 0.02 0.02 1.08 0.09 0.06 0.06 Acquired intangible asset amortization 0.03 0.17 0.09 0.19 0.18 0.18 0.18 0.17 0.17 0.17 0.17 0.46 0.70 0.68 0.68 Acquisition, integration and related costs 0.05 0.36 0.18 0.11 0.07 0.07 0.20 0.09 0.11 0.05 0.05 0.70 0.44 0.21 0.21 Business transition and related costs 0.00 0.00 0.00 0.00 0.00 0.00 0.08 0.18 0.16 0.15 0.15 0.00 0.26 0.35 0.35 Litigation related expenses and settlements 0.10 0.13 0.06 0.23 0.35 0.25 0.11 0.18 (0.04) 0.08 0.08 0.52 0.89 0.24 0.24 Other adjustments 0.00 (0.01) (0.01) 0.00 0.05 0.02 0.01 (0.00) 0.06 0.00 0.00 (0.02) 0.07 0.06 0.06 Realized and unrealized gains or losses 0.01 (0.15) (0.10) 0.14 0.01 (0.12) (0.02) 0.15 (0.04) (0.00) (0.00) (0.10) 0.02 (0.05) (0.05) Financing related adjustments 0.00 0.01 0.01 0.01 0.01 0.01 0.01 0.01 0.01 0.01 0.01 0.03 0.03 0.03 0.03 Tax impact of non-GAAP adjustments (0.04) (0.35) (0.09) (0.15) (0.18) (0.09) (0.15) (0.22) (0.11) (0.12) (0.12) (0.64) (0.64) (0.36) (0.37) Excess tax benefits from stock-based compensation (0.03) (0.00) (0.01) (0.00) (0.04) (0.01) (0.00) 0.00 (0.02) (0.01) (0.01) (0.04) (0.05) (0.05) (0.05) Tax related adjustments 0.00 0.00 0.00 0.00 0.00 0.00 0.00 (0.15) 0.00 0.00 0.00 0.00 (0.15) 0.00 0.00 Non-GAAP net income per share (prior definition) $0.93 $1.35 $1.00 $1.32 $0.87 $0.62 $0.63 $1.06 $0.66 $0.61 $0.68 $4.59 $3.17 $3.10 $3.26 Litigation related expenses and settlements 0.06 0.06 0.12 0.13 0.21 0.18 0.17 0.24 0.15 0.15 0.15 0.37 0.80 0.58 0.58 Tax impact of non-GAAP adjustments (0.02) (0.01) (0.03) (0.03) (0.05) (0.04) (0.04) (0.06) (0.04) (0.03) (0.03) (0.09) (0.19) (0.14) (0.14) Non-GAAP net income per share (updated definition) $0.98 $1.40 $1.08 $1.42 $1.03 $0.76 $0.75 $1.25 $0.77 $0.73 $0.79 $4.87 $3.79 $3.54 $3.70 Weighted average shares outstanding - Diluted 57.3 55.3 54.1 54.1 54.4 54.4 53.9 53.7 54.2 54.9 54.9 55.2 54.1 54.9 54.9


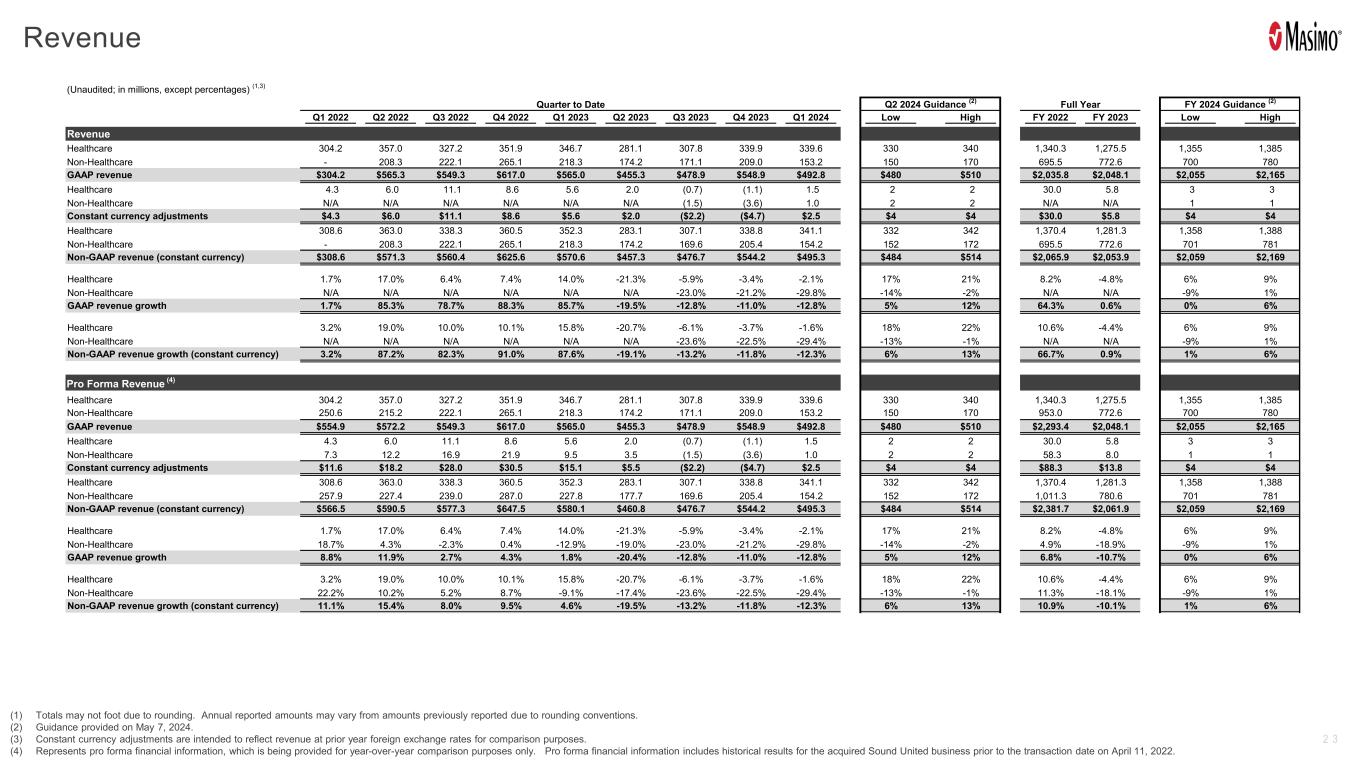
2 3 Revenue (1) Totals may not foot due to rounding. Annual reported amounts may vary from amounts previously reported due to rounding conventions. (2) Guidance provided on May 7, 2024. (3) Constant currency adjustments are intended to reflect revenue at prior year foreign exchange rates for comparison purposes. (4) Represents pro forma financial information, which is being provided for year-over-year comparison purposes only. Pro forma financial information includes historical results for the acquired Sound United business prior to the transaction date on April 11, 2022. (Unaudited; in millions, except percentages) (1,3) Quarter to Date Q2 2024 Guidance (2) Full Year FY 2024 Guidance (2) Q1 2022 Q2 2022 Q3 2022 Q4 2022 Q1 2023 Q2 2023 Q3 2023 Q4 2023 Q1 2024 Low High FY 2022 FY 2023 Low High Revenue Healthcare 304.2 357.0 327.2 351.9 346.7 281.1 307.8 339.9 339.6 330 340 1,340.3 1,275.5 1,355 1,385 Non-Healthcare - 208.3 222.1 265.1 218.3 174.2 171.1 209.0 153.2 150 170 695.5 772.6 700 780 GAAP revenue $304.2 $565.3 $549.3 $617.0 $565.0 $455.3 $478.9 $548.9 $492.8 $480 $510 $2,035.8 $2,048.1 $2,055 $2,165 Healthcare 4.3 6.0 11.1 8.6 5.6 2.0 (0.7) (1.1) 1.5 2 2 30.0 5.8 3 3 Non-Healthcare N/A N/A N/A N/A N/A N/A (1.5) (3.6) 1.0 2 2 N/A N/A 1 1 Constant currency adjustments $4.3 $6.0 $11.1 $8.6 $5.6 $2.0 ($2.2) ($4.7) $2.5 $4 $4 $30.0 $5.8 $4 $4 Healthcare 308.6 363.0 338.3 360.5 352.3 283.1 307.1 338.8 341.1 332 342 1,370.4 1,281.3 1,358 1,388 Non-Healthcare - 208.3 222.1 265.1 218.3 174.2 169.6 205.4 154.2 152 172 695.5 772.6 701 781 Non-GAAP revenue (constant currency) $308.6 $571.3 $560.4 $625.6 $570.6 $457.3 $476.7 $544.2 $495.3 $484 $514 $2,065.9 $2,053.9 $2,059 $2,169 Healthcare 1.7% 17.0% 6.4% 7.4% 14.0% -21.3% -5.9% -3.4% -2.1% 17% 21% 8.2% -4.8% 6% 9% Non-Healthcare N/A N/A N/A N/A N/A N/A -23.0% -21.2% -29.8% -14% -2% N/A N/A -9% 1% GAAP revenue growth 1.7% 85.3% 78.7% 88.3% 85.7% -19.5% -12.8% -11.0% -12.8% 5% 12% 64.3% 0.6% 0% 6% Healthcare 3.2% 19.0% 10.0% 10.1% 15.8% -20.7% -6.1% -3.7% -1.6% 18% 22% 10.6% -4.4% 6% 9% Non-Healthcare N/A N/A N/A N/A N/A N/A -23.6% -22.5% -29.4% -13% -1% N/A N/A -9% 1% Non-GAAP revenue growth (constant currency) 3.2% 87.2% 82.3% 91.0% 87.6% -19.1% -13.2% -11.8% -12.3% 6% 13% 66.7% 0.9% 1% 6% Pro Forma Revenue (4) Healthcare 304.2 357.0 327.2 351.9 346.7 281.1 307.8 339.9 339.6 330 340 1,340.3 1,275.5 1,355 1,385 Non-Healthcare 250.6 215.2 222.1 265.1 218.3 174.2 171.1 209.0 153.2 150 170 953.0 772.6 700 780 GAAP revenue $554.9 $572.2 $549.3 $617.0 $565.0 $455.3 $478.9 $548.9 $492.8 $480 $510 $2,293.4 $2,048.1 $2,055 $2,165 Healthcare 4.3 6.0 11.1 8.6 5.6 2.0 (0.7) (1.1) 1.5 2 2 30.0 5.8 3 3 Non-Healthcare 7.3 12.2 16.9 21.9 9.5 3.5 (1.5) (3.6) 1.0 2 2 58.3 8.0 1 1 Constant currency adjustments $11.6 $18.2 $28.0 $30.5 $15.1 $5.5 ($2.2) ($4.7) $2.5 $4 $4 $88.3 $13.8 $4 $4 Healthcare 308.6 363.0 338.3 360.5 352.3 283.1 307.1 338.8 341.1 332 342 1,370.4 1,281.3 1,358 1,388 Non-Healthcare 257.9 227.4 239.0 287.0 227.8 177.7 169.6 205.4 154.2 152 172 1,011.3 780.6 701 781 Non-GAAP revenue (constant currency) $566.5 $590.5 $577.3 $647.5 $580.1 $460.8 $476.7 $544.2 $495.3 $484 $514 $2,381.7 $2,061.9 $2,059 $2,169 Healthcare 1.7% 17.0% 6.4% 7.4% 14.0% -21.3% -5.9% -3.4% -2.1% 17% 21% 8.2% -4.8% 6% 9% Non-Healthcare 18.7% 4.3% -2.3% 0.4% -12.9% -19.0% -23.0% -21.2% -29.8% -14% -2% 4.9% -18.9% -9% 1% GAAP revenue growth 8.8% 11.9% 2.7% 4.3% 1.8% -20.4% -12.8% -11.0% -12.8% 5% 12% 6.8% -10.7% 0% 6% Healthcare 3.2% 19.0% 10.0% 10.1% 15.8% -20.7% -6.1% -3.7% -1.6% 18% 22% 10.6% -4.4% 6% 9% Non-Healthcare 22.2% 10.2% 5.2% 8.7% -9.1% -17.4% -23.6% -22.5% -29.4% -13% -1% 11.3% -18.1% -9% 1% Non-GAAP revenue growth (constant currency) 11.1% 15.4% 8.0% 9.5% 4.6% -19.5% -13.2% -11.8% -12.3% 6% 13% 10.9% -10.1% 1% 6%


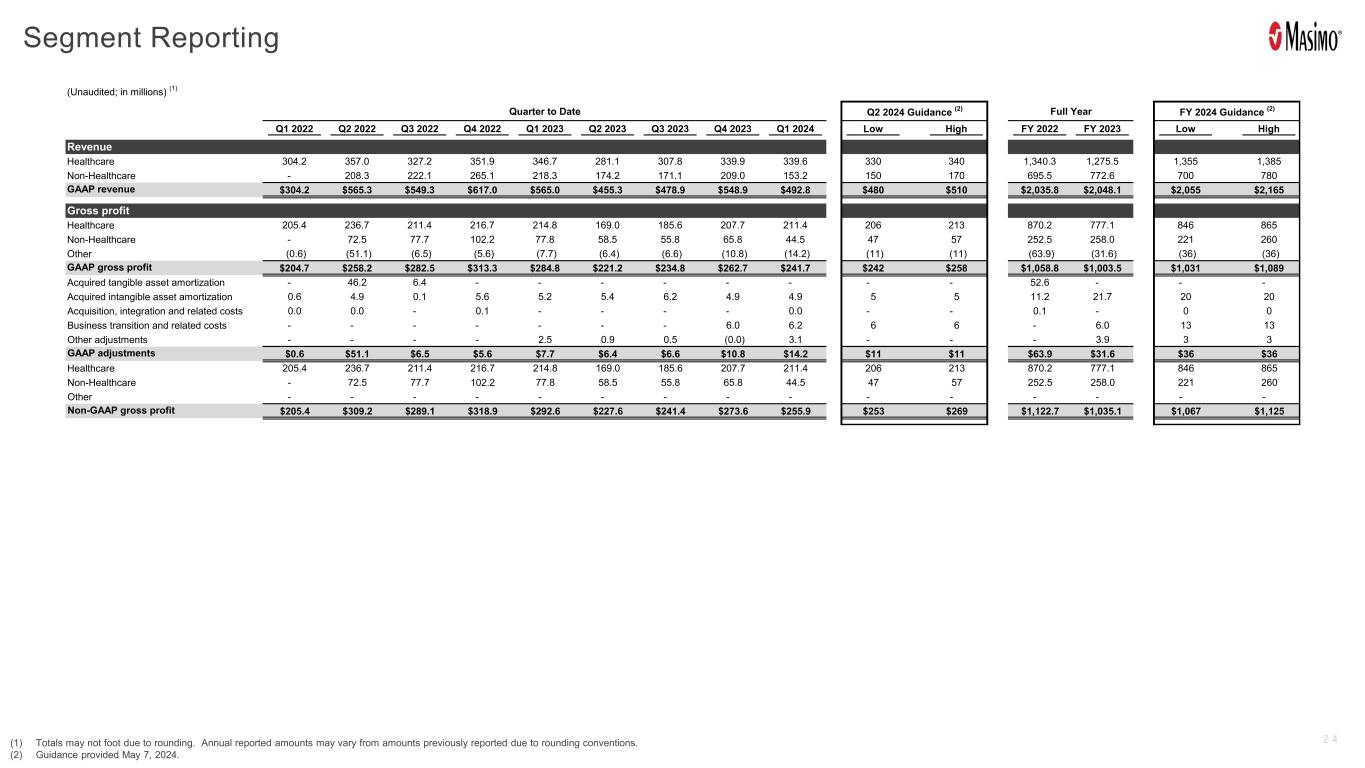
2 4 Segment Reporting (1) Totals may not foot due to rounding. Annual reported amounts may vary from amounts previously reported due to rounding conventions. (2) Guidance provided May 7, 2024. (Unaudited; in millions) (1) Quarter to Date Q2 2024 Guidance (2) Full Year FY 2024 Guidance (2) Q1 2022 Q2 2022 Q3 2022 Q4 2022 Q1 2023 Q2 2023 Q3 2023 Q4 2023 Q1 2024 Low High FY 2022 FY 2023 Low High Revenue Healthcare 304.2 357.0 327.2 351.9 346.7 281.1 307.8 339.9 339.6 330 340 1,340.3 1,275.5 1,355 1,385 Non-Healthcare - 208.3 222.1 265.1 218.3 174.2 171.1 209.0 153.2 150 170 695.5 772.6 700 780 GAAP revenue $304.2 $565.3 $549.3 $617.0 $565.0 $455.3 $478.9 $548.9 $492.8 $480 $510 $2,035.8 $2,048.1 $2,055 $2,165 Gross profit Healthcare 205.4 236.7 211.4 216.7 214.8 169.0 185.6 207.7 211.4 206 213 870.2 777.1 846 865 Non-Healthcare - 72.5 77.7 102.2 77.8 58.5 55.8 65.8 44.5 47 57 252.5 258.0 221 260 Other (0.6) (51.1) (6.5) (5.6) (7.7) (6.4) (6.6) (10.8) (14.2) (11) (11) (63.9) (31.6) (36) (36) GAAP gross profit $204.7 $258.2 $282.5 $313.3 $284.8 $221.2 $234.8 $262.7 $241.7 $242 $258 $1,058.8 $1,003.5 $1,031 $1,089 Acquired tangible asset amortization - 46.2 6.4 - - - - - - - - 52.6 - - - Acquired intangible asset amortization 0.6 4.9 0.1 5.6 5.2 5.4 6.2 4.9 4.9 5 5 11.2 21.7 20 20 Acquisition, integration and related costs 0.0 0.0 - 0.1 - - - - 0.0 - - 0.1 - 0 0 Business transition and related costs - - - - - - - 6.0 6.2 6 6 - 6.0 13 13 Other adjustments - - - - 2.5 0.9 0.5 (0.0) 3.1 - - - 3.9 3 3 GAAP adjustments $0.6 $51.1 $6.5 $5.6 $7.7 $6.4 $6.6 $10.8 $14.2 $11 $11 $63.9 $31.6 $36 $36 Healthcare 205.4 236.7 211.4 216.7 214.8 169.0 185.6 207.7 211.4 206 213 870.2 777.1 846 865 Non-Healthcare - 72.5 77.7 102.2 77.8 58.5 55.8 65.8 44.5 47 57 252.5 258.0 221 260 Other - - - - - - - - - - - - - - - Non-GAAP gross profit $205.4 $309.2 $289.1 $318.9 $292.6 $227.6 $241.4 $273.6 $255.9 $253 $269 $1,122.7 $1,035.1 $1,067 $1,125