masi-20211026
0000937556false00009375562021-10-262021-10-26

UNITED STATES
SECURITIES AND EXCHANGE COMMISSION
WASHINGTON, D.C. 20549
________________________________________________
FORM 8-K
________________________________________________
CURRENT REPORT
Pursuant to Section 13 or 15(d) of the
Securities Exchange Act of 1934
Date of Report (Date of earliest event reported): October 26, 2021
masi-20211026_g1.jpg
MASIMO CORPORATION
(Exact name of registrant as specified in its charter)
________________________________________________
DE001-3364233-0368882
(State or other jurisdiction
of incorporation)
(Commission
File Number)
(IRS Employer
Identification No.)
52 DiscoveryIrvine,CA92618
(Address of Principal Executive Offices)(Zip Code)
(949)
297-7000
Registrant’s telephone number, including area code:
Not Applicable
(Former name or former address, if changed since last report)
Check the appropriate box below if the Form 8-K filing is intended to simultaneously satisfy the filing obligation of the registrant under any of the following provisions:
Written communications pursuant to Rule 425 under the Securities Act (17 CFR 230.425)
Soliciting material pursuant to Rule 14a-12 under the Exchange Act (17 CFR 240.14a-12)
Pre-commencement communications pursuant to Rule 14d-2(b) under the Exchange Act (17 CFR 240.14d-2 (b))
Pre-commencement communications pursuant to Rule 13e-4(c) under the Exchange Act (17 CFR 240.13e-4(c))
Securities Registered pursuant to Section 12(b) of the Act:
Title of each classTrading Symbol(s)Name of each exchange on which registered
Common Stock, $0.001 par valueMASIThe Nasdaq Stock Market LLC
Indicate by check mark whether the registrant is an emerging growth company as defined in Rule 405 of the Securities Act of 1933(§230.405 of this chapter) or Rule 12b-2 of the Securities Exchange Act of 1934 (§240.12b-2 of this chapter).
Emerging growth company
If an emerging growth company, indicate by check mark if the registrant has elected not to use the extended transition period for complying with any new or revised financial accounting standards provided pursuant to Section 13(a) of the Exchange Act.


Item 2.02.Results of Operations and Financial Condition.
On October 26, 2021, Masimo Corporation (the “Company”) issued a press release announcing its financial results for the quarter ended October 2, 2021. A copy of the press release is furnished as Exhibit 99.1 to this Current Report.
In accordance with General Instructions B.2 of Form 8-K, the information in Item 2.02 of this Current Report on Form 8-K shall not be deemed “filed” for purposes of Section 18 of the Securities Exchange Act of 1934, as amended (the “Exchange Act”), or otherwise subject to the liability of that section, and shall not be incorporated by reference into any registration statement or other document filed under the Securities Act of 1933, as amended (the “Securities Act”), or the Exchange Act, except as shall be expressly set forth by specific reference in such filing.
Item 7.01.Regulation FD Disclosure.
In connection with the Company’s conference call scheduled to be held on October 26, 2021, the Company’s Chief Financial Officer will review supplemental information regarding the Company’s financial results for the quarter ended October 2, 2021. The Company’s supplemental information is furnished as Exhibit 99.2 to this Current Report.
In addition, the Company is making available to investors supplemental financial information for fiscal 2018, fiscal 2019, fiscal 2020 and the first, second and third quarters of fiscal 2021 pursuant to the materials furnished as Exhibit 99.3 to this Current Report.
In accordance with General Instructions B.2 of Form 8-K, the information in Item 7.01 of this Current Report on Form 8-K shall not be deemed “filed” for purposes of Section 18 of the Exchange Act, or otherwise subject to the liability of that section, and shall not be incorporated by reference into any registration statement or other document filed under the Securities Act or the Exchange Act, except as shall be expressly set forth by specific reference in such filing.
Item 9.01.Financial Statements and Exhibits.
(d) The following items are filed as exhibits to the Current Report on Form 8-K.
Exhibit
 No.
Description
99.1
99.2
99.3
104Cover Page Interactive Data File (embedded within the Inline XBRL document)


SIGNATURES
Pursuant to the requirements of the Securities Exchange Act of 1934, Masimo Corporation has duly caused this report to be signed on its behalf by the undersigned, thereunto duly authorized.
 
MASIMO CORPORATION
Date: October 26, 2021By:
/s/ MICAH YOUNG
Micah Young
Executive Vice President & Chief Financial Officer
(Principal Financial Officer)


Exhibit 99.1
masimologoq2020.jpg
Masimo Reports Third Quarter 2021 Financial Results
Third Quarter 2021 Highlights
Product revenue was $307.4 million;
GAAP net income per diluted share was $1.00; and
Non-GAAP net income per diluted share was $0.94.
Irvine, California, October 26, 2021 - Masimo (Nasdaq: MASI) today announced its financial results for the third quarter of 2021, ended October 2, 2021.
Third Quarter 2021 Results
Product revenue was $307.4 million, which represents 10.5% reported growth and 10.1% growth on a constant currency basis, compared to $278.1 million in the third quarter of 2020. Excluding handheld and fingertip pulse oximeters, shipments of noninvasive technology boards and instruments were 74,600 in the third quarter of 2021.
GAAP operating margin for the third quarter 2021 was 22.0% compared to 21.5% in the third quarter of 2020. Third quarter 2021 non-GAAP operating margin was 23.0% compared to 21.9% in the third quarter of 2020.
For the third quarter of 2021, GAAP net income was $57.8 million, or $1.00 per diluted share, compared to net income of $49.4 million, or $0.85 per diluted share, in the third quarter of 2020. Non-GAAP net income was $54.3 million, or $0.94 per diluted share, compared to net income of $46.8 million, or $0.80 per diluted share, in the third quarter of 2020.
Total cash and cash equivalents were $652.4 million as of October 2, 2021.
Joe Kiani, Chairman and Chief Executive Officer of Masimo, said “In the wake of the pandemic and its ongoing challenges, we have continued to demonstrate the commitment and responsiveness required to meet the needs of clinicians and patients around the world. We are happy to report double-digit revenue growth and EPS growth that exceeded expectations for the third quarter.”


-1-


2021 Financial Guidance
The Company provided the following updated estimates for its full-year 2021 guidance:
2021 Updated Guidance(1)
Prior 2021 Guidance(1)
(in millions, except percentages and earnings per diluted share)GAAPNon-GAAPGAAPNon-GAAP
Total revenue$1,230.0 $1,230.0 $1,216.0 $1,216.0 
   Product revenue$1,230.0 $1,230.0 $1,216.0 $1,216.0 
      Percentage growth - as reported7.5 %N/A6.3 %N/A
      Percentage growth - constant currencyN/A6.8 %N/A5.4 %
Gross margin65.3 %66.0 %65.3 %66.0 %
Operating margin22.3 %23.8 %22.3 %23.8 %
Earnings per diluted share$3.88 $3.88 $3.83 $3.85 
Estimated tax rate18.0 %23.4 %18.2 %23.4%
______________
(1)     Updated guidance provided October 26, 2021. Prior guidance provided July 27, 2021.

Product revenue of $1,230 million, which reflects 7.5% reported growth and 6.8% growth on a constant currency basis;
GAAP earnings per diluted share of $3.88;
Non-GAAP earnings per diluted share of $3.88;
Included in our full-year 2021 revenue guidance is approximately $9.0 million of year-over-year currency tailwinds, which is a $1.0 million decrease from our prior guidance.
Supplementary Non-GAAP Financial Information
For additional non-GAAP financial details, please visit the Investor Relations section of the Company’s website at www.masimo.com to access Supplementary Financial Information.
Non-GAAP Financial Measures
The non-GAAP financial measures contained herein are a supplement to the corresponding financial measures prepared in accordance with U.S. GAAP. The non-GAAP financial measures presented exclude the items described below. Management believes that adjustments for these items assist investors in making comparisons of period-to-period operating results. Furthermore, management also believes that these items are not indicative of the Company’s on-going operating performance. These non-GAAP financial measures have certain limitations in that they do not reflect all of the costs associated with the operations of the Company’s business as determined in accordance with GAAP.
Therefore, investors should consider non-GAAP financial measures in addition to, and not as a substitute for, or as superior to, measures of financial performance prepared in accordance with GAAP. The non-GAAP financial measures presented by the Company may be different from the non-GAAP financial measures used by other companies.
The Company has presented the following non-GAAP measures to assist investors in understanding the Company’s net operating results on an on-going basis: (i) constant currency product revenue growth %, (ii) non-GAAP net income, (iii) non-GAAP (net income) earnings per diluted share and (iv) non-GAAP operating income/margin. These non-GAAP financial measures may also assist investors in making comparisons of the Company’s operating results with those of other companies. Management believes constant currency product revenue growth, non-GAAP operating income/margin, non-GAAP net income and non-GAAP earnings per diluted share are important measures in the evaluation of the Company’s performance and uses these measures to better understand and evaluate our business.


-2-


The non-GAAP financial measures reflect adjustments for the following items, as well as the related income tax effects thereof:
Constant currency revenue adjustments
Some of our sales agreements with foreign customers provide for payment in currencies other than the U.S. Dollar. These foreign currency revenues, when converted into U.S. Dollars, can vary significantly from period-to-period depending on the average and quarter-end exchange rates during a respective period. We believe that comparing these foreign currency denominated revenues by holding the exchange rates constant with the prior year period is useful to management and investors in evaluating our product revenue growth rates on a period-to-period basis. We anticipate that fluctuations in foreign exchange rates and the related constant currency adjustments for calculation of our product revenue growth rate will continue to occur in future periods.
Royalty and other revenue, net of related costs
We derive royalty and other revenue, net of related costs, from certain non-recurring contractual arrangements that we do not expect to continue in the future. We believe the exclusion of royalty and other revenue, net of related costs, associated with these non-recurring revenue streams is useful to management and investors in evaluating the performance of our ongoing operations on a period-to-period basis.
Acquisition, integration and related costs
These transactions represent gains, losses, and other related costs associated with acquisitions, integrations, investments and divestitures. These items also include but are not limited to amortization and depreciation of intangible assets, asset impairments, and in-process research and development. We believe that the exclusion of these items is useful to management and investors in evaluating the performance of our ongoing operations on a period-to-period basis.
Litigation related expenses, settlements and awards
These transactions represent gains, losses, and other related costs associated with certain litigation matters, which can vary in their characteristics, frequency and significance to our operating results. We believe that the exclusion of these items is useful to management and investors in evaluating the performance of our ongoing operations on a period-to-period basis.
Other adjustments
In the event there are gains, losses and other adjustments which impact period-to-period comparability and do not represent the underlying ongoing results of the business, the Company may choose to exclude these from non-GAAP earnings.
Realized and unrealized gains or losses
These transactions represent gains, losses, and other related costs associated with foreign currency denominated transactions and investments. As the Company does not actively hedge these currency exposures, changes in the underlying currency rates relative to the U.S. Dollar may result in realized and unrealized foreign currency gains and losses between the time these receivables and payables arise and the time that they are settled in cash. Unrealized and realized gains and losses on investments may impact the Company’s reported results of operations for a period. These items are highly variable, difficult to predict and outside the control of those responsible for the underlying operations of the business. We believe that exclusion of these items is useful to management and investors in evaluating the performance of our ongoing operations on a period-to-period basis.
Tax impact of non-GAAP adjustments
In order to reflect the tax effected impact of the non-GAAP adjustments, the Company will adjust the non-GAAP earnings by the approximate tax impact of these adjustments.
Excess tax benefits from stock-based compensation expense
GAAP requires that excess tax benefits recognized on stock-based compensation expense be reflected in our provision for income taxes rather than paid-in capital. As these excess tax benefits may be highly variable from period-to-period, the Company may choose to exclude these tax benefits from non-GAAP earnings to facilitate comparability between periods and with peers.
-3-


Third Quarter 2021 Actuals versus Third Quarter 2020 Actuals
RECONCILIATION OF GAAP TO NON-GAAP CONSTANT CURRENCY PRODUCT REVENUE(1):
Three Months Ended
(in thousands, except percentages)October 2,
2021
September 26,
2020
GAAP product revenue$307,414 $278,112 
Non-GAAP constant currency adjustments:
Constant currency F/X adjustments(1,298)N/A
Total non-GAAP constant currency adjustments(1,298)N/A
    Non-GAAP constant currency product revenue$306,117 $278,112 
Product revenue growth %
GAAP10.5 %
Non-GAAP constant currency10.1 %
__________________
(1)      May not foot due to rounding.


RECONCILIATION OF GAAP TO NON-GAAP NET INCOME AND NET INCOME PER DILUTED SHARE(1):
Three Months Ended
October 2,
2021
September 26,
2020
(in thousands, except per diluted share amounts)$Per Diluted Share$Per Diluted Share
GAAP net income$57,771 $1.00 $49,405 $0.85 
Non-GAAP adjustments:
Acquisition, integration and related costs1,982 0.03 1,277 0.02 
Litigation related expenses, settlements and awards(2)
1,177 0.02 — — 
Realized and unrealized gains or losses230 — (647)(0.01)
Tax impact of non-GAAP adjustments(526)(0.01)(202)— 
Excess tax benefits from stock-based compensation expense
(6,377)(0.11)(3,076)(0.05)
Total non-GAAP adjustments(3,514)(0.06)(2,649)(0.05)
Non-GAAP net income$54,255 $0.94 $46,756 $0.80 
Weighted average shares outstanding - diluted57,664 58,280 
__________________
(1)      May not foot due to rounding.
(2)    Litigation related expenses, settlements and awards includes legal expenses in 2021 related to a complaint filed against Apple, Inc. with the U.S. International Trade Commission (ITC).
-4-


RECONCILIATION OF GAAP TO NON-GAAP OPERATING MARGIN(1):
Three Months Ended
October 2,
2021
September 26,
2020
(in thousands, except percentages)$$
GAAP operating income/margin$67,611 $59,698 
Non-GAAP adjustments:
Acquisition, integration and related costs1,982 1,277 
Litigation related expenses, settlements and awards(2)
1,177 — 
Total non-GAAP adjustments3,159 1,277 
Non-GAAP operating income/margin$70,768 $60,975 
GAAP operating income/margin %22.0 %21.5 %
Non-GAAP operating income/margin %23.0 %21.9 %
__________________
(1)     May not foot due to rounding.
(2)    Litigation related expenses, settlements and awards includes legal expenses in 2021 related to a complaint filed against Apple, Inc. with the U.S. International Trade Commission (ITC).
Full-Year 2021 Guidance versus Full-Year 2020 Actuals
RECONCILIATION OF GAAP PRODUCT REVENUE GROWTH % TO CONSTANT CURRENCY PRODUCT REVENUE GROWTH %(1):
(in thousands, except percentages)
Full-Year 2021
Updated Guidance
(2)
Full-Year 2020
Actuals
GAAP product revenue$1,230,000 $1,143,744 
Non-GAAP constant currency adjustments:
Constant currency F/X adjustments(9,000)N/A
Total non-GAAP constant currency adjustments(9,000)N/A
Non-GAAP constant currency product revenue$1,221,000 $1,143,744 
Product revenue growth %:
GAAP7.5 %
Non-GAAP constant currency6.8 %
__________________
(1)     May not foot due to rounding.
(2)    Updated guidance provided October 26, 2021. Prior guidance provided July 27, 2021.
-5-


RECONCILIATION OF GAAP TO NON-GAAP NET INCOME AND NET INCOME PER DILUTED SHARE(1):
Full-Year 2021
 Updated Guidance(2)
Full-Year 2020
Actuals
(in thousands, except per diluted share amounts)$Per Diluted Share$Per Diluted Share
GAAP net income$224,000 $3.88 $240,302 $4.14 
Non-GAAP adjustments:
Acquisition, integration and related costs10,100 0.18 8,286 0.14 
Litigation related expenses, settlements and awards(3)
5,000 0.09 (474)(0.01)
Other adjustments(4)
3,400 0.06 — — 
Realized and unrealized gains or losses1,100 0.02 (2,631)(0.05)
Tax impact of non-GAAP adjustments(3,500)(0.06)(6,096)(0.11)
Excess tax benefits from stock-based compensation expense(16,000)(0.28)(30,172)(0.52)
Total non-GAAP adjustments100 — (31,086)(0.54)
Non-GAAP product net income$224,100 $3.88 $209,216 $3.60 
Weighted average shares outstanding - diluted57,700 58,037 
__________________
(1)      May not foot due to rounding.
(2)    Updated guidance provided October 26, 2021. Prior guidance provided July 27, 2021.
(3)    Litigation related expenses, settlements and awards includes legal expenses in 2021 related to a complaint filed against Apple, Inc. with the U.S. International Trade Commission (ITC).
(4)    Other adjustments includes a charge in the second quarter of 2021 related to assisting a long-term OEM customer with their medical device correction.


-6-


RECONCILIATION OF GAAP TO NON-GAAP GROSS PROFIT AND OPERATING MARGIN(1):
Full-Year 2021
Updated Guidance
(2)
Full-Year 2020
Actuals
(in thousands, except percentages)$$
GAAP gross margin$803,700 $743,065 
Non-GAAP adjustments:
Acquisition, integration and related costs4,100 1,807 
Other adjustments(4)
3,400 — 
Total non-GAAP adjustments7,500 1,807 
Non-GAAP gross margin$811,200 $744,872 
GAAP gross margin %65.3 %65.0 %
Non-GAAP gross margin %66.0 %65.1 %
GAAP operating income/margin$273,700 $255,823 
Non-GAAP adjustments:
Acquisition, integration and related costs10,100 8,286 
Litigation related expenses, settlements and awards(3)
5,000 (474)
Other adjustments(4)
3,400 — 
Total non-GAAP adjustments18,500 7,812 
Non-GAAP operating income/margin$292,200 $263,636 
GAAP operating income/margin %22.3 %22.4 %
Non-GAAP operating income/margin %23.8 %23.1 %
__________________
(1)      May not foot due to rounding.    
(2)      Updated guidance provided October 26, 2021. Prior guidance provided July 27, 2021.
(3)    Litigation related expenses, settlements and awards includes legal expenses in 2021 related to a complaint filed against Apple, Inc. with the U.S. International Trade Commission (ITC).
(4)    Other adjustments includes a charge in the second quarter of 2021 related to assisting a long-term OEM customer with their medical device correction.
Conference Call:
The conference call to review the results will begin at 1:30 p.m. PT today (4:30 p.m. ET) and will be hosted by Joe Kiani, Chairman and Chief Executive Officer, and Micah Young, Executive Vice President and Chief Financial Officer.
To register for the conference call and receive the dial-in number, please use the link below. Upon registering, each participant will be provided with call details and a registrant ID number.
Conference Call Registration Link:
http://www.directeventreg.com/registration/event/5492005
A replay of the webcast and conference call will be available shortly after the conclusion of the call and will be archived on the Company’s website.


-7-


About Masimo
Masimo (Nasdaq: MASI) is a global medical technology company that develops and produces a wide array of industry-leading monitoring technologies, including innovative measurements, sensors, patient monitors, and automation and connectivity solutions. Our mission is to improve patient outcomes, reduce the cost of care and take noninvasive monitoring to new sites and applications. Masimo SET® Measure-through Motion and Low Perfusion pulse oximetry, introduced in 1995, has been shown in over 100 independent and objective studies to outperform other pulse oximetry technologies. Masimo SET® has also been shown to help clinicians reduce severe retinopathy of prematurity in neonates, improve CCHD screening in newborns, and, when used for continuous monitoring with Masimo Patient SafetyNet in post-surgical wards, reduce rapid response team activations, ICU transfers, and costs. Masimo SET® is estimated to be used on more than 200 million patients in leading hospitals and other healthcare settings around the world, and is the primary pulse oximetry at 9 of the top 10 hospitals as ranked in the 2021-22 U.S. News and World Report Best Hospitals Honor Roll. Masimo continues to refine SET® and in 2018, announced that SpO2 accuracy on RD SET® sensors during conditions of motion has been significantly improved, providing clinicians with even greater confidence that the SpO2 values they rely on accurately reflect a patient’s physiological status. In 2005, Masimo introduced rainbow® Pulse CO-Oximetry technology, allowing noninvasive and continuous monitoring of blood constituents that previously could only be measured invasively, including total hemoglobin (SpHb®), oxygen content (SpOC), carboxyhemoglobin (SpCO®), methemoglobin (SpMet®), Pleth Variability Index (PVi®), RPVi™ (rainbow® PVi), and Oxygen Reserve Index (ORi). In 2013, Masimo introduced the Root® Patient Monitoring and Connectivity Platform, built from the ground up to be as flexible and expandable as possible to facilitate the addition of other Masimo and third-party monitoring technologies; key Masimo additions include Next Generation SedLine® Brain Function Monitoring, O3® Regional Oximetry, and ISA™ Capnography with NomoLine® sampling lines. Masimo’s family of continuous and spot-check monitoring Pulse CO-Oximeters® includes devices designed for use in a variety of clinical and non-clinical scenarios, including tetherless, wearable technology, such as Radius-7® and Radius PPG, portable devices like Rad-67®, fingertip pulse oximeters like MightySat® Rx, and devices available for use both in the hospital and at home, such as Rad-97®. Masimo hospital automation and connectivity solutions are centered around the Masimo Hospital Automation platform, and include Iris® Gateway, iSirona, Patient SafetyNet, Replica, Halo ION, UniView®, UniView :60, and Masimo SafetyNet. Additional information about Masimo and its products may be found at www.masimo.com. Published clinical studies on Masimo products can be found at www.masimo.com/evidence/featured-studies/feature/.
ORi and RPVi have not received FDA 510(k) clearance and are not available for sale in the United States. The use of the trademark Patient SafetyNet is under license from University HealthSystem Consortium.

References
1.Estimate: Masimo data on file.
2.https://content.govdelivery.com/accounts/USFDA/bulletins/2c276cb.
3.http://health.usnews.com/health-care/best-hospitals/articles/best-hospitals-honor-roll-and-overview.
4.Published clinical studies on pulse oximetry and the benefits of Masimo SET® can be found on our website at http://www.masimo.com. Comparative studies include independent and objective studies which are comprised of abstracts presented at scientific meetings and peer-reviewed journal articles.
5.Castillo A et al. Prevention of Retinopathy of Prematurity in Preterm Infants through Changes in Clinical Practice and SpO2 Technology. Acta Paediatr. 2011 Feb;100(2):188-92.
6.de-Wahl Granelli A et al. Impact of pulse oximetry screening on the detection of duct dependent congenital heart disease: a Swedish prospective screening study in 39,821 newborns. BMJ. 2009;Jan 8;338.
7.Taenzer A et al. Impact of pulse oximetry surveillance on rescue events and intensive care unit transfers: a before-and-after concurrence study. Anesthesiology. 2010:112(2):282-287.
8.Taenzer A et al. Postoperative Monitoring – The Dartmouth Experience. Anesthesia Patient Safety Foundation Newsletter. Spring-Summer 2012.
9.McGrath S et al. Surveillance Monitoring Management for General Care Units: Strategy, Design, and Implementation. The Joint Commission Journal on Quality and Patient Safety. 2016 Jul;42(7):293-302.
10.McGrath S et al. Inpatient Respiratory Arrest Associated With Sedative and Analgesic Medications: Impact of Continuous Monitoring on Patient Mortality and Severe Morbidity. J Patient Saf. 2020 14 Mar. DOI: 10.1097/PTS.0000000000000696.
Forward-Looking Statements
All statements other than statements of historical facts included in this press release that address activities, events or developments that we expect, believe or anticipate will or may occur in the future are forward-looking statements including, in particular, the statements about our expectations for full year 2021 financial guidance; our long-term outlook; demand for our products; anticipated revenue and earnings growth; our financial condition, results of operations and business generally; expectations regarding our ability to design and deliver innovative new noninvasive technologies and reduce the cost of care; and demand for our technologies. These forward-looking statements are based on management’s current expectations and beliefs and are subject to uncertainties and factors, all of which are difficult to predict and many of which are beyond our control and could cause actual results to differ materially and adversely from those described in the forward-looking statements. These risks include, but are not limited to, those related to: our dependence on Masimo SET® and Masimo rainbow SET products and technologies for substantially all of our revenue; any failure in protecting our intellectual property exposure to competitors’ assertions of intellectual property claims; the highly competitive nature of the markets in which we sell our products and technologies; any failure to continue developing innovative products and technologies; the lack of acceptance of any of our current or future products and technologies; obtaining regulatory approval of our current and future products and technologies; the risk that the implementation of our international realignment will not continue to produce anticipated operational and financial benefits, including a continued lower effective tax rate; the loss of our customers; the failure to retain and recruit senior management; product liability claims exposure; a failure to obtain expected returns from the amount of intangible assets we have recorded; the maintenance of our brand; the amount and type of equity awards that we may grant to employees and service providers in the future; our ongoing litigation and related matters; risks related to global economic and marketplace uncertainties related to the impact of the COVID-19 pandemic; and other factors discussed in the “Risk Factors” section of our most recent periodic reports filed with the Securities and Exchange Commission (“SEC”), including our most recent Form 10-K and Form 10-Q, all of which you may obtain for free on the SEC’s website at www.sec.gov. Although we believe that the expectations reflected in our forward-looking statements are reasonable, we do not know whether our expectations will prove correct. You are cautioned not to place undue reliance on these forward-looking statements, which speak only as of the date hereof, even if subsequently made available by us on our website or otherwise. We do not undertake any obligation to update, amend or clarify these forward-looking statements, whether as a result of new information, future events or otherwise, except as may be required under applicable securities laws.
# # #
Investor Contact: Eli KammermanMedia Contact: Evan Lamb
(949) 297-7077(949) 396-3376
[email protected][email protected]
Masimo, SET, Signal Extraction Technology, Improving Patient Outcome and Reducing Cost of Care... by Taking Noninvasive Monitoring to New Sites and Applications, rainbow, SpHb, SpOC, SpCO, SpMet, PVI and ORI are trademarks or registered trademarks of Masimo Corporation.
-8-


MASIMO CORPORATION
CONDENSED CONSOLIDATED BALANCE SHEETS
(unaudited, in thousands)
October 2,
2021
January 2,
2021
ASSETS
Current assets
Cash and cash equivalents$652,354 $641,447 
Accounts receivable, net of allowance for credit losses191,332 141,350 
Inventories202,328 215,952 
Other current assets91,772 102,416 
Total current assets1,137,786 1,101,165 
Lease receivable, noncurrent66,955 57,666 
Deferred costs and other contract assets22,599 20,076 
Property and equipment, net274,929 272,511 
Intangible assets, net74,089 73,923 
Goodwill101,242 103,206 
Deferred tax assets39,294 39,363 
Other non-current assets49,886 44,642 
Total assets$1,766,780 $1,712,552 
LIABILITIES AND STOCKHOLDERS EQUITY
Current liabilities
Accounts payable$60,710 $64,061 
Accrued compensation69,785 71,601 
Deferred revenue and other contract liabilities, current46,641 44,935 
Other current liabilities51,118 53,239 
Total current liabilities228,254 233,836 
Other non-current liabilities70,377 71,076 
Total liabilities298,631 304,912 
Commitments and contingencies
Stockholders’ equity
Common stock55 55 
Treasury stock(767,653)(638,736)
Additional paid-in capital736,575 703,693 
Accumulated other comprehensive (loss) income(3,432)1,413 
Retained earnings1,502,604 1,341,215 
Total stockholders’ equity1,468,149 1,407,640 
Total liabilities and stockholders’ equity$1,766,780 $1,712,552 


-9-


MASIMO CORPORATION
 CONDENSED CONSOLIDATED STATEMENTS OF OPERATIONS
(unaudited, in thousands, except per share amounts)
Three Months EndedNine Months Ended
October 2,
2021
September 26,
2020
October 2,
2021
September 26,
2020
Product revenue$307,414 $278,112 $911,575 $848,690 
Cost of goods sold103,750 99,186 318,124 292,551 
Gross profit203,664 178,926 593,451 556,139 
Operating expenses:
Selling, general and administrative100,647 90,376 291,180 278,714 
Research and development35,406 28,852 103,860 86,971 
Litigation awards— — — (474)
Total operating expenses136,053 119,228 395,040 365,211 
Operating income67,611 59,698 198,411 190,928 
Non-operating (loss) income(78)1,357 (735)6,108 
Income before provision for income taxes67,533 61,055 197,676 197,036 
Provision for income taxes9,762 11,650 36,287 27,403 
Net income$57,771 $49,405 $161,389 $169,633 
Net income per share:
Basic$1.05 $0.90 $2.93 $3.11 
Diluted$1.00 $0.85 $2.80 $2.92 
Weighted-average shares used in per share calculations:
Basic55,143 54,997 55,125 54,543 
Diluted57,664 58,280 57,651 58,033 
The following table presents details of the stock-based compensation expense that is included in each functional line item in the condensed consolidated statements of operations (in thousands):
Three Months EndedNine Months Ended
October 2,
2021
September 26,
2020
October 2,
2021
September 26,
2020
Cost of goods sold$227 $184 $624 $498 
Selling, general and administrative9,015 8,659 23,503 27,443 
Research and development3,318 3,069 9,403 8,431 
Total$12,560 $11,912 $33,530 $36,372 

-10-


MASIMO CORPORATION
CONDENSED CONSOLIDATED STATEMENTS OF CASH FLOWS
(unaudited, in thousands)
Nine Months Ended
October 2,
2021
September 26,
2020
Cash flows from operating activities:
Net income$161,389 $169,633 
Adjustments to reconcile net income to net cash provided by operating activities:
Depreciation and amortization26,449 21,200 
Stock-based compensation33,530 36,372 
Loss on disposal of equipment, intangibles and other assets371 202 
Provision for credit losses647 
Provision for deferred income taxes— 136 
Changes in operating assets and liabilities:
Increase in accounts receivable(50,967)(9,459)
Increase in lease receivable, net(9,312)(6,279)
Decrease (increase) in inventories12,329 (86,815)
Decrease (increase) in other current assets4,433 (23,461)
Increase in deferred costs and other contract assets(2,573)(1,964)
Increase in other non-current assets(144)(775)
(Decrease) increase in accounts payable(4,290)31,793 
(Decrease) increase in accrued compensation(1,298)3,654 
(Decrease) increase in accrued liabilities(3,969)4,691 
Decrease in income tax payable(1,456)(2,756)
Increase in deferred revenue and other contract-related liabilities1,378 9,973 
Increase in other non-current liabilities634 395 
Net cash provided by operating activities167,151 146,545 
Cash flows from investing activities:
Maturities of short-term investments— 70,000 
Purchases of property and equipment, net(20,680)(60,017)
Increase in intangible assets(8,185)(5,763)
Business combinations, net of cash acquired— (78,310)
Other strategic investing activities(2,600)(6,750)
Net cash used in investing activities(31,465)(80,840)
Cash flows from financing activities:
Proceeds from issuance of common stock18,975 40,994 
Payroll tax withholdings on behalf of employees for vested equity awards(16,724)(1,449)
Repurchases of common stock(128,917)(591)
Net cash (used in) provided by financing activities(126,666)38,954 
Effect of foreign currency exchange rates on cash(89)(294)
Net increase in cash, cash equivalents and restricted cash8,931 104,365 
Cash, cash equivalents and restricted cash at beginning of period645,004 568,075 
Cash, cash equivalents and restricted cash at end of period$653,935 $672,440 

-11-
Improving Patient Outcomes Reducing the Cost of Care® Third Quarter 2021 Earnings Presentation | October 26, 2021


FORWARD-LOOKING STATEMENTS These presentations contain forward-looking statements within the meaning of federal securities laws, including, among others, statements about our expectations, plans, strategies or prospects. We generally use the words “may,” “will,” “expect,” “believe,” “anticipate,” “plan,” “estimate,” “project,” “assume,” “guide,” “target,” “forecast,” “see,” “seek,” “can,” “should,” “could,” “would,” “intend” “predict,” “potential,” “strategy,” “is confident that,” “future,” “opportunity,” “work toward,” and similar expressions to identify forward-looking statements. All statements other than statements of historical or current fact are, or may be deemed to be, forward-looking statements. Such statements are based upon the current beliefs, expectations and assumptions of management and are subject to significant risks, uncertainties and changes in circumstances that could cause actual results to differ materially from the forward-looking statements. Forward-looking statements speak only as of the date they are made, and we disclaim any intention or obligation to update or revise any forward-looking statements, whether as a result of new information, future events or otherwise. Readers of these presentations are cautioned not to rely on these forward-looking statements, since there can be no assurance that these forward-looking statements will prove to be accurate. This cautionary statement is applicable to all forward-looking statements contained in these presentations. The risks and uncertainties that may cause actual results to differ materially from Masimo’s current expectations are more fully described in Masimo’s reports filed with the U.S. Securities and Exchange Commission (SEC), including our most recent Form 10-K and Form 10-Q. Copies of these filings, as well as subsequent filings, are available online at www.sec.gov, www.masimo.com or upon request.


NON-GAAP FINANCIAL MEASURES The non-GAAP financial measures contained herein are a supplement to the corresponding financial measures prepared in accordance with U.S. GAAP. The non-GAAP financial measures presented exclude certain items that are more fully described in the Appendix. Management believes that adjustments for these items assist investors in making comparisons of period-to- period operating results. Furthermore, management also believes that these items are not indicative of the Company’s on- going core operating performance. These non-GAAP financial measures have certain limitations in that they do not reflect all of the costs associated with the operations of the Company’s business as determined in accordance with GAAP. Therefore, investors should consider non-GAAP financial measures in addition to, and not as a substitute for, or as superior to, measures of financial performance prepared in accordance with GAAP. The non-GAAP financial measures presented by the Company may be different from the non-GAAP financial measures used by other companies. The Company has presented the following non-GAAP measures to assist investors in understanding the Company’s core net operating results on an on-going basis: (i) constant currency product revenue growth %, (ii) non-GAAP gross profit/margin %, (iii) non-GAAP SG&A expense, (iv) non- GAAP R&D expense, (v) non-GAAP litigation settlements and (awards), (vi) non-GAAP operating expense %, (vii) non-GAAP operating income/margin %, (viii) non-GAAP earnings per diluted share and (ix) adjusted free cash flow. These non-GAAP financial measures may also assist investors in making comparisons of the company’s core operating results with those of other companies. Management believes constant currency product revenue growth, non-GAAP gross profit/margin, non-GAAP operating income/margin, non-GAAP net income, non-GAAP net income per diluted share, and adjusted free cash flow are important measures in the evaluation of the Company’s performance and uses these measures to better understand and evaluate our business. For additional financial details, including GAAP to non-GAAP reconciliations, please visit the Investor Relations section of the Company’s website at www.masimo.com to access Supplementary Financial Information.


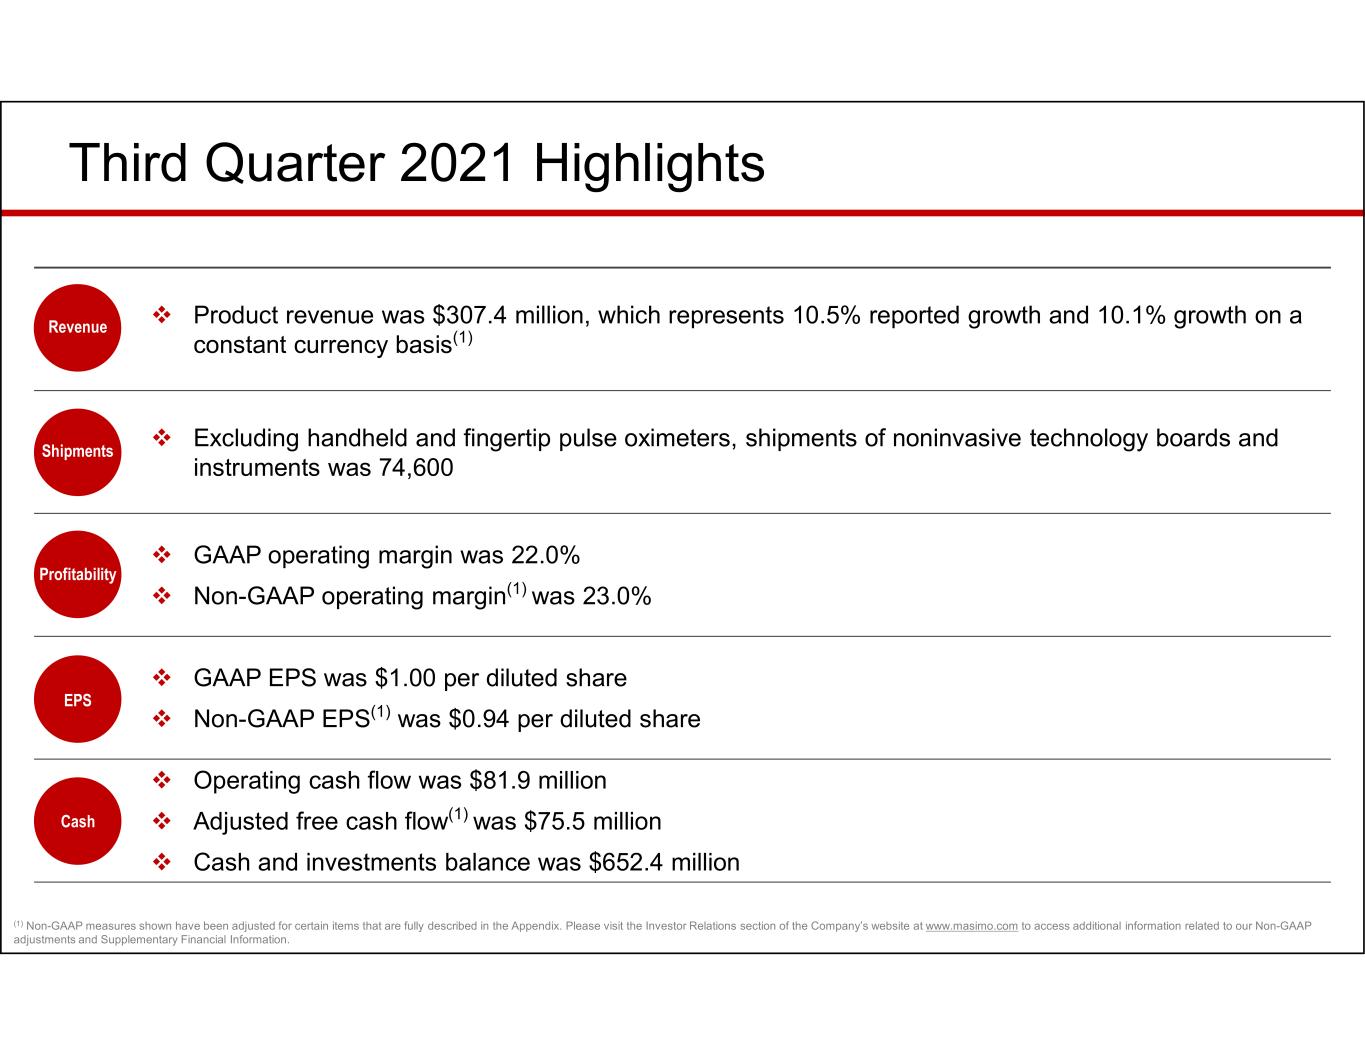
Third Quarter 2021 Highlights  Product revenue was $307.4 million, which represents 10.5% reported growth and 10.1% growth on a constant currency basis(1)  Excluding handheld and fingertip pulse oximeters, shipments of noninvasive technology boards and instruments was 74,600  GAAP operating margin was 22.0%  Non-GAAP operating margin(1) was 23.0%  GAAP EPS was $1.00 per diluted share  Non-GAAP EPS(1) was $0.94 per diluted share  Operating cash flow was $81.9 million  Adjusted free cash flow(1) was $75.5 million  Cash and investments balance was $652.4 million Shipments Revenue Profitability EPS Cash (1) Non-GAAP measures shown have been adjusted for certain items that are fully described in the Appendix. Please visit the Investor Relations section of the Company’s website at www.masimo.com to access additional information related to our Non-GAAP adjustments and Supplementary Financial Information.


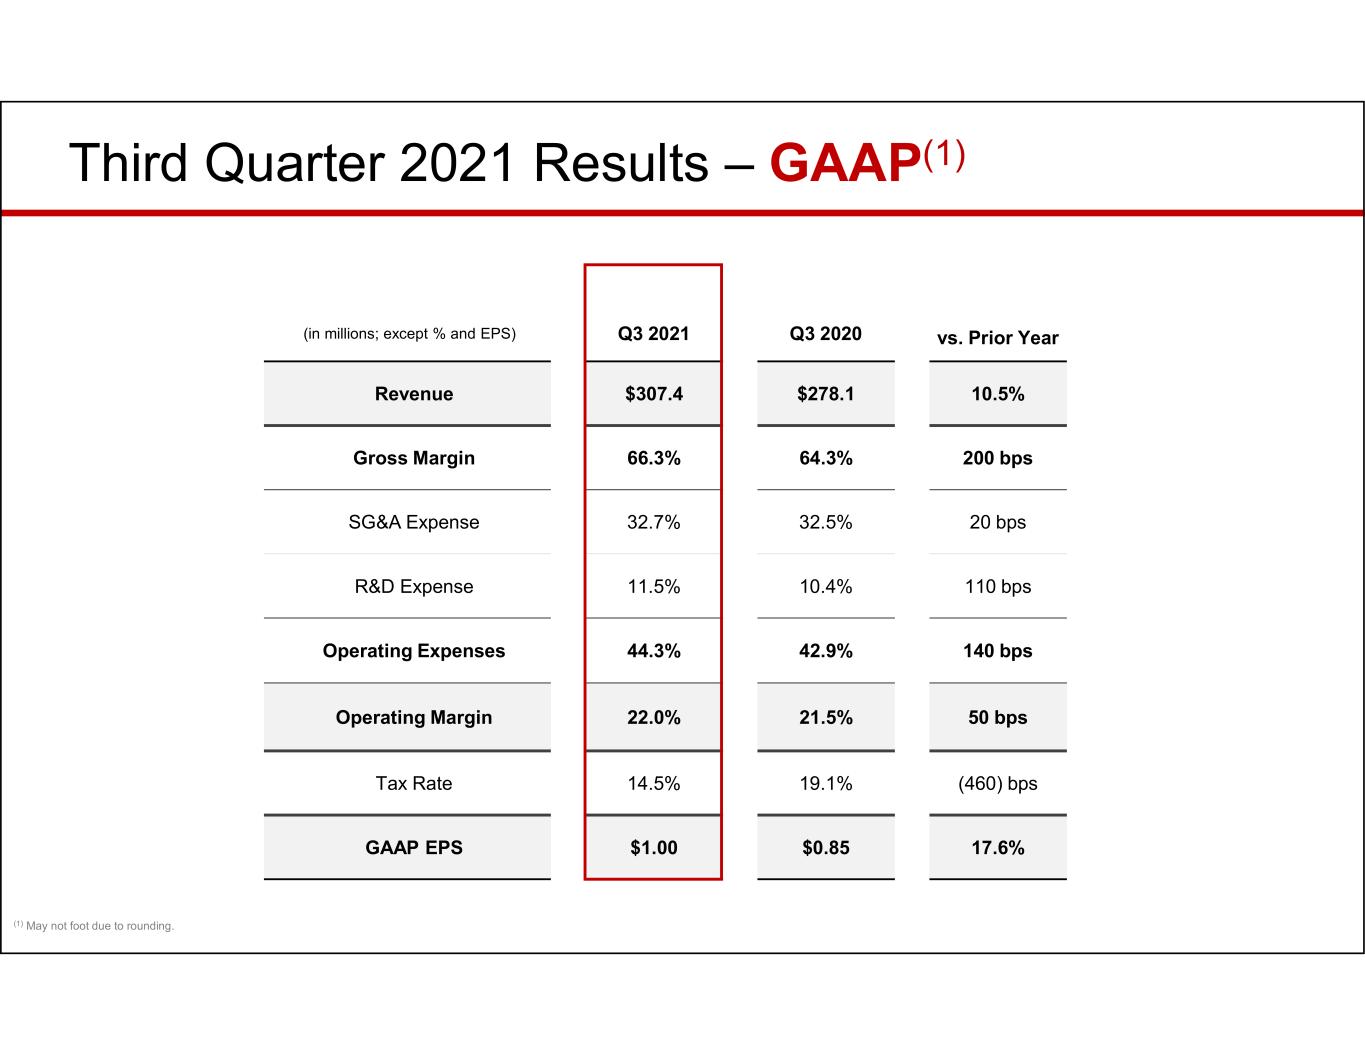
Third Quarter 2021 Results – GAAP(1) (in millions; except % and EPS) Q3 2021 Q3 2020 vs. Prior Year Revenue $307.4 $278.1 10.5% Gross Margin 66.3% 64.3% 200 bps SG&A Expense 32.7% 32.5% 20 bps R&D Expense 11.5% 10.4% 110 bps Operating Expenses 44.3% 42.9% 140 bps Operating Margin 22.0% 21.5% 50 bps Tax Rate 14.5% 19.1% (460) bps GAAP EPS $1.00 $0.85 17.6% (1) May not foot due to rounding.


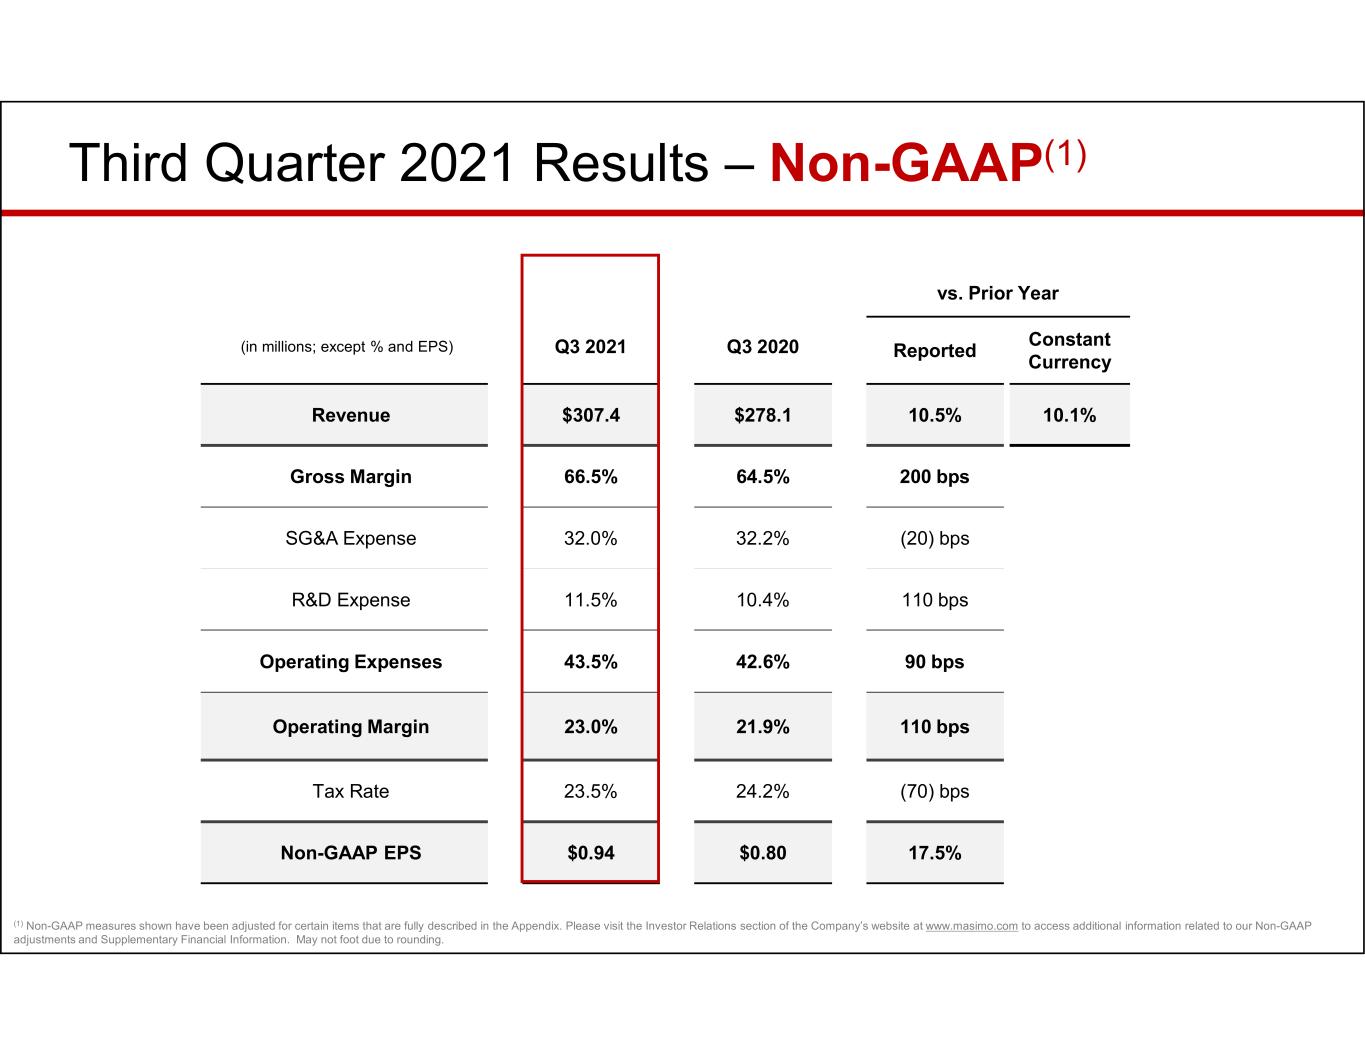
Third Quarter 2021 Results – Non-GAAP(1) vs. Prior Year (in millions; except % and EPS) Q3 2021 Q3 2020 Reported Constant Currency Revenue $307.4 $278.1 10.5% 10.1% Gross Margin 66.5% 64.5% 200 bps SG&A Expense 32.0% 32.2% (20) bps R&D Expense 11.5% 10.4% 110 bps Operating Expenses 43.5% 42.6% 90 bps Operating Margin 23.0% 21.9% 110 bps Tax Rate 23.5% 24.2% (70) bps Non-GAAP EPS $0.94 $0.80 17.5% (1) Non-GAAP measures shown have been adjusted for certain items that are fully described in the Appendix. Please visit the Investor Relations section of the Company’s website at www.masimo.com to access additional information related to our Non-GAAP adjustments and Supplementary Financial Information. May not foot due to rounding.


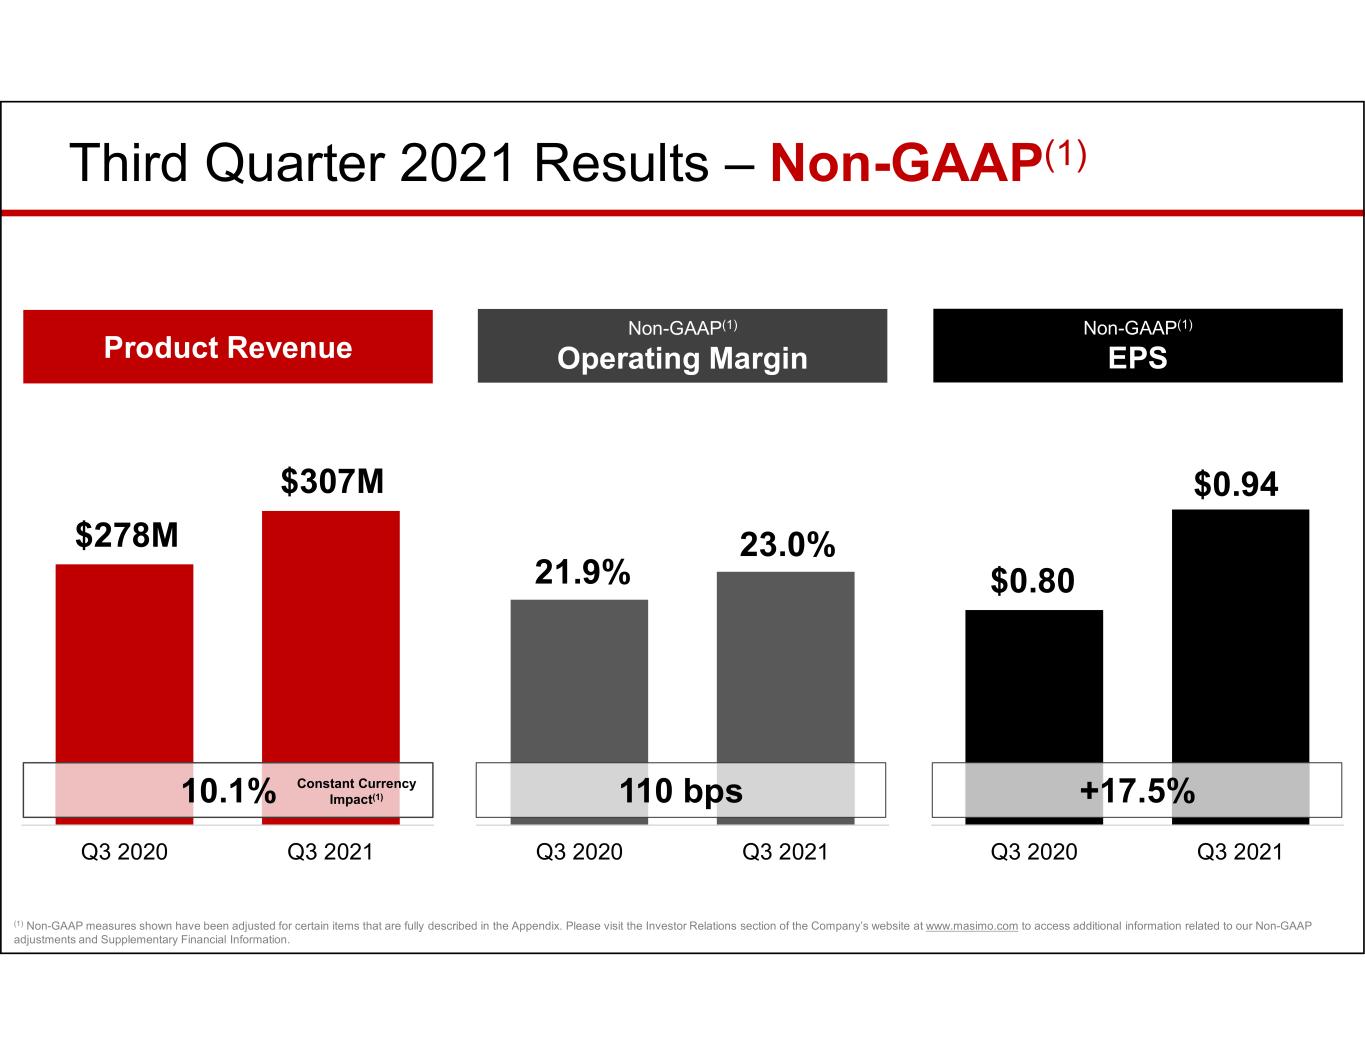
Third Quarter 2021 Results – Non-GAAP(1) Q3 2020 Q3 2021 110 bps Q3 2020 Q3 2021 Q3 2020 Q3 2021 $307M 10.1% +17.5% Non-GAAP(1) Operating MarginProduct Revenue Non-GAAP(1) EPS $278M Constant Currency Impact(1) 23.0% 21.9% $0.80 (1) Non-GAAP measures shown have been adjusted for certain items that are fully described in the Appendix. Please visit the Investor Relations section of the Company’s website at www.masimo.com to access additional information related to our Non-GAAP adjustments and Supplementary Financial Information. $0.94 $0.80


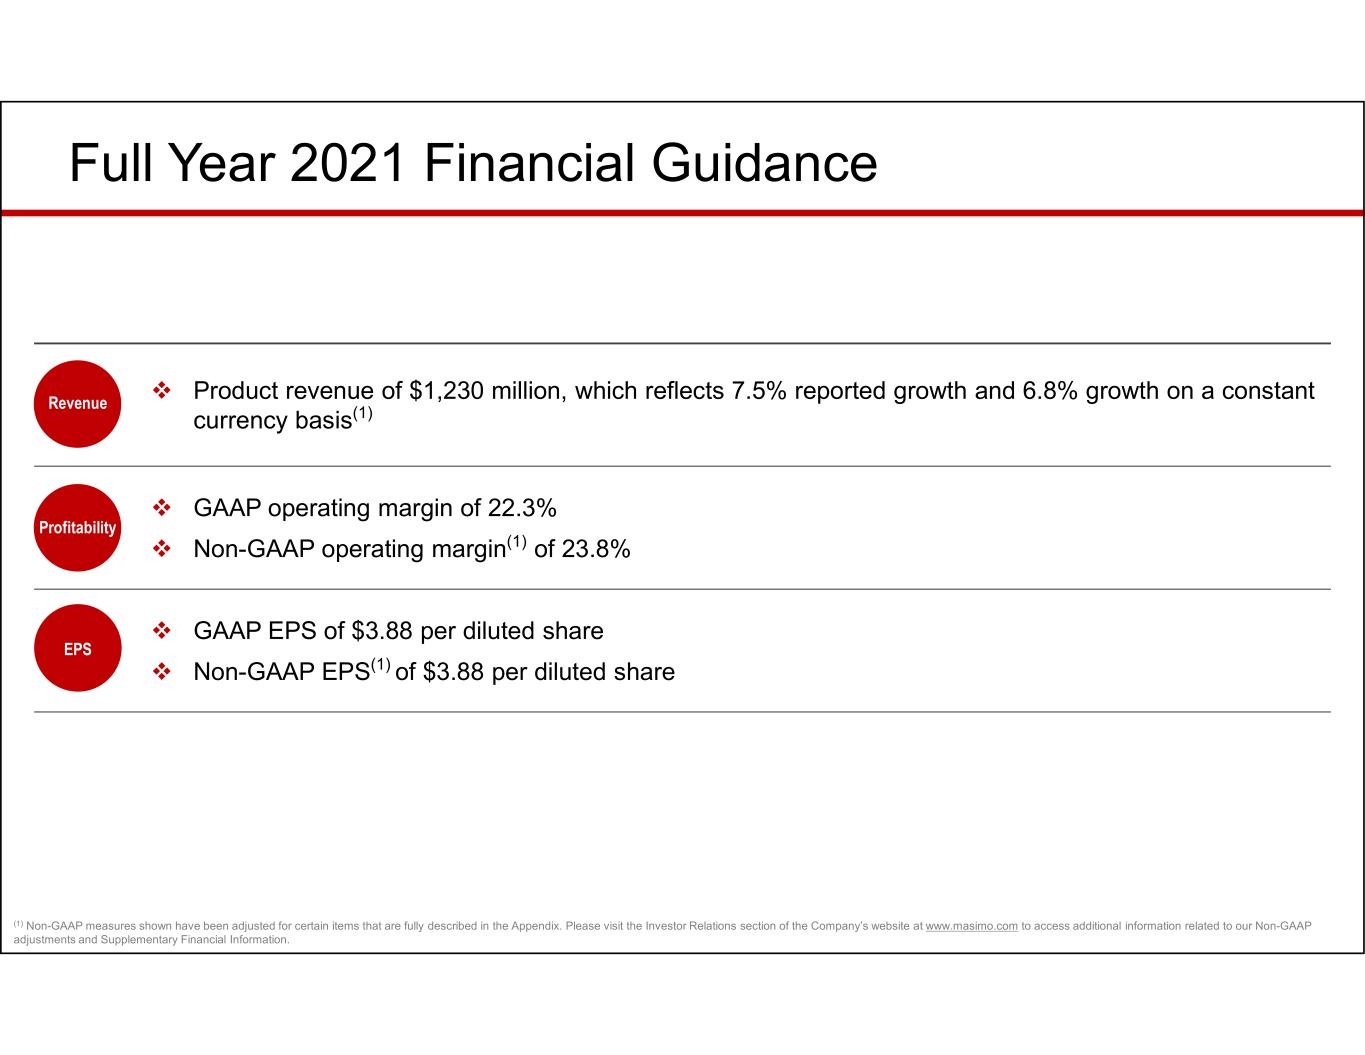
Full Year 2021 Financial Guidance  Product revenue of $1,230 million, which reflects 7.5% reported growth and 6.8% growth on a constant currency basis(1)  GAAP operating margin of 22.3%  Non-GAAP operating margin(1) of 23.8%  GAAP EPS of $3.88 per diluted share  Non-GAAP EPS(1) of $3.88 per diluted share Revenue Profitability EPS (1) Non-GAAP measures shown have been adjusted for certain items that are fully described in the Appendix. Please visit the Investor Relations section of the Company’s website at www.masimo.com to access additional information related to our Non-GAAP adjustments and Supplementary Financial Information.


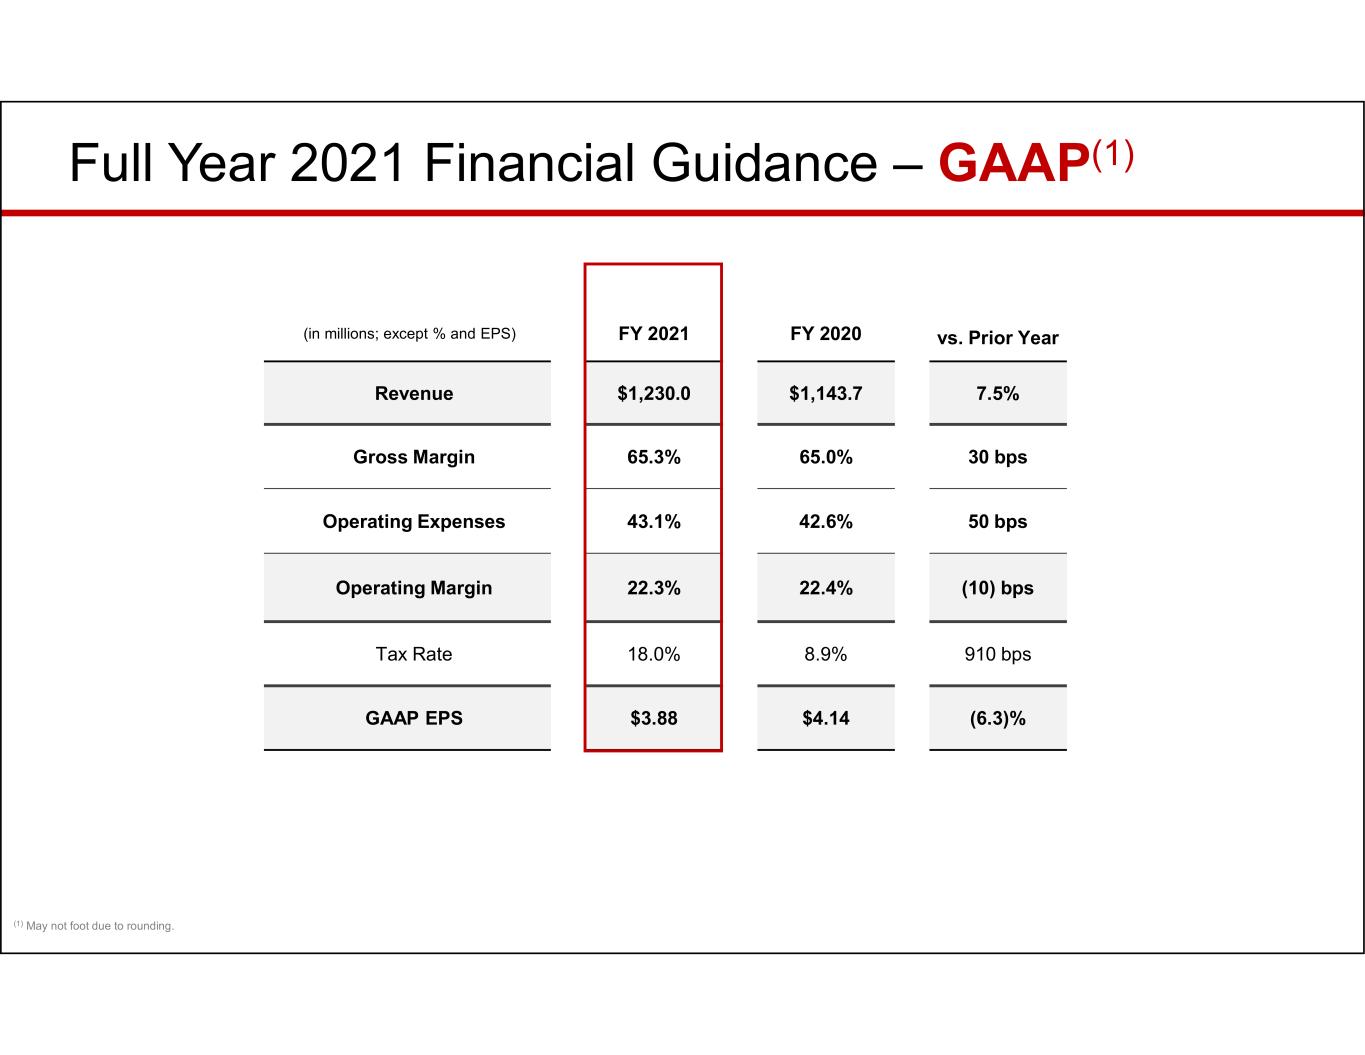
Full Year 2021 Financial Guidance – GAAP(1) (in millions; except % and EPS) FY 2021 FY 2020 vs. Prior Year Revenue $1,230.0 $1,143.7 7.5% Gross Margin 65.3% 65.0% 30 bps Operating Expenses 43.1% 42.6% 50 bps Operating Margin 22.3% 22.4% (10) bps Tax Rate 18.0% 8.9% 910 bps GAAP EPS $3.88 $4.14 (6.3)% (1) May not foot due to rounding.


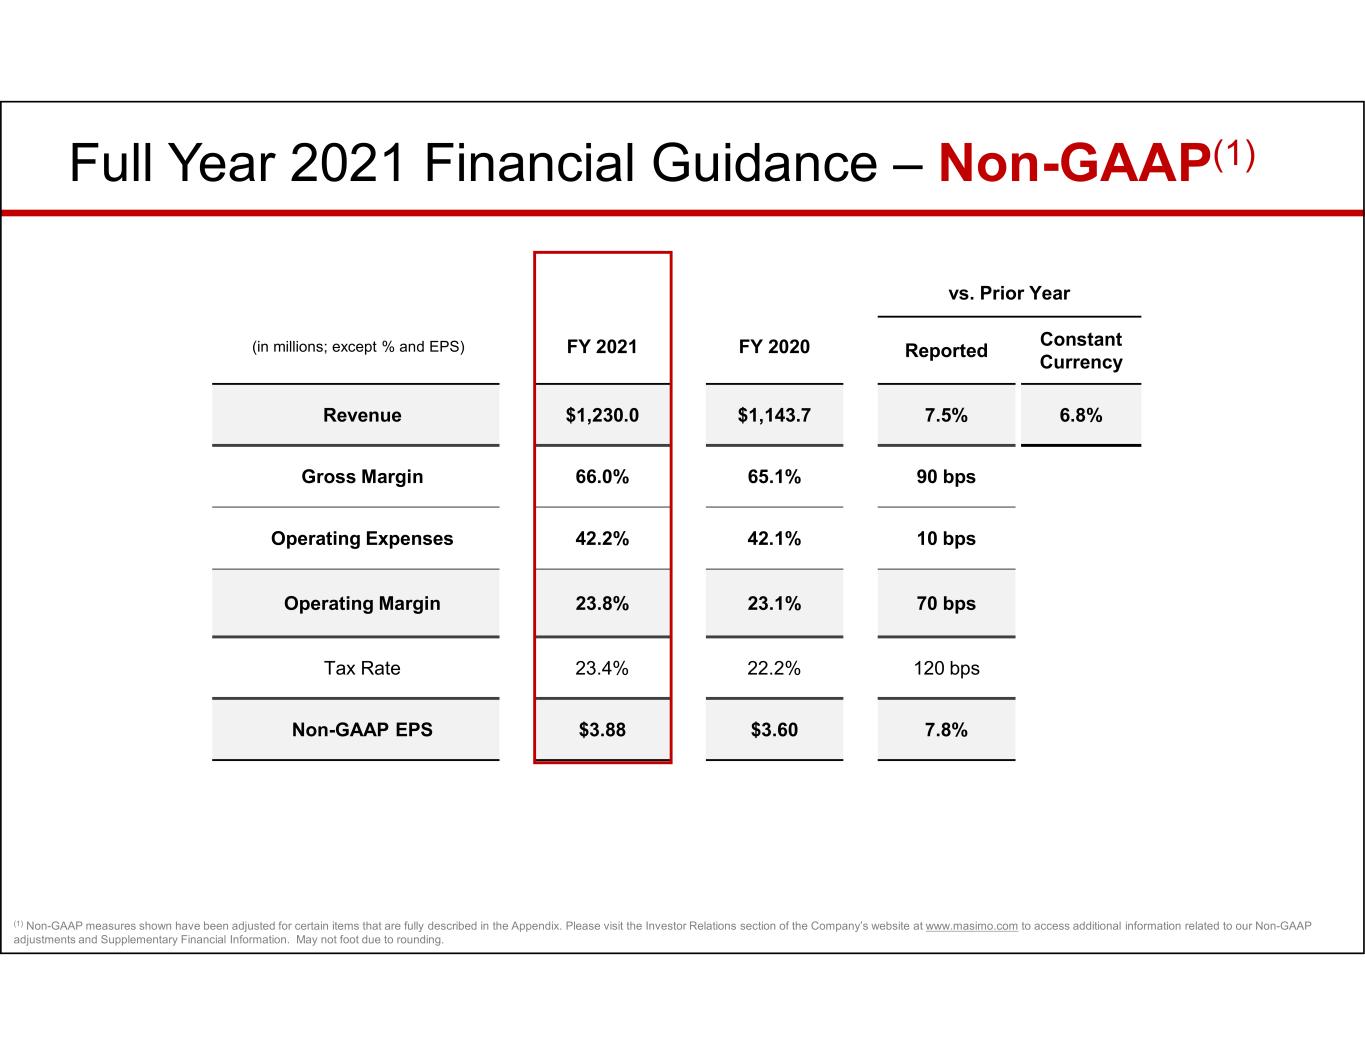
Full Year 2021 Financial Guidance – Non-GAAP(1) vs. Prior Year (in millions; except % and EPS) FY 2021 FY 2020 Reported Constant Currency Revenue $1,230.0 $1,143.7 7.5% 6.8% Gross Margin 66.0% 65.1% 90 bps Operating Expenses 42.2% 42.1% 10 bps Operating Margin 23.8% 23.1% 70 bps Tax Rate 23.4% 22.2% 120 bps Non-GAAP EPS $3.88 $3.60 7.8% (1) Non-GAAP measures shown have been adjusted for certain items that are fully described in the Appendix. Please visit the Investor Relations section of the Company’s website at www.masimo.com to access additional information related to our Non-GAAP adjustments and Supplementary Financial Information. May not foot due to rounding.


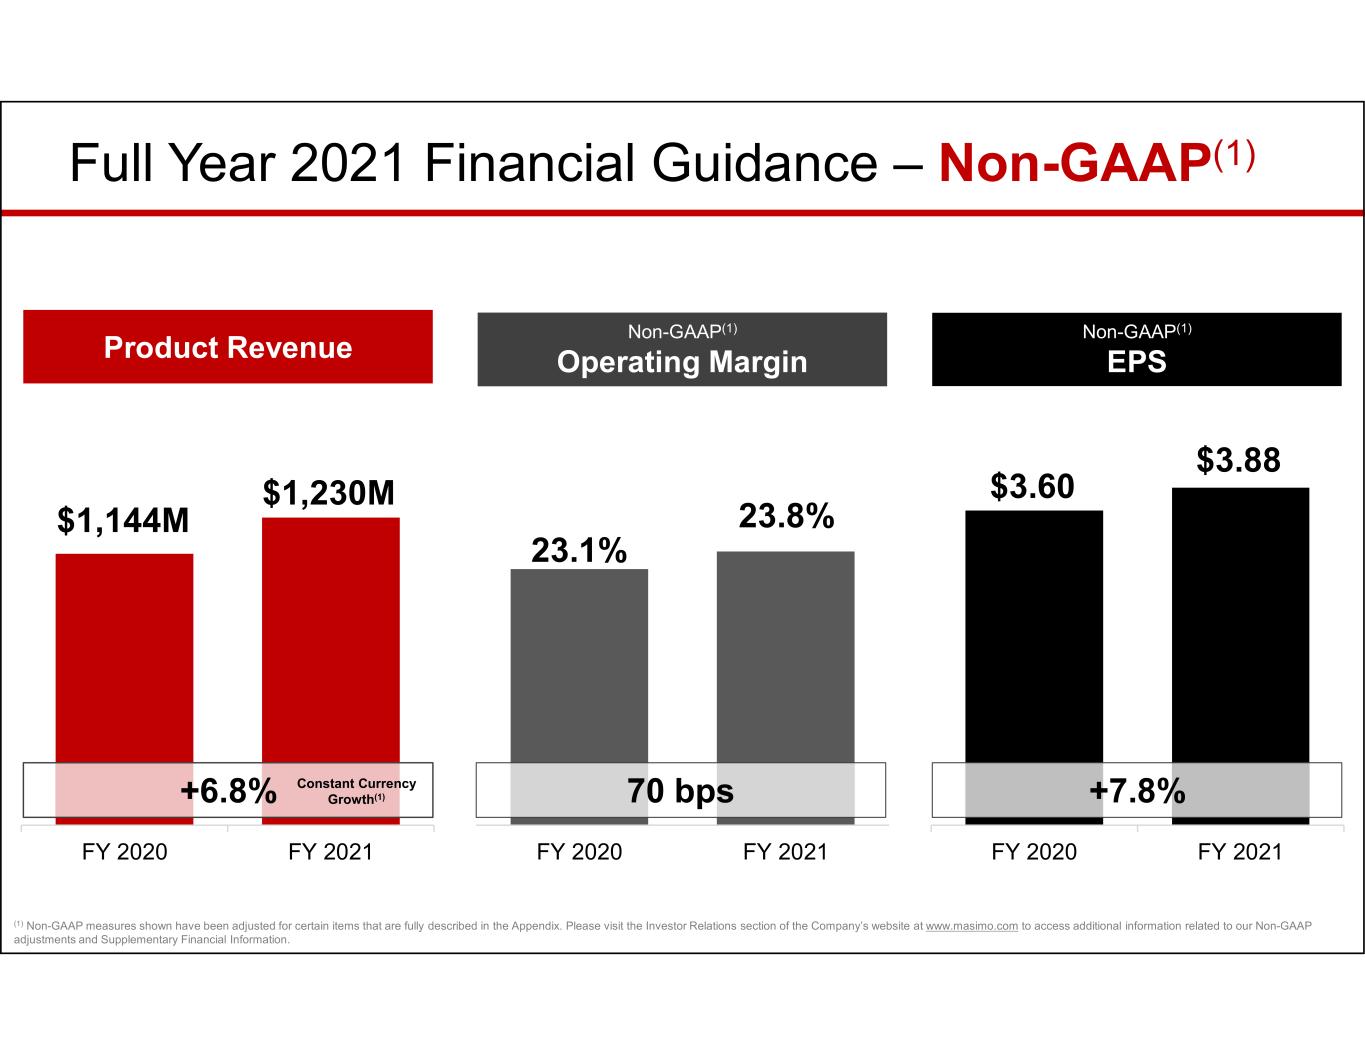
FY 2020 FY 2021 Full Year 2021 Financial Guidance – Non-GAAP(1) FY 2020 FY 2021 70 bps FY 2020 FY 2021 $1,230M +6.8% +7.8% Non-GAAP(1) Operating MarginProduct Revenue Non-GAAP(1) EPS $1,144M Constant Currency Growth(1) 23.8% 23.1% $3.88 $3.60 (1) Non-GAAP measures shown have been adjusted for certain items that are fully described in the Appendix. Please visit the Investor Relations section of the Company’s website at www.masimo.com to access additional information related to our Non-GAAP adjustments and Supplementary Financial Information.


Improving Patient Outcomes Reducing the Cost of Care® APPENDICES GAAP to Non-GAAP Adjustments and Reconciliations


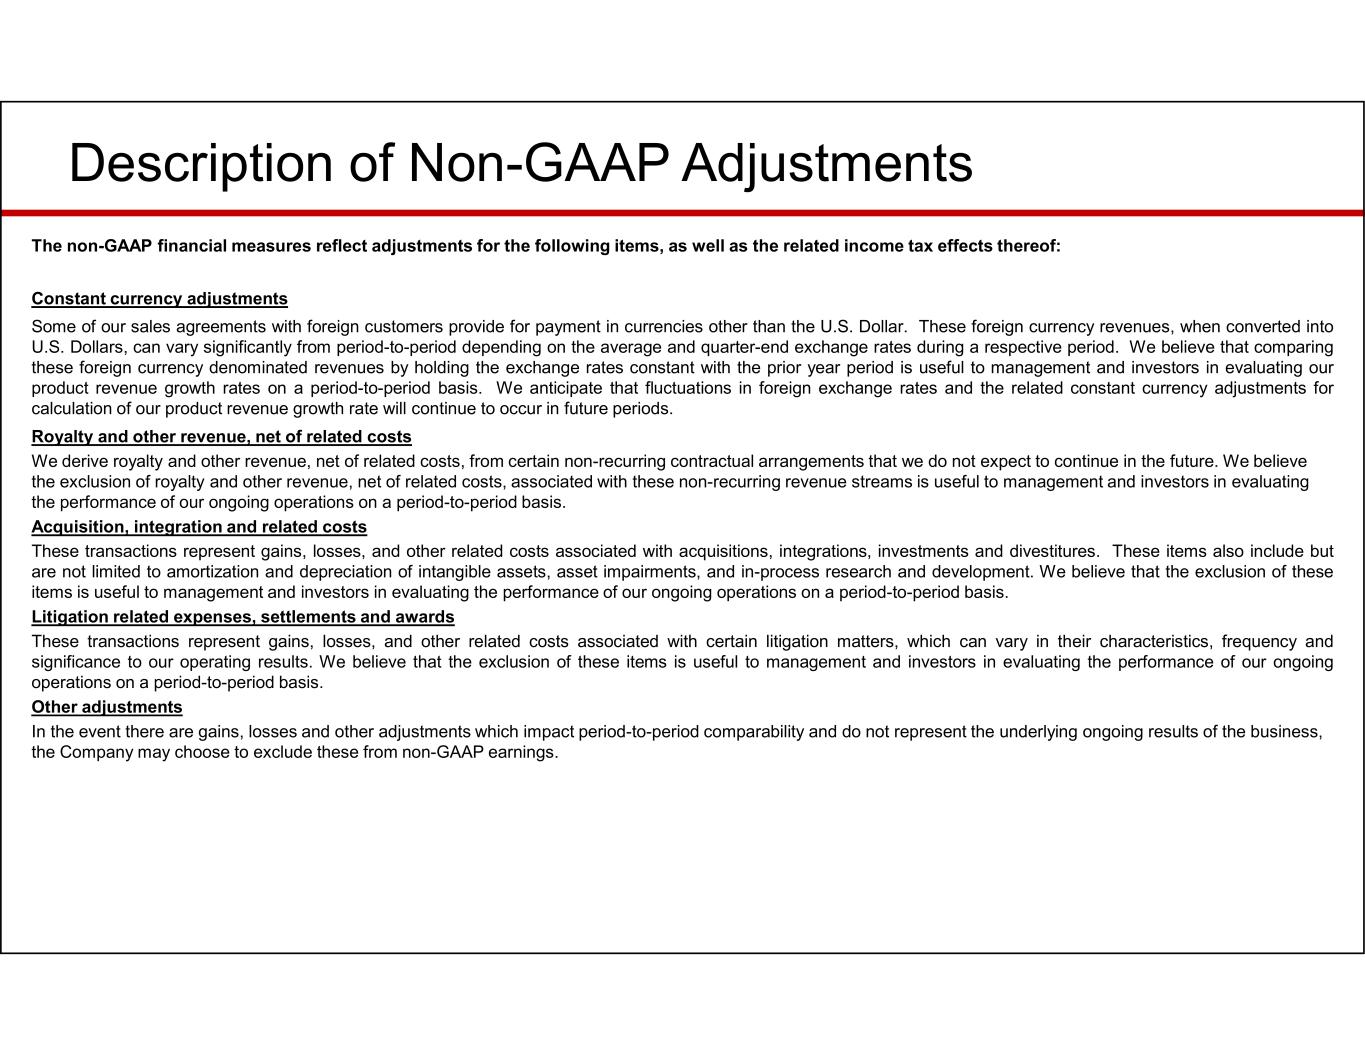
The non-GAAP financial measures reflect adjustments for the following items, as well as the related income tax effects thereof: Constant currency adjustments Some of our sales agreements with foreign customers provide for payment in currencies other than the U.S. Dollar. These foreign currency revenues, when converted into U.S. Dollars, can vary significantly from period-to-period depending on the average and quarter-end exchange rates during a respective period. We believe that comparing these foreign currency denominated revenues by holding the exchange rates constant with the prior year period is useful to management and investors in evaluating our product revenue growth rates on a period-to-period basis. We anticipate that fluctuations in foreign exchange rates and the related constant currency adjustments for calculation of our product revenue growth rate will continue to occur in future periods. Royalty and other revenue, net of related costs We derive royalty and other revenue, net of related costs, from certain non-recurring contractual arrangements that we do not expect to continue in the future. We believe the exclusion of royalty and other revenue, net of related costs, associated with these non-recurring revenue streams is useful to management and investors in evaluating the performance of our ongoing operations on a period-to-period basis. Acquisition, integration and related costs These transactions represent gains, losses, and other related costs associated with acquisitions, integrations, investments and divestitures. These items also include but are not limited to amortization and depreciation of intangible assets, asset impairments, and in-process research and development. We believe that the exclusion of these items is useful to management and investors in evaluating the performance of our ongoing operations on a period-to-period basis. Litigation related expenses, settlements and awards These transactions represent gains, losses, and other related costs associated with certain litigation matters, which can vary in their characteristics, frequency and significance to our operating results. We believe that the exclusion of these items is useful to management and investors in evaluating the performance of our ongoing operations on a period-to-period basis. Other adjustments In the event there are gains, losses and other adjustments which impact period-to-period comparability and do not represent the underlying ongoing results of the business, the Company may choose to exclude these from non-GAAP earnings. Description of Non-GAAP Adjustments


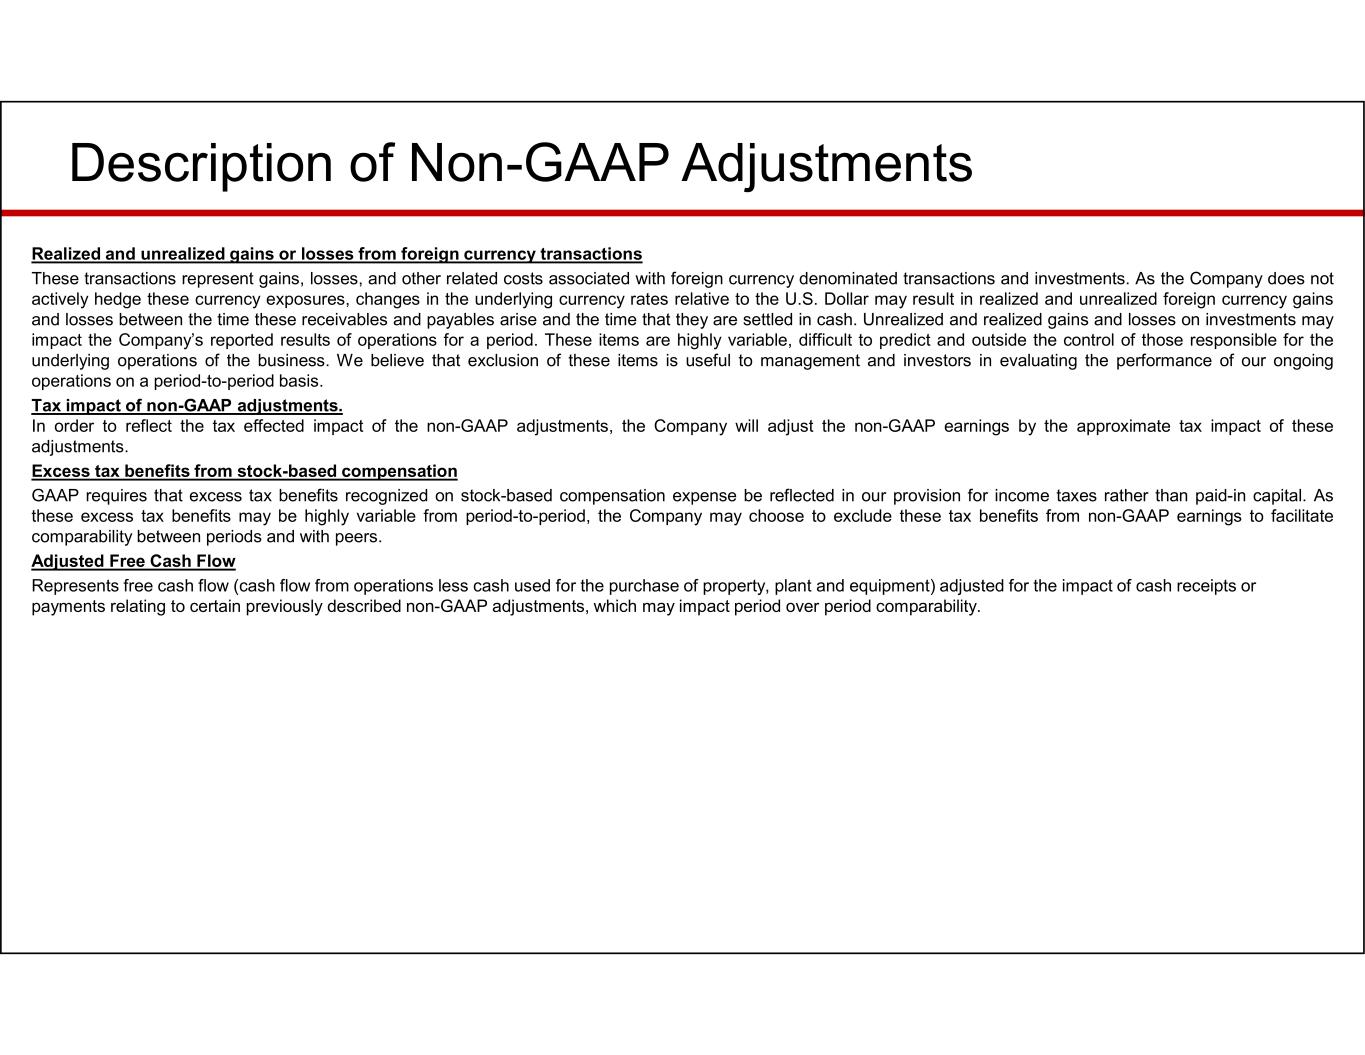
Realized and unrealized gains or losses from foreign currency transactions These transactions represent gains, losses, and other related costs associated with foreign currency denominated transactions and investments. As the Company does not actively hedge these currency exposures, changes in the underlying currency rates relative to the U.S. Dollar may result in realized and unrealized foreign currency gains and losses between the time these receivables and payables arise and the time that they are settled in cash. Unrealized and realized gains and losses on investments may impact the Company’s reported results of operations for a period. These items are highly variable, difficult to predict and outside the control of those responsible for the underlying operations of the business. We believe that exclusion of these items is useful to management and investors in evaluating the performance of our ongoing operations on a period-to-period basis. Tax impact of non-GAAP adjustments. In order to reflect the tax effected impact of the non-GAAP adjustments, the Company will adjust the non-GAAP earnings by the approximate tax impact of these adjustments. Excess tax benefits from stock-based compensation GAAP requires that excess tax benefits recognized on stock-based compensation expense be reflected in our provision for income taxes rather than paid-in capital. As these excess tax benefits may be highly variable from period-to-period, the Company may choose to exclude these tax benefits from non-GAAP earnings to facilitate comparability between periods and with peers. Adjusted Free Cash Flow Represents free cash flow (cash flow from operations less cash used for the purchase of property, plant and equipment) adjusted for the impact of cash receipts or payments relating to certain previously described non-GAAP adjustments, which may impact period over period comparability. Description of Non-GAAP Adjustments


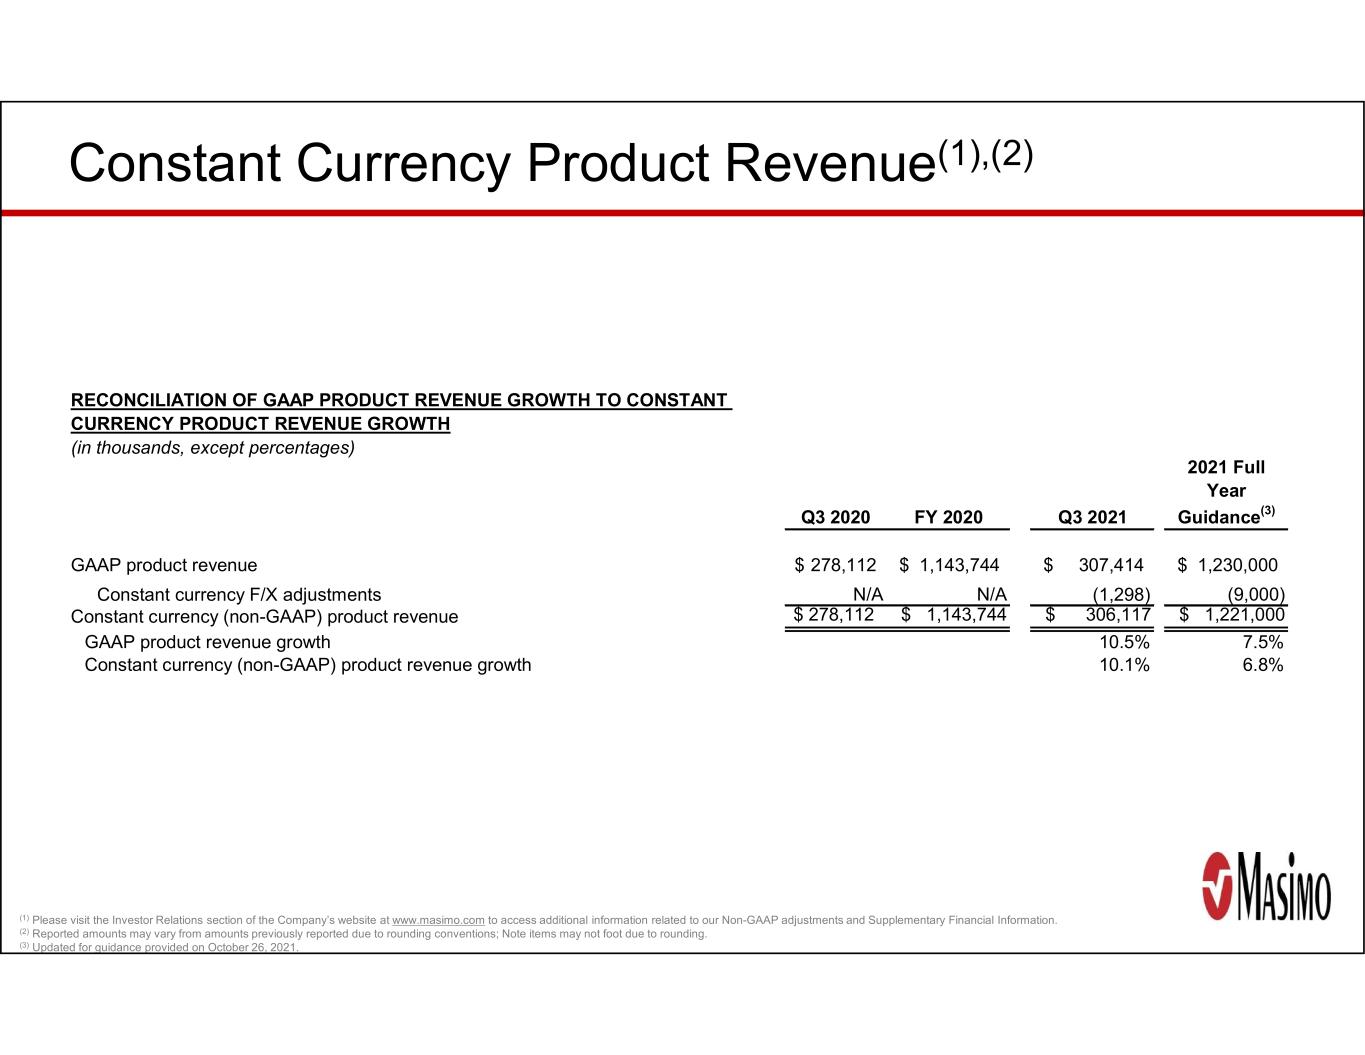
(1) Please visit the Investor Relations section of the Company’s website at www.masimo.com to access additional information related to our Non-GAAP adjustments and Supplementary Financial Information. (2) Reported amounts may vary from amounts previously reported due to rounding conventions; Note items may not foot due to rounding. (3) Updated for guidance provided on October 26, 2021. Constant Currency Product Revenue(1),(2) (in thousands, except percentages) FY 2020 Q3 2021 278,112$ 1,143,744$ 307,414$ 1,230,000$ Constant currency F/X adjustments N/A N/A (1,298) (9,000) Constant currency (non-GAAP) product revenue $ 278,112 $ 1,143,744 $ 306,117 $ 1,221,000 GAAP product revenue growth 10.5% 7.5% Constant currency (non-GAAP) product revenue growth 10.1% 6.8% Q3 2020 2021 Full Year Guidance(3) GAAP product revenue RECONCILIATION OF GAAP PRODUCT REVENUE GROWTH TO CONSTANT CURRENCY PRODUCT REVENUE GROWTH


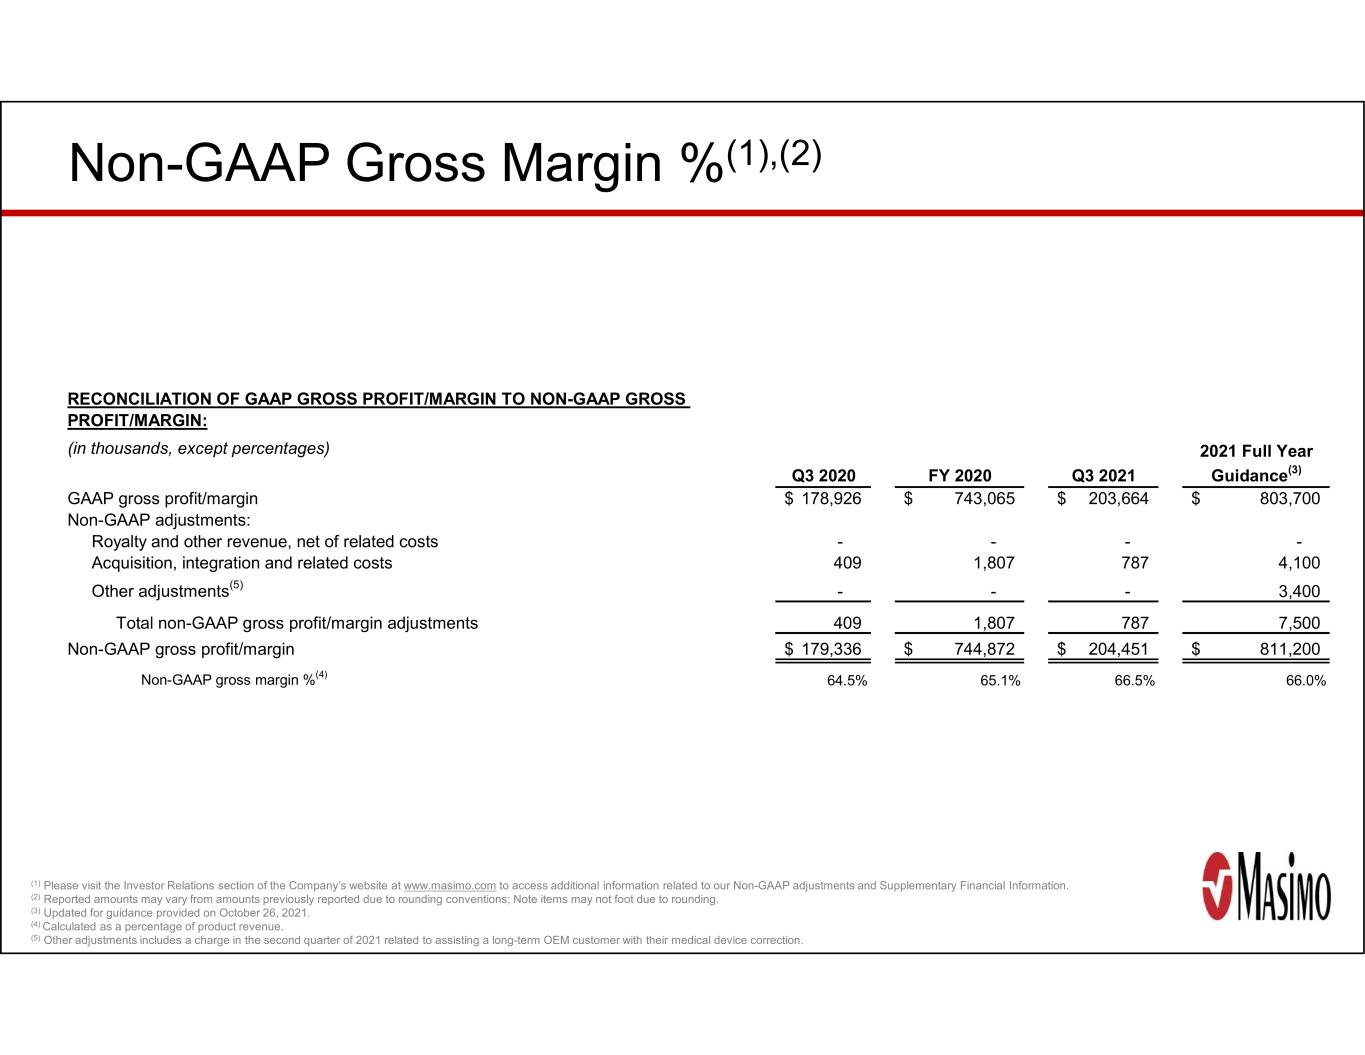
(1) Please visit the Investor Relations section of the Company’s website at www.masimo.com to access additional information related to our Non-GAAP adjustments and Supplementary Financial Information. (2) Reported amounts may vary from amounts previously reported due to rounding conventions; Note items may not foot due to rounding. (3) Updated for guidance provided on October 26, 2021. (4) Calculated as a percentage of product revenue. (5) Other adjustments includes a charge in the second quarter of 2021 related to assisting a long-term OEM customer with their medical device correction. Non-GAAP Gross Margin %(1),(2) (in thousands, except percentages) Q3 2020 FY 2020 Q3 2021 GAAP gross profit/margin 178,926$ 743,065$ 203,664$ 803,700$ Non-GAAP adjustments: Royalty and other revenue, net of related costs - - - - Acquisition, integration and related costs 409 1,807 787 4,100 Other adjustments(5) - - - 3,400 Total non-GAAP gross profit/margin adjustments 409 1,807 787 7,500 Non-GAAP gross profit/margin 179,336$ 744,872$ 204,451$ 811,200$ Non-GAAP gross margin %(4) 64.5% 65.1% 66.5% 66.0% RECONCILIATION OF GAAP GROSS PROFIT/MARGIN TO NON-GAAP GROSS PROFIT/MARGIN: 2021 Full Year Guidance(3)


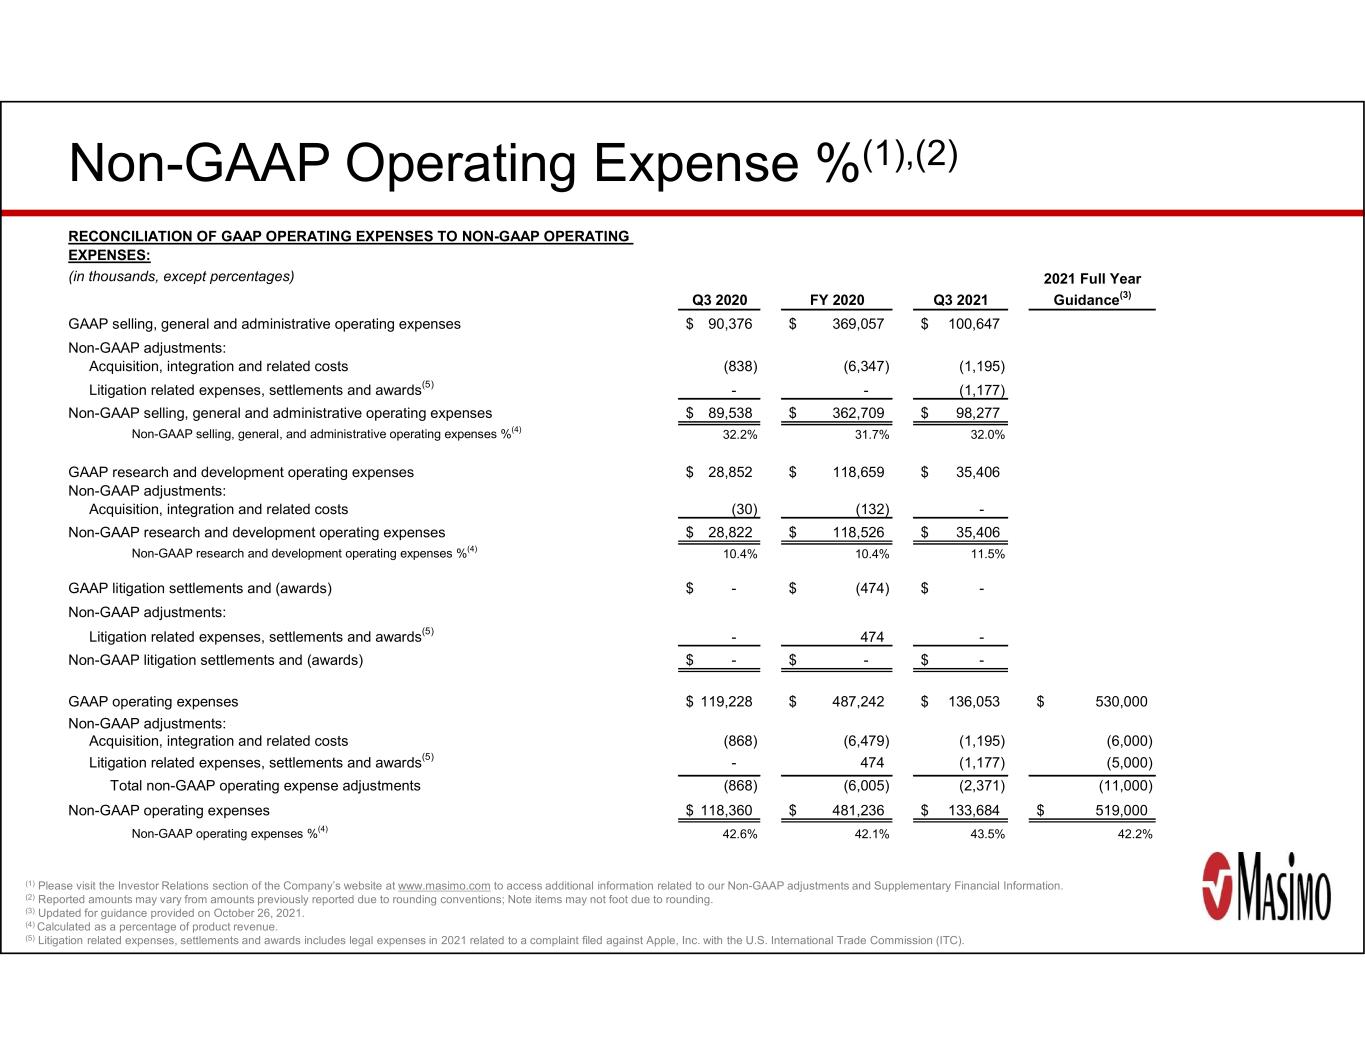
(1) Please visit the Investor Relations section of the Company’s website at www.masimo.com to access additional information related to our Non-GAAP adjustments and Supplementary Financial Information. (2) Reported amounts may vary from amounts previously reported due to rounding conventions; Note items may not foot due to rounding. (3) Updated for guidance provided on October 26, 2021. (4) Calculated as a percentage of product revenue. (5) Litigation related expenses, settlements and awards includes legal expenses in 2021 related to a complaint filed against Apple, Inc. with the U.S. International Trade Commission (ITC). Non-GAAP Operating Expense %(1),(2) (in thousands, except percentages) Q3 2020 FY 2020 Q3 2021 GAAP selling, general and administrative operating expenses 90,376$ 369,057$ 100,647$ Non-GAAP adjustments: Acquisition, integration and related costs (838) (6,347) (1,195) Litigation related expenses, settlements and awards(5) - - (1,177) Non-GAAP selling, general and administrative operating expenses 89,538$ 362,709$ 98,277$ Non-GAAP selling, general, and administrative operating expenses %(4) 32.2% 31.7% 32.0% GAAP research and development operating expenses 28,852$ 118,659$ 35,406$ Non-GAAP adjustments: Acquisition, integration and related costs (30) (132) - Non-GAAP research and development operating expenses 28,822$ 118,526$ 35,406$ Non-GAAP research and development operating expenses %(4) 10.4% 10.4% 11.5% GAAP litigation settlements and (awards) -$ (474)$ -$ Non-GAAP adjustments: Litigation related expenses, settlements and awards(5) - 474 - Non-GAAP litigation settlements and (awards) -$ -$ -$ GAAP operating expenses 119,228$ 487,242$ 136,053$ 530,000$ Non-GAAP adjustments: Acquisition, integration and related costs (868) (6,479) (1,195) (6,000) Litigation related expenses, settlements and awards(5) - 474 (1,177) (5,000) Total non-GAAP operating expense adjustments (868) (6,005) (2,371) (11,000) Non-GAAP operating expenses 118,360$ 481,236$ 133,684$ 519,000$ Non-GAAP operating expenses %(4) 42.6% 42.1% 43.5% 42.2% RECONCILIATION OF GAAP OPERATING EXPENSES TO NON-GAAP OPERATING EXPENSES: 2021 Full Year Guidance(3)


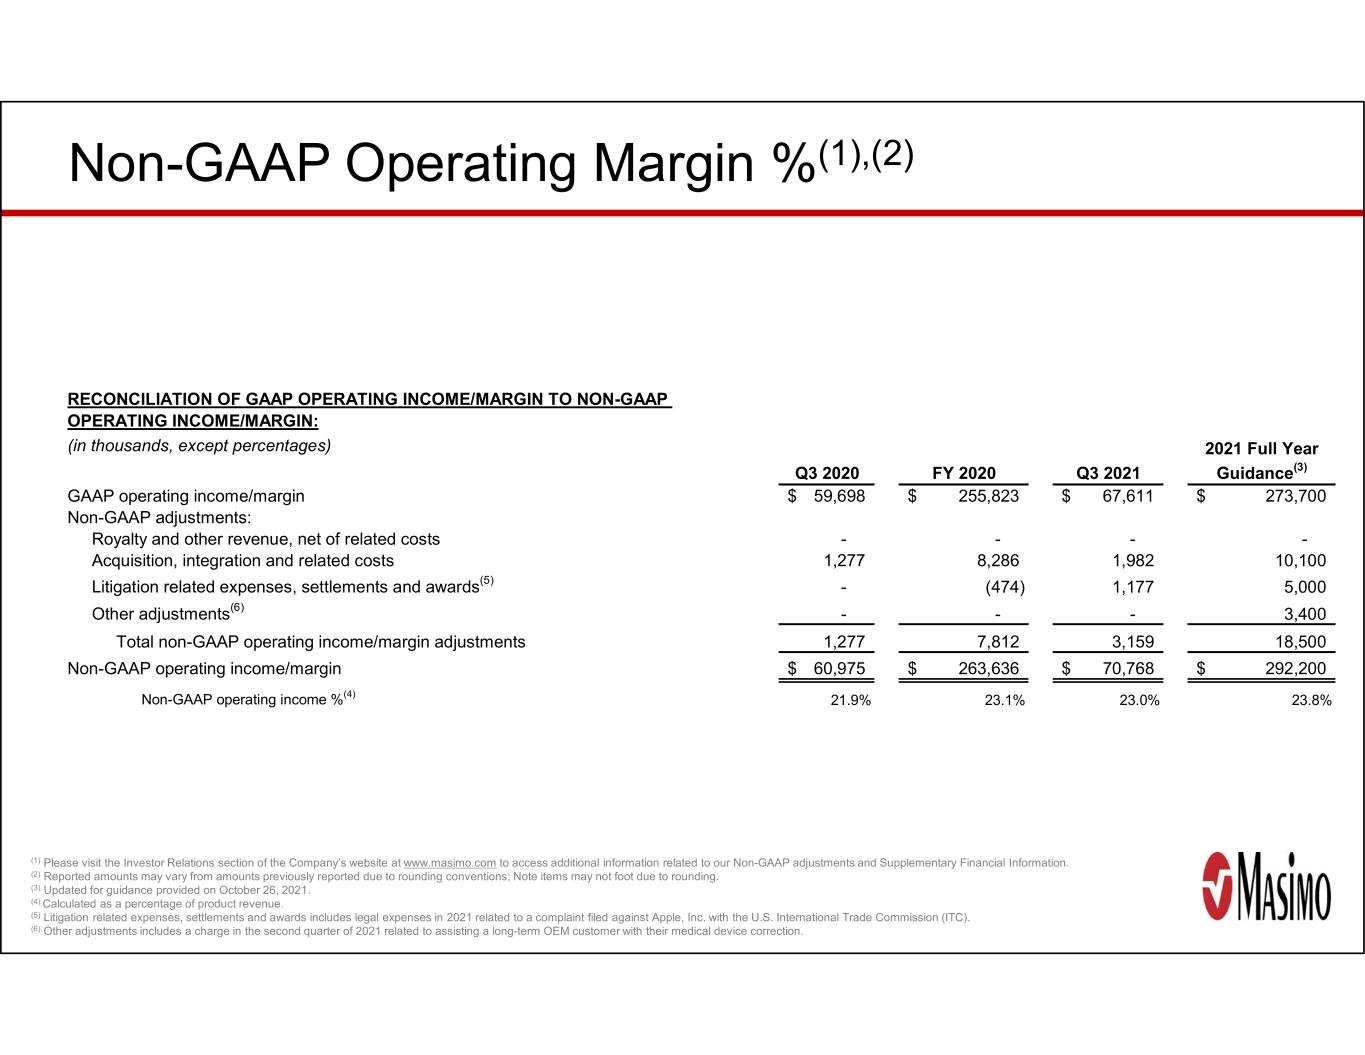
Non-GAAP Operating Margin %(1),(2) (1) Please visit the Investor Relations section of the Company’s website at www.masimo.com to access additional information related to our Non-GAAP adjustments and Supplementary Financial Information. (2) Reported amounts may vary from amounts previously reported due to rounding conventions; Note items may not foot due to rounding. (3) Updated for guidance provided on October 26, 2021. (4) Calculated as a percentage of product revenue. (5) Litigation related expenses, settlements and awards includes legal expenses in 2021 related to a complaint filed against Apple, Inc. with the U.S. International Trade Commission (ITC). (6) Other adjustments includes a charge in the second quarter of 2021 related to assisting a long-term OEM customer with their medical device correction. (in thousands, except percentages) Q3 2020 FY 2020 Q3 2021 GAAP operating income/margin 59,698$ 255,823$ 67,611$ 273,700$ Non-GAAP adjustments: Royalty and other revenue, net of related costs - - - - Acquisition, integration and related costs 1,277 8,286 1,982 10,100 Litigation related expenses, settlements and awards(5) - (474) 1,177 5,000 Other adjustments(6) - - - 3,400 Total non-GAAP operating income/margin adjustments 1,277 7,812 3,159 18,500 Non-GAAP operating income/margin 60,975$ 263,636$ 70,768$ 292,200$ Non-GAAP operating income %(4) 21.9% 23.1% 23.0% 23.8% 2021 Full Year Guidance(3) RECONCILIATION OF GAAP OPERATING INCOME/MARGIN TO NON-GAAP OPERATING INCOME/MARGIN:


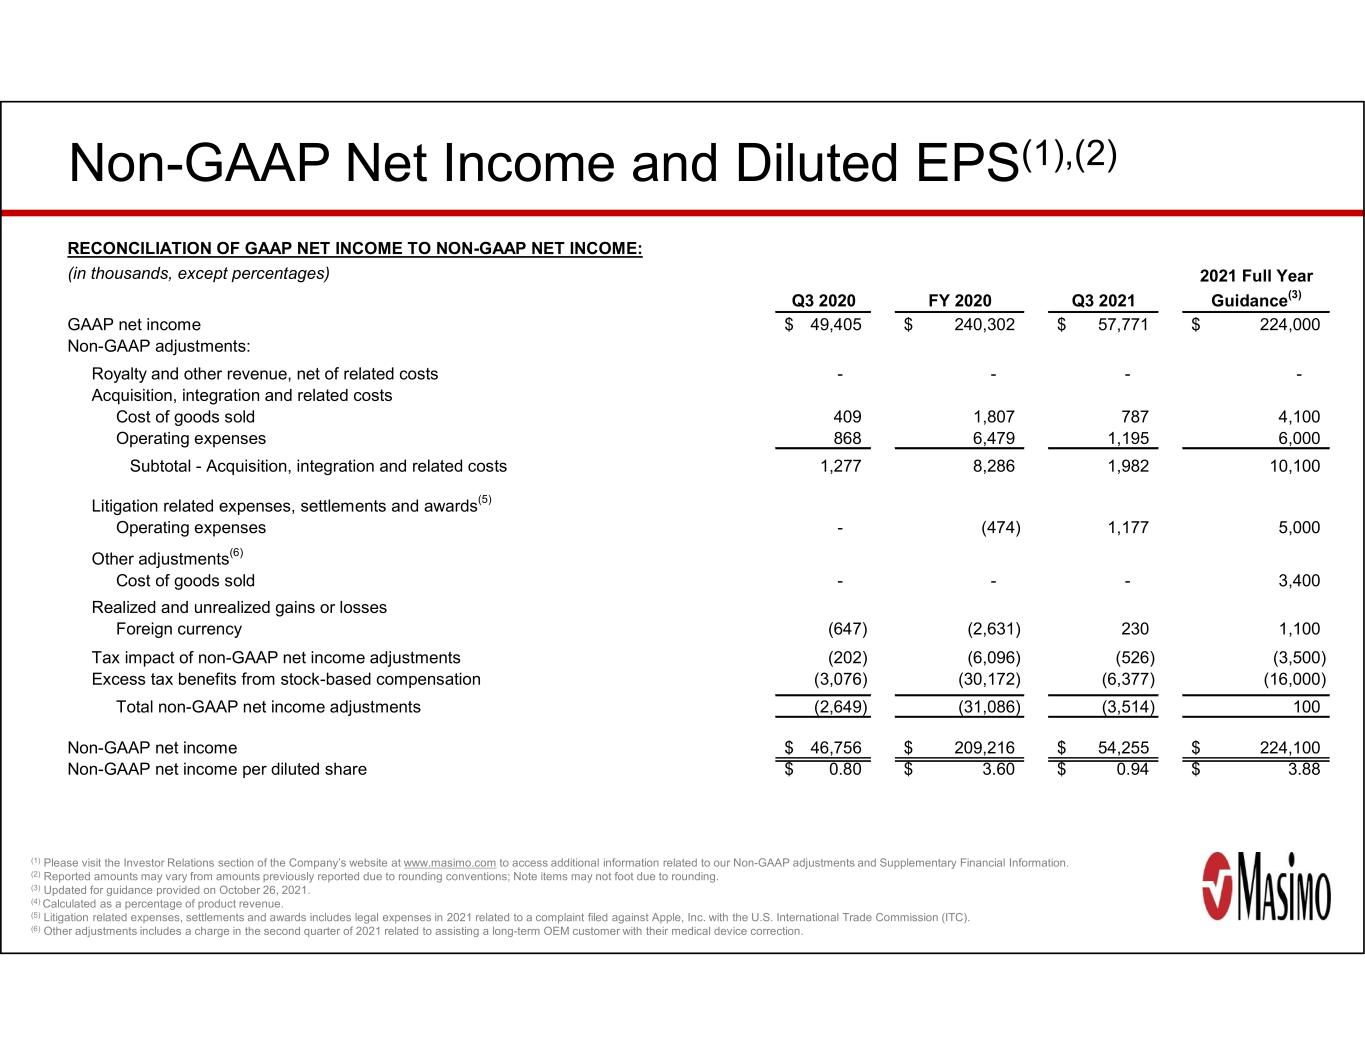
Non-GAAP Net Income and Diluted EPS(1),(2) (1) Please visit the Investor Relations section of the Company’s website at www.masimo.com to access additional information related to our Non-GAAP adjustments and Supplementary Financial Information. (2) Reported amounts may vary from amounts previously reported due to rounding conventions; Note items may not foot due to rounding. (3) Updated for guidance provided on October 26, 2021. (4) Calculated as a percentage of product revenue. (5) Litigation related expenses, settlements and awards includes legal expenses in 2021 related to a complaint filed against Apple, Inc. with the U.S. International Trade Commission (ITC). (6) Other adjustments includes a charge in the second quarter of 2021 related to assisting a long-term OEM customer with their medical device correction. (in thousands, except percentages) Q3 2020 FY 2020 Q3 2021 GAAP net income 49,405$ 240,302$ 57,771$ 224,000$ Non-GAAP adjustments: Royalty and other revenue, net of related costs - - - - Acquisition, integration and related costs Cost of goods sold 409 1,807 787 4,100 Operating expenses 868 6,479 1,195 6,000 Subtotal - Acquisition, integration and related costs 1,277 8,286 1,982 10,100 Litigation related expenses, settlements and awards(5) Operating expenses - (474) 1,177 5,000 Other adjustments(6) Cost of goods sold - - - 3,400 Realized and unrealized gains or losses Foreign currency (647) (2,631) 230 1,100 ## Tax impact of non-GAAP net income adjustments (202) (6,096) (526) (3,500) 9800Excess tax benefits from stock-based compensation (3,076) (30,172) (6,377) (16,000) Total non-GAAP net income adjustments (2,649) (31,086) (3,514) 100 Non-GAAP net income 46,756$ 209,216$ 54,255$ 224,100$ Non-GAAP net income per diluted share 0.80$ 3.60$ 0.94$ 3.88$ RECONCILIATION OF GAAP NET INCOME TO NON-GAAP NET INCOME: 2021 Full Year Guidance(3)


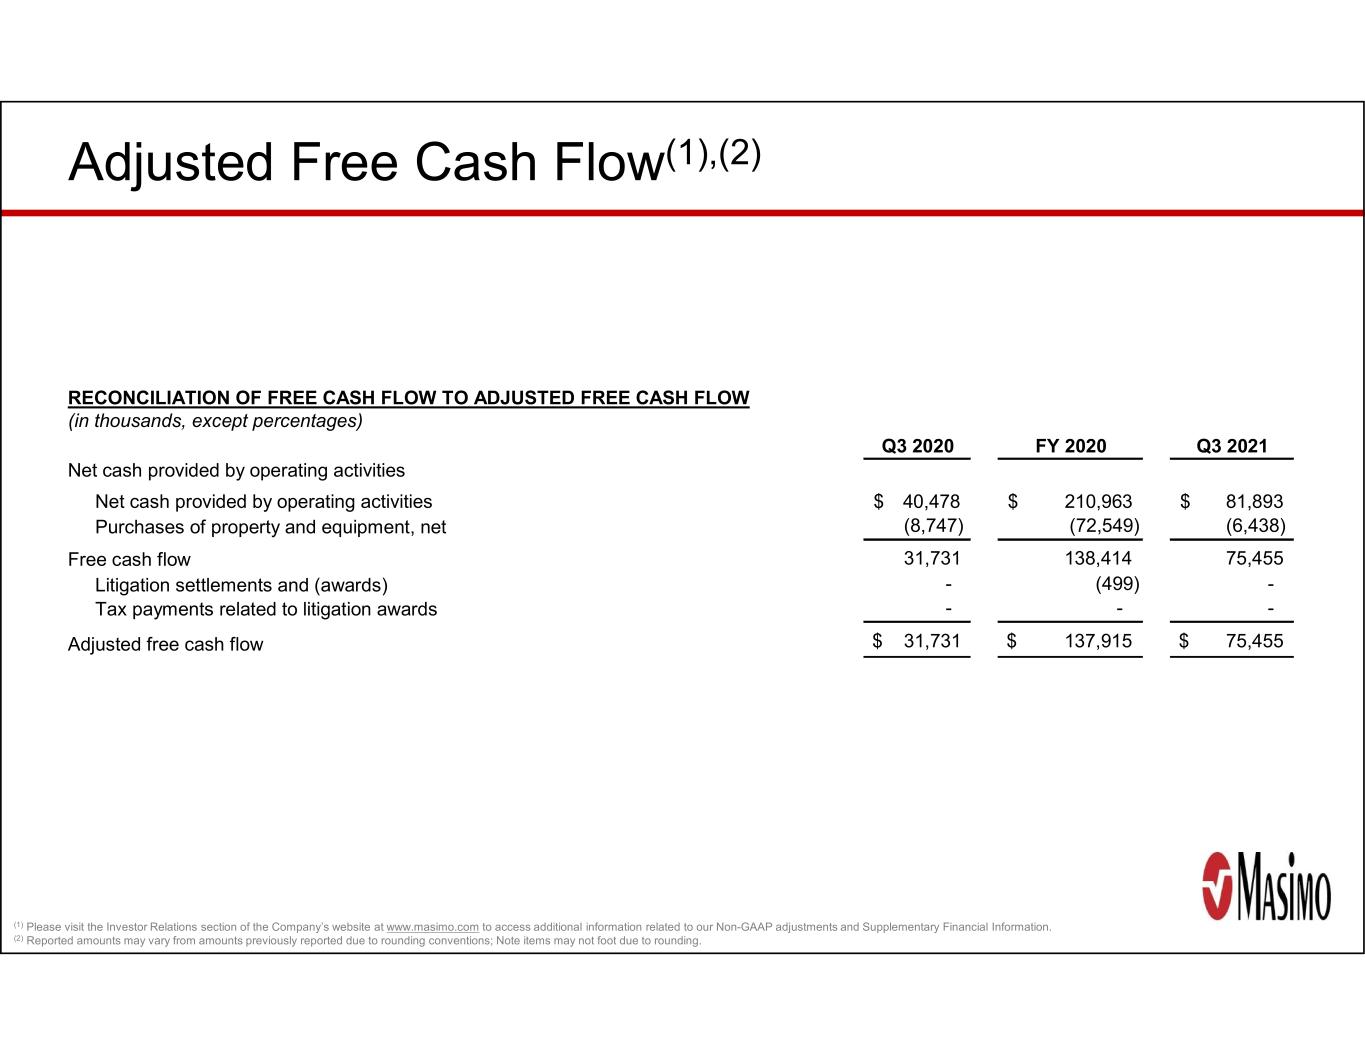
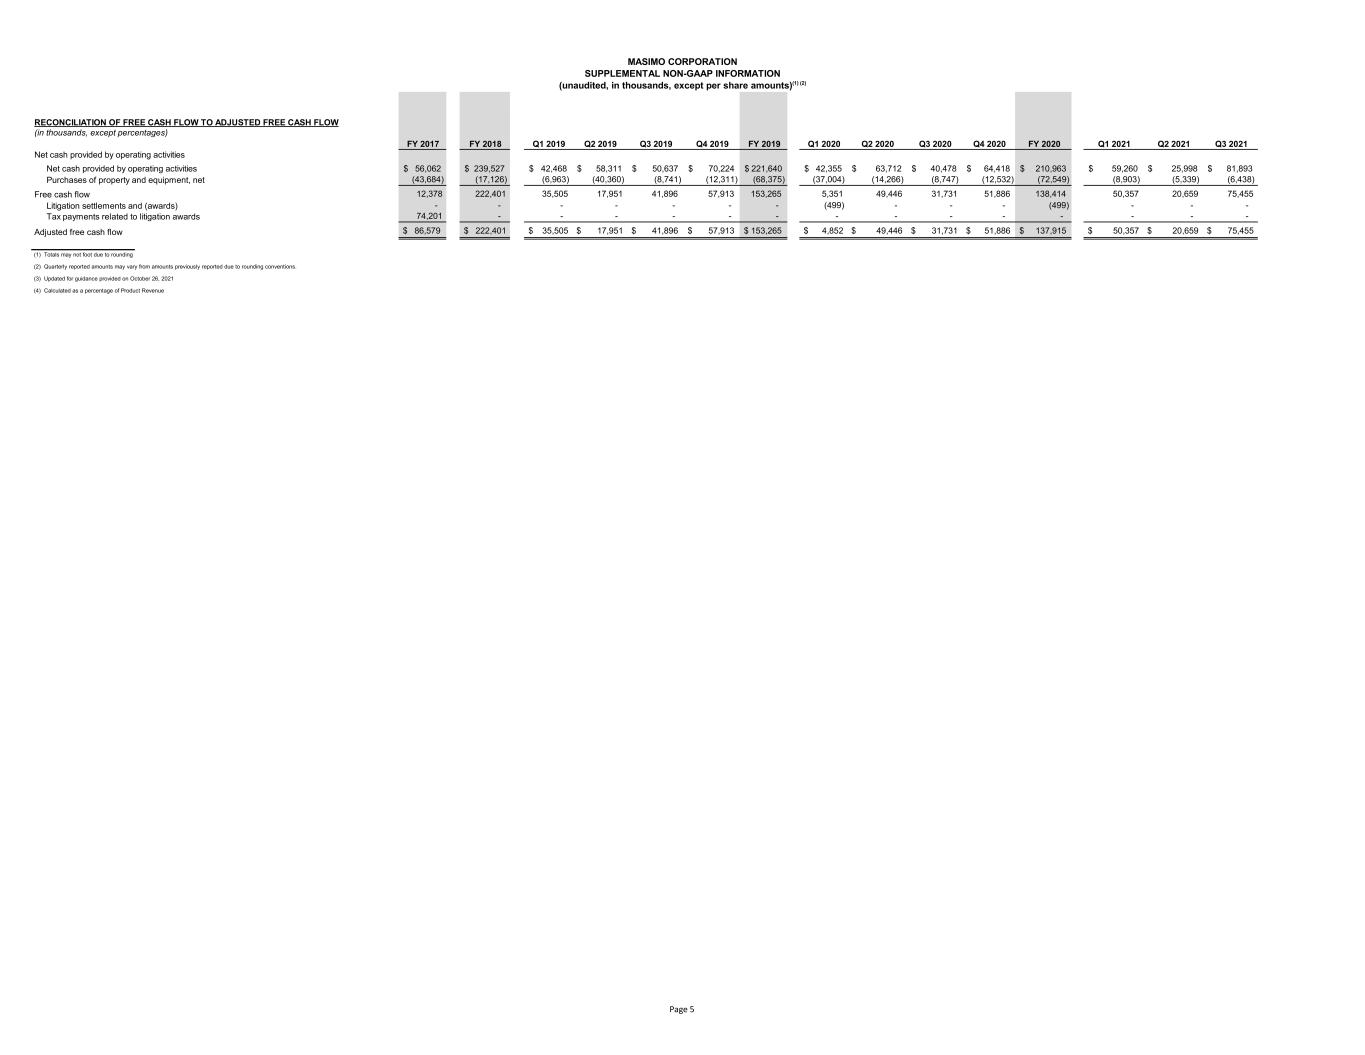
(1) Please visit the Investor Relations section of the Company’s website at www.masimo.com to access additional information related to our Non-GAAP adjustments and Supplementary Financial Information. (2) Reported amounts may vary from amounts previously reported due to rounding conventions; Note items may not foot due to rounding. Adjusted Free Cash Flow(1),(2) (in thousands, except percentages) Q3 2020 FY 2020 Q3 2021 Net cash provided by operating activities 40,478$ 210,963$ 81,893$ Purchases of property and equipment, net (8,747) (72,549) (6,438) Free cash flow 31,731 138,414 75,455 - (499) - Tax payments related to litigation awards - - - Adjusted free cash flow $ 31,731 $ 137,915 $ 75,455 RECONCILIATION OF FREE CASH FLOW TO ADJUSTED FREE CASH FLOW Net cash provided by operating activities Litigation settlements and (awards)


MASIMO CORPORATION SUPPLEMENTAL NON-GAAP INFORMATION (unaudited, in thousands, except per share amounts)(1) (2) All statements other than statements of historical facts included in this Supplemental Non-GAAP information that address activities, events or developments that we expect, believe or anticipate will or may occur in the future are forward-looking statements including, in particular, the statements about our expectations for full fiscal year GAAP and non-GAAP 2021 total revenue, product revenue, royalty and other revenues, gross profit/margin, selling, general and administrative operating expenses, research and development operating expenses, litigation settlement, award and/or defense costs, operating expenses, operating income/margin, net income, diluted earnings per share, non-operating income, provision for income taxes, adjusted free cash flow; our long-term outlook; demand for our products; anticipated revenue and earnings growth; our financial condition, results of operations and business generally; expectations regarding our ability to design and deliver innovative new noninvasive technologies and reduce the cost of care; and demand for our technologies. These forward-looking statements are based on management’s current expectations and beliefs and are subject to uncertainties and factors, all of which are difficult to predict and many of which are beyond our control and could cause actual results to differ materially and adversely from those described in the forward-looking statements. These risks include, but are not limited to, those related to: our dependence on Masimo SET® and Masimo rainbow SET™ products and technologies for substantially all of our revenue; any failure in protecting our intellectual property exposure to competitors’ assertions of intellectual property claims; the highly competitive nature of the markets in which we sell our products and technologies; any failure to continue developing innovative products and technologies; the lack of acceptance of any of our current or future products and technologies; obtaining regulatory approval of our current and future products and technologies; the risk that the implementation of our international realignment will not continue to produce anticipated operational and financial benefits, including a continued lower effective tax rate; the loss of our customers; the failure to retain and recruit senior management; product liability claims exposure; a failure to obtain expected returns from the amount of intangible assets we have recorded; the maintenance of our brand; the amount and type of equity awards that we may grant to employees and service providers in the future; our ongoing litigation and related matters; and other factors discussed in the “Risk Factors” section of our most recent periodic reports filed with the Securities and Exchange Commission (“SEC”), including our most recent Form 10-K and Form 10-Q, all of which you may obtain for free on the SEC’s website at www.sec.gov. Although we believe that the expectations reflected in our forward-looking statements are reasonable, we do not know whether our expectations will prove correct. You are cautioned not to place undue reliance on these forward-looking statements, which speak only as of the date hereof, even if subsequently made available by us on our website or otherwise. We do not undertake any obligation to update, amend or clarify these forward-looking statements, whether as a result of new information, future events or otherwise, except as may be required under applicable securities laws. For additional information related to the definitions of our Non-GAAP measures, please visit the Investor Relations section of the Company's website at www.masimo.com. Page 1


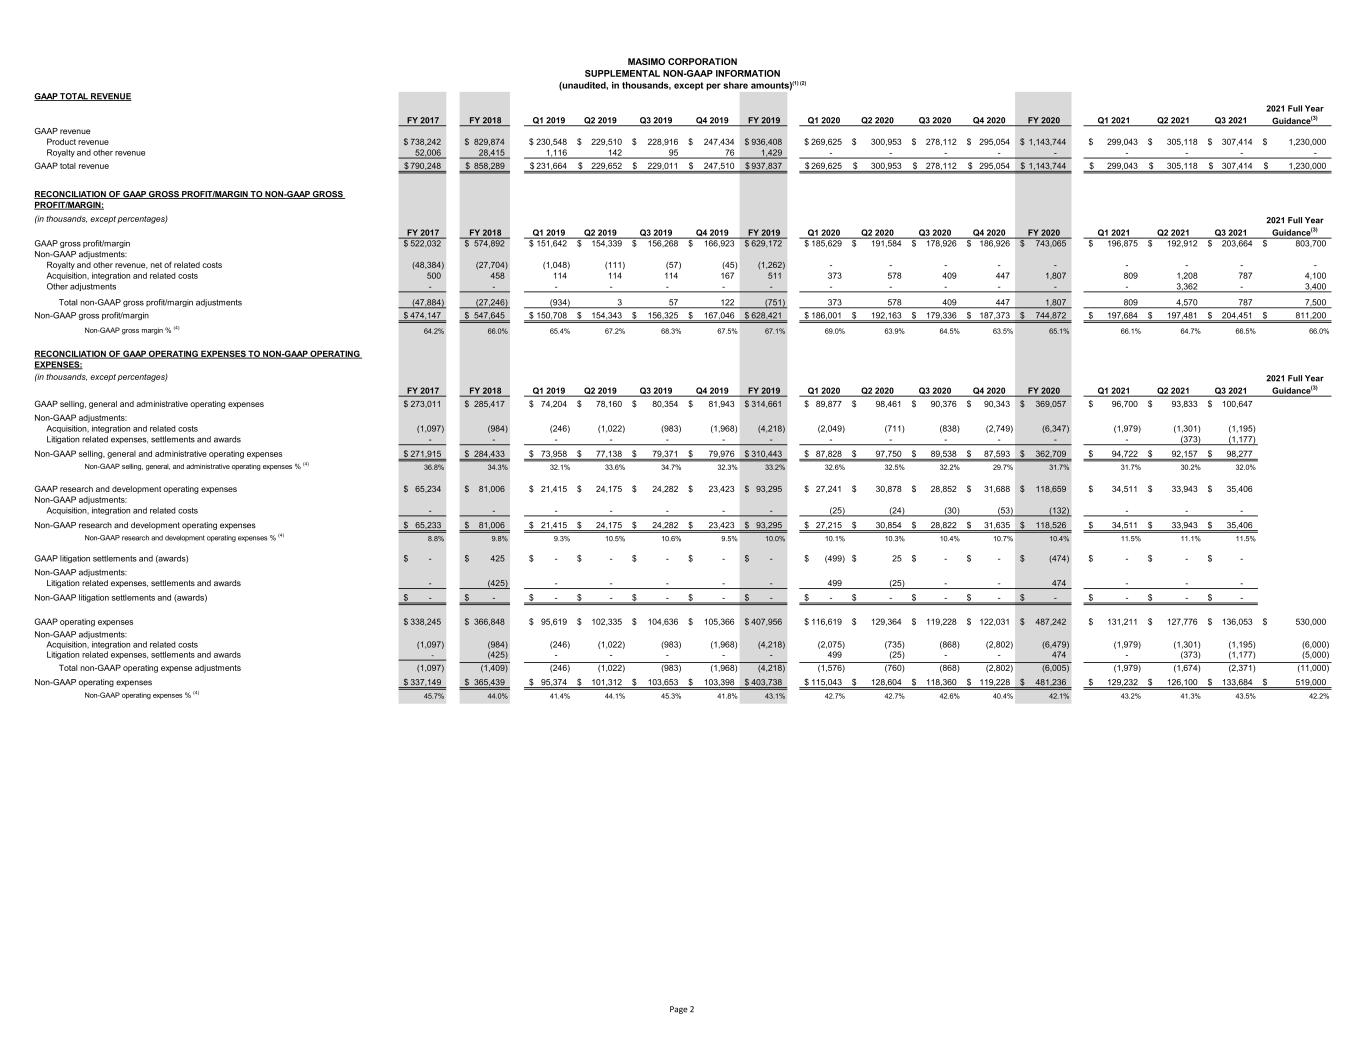
MASIMO CORPORATION SUPPLEMENTAL NON-GAAP INFORMATION (unaudited, in thousands, except per share amounts)(1) (2) GAAP TOTAL REVENUE FY 2017 FY 2018 Q1 2019 Q2 2019 Q3 2019 Q4 2019 FY 2019 Q1 2020 Q2 2020 Q3 2020 Q4 2020 FY 2020 Q1 2021 Q2 2021 Q3 2021 GAAP revenue Product revenue 738,242$ 829,874$ 230,548$ 229,510$ 228,916$ 247,434$ 936,408$ 269,625$ 300,953$ 278,112$ 295,054$ 1,143,744$ 299,043$ 305,118$ 307,414$ 1,230,000$ Royalty and other revenue 52,006 28,415 1,116 142 95 76 1,429 - - - - - - - - - GAAP total revenue 790,248$ 858,289$ 231,664$ 229,652$ 229,011$ 247,510$ 937,837$ 269,625$ 300,953$ 278,112$ 295,054$ 1,143,744$ 299,043$ 305,118$ 307,414$ 1,230,000$ (in thousands, except percentages) FY 2017 FY 2018 Q1 2019 Q2 2019 Q3 2019 Q4 2019 FY 2019 Q1 2020 Q2 2020 Q3 2020 Q4 2020 FY 2020 Q1 2021 Q2 2021 Q3 2021 GAAP gross profit/margin 522,032$ 574,892$ 151,642$ 154,339$ 156,268$ 166,923$ 629,172$ 185,629$ 191,584$ 178,926$ 186,926$ 743,065$ 196,875$ 192,912$ 203,664$ 803,700$ Non-GAAP adjustments: Royalty and other revenue, net of related costs (48,384) (27,704) (1,048) (111) (57) (45) (1,262) - - - - - - - - - Acquisition, integration and related costs 500 458 114 114 114 167 511 373 578 409 447 1,807 809 1,208 787 4,100 Other adjustments - - - - - - - - - - - - - 3,362 - 3,400 Total non-GAAP gross profit/margin adjustments (47,884) (27,246) (934) 3 57 122 (751) 373 578 409 447 1,807 809 4,570 787 7,500 Non-GAAP gross profit/margin 474,147$ 547,645$ 150,708$ 154,343$ 156,325$ 167,046$ 628,421$ 186,001$ 192,163$ 179,336$ 187,373$ 744,872$ 197,684$ 197,481$ 204,451$ 811,200$ Non-GAAP gross margin % (4) 64.2% 66.0% 65.4% 67.2% 68.3% 67.5% 67.1% 69.0% 63.9% 64.5% 63.5% 65.1% 66.1% 64.7% 66.5% 66.0% (in thousands, except percentages) FY 2017 FY 2018 Q1 2019 Q2 2019 Q3 2019 Q4 2019 FY 2019 Q1 2020 Q2 2020 Q3 2020 Q4 2020 FY 2020 Q1 2021 Q2 2021 Q3 2021 GAAP selling, general and administrative operating expenses 273,011$ 285,417$ 74,204$ 78,160$ 80,354$ 81,943$ 314,661$ 89,877$ 98,461$ 90,376$ 90,343$ 369,057$ 96,700$ 93,833$ 100,647$ Non-GAAP adjustments: Acquisition, integration and related costs (1,097) (984) (246) (1,022) (983) (1,968) (4,218) (2,049) (711) (838) (2,749) (6,347) (1,979) (1,301) (1,195) Litigation related expenses, settlements and awards - - - - - - - - - - - - - (373) (1,177) Non-GAAP selling, general and administrative operating expenses 271,915$ 284,433$ 73,958$ 77,138$ 79,371$ 79,976$ 310,443$ 87,828$ 97,750$ 89,538$ 87,593$ 362,709$ 94,722$ 92,157$ 98,277$ Non-GAAP selling, general, and administrative operating expenses % (4) 36.8% 34.3% 32.1% 33.6% 34.7% 32.3% 33.2% 32.6% 32.5% 32.2% 29.7% 31.7% 31.7% 30.2% 32.0% GAAP research and development operating expenses 65,234$ 81,006$ 21,415$ 24,175$ 24,282$ 23,423$ 93,295$ 27,241$ 30,878$ 28,852$ 31,688$ 118,659$ 34,511$ 33,943$ 35,406$ Non-GAAP adjustments: Acquisition, integration and related costs - - - - - - - (25) (24) (30) (53) (132) - - - Non-GAAP research and development operating expenses 65,233$ 81,006$ 21,415$ 24,175$ 24,282$ 23,423$ 93,295$ 27,215$ 30,854$ 28,822$ 31,635$ 118,526$ 34,511$ 33,943$ 35,406$ Non-GAAP research and development operating expenses % (4) 8.8% 9.8% 9.3% 10.5% 10.6% 9.5% 10.0% 10.1% 10.3% 10.4% 10.7% 10.4% 11.5% 11.1% 11.5% GAAP litigation settlements and (awards) -$ 425$ -$ -$ -$ -$ -$ (499)$ 25$ -$ -$ (474)$ -$ -$ -$ Non-GAAP adjustments: Litigation related expenses, settlements and awards - (425) - - - - - 499 (25) - - 474 - - - Non-GAAP litigation settlements and (awards) -$ -$ -$ -$ -$ -$ -$ -$ -$ -$ -$ -$ -$ -$ -$ 4 4 GAAP operating expenses 338,245$ 366,848$ 95,619$ 102,335$ 104,636$ 105,366$ 407,956$ 116,619$ 129,364$ 119,228$ 122,031$ 487,242$ 131,211$ 127,776$ 136,053$ 530,000$ -$ -$ Non-GAAP adjustments: Acquisition, integration and related costs (1,097) (984) (246) (1,022) (983) (1,968) (4,218) (2,075) (735) (868) (2,802) (6,479) (1,979) (1,301) (1,195) (6,000) Litigation related expenses, settlements and awards - (425) - - - - - 499 (25) - - 474 - (373) (1,177) (5,000) Total non-GAAP operating expense adjustments (1,097) (1,409) (246) (1,022) (983) (1,968) (4,218) (1,576) (760) (868) (2,802) (6,005) (1,979) (1,674) (2,371) (11,000) Non-GAAP operating expenses 337,149$ 365,439$ 95,374$ 101,312$ 103,653$ 103,398$ 403,738$ 115,043$ 128,604$ 118,360$ 119,228$ 481,236$ 129,232$ 126,100$ 133,684$ 519,000$ Non-GAAP operating expenses % (4) 45.7% 44.0% 41.4% 44.1% 45.3% 41.8% 43.1% 42.7% 42.7% 42.6% 40.4% 42.1% 43.2% 41.3% 43.5% 42.2% 2021 Full Year Guidance(3) RECONCILIATION OF GAAP GROSS PROFIT/MARGIN TO NON-GAAP GROSS PROFIT/MARGIN: 2021 Full Year Guidance(3) RECONCILIATION OF GAAP OPERATING EXPENSES TO NON-GAAP OPERATING EXPENSES: 2021 Full Year Guidance(3) Page 2


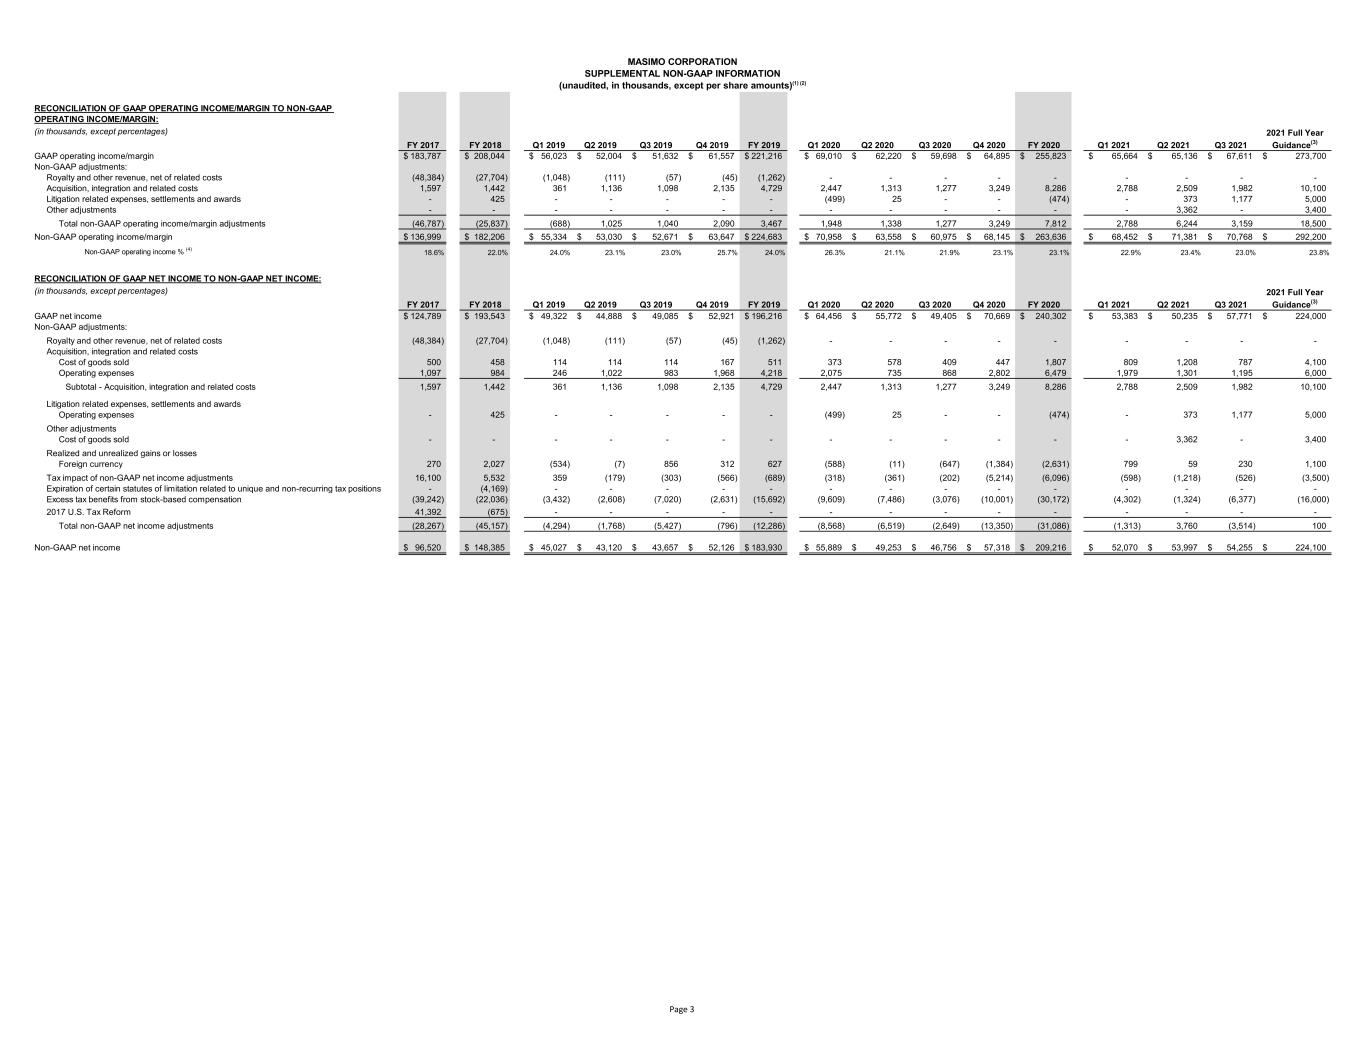
MASIMO CORPORATION SUPPLEMENTAL NON-GAAP INFORMATION (unaudited, in thousands, except per share amounts)(1) (2) (in thousands, except percentages) FY 2017 FY 2018 Q1 2019 Q2 2019 Q3 2019 Q4 2019 FY 2019 Q1 2020 Q2 2020 Q3 2020 Q4 2020 FY 2020 Q1 2021 Q2 2021 Q3 2021 GAAP operating income/margin 183,787$ 208,044$ 56,023$ 52,004$ 51,632$ 61,557$ 221,216$ 69,010$ 62,220$ 59,698$ 64,895$ 255,823$ 65,664$ 65,136$ 67,611$ 273,700$ Non-GAAP adjustments: Royalty and other revenue, net of related costs (48,384) (27,704) (1,048) (111) (57) (45) (1,262) - - - - - - - - - Acquisition, integration and related costs 1,597 1,442 361 1,136 1,098 2,135 4,729 2,447 1,313 1,277 3,249 8,286 2,788 2,509 1,982 10,100 Litigation related expenses, settlements and awards - 425 - - - - - (499) 25 - - (474) - 373 1,177 5,000 Other adjustments - - - - - - - - - - - - - 3,362 - 3,400 Total non-GAAP operating income/margin adjustments (46,787) (25,837) (688) 1,025 1,040 2,090 3,467 1,948 1,338 1,277 3,249 7,812 2,788 6,244 3,159 18,500 Non-GAAP operating income/margin 136,999$ 182,206$ 55,334$ 53,030$ 52,671$ 63,647$ 224,683$ 70,958$ 63,558$ 60,975$ 68,145$ 263,636$ 68,452$ 71,381$ 70,768$ 292,200$ Non-GAAP operating income % (4) 18.6% 22.0% 24.0% 23.1% 23.0% 25.7% 24.0% 26.3% 21.1% 21.9% 23.1% 23.1% 22.9% 23.4% 23.0% 23.8% (in thousands, except percentages) FY 2017 FY 2018 Q1 2019 Q2 2019 Q3 2019 Q4 2019 FY 2019 Q1 2020 Q2 2020 Q3 2020 Q4 2020 FY 2020 Q1 2021 Q2 2021 Q3 2021 GAAP net income 124,789$ 193,543$ 49,322$ 44,888$ 49,085$ 52,921$ 196,216$ 64,456$ 55,772$ 49,405$ 70,669$ 240,302$ 53,383$ 50,235$ 57,771$ 224,000$ Non-GAAP adjustments: Royalty and other revenue, net of related costs (48,384) (27,704) (1,048) (111) (57) (45) (1,262) - - - - - - - - - Acquisition, integration and related costs Cost of goods sold 500 458 114 114 114 167 511 373 578 409 447 1,807 809 1,208 787 4,100 Operating expenses 1,097 984 246 1,022 983 1,968 4,218 2,075 735 868 2,802 6,479 1,979 1,301 1,195 6,000 Subtotal - Acquisition, integration and related costs 1,597 1,442 361 1,136 1,098 2,135 4,729 2,447 1,313 1,277 3,249 8,286 2,788 2,509 1,982 10,100 Litigation related expenses, settlements and awards Operating expenses - 425 - - - - - (499) 25 - - (474) - 373 1,177 5,000 Other adjustments Cost of goods sold - - - - - - - - - - - - - 3,362 - 3,400 Realized and unrealized gains or losses Foreign currency 270 2,027 (534) (7) 856 312 627 (588) (11) (647) (1,384) (2,631) 799 59 230 1,100 # Tax impact of non-GAAP net income adjustments 16,100 5,532 359 (179) (303) (566) (689) (318) (361) (202) (5,214) (6,096) (598) (1,218) (526) (3,500) Expiration of certain statutes of limitation related to unique and non-recurring tax positions - (4,169) - - - - - - - - - - - - - - 9800Excess tax benefits from stock-based compensation (39,242) (22,036) (3,432) (2,608) (7,020) (2,631) (15,692) (9,609) (7,486) (3,076) (10,001) (30,172) (4,302) (1,324) (6,377) (16,000) 2017 U.S. Tax Reform 41,392 (675) - - - - - - - - - - - - - - Total non-GAAP net income adjustments (28,267) (45,157) (4,294) (1,768) (5,427) (796) (12,286) (8,568) (6,519) (2,649) (13,350) (31,086) (1,313) 3,760 (3,514) 100 Non-GAAP net income 96,520$ 148,385$ 45,027$ 43,120$ 43,657$ 52,126$ 183,930$ 55,889$ 49,253$ 46,756$ 57,318$ 209,216$ 52,070$ 53,997$ 54,255$ 224,100$ 2021 Full Year Guidance(3) RECONCILIATION OF GAAP NET INCOME TO NON-GAAP NET INCOME: 2021 Full Year Guidance(3) RECONCILIATION OF GAAP OPERATING INCOME/MARGIN TO NON-GAAP OPERATING INCOME/MARGIN: Page 3


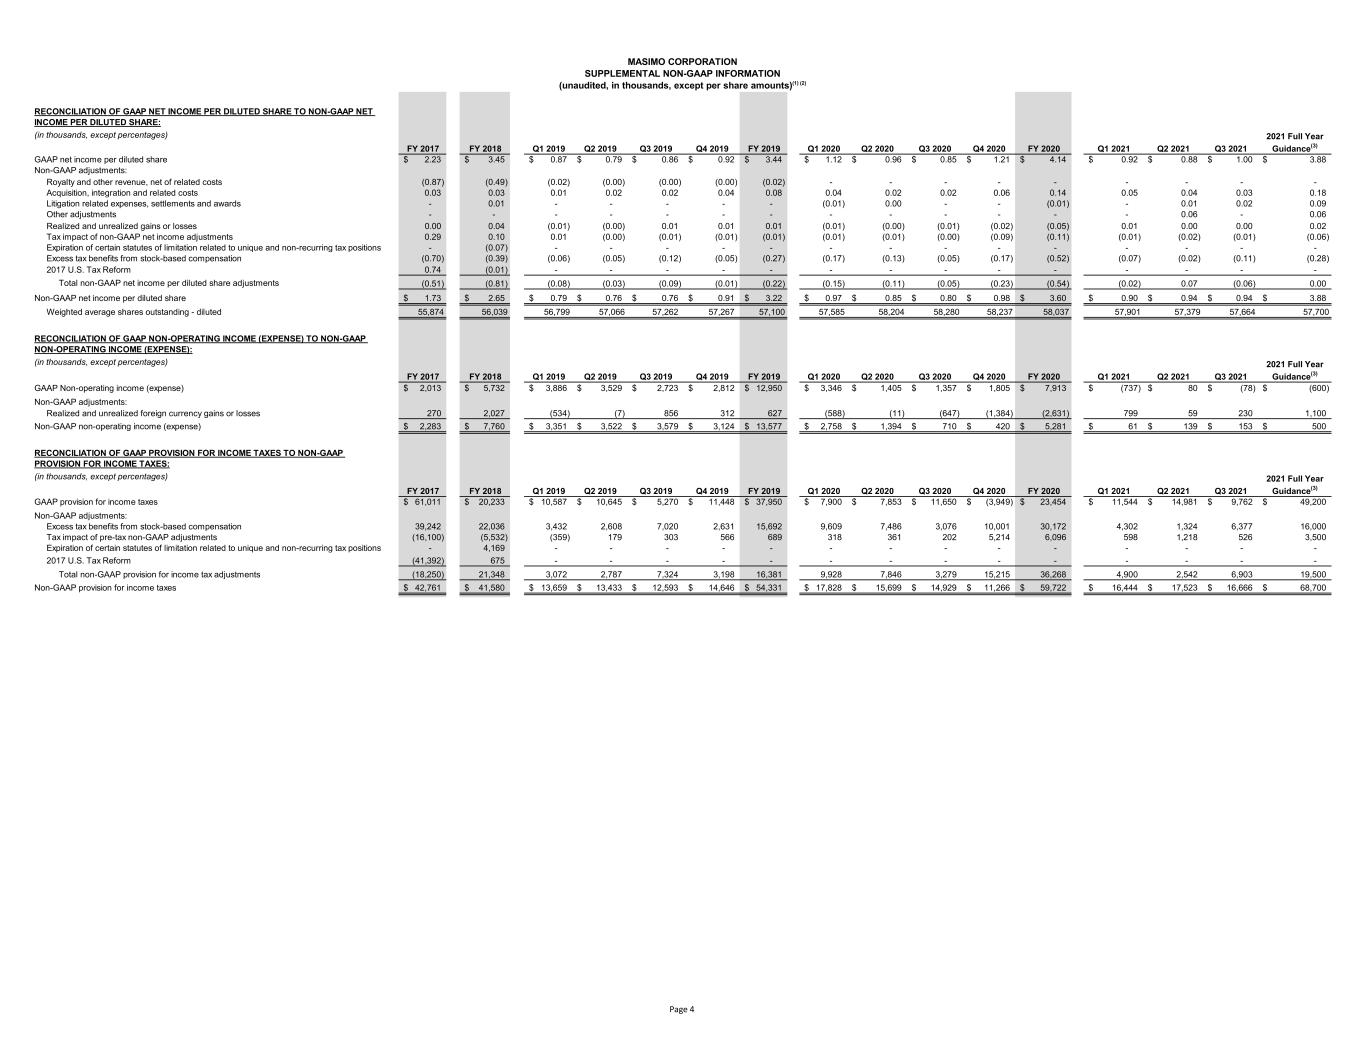
MASIMO CORPORATION SUPPLEMENTAL NON-GAAP INFORMATION (unaudited, in thousands, except per share amounts)(1) (2) (in thousands, except percentages) FY 2017 FY 2018 Q1 2019 Q2 2019 Q3 2019 Q4 2019 FY 2019 Q1 2020 Q2 2020 Q3 2020 Q4 2020 FY 2020 Q1 2021 Q2 2021 Q3 2021 2.23$ 3.45$ 0.87$ 0.79$ 0.86$ 0.92$ 3.44$ 1.12$ 0.96$ 0.85$ 1.21$ 4.14$ 0.92$ 0.88$ 1.00$ 3.88$ Royalty and other revenue, net of related costs (0.87) (0.49) (0.02) (0.00) (0.00) (0.00) (0.02) - - - - - - - - - Acquisition, integration and related costs 0.03 0.03 0.01 0.02 0.02 0.04 0.08 0.04 0.02 0.02 0.06 0.14 0.05 0.04 0.03 0.18 Litigation related expenses, settlements and awards - 0.01 - - - - - (0.01) 0.00 - - (0.01) - 0.01 0.02 0.09 - - - - - - - - - - - - - 0.06 - 0.06 Realized and unrealized gains or losses 0.00 0.04 (0.01) (0.00) 0.01 0.01 0.01 (0.01) (0.00) (0.01) (0.02) (0.05) 0.01 0.00 0.00 0.02 Tax impact of non-GAAP net income adjustments 0.29 0.10 0.01 (0.00) (0.01) (0.01) (0.01) (0.01) (0.01) (0.00) (0.09) (0.11) (0.01) (0.02) (0.01) (0.06) Expiration of certain statutes of limitation related to unique and non-recurring tax positions - (0.07) - - - - - - - - - - - - - - 9800Excess tax benefits from stock-based compensation (0.70) (0.39) (0.06) (0.05) (0.12) (0.05) (0.27) (0.17) (0.13) (0.05) (0.17) (0.52) (0.07) (0.02) (0.11) (0.28) 2017 U.S. Tax Reform 0.74 (0.01) - - - - - - - - - - - - - - Total non-GAAP net income per diluted share adjustments (0.51) (0.81) (0.08) (0.03) (0.09) (0.01) (0.22) (0.15) (0.11) (0.05) (0.23) (0.54) (0.02) 0.07 (0.06) 0.00 Non-GAAP net income per diluted share 1.73$ 2.65$ 0.79$ 0.76$ 0.76$ 0.91$ 3.22$ 0.97$ 0.85$ 0.80$ 0.98$ 3.60$ 0.90$ 0.94$ 0.94$ 3.88$ Weighted average shares outstanding - diluted 55,874 56,039 56,799 57,066 57,262 57,267 57,100 57,585 58,204 58,280 58,237 58,037 57,901 57,379 57,664 57,700 (in thousands, except percentages) FY 2017 FY 2018 Q1 2019 Q2 2019 Q3 2019 Q4 2019 FY 2019 Q1 2020 Q2 2020 Q3 2020 Q4 2020 FY 2020 Q1 2021 Q2 2021 Q3 2021 GAAP Non-operating income (expense) 2,013$ 5,732$ 3,886$ 3,529$ 2,723$ 2,812$ 12,950$ 3,346$ 1,405$ 1,357$ 1,805$ 7,913$ (737)$ 80$ (78)$ (600)$ Non-GAAP adjustments: Realized and unrealized foreign currency gains or losses 270 2,027 (534) (7) 856 312 627 (588) (11) (647) (1,384) (2,631) 799 59 230 1,100 h Non-GAAP non-operating income (expense) 2,283$ 7,760$ 3,351$ 3,522$ 3,579$ 3,124$ 13,577$ 2,758$ 1,394$ 710$ 420$ 5,281$ 61$ 139$ 153$ 500$ (in thousands, except percentages) FY 2017 FY 2018 Q1 2019 Q2 2019 Q3 2019 Q4 2019 FY 2019 Q1 2020 Q2 2020 Q3 2020 Q4 2020 FY 2020 Q1 2021 Q2 2021 Q3 2021 GAAP provision for income taxes 61,011$ 20,233$ 10,587$ 10,645$ 5,270$ 11,448$ 37,950$ 7,900$ 7,853$ 11,650$ (3,949)$ 23,454$ 11,544$ 14,981$ 9,762$ 49,200$ Non-GAAP adjustments: Excess tax benefits from stock-based compensation 39,242 22,036 3,432 2,608 7,020 2,631 15,692 9,609 7,486 3,076 10,001 30,172 4,302 1,324 6,377 16,000 Tax impact of pre-tax non-GAAP adjustments (16,100) (5,532) (359) 179 303 566 689 318 361 202 5,214 6,096 598 1,218 526 3,500 Expiration of certain statutes of limitation related to unique and non-recurring tax positions - 4,169 - - - - - - - - - - - - - - 2017 U.S. Tax Reform (41,392) 675 - - - - - - - - - - - - - - Total non-GAAP provision for income tax adjustments (18,250) 21,348 3,072 2,787 7,324 3,198 16,381 9,928 7,846 3,279 15,215 36,268 4,900 2,542 6,903 19,500 Non-GAAP provision for income taxes 42,761$ 41,580$ 13,659$ 13,433$ 12,593$ 14,646$ 54,331$ 17,828$ 15,699$ 14,929$ 11,266$ 59,722$ 16,444$ 17,523$ 16,666$ 68,700$ 2021 Full Year Guidance(3) GAAP net income per diluted share Non-GAAP adjustments: Other adjustments RECONCILIATION OF GAAP NON-OPERATING INCOME (EXPENSE) TO NON-GAAP NON-OPERATING INCOME (EXPENSE): 2021 Full Year Guidance(3) RECONCILIATION OF GAAP PROVISION FOR INCOME TAXES TO NON-GAAP PROVISION FOR INCOME TAXES: RECONCILIATION OF GAAP NET INCOME PER DILUTED SHARE TO NON-GAAP NET INCOME PER DILUTED SHARE: 2021 Full Year Guidance(3) Page 4


MASIMO CORPORATION SUPPLEMENTAL NON-GAAP INFORMATION (unaudited, in thousands, except per share amounts)(1) (2) (in thousands, except percentages) FY 2017 FY 2018 Q1 2019 Q2 2019 Q3 2019 Q4 2019 FY 2019 Q1 2020 Q2 2020 Q3 2020 Q4 2020 FY 2020 Q1 2021 Q2 2021 Q3 2021 Net cash provided by operating activities 56,062$ 239,527$ 42,468$ 58,311$ 50,637$ 70,224$ 221,640$ 42,355$ 63,712$ 40,478$ 64,418$ 210,963$ 59,260$ 25,998$ 81,893$ Purchases of property and equipment, net (43,684) (17,126) (6,963) (40,360) (8,741) (12,311) (68,375) (37,004) (14,266) (8,747) (12,532) (72,549) (8,903) (5,339) (6,438) - Free cash flow 12,378 222,401 35,505 17,951 41,896 57,913 153,265 5,351 49,446 31,731 51,886 138,414 50,357 20,659 75,455 - - - - - - - (499) - - - (499) - - - Tax payments related to litigation awards 74,201 - - - - - - - - - - - - - - Adjusted free cash flow $ 86,579 $ 222,401 $ 35,505 $ 17,951 $ 41,896 $ 57,913 $ 153,265 $ 4,852 $ 49,446 $ 31,731 $ 51,886 $ 137,915 $ 50,357 $ 20,659 $ 75,455 (3) Updated for guidance provided on October 26, 2021 (4) Calculated as a percentage of Product Revenue RECONCILIATION OF FREE CASH FLOW TO ADJUSTED FREE CASH FLOW Net cash provided by operating activities Litigation settlements and (awards) (1) Totals may not foot due to rounding (2) Quarterly reported amounts may vary from amounts previously reported due to rounding conventions. Page 5