| NEWS RELEASE | ||||
Matthews International Corporation
Corporate Office
Two NorthShore Center
Pittsburgh, PA 15212-5851
Phone: (412) 442-8200
| January 27, 2022 | Contact: | Steven F. Nicola | William D. Wilson | ||||||||
| Chief Financial Officer and Secretary | Senior Director, Corporate Development | ||||||||||
MATTHEWS INTERNATIONAL REPORTS RESULTS FOR
FISCAL 2022 FIRST QUARTER
Financial Highlights:
•Sales increased $51.9 million (13.4%) compared to prior year 1st quarter
•All business segments report higher sales
•GAAP net loss of $19.8 million ($0.62 per share); adjusted net income of $23.6 million
•Adjusted EBITDA of $53.3 million; non-GAAP adjusted EPS of $0.74 per share
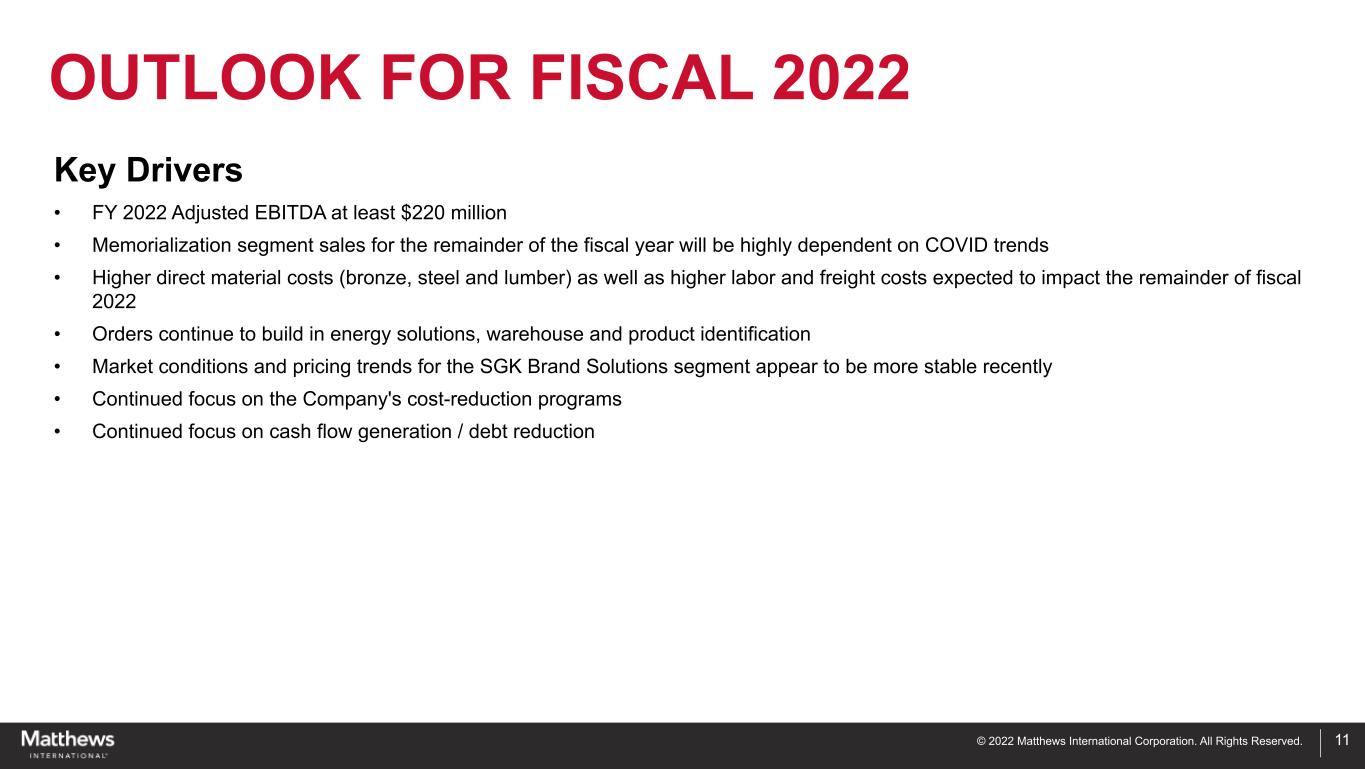
•Company sets fiscal 2022 adjusted EBITDA outlook to be at least $220 million
PITTSBURGH, PA, January 27, 2022 - Matthews International Corporation (NASDAQ GSM: MATW) today announced financial results for its first quarter of fiscal 2022.
In discussing the results for the Company’s fiscal 2022 first quarter, Joseph C. Bartolacci, President and Chief Executive Officer, stated:
“We generated strong sales growth for the fiscal 2022 first quarter, with all segments contributing to our year-over-year improvement. Our higher growth businesses within the Industrial Technologies segment continued to perform well, particularly energy solutions and warehouse automation. Our Memorialization businesses also reported another quarter of revenue growth across all of its main product lines. In addition, despite the ongoing challenges of the pandemic, our SGK Brand Solutions segment also reported higher sales.
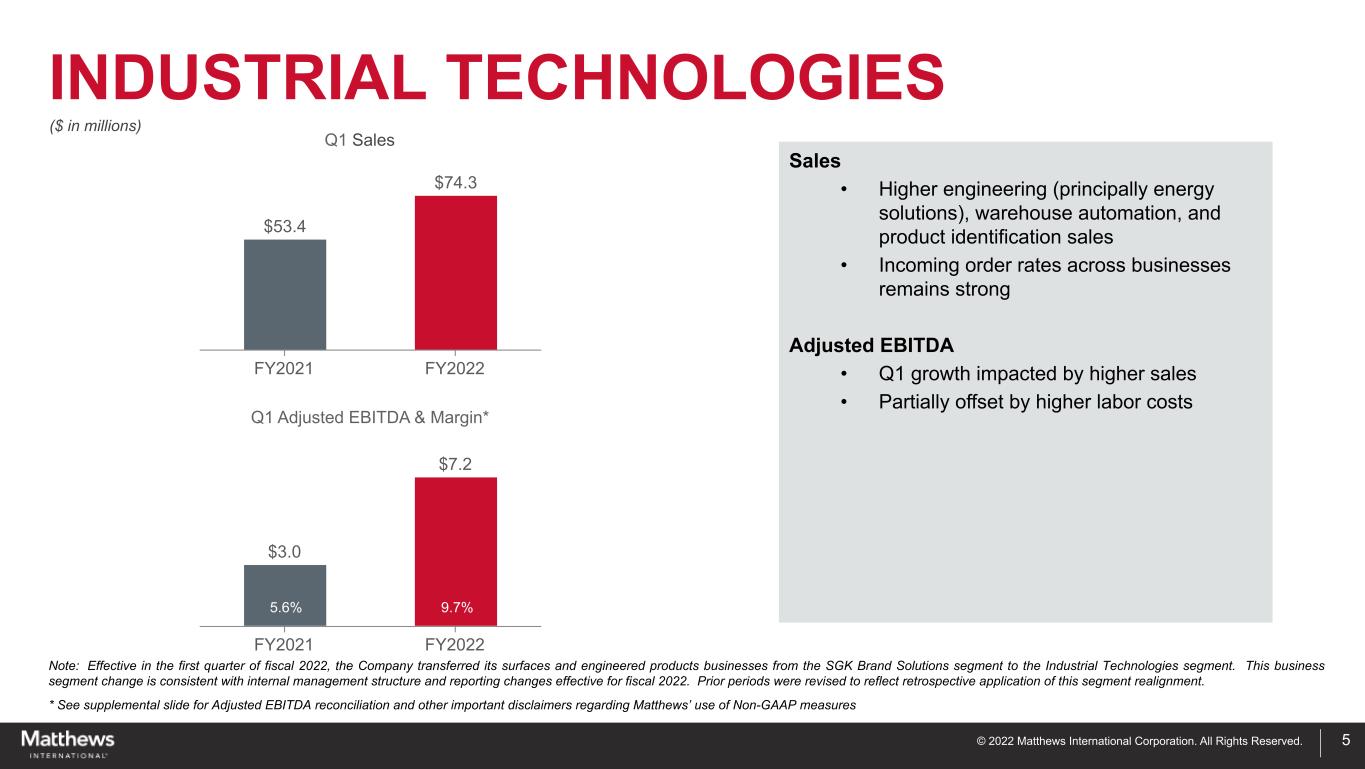
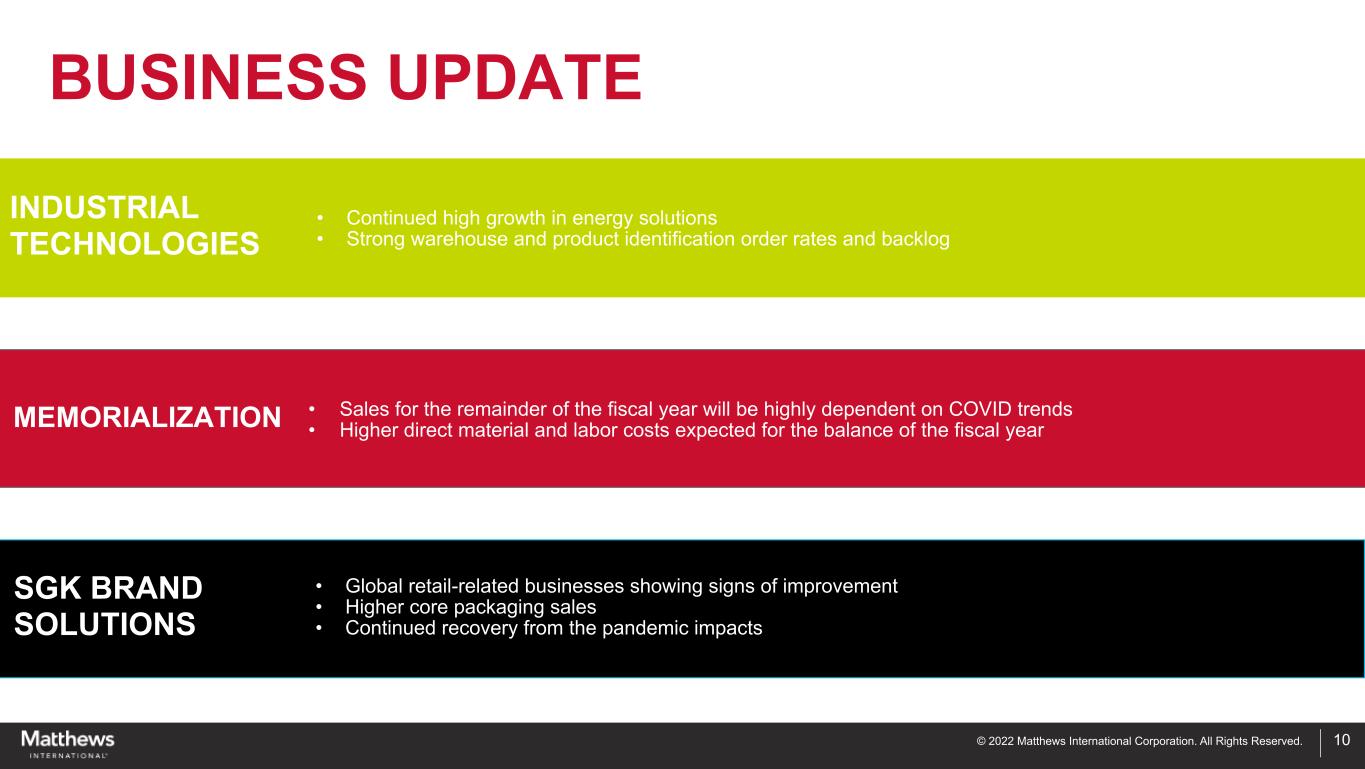
“Sales for the Industrial Technologies segment for the current quarter were $74.3 million, compared to $53.4 million a year ago, representing an increase of $20.9 million, or 39.1%. The increase resulted from higher engineering (principally energy solutions) sales and an increase in warehouse automation sales. Product identification sales were also higher than the same quarter last year. Order rates across these businesses continued to remain strong.
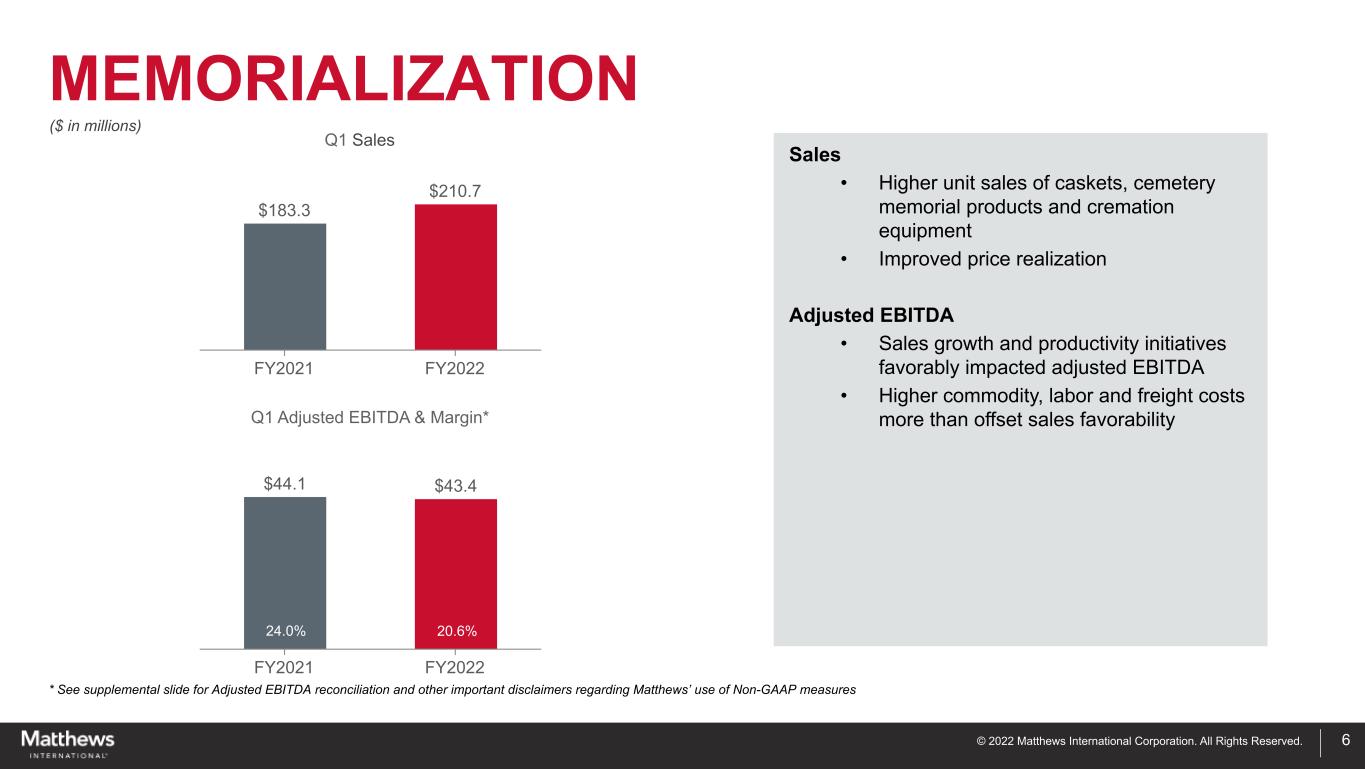
“Sales for the Memorialization segment for the fiscal 2022 first quarter were $210.7 million, compared to $183.3 million for the same quarter a year ago, representing an increase of $27.4 million, or 15.0%. The increase was mainly the result of higher sales of caskets and cemetery memorials, primarily driven by COVID-19. Improved price realization and increases in sales of cremation equipment and mausoleum projects also contributed to the segment’s sales improvement.
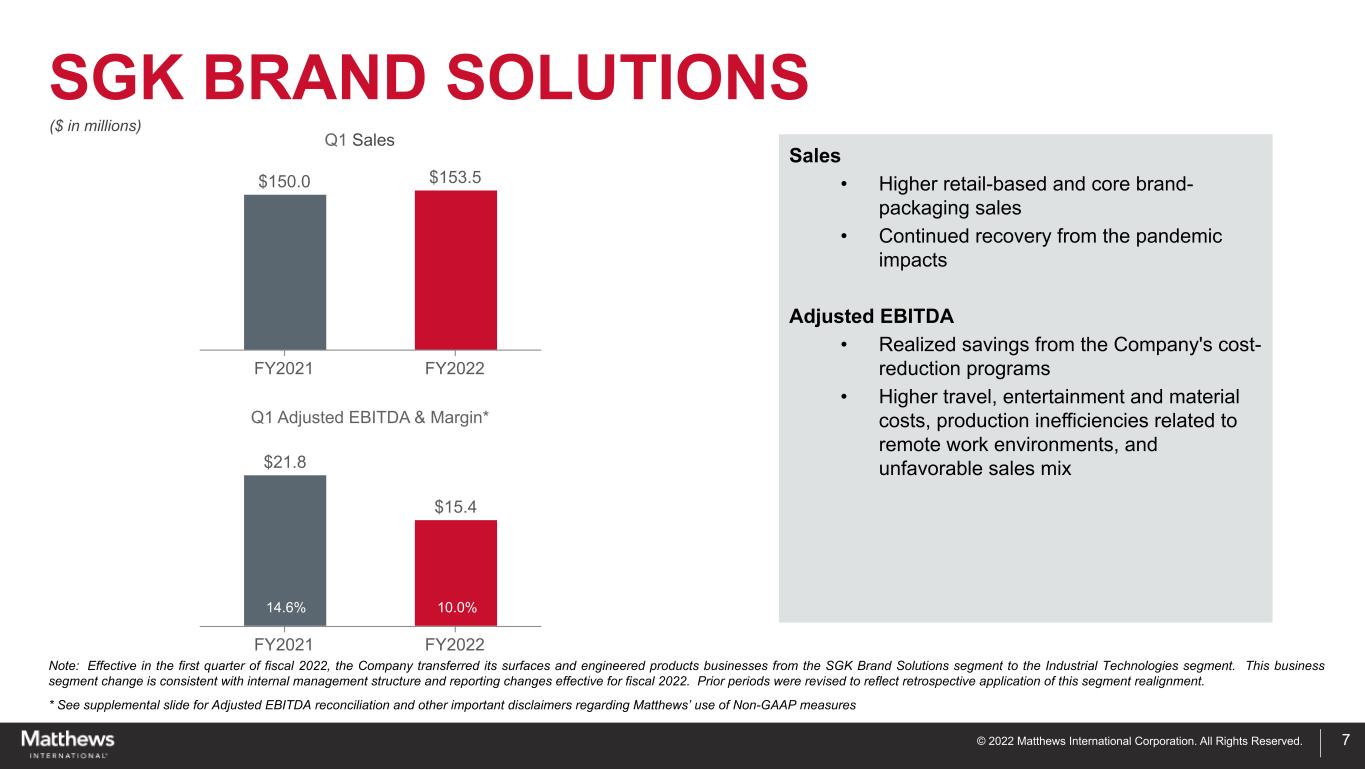
“The SGK Brand Solutions segment sales increased to $153.5 million for the current quarter, compared to $150.0 million a year ago. The segment’s retail-based sales were higher than a year ago reflecting
Matthews International Reports Results for Fiscal 2022 First Quarter
Page 2 of 9
January 27, 2022
continued recovery from the impacts of the pandemic. In addition, brand packaging sales were also higher for the quarter, albeit at lower margins.
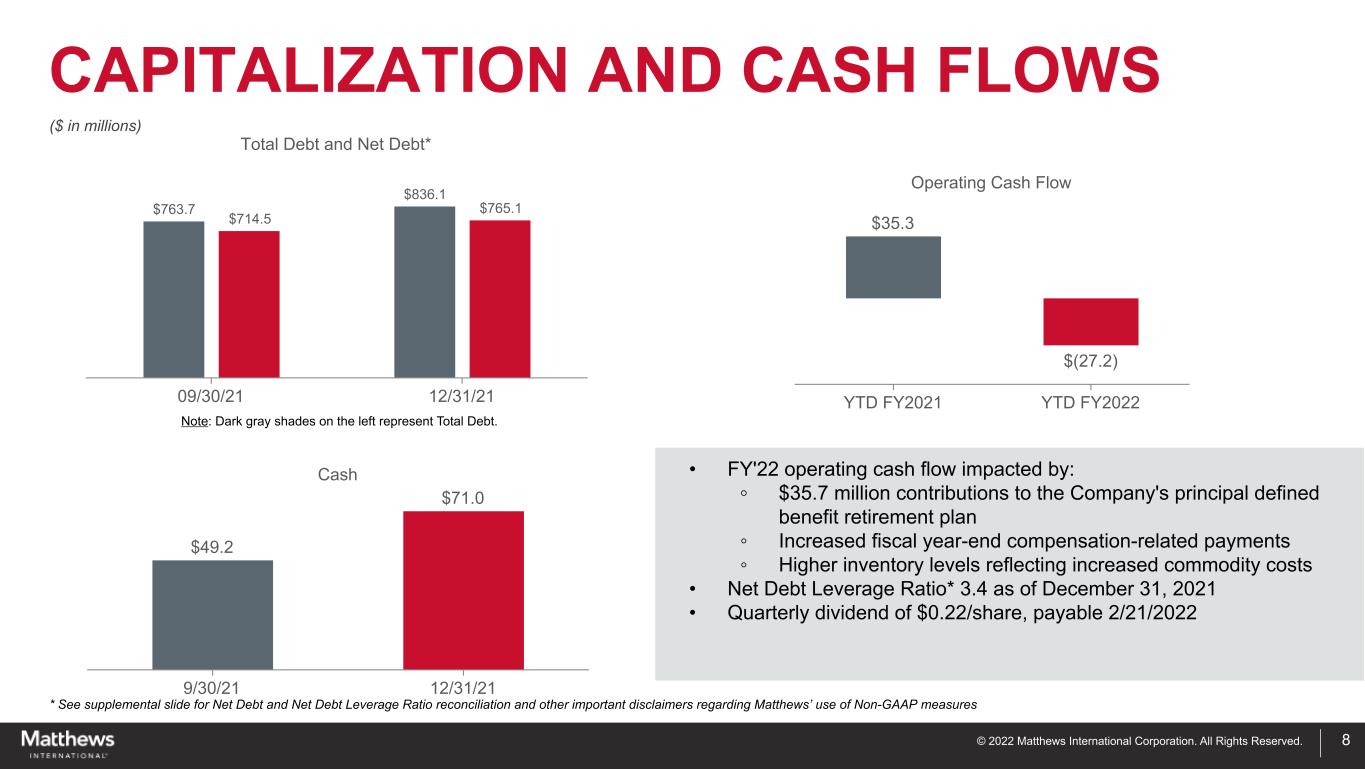
"During the fiscal 2022 first quarter, we completed the funding toward the termination of the Company’s principal U.S. retirement plan. Although this funding contributed to an increase in our outstanding debt during the quarter, we significantly reduced the Company’s accrued pension liabilities. We expect this debt increase to be temporary as we continue to focus on debt reduction this fiscal year.”
First Quarter Fiscal 2022 Consolidated Results (Unaudited)
| ($ in millions, except per share data) | Q1 FY2022 | Q1 FY2021 | Change | % Change | |||||||||||||||||||
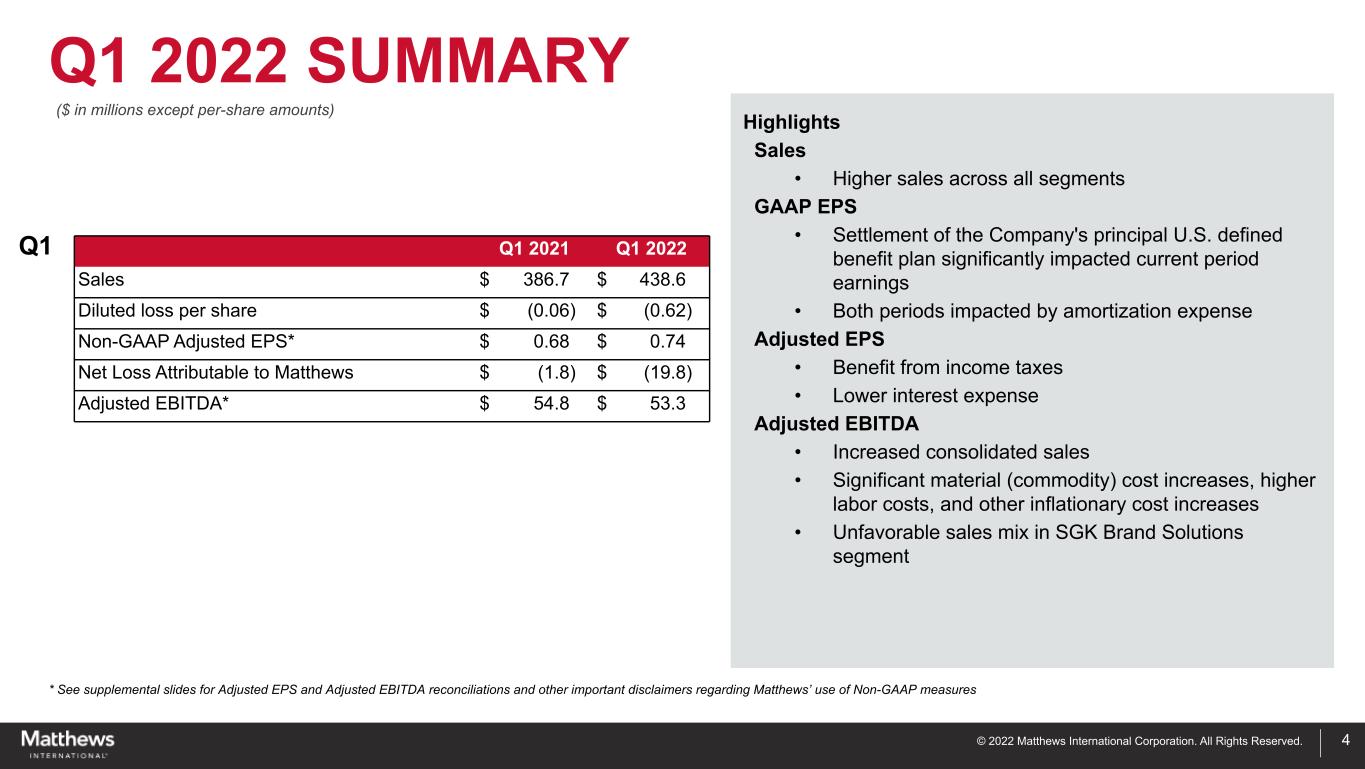
| Sales | $ | 438.6 | $ | 386.7 | $ | 51.9 | 13.4 | % | |||||||||||||||
| Net loss attributable to Matthews | $ | (19.8) | $ | (1.8) | $ | (18.0) | 1026.5 | % | |||||||||||||||
| Diluted loss per share | $ | (0.62) | $ | (0.06) | $ | (0.56) | 933.3 | % | |||||||||||||||
| Non-GAAP adjusted net income | $ | 23.6 | $ | 21.6 | $ | 2.0 | 9.3 | % | |||||||||||||||
| Non-GAAP adjusted EPS | $ | 0.74 | $ | 0.68 | $ | 0.06 | 8.8 | % | |||||||||||||||
| Adjusted EBITDA | $ | 53.3 | $ | 54.8 | $ | (1.5) | (2.7) | % | |||||||||||||||
| Note: See the attached tables for additional important disclosures regarding Matthews’ use of non-GAAP measures as well as reconciliations of non-GAAP measures to corresponding GAAP measures. Organic sales represent changes in sales excluding the impact of acquisitions, divestitures, and changes in foreign currency exchange rates. | |||||||||||||||||||||||
Consolidated sales for the quarter ended December 31, 2021 were $438.6 million, compared to $386.7 million for the same quarter a year ago, representing an increase of $51.9 million, or 13.4%. The increase reflected higher sales in all three of the Company's segments. Changes in foreign currency rates were estimated to have an unfavorable impact of $4.1 million on consolidated sales compared to a year ago.
Net loss attributable to the Company for the quarter ended December 31, 2021 was $19.8 million, or $0.62 per share, compared to $1.8 million, or $0.06 per share in the prior year. The current quarter reflected a pension settlement loss in connection with the terminations of certain of the Company’s retirement plans. In addition, both periods reflect the impact of intangible amortization expense.
On a non-GAAP adjusted basis, earnings for the fiscal 2022 first quarter were $0.74 per share, compared to $0.68 per share a year ago. Adjusted EBITDA (net income before interest expense, income taxes, depreciation and amortization, and other adjustments) for the fiscal 2022 first quarter was $53.3 million, compared to $54.8 million a year ago, representing a decrease of $1.5 million. The benefits of the increase in consolidated sales and ongoing cost reduction efforts were offset by the impacts of significant material (commodity) cost increases, higher labor costs, and other inflationary cost increases.
Outlook
Mr. Bartolacci further stated: “Each of our segments are continuing to build on their respective trends of revenue growth. As we reported previously, sales for our energy solutions business, which supports the electric vehicle market, grew significantly in fiscal 2021 and, based on current backlogs, are expected to significantly grow again in fiscal 2022. In addition, order rates and backlogs in the warehouse and product identification businesses within the Industrial Technologies segment remain strong. Also, market conditions and pricing trends for the SGK Brand Solutions segment appear to be more stable recently.
“With respect to our Memorialization segment, sales for the remainder of the fiscal year will be highly dependent on COVID trends. In addition, the segment’s adjusted EBITDA will remain challenged by the significant increases in material and labor costs. However, we are implementing new pricing actions and taking additional cost reduction measures to further mitigate these impacts.
Matthews International Reports Results for Fiscal 2022 First Quarter
Page 3 of 9
January 27, 2022
“Accordingly, in consideration of our recent sales trends and these additional cost mitigation efforts, we currently expect consolidated adjusted EBITDA to be at least $220 million for fiscal 2022.”
Webcast
The Company will host a conference call and webcast on Friday, January 28, 2022 at 9:00 a.m. Eastern Time to review its financial and operating results and discuss its corporate strategies and outlook. A question-and-answer session will follow. The conference call can be accessed by calling (201) 689-8471. The audio webcast can be monitored at www.matw.com. As soon as available after the call, a transcript of the call will be posted in the Investor Relations section of the Company’s website at www.matw.com.
About Matthews International Corporation
Matthews International Corporation is a global provider of brand solutions, memorialization products and industrial technologies. The SGK Brand Solutions segment is a leading provider of packaging solutions and brand experiences, helping companies simplify their marketing, amplify their brands and provide value. The Memorialization segment is a leading provider of memorialization products, including memorials, caskets and cremation and incineration equipment, primarily to cemetery and funeral home customers that help families move from grief to remembrance. The Industrial Technologies segment designs, manufactures, services and distributes high-tech custom energy storage, marking, coding and industrial automation technologies and solutions. The Company has approximately 11,000 employees in more than 26 countries on six continents that are committed to delivering the highest quality products and services.
Forward-looking Information
Any forward-looking statements contained in this release are included pursuant to the “safe harbor” provisions of the Private Securities Litigation Reform Act of 1995. Such forward-looking statements involve known and unknown risks and uncertainties that may cause the Company’s actual results in future periods to be materially different from management’s expectations. Although the Company believes that the expectations reflected in such forward-looking statements are reasonable, no assurance can be given that such expectations will prove correct. Factors that could cause the Company's results to differ materially from the results discussed in such forward-looking statements principally include changes in domestic or international economic conditions, changes in foreign currency exchange rates, changes in the cost of materials used in the manufacture of the Company's products, changes in mortality and cremation rates, changes in product demand or pricing as a result of consolidation in the industries in which the Company operates, or other factors such as supply chain disruptions, labor shortages or labor cost increases, changes in product demand or pricing as a result of domestic or international competitive pressures, ability to achieve cost-reduction objectives, unknown risks in connection with the Company's acquisitions, cybersecurity concerns, effectiveness of the Company's internal controls, compliance with domestic and foreign laws and regulations, technological factors beyond the Company's control, impact of pandemics or similar outbreaks, such as coronavirus disease 2019 ("COVID-19") or other disruptions to our industries, customers, or supply chains, and other factors described in the Company’s Annual Report on Form 10-K and other periodic filings with the U.S. Securities and Exchange Commission.
Matthews International Reports Results for Fiscal 2022 First Quarter
Page 4 of 9
January 27, 2022
CONDENSED CONSOLIDATED STATEMENTS OF INCOME (Unaudited)
(In thousands, except per share data)
| Three Months Ended December 31, | |||||||||||||||||
| 2021 | 2020 | % Change | |||||||||||||||
| Sales | $ | 438,579 | $ | 386,657 | 13.4 | % | |||||||||||
| Cost of sales | (306,942) | (261,159) | 17.5 | % | |||||||||||||
| Gross profit | 131,637 | 125,498 | 4.9 | % | |||||||||||||
| Gross margin | 30.0 | % | 32.5 | % | |||||||||||||
| Selling and administrative expenses | (99,312) | (99,904) | (0.6) | % | |||||||||||||
| Amortization of intangible assets | (21,546) | (15,221) | 41.6 | % | |||||||||||||
| Operating profit | 10,779 | 10,373 | (3.9) | % | |||||||||||||
| Operating margin | 2.5 | % | 2.7 | % | |||||||||||||
| Interest and other deductions, net | (37,217) | (8,385) | 343.9 | % | |||||||||||||
| (Loss) income before income taxes | (26,438) | 1,988 | 1,429.9 | % | |||||||||||||
| Income taxes | 6,628 | (3,980) | (266.5) | % | |||||||||||||
| Net loss | (19,810) | (1,992) | (894.5) | % | |||||||||||||
| Non-controlling interests | 7 | 234 | (97.0) | % | |||||||||||||
| Net loss attributable to Matthews | $ | (19,803) | $ | (1,758) | (1,026.5) | % | |||||||||||
| Loss per share -- diluted | $ | (0.62) | $ | (0.06) | (933.3) | % | |||||||||||
Earnings per share -- non-GAAP (1) | $ | 0.74 | $ | 0.68 | 8.8 | % | |||||||||||
| Dividends declared per share | $ | 0.22 | $ | 0.215 | 2.3 | % | |||||||||||
| Diluted Shares | 31,719 | 31,725 | |||||||||||||||
(1) See reconciliation of non-GAAP financial information provided in tables at the end of this release | |||||||||||||||||
SEGMENT INFORMATION (Unaudited) (2)
(In thousands)
| Three Months Ended December 31, | |||||||||||
| 2021 | 2020 | ||||||||||
| Sales: | |||||||||||
| SGK Brand Solutions | $ | 153,542 | $ | 149,959 | |||||||
| Memorialization | 210,706 | 183,274 | |||||||||
| Industrial Technologies | 74,331 | 53,424 | |||||||||
| $ | 438,579 | $ | 386,657 | ||||||||
| Adjusted EBITDA: | |||||||||||
| SGK Brand Solutions | $ | 15,414 | $ | 21,833 | |||||||
| Memorialization | 43,370 | 44,072 | |||||||||
| Industrial Technologies | 7,183 | 2,996 | |||||||||
| Corporate and Non-Operating | (12,634) | (14,138) | |||||||||
Total Adjusted EBITDA (1) | $ | 53,333 | $ | 54,763 | |||||||
(1) See reconciliation of non-GAAP financial information provided in tables at the end of this release | |||||||||||
(2) Effective in the first quarter of fiscal 2022, the Company transferred its surfaces and engineered products businesses from the SGK Brand Solutions segment to the Industrial Technologies segment. This business segment change is consistent with internal management structure and reporting changes effective for fiscal 2022. Prior periods were revised to reflect retrospective application of this segment realignment. | |||||||||||
Matthews International Reports Results for Fiscal 2022 First Quarter
Page 5 of 9
January 27, 2022
CONDENSED CONSOLIDATED BALANCE SHEET INFORMATION (Unaudited)
(In thousands)
| December 31, 2021 | September 30, 2021 | ||||||||||||||||
| ASSETS | |||||||||||||||||
| Cash and cash equivalents | $ | 70,984 | $ | 49,176 | |||||||||||||
| Accounts receivable, net | 313,997 | 309,818 | |||||||||||||||
| Inventories, net | 192,744 | 189,088 | |||||||||||||||
| Other current assets | 109,027 | 76,083 | |||||||||||||||
| Total current assets | 686,752 | 624,165 | |||||||||||||||
| Property, plant and equipment, net | 221,940 | 223,707 | |||||||||||||||
| Goodwill | 771,983 | 773,787 | |||||||||||||||
| Other intangible assets, net | 239,724 | 261,542 | |||||||||||||||
| Other long-term assets | 132,916 | 148,877 | |||||||||||||||
| Total assets | $ | 2,053,315 | $ | 2,032,078 | |||||||||||||
| LIABILITIES | |||||||||||||||||
| Long-term debt, current maturities | $ | 4,271 | $ | 4,624 | |||||||||||||
| Other current liabilities | 336,859 | 349,601 | |||||||||||||||
| Total current liabilities | 341,130 | 354,225 | |||||||||||||||
| Long-term debt | 831,791 | 759,086 | |||||||||||||||
| Other long-term liabilities | 235,722 | 282,364 | |||||||||||||||
| Total liabilities | 1,408,643 | 1,395,675 | |||||||||||||||
| SHAREHOLDERS' EQUITY | |||||||||||||||||
| Total shareholders' equity | 644,672 | 636,403 | |||||||||||||||
| Total liabilities and shareholders' equity | $ | 2,053,315 | $ | 2,032,078 | |||||||||||||
CONDENSED CONSOLIDATED CASH FLOWS INFORMATION (Unaudited)
(In thousands)
| Three Months Ended December 31, | |||||||||||
| 2021 | 2020 | ||||||||||
| Cash flows from operating activities: | |||||||||||
| Net loss | $ | (19,810) | $ | (1,992) | |||||||
| Adjustments to reconcile net loss to net cash provided by operating activities: | |||||||||||
| Depreciation and amortization | 33,501 | 27,351 | |||||||||
| Changes in working capital items | (40,816) | (3,729) | |||||||||
| Other operating activities | (31) | 13,696 | |||||||||
| Net cash (used in) provided by operating activities | (27,156) | 35,326 | |||||||||
| Cash flows from investing activities: | |||||||||||
| Capital expenditures | (12,640) | (7,535) | |||||||||
| Other investing activities | 171 | 1,689 | |||||||||
| Net cash used in investing activities | (12,469) | (5,846) | |||||||||
| Cash flows from financing activities: | |||||||||||
| Net payments from long-term debt | 72,345 | (18,039) | |||||||||
| Purchases of treasury stock | (2,435) | (4,237) | |||||||||
| Dividends | (6,824) | (6,808) | |||||||||
| Other financing activities | (725) | (2,291) | |||||||||
| Net cash provided by (used in) financing activities | 62,361 | (31,375) | |||||||||
| Effect of exchange rate changes on cash | (928) | 1,736 | |||||||||
| Net change in cash, cash equivalents and restricted cash | $ | 21,808 | $ | (159) | |||||||
Matthews International Reports Results for Fiscal 2022 First Quarter
Page 6 of 9
January 27, 2022
Reconciliations of Non-GAAP Financial Measures
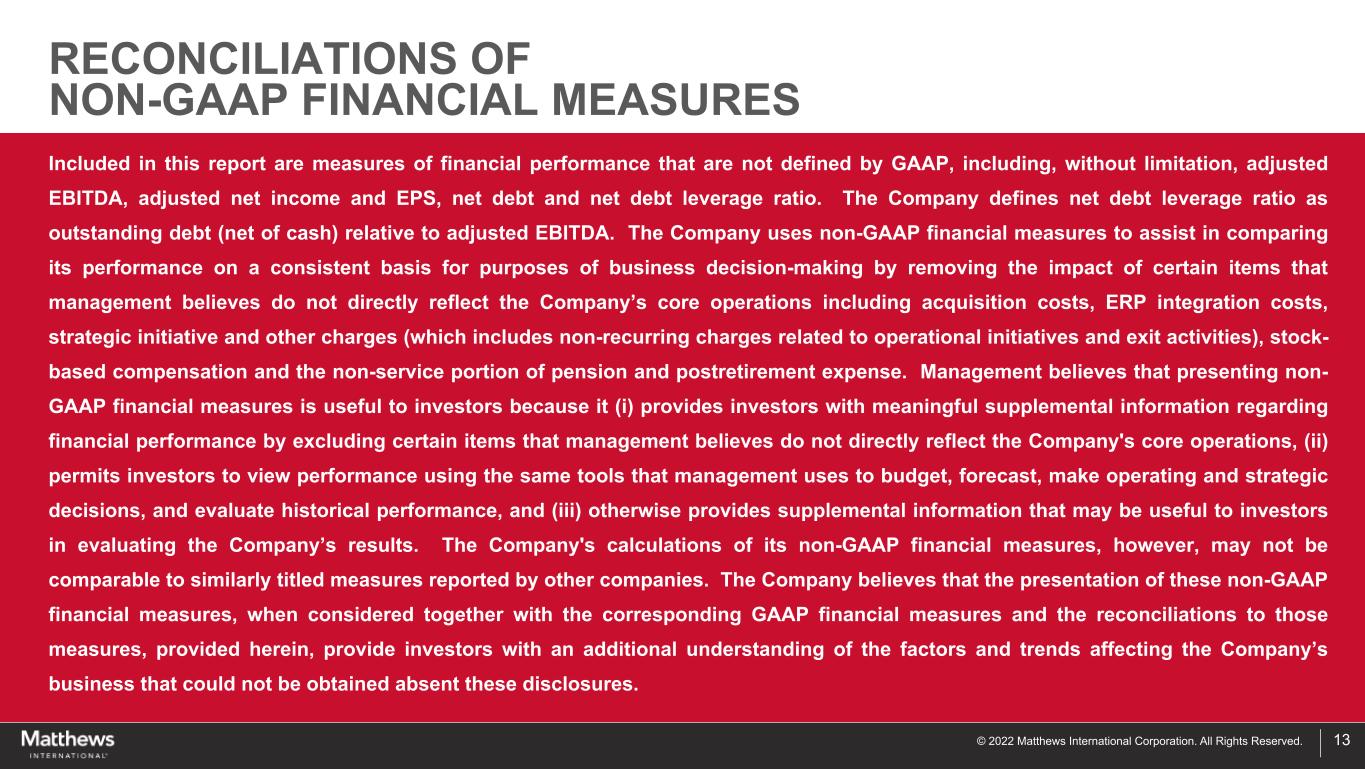
Included in this report are measures of financial performance that are not defined by GAAP, including, without limitation, adjusted EBITDA, adjusted net income and EPS, net debt and net debt leverage ratio. The Company defines net debt leverage ratio as outstanding debt (net of cash) relative to adjusted EBITDA. The Company uses non-GAAP financial measures to assist in comparing its performance on a consistent basis for purposes of business decision-making by removing the impact of certain items that management believes do not directly reflect the Company’s core operations including acquisition costs, ERP integration costs, strategic initiative and other charges (which includes non-recurring charges related to operational initiatives and exit activities), stock-based compensation and the non-service portion of pension and postretirement expense. Management believes that presenting non-GAAP financial measures is useful to investors because it (i) provides investors with meaningful supplemental information regarding financial performance by excluding certain items that management believes do not directly reflect the Company's core operations, (ii) permits investors to view performance using the same tools that management uses to budget, forecast, make operating and strategic decisions, and evaluate historical performance, and (iii) otherwise provides supplemental information that may be useful to investors in evaluating the Company’s results. The Company's calculations of its non-GAAP financial measures, however, may not be comparable to similarly titled measures reported by other companies. The Company believes that the presentation of these non-GAAP financial measures, when considered together with the corresponding GAAP financial measures and the reconciliations to those measures, provided herein, provide investors with an additional understanding of the factors and trends affecting the Company’s business that could not be obtained absent these disclosures.
Matthews International Reports Results for Fiscal 2022 First Quarter
Page 7 of 9
January 27, 2022
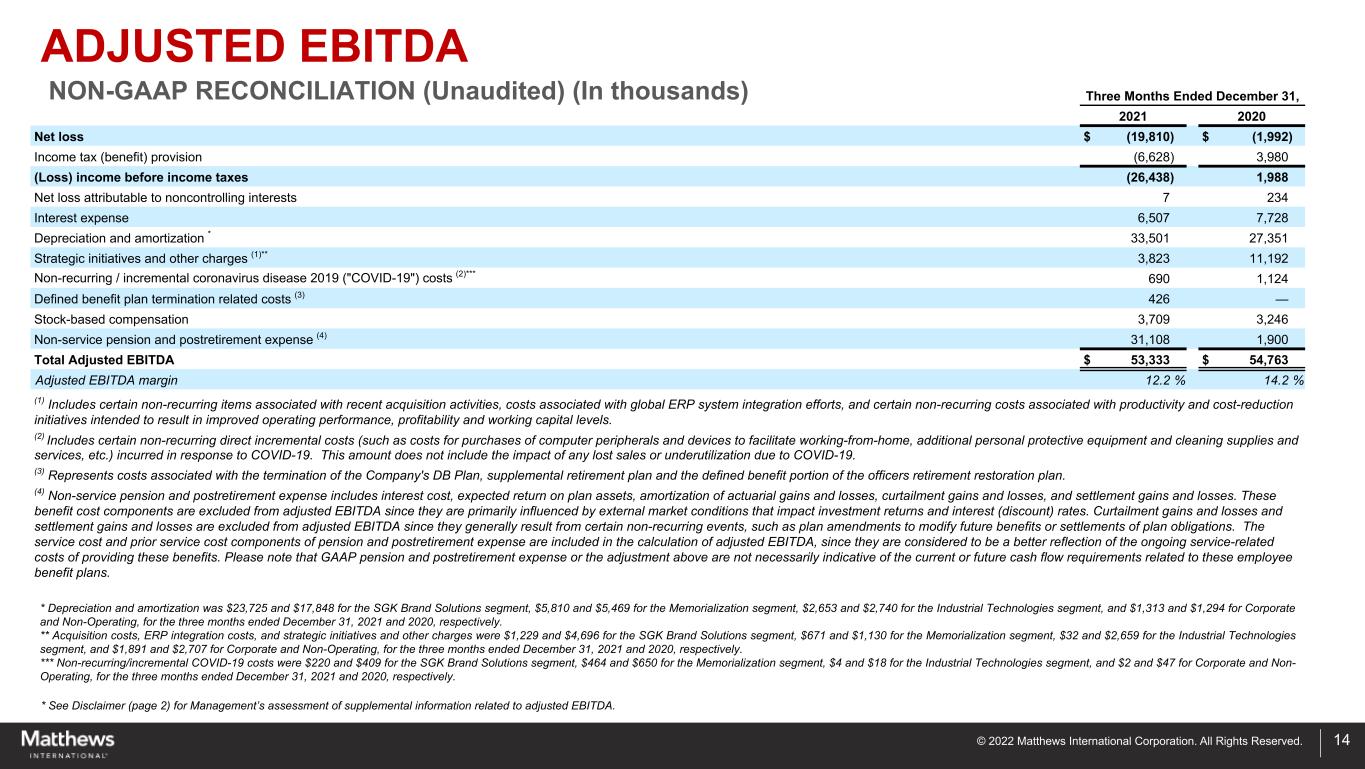
ADJUSTED EBITDA RECONCILIATION (Unaudited)
(In thousands)
| Three Months Ended December 31, | |||||||||||
| 2021 | 2020 | ||||||||||
| Net loss | $ | (19,810) | $ | (1,992) | |||||||
| Income tax (benefit) provision | (6,628) | 3,980 | |||||||||
| (Loss) income before income taxes | (26,438) | 1,988 | |||||||||
| Net loss attributable to noncontrolling interests | 7 | 234 | |||||||||
| Interest expense | 6,507 | 7,728 | |||||||||
Depreciation and amortization * | 33,501 | 27,351 | |||||||||
Strategic initiatives and other charges (1)** | 3,823 | 11,192 | |||||||||
Non-recurring / incremental COVID-19 costs (2)*** | 690 | 1,124 | |||||||||
Defined benefit plan termination related costs (3) | 426 | — | |||||||||
| Stock-based compensation | 3,709 | 3,246 | |||||||||
Non-service pension and postretirement expense (4) | 31,108 | 1,900 | |||||||||
| Total Adjusted EBITDA | $ | 53,333 | $ | 54,763 | |||||||
| Adjusted EBITDA margin | 12.2 | % | 14.2 | % | |||||||
(1) Includes certain non-recurring items associated with recent acquisition activities, costs associated with global ERP system integration efforts, and certain non-recurring costs associated with productivity and cost-reduction initiatives intended to result in improved operating performance, profitability and working capital levels. | |||||||||||
(2) Includes certain non-recurring direct incremental costs (such as costs for purchases of computer peripherals and devices to facilitate working-from-home, additional personal protective equipment and cleaning supplies and services, etc.) incurred in response to COVID-19. This amount does not include the impact of any lost sales or underutilization due to COVID-19. | |||||||||||
(3) Represents costs associated with the termination of the Company's principal defined benefit retirement plan ("DB Plan"), supplemental retirement plan and the defined benefit portion of the officers retirement restoration plan. | |||||||||||
(4) Non-service pension and postretirement expense includes interest cost, expected return on plan assets, amortization of actuarial gains and losses, curtailment gains and losses, and settlement gains and losses. These benefit cost components are excluded from adjusted EBITDA since they are primarily influenced by external market conditions that impact investment returns and interest (discount) rates. Curtailment gains and losses and settlement gains and losses are excluded from adjusted EBITDA since they generally result from certain non-recurring events, such as plan amendments to modify future benefits or settlements of plan obligations. The service cost and prior service cost components of pension and postretirement expense are included in the calculation of adjusted EBITDA, since they are considered to be a better reflection of the ongoing service-related costs of providing these benefits. Please note that GAAP pension and postretirement expense or the adjustment above are not necessarily indicative of the current or future cash flow requirements related to these employee benefit plans. | |||||||||||
* Depreciation and amortization was $23,725 and $17,848 for the SGK Brand Solutions segment, $5,810 and $5,469 for the Memorialization segment, $2,653 and $2,740 for the Industrial Technologies segment, and $1,313 and $1,294 for Corporate and Non-Operating, for the three months ended December 31, 2021 and 2020, respectively.
** Acquisition costs, ERP integration costs, and strategic initiatives and other charges were $1,229 and $4,696 for the SGK Brand Solutions segment, $671 and $1,130 for the Memorialization segment, $32 and $2,659 for the Industrial Technologies segment, and $1,891 and $2,707 for Corporate and Non-Operating, for the three months ended December 31, 2021 and 2020, respectively.
*** Non-recurring/incremental COVID-19 costs were $220 and $409 for the SGK Brand Solutions segment, $464 and $650 for the Memorialization segment, $4 and $18 for the Industrial Technologies segment, and $2 and $47 for Corporate and Non-Operating, for the three months ended December 31, 2021 and 2020, respectively.
Matthews International Reports Results for Fiscal 2022 First Quarter
Page 8 of 9
January 27, 2022
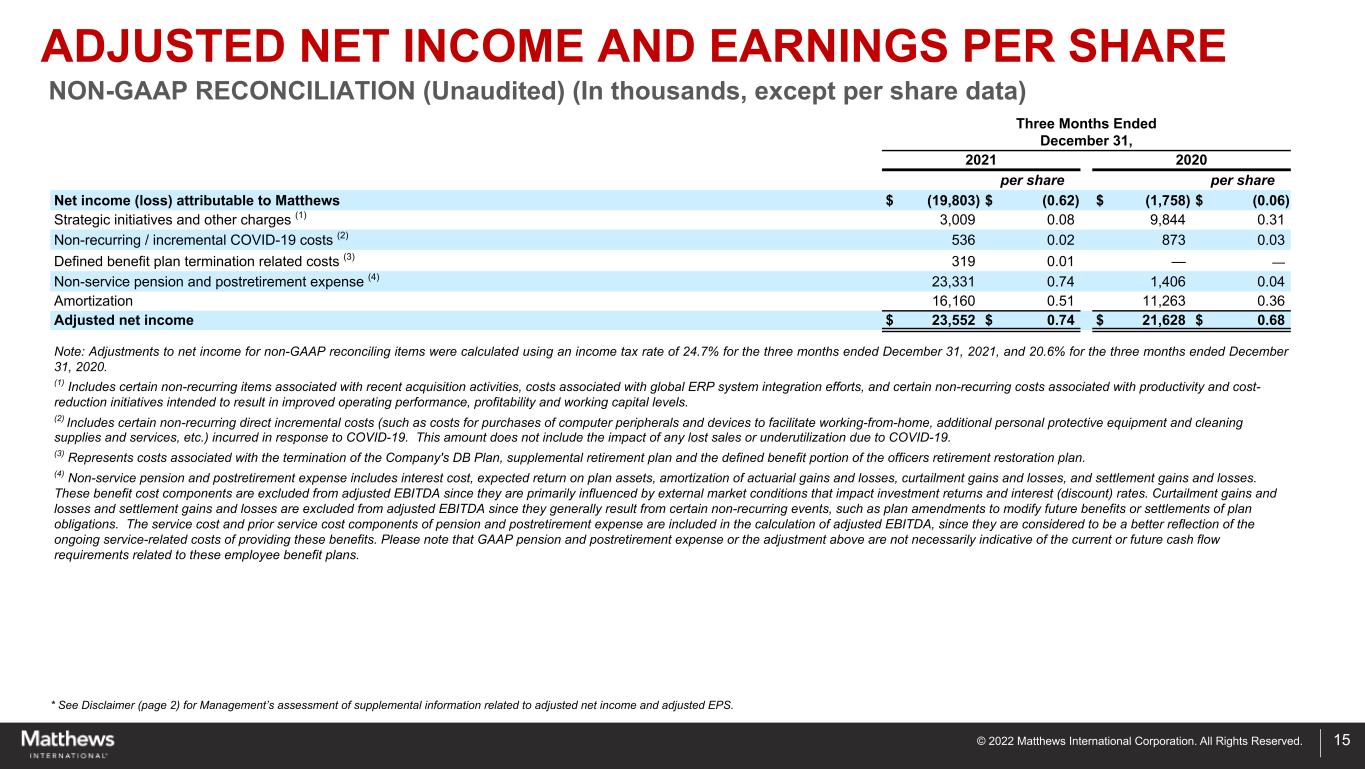
ADJUSTED NET INCOME AND EPS RECONCILIATION (Unaudited)
(In thousands, except per share data)
| Three Months Ended December 31, | |||||||||||||||||
| 2021 | 2020 | ||||||||||||||||
| per share | per share | ||||||||||||||||
| Net income (loss) attributable to Matthews | $ | (19,803) | $ | (0.62) | $ | (1,758) | $ | (0.06) | |||||||||
Strategic initiatives and other charges (1) | 3,009 | 0.08 | 9,844 | 0.31 | |||||||||||||
Non-recurring / incremental COVID-19 costs (2) | 536 | 0.02 | 873 | 0.03 | |||||||||||||
Defined benefit plan termination related costs (3) | 319 | 0.01 | — | — | |||||||||||||
Non-service pension and postretirement expense (4) | 23,331 | 0.74 | 1,406 | 0.04 | |||||||||||||
| Amortization | 16,160 | 0.51 | 11,263 | 0.36 | |||||||||||||
| Adjusted net income | $ | 23,552 | $ | 0.74 | $ | 21,628 | $ | 0.68 | |||||||||
| Note: Adjustments to net income for non-GAAP reconciling items were calculated using an income tax rate of 24.7% for the three months ended December 31, 2021, and 20.6% for the three months ended December 31, 2020. | |||||||||||||||||
(1) Includes certain non-recurring items associated with recent acquisition activities, costs associated with global ERP system integration efforts, and certain non-recurring costs associated with productivity and cost-reduction initiatives intended to result in improved operating performance, profitability and working capital levels. | |||||||||||||||||
(2) Includes certain non-recurring direct incremental costs (such as costs for purchases of computer peripherals and devices to facilitate working-from-home, additional personal protective equipment and cleaning supplies and services, etc.) incurred in response to COVID-19. This amount does not include the impact of any lost sales or underutilization due to COVID-19. | |||||||||||||||||
(3) Represents costs associated with the termination of the Company's DB Plan, supplemental retirement plan and the defined benefit portion of the officers retirement restoration plan. | |||||||||||||||||
(4) Non-service pension and postretirement expense includes interest cost, expected return on plan assets, amortization of actuarial gains and losses, curtailment gains and losses, and settlement gains and losses. These benefit cost components are excluded from adjusted EBITDA since they are primarily influenced by external market conditions that impact investment returns and interest (discount) rates. Curtailment gains and losses and settlement gains and losses are excluded from adjusted EBITDA since they generally result from certain non-recurring events, such as plan amendments to modify future benefits or settlements of plan obligations. The service cost and prior service cost components of pension and postretirement expense are included in the calculation of adjusted EBITDA, since they are considered to be a better reflection of the ongoing service-related costs of providing these benefits. Please note that GAAP pension and postretirement expense or the adjustment above are not necessarily indicative of the current or future cash flow requirements related to these employee benefit plans. | |||||||||||||||||
Matthews International Reports Results for Fiscal 2022 First Quarter
Page 9 of 9
January 27, 2022
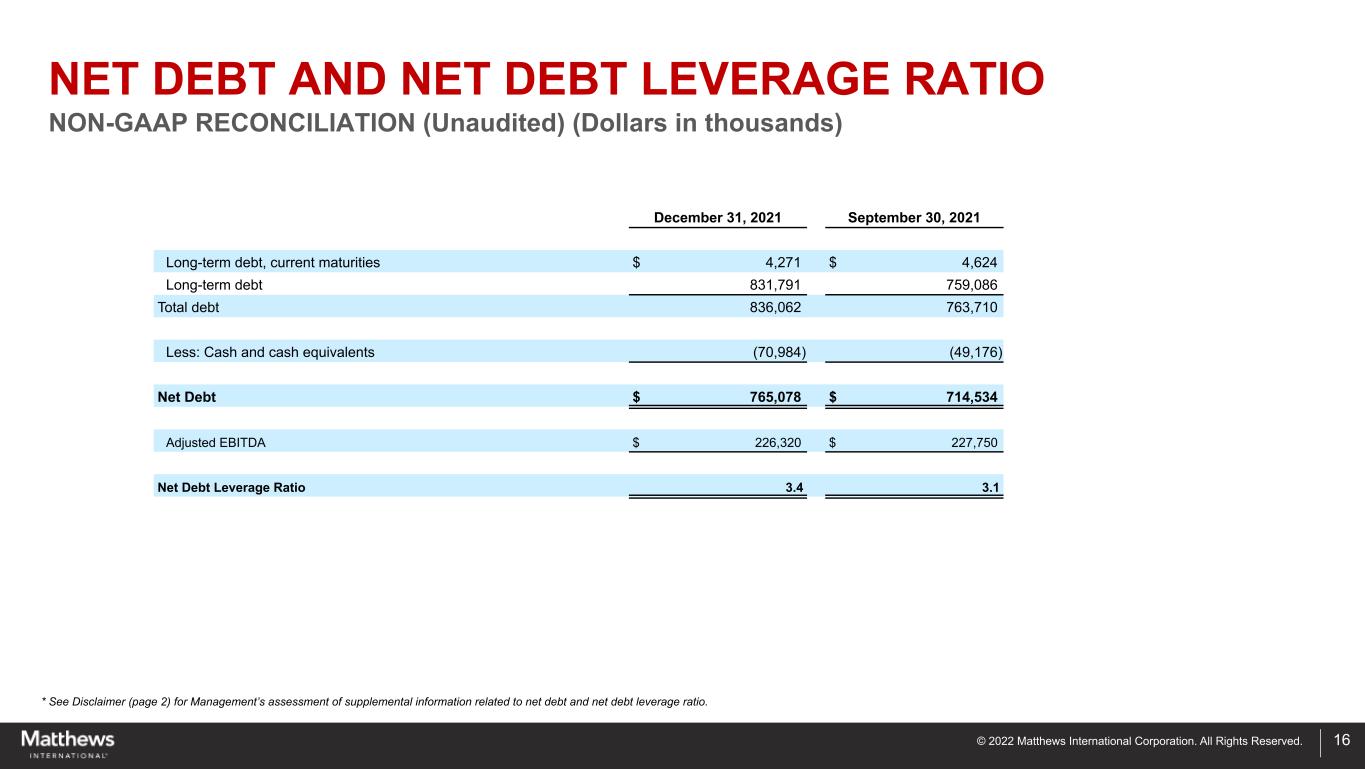
NET DEBT AND NET DEBT LEVERAGE RATIO RECONCILIATION (Unaudited)
(Dollars in thousands)
| December 31, 2021 | September 30, 2021 | |||||||||||||
| Long-term debt, current maturities | $ | 4,271 | $ | 4,624 | ||||||||||
| Long-term debt | 831,791 | 759,086 | ||||||||||||
| Total debt | 836,062 | 763,710 | ||||||||||||
| Less: Cash and cash equivalents | (70,984) | (49,176) | ||||||||||||
| Net Debt | $ | 765,078 | $ | 714,534 | ||||||||||
| Adjusted EBITDA | $ | 226,320 | $ | 227,750 | ||||||||||
| Net Debt Leverage Ratio | 3.4 | 3.1 | ||||||||||||
- ### -