 | NEWS RELEASE | ||||
Matthews International Corporation
Corporate Office
Two NorthShore Center
Pittsburgh, PA 15212-5851
Phone: (412) 442-8200
| January 26, 2023 | Contact: | Steven F. Nicola | William D. Wilson | ||||||||
| Chief Financial Officer and Secretary | Senior Director, Corporate Development | ||||||||||
MATTHEWS INTERNATIONAL REPORTS RESULTS FOR
FISCAL 2023 FIRST QUARTER
Financial Highlights:
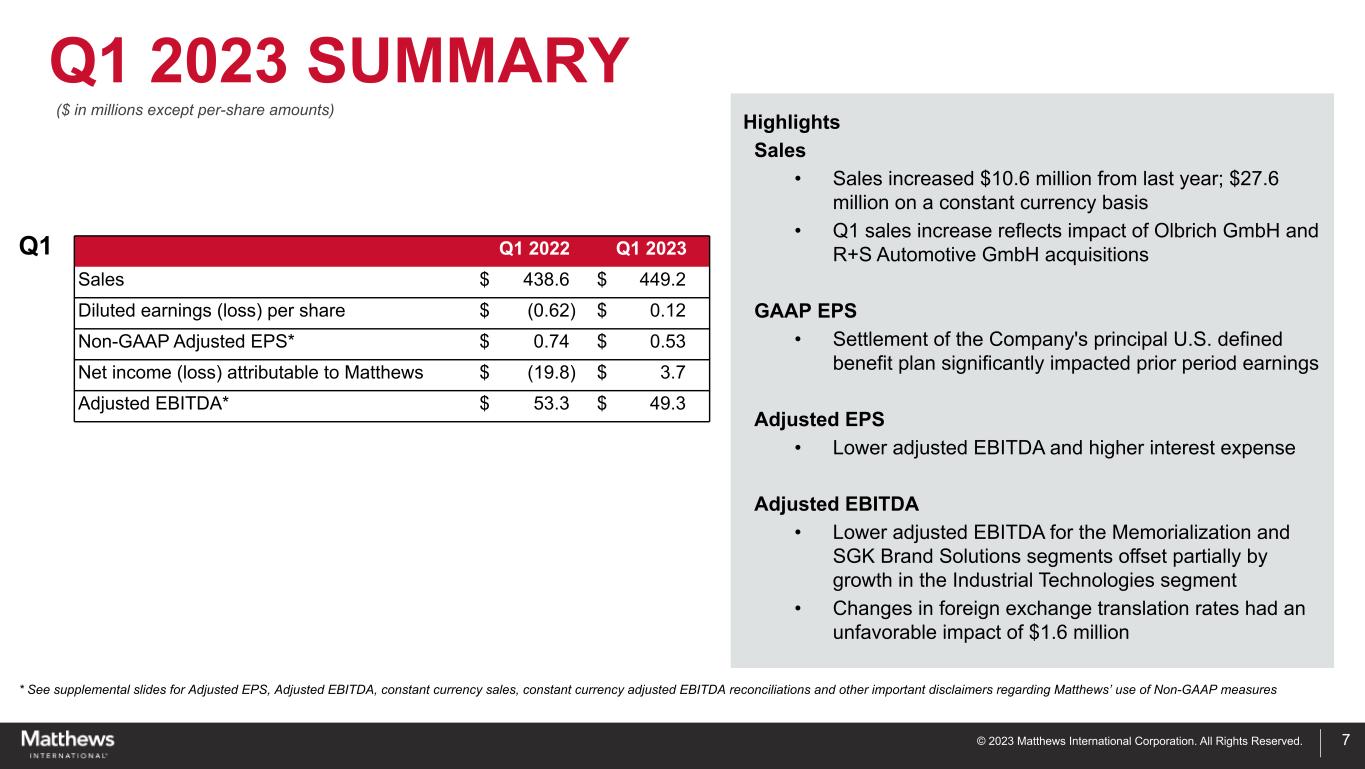
•Sales increased $10.6 million from last year; $27.6 million on a constant currency basis
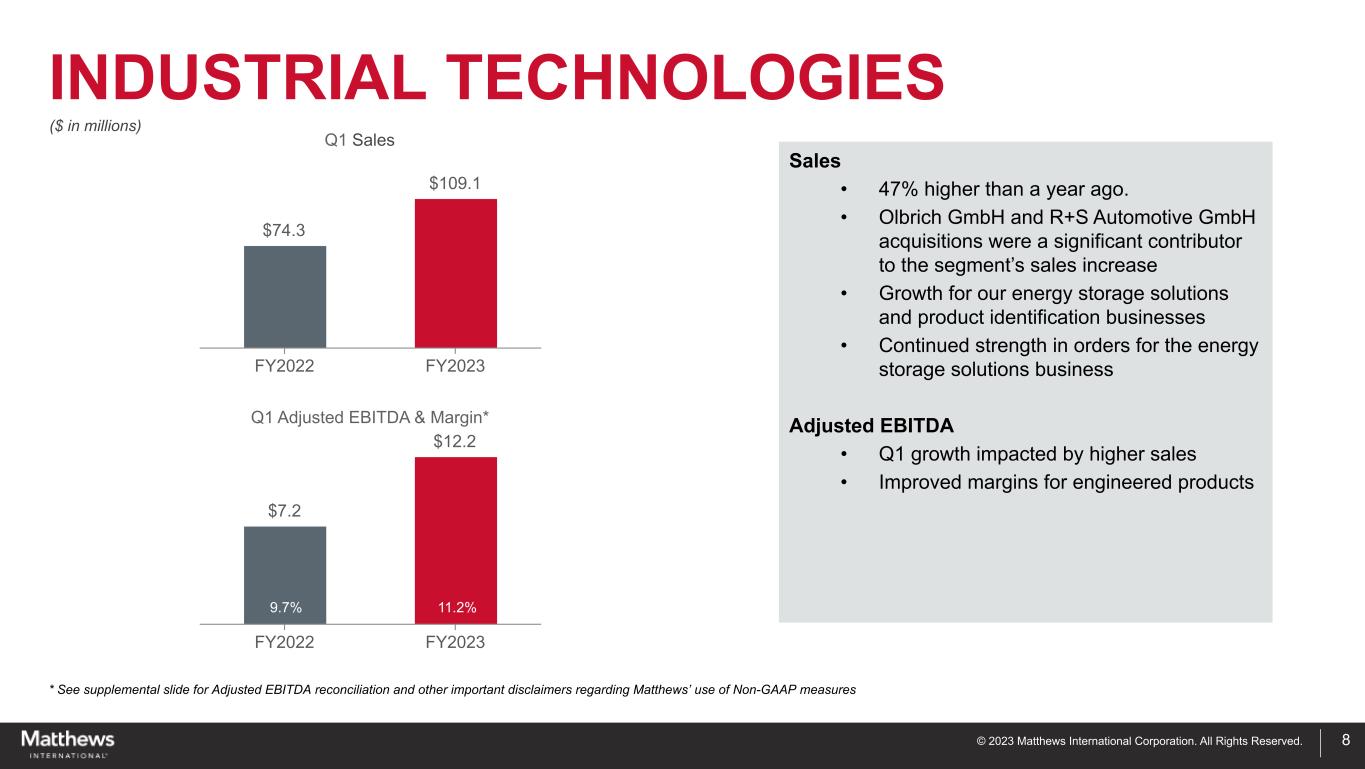
•Industrial Technologies sales 47% higher than a year ago
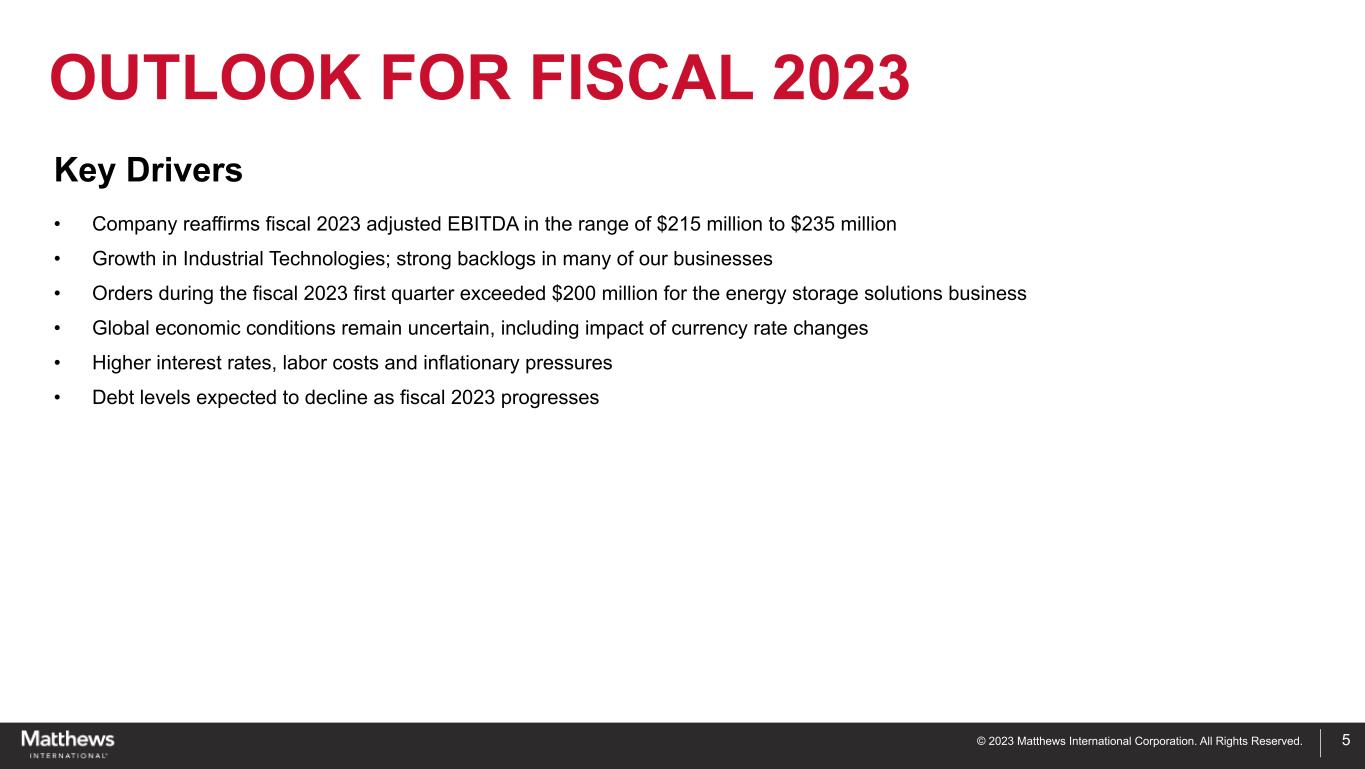
•Company reaffirms guidance
•Webcast: Friday, January 27, 2023, 9:00 a.m., (201) 689-8471
PITTSBURGH, PA, January 26, 2023 - Matthews International Corporation (NASDAQ GSM: MATW) today announced financial results for its first quarter of fiscal 2023.
In discussing the results for the Company’s fiscal 2023 first quarter, Joseph C. Bartolacci, President and Chief Executive Officer, stated:
“We had a strong start to fiscal 2023. Order rates in our Industrial Technologies segment have grown significantly. Total orders for the segment were almost $270 million for the quarter, including the recently announced orders received for our energy storage solutions business.
“On a consolidated basis for the three months ended December 31, 2022, we reported another consecutive quarter of year-over-year sales growth, primarily resulting from a 47% increase in sales for our Industrial Technologies segment.
“The continued strength in orders for our energy storage solutions business reaffirms our commitment to the energy space. Our goal is to be the premier, global supplier of highly engineered, clean energy equipment with industry-leading customers across renewable energy services, transportation, and infrastructure. We are confident that the global and growing shift to electrification, coupled with our recent acquisitions, will continue to drive growth for our Company.
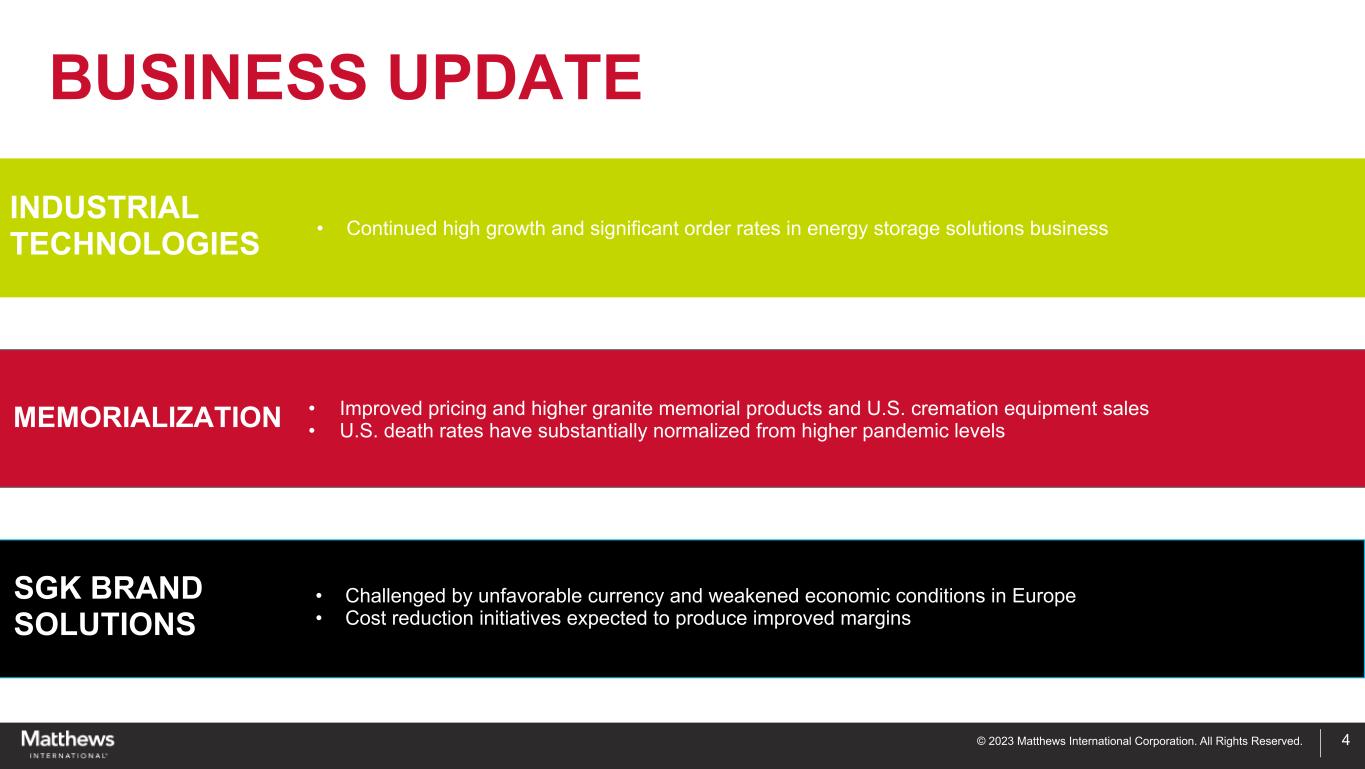
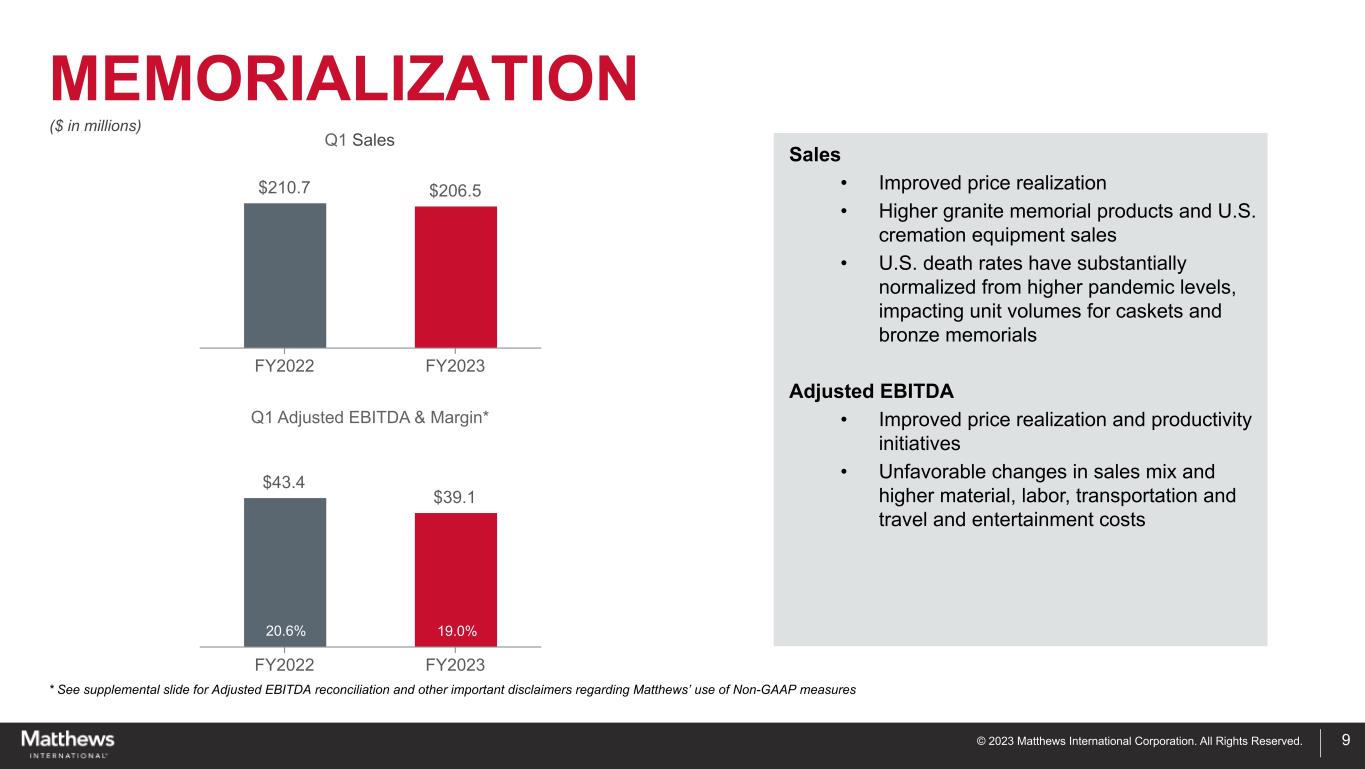
“Memorialization sales were relatively steady for the current quarter as the segment reported only a modest decline despite lower death rates compared to a year ago. Consistent with last quarter, U.S. death rates have substantially normalized from higher pandemic levels, impacting unit volumes for caskets and bronze memorials. However, these impacts were largely mitigated by improved pricing and higher granite memorial products and U.S. cremation equipment sales.
Matthews International Reports Results for Fiscal 2023 First Quarter
Page 2 of 9
January 26, 2023
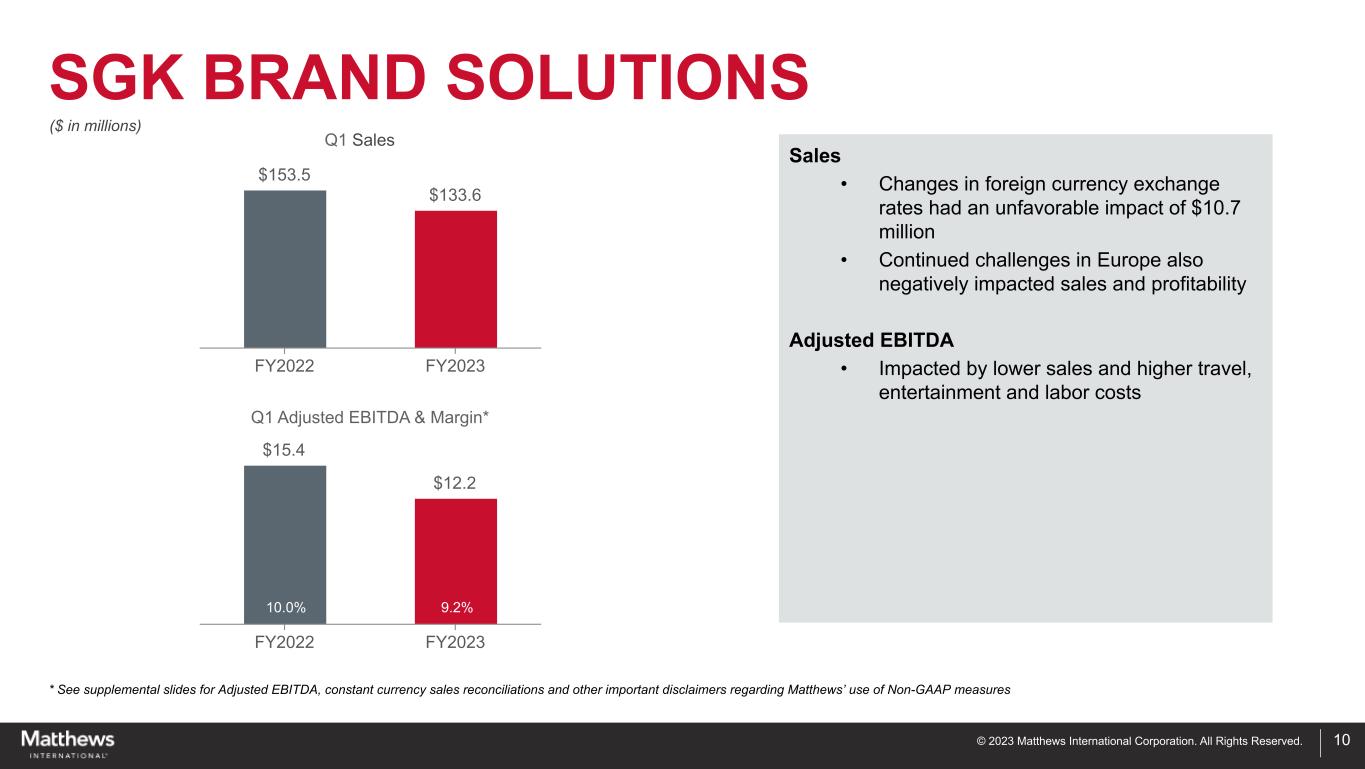
“For our SGK Brand Solutions segment, currency rate changes compared to a year ago, particularly the Euro and British Pound, represented over half of the reported decline in sales, while continued challenges in Europe also negatively impacted sales and profitability. However, we expect the cost reduction actions initiated last quarter will begin to produce improved margins.”
First Quarter Fiscal 2023 Consolidated Results (Unaudited)
| ($ in millions, except per share data) | Q1 FY2023 | Q1 FY2022 | Change | % Change | |||||||||||||||||||
| Sales | $ | 449.2 | $ | 438.6 | $ | 10.6 | 2.4 | % | |||||||||||||||
| Net income (loss) attributable to Matthews | $ | 3.7 | $ | (19.8) | $ | 23.5 | 118.7 | % | |||||||||||||||
| Diluted earnings (loss) per share | $ | 0.12 | $ | (0.62) | $ | 0.74 | 119.4 | % | |||||||||||||||
| Non-GAAP adjusted net income | $ | 16.4 | $ | 23.6 | $ | (7.2) | (30.5) | % | |||||||||||||||
| Non-GAAP adjusted EPS | $ | 0.53 | $ | 0.74 | $ | (0.21) | (28.4) | % | |||||||||||||||
| Adjusted EBITDA | $ | 49.3 | $ | 53.3 | $ | (4.0) | (7.5) | % | |||||||||||||||
| Note: See the attached tables for additional important disclosures regarding Matthews’ use of non-GAAP measures as well as reconciliations of non-GAAP measures to corresponding GAAP measures. Organic sales represent changes in sales excluding the impact of acquisitions, divestitures, and changes in foreign currency exchange rates. | |||||||||||||||||||||||
Consolidated sales for the quarter ended December 31, 2022 were $449.2 million, compared to $438.6 million for the same quarter a year ago, representing an increase of $10.6 million, or 2.4%. On a constant currency basis, consolidated sales increased $27.7 million, or 6.3%, from a year ago. Changes in foreign currency exchange rates were estimated to have an unfavorable impact of $17.0 million on fiscal 2023 first quarter sales compared to the prior year.
Net income attributable to the Company for the quarter ended December 31, 2022 was $3.7 million, or $0.12 per share, compared to loss of $19.8 million, or $0.62 per share in the prior year. The first quarter last year included a charge in connection with the termination and settlement of the Company’s principal U.S. pension plan. On a non-GAAP adjusted basis, earnings for the fiscal 2023 first quarter were $0.53 per share, compared to $0.74 per share a year ago, primarily reflecting lower adjusted EBITDA (net income before interest expense, income taxes, depreciation and amortization, and other adjustments) and higher interest expense. Adjusted EBITDA for the fiscal 2023 first quarter was $49.3 million. On a constant currency basis, adjusted EBITDA was $50.9 million for the current quarter, compared to $53.3 million a year ago, primarily reflecting lower adjusted EBITDA for the Memorialization and SGK Brand Solutions segments offset partially by growth in the Industrial Technologies segment.
Outlook
Mr. Bartolacci further stated: “Based on our orders received in the first quarter and continued robust activity in all of our Industrial Technologies products and services, we expect to report another strong year in this segment. Timing of new projects will influence our results as deliveries for portions of the orders will extend up to 18 months. We expect Memorialization operating results to remain relatively steady compared to last year, primarily reflecting the level of our cremation-related products sales and expected recovery in the segment’s margins. Lastly, for our SGK Brand Solutions segment, year-over-year currency rate changes are expected to present a challenge for the near term. However, our cost reduction actions should improve margins in this business.
“At the present time, we are maintaining our previously reported guidance for fiscal 2023 (adjusted EBITDA range of $215 million to $235 million). Importantly, as we further assess expected timing of deliveries for the recent energy storage solutions orders, our confidence level within this range should improve. We continue, however, to express caution as global economic conditions remain uncertain.”
Matthews International Reports Results for Fiscal 2023 First Quarter
Page 3 of 9
January 26, 2023
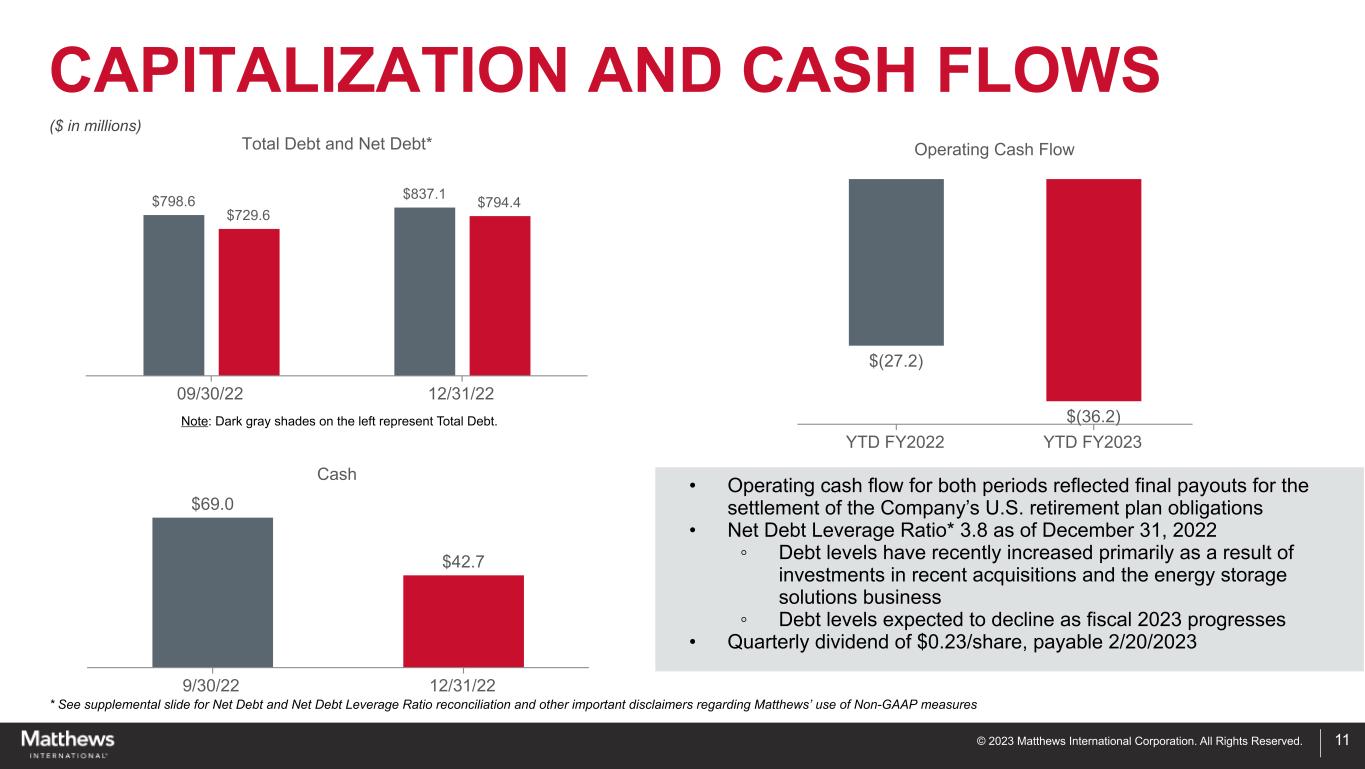
“Lastly, as we anticipated, our debt levels have recently increased primarily as a result of investments in our recent acquisitions and the energy storage solutions business. Based on the expected performance and related cash flows of this business, we expect these levels to decline as fiscal 2023 progresses.”
Webcast
The Company will host a conference call and webcast on Friday, January 27, 2023 at 9:00 a.m. Eastern Time to review its financial and operating results and discuss its corporate strategies and outlook. A question-and-answer session will follow. The conference call can be accessed by calling (201) 689-8471. The audio webcast can be monitored at www.matw.com. As soon as available after the call, a transcript of the call will be posted in the Investor Relations section of the Company’s website at www.matw.com.
About Matthews International Corporation
Matthews International Corporation is a global provider of memorialization products, industrial technologies, and brand solutions. The Memorialization segment is a leading provider of memorialization products, including memorials, caskets, cremation-related products, and cremation and incineration equipment, primarily to cemetery and funeral home customers that help families move from grief to remembrance. The Industrial Technologies segment designs, manufactures, services and distributes high-tech custom energy storage solutions, product identification, and warehouse automation technologies and solutions. The SGK Brand Solutions segment is a leading provider of packaging solutions and brand experiences, helping companies simplify their marketing, amplify their brands and provide value. The Company has approximately 12,000 employees in more than 30 countries on six continents that are committed to delivering the highest quality products and services.
Forward-looking Information
Any forward-looking statements contained in this release are included pursuant to the “safe harbor” provisions of the Private Securities Litigation Reform Act of 1995. Such forward-looking statements involve known and unknown risks and uncertainties that may cause the Company’s actual results in future periods to be materially different from management’s expectations. Although the Company believes that the expectations reflected in such forward-looking statements are reasonable, no assurance can be given that such expectations will prove correct. Factors that could cause the Company's results to differ materially from the results discussed in such forward-looking statements principally include changes in domestic or international economic conditions, changes in foreign currency exchange rates, changes in interest rates, changes in the cost of materials used in the manufacture of the Company's products, changes in mortality and cremation rates, changes in product demand or pricing as a result of consolidation in the industries in which the Company operates, or other factors such as supply chain disruptions, labor shortages or labor cost increases, changes in product demand or pricing as a result of domestic or international competitive pressures, ability to achieve cost-reduction objectives, unknown risks in connection with the Company's acquisitions, cybersecurity concerns, effectiveness of the Company's internal controls, compliance with domestic and foreign laws and regulations, technological factors beyond the Company's control, impact of pandemics or similar outbreaks, or other disruptions to our industries, customers, or supply chains, the impact of global conflicts, such as the current war between Russia and Ukraine, and other factors described in the Company’s Annual Report on Form 10-K and other periodic filings with the U.S. Securities and Exchange Commission.
Matthews International Reports Results for Fiscal 2023 First Quarter
Page 4 of 9
January 26, 2023
CONDENSED CONSOLIDATED STATEMENTS OF INCOME (Unaudited)
(In thousands, except per share data)
| Three Months Ended December 31, | |||||||||||||||||
| 2022 | 2021 | % Change | |||||||||||||||
| Sales | $ | 449,240 | $ | 438,579 | 2.4 | % | |||||||||||
| Cost of sales | (310,310) | (306,942) | 1.1 | % | |||||||||||||
| Gross profit | 138,930 | 131,637 | 5.5 | % | |||||||||||||
| Gross margin | 30.9 | % | 30.0 | % | |||||||||||||
| Selling and administrative expenses | (111,360) | (99,312) | 12.1 | % | |||||||||||||
| Amortization of intangible assets | (10,342) | (21,546) | (52.0) | % | |||||||||||||
| Operating profit | 17,228 | 10,779 | 59.8 | % | |||||||||||||
| Operating margin | 3.8 | % | 2.5 | % | |||||||||||||
| Interest and other deductions, net | (12,269) | (37,217) | (67.0) | % | |||||||||||||
| Income (loss) before income taxes | 4,959 | (26,438) | 118.8 | % | |||||||||||||
| Income taxes | (1,312) | 6,628 | 119.8 | % | |||||||||||||
| Net income (loss) | 3,647 | (19,810) | 118.4 | % | |||||||||||||
| Non-controlling interests | 56 | 7 | NM | ||||||||||||||
| Net income (loss) attributable to Matthews | $ | 3,703 | $ | (19,803) | 118.7 | % | |||||||||||
| Earnings (loss) per share -- diluted | $ | 0.12 | $ | (0.62) | 119.4 | % | |||||||||||
Earnings per share -- non-GAAP (1) | $ | 0.53 | $ | 0.74 | (28.4) | % | |||||||||||
| Dividends declared per share | $ | 0.23 | $ | 0.22 | 4.5 | % | |||||||||||
| Diluted Shares | 30,953 | 31,719 | |||||||||||||||
(1) See reconciliation of non-GAAP financial information provided in tables at the end of this release | |||||||||||||||||
| NM: Not meaningful | |||||||||||||||||
SEGMENT INFORMATION (Unaudited)
(In thousands)
| Three Months Ended December 31, | |||||||||||
| 2022 | 2021 | ||||||||||
| Sales: | |||||||||||
| Memorialization | $ | 206,502 | $ | 210,706 | |||||||
| Industrial Technologies | 109,143 | 74,331 | |||||||||
| SGK Brand Solutions | 133,595 | 153,542 | |||||||||
| $ | 449,240 | $ | 438,579 | ||||||||
| Adjusted EBITDA: | |||||||||||
| Memorialization | $ | 39,137 | $ | 43,370 | |||||||
| Industrial Technologies | 12,202 | 7,183 | |||||||||
| SGK Brand Solutions | 12,232 | 15,414 | |||||||||
| Corporate and Non-Operating | (14,280) | (12,634) | |||||||||
Total Adjusted EBITDA (1) | $ | 49,291 | $ | 53,333 | |||||||
(1) See reconciliation of non-GAAP financial information provided in tables at the end of this release | |||||||||||
Matthews International Reports Results for Fiscal 2023 First Quarter
Page 5 of 9
January 26, 2023
CONDENSED CONSOLIDATED BALANCE SHEET INFORMATION (Unaudited)
(In thousands)
| December 31, 2022 | September 30, 2022 | |||||||||||||||||||
| ASSETS | ||||||||||||||||||||
| Cash and cash equivalents | $ | 42,718 | $ | 69,016 | ||||||||||||||||
| Accounts receivable, net | 221,613 | 221,015 | ||||||||||||||||||
| Inventories, net | 245,565 | 225,440 | ||||||||||||||||||
| Other current assets | 123,348 | 113,145 | ||||||||||||||||||
| Total current assets | 633,244 | 628,616 | ||||||||||||||||||
| Property, plant and equipment, net | 264,684 | 256,065 | ||||||||||||||||||
| Goodwill | 692,015 | 675,421 | ||||||||||||||||||
| Other intangible assets, net | 193,756 | 202,154 | ||||||||||||||||||
| Other long-term assets | 119,243 | 120,515 | ||||||||||||||||||
| Total assets | $ | 1,902,942 | $ | 1,882,771 | ||||||||||||||||
| LIABILITIES | ||||||||||||||||||||
| Long-term debt, current maturities | $ | 2,977 | $ | 3,277 | ||||||||||||||||
| Other current liabilities | 363,767 | 408,098 | ||||||||||||||||||
| Total current liabilities | 366,744 | 411,375 | ||||||||||||||||||
| Long-term debt | 834,127 | 795,291 | ||||||||||||||||||
| Other long-term liabilities | 197,154 | 189,029 | ||||||||||||||||||
| Total liabilities | 1,398,025 | 1,395,695 | ||||||||||||||||||
| SHAREHOLDERS' EQUITY | ||||||||||||||||||||
| Total shareholders' equity | 504,917 | 487,076 | ||||||||||||||||||
| Total liabilities and shareholders' equity | $ | 1,902,942 | $ | 1,882,771 | ||||||||||||||||
CONDENSED CONSOLIDATED CASH FLOWS INFORMATION (Unaudited)
(In thousands)
| Three Months Ended December 31, | |||||||||||
| 2022 | 2021 | ||||||||||
| Cash flows from operating activities: | |||||||||||
| Net income (loss) | $ | 3,647 | $ | (19,810) | |||||||
| Adjustments to reconcile net income (loss) to net cash flows from operating activities: | |||||||||||
| Depreciation and amortization | 23,729 | 33,501 | |||||||||
| Changes in working capital items | (43,152) | (40,816) | |||||||||
| Other operating activities | (20,448) | (31) | |||||||||
| Net cash used in operating activities | (36,224) | (27,156) | |||||||||
| Cash flows from investing activities: | |||||||||||
| Capital expenditures | (12,398) | (12,640) | |||||||||
| Acquisitions, net of cash acquired | (1,759) | — | |||||||||
| Other investing activities | 4 | 171 | |||||||||
| Net cash used in investing activities | (14,153) | (12,469) | |||||||||
| Cash flows from financing activities: | |||||||||||
| Net payments from long-term debt | 32,722 | 72,345 | |||||||||
| Purchases of treasury stock | (2,451) | (2,435) | |||||||||
| Dividends | (7,003) | (6,824) | |||||||||
| Other financing activities | (946) | (725) | |||||||||
| Net cash provided by financing activities | 22,322 | 62,361 | |||||||||
| Effect of exchange rate changes on cash | 1,757 | (928) | |||||||||
| Net change in cash, cash equivalents and restricted cash | $ | (26,298) | $ | 21,808 | |||||||
Matthews International Reports Results for Fiscal 2023 First Quarter
Page 6 of 9
January 26, 2023
Reconciliations of Non-GAAP Financial Measures
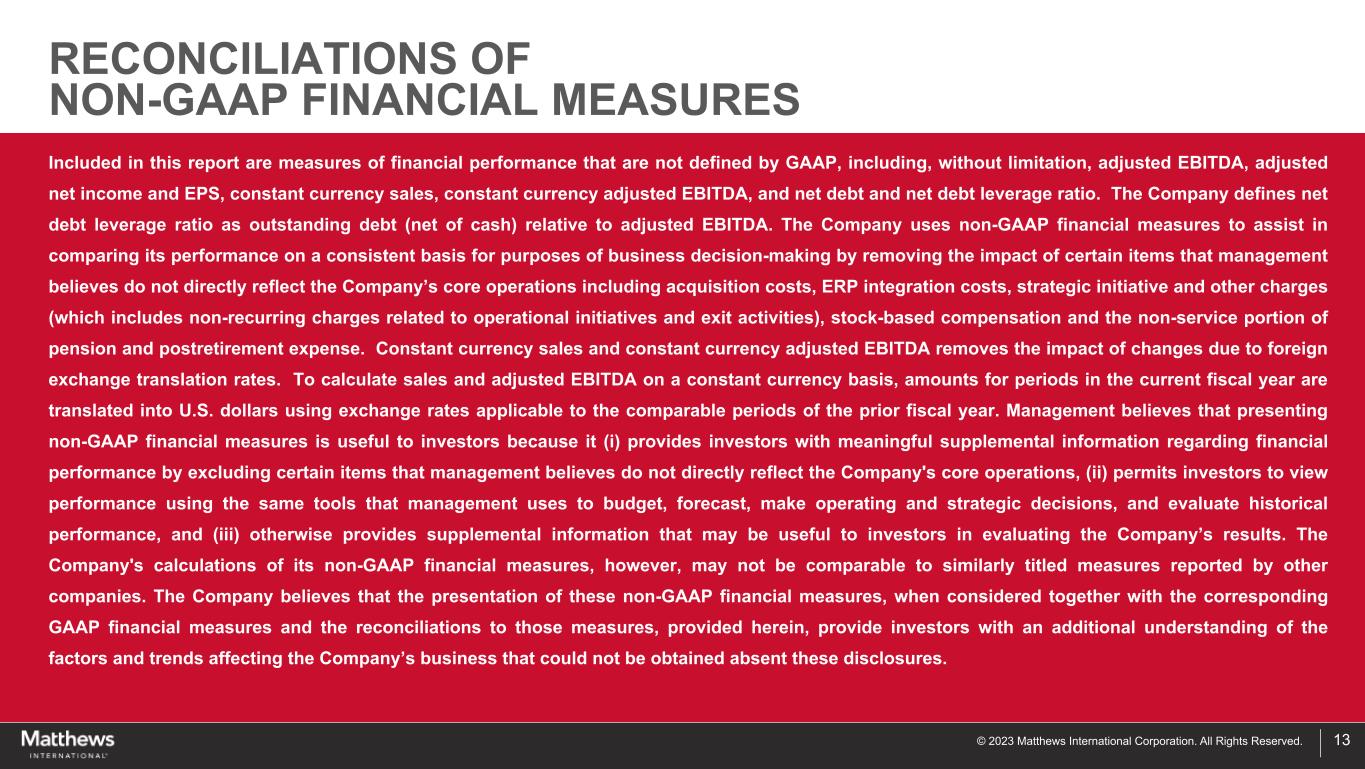
Included in this report are measures of financial performance that are not defined by GAAP, including, without limitation, adjusted EBITDA, adjusted net income and EPS, constant currency sales, constant currency adjusted EBITDA, net debt and net debt leverage ratio. The Company defines net debt leverage ratio as outstanding debt (net of cash) relative to adjusted EBITDA. The Company uses non-GAAP financial measures to assist in comparing its performance on a consistent basis for purposes of business decision-making by removing the impact of certain items that management believes do not directly reflect the Company’s core operations including acquisition costs, ERP integration costs, strategic initiative and other charges (which includes non-recurring charges related to operational initiatives and exit activities), stock-based compensation and the non-service portion of pension and postretirement expense. Constant currency sales and constant currency adjusted EBITDA remove the impact of changes due to foreign exchange translation rates. To calculate sales and adjusted EBITDA on a constant currency basis, amounts for periods in the current fiscal year are translated into U.S. dollars using exchange rates applicable to the comparable periods of the prior fiscal year. Management believes that presenting non-GAAP financial measures is useful to investors because it (i) provides investors with meaningful supplemental information regarding financial performance by excluding certain items that management believes do not directly reflect the Company's core operations, (ii) permits investors to view performance using the same tools that management uses to budget, forecast, make operating and strategic decisions, and evaluate historical performance, and (iii) otherwise provides supplemental information that may be useful to investors in evaluating the Company’s results. The Company's calculations of its non-GAAP financial measures, however, may not be comparable to similarly titled measures reported by other companies. The Company believes that the presentation of these non-GAAP financial measures, when considered together with the corresponding GAAP financial measures and the reconciliations to those measures, provided herein, provide investors with an additional understanding of the factors and trends affecting the Company’s business that could not be obtained absent these disclosures.
Matthews International Reports Results for Fiscal 2023 First Quarter
Page 7 of 9
January 26, 2023
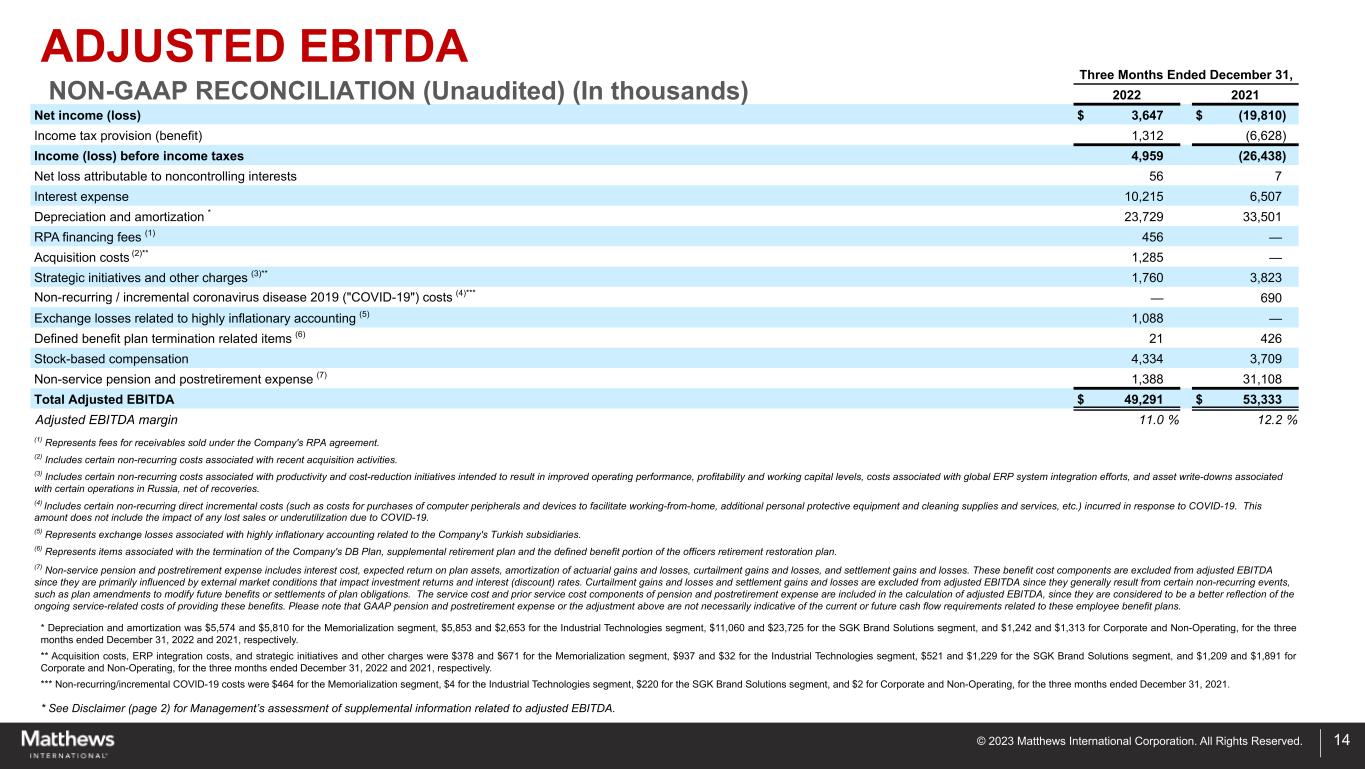
ADJUSTED EBITDA RECONCILIATION (Unaudited)
(In thousands)
| Three Months Ended December 31, | |||||||||||
| 2022 | 2021 | ||||||||||
| Net income (loss) | $ | 3,647 | $ | (19,810) | |||||||
| Income tax provision (benefit) | 1,312 | (6,628) | |||||||||
| Income (loss) before income taxes | 4,959 | (26,438) | |||||||||
| Net loss attributable to noncontrolling interests | 56 | 7 | |||||||||
| Interest expense | 10,215 | 6,507 | |||||||||
Depreciation and amortization * | 23,729 | 33,501 | |||||||||
RPA financing fees (1) | 456 | — | |||||||||
Acquisition costs (2)** | 1,285 | — | |||||||||
Strategic initiatives and other charges (3)** | 1,760 | 3,823 | |||||||||
Non-recurring / incremental coronavirus disease 2019 ("COVID-19") costs (4)*** | — | 690 | |||||||||
Exchange losses related to highly inflationary accounting (5) | 1,088 | — | |||||||||
Defined benefit plan termination related items (6) | 21 | 426 | |||||||||
| Stock-based compensation | 4,334 | 3,709 | |||||||||
Non-service pension and postretirement expense (7) | 1,388 | 31,108 | |||||||||
| Total Adjusted EBITDA | $ | 49,291 | $ | 53,333 | |||||||
| Adjusted EBITDA margin | 11.0 | % | 12.2 | % | |||||||
(1) Represents fees for receivables sold under the Company's RPA agreement. | |||||||||||
(2) Includes certain non-recurring costs associated with recent acquisition activities. | |||||||||||
(3) Includes certain non-recurring costs associated with productivity and cost-reduction initiatives intended to result in improved operating performance, profitability and working capital levels, costs associated with global ERP system integration efforts, and asset write-downs associated with certain operations in Russia, net of recoveries. | |||||||||||
(4) Includes certain non-recurring direct incremental costs (such as costs for purchases of computer peripherals and devices to facilitate working-from-home, additional personal protective equipment and cleaning supplies and services, etc.) incurred in response to COVID-19. This amount does not include the impact of any lost sales or underutilization due to COVID-19. | |||||||||||
(5) Represents exchange losses associated with highly inflationary accounting related to the Company's Turkish subsidiaries. | |||||||||||
(6) Represents items associated with the termination of the Company's DB Plan, supplemental retirement plan and the defined benefit portion of the officers retirement restoration plan. | |||||||||||
(7) Non-service pension and postretirement expense includes interest cost, expected return on plan assets, amortization of actuarial gains and losses, curtailment gains and losses, and settlement gains and losses. These benefit cost components are excluded from adjusted EBITDA since they are primarily influenced by external market conditions that impact investment returns and interest (discount) rates. Curtailment gains and losses and settlement gains and losses are excluded from adjusted EBITDA since they generally result from certain non-recurring events, such as plan amendments to modify future benefits or settlements of plan obligations. The service cost and prior service cost components of pension and postretirement expense are included in the calculation of adjusted EBITDA, since they are considered to be a better reflection of the ongoing service-related costs of providing these benefits. Please note that GAAP pension and postretirement expense or the adjustment above are not necessarily indicative of the current or future cash flow requirements related to these employee benefit plans. | |||||||||||
* Depreciation and amortization was $5,574 and $5,810 for the Memorialization segment, $5,853 and $2,653 for the Industrial Technologies segment, $11,060 and $23,725 for the SGK Brand Solutions segment, and $1,242 and $1,313 for Corporate and Non-Operating, for the three months ended December 31, 2022 and 2021, respectively.
** Acquisition costs, ERP integration costs, and strategic initiatives and other charges were $378 and $671 for the Memorialization segment, $937 and $32 for the Industrial Technologies segment, $521 and $1,229 for the SGK Brand Solutions segment, and $1,209 and $1,891 for Corporate and Non-Operating, for the three months ended December 31, 2022 and 2021, respectively.
*** Non-recurring/incremental COVID-19 costs were $464 for the Memorialization segment, $4 for the Industrial Technologies segment, $220 for the SGK Brand Solutions segment, and $2 for Corporate and Non-Operating, for the three months ended December 31, 2021.
Matthews International Reports Results for Fiscal 2023 First Quarter
Page 8 of 9
January 26, 2023
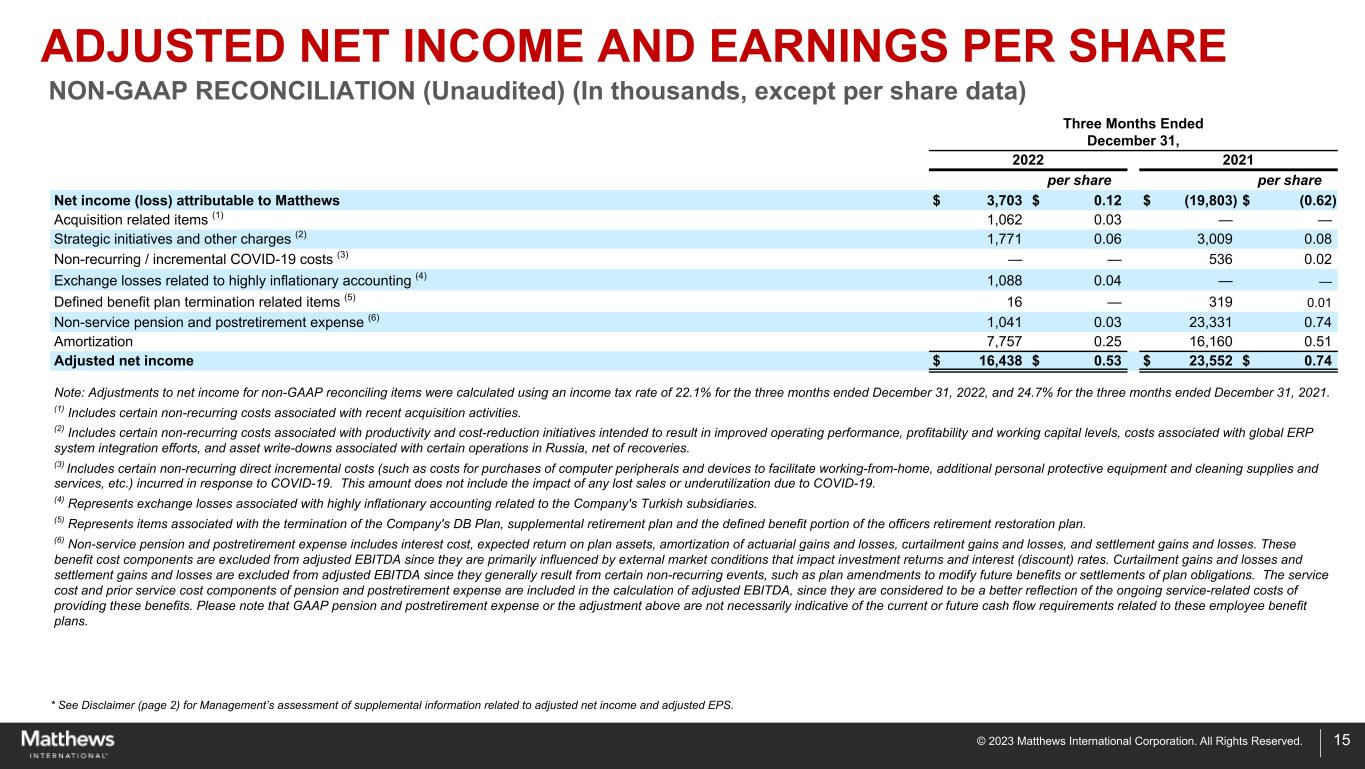
ADJUSTED NET INCOME AND EPS RECONCILIATION (Unaudited)
(In thousands, except per share data)
| Three Months Ended December 31, | |||||||||||||||||
| 2022 | 2021 | ||||||||||||||||
| per share | per share | ||||||||||||||||
| Net income (loss) attributable to Matthews | $ | 3,703 | $ | 0.12 | $ | (19,803) | $ | (0.62) | |||||||||
Acquisition related items (1) | 1,062 | 0.03 | — | — | |||||||||||||
Strategic initiatives and other charges (2) | 1,771 | 0.06 | 3,009 | 0.08 | |||||||||||||
Non-recurring / incremental COVID-19 costs (3) | — | — | 536 | 0.02 | |||||||||||||
Exchange losses related to highly inflationary accounting (4) | 1,088 | 0.04 | — | — | |||||||||||||
Defined benefit plan termination related items (5) | 16 | — | 319 | 0.01 | |||||||||||||
Non-service pension and postretirement expense (6) | 1,041 | 0.03 | 23,331 | 0.74 | |||||||||||||
| Amortization | 7,757 | 0.25 | 16,160 | 0.51 | |||||||||||||
| Adjusted net income | $ | 16,438 | $ | 0.53 | $ | 23,552 | $ | 0.74 | |||||||||
| Note: Adjustments to net income for non-GAAP reconciling items were calculated using an income tax rate of 22.1% for the three months ended December 31, 2022, and 24.7% for the three months ended December 31, 2021. | |||||||||||||||||
(1) Includes certain non-recurring costs associated with recent acquisition activities. | |||||||||||||||||
(2) Includes certain non-recurring costs associated with productivity and cost-reduction initiatives intended to result in improved operating performance, profitability and working capital levels, costs associated with global ERP system integration efforts, and asset write-downs associated with certain operations in Russia, net of recoveries. | |||||||||||||||||
(3) Includes certain non-recurring direct incremental costs (such as costs for purchases of computer peripherals and devices to facilitate working-from-home, additional personal protective equipment and cleaning supplies and services, etc.) incurred in response to COVID-19. This amount does not include the impact of any lost sales or underutilization due to COVID-19. | |||||||||||||||||
(4) Represents exchange losses associated with highly inflationary accounting related to the Company's Turkish subsidiaries. | |||||||||||||||||
(5) Represents items associated with the termination of the Company's DB Plan, supplemental retirement plan and the defined benefit portion of the officers retirement restoration plan. | |||||||||||||||||
(6) Non-service pension and postretirement expense includes interest cost, expected return on plan assets, amortization of actuarial gains and losses, curtailment gains and losses, and settlement gains and losses. These benefit cost components are excluded from adjusted EBITDA since they are primarily influenced by external market conditions that impact investment returns and interest (discount) rates. Curtailment gains and losses and settlement gains and losses are excluded from adjusted EBITDA since they generally result from certain non-recurring events, such as plan amendments to modify future benefits or settlements of plan obligations. The service cost and prior service cost components of pension and postretirement expense are included in the calculation of adjusted EBITDA, since they are considered to be a better reflection of the ongoing service-related costs of providing these benefits. Please note that GAAP pension and postretirement expense or the adjustment above are not necessarily indicative of the current or future cash flow requirements related to these employee benefit plans. | |||||||||||||||||
Matthews International Reports Results for Fiscal 2023 First Quarter
Page 9 of 9
January 26, 2023
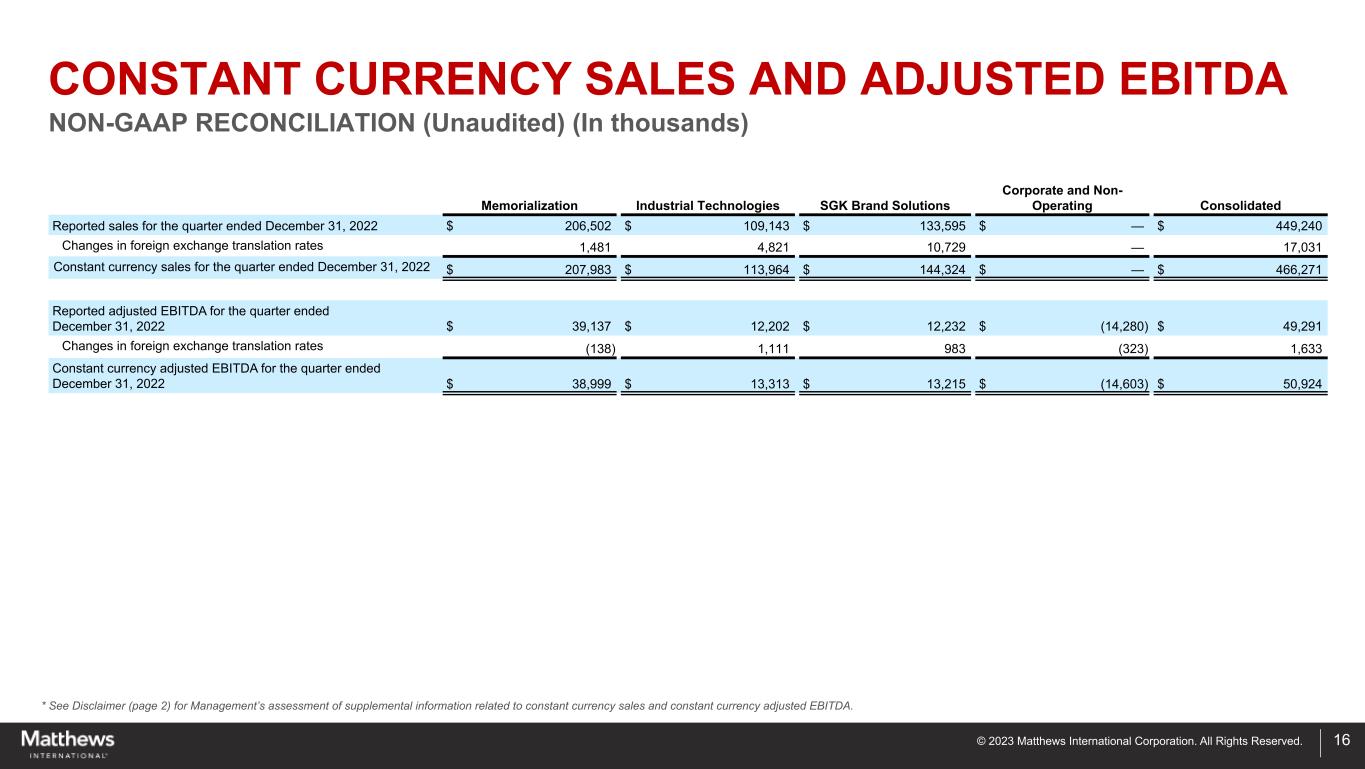
CONSTANT CURRENCY SALES AND ADJUSTED EBITDA RECONCILIATION (Unaudited)
(In thousands)
| Memorialization | Industrial Technologies | SGK Brand Solutions | Corporate and Non-Operating | Consolidated | |||||||||||||||||||||||||
Reported sales for the quarter ended December 31, 2022 | $ | 206,502 | $ | 109,143 | $ | 133,595 | $ | — | $ | 449,240 | |||||||||||||||||||
| Changes in foreign exchange translation rates | 1,481 | 4,821 | 10,729 | — | 17,031 | ||||||||||||||||||||||||
Constant currency sales for the quarter ended December 31, 2022 | $ | 207,983 | $ | 113,964 | $ | 144,324 | $ | — | $ | 466,271 | |||||||||||||||||||
Reported adjusted EBITDA for the quarter ended December 31, 2022 | $ | 39,137 | $ | 12,202 | $ | 12,232 | $ | (14,280) | $ | 49,291 | |||||||||||||||||||
| Changes in foreign exchange translation rates | (138) | 1,111 | 983 | (323) | 1,633 | ||||||||||||||||||||||||
Constant currency adjusted EBITDA for the quarter ended December 31, 2022 | $ | 38,999 | $ | 13,313 | $ | 13,215 | $ | (14,603) | $ | 50,924 | |||||||||||||||||||
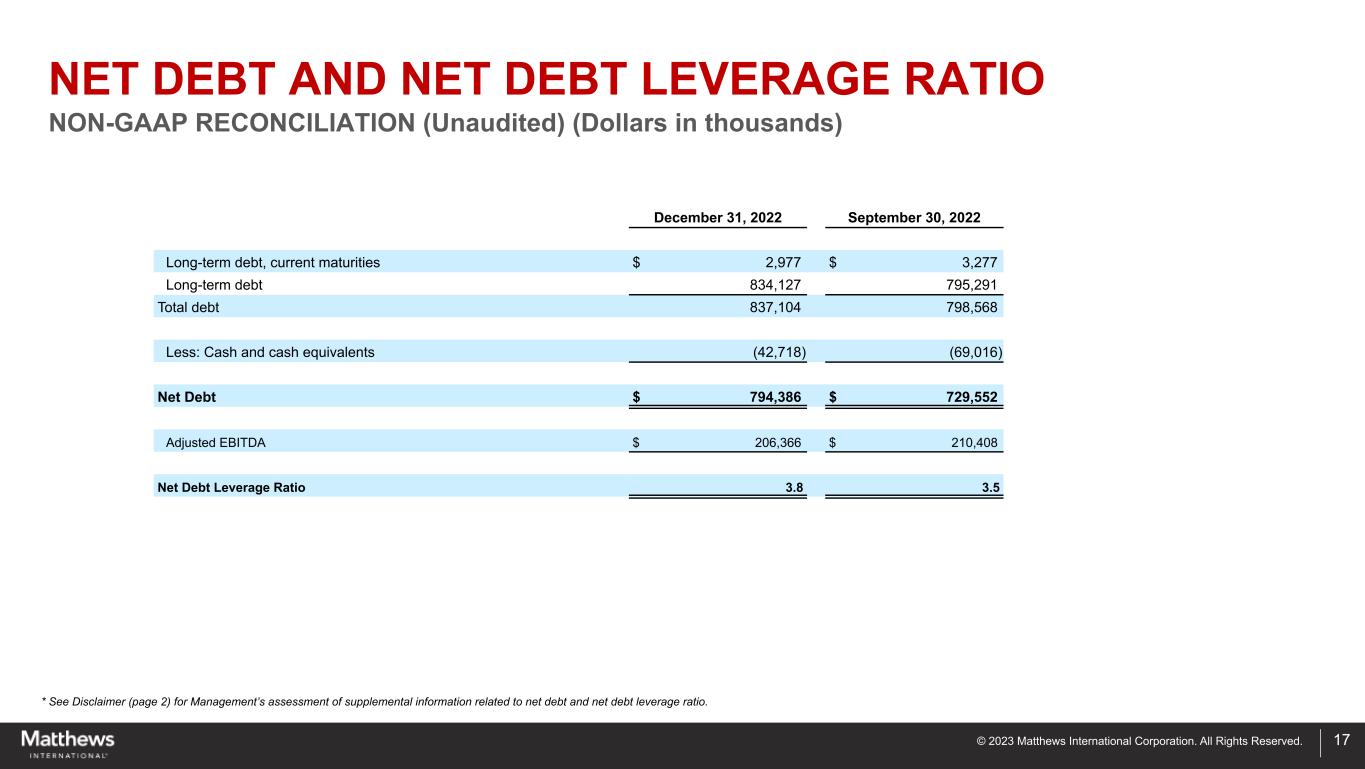
NET DEBT AND NET DEBT LEVERAGE RATIO RECONCILIATION (Unaudited)
(Dollars in thousands)
| December 31, 2022 | September 30, 2022 | |||||||||||||
| Long-term debt, current maturities | $ | 2,977 | $ | 3,277 | ||||||||||
| Long-term debt | 834,127 | 795,291 | ||||||||||||
| Total debt | 837,104 | 798,568 | ||||||||||||
| Less: Cash and cash equivalents | (42,718) | (69,016) | ||||||||||||
| Net Debt | $ | 794,386 | $ | 729,552 | ||||||||||
| Adjusted EBITDA | $ | 206,366 | $ | 210,408 | ||||||||||
| Net Debt Leverage Ratio | 3.8 | 3.5 | ||||||||||||
- ### -