Exhibit 99.1

Release: | 4:10 P.M. July 17, 2025 |
212-365-6721
Metropolitan Bank Holding Corp. Reports Second Quarter 2025 Results
Net Interest Margin increased to 3.83%
Diluted EPS of $1.76
Financial Highlights
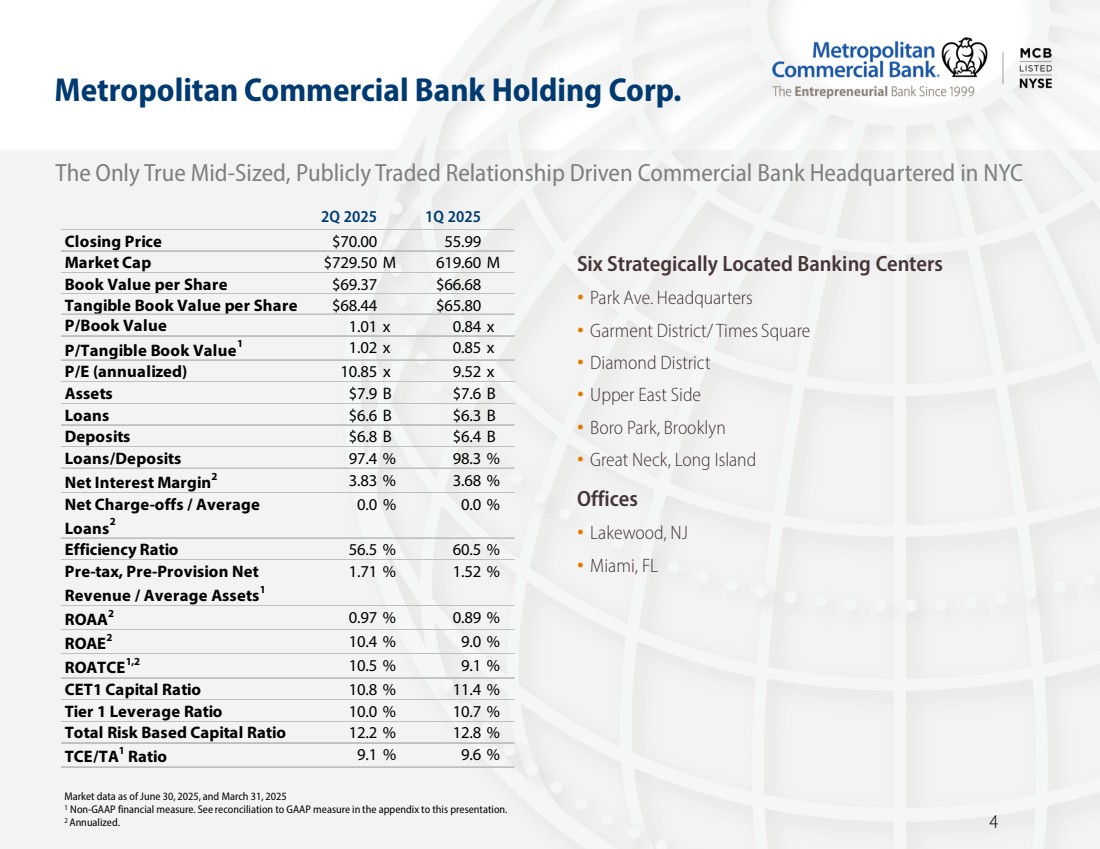
NEW YORK, July 17, 2025 ‒ Metropolitan Bank Holding Corp. (the “Company”) (NYSE: MCB), the holding company for Metropolitan Commercial Bank (the “Bank”), reported net income of $18.8 million, or $1.76 per diluted common share, for the second quarter of 2025 compared to $16.4 million, or $1.45 per diluted common share, for the first quarter of 2025, and $16.8 million, or $1.50 per diluted common share, for the second quarter of 2024.
1
Mark DeFazio, President and Chief Executive Officer, commented,
“I am pleased with MCB’s sustained performance throughout our various business lines. Our second quarter and first half results underscore the strength and discipline of our franchise, which position us well to balance supporting our clients with attractive shareholder returns. Our true diversified commercial bank offerings clearly differentiate MCB from our peers.
“In the second quarter, we completed our initial $50 million share repurchase program announced in March, at prices well below our tangible book value. Given robust results coupled with confidence in continued business strength, our board has authorized an additional $50 million repurchase program for a total of $100 million authorized year to date. As part of our multi-pronged approach to return capital to shareholders while maintaining investment and expansion optionality, our board also approved an initial quarterly cash dividend.
“Our healthy balance sheet, together with strong earnings momentum, enables us to opportunistically capitalize on various strategic initiatives to support responsible growth.”
Balance Sheet
Total cash and cash equivalents were $152.5 million at June 30, 2025, a decrease of $44.0 million, or 22.4%, from March 31, 2025, and a decrease of $92.2 million, or 37.7%, from June 30, 2024. The decrease from March 31, 2025 primarily reflects an increase in the loan book of $270.7 million and an $85.0 million decrease in wholesale funding, partially offset by an increase of $342.0 million in deposits. The decrease from June 30, 2024 primarily reflects an increase in the loan book of $773.9 million, partially offset by an increase of $621.6 million in deposits.
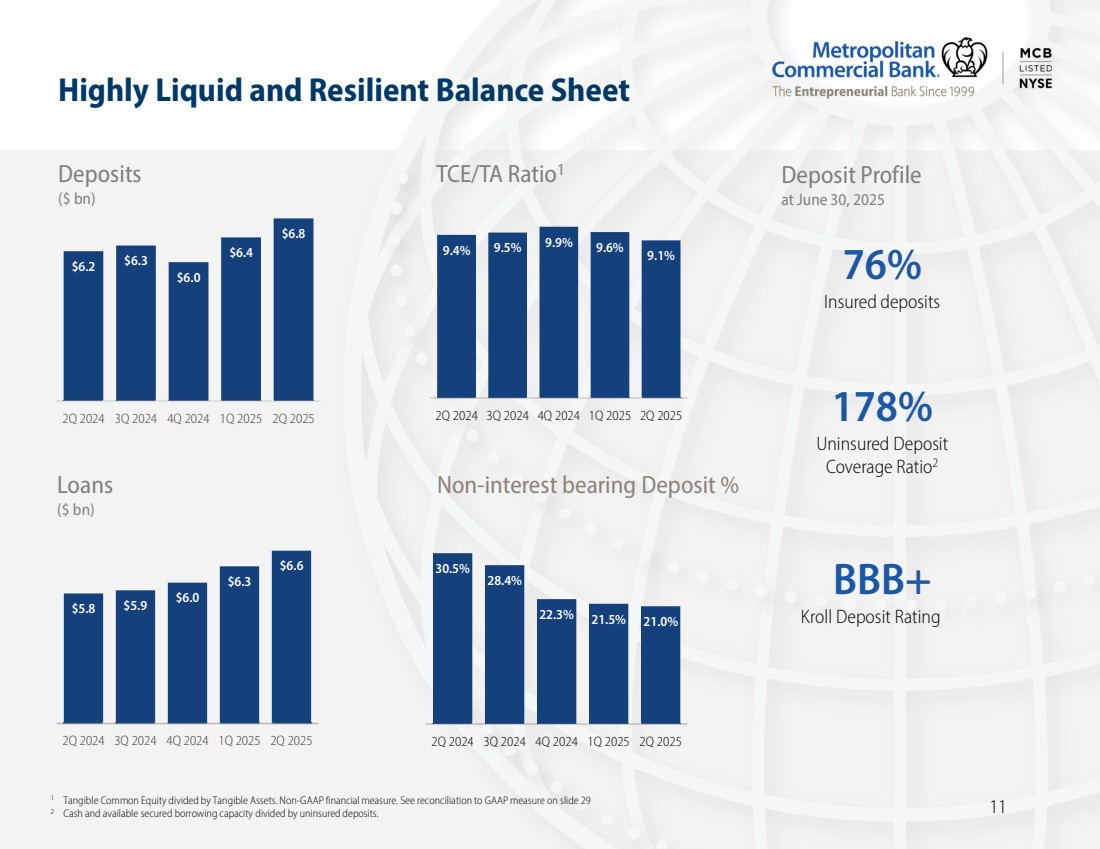
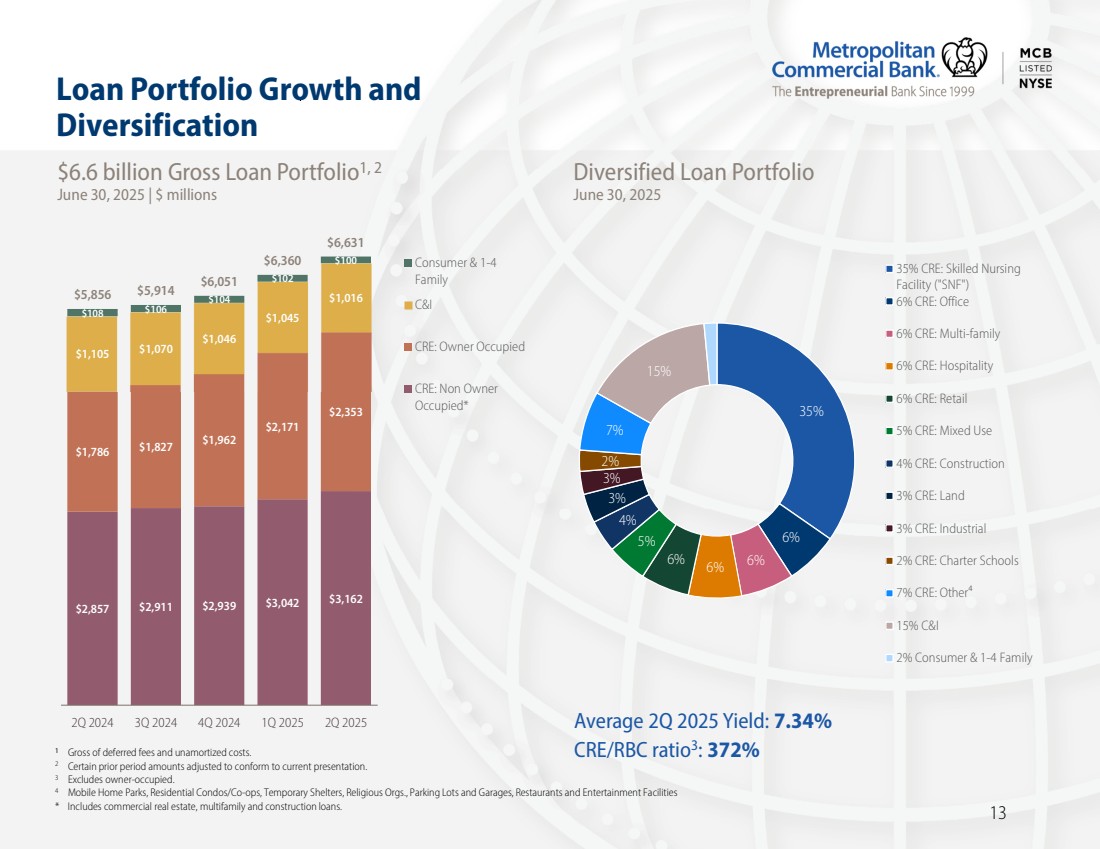
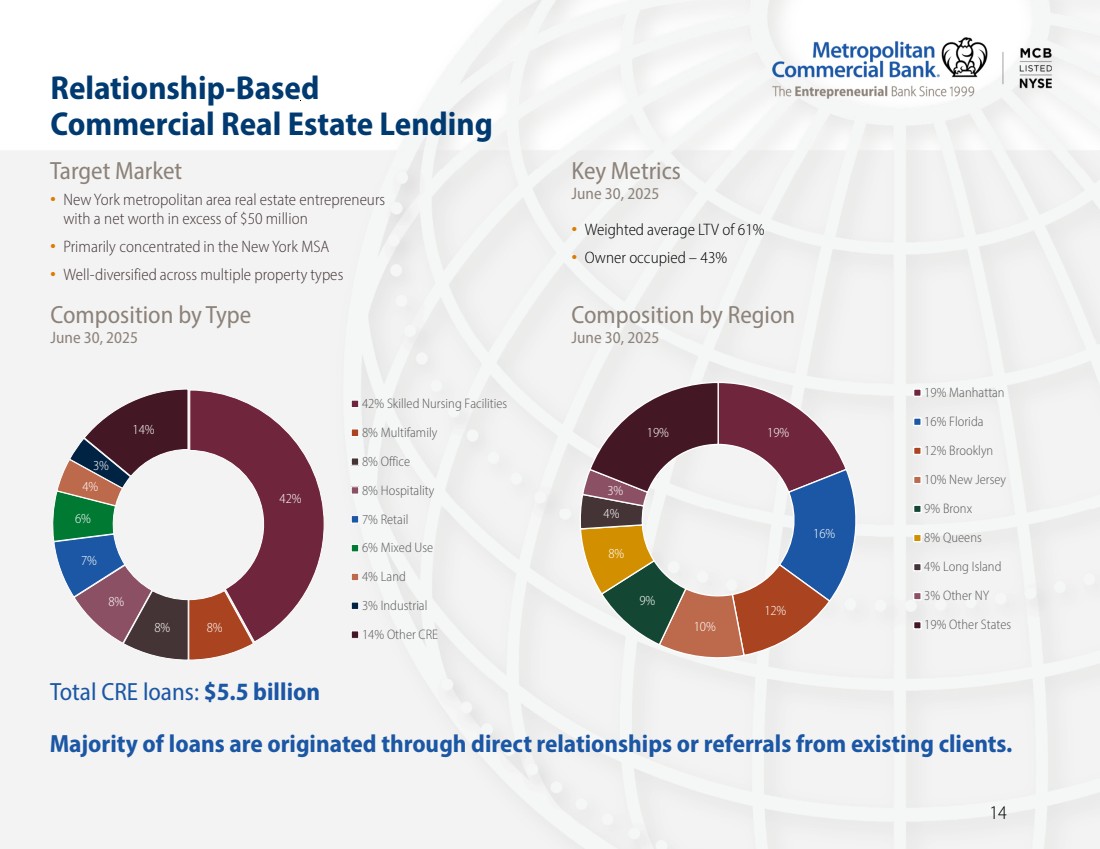
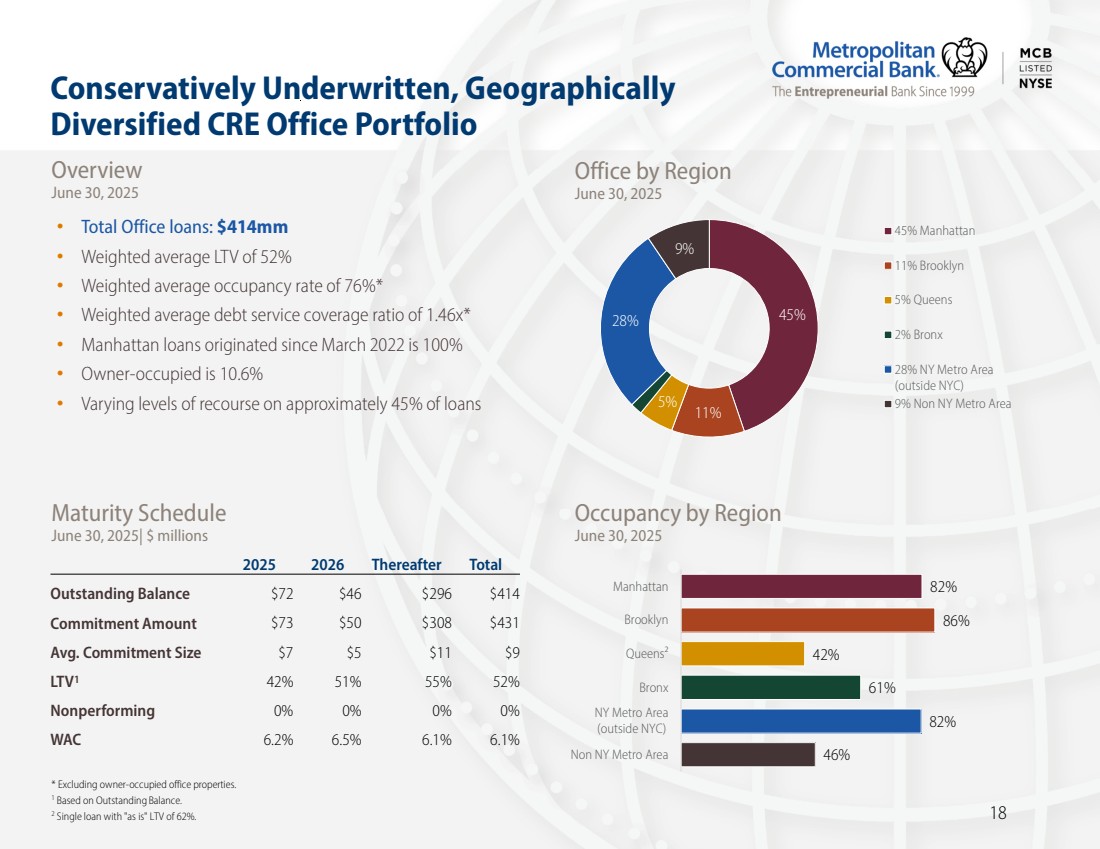
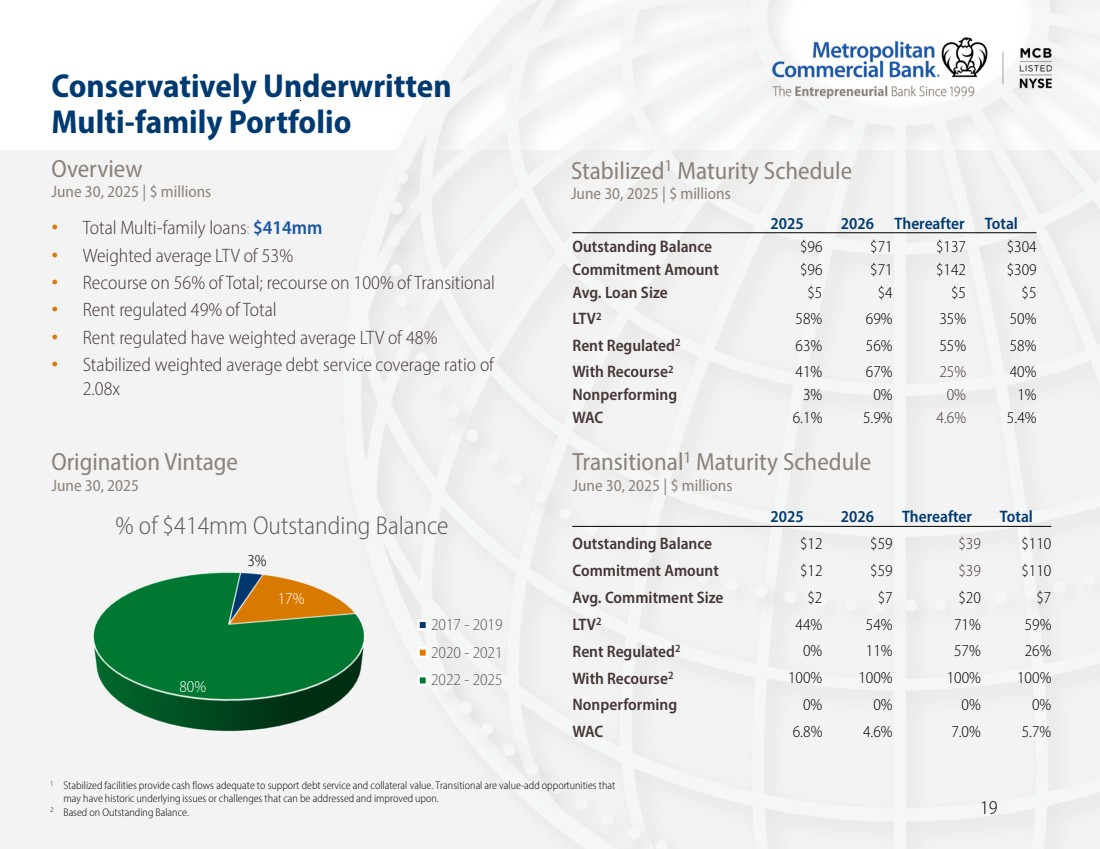
Total loans, net of deferred fees and unamortized costs, were $6.6 billion at June 30, 2025, an increase of $270.7 million, or 4.3%, from March 31, 2025, and an increase of $773.9 million, or 13.3%, from June 30, 2024. Loan production was $492.0 million for the second quarter of 2025 compared to $409.8 million for the prior linked quarter and $290.8 million for the prior year period. The increase in total loans from March 31, 2025, was due primarily to an increase of $252.5 million in commercial real estate (“CRE”) loans (including owner-occupied). The increase in total loans from June 30, 2024 was due primarily to an increase of $790.8 million in CRE loans (including owner-occupied).
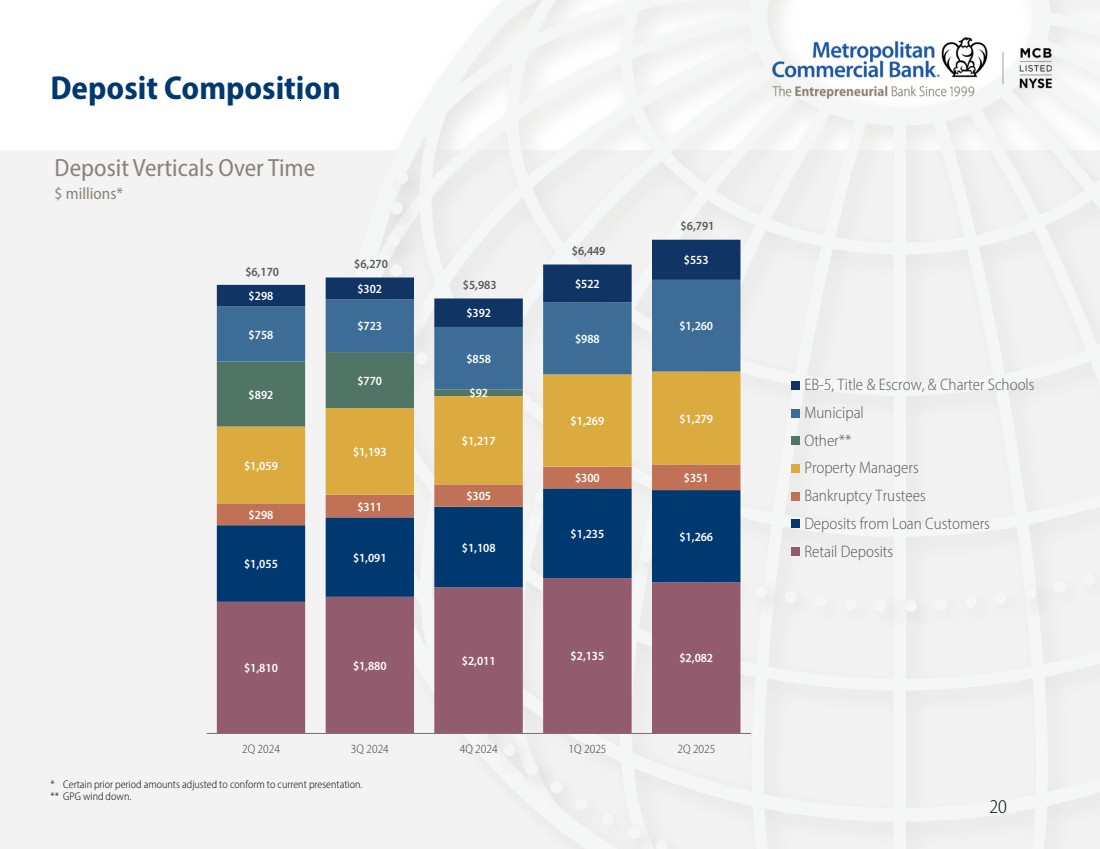
Total deposits were $6.8 billion at June 30, 2025, an increase of $342.0 million, or 5.3%, from March 31, 2025, and an increase of $621.6 million, or 10.1%, from June 30, 2024. Deposit growth was broadly distributed across the Bank’s various deposit verticals.
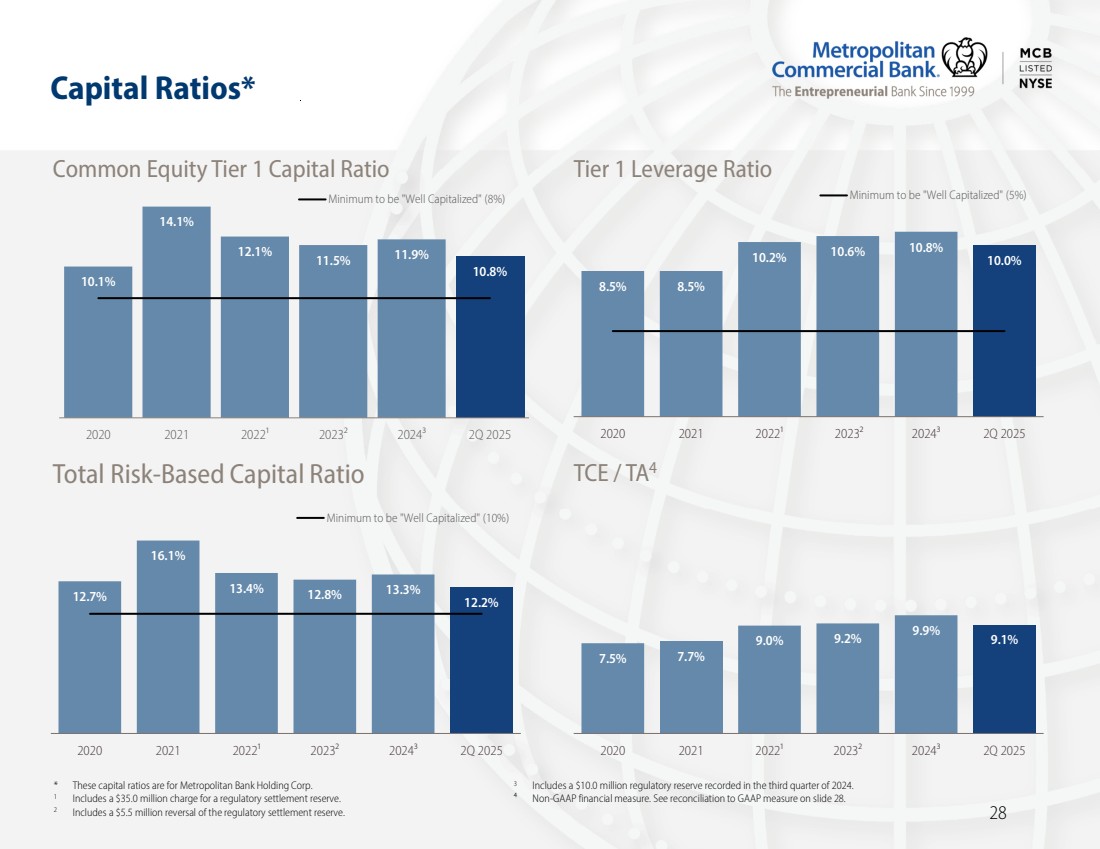
At June 30, 2025, cash on deposit with the Federal Reserve Bank of New York and available secured funding capacity totaled $2.9 billion. The Company and the Bank each met all the requirements to be considered “well capitalized” under applicable regulatory guidelines. Total non-owner-occupied commercial real estate loans were 371.9% of total risk-based capital at June 30, 2025, compared to 367.0% and 358.4% at March 31, 2025 and June 30, 2024, respectively. The increased CRE concentration ratio is primarily the result of the Bank funding the share repurchase program at the Company.
2
Income Statement
Financial Highlights
|
| Three months ended | | | Six months ended | ||||||||||||
| | Jun. 30, | | Mar. 31, | | Jun. 30, | | | Jun. 30, | | Jun. 30, | | |||||
(dollars in thousands, except per share data) | | 2025 | | 2025 | | 2024 | | | 2025 | | 2024 | | |||||
Total revenues(1) | | $ | 76,270 | | $ | 70,590 | | $ | 67,678 | | | $ | 146,860 | | $ | 134,391 | |
Net income (loss) | | $ | 18,767 | | $ | 16,354 | | $ | 16,799 | | | | 35,121 | | | 33,002 | |
Diluted earnings (loss) per common share | | $ | 1.76 | | $ | 1.45 | | $ | 1.50 | | |
| 3.20 | |
| 2.96 | |
Return on average assets(2) | |
| 0.97 | % |
| 0.89 | % |
| 0.92 | % | |
| 0.93 | % |
| 0.91 | % |
Return on average equity(2) | |
| 10.4 | % |
| 9.0 | % |
| 9.9 | % | |
| 9.7 | % |
| 9.9 | % |
Return on average tangible common equity(2), (3), (4) | |
| 10.5 | % |
| 9.1 | % |
| 10.1 | % | |
| 9.8 | % |
| 10.0 | % |
(1) | Total revenues equal net interest income plus non-interest income. |
(2) | Ratios are annualized. |
(3) | Non-GAAP financial measure. See Reconciliation of Non-GAAP Measures on page 12. |
(4) | Net income divided by average tangible common equity. |
Net Interest Income
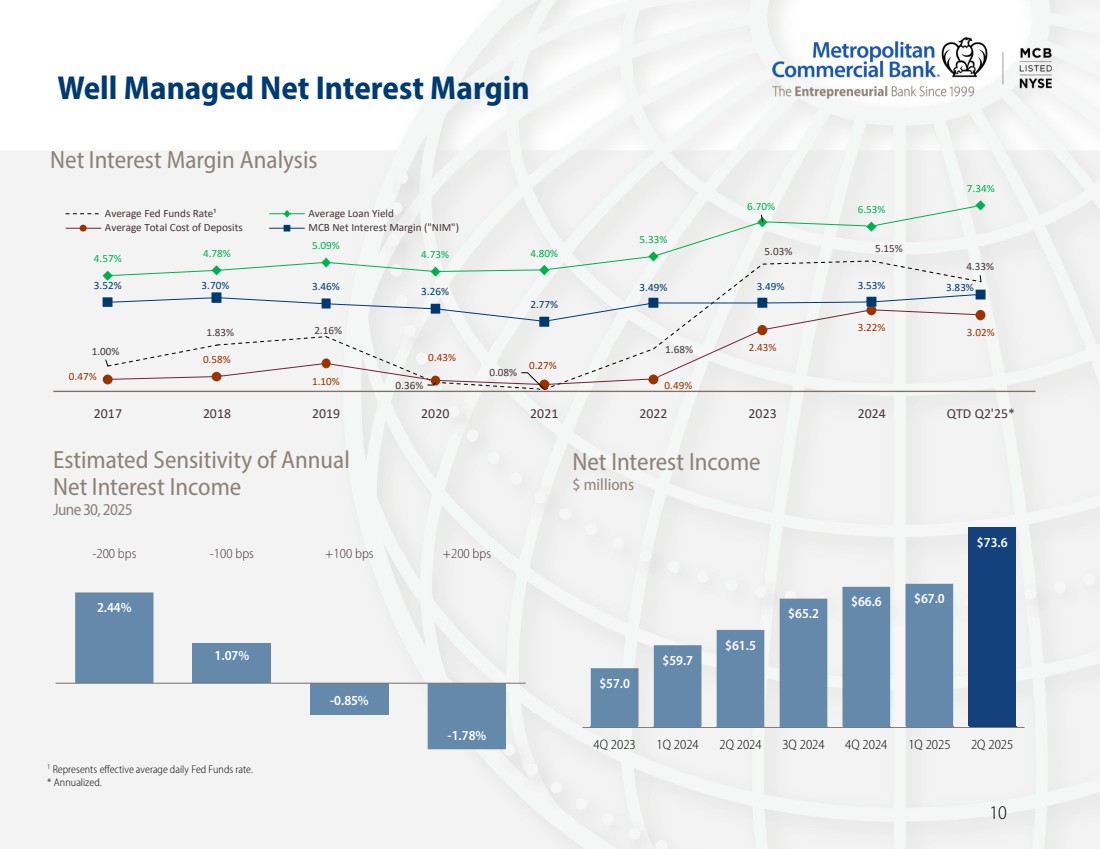
Net interest income for the second quarter of 2025 was $73.6 million compared to $67.0 million for the prior linked quarter and $61.5 million for the prior year period. The $6.7 million increase from the prior linked quarter was due primarily to an increase in the average balance of loans and a decrease in the cost of funds, partially offset by an increase in the average balance of interest-bearing deposits. The $12.1 million increase from the prior year period was due primarily to an increase in the average balance of loans and a decrease in the cost of funds, partially offset by an increase in the average balance of interest-bearing deposits.
Net Interest Margin
Net interest margin for the second quarter of 2025 was 3.83% compared to 3.68% and 3.44% for the prior linked quarter and prior year period, respectively. The Bank’s ability to expand its net interest margin is supported by rigorous loan and deposit pricing initiatives.
The total cost of funds for the second quarter of 2025 was 310 basis points compared to 319 basis points and 334 basis points for the prior linked quarter and prior year period, respectively. The decrease from the prior linked quarter reflects the deposit mix and hedging activities, and a decrease in the average balance of borrowings. The decrease from the prior year period reflects the reduction in short-term interest rates.
Non-Interest Income
Non-interest income was $2.6 million for the second quarter of 2025, a decrease of $1.0 million from the prior linked quarter and a decrease of $3.5 million from the prior year period. The decrease from the prior linked quarter was driven primarily by a one-time recognition in the first quarter of 2025 of non-refundable program fees of $822,000. The decrease from the prior year period was driven primarily by the absence of Banking-as-a-Service revenue.
Non-Interest Expense
Non-interest expense was $43.1 million for the second quarter of 2025, an increase of $387,000 from the prior linked quarter and an increase of $852,000 from the prior year period. The increase from the prior linked quarter was due primarily to an increase of $1.4 million in technology costs, $988,000 in licensing fees and $792,000 in deposit program related fees, partially offset by a $1.5 million seasonal decrease in compensation and benefits and $1.4 million reduction in professional fees. The $852,000 increase from the prior year period was due primarily to a $1.7 million
3
increase in compensation and benefits related to the increase in the number of employees, a $1.7 million increase in deposit program related fees, and a $610,000 increase in technology costs, partially offset by decreases of $3.3 million in professional fees.
Income Tax Expense
The effective tax rate for the second quarter of 2025 was 29.9% compared to 30.0% for the prior linked quarter and 29.7% for the prior year period.
Asset Quality
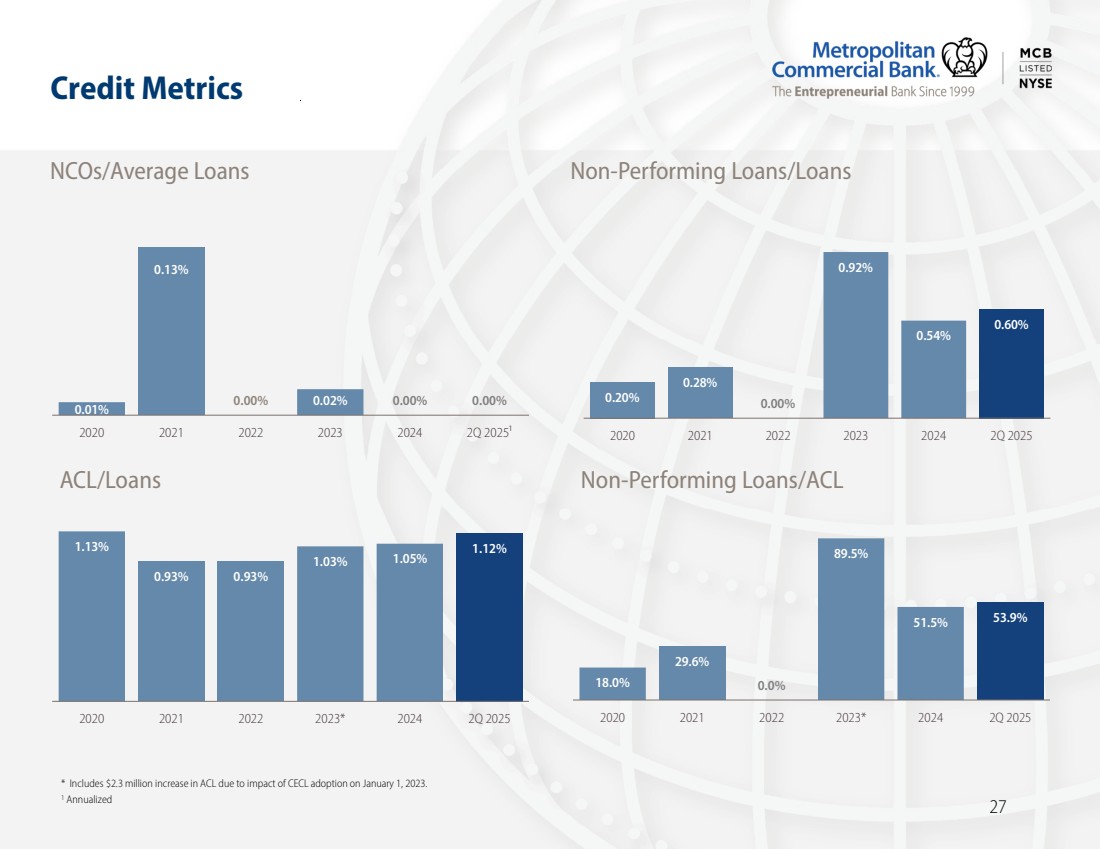
Credit quality remains stable. The ratio of non-performing loans to total loans was 0.60% at June 30, 2025 and 0.54% at March 31, 2025 and 0.53% at June 30, 2024.
The allowance for credit losses was $74.1 million at June 30, 2025, an increase of $6.3 million from March 31, 2025 and an increase of $14.1 million from June 30, 2024. The increase from the prior linked quarter was due primarily to loan growth, provisioning for a commercial real estate loan and changes in the outlook for certain macroeconomic variables.
Conference Call
The Company will conduct a conference call at 9:00 a.m. ET on Friday, July 18, 2025, to discuss the results. To access the event by telephone, please dial 800-579-2543 (US), 785-424-1789 (INTL), and provide conference ID: MCBQ225 approximately 15 minutes prior to the start time (to allow time for registration).
The call will also be broadcast live over the Internet and accessible at MCB Quarterly Results Conference Call and in the Investor Relations section of the Company’s website at MCB News. To listen to the live webcast, please visit the site at least 15 minutes prior to the start time to register, download and install any necessary audio software.
For those unable to join for the live presentation, a replay of the webcast will also be available later that day accessible at MCB Quarterly Results Conference Call.
About Metropolitan Bank Holding Corp.
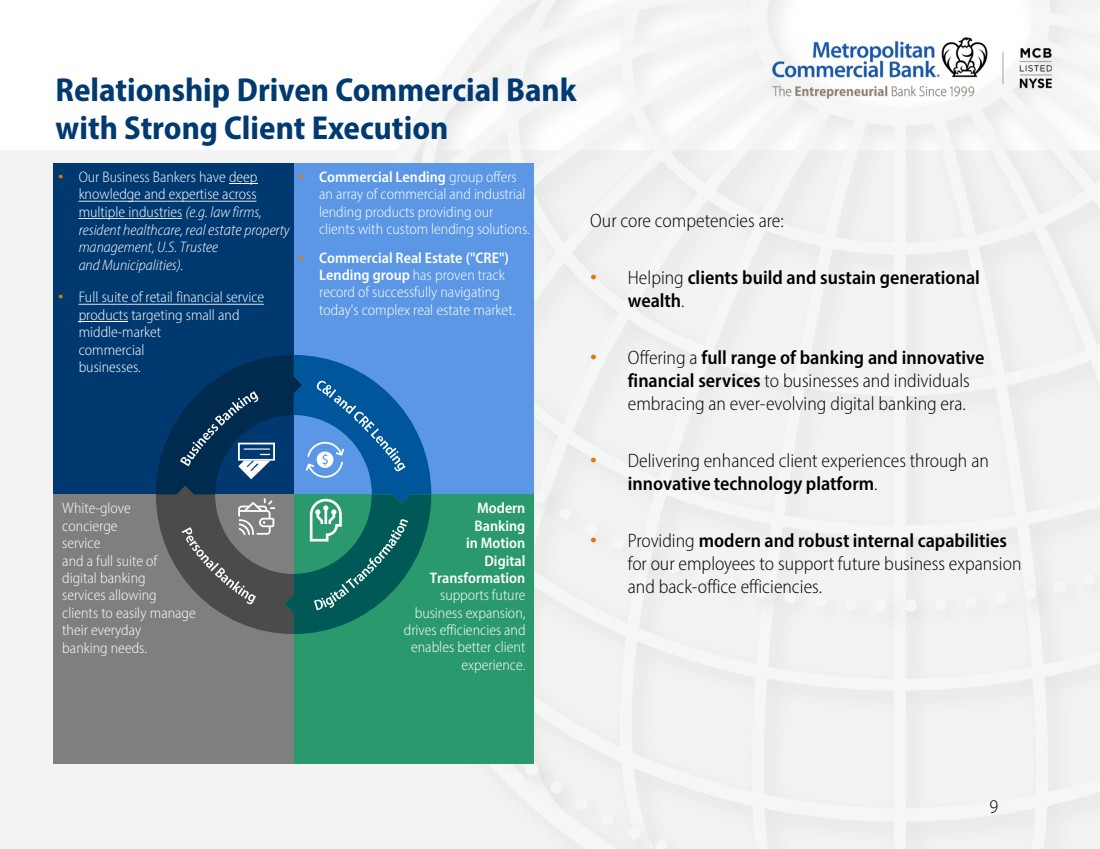
Metropolitan Bank Holding Corp. (NYSE: MCB) is the parent company of Metropolitan Commercial Bank (the “Bank”), a New York City based full-service commercial bank. The Bank provides a broad range of business, commercial and personal banking products and services to individuals, small businesses, private and public middle-market and corporate enterprises and institutions, municipalities, and local government entities.
Metropolitan Commercial Bank was named one of Newsweek’s Best Regional Banks in 2024 and 2025. The Bank was ranked by Independent Community Bankers of America among the top ten successful loan producers for 2024 by loan category and asset size for commercial banks with more than $1 billion in assets. Kroll affirmed a BBB+ (investment grade) deposit rating on January 29, 2025. For the fourth time, MCB has earned a place in the Piper Sandler Bank Sm-All Stars Class of 2024.
The Bank is a New York State chartered commercial bank, a member of the Federal Reserve System and the Federal Deposit Insurance Corporation, and an equal housing lender. For more information, please visit the Bank’s website at MCBankNY.com.
4
Forward-Looking Statement Disclaimer
This release contains “forward-looking statements” within the meaning of the Private Securities Litigation Reform Act of 1995. Examples of forward-looking statements include but are not limited to the Company’s future financial condition and capital ratios, results of operations and the Company’s outlook, business, share repurchases under the program, and dividend payments. Forward-looking statements are not historical facts. Such statements may be identified by the use of such words as “may,” “believe,” “expect,” “anticipate,” “plan,” “continue” or similar terminology. These statements relate to future events or our future financial performance and involve risks and uncertainties that are difficult to predict and are generally beyond our control and may cause our actual results, levels of activity, performance or achievements to differ materially from those expressed or implied by these forward-looking statements. Although we believe that the expectations reflected in the forward-looking statements are reasonable, we caution you not to place undue reliance on these forward-looking statements. Factors which may cause our forward-looking statements to be materially inaccurate include, but are not limited to the following: the interest rate policies of the Federal Reserve and other regulatory bodies; an unexpected deterioration in the performance of our loan or securities portfolios; changes in liquidity, including the size and composition of our deposit portfolio and the percentage of uninsured deposits in the portfolio; unexpected increases in our expenses; different than anticipated growth and our ability to manage our growth; global pandemics, or localized epidemics, could adversely affect the Company’s financial condition and results of operations; potential recessionary conditions, including the related effects on our borrowers and on our financial condition and results of operations; an unanticipated loss of key personnel or existing clients, or an inability to attract key employees; increases in competitive pressures among financial institutions or from non-financial institutions which may result in unanticipated changes in our loan or deposit rates; unanticipated increases in FDIC insurance premiums or future assessments; legislative, tax or regulatory changes or actions, which may adversely affect the Company’s business; impacts related to or resulting from regional and community bank failures and stresses to regional banks; changes in deposit flows, funding sources or loan demand, which may adversely affect the Company’s business; changes in accounting principles, policies or guidelines may cause the Company’s financial condition or results of operation to be reported or perceived differently; general economic conditions, including unemployment rates, either nationally or locally in some or all of the areas in which the Company does business, or conditions in the securities markets or the banking industry being less favorable than currently anticipated; inflation, which may lead to higher operating costs; declines in real estate values in the Company’s market area, which may adversely affect our loan production; an unexpected adverse financial, regulatory, legal or bankruptcy event experienced by our non-bank financial service clients; system failures or cybersecurity breaches of our information technology infrastructure and/or confidential information or those of the Company’s third-party service providers or those of our non-bank financial service clients for which we provide global payments infrastructure; emerging issues related to the development and use of artificial intelligence that could give rise to legal or regulatory action, damage our reputation or otherwise materially harm our business or clients; failure to maintain current technologies or technological changes that may be more difficult or expensive to implement than anticipated, and failure to successfully implement future information technology enhancements; the costs, including the possible incurrence of fines, penalties, or other negative effects (including reputational harm) of any adverse judicial, administrative, or arbitral rulings or proceedings, regulatory enforcement actions, or other legal actions to which we or any of our subsidiaries are a party, and which may adversely affect our results; the current or anticipated impact of military conflict, terrorism or other geopolitical events; the successful implementation or consummation of new business initiatives, which may be more difficult or expensive than anticipated; the timely and efficient development of new products and services offered by the Company or its strategic partners, as well as risks (including reputational and litigation) attendant thereto, and the perceived overall value and acceptance of these products and services by clients; changes in consumer spending, borrowing or savings habits; the risks associated with adverse changes to credit quality; an unexpected failure to successfully manage our credit risk and the sufficiency of our allowance for credit losses; credit and other risks from borrower and depositor concentrations (e.g., by geographic area and by industry); difficulties associated with achieving or predicting expected future financial results; and the potential impact on the Company’s operations and clients resulting from natural or man-made disasters, wars, acts of terrorism, cyberattacks and pandemics, as well as those discussed under the heading “Risk Factors” in our Annual Report on Form 10-K and Quarterly Reports on Form 10-Q which have been filed with the Securities and Exchange Commission under the Securities Exchange Act of 1934, as amended. Forward-looking statements speak only as of the date of this release. We do not undertake (and expressly disclaim) any obligation to update or revise any forward-looking statement, except as may be required by law.
5
Consolidated Balance Sheet (unaudited)
| | Jun. 30, | | Mar. 31, | | Dec. 31, | | Sept. 30, | | Jun. 30, | |||||
(in thousands) |
| 2025 | | 2025 | | 2024 | | 2024 | | 2024 | |||||
Assets |
| |
| | | | | | | | |
| | | |
Cash and due from banks | | $ | 13,577 | | $ | 18,572 | | $ | 13,078 | | $ | 16,674 | | $ | 18,152 |
Overnight deposits | |
| 138,876 | |
| 177,891 | |
| 187,190 | | | 301,804 | | | 226,510 |
Total cash and cash equivalents | |
| 152,453 | |
| 196,463 | |
| 200,268 | | | 318,478 | | | 244,662 |
Investment securities available-for-sale | |
| 551,029 | |
| 523,542 | |
| 482,085 | | | 510,966 | | | 504,748 |
Investment securities held-to-maturity | |
| 387,901 | |
| 398,973 | |
| 428,557 | | | 438,445 | | | 449,368 |
Equity investment securities, at fair value | | | 5,276 | | | 5,221 | |
| 5,109 | | | 5,213 | | | 2,122 |
Total securities | |
| 944,206 | |
| 927,736 | |
| 915,751 | | | 954,624 | | | 956,238 |
Other investments | |
| 27,297 | |
| 27,062 | |
| 30,636 | | | 26,586 | | | 26,584 |
Loans, net of deferred fees and unamortized costs | |
| 6,612,789 | |
| 6,342,122 | |
| 6,034,076 | | | 5,897,119 | | | 5,838,892 |
Allowance for credit losses | |
| (74,071) | |
| (67,803) | |
| (63,273) | | | (62,493) | | | (60,008) |
Net loans | |
| 6,538,718 | |
| 6,274,319 | |
| 5,970,803 | | | 5,834,626 | | | 5,778,884 |
Receivables from global payments business, net | | | — | |
| — | |
| — | | | 96,048 | | | 90,626 |
Other assets | | | 191,175 | | | 190,718 | | | 183,291 | | | 172,996 | | | 168,597 |
Total assets | | $ | 7,853,849 | | $ | 7,616,298 | | $ | 7,300,749 | | $ | 7,403,358 | | $ | 7,265,591 |
| | | | | | | | | | | | | | | |
Liabilities and Stockholders' Equity | |
| | |
| | |
| | | | | | | |
Deposits | |
| | |
|
| |
|
| | | | | | |
Non-interest-bearing demand deposits | | $ | 1,427,439 | | $ | 1,384,524 | | $ | 1,334,054 | | $ | 1,780,305 | | $ | 1,883,176 |
Interest-bearing deposits | |
| 5,363,867 | |
| 5,064,768 | |
| 4,648,919 | | | 4,489,602 | | | 4,286,486 |
Total deposits | |
| 6,791,306 | |
| 6,449,292 | |
| 5,982,973 | | | 6,269,907 | | | 6,169,662 |
Federal funds purchased | | | 50,000 | | | 125,000 | | | 210,000 | | | — | | | — |
Federal Home Loan Bank of New York advances | | | 150,000 | | | 160,000 | | | 240,000 | | | 150,000 | | | 150,000 |
Trust preferred securities | |
| 20,620 | |
| 20,620 | |
| 20,620 | | | 20,620 | | | 20,620 |
Secured and other borrowings | | | 17,366 | | | 17,403 | | | 7,441 | | | 107,478 | | | 107,514 |
Prepaid third-party debit cardholder balances | |
| — | |
| — | |
| — | | | 21,970 | | | 22,631 |
Other liabilities | | | 101,589 | | | 106,137 | | | 109,888 | | | 118,192 | | | 102,760 |
Total liabilities | |
| 7,130,881 | |
| 6,878,452 | |
| 6,570,922 | | | 6,688,167 | | | 6,573,187 |
| | | | | | | | | | | | | | | |
Common stock | |
| 113 | |
| 113 | |
| 112 | | | 112 | | | 112 |
Additional paid in capital | |
| 401,055 | |
| 398,823 | |
| 400,188 | | | 397,963 | | | 395,520 |
Retained earnings | |
| 417,782 | |
| 399,015 | |
| 382,661 | | | 361,243 | | | 348,977 |
Accumulated other comprehensive gain (loss), net of tax effect | |
| (45,455) | |
| (47,170) | |
| (53,134) | | | (44,127) | | | (52,205) |
Treasury stock, at cost | | | (50,527) | | | (12,935) | | | — | | | — | | | — |
Total stockholders’ equity | |
| 722,968 | |
| 737,846 | |
| 729,827 | | | 715,191 | | | 692,404 |
Total liabilities and stockholders’ equity | | $ | 7,853,849 | | $ | 7,616,298 | | $ | 7,300,749 | | $ | 7,403,358 | | $ | 7,265,591 |
6
Consolidated Statement of Income (unaudited)
|
| Three months ended | | Six months ended | |||||||||||
| | Jun. 30, | | Mar. 31, | | Jun. 30, | | Jun. 30, | | Jun. 30, | |||||
(dollars in thousands, except per share data) |
| 2025 | | 2025 | | 2024 |
| 2025 | | 2024 | |||||
Total interest income | | $ | 127,043 | | $ | 118,770 | | $ | 115,761 | | $ | 245,813 | | $ | 228,096 |
Total interest expense | |
| 53,396 | |
| 51,818 | |
| 54,222 | |
| 105,214 | |
| 106,848 |
Net interest income | |
| 73,647 | |
| 66,952 | |
| 61,539 | |
| 140,599 | |
| 121,248 |
Provision for credit losses | |
| 6,378 | |
| 4,506 | |
| 1,538 | |
| 10,884 | |
| 2,066 |
Net interest income after provision for credit losses | |
| 67,269 | |
| 62,446 | |
| 60,001 | |
| 129,715 | |
| 119,182 |
| |
|
| |
|
| |
|
| |
|
| |
|
|
Non-interest income | |
|
| |
|
| |
|
| |
|
| |
|
|
Service charges on deposit accounts | |
| 2,131 | |
| 2,173 | |
| 2,094 | |
| 4,304 | |
| 3,957 |
Global Payments Group revenue | |
| — | |
| — | |
| 3,686 | |
| — | |
| 7,755 |
Other income | | | 492 | | | 1,465 | | | 359 | | | 1,957 | | | 1,431 |
Total non-interest income | |
| 2,623 | |
| 3,638 | |
| 6,139 | |
| 6,261 | |
| 13,143 |
| |
|
| |
|
| |
|
| |
|
| |
|
|
Non-interest expense | |
|
| |
|
| |
|
| |
|
| |
|
|
Compensation and benefits | |
| 20,255 | |
| 21,739 | |
| 18,532 | |
| 41,994 | |
| 38,359 |
Bank premises and equipment | |
| 2,513 | |
| 2,463 | |
| 2,322 | |
| 4,976 | |
| 4,665 |
Professional fees | |
| 3,583 | |
| 4,986 | |
| 6,916 | |
| 8,569 | |
| 12,888 |
Technology costs | |
| 3,653 | |
| 2,220 | |
| 3,043 | |
| 5,873 | |
| 6,054 |
Licensing fees | | | 3,462 | | | 2,474 | | | 3,180 | | | 5,936 | | | 6,456 |
FDIC assessments | | | 2,999 | | | 2,967 | | | 2,925 | | | 5,966 | | | 5,850 |
Other expenses | |
| 6,644 | |
| 5,873 | |
| 5,339 | |
| 12,517 | |
| 9,885 |
Total non-interest expense | |
| 43,109 | |
| 42,722 | |
| 42,257 | |
| 85,831 | |
| 84,157 |
| |
|
| |
|
| |
|
| |
|
| |
|
|
Net income before income tax expense | |
| 26,783 | |
| 23,362 | |
| 23,883 | |
| 50,145 | |
| 48,168 |
Income tax expense | |
| 8,016 | |
| 7,008 | |
| 7,084 | |
| 15,024 | |
| 15,166 |
Net income (loss) | | $ | 18,767 | | $ | 16,354 | | $ | 16,799 | | $ | 35,121 | | $ | 33,002 |
| |
|
| | |
| |
|
| |
|
| |
|
|
Earnings per common share: | |
| | | | | |
|
| |
|
| |
|
|
Average common shares outstanding: | | | | | | | | | | | | | | | |
Basic | | | 10,564,275 | | | 11,215,118 | | | 11,192,936 | | | 10,886,120 | | | 11,163,127 |
Diluted | | | 10,676,878 | | | 11,281,375 | | | 11,199,736 | | | 10,975,431 | | | 11,163,127 |
Basic earnings (loss) | | $ | 1.78 | | $ | 1.46 | | $ | 1.50 | | $ | 3.23 | | $ | 2.96 |
Diluted earnings (loss) | | $ | 1.76 | | $ | 1.45 | | $ | 1.50 | | $ | 3.20 | | $ | 2.96 |
7
Loan Production, Asset Quality & Regulatory Capital
|
| Jun. 30, | | Mar. 31, | | Dec. 31, | | Sept. 30, | | Jun. 30, | | |||||
| | 2025 | | 2025 | | 2024 | | 2024 |
| 2024 | | |||||
LOAN PRODUCTION (in millions) | | $ | 492.0 | | $ | 409.8 | | $ | 309.0 | | $ | 460.6 | | $ | 290.8 | |
| | | | | | | | | | | | | | | | |
ASSET QUALITY (in thousands) | | | | | | | | | | | | | | | | |
Non-performing loans: | | | | | | | | | | | | | | | | |
Commercial real estate | | $ | 28,480 | | $ | 25,087 | | $ | 25,087 | | $ | 24,000 | | $ | 24,000 | |
Commercial and industrial | | | 8,989 | | | 8,989 | | | 6,989 | | | 6,989 | | | 6,989 | |
One- to four- family | | | 2,469 | | | 446 | | | 452 | | | — | | | — | |
Consumer | | | — | | | 22 | | | 72 | | | — | | | 108 | |
Total non-performing loans | | $ | 39,938 | | $ | 34,544 | | $ | 32,600 | | $ | 30,989 | | $ | 31,097 | |
Non-performing loans to total loans | |
| 0.60 | % |
| 0.54 | % |
| 0.54 | % |
| 0.53 | % |
| 0.53 | % |
Allowance for credit losses | | $ | 74,071 | | $ | 67,803 | | $ | 63,273 | | $ | 62,493 | | $ | 60,008 | |
Allowance for credit losses to total loans | |
| 1.12 | % |
| 1.07 | % |
| 1.05 | % |
| 1.06 | % |
| 1.03 | % |
Charge-offs | | $ | (112) | | $ | (118) | | $ | (106) | | $ | (122) | | $ | (16) | |
Recoveries | | $ | 126 | | $ | 180 | | $ | 120 | | $ | 2 | | $ | — | |
Net charge-offs/(recoveries) to average loans (annualized) | | | — | % | | — | % | | — | % | | 0.01 | % | | — | % |
| | | | | | | | | | | | | | | | |
REGULATORY CAPITAL | |
|
| |
|
| |
|
| |
|
| |
|
| |
Tier 1 Leverage: | |
|
| |
|
| |
|
| |
|
| |
|
| |
Metropolitan Bank Holding Corp. | |
| 10.0 | % |
| 10.7 | % |
| 10.8 | % |
| 10.6 | % |
| 10.3 | % |
Metropolitan Commercial Bank | |
| 9.8 | % |
| 10.1 | % |
| 10.6 | % |
| 10.3 | % |
| 10.1 | % |
| | | | | | | | | | | | | | | | |
Common Equity Tier 1 Risk-Based (CET1): | |
|
| |
|
| |
|
| |
|
| |
|
| |
Metropolitan Bank Holding Corp. | |
| 10.8 | % |
| 11.4 | % |
| 11.9 | % |
| 11.9 | % |
| 11.7 | % |
Metropolitan Commercial Bank | |
| 10.9 | % |
| 11.0 | % |
| 12.0 | % |
| 11.9 | % |
| 11.8 | % |
| | | | | | | | | | | | | | | | |
Tier 1 Risk-Based: | |
|
| |
|
| |
|
| |
|
| |
|
| |
Metropolitan Bank Holding Corp. | |
| 11.1 | % |
| 11.7 | % |
| 12.3 | % |
| 12.2 | % |
| 12.1 | % |
Metropolitan Commercial Bank | |
| 10.9 | % |
| 11.0 | % |
| 12.0 | % |
| 11.9 | % |
| 11.8 | % |
| | | | | | | | | | | | | | | | |
Total Risk-Based: | |
|
| |
|
| |
|
| |
|
| |
|
| |
Metropolitan Bank Holding Corp. | |
| 12.2 | % |
| 12.8 | % |
| 13.3 | % |
| 13.2 | % |
| 13.0 | % |
Metropolitan Commercial Bank | |
| 12.0 | % |
| 12.1 | % |
| 13.0 | % |
| 12.9 | % |
| 12.8 | % |
8
Performance Measures
| | Three months ended | | Six months ended |
| |||||||||||
| | Jun. 30, | | Mar. 31, | | Jun. 30, | | Jun. 30, | | Jun. 30, | | |||||
(dollars in thousands, except per share data) |
| 2025 | | 2025 | | 2024 |
| 2025 | | 2024 |
| |||||
Net income per consolidated statements of income | | $ | 18,767 | | $ | 16,354 | | $ | 16,799 | | $ | 35,121 | | $ | 33,002 | |
Less: Earnings allocated to participating securities | | | — | | | — | | | — | | | — | | | — | |
Net income (loss) available to common shareholders | | $ | 18,767 | | $ | 16,354 | | $ | 16,799 | | $ | 35,121 | | $ | 33,002 | |
| | | | | | | | | | | | | | | | |
Per common share: | |
|
| |
|
| |
|
| |
|
| |
|
| |
Basic earnings (loss) | | $ | 1.78 | | $ | 1.46 | | $ | 1.50 | | $ | 3.23 | | $ | 2.96 | |
Diluted earnings (loss) | | $ | 1.76 | | $ | 1.45 | | $ | 1.50 | | $ | 3.20 | | $ | 2.96 | |
Common shares outstanding: | |
|
| |
|
| |
|
| |
|
| |
|
| |
Period end | |
| 10,421,384 | |
| 11,066,234 | |
| 11,192,936 | |
| 10,421,384 | |
| 11,192,936 | |
Average fully diluted | |
| 10,676,878 | |
| 11,281,375 | |
| 11,199,736 | |
| 10,975,431 | |
| 11,163,127 | |
Return on:(1) | |
|
| |
|
| |
|
| |
|
| |
|
| |
Average total assets | |
| 0.97 | % |
| 0.89 | % |
| 0.92 | % |
| 0.93 | % |
| 0.91 | % |
Average equity | | | 10.4 | % | | 9.0 | % | | 9.9 | % | | 9.7 | % | | 9.9 | % |
Average tangible common equity(2), (3) | | | 10.5 | % | | 9.1 | % | | 10.1 | % | | 9.8 | % | | 10.0 | % |
Yield on average earning assets(1) | |
| 6.61 | % |
| 6.52 | % |
| 6.47 | % |
| 6.57 | % |
| 6.43 | % |
Total cost of deposits(1) | | | 3.02 | % | | 3.09 | % | | 3.26 | % | | 3.05 | % | | 3.21 | % |
Net interest spread(1) | |
| 2.76 | % |
| 2.53 | % |
| 1.77 | % |
| 2.65 | % |
| 1.77 | % |
Net interest margin(1) | |
| 3.83 | % |
| 3.68 | % |
| 3.44 | % |
| 3.76 | % |
| 3.42 | % |
Net charge-offs as % of average loans(1) | |
| — | % |
| — | % |
| — | % |
| — | % |
| — | % |
Efficiency ratio(4) | |
| 56.5 | % |
| 60.5 | % |
| 62.4 | % |
| 58.4 | % |
| 62.6 | % |
(1)Ratios are annualized.
(2)Net income divided by average tangible common equity.
(3)Non-GAAP financial measure. See Reconciliation of Non-GAAP Measures on page 12.
(4)Total non-interest expense divided by total revenues.
9
Interest Margin Analysis
| | Three months ended | | ||||||||||||||||||||||||
| | Jun. 30, 2025 | | | Mar. 31, 2025 | | | Jun. 30, 2024 | | ||||||||||||||||||
| | Average | | | | | Yield / | | | Average | | | | | Yield / | | | Average | | | | | Yield / | | |||
(dollars in thousands) | | Balance | | Interest | | Rate (1) | | | Balance | | Interest | | Rate (1) | | | Balance | | Interest | | Rate (1) | | ||||||
Assets: | | | | | | | | | | | | | | | | | | | | | | | | | | | |
Interest-earning assets: | | |
|
| |
|
|
|
| | |
|
| |
|
| |
| | |
|
| |
|
| | |
Loans (2) | | $ | 6,486,667 | | $ | 118,774 |
| 7.34 | % | | $ | 6,202,311 | | $ | 110,865 |
| 7.25 | % | | $ | 5,754,283 | | $ | 104,595 |
| 7.31 | % |
Available-for-sale securities | |
| 607,363 | |
| 3,884 |
| 2.57 | | |
| 577,184 | |
| 3,415 |
| 2.40 | | |
| 589,825 | |
| 3,353 |
| 2.29 | |
Held-to-maturity securities | |
| 394,374 | |
| 1,849 |
| 1.88 | | |
| 417,326 | |
| 1,943 |
| 1.89 | | |
| 456,078 | |
| 2,124 |
| 1.87 | |
Equity investments | | | 5,556 | | | 42 | | 3.02 | | | | 5,516 | | | 39 |
| 2.90 | | | | 2,431 | | | 16 | | 2.59 | |
Overnight deposits | |
| 184,054 | |
| 2,078 |
| 4.53 | | |
| 154,357 | |
| 1,925 |
| 5.06 | | |
| 369,169 | |
| 5,167 |
| 5.63 | |
Other interest-earning assets | |
| 27,682 | |
| 416 |
| 6.03 | | |
| 30,917 | |
| 583 |
| 7.65 | | |
| 27,301 | |
| 506 |
| 7.45 | |
Total interest-earning assets | |
| 7,705,696 | |
| 127,043 |
| 6.61 | | |
| 7,387,611 | |
| 118,770 |
| 6.52 | | |
| 7,199,087 | |
| 115,761 |
| 6.47 | |
Non-interest-earning assets | |
| 138,469 | |
|
|
|
| | |
| 128,676 | |
|
|
|
| | |
| 182,234 | |
|
|
|
| |
Allowance for credit losses | |
| (68,966) | |
| |
|
| | |
| (64,584) | |
|
|
|
| | |
| (58,841) | |
|
|
|
| |
Total assets | | $ | 7,775,199 | |
|
|
|
| | | $ | 7,451,703 | |
|
|
|
| | | $ | 7,322,480 | |
|
|
|
| |
Liabilities and Stockholders' Equity: | |
|
| |
|
|
|
| | |
| | | | | | | | |
|
| |
|
|
|
| |
Interest-bearing liabilities: | |
|
| |
|
|
|
| | |
| | | | | | | | |
|
| |
|
|
|
| |
Money market and savings accounts | | $ | 5,125,850 | | | 48,454 |
| 3.79 | | | $ | 4,747,995 | | | 45,844 |
| 3.92 | | | $ | 4,319,340 | | | 50,237 |
| 4.68 | |
Certificates of deposit | |
| 133,495 | |
| 1,369 |
| 4.11 | | |
| 126,471 | |
| 1,334 |
| 4.28 | | |
| 37,084 | |
| 318 |
| 3.45 | |
Total interest-bearing deposits | |
| 5,259,345 | |
| 49,823 |
| 3.80 | | |
| 4,874,466 | |
| 47,178 |
| 3.93 | | |
| 4,356,424 | |
| 50,555 |
| 4.67 | |
Borrowed funds | |
| 298,843 | |
| 3,573 |
| 4.79 | | |
| 392,453 | |
| 4,640 |
| 4.80 | | |
| 287,104 | |
| 3,667 |
| 5.14 | |
Total interest-bearing liabilities | |
| 5,558,188 | |
| 53,396 |
| 3.85 | | |
| 5,266,919 | |
| 51,818 |
| 3.99 | | |
| 4,643,528 | |
| 54,222 |
| 4.70 | |
Non-interest-bearing liabilities: | |
|
| |
|
|
|
| | |
|
| |
|
|
|
| | |
|
| |
|
|
|
| |
Non-interest-bearing deposits | |
| 1,358,029 | |
|
|
|
| | |
| 1,319,688 | |
|
|
|
| | |
| 1,879,213 | |
|
|
|
| |
Other non-interest-bearing liabilities | |
| 135,008 | |
|
|
|
| | |
| 126,872 | |
|
|
|
| | |
| 119,675 | |
|
|
|
| |
Total liabilities | |
| 7,051,225 | |
|
|
|
| | |
| 6,713,479 | |
|
|
|
| | |
| 6,642,416 | |
|
|
|
| |
Stockholders' equity | |
| 723,974 | |
|
|
|
| | |
| 738,224 | | | | | | | |
| 680,064 | | | | | | |
Total liabilities and equity | | $ | 7,775,199 | |
|
|
|
| | | $ | 7,451,703 | |
|
|
|
| | | $ | 7,322,480 | |
|
|
|
| |
Net interest income | |
|
| | $ | 73,647 |
|
| | |
| | | $ | 66,952 |
|
| | |
| | | $ | 61,539 |
| | |
Net interest rate spread (3) | |
| | |
|
|
| 2.76 | % | |
| | | | | | 2.53 | % | |
| | | | | | 1.77 | % |
Net interest margin (4) | |
|
| |
|
|
| 3.83 | % | |
|
| |
|
|
| 3.68 | % | |
|
| |
|
|
| 3.44 | % |
Total cost of deposits (5) | | | | | | | | 3.02 | % | | | | | | | | 3.09 | % | | | | | | | | 3.26 | % |
Total cost of funds (6) | | | | | | | | 3.10 | % | | | | | | | | 3.19 | % | | |
| |
|
|
| 3.34 | % |
(1) | Ratios are annualized. |
(2) | Amount includes deferred loan fees and non-performing loans. |
(3) | Determined by subtracting the annualized average cost of total interest-bearing liabilities from the annualized average yield on total interest-earning assets. |
(4) | Determined by dividing annualized net interest income by total average interest-earning assets. |
(5) | Determined by dividing annualized interest expense on deposits by total average interest-bearing and non-interest-bearing deposits. |
(6) | Determined by dividing annualized interest expense by the sum of total average interest-bearing liabilities and total average non-interest-bearing deposits. |
10
| | Six months ended | | |||||||||||||||
| | Jun. 30, 2025 | | | Jun. 30, 2024 |
| ||||||||||||
| | Average | | | | | Yield / | | | Average | | | | | Yield / |
| ||
(dollars in thousands) | | Balance | | Interest | | Rate (1) | | | Balance | | Interest | | Rate (1) |
| ||||
Assets: | | | | | | | | | | | | | | | | | | |
Interest-earning assets: |
| |
|
| |
|
|
|
| | |
|
| |
|
|
| |
Loans (2) | | $ | 6,345,274 | | $ | 229,639 |
| 7.30 | % | | $ | 5,725,562 | | $ | 206,976 |
| 7.27 | % |
Available-for-sale securities | |
| 592,357 | |
| 7,299 |
| 2.48 | | |
| 577,558 | | | 6,311 |
| 2.20 | |
Held-to-maturity securities | |
| 405,787 | |
| 3,792 |
| 1.88 | | |
| 460,674 | | | 4,296 |
| 1.88 | |
Equity investments | | | 5,536 | | | 81 | | 2.96 | | | | 2,423 | | | 30 |
| 2.53 | |
Overnight deposits | |
| 169,287 | |
| 4,003 |
| 4.77 | | |
| 333,580 | | | 9,321 |
| 5.62 | |
Other interest-earning assets | |
| 29,291 | |
| 999 |
| 6.88 | | |
| 30,365 | | | 1,162 |
| 7.69 | |
Total interest-earning assets | |
| 7,547,532 | |
| 245,813 |
| 6.57 | | |
| 7,130,162 | |
| 228,096 |
| 6.43 | |
Non-interest-earning assets | |
| 132,675 | |
|
|
|
| | |
| 182,635 | |
|
|
|
| |
Allowance for credit losses | |
| (66,787) | |
|
|
|
| | |
| (58,679) | |
|
|
|
| |
Total assets | | $ | 7,613,420 | |
|
|
|
| | | $ | 7,254,118 | |
|
|
|
| |
Liabilities and Stockholders' Equity: | |
|
| |
|
|
|
| | |
|
| |
|
|
|
| |
Interest-bearing liabilities: | |
|
| |
|
|
|
| | |
|
| |
|
|
|
| |
Money market and savings accounts | | $ | 4,937,693 | | $ | 94,298 |
| 3.85 | | | $ | 4,209,403 | | $ | 96,848 |
| 4.63 | |
Certificates of deposit | |
| 130,002 | |
| 2,703 |
| 4.19 | | |
| 35,674 | | | 593 |
| 3.34 | |
Total interest-bearing deposits | |
| 5,067,695 | |
| 97,001 |
| 3.86 | | |
| 4,245,076 | |
| 97,441 |
| 4.62 | |
Borrowed funds | |
| 345,982 | |
| 8,213 |
| 4.79 | | |
| 362,246 | |
| 9,407 |
| 5.22 | |
Total interest-bearing liabilities | |
| 5,413,677 | |
| 105,214 |
| 3.92 | | |
| 4,607,323 | |
| 106,848 |
| 4.66 | |
Non-interest-bearing liabilities: | |
|
| |
|
|
|
| | |
|
| |
|
|
|
| |
Non-interest-bearing deposits | |
| 1,338,964 | |
|
|
|
| | |
| 1,857,290 | |
|
|
|
| |
Other non-interest-bearing liabilities | |
| 130,644 | |
|
|
|
| | |
| 115,974 | |
|
|
|
| |
Total liabilities | |
| 6,883,285 | |
| |
|
| | |
| 6,580,587 | |
|
|
|
| |
Stockholders' equity | |
| 730,135 | |
|
|
|
| | |
| 673,531 | |
|
|
|
| |
Total liabilities and equity | | $ | 7,613,420 | |
|
|
|
| | | $ | 7,254,118 | |
|
|
|
| |
Net interest income | |
|
| | $ | 140,599 |
|
| | |
|
| | $ | 121,248 |
|
| |
Net interest rate spread (3) | |
|
| |
|
|
| 2.65 | % | |
|
| |
|
|
| 1.77 | % |
Net interest margin (4) | |
|
| |
|
|
| 3.76 | % | |
|
| |
|
|
| 3.42 | % |
Total cost of deposits (5) | | | | | | | | 3.05 | % | | | | | | | | 3.21 | % |
Total cost of funds (6) | |
|
| |
|
|
| 3.14 | % | |
|
| |
|
|
| 3.32 | % |
(1) | Ratios are annualized. |
(2) | Amount includes deferred loan fees and non-performing loans. |
(3) | Determined by subtracting the annualized average cost of total interest-bearing liabilities from the annualized average yield on total interest-earning assets. |
(4) | Determined by dividing annualized net interest income by total average interest-earning assets. |
(5) | Determined by dividing annualized interest expense on deposits by total average interest-bearing and non-interest-bearing deposits. |
(6) | Determined by dividing annualized interest expense by the sum of total average interest-bearing liabilities and total average non-interest-bearing deposits. |
11
Reconciliation of Non-GAAP Measures
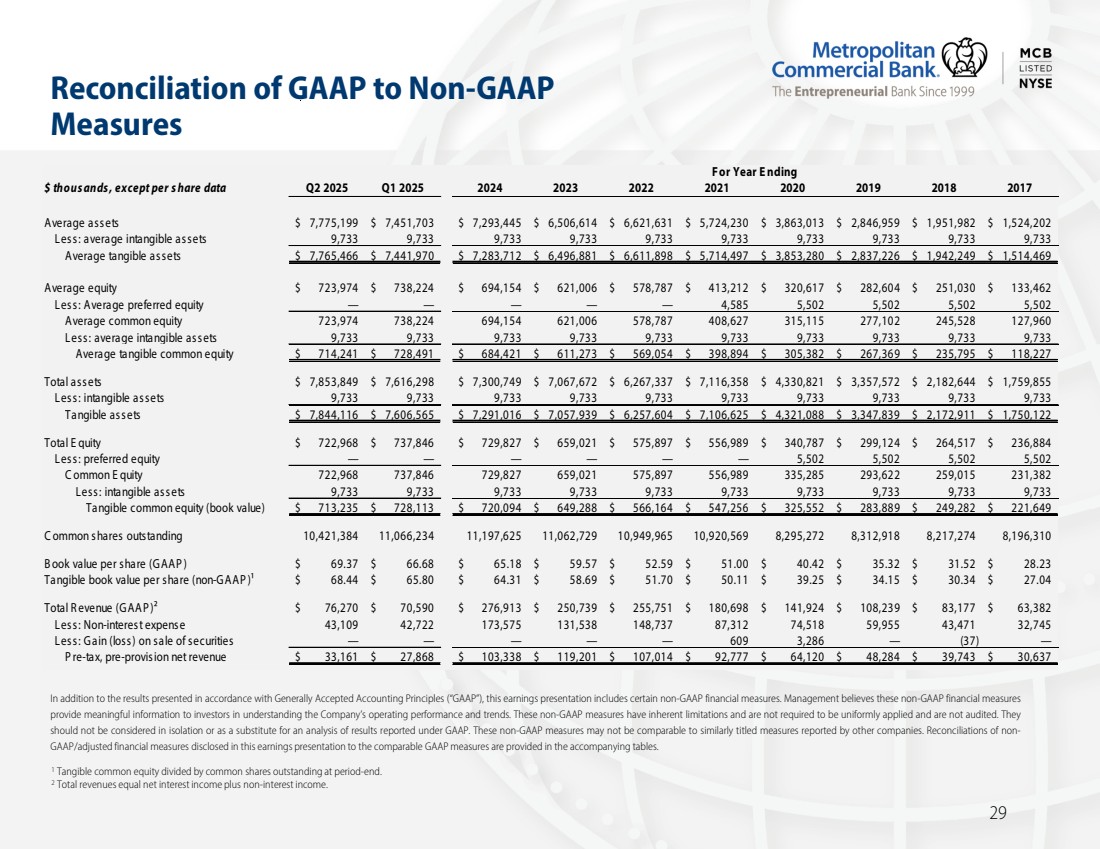
In addition to the results presented in accordance with Generally Accepted Accounting Principles (“GAAP”), this earnings release includes certain non-GAAP financial measures. Management believes these non-GAAP financial measures provide meaningful information to investors in understanding the Company’s operating performance and trends. These non-GAAP measures have inherent limitations and are not required to be uniformly applied and are not audited. They should not be considered in isolation or as a substitute for an analysis of results reported under GAAP. These non-GAAP measures may not be comparable to similarly titled measures reported by other companies. Reconciliations of non-GAAP/adjusted financial measures disclosed in this earnings release to the comparable GAAP measures are provided in the following tables:
| | Quarterly Data | | | Six months ended | | ||||||||||||||||||||||
(dollars in thousands, | | Jun. 30, | | | Mar. 31, | | | Dec. 31, | | | Sept. 30, | | | Jun. 30, | | | Jun. 30, | | | Jun. 30, | | |||||||
except per share data) | | 2025 | | | 2025 | | | 2024 | | | 2024 | | | 2024 | | | 2025 | | | 2024 | | |||||||
Average assets | | $ | 7,775,199 | | | $ | 7,451,703 | | | $ | 7,363,252 | | | $ | 7,297,503 | | | $ | 7,322,480 | | | $ | 7,613,420 | | | $ | 7,254,118 | |
Less: average intangible assets | | | 9,733 | | | | 9,733 | | | | 9,733 | | | | 9,733 | | | | 9,733 | | | | 9,733 | | | | 9,733 | |
Average tangible assets (non-GAAP) | | $ | 7,765,466 | | | $ | 7,441,970 | | | $ | 7,353,519 | | | $ | 7,287,770 | | | $ | 7,312,747 | | | $ | 7,603,687 | | | $ | 7,244,385 | |
| | | | | | | | | | | | | | | | | | | | | | | | | | | | |
Average equity | | $ | 723,974 | | | $ | 738,224 | | | $ | 721,506 | | | $ | 706,442 | | | $ | 680,064 | | | $ | 730,135 | | | $ | 673,531 | |
Less: average preferred equity | |
| — | | |
| — | | |
| — | | |
| — | | |
| — | | |
| — | | |
| — | |
Average common equity | | $ | 723,974 | | | $ | 738,224 | | | $ | 721,506 | | | $ | 706,442 | | | $ | 680,064 | | | $ | 730,135 | | | $ | 673,531 | |
Less: average intangible assets | |
| 9,733 | | |
| 9,733 | | |
| 9,733 | | |
| 9,733 | | |
| 9,733 | | |
| 9,733 | | |
| 9,733 | |
Average tangible common equity (non-GAAP) | | $ | 714,241 | | | $ | 728,491 | | | $ | 711,773 | | | $ | 696,709 | | | $ | 670,331 | | | $ | 720,402 | | | $ | 663,798 | |
| | | | | | | | | | | | | | | | | | | | | | | | | | | | |
Total assets | | $ | 7,853,849 | | | $ | 7,616,298 | | | $ | 7,300,749 | | | $ | 7,403,358 | | | $ | 7,265,591 | | | $ | 7,853,849 | | | $ | 7,265,591 | |
Less: intangible assets | | | 9,733 | | | | 9,733 | | | | 9,733 | | | | 9,733 | | | | 9,733 | | | | 9,733 | | | | 9,733 | |
Tangible assets (non-GAAP) | | $ | 7,844,116 | | | $ | 7,606,565 | | | $ | 7,291,016 | | | $ | 7,393,625 | | | $ | 7,255,858 | | | $ | 7,844,116 | | | $ | 7,255,858 | |
| | | | | | | | | | | | | | | | | | | | | | | | | | | | |
Common equity | | $ | 722,968 | | | $ | 737,846 | | | $ | 729,827 | | | $ | 715,191 | | | $ | 692,404 | | | $ | 722,968 | | | $ | 692,404 | |
Less: intangible assets | |
| 9,733 | | |
| 9,733 | | |
| 9,733 | | |
| 9,733 | | |
| 9,733 | | |
| 9,733 | | |
| 9,733 | |
Tangible common equity (book value) (non-GAAP) | | $ | 713,235 | | | $ | 728,113 | | | $ | 720,094 | | | $ | 705,458 | | | $ | 682,671 | | | $ | 713,235 | | | $ | 682,671 | |
| | | | | | | | | | | | | | | | | | | | | | | | | | | | |
Common shares outstanding | | | 10,421,384 | | | | 11,066,234 | | | | 11,197,625 | | | | 11,194,411 | | | | 11,192,936 | | | | 10,421,384 | | | | 11,192,936 | |
Book value per share (GAAP) | | $ | 69.37 | | | $ | 66.68 | | | $ | 65.18 | | | $ | 63.89 | | | $ | 61.86 | | | $ | 69.37 | | | $ | 61.86 | |
Tangible book value per share (non-GAAP) (1) | | $ | 68.44 | | | $ | 65.80 | | | $ | 64.31 | | | $ | 63.02 | | | $ | 60.99 | | | $ | 68.44 | | | $ | 60.99 | |
| (1) | Tangible book value divided by common shares outstanding at period-end. |
Explanatory Note
Some amounts presented within this document may not recalculate due to rounding.
12