met-20221102
0001099219false00010992192022-11-022022-11-020001099219us-gaap:CommonStockMember2022-11-022022-11-020001099219us-gaap:SeriesAPreferredStockMember2022-11-022022-11-020001099219us-gaap:SeriesEPreferredStockMember2022-11-022022-11-020001099219us-gaap:SeriesFPreferredStockMember2022-11-022022-11-02

UNITED STATES
SECURITIES AND EXCHANGE COMMISSION
WASHINGTON, D.C. 20549  
FORM 8-K
CURRENT REPORT
PURSUANT TO SECTION 13 OR 15(d)
OF THE SECURITIES EXCHANGE ACT OF 1934
Date of report (Date of earliest event reported): November 2, 2022
METLIFE, INC.
(Exact Name of Registrant as Specified in Its Charter)
Delaware
(State or Other Jurisdiction of Incorporation)
 
1-1578713-4075851
(Commission File Number)(IRS Employer Identification No.)
200 Park Avenue,New York,NY10166-0188
(Address of Principal Executive Offices)(Zip Code)
(212) 578-9500
(Registrant’s Telephone Number, Including Area Code)
N/A
(Former Name or Former Address, if Changed Since Last Report) 
Check the appropriate box below if the Form 8-K filing is intended to simultaneously satisfy the filing obligation of the registrant under any of the following provisions:
Written communications pursuant to Rule 425 under the Securities Act (17 CFR 230.425)
Soliciting material pursuant to Rule 14a-12 under the Exchange Act (17 CFR 240.14a-12)
Pre-commencement communications pursuant to Rule 14d-2(b) under the Exchange Act (17 CFR 240.14d-2(b))
Pre-commencement communications pursuant to Rule 13e-4(c) under the Exchange Act (17 CFR 240.13e-4(c))
Securities registered pursuant to Section 12(b) of the Act:
Title of each classTrading Symbol(s)Name of each exchange on which registered
Common Stock, par value $0.01METNew York Stock Exchange
Floating Rate Non-Cumulative Preferred Stock,
Series A, par value $0.01
MET PRANew York Stock Exchange
Depositary Shares, each representing a 1/1,000th
interest in a share of 5.625% Non-Cumulative
Preferred Stock, Series E
MET PRENew York Stock Exchange
Depositary Shares, each representing a 1/1,000th
interest in a share of 4.75% Non-Cumulative
Preferred Stock, Series F
MET PRF
New York Stock Exchange
Indicate by check mark whether the registrant is an emerging growth company as defined in Rule 405 of the Securities Act of 1933 (§230.405 of this chapter) or Rule 12b-2 of the Securities Exchange Act of 1934 (§240.12b-2 of this chapter).
Emerging growth company    
If an emerging growth company, indicate by check mark if the registrant has elected not to use the extended transition period for complying with any new or revised financial accounting standards provided pursuant to Section 13(a) of the Exchange Act.    


Item 2.02 Results of Operations and Financial Condition.
On November 2, 2022, MetLife, Inc. issued (i) a news release announcing its results for the quarter ended September 30, 2022 (the “Earnings Release”), a copy of which is attached hereto as Exhibit 99.1 and is incorporated herein by reference, and (ii) a Quarterly Financial Supplement for the quarter ended September 30, 2022 (the “Quarterly Financial Supplement”), a copy of which is attached hereto as Exhibit 99.2 and is incorporated herein by reference. The Earnings Release and the Quarterly Financial Supplement are furnished and not filed pursuant to instruction B.2 of Form 8-K.
Item 7.01 Regulation FD Disclosure.
On November 2, 2022, MetLife, Inc. issued a supplemental slide presentation for the quarter ended September 30, 2022 (the “Supplemental Slides”), a copy of which is attached hereto as Exhibit 99.3 and is incorporated herein by reference. The slides highlight information in MetLife, Inc.’s Earnings Release and Quarterly Financial Supplement. The Supplemental Slides are furnished and not filed pursuant to instruction B.2 of Form 8-K.
2


Item 9.01 Financial Statements and Exhibits.
101Pursuant to Rule 406 of Regulation S-T, the cover page is formatted in Inline XBRL (Inline eXtensible Business Reporting Language)
104Cover Page Interactive Data File (embedded within the Inline XBRL document and included in Exhibit 101)
3


SIGNATURES
Pursuant to the requirements of the Securities Exchange Act of 1934, the registrant has duly caused this report to be signed on its behalf by the undersigned hereunto duly authorized.
METLIFE, INC.
By:/s/ Tamara L. Schock
Name:Tamara L. Schock
Title:Executive Vice President and
Chief Accounting Officer
Date: November 2, 2022
4

Exhibit 99.1

mllogonewa22a.jpg
                    For Immediate Release İ Global Communications İ MetLife, Inc.


METLIFE ANNOUNCES THIRD QUARTER 2022 RESULTS
NEW YORK, November 2, 2022 - MetLife, Inc. (NYSE: MET) today announced its third quarter 2022 results.
Third Quarter Results Summary
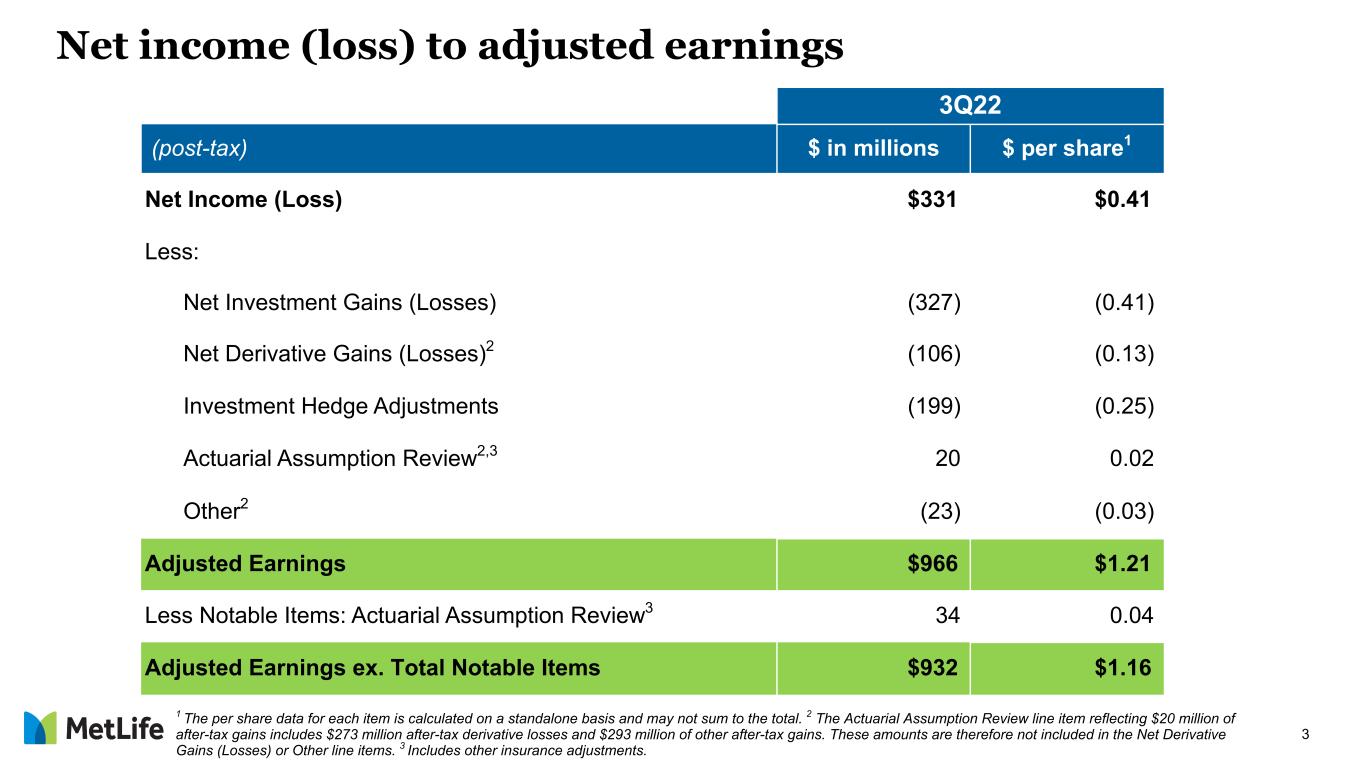
Net income of $331 million, or $0.41 per share, compared to net income of $1.5 billion, or $1.77 per share, in the third quarter of 2021.
Adjusted earnings of $966 million, or $1.21 per share, compared to adjusted earnings of $2.1 billion, or $2.39 per share, in the third quarter of 2021.
Book value of $27.00 per share, down 65 percent from $77.24 per share at September 30, 2021.
Book value, excluding accumulated other comprehensive income (AOCI) other than foreign currency translation adjustments (FCTA), of $54.37 per share, down 5 percent from $57.29 per share at September 30, 2021.
Return on equity (ROE) of 4.9 percent.
Adjusted ROE, excluding AOCI other than FCTA, of 8.9 percent.
Holding company cash and liquid assets of $5.2 billion at September 30, 2022, which is above the target cash buffer of $3.0 - $4.0 billion.


“Against the current backdrop, we are pleased with the execution of our Next Horizon strategy, which continues to demonstrate its resilience," said MetLife President and CEO Michel Khalaf. "The strong underlying growth fundamentals of our diversified set of market-leading businesses position MetLife to perform well across a range of economic cycles."


Page 1 of 28


Third Quarter 2022 Summary
($ in millions, except per share data)
Three months ended
September 30,
20222021Change
Premiums, fees and other revenues
$19,579 $11,639 68%
Net investment income
3,585 5,568 (36)%
Net investment gains (losses)
(414)(84)
Net derivative gains (losses)
(480)(218)
Total revenues
$22,270 $16,905 
Adjusted premiums, fees and other revenues
$19,527 $11,419 71%
Adjusted premiums, fees and other revenues, excluding pension risk transfers (PRT)$11,061 $11,443 (3)%
Net income (loss)
$331 $1,521 (78)%
Net income (loss) per share
$0.41 $1.77 (77)%
Adjusted earnings
$966 $2,062 (53)%
Adjusted earnings per share
$1.21 $2.39 (49)%
Adjusted earnings, excluding total notable items
$932 $2,202 (58)%
Adjusted earnings, excluding total notable items per share
$1.16 $2.56 (55)%
Book value per share
$27.00 $77.24 (65)%
Book value per share, excluding AOCI other than FCTA
$54.37 $57.29 (5)%
Expense ratio
11.6 %19.2 %   
Direct expense ratio, excluding total notable items related to direct expenses and PRT
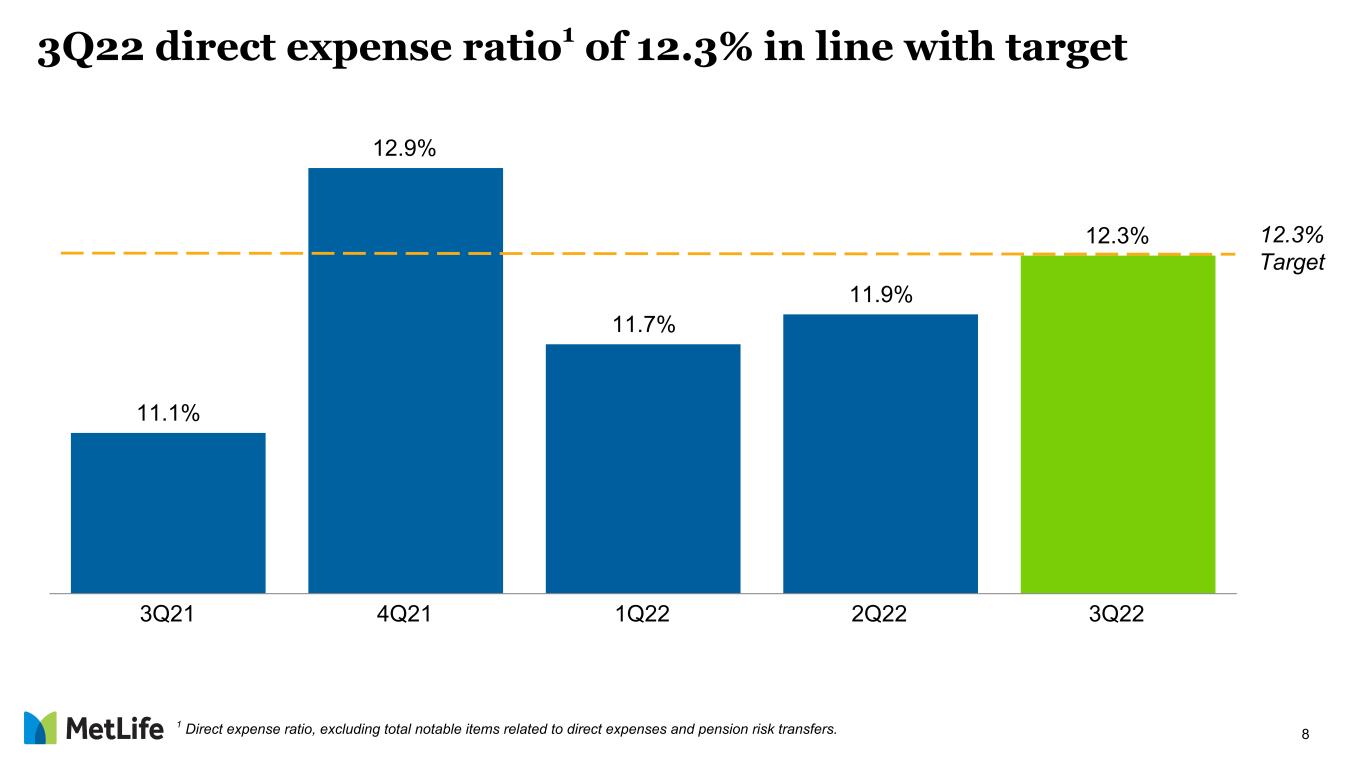
12.3 %11.1 %
Adjusted expense ratio, excluding total notable items related to adjusted other expenses and PRT20.1 %18.7 %
ROE
4.9 %9.3 %
Adjusted ROE, excluding AOCI other than FCTA
8.9 %17.0 %
Adjusted ROE, excluding total notable items (excludes AOCI other than FCTA)
8.6 %18.2 %

Information regarding the non-GAAP and other financial measures included in this news release and reconciliation of the non-GAAP financial measures to GAAP measures are in “Non-GAAP and Other Financial Disclosures” below and in the tables that accompany this news release.

Supplemental slides for the third quarter of 2022, titled “3Q22 Supplemental Slides,” are available on the MetLife Investor Relations website at https://investor.metlife.com and in the Form 8-K furnished by MetLife to the U.S. Securities and Exchange Commission in connection with this earnings release.
Page 2 of 28


Total Company Discussion
MetLife reported third quarter 2022 premiums, fees and other revenues of $19.6 billion, up 68 percent from the third quarter of 2021. Adjusted premiums, fees and other revenues were $19.5 billion, up 71 percent on a reported basis and up 78 percent on a constant currency basis from the prior-year period.
Net investment income was $3.6 billion, down 36 percent from the third quarter of 2021, largely driven by lower variable investment income primarily due to lower private equity returns. Adjusted net investment income was $4.2 billion, down 27 percent from the prior-year period, driven by lower variable investment income primarily due to lower private equity returns.
Net derivative losses amounted to $480 million, or $379 million after tax during the quarter, primarily driven by an increase in long-term interest rates.
Net income was $331 million, compared to net income of $1.5 billion in the third quarter of 2021, primarily driven by derivative and investment losses in the current-year period. On a per share basis, net income was $0.41, compared to net income of $1.77 in the prior-year period.
MetLife reported adjusted earnings of $966 million, down 53 percent on a reported basis and down 52 percent on a constant currency basis from the third quarter of 2021. On a per share basis, adjusted earnings were $1.21, down 49 percent from the prior-year period.

Annual Actuarial Assumption Review and Other Insurance Adjustments
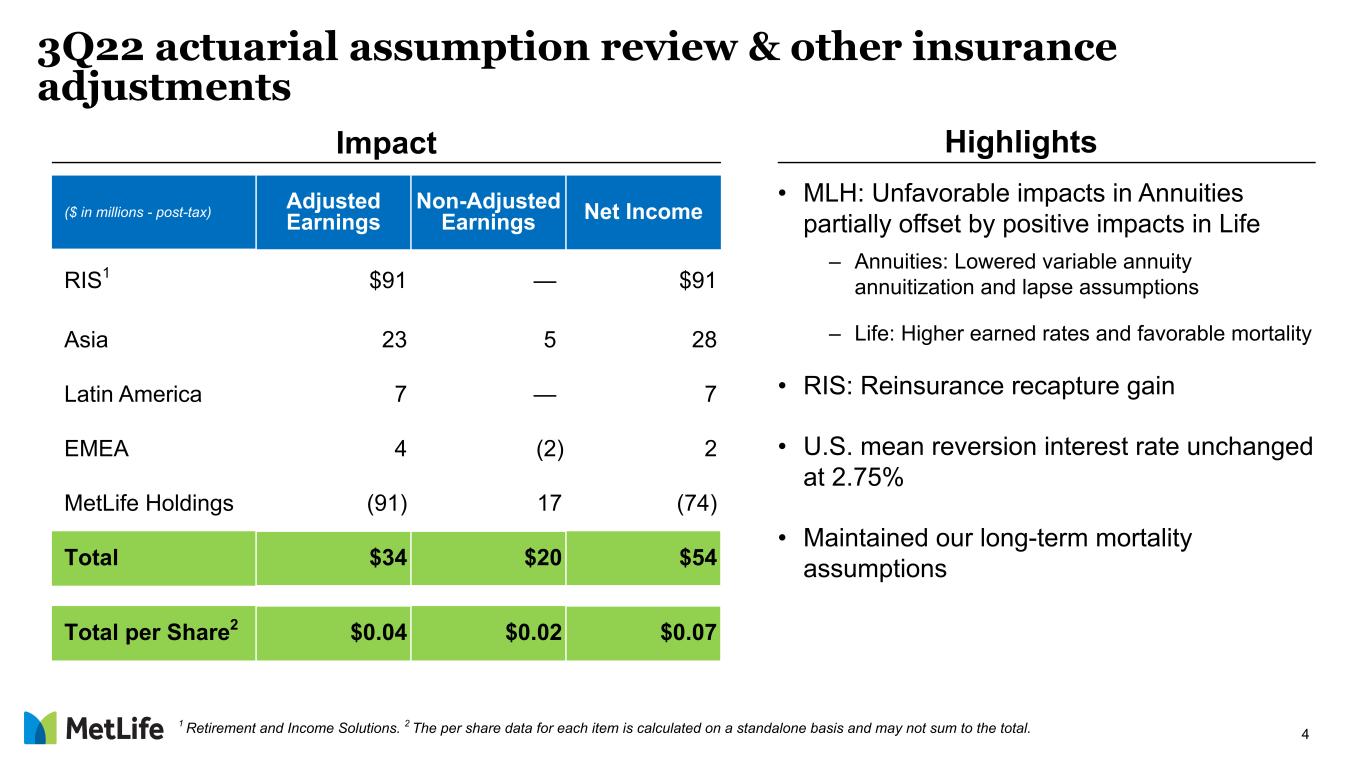
In the third quarter of 2022, MetLife performed the company's annual global actuarial assumption review. The actuarial assumption review and other insurance adjustments during the quarter increased net income by $54 million, of which $34 million positively impacted adjusted earnings.

Adjusted Earnings by Segment Summary*
Three months ended
September 30, 2022
SegmentChange from
prior-year period
Change from
prior-year
period (on a
constant
currency
basis)
U.S.(17)%
Asia(65)%(65)%
Latin America NM%**NM%**
Europe, the Middle East and Africa (EMEA)
(36)%(20)%
MetLife Holdings(90)%
* The percentages in this table are on a reported and constant currency basis, and do not exclude notable items.
** Not meaningful. For more information, refer to "Non-GAAP and Other Financial Disclosures".


Page 3 of 28


Business Discussions
All comparisons of the results for the third quarter of 2022 in the business discussions that follow are with the third quarter of 2021, unless otherwise noted. The third quarter of 2022 notable items table follows the Business Discussions section of this release.

U.S.
($ in millions)Three months ended September 30, 2022Three months ended September 30, 2021Change
Adjusted earnings
$744$895(17)%
Adjusted premiums, fees and other revenues
$14,966$6,408134%
Adjusted premiums, fees and other revenues, excluding PRT
$6,500$6,4321%
Notable item(s)
$91$0

Adjusted earnings were $744 million, down 17 percent, primarily driven by lower variable investment income partially offset by a decline in COVID-19 life insurance claims.
Excluding notable items from both periods, adjusted earnings were down 27 percent.
Adjusted return on allocated equity was 26.1 percent, and adjusted return on allocated tangible equity was 35.0 percent.
Adjusted premiums, fees and other revenues were $15.0 billion, up 134 percent, primarily driven by higher pension risk transfer sales.


Page 4 of 28


Group Benefits
($ in millions)Three months ended September 30, 2022Three months ended September 30, 2021Change
Adjusted earnings
$399$111259%
Adjusted premiums, fees and other revenues
$5,707$5,5173%
Notable item(s)$0$0

Adjusted earnings were $399 million, up 259 percent, primarily driven by favorable underwriting, including a decline in COVID-19 life insurance claims, and volume growth.
Adjusted premiums, fees and other revenues were $5.7 billion, up 3 percent, primarily driven by solid growth across most products, including voluntary, partially offset by higher premiums in the prior year related to participating life contracts. Premiums, fees and other revenues from participating life contracts can fluctuate with claims experience.
Sales were down 18 percent year-to-date due to lower jumbo case activity.


Retirement and Income Solutions
($ in millions)Three months ended September 30, 2022Three months ended September 30, 2021Change
Adjusted earnings
$345$784(56)%
Adjusted premiums, fees and other revenues
$9,259$891NM%
Adjusted premiums, fees and other revenues, excluding PRT
$793$915(13)%
Notable item(s)$91$0 

Adjusted earnings were $345 million, down 56 percent, largely driven by lower variable investment income. The notable item in the current-year period, related to a favorable reinsurance recapture, was a partial offset.
Excluding notable items from both periods, adjusted earnings were down 68 percent.
Adjusted premiums, fees and other revenues were $9.3 billion, compared to $891 million in the third quarter of 2021, primarily driven by a large pension risk transfer transaction.
Excluding pension risk transfers, adjusted premiums, fees and other revenues were $793 million, down 13 percent, primarily due to higher single premium life insurance sales in the prior-year period.
Sales were up 59 percent year-to-date, primarily driven by pension risk transfer transactions and stable value products.


Page 5 of 28


ASIA
($ in millions)Three months ended September 30, 2022Three months ended September 30, 2021Change
Adjusted earnings$197$569(65)%
Adjusted earnings (constant currency)
$197$555(65)%
Adjusted premiums, fees and other revenues
$1,789$2,088(14)%
Notable item(s)$23$(79)
Asia general account assets under management (at amortized cost)$119,302$130,777(9)%

Adjusted earnings were $197 million, down 65 percent both on a reported and constant currency basis, largely driven by lower variable investment income and unfavorable underwriting primarily from COVID-19 claims in Japan, partially offset by volume growth and the positive impact from the annual actuarial assumption review.
Excluding notable items from both periods, adjusted earnings were down 73 percent on both a reported and constant currency basis.
Adjusted return on allocated equity was 5.5 percent, and adjusted return on allocated tangible equity was 8.2 percent.
Adjusted premiums, fees and other revenues were $1.8 billion, down 14 percent, and up 2 percent on a constant currency basis.
Asia general account assets under management (at amortized cost) were $119.3 billion, down 9 percent, and up 4 percent on a constant currency basis.
Sales were $585 million, up 27 percent on a constant currency basis, primarily driven by sales in Japan.


Page 6 of 28


LATIN AMERICA*
($ in millions)Three months ended September 30, 2022Three months ended September 30, 2021Change
Adjusted earnings$171$29NM%
Adjusted earnings (constant currency)
$171$19NM%
Adjusted premiums, fees and other revenues
$1,123$98814%
Notable item(s)$7$(2)
* For the three months ended September 30, 2022, Latin America results exclude the Argentina business, which was sold in the third quarter of 2021. This business is included in the prior-year period.

Adjusted earnings were $171 million on both a reported and constant currency basis, compared to $29 million on a reported basis and $19 million on a constant currency basis for the third quarter of 2021, primarily driven by a decline in COVID-19 related claims and volume growth. Higher recurring interest margins, largely due to inflation in Chile, were more than offset by lower variable investment income and Chilean encaje returns.
Excluding notable items from both periods, adjusted earnings percentage changes were not meaningful on either a reported or a constant currency basis.
Adjusted return on allocated equity was 25.1 percent, and adjusted return on allocated tangible equity was 39.1 percent.
Adjusted premiums, fees and other revenues were $1.1 billion, up 14 percent, and up 21 percent on a constant currency basis, driven by strong sales and solid persistency across the region.
Sales were $288 million, up 22 percent on a constant currency basis, driven by growth across the region.


Page 7 of 28


EMEA
($ in millions)Three months ended September 30, 2022Three months ended September 30, 2021Change
Adjusted earnings
$60$94(36)%
Adjusted earnings (constant currency)
$60$75(20)%
Adjusted premiums, fees and other revenues
$545$670(19)%
Notable item(s)
$4$(6)

Adjusted earnings were $60 million, down 36 percent on a reported basis, and down 20 percent on a constant currency basis, largely due to refinements to certain unearned revenue reserves in both periods and less favorable underwriting compared to the prior-year period.
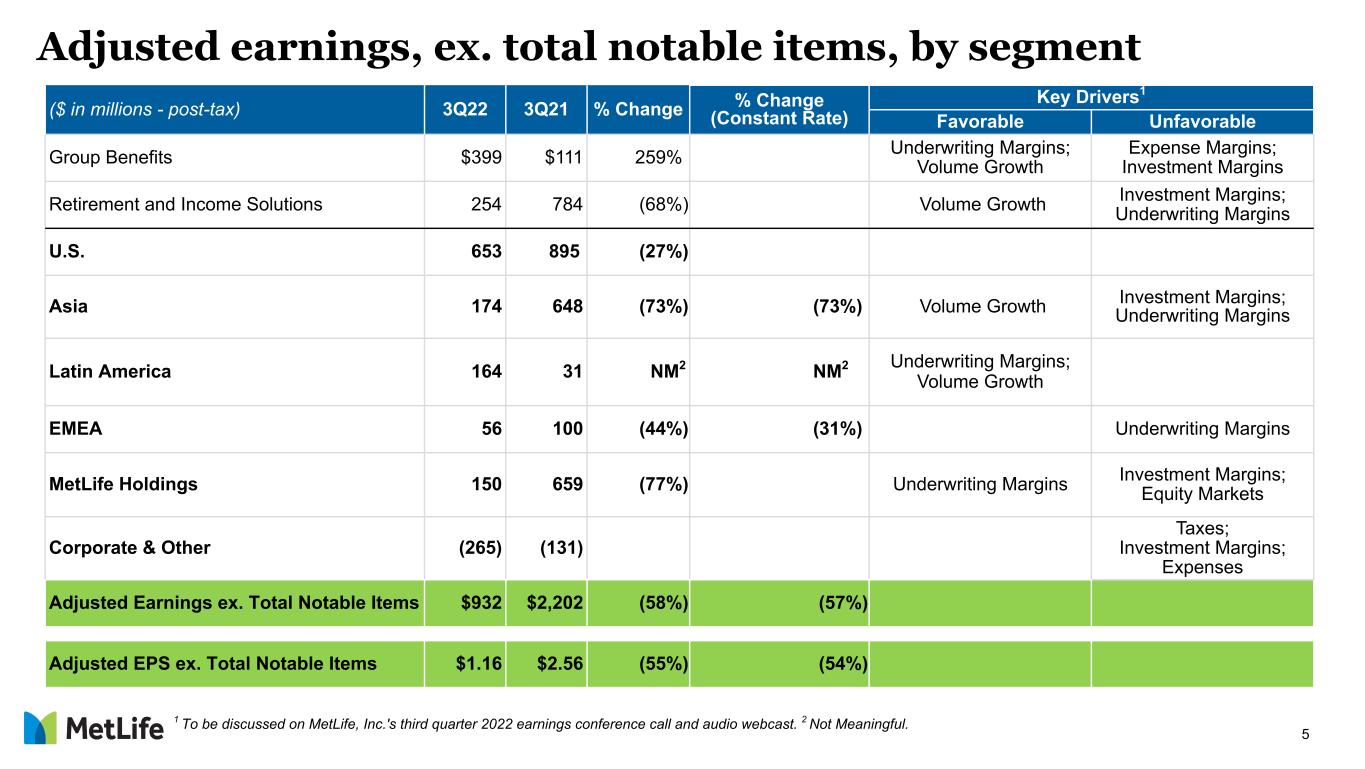
Excluding notable items from both periods, adjusted earnings were down 44 percent on a reported basis and down 31 percent on a constant currency basis.
Adjusted return on allocated equity was 10.7 percent, and adjusted return on allocated tangible equity was 15.8 percent.
Adjusted premiums, fees and other revenues were $545 million, down 19 percent, and down 7 percent on a constant currency basis, primarily due to refinements to certain unearned revenue reserves in both periods.
Sales were $175 million, up 10 percent on a constant currency basis, driven by growth across the region.

METLIFE HOLDINGS
($ in millions)Three months ended September 30, 2022Three months ended September 30, 2021Change
Adjusted earnings
$59$606(90)%
Adjusted premiums, fees and other revenues
$1,016$1,141(11)%
Notable item(s)
$(91)$(53)

Adjusted earnings were $59 million, down 90 percent, largely driven by lower variable investment income. The notable item is related to the actuarial assumption review and other insurance adjustments.
Excluding notable items from both periods, adjusted earnings were down 77 percent.
Adjusted return on allocated equity was 2.1 percent, and adjusted return on allocated tangible equity was 2.4 percent.
Adjusted premiums, fees and other revenues were $1.0 billion, down 11 percent.


Page 8 of 28


CORPORATE & OTHER
($ in millions)Three months ended September 30, 2022Three months ended September 30, 2021Change
Adjusted earnings$(265)$(131)
Notable item(s)$0$0

Adjusted loss of $265 million, compared to an adjusted loss of $131 million in the prior-year period.


INVESTMENTS
($ in millions)Three months ended September 30, 2022Three months ended September 30, 2021Change
Adjusted net investment income
$4,163$5,668(27)%

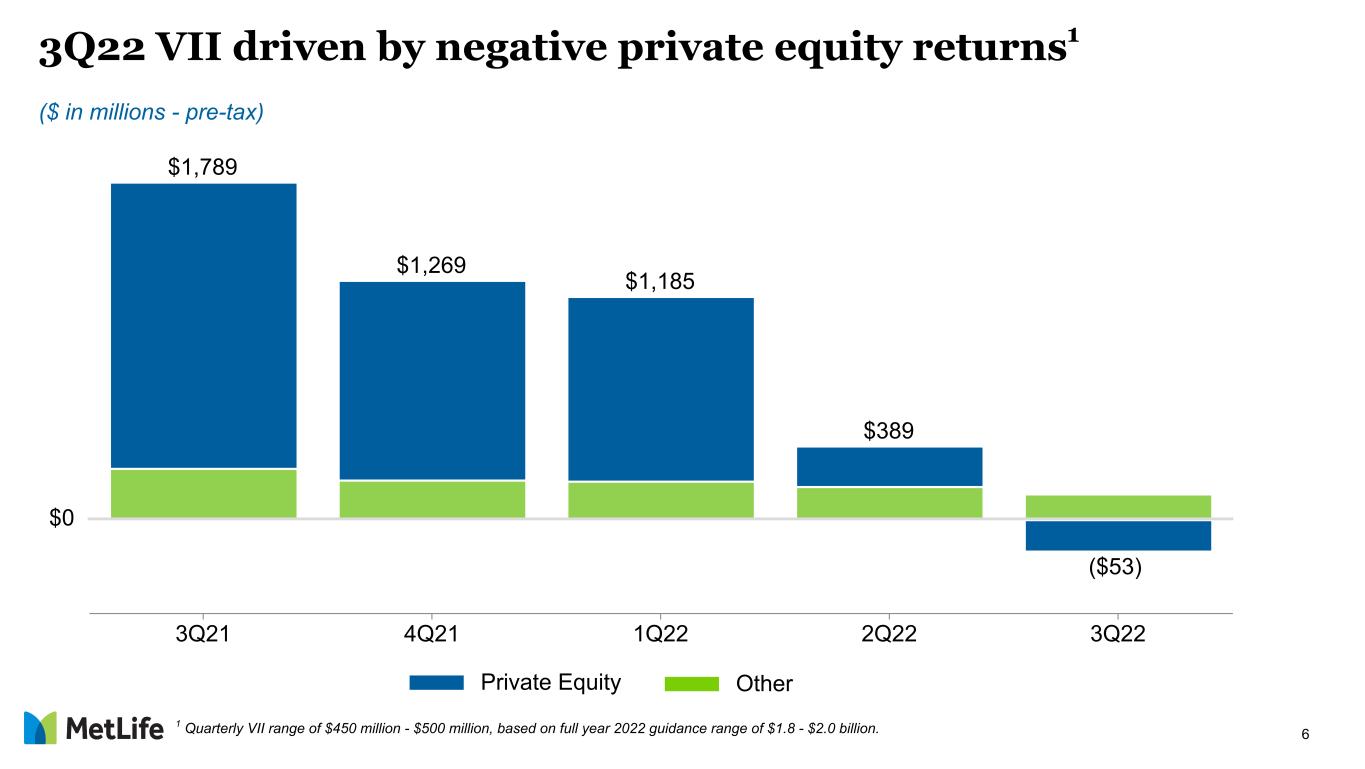
Adjusted net investment income was $4.2 billion, down 27 percent. Variable investment income was a loss of $53 million, compared to variable investment income of $1.8 billion in the prior-year period, primarily driven by lower private equity returns.


THIRD QUARTER 2022 NOTABLE ITEMS
($ in millions)
Adjusted Earnings
Three months ended September 30, 2022
Notable ItemsU.S.AsiaLatin
America
EMEAMetLife
Holdings
Corporate
&
Other
Total
Group BenefitsRetirement and Income Solutions
Actuarial assumption review and other insurance adjustments$0$91$23$7$4$(91)$0$34
Total notable items$0$91$23$7$4$(91)$0$34

###

Contacts:     For Media:        Brian Blaser (212) 578-2415    
For Investors:         John Hall (212) 578-7888


Page 9 of 28


About MetLife
MetLife, Inc. (NYSE: MET), through its subsidiaries and affiliates (“MetLife”), is one of the world’s leading financial services companies, providing insurance, annuities, employee benefits and asset management to help individual and institutional customers build a more confident future. Founded in 1868, MetLife has operations in more than 40 markets globally and holds leading positions in the United States, Japan, Latin America, Asia, Europe and the Middle East. For more information, visit www.metlife.com.
Conference Call
MetLife will hold its third quarter 2022 earnings conference call and audio webcast on Thursday, November 3, 2022, from 9-10 a.m. (ET). The conference call will be available live via telephone and the internet. To listen via telephone, dial 877-692-8955 (U.S.) or 234-720-6979 (outside the U.S.). The participant access code is 2510803. To listen to the conference call via the internet, click the link to the webcast on the MetLife Investor Relations web page (https://investor.metlife.com). Those who want to listen to the call via telephone or the internet should dial in or go to the website at least 15 minutes prior to the call to register, and/or download and install any necessary audio software.

The conference call will be available for replay via telephone and the internet beginning at 11 a.m. (ET) on Thursday, November 3, 2022, until Thursday, November 10, 2022, at 11:59 p.m. (ET). To listen to a replay of the conference call via telephone, dial 866-207-1041 (U.S.) or 402-970-0847 (outside the U.S.). The access code for the replay is 6217824. To access the replay of the conference call over the internet, visit the above-mentioned website.
Non-GAAP and Other Financial Disclosures
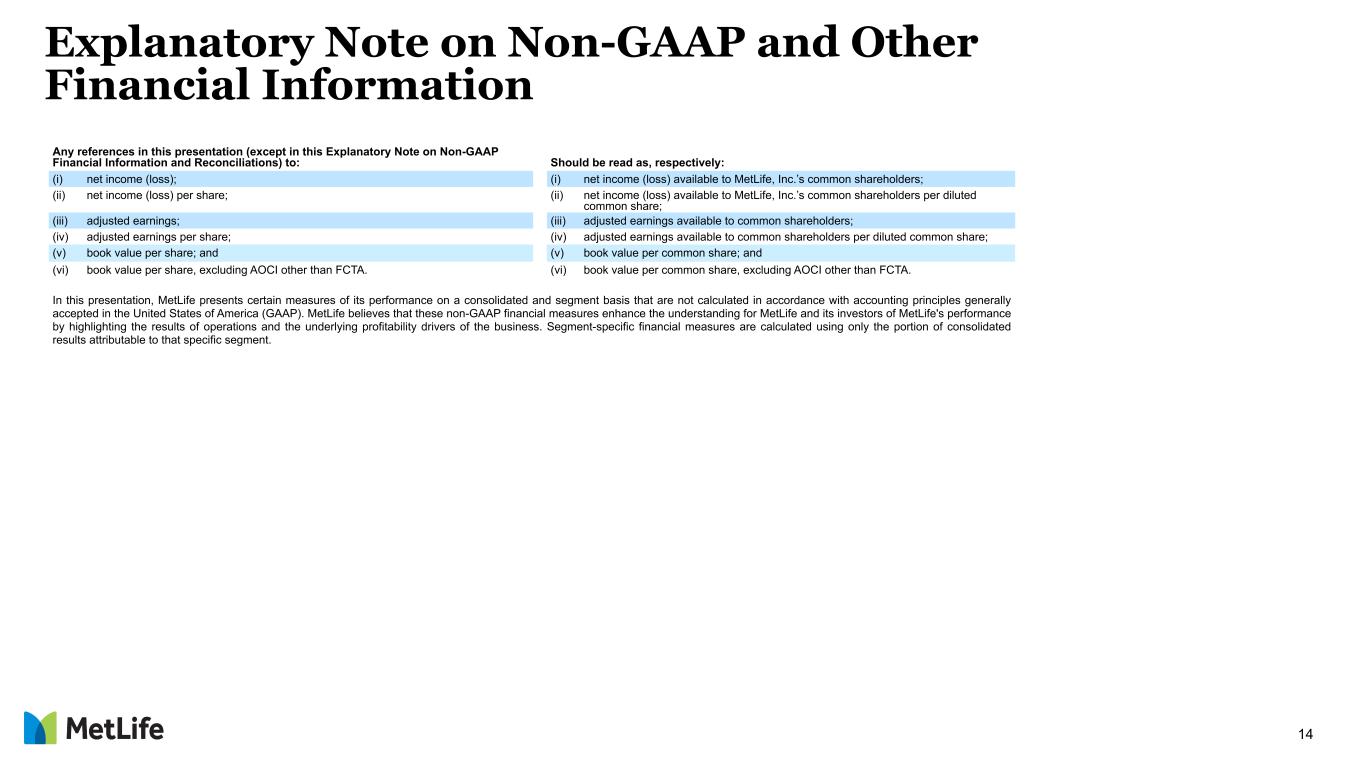
Any references in this news release (except in this section and the tables that accompany this release) to:should be read as, respectively:
(i)net income (loss);(i) net income (loss) available to MetLife, Inc.’s common shareholders;
(ii)net income (loss) per share;(ii)net income (loss) available to MetLife, Inc.’s common shareholders per diluted common share;
(iii)adjusted earnings;(iii)adjusted earnings available to common shareholders;
(iv)adjusted earnings per share;(iv)adjusted earnings available to common shareholders per diluted common share;
(v)book value per share;(v)book value per common share;
(vi)book value per share, excluding AOCI other than FCTA;(vi)book value per common share, excluding AOCI other than FCTA;
(vii)book value per share-tangible common stockholders’ equity;(vii) book value per common share-tangible common stockholders’ equity;
(viii)return on equity;(viii)return on MetLife, Inc.’s common stockholders’ equity;
(ix)adjusted return on equity, excluding AOCI other than FCTA; and(ix)adjusted return on MetLife, Inc.’s common stockholders’ equity, excluding AOCI other than FCTA; and
Page 10 of 28


(x)adjusted tangible return on equity.(x)adjusted return on MetLife, Inc.’s tangible common stockholders’ equity.

In this news release, MetLife presents certain measures of its performance on a consolidated and segment basis that are not calculated in accordance with accounting principles generally accepted in the United States of America (GAAP). MetLife believes that these non-GAAP financial measures enhance the understanding for MetLife and its investors of MetLife's performance by highlighting the results of operations and the underlying profitability drivers of the business. Segment-specific financial measures are calculated using only the portion of consolidated results attributable to that specific segment.
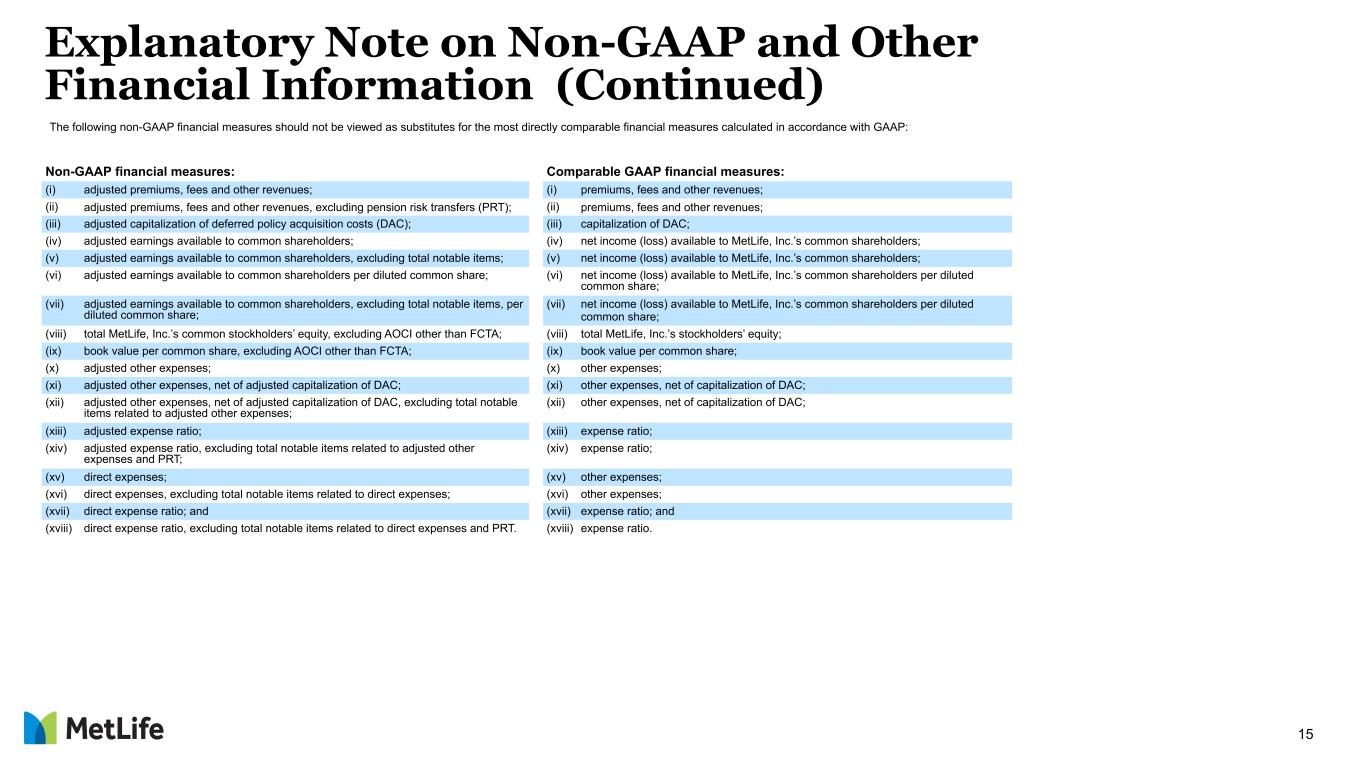
The following non-GAAP financial measures should not be viewed as substitutes for the most directly comparable financial measures calculated in accordance with GAAP:
Non-GAAP financial measures:Comparable GAAP financial measures:
(i)total adjusted revenues;(i)total revenues;
(ii)total adjusted expenses;(ii)total expenses;
(iii)adjusted premiums, fees and other revenues;(iii)premiums, fees and other revenues;
(iv)adjusted premiums, fees and other revenues, excluding PRT;(iv)premiums, fees and other revenues;
(v)adjusted net investment income;(v)net investment income;
(vi)adjusted capitalization of deferred policy acquisition costs (DAC);(vi)capitalization of DAC;
(vii)adjusted earnings available to common shareholders;(vii)net income (loss) available to MetLife, Inc.’s common shareholders;
(viii)adjusted earnings available to common shareholders, excluding total notable items;(viii)net income (loss) available to MetLife, Inc.’s common shareholders;
(ix)adjusted earnings available to common shareholders per diluted common share;(ix)net income (loss) available to MetLife, Inc.’s common shareholders per diluted common share;
(x)adjusted earnings available to common shareholders, excluding total notable items, per diluted common share;(x)net income (loss) available to MetLife, Inc.’s common shareholders per diluted common share;
(xi)adjusted return on equity;(xi)return on equity;
(xii)adjusted return on equity, excluding AOCI other than FCTA;(xii)return on equity;
(xiii)adjusted return on equity, excluding total notable items (excludes AOCI other than FCTA);(xiii)return on equity;
(xiv)adjusted tangible return on equity;(xiv)return on equity;
(xv)investment portfolio gains (losses);(xv)net investment gains (losses);
(xvi)derivative gains (losses);(xvi)net derivative gains (losses);
(xvii)total MetLife, Inc.’s tangible common stockholders’ equity;(xvii)total MetLife, Inc.’s stockholders’ equity;
(xviii)total MetLife, Inc.’s tangible common stockholders’ equity, excluding total notable items;(xviii)total MetLife, Inc.’s stockholders’ equity;
(xix)total MetLife, Inc.’s common stockholders’ equity, excluding AOCI other than FCTA;(xix)total MetLife, Inc.’s stockholders’ equity;
Page 11 of 28


(xx)total MetLife, Inc.’s common stockholders’ equity, excluding total notable items (excludes AOCI other than FCTA);(xx)total MetLife, Inc.’s stockholders’ equity;
(xxi)book value per common share, excluding AOCI other than FCTA;(xxi)book value per common share;
(xxii)book value per common share - tangible common stockholders' equity;(xxii)book value per common share;
(xxiii)free cash flow of all holding companies;(xxiii)MetLife, Inc. (parent company only) net cash provided by (used in) operating activities;
(xxiv)adjusted other expenses;(xxiv)other expenses;
(xxv)adjusted other expenses, net of adjusted capitalization of DAC;(xxv)other expenses, net of capitalization of DAC;
(xxvi)adjusted other expenses, net of adjusted capitalization of DAC, excluding total notable items related to adjusted other expenses;(xxvi)other expenses, net of capitalization of DAC;
(xxvii)adjusted expense ratio;(xxvii)expense ratio;
(xxviii)adjusted expense ratio, excluding total notable items related to adjusted other expenses and PRT;(xxviii)expense ratio;
(xxix)direct expenses;(xxix)other expenses;
(xxx)direct expenses, excluding total notable items related to direct expenses;(xxx)other expenses;
(xxxi)direct expense ratio; and(xxxi)expense ratio; and
(xxxii)direct expense ratio, excluding total notable items related to direct expenses and PRT.(xxxii)expense ratio.

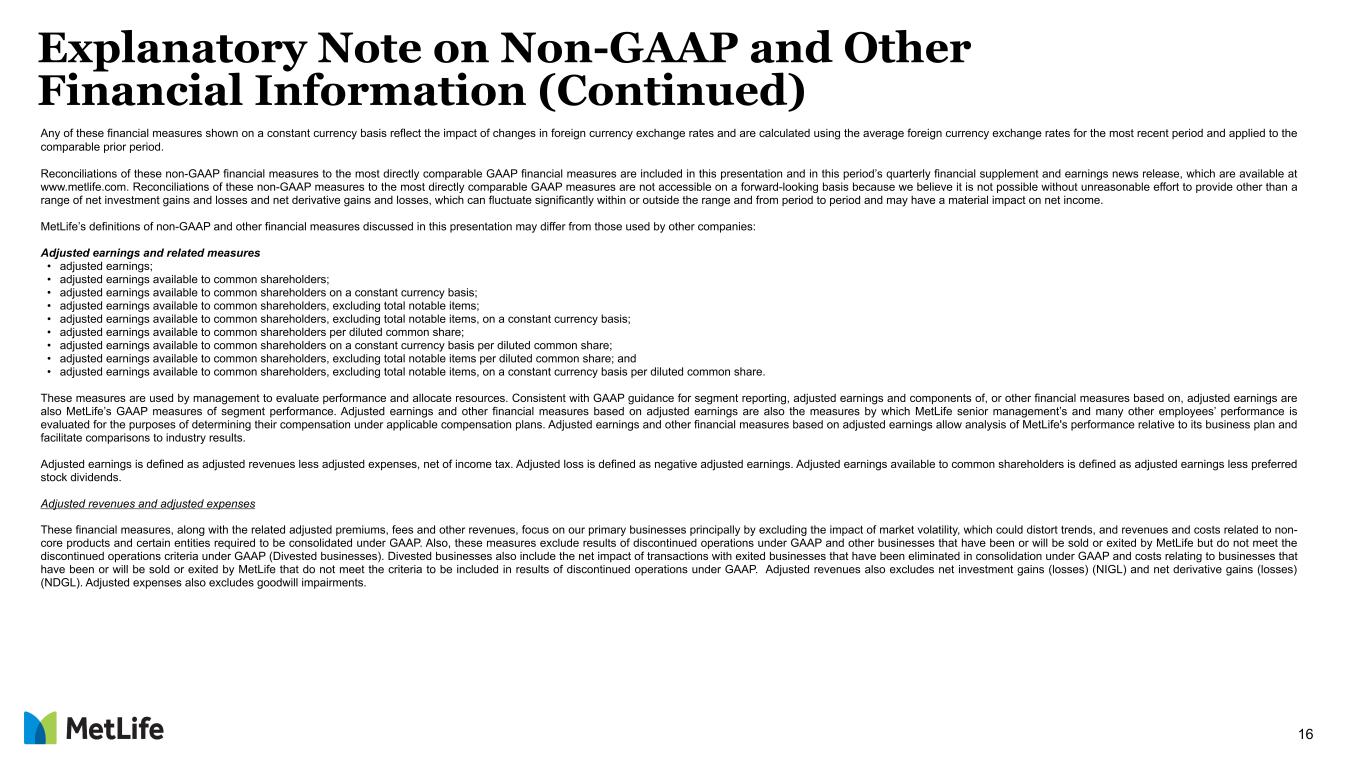
Any of these financial measures shown on a constant currency basis reflect the impact of changes in foreign currency exchange rates and are calculated using the average foreign currency exchange rates for the most recent period and applied to the comparable prior period.

Reconciliations of these non-GAAP financial measures to the most directly comparable GAAP financial measures are included in this earnings news release and in this period’s quarterly financial supplement, which is available at www.metlife.com.

MetLife’s definitions of non-GAAP and other financial measures discussed in this news release may differ from those used by other companies:
Adjusted earnings and related measures
adjusted earnings;
adjusted earnings available to common shareholders;
adjusted earnings available to common shareholders on a constant currency basis;
adjusted earnings available to common shareholders, excluding total notable items;
adjusted earnings available to common shareholders, excluding total notable items, on a constant currency basis;
adjusted earnings available to common shareholders per diluted common share;
adjusted earnings available to common shareholders on a constant currency basis per diluted common share;
adjusted earnings available to common shareholders, excluding total notable items per diluted common share; and
Page 12 of 28


adjusted earnings available to common shareholders, excluding total notable items, on a constant currency basis per diluted common share.

These measures are used by management to evaluate performance and allocate resources. Consistent with GAAP guidance for segment reporting, adjusted earnings and components of, or other financial measures based on, adjusted earnings are also MetLife’s GAAP measures of segment performance. Adjusted earnings and other financial measures based on adjusted earnings are also the measures by which MetLife senior management’s and many other employees’ performance is evaluated for the purposes of determining their compensation under applicable compensation plans. Adjusted earnings and other financial measures based on adjusted earnings allow analysis of MetLife's performance relative to its business plan and facilitate comparisons to industry results.
Adjusted earnings is defined as adjusted revenues less adjusted expenses, net of income tax. Adjusted loss is defined as negative adjusted earnings. Adjusted earnings available to common shareholders is defined as adjusted earnings less preferred stock dividends.
Adjusted revenues and adjusted expenses
These financial measures, along with the related adjusted premiums, fees and other revenues, focus on our primary businesses principally by excluding the impact of market volatility, which could distort trends, and revenues and costs related to non-core products and certain entities required to be consolidated under GAAP. Also, these measures exclude results of discontinued operations under GAAP and other businesses that have been or will be sold or exited by MetLife but do not meet the discontinued operations criteria under GAAP and are referred to as divested businesses. Divested businesses also include the net impact of transactions with exited businesses that have been eliminated in consolidation under GAAP and costs relating to businesses that have been or will be sold or exited by MetLife that do not meet the criteria to be included in results of discontinued operations under GAAP.

Adjusted revenues also excludes net investment gains (losses) (NIGL) and net derivative gains (losses) (NDGL). Adjusted expenses also excludes goodwill impairments.
The following additional adjustments are made to revenues, in the line items indicated, in calculating adjusted revenues:
Universal life and investment-type product policy fees excludes the amortization of unearned revenue related to NIGL and NDGL (Unearned revenue adjustments) and certain variable annuity guaranteed minimum income benefits (GMIB) fees (GMIB fees);
Net investment income: (i) includes adjustments for earned income on derivatives and amortization of premium on derivatives that are hedges of investments or that are used to replicate certain investments, but do not qualify for hedge accounting treatment (Investment hedge adjustments), (ii) excludes post-tax adjusted earnings adjustments relating to insurance joint ventures accounted for under the equity method (Operating joint venture adjustments), (iii) excludes certain amounts related to contractholder-directed equity securities (Unit-linked contract income), (iv) excludes certain amounts related to securitization entities that are variable interest entities (VIEs) consolidated under GAAP (Securitization entities income); and (v) includes distributions of profits from certain other limited partnership interests that were previously accounted for under the cost method, but are now accounted for at estimated fair value, where the change in estimated fair value is recognized in NIGL under GAAP (Certain partnership distributions); and
Other revenues is adjusted for settlements of foreign currency earnings hedges and excludes fees received in association with services provided under transition service agreements (TSA fees).
The following additional adjustments are made to expenses, in the line items indicated, in calculating adjusted expenses:
Policyholder benefits and claims and policyholder dividends excludes: (i) amortization of basis adjustments associated with de-designated fair value hedges of future policy benefits (PBC hedge adjustments), (ii) changes in the policyholder dividend obligation related to NIGL and NDGL (PDO adjustments), (iii) inflation-indexed benefit adjustments associated with contracts backed by
Page 13 of 28


inflation-indexed investments and amounts associated with periodic crediting rate adjustments based on the total return of a contractually referenced pool of assets and other pass-through adjustments (Inflation and pass-through adjustments), (iv) benefits and hedging costs related to GMIBs (GMIB costs), and (v) market value adjustments associated with surrenders or terminations of contracts (Market value adjustments);
Interest credited to policyholder account balances includes adjustments for earned income on derivatives and amortization of premium on derivatives that are hedges of policyholder account balances but do not qualify for hedge accounting treatment (PAB hedge adjustments) and excludes certain amounts related to net investment income earned on contractholder-directed equity securities (Unit-linked contract costs);
Amortization of DAC and value of business acquired (VOBA) excludes amounts related to: (i) NIGL and NDGL, (ii) GMIB fees and GMIB costs and (iii) Market value adjustments;
Amortization of negative VOBA excludes amounts related to Market value adjustments;
Interest expense on debt excludes certain amounts related to securitization entities that are VIEs consolidated under GAAP (Securitization entities debt expense); and
Other expenses excludes: (i) noncontrolling interests, (ii) implementation of new insurance regulatory requirements costs (Regulatory implementation costs), and (iii) acquisition, integration and other costs. Other expenses includes TSA fees.
Adjusted earnings also excludes the recognition of certain contingent assets and liabilities that could not be recognized at acquisition or adjusted for during the measurement period under GAAP business combination accounting guidance.
The tax impact of the adjustments mentioned above are calculated net of the U.S. or foreign statutory tax rate, which could differ from MetLife’s effective tax rate. Additionally, the provision for income tax (expense) benefit also includes the impact related to the timing of certain tax credits, as well as certain tax reforms.
In addition, adjusted earnings available to common shareholders excludes the impact of preferred stock redemption premium, which is reported as a reduction to net income (loss) available to MetLife, Inc.’s common shareholders.
Investment portfolio gains (losses) and derivative gains (losses)
These are measures of investment and hedging activity. Investment portfolio gains (losses) principally excludes amounts that are reported within net investment gains (losses) but do not relate to the performance of the investment portfolio, such as gains (losses) on sales and divestitures of businesses, as well as investment portfolio gains (losses) of divested businesses. Derivative gains (losses) principally excludes earned income on derivatives and amortization of premium on derivatives, where such derivatives are either hedges of investments or are used to replicate certain investments, and where such derivatives do not qualify for hedge accounting. This earned income and amortization of premium is reported within adjusted earnings and not within derivative gains (losses).
Return on equity, allocated equity, tangible equity and related measures
Total MetLife, Inc.’s common stockholders’ equity, excluding AOCI other than FCTA: total MetLife, Inc.’s common stockholders’ equity, excluding net unrealized investment gains (losses) and defined benefit plans adjustment components of AOCI, net of income tax.
Total MetLife, Inc.’s common stockholders’ equity, excluding total notable items (excludes AOCI other than FCTA): total MetLife, Inc.’s common stockholders’ equity, excluding net unrealized investment gains (losses), defined benefit plans adjustment components of AOCI and total notable items, net of income tax.
Return on MetLife, Inc.’s common stockholders’ equity: net income (loss) available to MetLife, Inc.’s common shareholders divided by MetLife, Inc.’s average common stockholders’ equity.
Adjusted return on MetLife, Inc.'s common stockholders' equity: adjusted earnings available to common shareholders divided by MetLife, Inc.'s average common stockholders' equity.
Adjusted return on MetLife, Inc.'s common stockholders' equity, excluding AOCI other than FCTA: adjusted earnings available to common shareholders divided by MetLife, Inc.'s average common
Page 14 of 28


stockholders' equity, excluding AOCI other than FCTA.
Adjusted return on MetLife, Inc.'s common stockholders' equity, excluding total notable items (excludes AOCI other than FCTA): adjusted earnings available to common shareholders, excluding total notable items, divided by MetLife, Inc.'s average common stockholders' equity, excluding total notable items (excludes AOCI other than FCTA).
Allocated equity: portion of MetLife, Inc.’s common stockholders’ equity that management allocates to each of its segments and sub-segments based on local capital requirements and economic capital. Economic capital is an internally developed risk capital model, the purpose of which is to measure the risk in the business and to provide a basis upon which capital is deployed. MetLife management periodically reviews this model to ensure that it remains consistent with emerging industry practice standards and the local capital requirements; allocated equity may be adjusted if warranted by such review. Allocated equity excludes the impact of AOCI other than FCTA.
Adjusted return on allocated equity: adjusted earnings available to common shareholders divided by allocated equity. The above measures represent a level of equity consistent with the view that, in the ordinary course of business, MetLife does not plan to sell most investments for the sole purpose of realizing gains or losses.
Total MetLife, Inc.’s tangible common stockholders’ equity or tangible equity: total MetLife, Inc.’s common stockholders’ equity, excluding AOCI other than FCTA, reduced by the impact of goodwill, value of distribution agreements acquired (VODA) and value of customer relationships acquired (VOCRA), all net of income tax.
Total MetLife, Inc.’s tangible common stockholders’ equity, adjusted for total notable items: total MetLife, Inc.’s common stockholders’ equity, excluding AOCI other than FCTA, reduced by the impact of goodwill, VODA, VOCRA and total notable items, all net of income tax.
Adjusted return on MetLife, Inc.'s tangible common stockholders' equity: adjusted earnings available to common shareholders, excluding amortization of VODA and VOCRA, net of income tax, divided by MetLife, Inc.'s average tangible common stockholders' equity.
Allocated tangible equity: allocated equity reduced by the impact of goodwill, VODA and VOCRA, all net of income tax.
Adjusted return on allocated tangible equity: adjusted earnings available to common shareholders, excluding amortization of VODA and VOCRA, net of income tax, divided by allocated tangible equity.
The above measures are, when considered in conjunction with regulatory capital ratios, a measure of capital adequacy.
Expense ratio, direct expense ratio, adjusted expense ratio and related measures
Expense ratio: other expenses, net of capitalization of DAC, divided by premiums, fees and other revenues.
Direct expense ratio: adjusted direct expenses, divided by adjusted premiums, fees and other revenues.
Direct expense ratio, excluding total notable items related to direct expenses and PRT: adjusted direct expenses, excluding total notable items related to direct expenses, divided by adjusted premiums, fees and other revenues, excluding PRT.
Adjusted expense ratio: adjusted other expenses, net of adjusted capitalization of DAC, divided by adjusted premiums, fees and other revenues.
Adjusted expense ratio, excluding total notable items related to adjusted other expenses and PRT: adjusted other expenses, net of adjusted capitalization of DAC, excluding total notable items related to adjusted other expenses, divided by adjusted premiums, fees and other revenues, excluding PRT.
Asia General account (GA) assets under management (GA AUM) and related measures
Asia GA AUM is used by MetLife to describe assets in its Asia GA investment portfolio which are actively managed and stated at estimated fair value. Asia GA AUM is comprised of Asia GA total investments and cash and cash equivalents, excluding policy loans, contractholder-directed equity securities, fair value option securities and certain other invested assets, as substantially all of these assets are not actively managed in MetLife’s Asia GA investment portfolio. Mortgage loans (including commercial, agricultural and residential) and real estate and real estate joint ventures included in
Page 15 of 28


Asia GA AUM (at net asset value, net of deduction for encumbering debt) have been adjusted from carrying value to estimated fair value. At the segment level, intersegment balances (intercompany activity, primarily related to investments in subsidiaries, that eliminate at the MetLife consolidated level) are excluded from Asia GA AUM.
Asia GA AUM (at amortized cost) excludes the following adjustments: (i) unrealized gain (loss) on investments carried at estimated fair value and (ii) adjustments from carrying value to estimated fair value on mortgage loans (including commercial, agricultural and residential) and real estate and real estate joint ventures. Asia GA AUM (at amortized cost) is presented net of related allowance for credit loss.
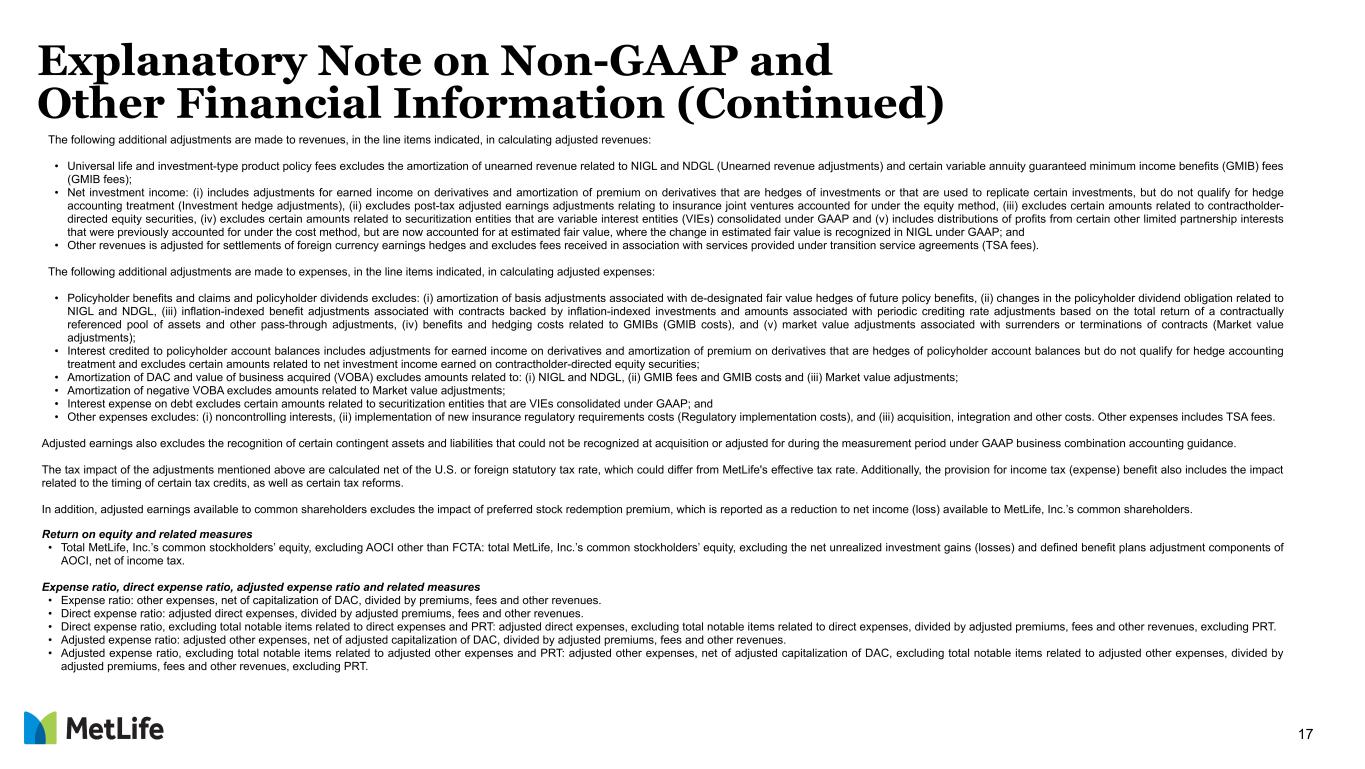
Statistical sales information:
U.S.:
Group Benefits: calculated using 10% of single premium deposits and 100% of annualized full-year premiums and fees from recurring premium policy sales of all products.
Retirement and Income Solutions: calculated using 10% of single premium deposits and 100% of annualized full-year premiums and fees only from recurring premium policy sales of specialized benefit resources and corporate-owned life insurance.
Latin America, Asia and EMEA: calculated using 10% of single-premium deposits (mainly from retirement products such as variable annuity, fixed annuity and pensions), 20% of single-premium deposits from credit insurance and 100% of annualized full-year premiums and fees from recurring-premium policy sales of all products (mainly from risk and protection products such as individual life, accident & health and group).

Sales statistics do not correspond to revenues under GAAP, but are used as relevant measures of business activity.
The following additional information is relevant to an understanding of MetLife’s performance results and outlook:
Volume growth, as discussed in the context of business growth, is the period over period percentage change in adjusted earnings available to common shareholders attributable to adjusted premiums, fees and other revenues and assets under management levels, applying a model in which certain margins and factors are held constant. The most significant of such items are underwriting margins, investment margins, changes in equity market performance, expense margins and the impact of changes in foreign currency exchange rates.
Holding company cash and liquid assets are held by MetLife, Inc. collectively with other MetLife holding companies and include cash and cash equivalents, short term investments and publicly traded securities excluding assets that are pledged or otherwise committed. Assets pledged or otherwise committed include amounts received in connection with securities lending, repurchase agreements, derivatives, regulatory deposits, the collateral financing arrangement, funding agreements and secured borrowings, as well as amounts held in the closed block.
MetLife uses a measure of free cash flow to facilitate an understanding of its ability to generate cash for reinvestment into its businesses or use in non-mandatory capital actions. MetLife defines free cash flow as the sum of cash available at MetLife’s holding companies from dividends from operating subsidiaries, expenses and other net flows of the holding companies (including capital contributions to subsidiaries), and net contributions from debt to be at or below target leverage ratios. This measure of free cash flow is prior to capital actions, such as common stock dividends and repurchases, debt reduction and mergers and acquisitions. Free cash flow should not be viewed as a substitute for net cash provided by (used in) operating activities calculated in accordance with GAAP. The free cash flow ratio is typically expressed as a percentage of annual adjusted earnings available to common shareholders.
Notable items reflect the unexpected impact of events that affect MetLife’s results, but that were unknown and that MetLife could not anticipate when it devised its business plan. Notable items also include certain items regardless of the extent anticipated in the business plan, to help investors have a better understanding of MetLife's results and to evaluate and forecast those results. Notable items
Page 16 of 28


represent a positive (negative) impact to adjusted earnings available to common shareholders.
We refer to observable forward yield curves as of a particular date in connection with making our estimates for future results. The observable forward yield curves at a given time are based on implied future interest rates along a range of interest rate durations. This includes the 10-year U.S. Treasury rate which we use as a benchmark rate to describe longer-term interest rates used in our estimates for future results.
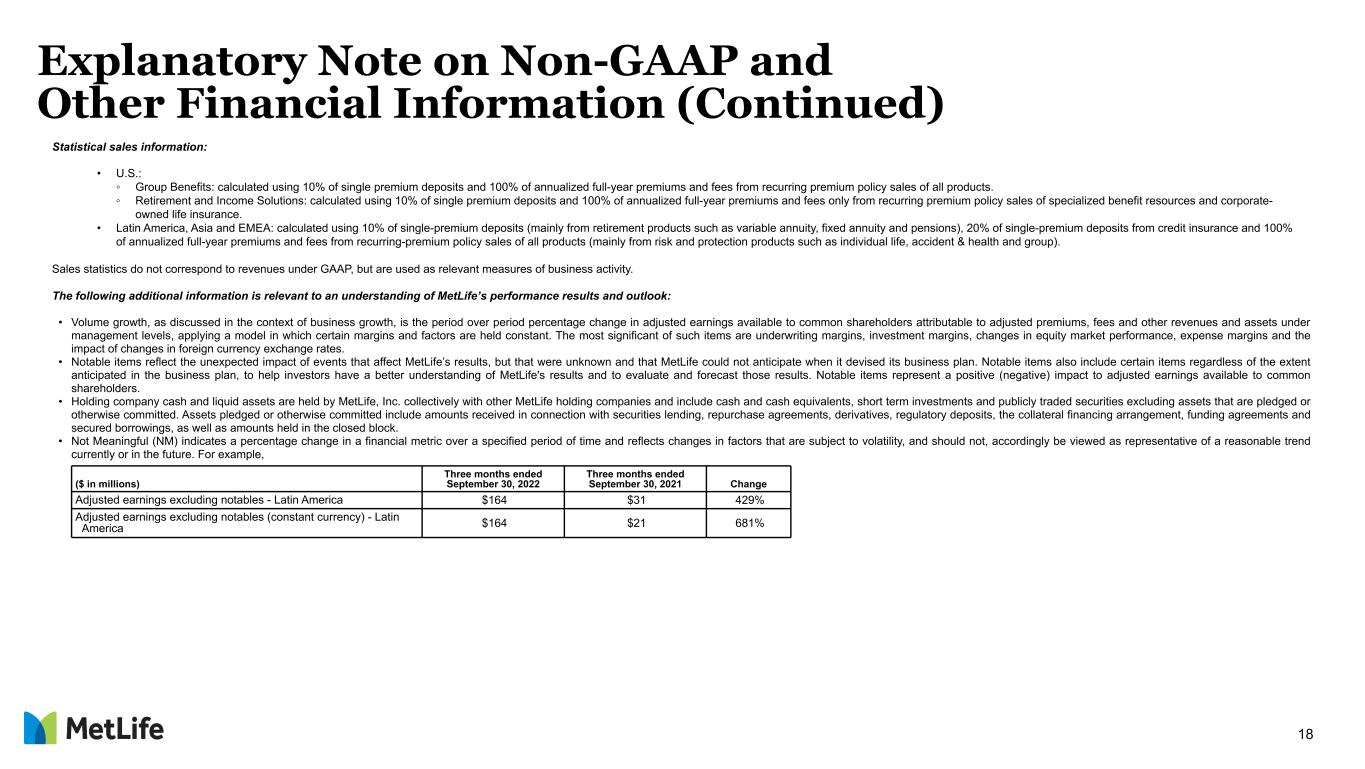
Not Meaningful (NM) indicates a percentage change in a financial metric over a specified period of time and reflects changes in factors that are subject to volatility, and should not, accordingly be viewed as representative of a reasonable trend currently or in the future. For example,
($ in millions)Three months ended September 30, 2022Three months ended September 30, 2021Change
Adjusted premiums, fees and other revenues - Retirement and Income Solutions$9,259$891939%
Adjusted earnings - Latin America$171$29490%
Adjusted earnings (constant currency) -Latin America$171$19800%
Adjusted earnings excluding notables - Latin America$164$31429%
Adjusted earnings excluding notables (constant currency) -Latin America$164$21681%


Forward-Looking Statements
This news release may contain or incorporate by reference information that includes or is based upon forward-looking statements within the meaning of the Private Securities Litigation Reform Act of 1995. Forward-looking statements give expectations or forecasts of future events and do not relate strictly to historical or current facts. They use words and terms such as “anticipate,” “assume,” “believe,” “continue,” “could,” “estimate,” “expect,” “if,” “intend,” “likely,” “may,” “plan,” “potential,” “project,” “should,” “will,” “would,” and other words and terms of similar meaning or that are otherwise tied to future periods or future performance, in each case in all derivative forms. They include statements relating to future actions, prospective services or products, future performance or results of current and anticipated services or products, future sales efforts, future expenses, the outcome of contingencies such as legal proceedings, and future trends in operations and financial results.

Many factors determine the results of MetLife, Inc., its subsidiaries and affiliates, and they involve unpredictable risks and uncertainties. Our forward-looking statements depend on our assumptions, our expectations, and our understanding of the economic environment, but they may be inaccurate and may change. MetLife, Inc. does not guarantee any future performance. Our results could differ materially from those MetLife, Inc. expresses or implies in forward-looking statements. The risks, uncertainties and other factors, including those relating to the COVID-19 pandemic, identified in MetLife, Inc.’s filings with the U.S. Securities and Exchange Commission, and others, may cause such differences. These factors include:

(1)economic condition difficulties, including risks relating to public health, interest rates, credit spreads, equity, real estate, obligors and counterparties, currency exchange rates, derivatives, and terrorism and security;
(2)global capital and credit market adversity;
(3)credit facility inaccessibility;
(4)financial strength or credit ratings downgrades;
(5)unavailability, unaffordability, or inadequate reinsurance;
(6)statutory life insurance reserve financing costs or limited market capacity;
(7)legal, regulatory, and supervisory and enforcement policy changes;
Page 17 of 28


(8)changes in tax rates, tax laws or interpretations;
(9)litigation and regulatory investigations;
(10)London Interbank Offered Rate discontinuation and transition to alternative reference rates;
(11)unsuccessful efforts to meet all environmental, social, and governance standards or to enhance our sustainability;
(12)MetLife, Inc.’s inability to pay dividends and repurchase common stock;
(13)MetLife, Inc.’s subsidiaries’ inability to pay it dividends;
(14)investment defaults, downgrades, or volatility;
(15)investment sales or lending difficulties;
(16)collateral or derivative-related payments;
(17)investment valuations, allowances, or impairments changes;
(18)claims or other results that differ from our estimates, assumptions, or models;
(19)global political, legal, or operational risks;
(20)business competition;
(21)technological changes;
(22)catastrophes;
(23)climate changes or responses to it;
(24)deficiencies in our closed block;
(25)goodwill or other asset impairment, or deferred income tax asset allowance;
(26)acceleration of amortization of DAC, deferred sales inducements, VOBA, VODA or VOCRA;
(27)product guarantee volatility, costs, and counterparty risks;
(28)risk management failures;
(29)insufficient protection from operational risks;
(30)failure to protect confidentiality and integrity of data or other cybersecurity or disaster recovery failures;
(31)accounting standards changes;
(32)excessive risk-taking;
(33)marketing and distribution difficulties;
(34)pension and other postretirement benefit assumption changes;
(35)inability to protect our intellectual property or avoid infringement claims;
(36)acquisition, integration, growth, disposition, or reorganization difficulties;
(37)Brighthouse Financial, Inc. separation risks;
(38)MetLife, Inc.’s Board of Directors influence over the outcome of stockholder votes through the voting provisions of the MetLife Policyholder Trust; and
(39)legal- and corporate governance-related effects on business combinations.

MetLife, Inc. does not undertake any obligation to publicly correct or update any forward-looking statement if MetLife, Inc. later becomes aware that such statement is not likely to be achieved. Please consult any further disclosures MetLife, Inc. makes on related subjects in subsequent reports to the U.S. Securities and Exchange Commission.

Page 18 of 28


MetLife, Inc.
GAAP Interim Condensed Consolidated Statements of Operations
(Unaudited)
(In millions)
For the Three Months Ended
September 30,
20222021
Revenues
Premiums$17,547 $9,455 
Universal life and investment-type product policy fees1,302 1,521 
Net investment income3,585 5,568 
Other revenues730 663 
Net investment gains (losses)(414)(84)
Net derivative gains (losses)(480)(218)
Total revenues22,270 16,905 
Expenses
Policyholder benefits and claims17,993 10,103 
Interest credited to policyholder account balances980 1,287 
Policyholder dividends155 189 
Capitalization of DAC(615)(635)
Amortization of DAC and VOBA218 816 
Amortization of negative VOBA(12)(6)
Interest expense on debt239 240 
Other expenses2,893 2,869 
Total expenses21,851 14,863 
Income (loss) before provision for income tax419 2,042 
Provision for income tax expense (benefit)19 453 
Net income (loss)400 1,589 
Less: Net income (loss) attributable to noncontrolling interests
Net income (loss) attributable to MetLife, Inc.395 1,584 
Less: Preferred stock dividends64 63 
         Preferred stock redemption premium— — 
Net income (loss) available to MetLife, Inc.'s common shareholders$331 $1,521 
See footnotes on last page.
Page 19 of 28


MetLife, Inc.
(Unaudited)
(In millions, except per share data)
For the Three Months Ended
September 30,
20222021
Reconciliation to Adjusted Earnings Available to Common ShareholdersEarnings Per
Weighted Average
Common Share Diluted (1)
Earnings Per
Weighted Average
Common Share Diluted (1)
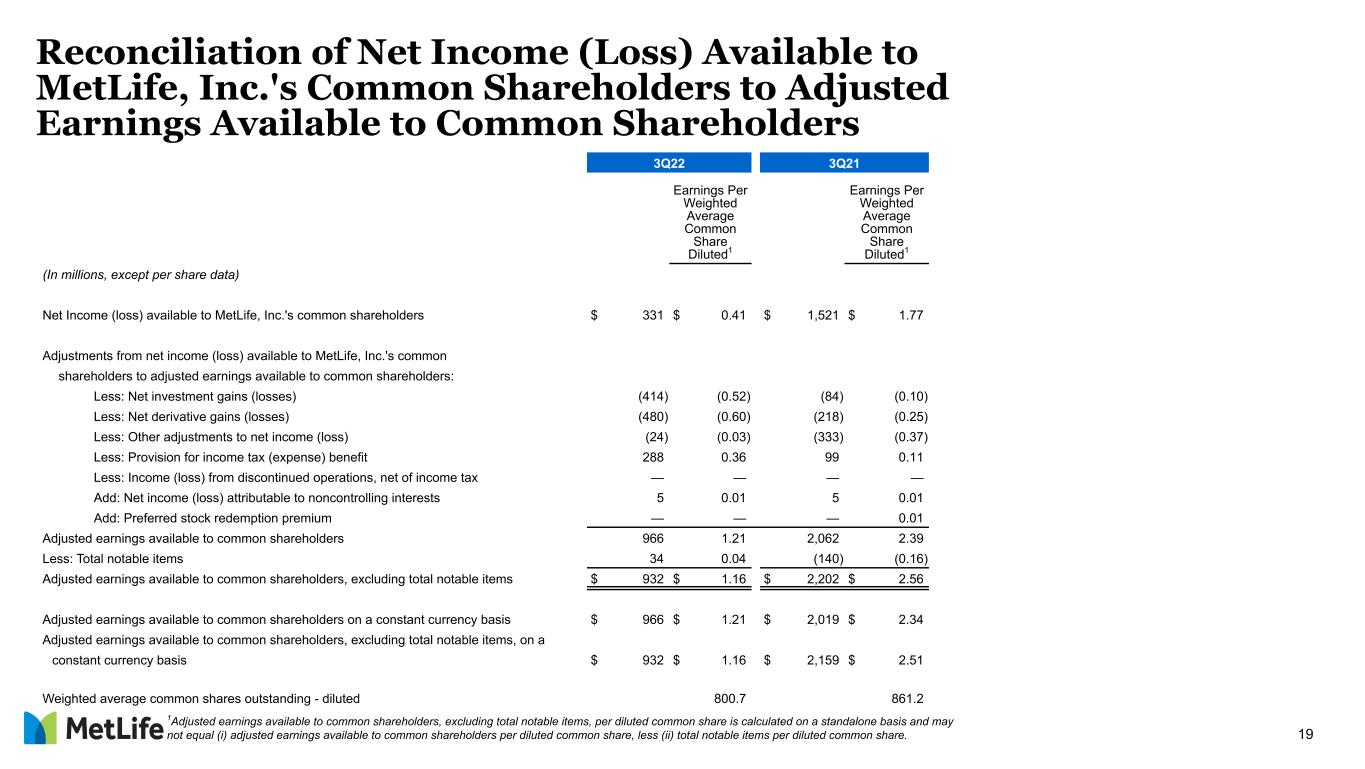
Net income (loss) available to MetLife, Inc.'s common shareholders$331 $0.41 $1,521 $1.77 
Adjustments from net income (loss) available to common shareholders to adjusted earnings available to common shareholders:
Less: Net investment gains (losses)(414)(0.52)(84)(0.10)
Net derivative gains (losses)(480)(0.60)(218)(0.25)
Premiums— — 57 0.07 
Universal life and investment-type product policy fees12 0.01 84 0.10 
Net investment income(578)(0.72)(100)(0.12)
Other revenues40 0.05 79 0.09 
Policyholder benefits and claims and policyholder dividends143 0.18 (181)(0.20)
Interest credited to policyholder account balances302 0.38 (120)(0.14)
Capitalization of DAC— — 15 0.02 
Amortization of DAC and VOBA117 0.15 (58)(0.07)
Amortization of negative VOBA— — — — 
Interest expense on debt— — — — 
Other expenses(60)(0.08)(109)(0.12)
Goodwill impairment— — — — 
Provision for income tax (expense) benefit288 0.36 99 0.11 
Add: Net income (loss) attributable to noncontrolling interests0.01 0.01 
  Preferred stock redemption premium— — — — 
Adjusted earnings available to common shareholders966 1.21 2,062 2.39 
Less: Total notable items (2)34 0.04 (140)(0.16)
Adjusted earnings available to common shareholders, excluding total notable items (2)$932 $1.16 $2,202 $2.56 
Adjusted earnings available to common shareholders on a constant currency basis$966 $1.21 $2,019 $2.34 
Adjusted earnings available to common shareholders, excluding total notable items, on a constant currency basis (2)$932 $1.16 $2,159 $2.51 
Weighted average common shares outstanding - diluted800.7 861.2 
See footnotes on last page.
Page 20 of 28


MetLife, Inc.
(Unaudited)
(In millions)
 For the Three Months Ended
September 30,
20222021
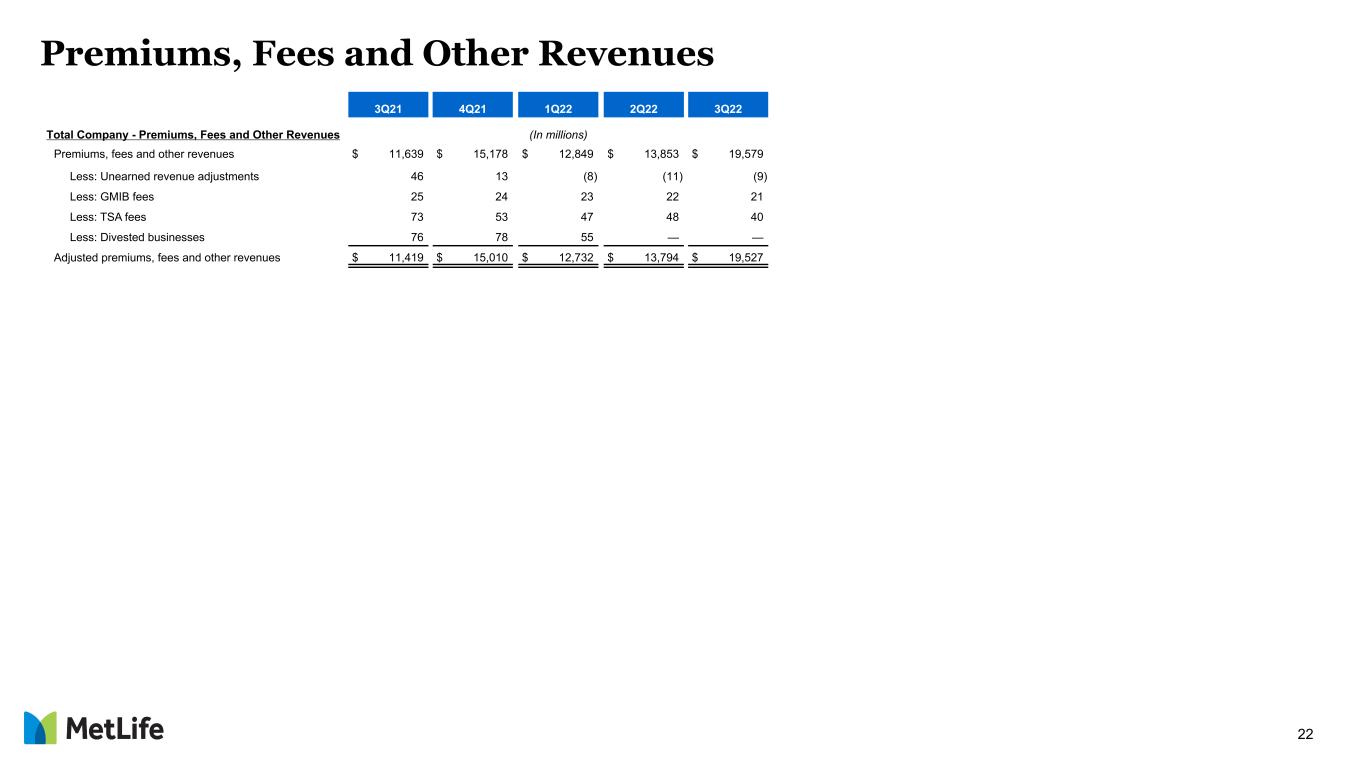
Premiums, Fees and Other Revenues
Premiums, fees and other revenues$19,579 $11,639 
Less: Unearned revenue adjustments(9)46 
GMIB fees21 25 
Settlement of foreign currency earnings hedges— — 
TSA fees40 73 
Divested businesses— 76 
Adjusted premiums, fees and other revenues$19,527 $11,419 
Adjusted premiums, fees and other revenues, on a constant currency basis$19,527 $10,948 
Less: PRT (3)8,466 (24)
Adjusted premiums, fees and other revenues, excluding PRT, on a constant currency basis$11,061 $10,972 
Net Investment Income
Net investment income$3,585 $5,568 
Less: Investment hedge adjustments(252)(228)
Operating joint venture adjustments(5)(1)
Unit-linked contract income(321)114 
Securitization entities income— — 
Certain partnership distributions— (1)
Divested businesses— 16 
Adjusted net investment income$4,163 $5,668 
Revenues and Expenses
Total revenues$22,270 $16,905 
Less: Net investment gains (losses)(414)(84)
Less: Net derivative gains (losses)(480)(218)
Less: Adjustments related to net investment gains (losses) and net derivative gains (losses)(9)46 
Less: Other adjustments to revenues:
GMIB fees21 25 
Investment hedge adjustments(252)(228)
Operating joint venture adjustments(5)(1)
Unit-linked contract income(321)114 
Securitization entities income— — 
Certain partnership distributions— (1)
Settlement of foreign currency earnings hedges— — 
TSA fees40 73 
Divested businesses— 92 
Total adjusted revenues$23,690 $17,087 
Total expenses$21,851 $14,863 
Less: Adjustments related to net investment gains (losses) and net derivative gains (losses)(98)31 
Less: Goodwill impairment— — 
Less: Other adjustments to expenses:
PBC hedge adjustments
Inflation and pass-through adjustments88 — 
GMIB costs and amortization of DAC and VOBA related to GMIB fees and GMIB costs(190)129 
Market value adjustments and amortization of DAC, VOBA and negative VOBA related to market value adjustments(66)21 
PAB hedge adjustments— (1)
Unit-linked contract costs(302)116 
Securitization entities debt expense— — 
Noncontrolling interest(8)(7)
Regulatory implementation costs— 
Acquisition, integration and other costs14 
TSA fees40 73 
Divested businesses13 81 
Total adjusted expenses$22,353 $14,410 
See footnotes on last page.
Page 21 of 28


MetLife, Inc.
(Unaudited)
(In millions, except per share and ratio data)
For the Three Months Ended
September 30,
20222021
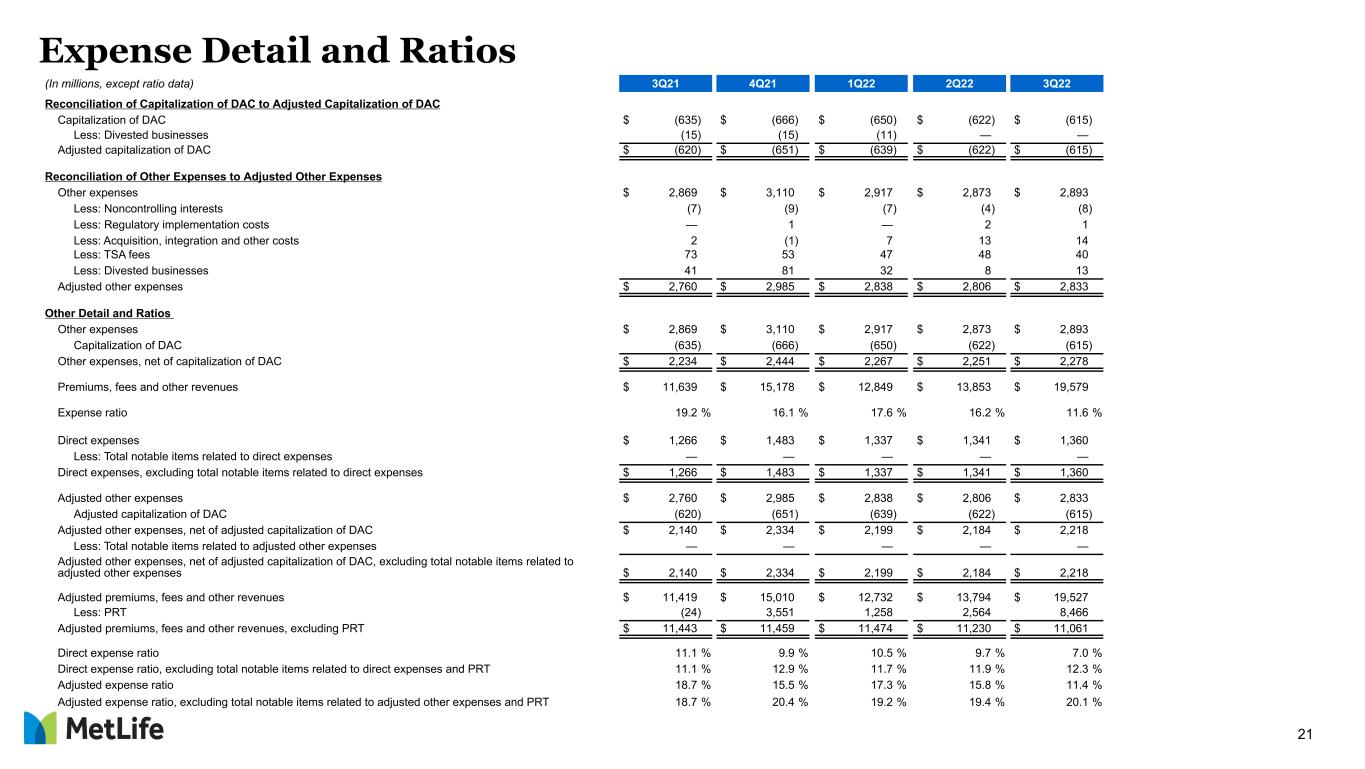
Expense Detail and Ratios
Reconciliation of Capitalization of DAC to Adjusted Capitalization of DAC
Capitalization of DAC $(615)$(635)
Less: Divested businesses— (15)
Adjusted capitalization of DAC$(615)$(620)
Reconciliation of Other Expenses to Adjusted Other Expenses
Other expenses $2,893 $2,869 
Less: Noncontrolling interests(8)(7)
Less: Regulatory implementation costs— 
Less: Acquisition, integration and other costs14 
Less: TSA fees40 73 
Less: Divested businesses13 41 
Adjusted other expenses$2,833 $2,760 
Other Detail and Ratios
Other expenses$2,893 $2,869 
Capitalization of DAC(615)(635)
Other expenses, net of capitalization of DAC$2,278 $2,234 
Premiums, fees and other revenues$19,579 $11,639 
Expense ratio11.6 %19.2 %
Direct expenses$1,360 $1,266 
Less: Total notable items related to direct expenses (2)— — 
Direct expenses, excluding total notable items related to direct expenses (2)$1,360 $1,266 
Adjusted other expenses$2,833 $2,760 
Adjusted capitalization of DAC(615)(620)
Adjusted other expenses, net of adjusted capitalization of DAC2,218 2,140 
Less: Total notable items related to adjusted other expenses (2)— — 
Adjusted other expenses, net of adjusted capitalization of DAC, excluding total notable items related to adjusted other expenses (2)$2,218 $2,140 
Adjusted premiums, fees and other revenues$19,527 $11,419 
Less: PRT8,466 (24)
Adjusted premiums, fees and other revenues, excluding PRT$11,061 $11,443 
Direct expense ratio 7.0 %11.1 %
Direct expense ratio, excluding total notable items related to direct expenses and PRT (2)12.3 %11.1 %
Adjusted expense ratio11.4 %18.7 %
Adjusted expense ratio, excluding total notable items related to adjusted other expenses and PRT (2)20.1 %18.7 %
See footnotes on last page.
Page 22 of 28


MetLife, Inc.
(Unaudited)
(In millions, except per share data)
September 30,
Equity Details20222021
Total MetLife, Inc.'s stockholders' equity$25,076 $69,050 
Less: Preferred stock3,818 3,818 
MetLife, Inc.'s common stockholders' equity 21,258 65,232 
Less: Net unrealized investment gains (losses), net of income tax(20,008)18,658 
  Defined benefit plans adjustment, net of income tax(1,536)(1,805)
Total MetLife, Inc.'s common stockholders' equity, excluding AOCI other than FCTA42,802 48,379 
Less: Goodwill, net of income tax8,683 9,317 
  VODA and VOCRA, net of income tax663 763 
Total MetLife, Inc.'s tangible common stockholders' equity$33,456 $38,299 
September 30,
20222021
Total MetLife, Inc.'s common stockholders' equity, excluding AOCI other than FCTA$42,802 $48,379 
Less: Accumulated year-to-date total notable items (2)111 (74)
Total MetLife, Inc.'s common stockholders' equity, excluding total notable items (excludes AOCI other than FCTA) (2)42,691 48,453 
Less: Goodwill, net of income tax8,683 9,317 
  VODA and VOCRA, net of income tax663 763 
Total MetLife, Inc.'s tangible common stockholders' equity, excluding total notable items (2)$33,345 $38,373 
September 30,
Book Value (4)20222021
Book value per common share$27.00 $77.24 
Less: Net unrealized investment gains (losses), net of income tax(25.42)22.09 
   Defined benefit plans adjustment, net of income tax(1.95)(2.14)
Book value per common share, excluding AOCI other than FCTA54.37 57.29 
Less: Goodwill, net of income tax11.04 11.04 
   VODA and VOCRA, net of income tax0.84 0.90 
Book value per common share - tangible common stockholders' equity$42.49 $45.35 
Common shares outstanding, end of period (5)787.3 844.5 
For the Three Months Ended
September 30,
Average Common Stockholders' Equity 20222021
Average common stockholders' equity$27,271 $65,276 
Average common stockholders' equity, excluding AOCI other than FCTA$43,549 $48,464 
Average common stockholders' equity, excluding total notable items (excludes AOCI other than FCTA) (2)$43,455 $48,468 
Average tangible common stockholders' equity$34,122 $38,335 
Average tangible common stockholders' equity, excluding total notable items (2)$34,028 $38,339 
See footnotes on last page.
Page 23 of 28


MetLife, Inc.
(Unaudited)
For the Three Months Ended
September 30, (6)
20222021
Return on Equity
Return on MetLife, Inc.'s:
Common stockholders' equity4.9 %9.3 %
Adjusted return on MetLife, Inc.'s:
Common stockholders' equity14.2 %12.6 %
Common stockholders' equity, excluding AOCI other than FCTA8.9 %17.0 %
Common stockholders' equity, excluding total notable items (excludes AOCI other than FCTA) (2)8.6 %18.2 %
Tangible common stockholders' equity (7)11.5 %21.7 %
Tangible common stockholders' equity, excluding total notable items (2), (7)11.2 %23.2 %
Adjusted Return on Allocated Equity:
U.S.26.1 %38.4 %
Asia5.5 %15.5 %
Latin America25.1 %4.2 %
EMEA10.7 %13.2 %
MetLife Holdings2.1 %23.2 %
Adjusted Return on Allocated Tangible Equity:
U.S.35.0 %44.8 %
Asia8.2 %23.2 %
Latin America39.1 %6.6 %
EMEA15.8 %22.8 %
MetLife Holdings2.4 %25.4 %
See footnotes on last page.

Page 24 of 28


MetLife, Inc.
Adjusted Earnings Available to Common Shareholders
(Unaudited)
(In millions)
For the Three Months Ended
September 30,
20222021
U.S. (3):
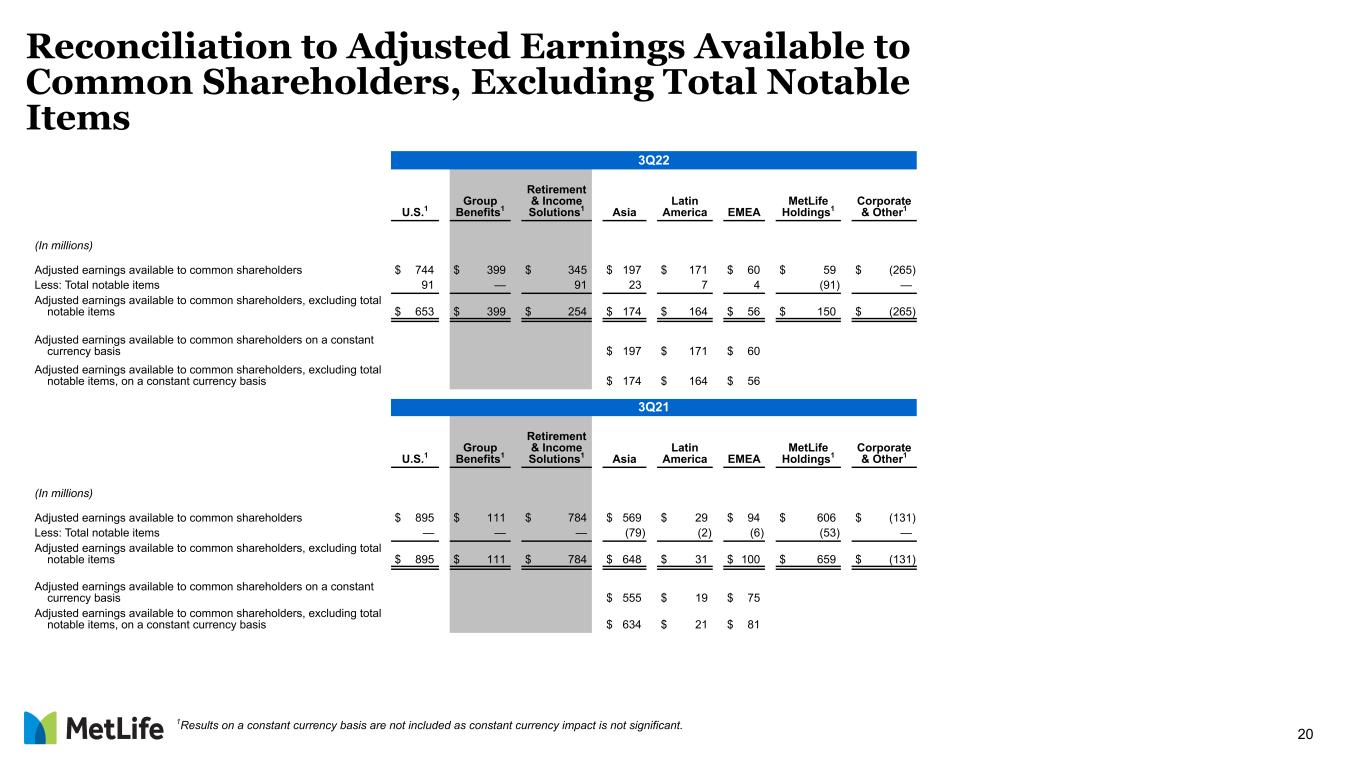
Adjusted earnings available to common shareholders$744 $895 
Less: Total notable items (2)91 — 
Adjusted earnings available to common shareholders, excluding total notable items (2)$653 $895 
Adjusted premiums, fees and other revenues$14,966 $6,408 
Less: PRT8,466 (24)
Adjusted premiums, fees and other revenues, excluding PRT$6,500 $6,432 
Group Benefits (3):
Adjusted earnings available to common shareholders$399 $111 
Less: Total notable items (2)— — 
Adjusted earnings available to common shareholders, excluding total notable items (2)$399 $111 
Adjusted premiums, fees and other revenues$5,707 $5,517 
Retirement & Income Solutions (3):
Adjusted earnings available to common shareholders$345 $784 
Less: Total notable items (2)91 — 
Adjusted earnings available to common shareholders, excluding total notable items (2)$254 $784 
Adjusted premiums, fees and other revenues$9,259 $891 
Less: PRT8,466 (24)
Adjusted premiums, fees and other revenues, excluding PRT$793 $915 
See footnotes on last page.
Page 25 of 28


MetLife, Inc.
Adjusted Earnings Available to Common Shareholders (Continued)
(Unaudited)
(In millions)
For the Three Months Ended
September 30,
20222021
Asia:
Adjusted earnings available to common shareholders$197 $569 
Less: Total notable items (2)23 (79)
Adjusted earnings available to common shareholders, excluding total notable items (2)$174 $648 
Adjusted earnings available to common shareholders on a constant currency basis $197 $555 
Adjusted earnings available to common shareholders, excluding total notable items, on a constant currency basis (2)$174 $634 
Adjusted premiums, fees and other revenues$1,789 $2,088 
Adjusted premiums, fees and other revenues, on a constant currency basis $1,789 $1,762 
Latin America:
Adjusted earnings available to common shareholders$171 $29 
Less: Total notable items (2)(2)
Adjusted earnings available to common shareholders, excluding total notable items (2)$164 $31 
Adjusted earnings available to common shareholders on a constant currency basis $171 $19 
Adjusted earnings available to common shareholders, excluding total notable items, on a constant currency basis (2)$164 $21 
Adjusted premiums, fees and other revenues$1,123 $988 
Adjusted premiums, fees and other revenues, on a constant currency basis $1,123 $930 
EMEA:
Adjusted earnings available to common shareholders$60 $94 
Less: Total notable items (2)(6)
Adjusted earnings available to common shareholders, excluding total notable items (2)$56 $100 
Adjusted earnings available to common shareholders on a constant currency basis$60 $75 
Adjusted earnings available to common shareholders, excluding total notable items, on a constant currency basis (2)$56 $81 
Adjusted premiums, fees and other revenues$545 $670 
Adjusted premiums, fees and other revenues, on a constant currency basis$545 $583 
MetLife Holdings (3):
Adjusted earnings available to common shareholders$59 $606 
Less: Total notable items (2)(91)(53)
Adjusted earnings available to common shareholders, excluding total notable items (2)$150 $659 
Adjusted premiums, fees and other revenues$1,016 $1,141 
Corporate & Other (3):
Adjusted earnings available to common shareholders$(265)$(131)
Less: Total notable items (2)— — 
Adjusted earnings available to common shareholders, excluding total notable items (2)$(265)$(131)
Adjusted premiums, fees and other revenues$88 $124 
See footnotes on last page.


Page 26 of 28


MetLife, Inc.
(Unaudited)
For the Three Months Ended
September 30,
20222021
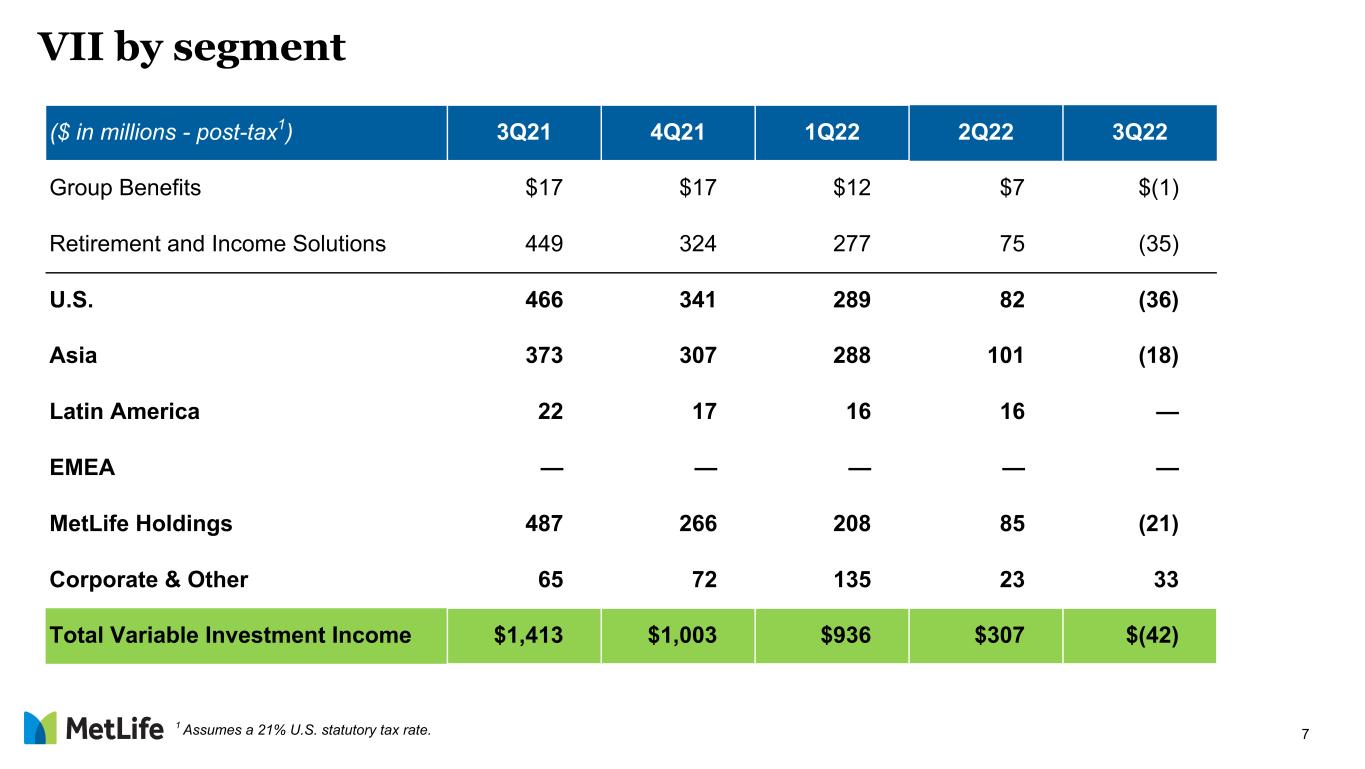
Variable investment income (post-tax, in millions) (8)
U.S.
Group Benefits$(1)$17 
Retirement and Income Solutions(35)449 
Total U.S.(36)466 
Asia(18)373 
Latin America— 22 
EMEA— — 
MetLife Holdings(21)487 
Corporate & Other33 65 
Total variable investment income$(42)1,413 

Segments: U.S., Asia, Latin America and EMEA (9)
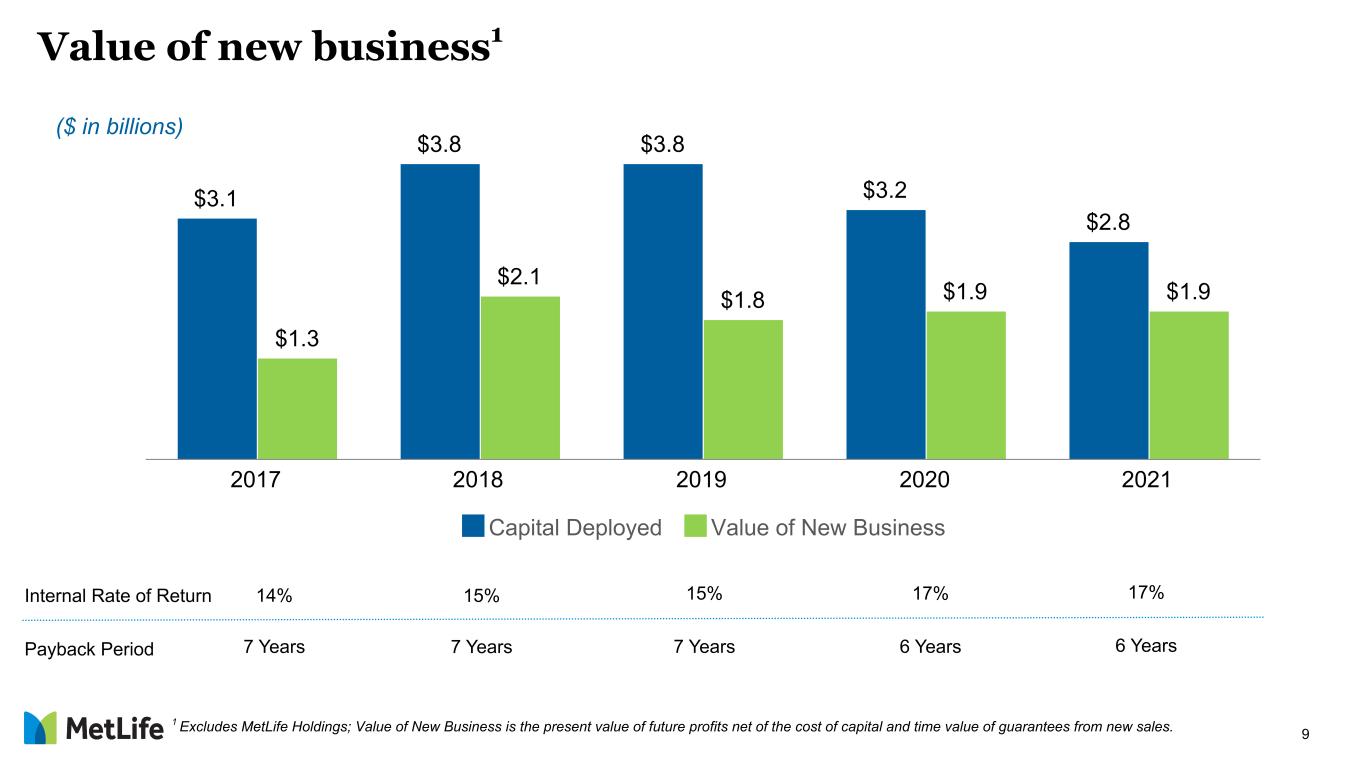
Capital DeployedValue of New BusinessInternal Rate of ReturnPayback (Years)
Value of new business ($ in billions)
2021$2.8 $1.9 17 %
2020$3.2 $1.9 17 %
2019$3.8 $1.8 15 %
2018$3.8 $2.1 15 %
2017$3.1 $1.3 14 %
See footnotes on last page.
Page 27 of 28


MetLife, Inc.
(Unaudited)
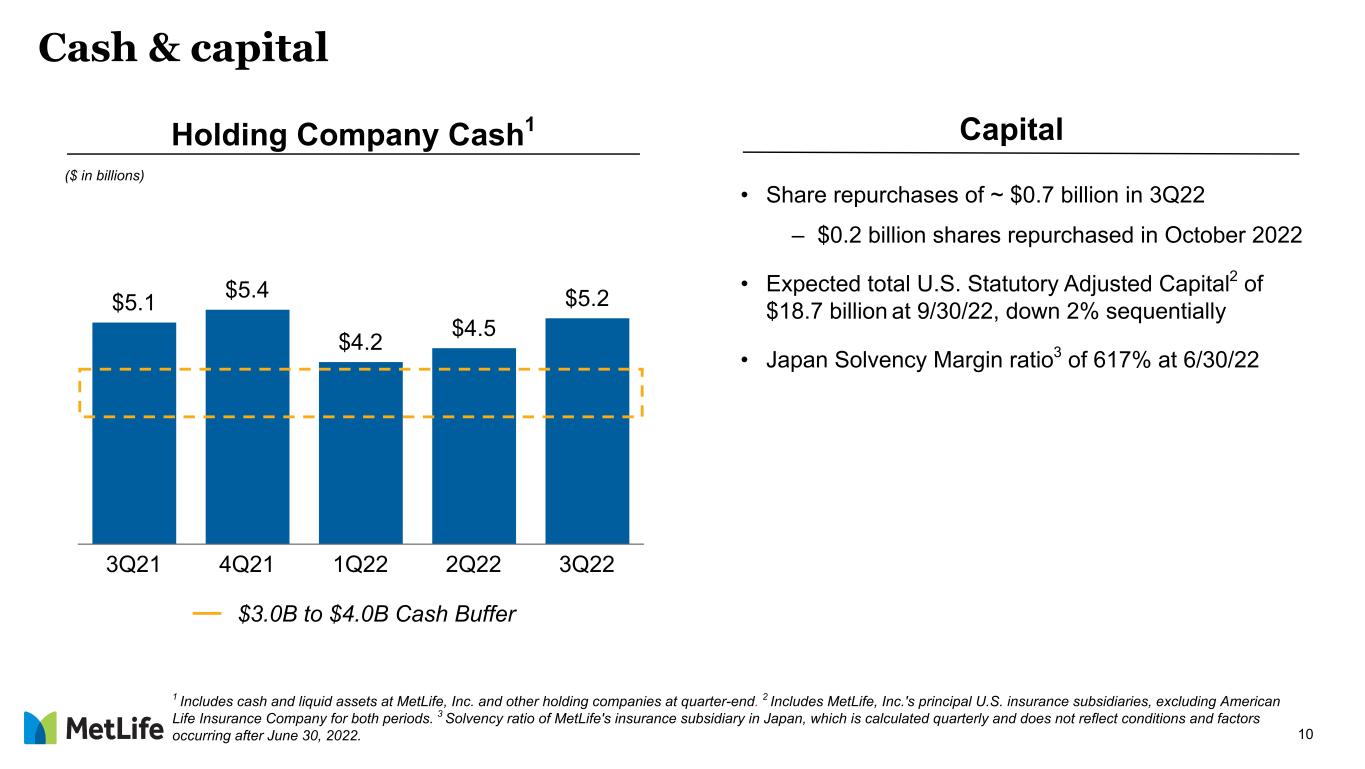
Cash & Capital (10), (11)
(In billions)
September 30,
20222021
Holding Companies Cash & Liquid Assets
$5.2 $5.1 
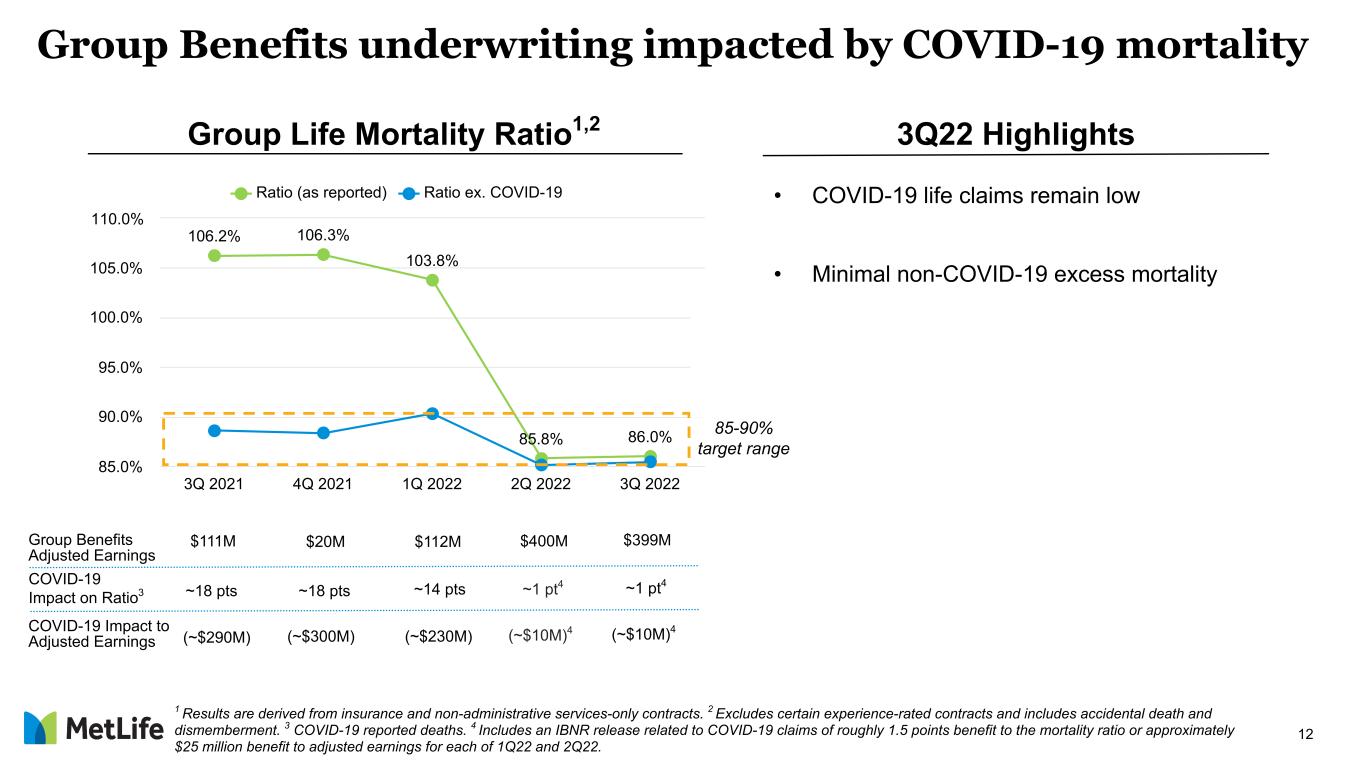
Group Benefits Underwriting (12)
For the Three Months Ended
September 30,
20222021
Group Life Mortality Ratio (13)86.0 %106.2 %
Footnotes
(1)
Adjusted earnings available to common shareholders, excluding total notable items, per diluted common share is calculated on a standalone basis and may not equal (i) adjusted earnings available to common shareholders per diluted common share, less (ii) total notable items per diluted common share.
(2)
Notable items reflect the unexpected impact of events that affect MetLife’s results, but that were unknown and that MetLife could not anticipate when it devised its business plan. Notable items also include certain items regardless of the extent anticipated in the business plan, to help investors have a better understanding of MetLife's results and to evaluate and forecast those results. Notable items can affect MetLife’s results either positively or negatively.
(3)Results on a constant currency basis are not included as constant currency impact is not significant.
(4)Book values exclude $3,818 million of equity related to preferred stock at both September 30, 2022 and 2021.
(5)There were share repurchases of $674 million for the three months ended September 30, 2022.
(6)Annualized using quarter-to-date results.
(7)Adjusted earnings available to common shareholders, used to calculate the adjusted return on tangible common stockholders' equity, excludes the impact of amortization of VODA and VOCRA, net of income tax, for the three months ended September 30, 2022 and 2021 of $17 million and $20 million, respectively.
(8)
Assumes a 21% U.S. statutory tax rate.
(9)
Excludes MetLife Holdings; Value of New Business is the present value of future profits net of the cost of capital and time value of guarantees from new sales.
(10)
The total U.S. statutory adjusted capital is expected to be approximately $18.7 billion at September 30, 2022, down 2% from June 30, 2022. This balance includes MetLife, Inc.'s principal U.S. insurance subsidiaries, excluding American Life Insurance Company for both periods.
(11)
As of June 30, 2022, the solvency margin ratio of MetLife's insurance subsidiary in Japan was 617%, which is calculated quarterly and does not reflect conditions and factors occurring after June 30, 2022.
(12)
Results are derived from insurance and non-administrative services-only contracts.
(13)
Excludes certain experience-rated contracts and includes accidental death and dismemberment. For the three months ended September 30, 2022 there was an estimated (1) percentage point impact to the ratio due to COVID-19 reported deaths with an estimated impact to adjusted earnings of approximately ($10) million, which includes a roughly 1.5 percentage point benefit to the ratio due to an incurred but not reported release related to COVID-19 life claims for the three months ended June 30, 2022, or an estimated impact to adjusted earnings of approximately $25 million.
Page 28 of 28

Table of Contents
Exhibit 99.2


 imagk06.jpg
Third Quarter
Financial Supplement
September 30, 2022
3


Table of Contents
image2a32a.jpg
METLIFE
TABLE OF CONTENTS


1

Table of Contents
image2a32a.jpg
METLIFE
As used in this QFS, “MetLife," “we” and “our” refer to MetLife, Inc., a Delaware corporation incorporated in 1999, its subsidiaries and affiliates. In this QFS, MetLife presents certain measures of its performance that are not calculated in accordance with GAAP. We believe that these non-GAAP financial measures enhance the understanding for MetLife and its investors of MetLife's performance by highlighting the results of operations and the underlying profitability drivers of our business. See Appendix for definitions of non-GAAP financial measures and other financial disclosures.
GAAP INTERIM CONDENSED CONSOLIDATED STATEMENTS OF OPERATIONS
For the Three Months EndedFor the Year-to-Date Period Ended
Unaudited (In millions)September 30, 2021December 31, 2021March 31, 2022June 30, 2022September 30, 2022September 30, 2021September 30, 2022
Revenues
Premiums$9,455 $13,095 $10,771 $11,721 $17,547 $28,914 $40,039 
Universal life and investment-type product policy fees1,521 1,422 1,418 1,516 1,302 4,334 4,236 
Net investment income5,568 5,233 4,284 3,583 3,585 16,162 11,452 
Other revenues663 661 660 616 730 1,958 2,006 
Net investment gains (losses)(84)(126)(518)(685)(414)1,655 (1,617)
Net derivative gains (losses)(218)(196)(859)(1,195)(480)(2,032)(2,534)
Total revenues16,905 20,089 15,756 15,556 22,270 50,991 53,582 
Expenses
Policyholder benefits and claims10,103 13,923 11,193 11,790 17,993 30,031 40,976 
Interest credited to policyholder account balances1,287 1,385 630 492 980 4,153 2,102 
Policyholder dividends189 204 198 193 155 672 546 
Capitalization of DAC(635)(666)(650)(622)(615)(2,052)(1,887)
Amortization of DAC and VOBA816 612 537 616 218 1,943 1,371 
Amortization of negative VOBA(6)(9)(9)(10)(12)(25)(31)
Interest expense on debt240 224 225 226 239 696 690 
Other expenses2,869 3,110 2,917 2,873 2,893 8,753 8,683 
Total expenses14,863 18,783 15,041 15,558 21,851 44,171 52,450 
Income (loss) before provision for income tax2,042 1,306 715 (2)419 6,820 1,132 
Provision for income tax expense (benefit)453 95 41 (140)19 1,456 (80)
Net income (loss) 1,589 1,211 674 138 400 5,364 1,212 
Less: Net income (loss) attributable to noncontrolling interests15 16 
Net income (loss) attributable to MetLife, Inc.1,584 1,205 669 132 395 5,349 1,196 
Less: Preferred stock dividends63 29 63 29 64 166 156 
 Preferred stock redemption premium — — — — — — 
Net income (loss) available to MetLife, Inc.'s common shareholders$1,521 $1,176 $606 $103 $331 $5,177 $1,040 
Premiums, fees and other revenues$11,639 $15,178 $12,849 $13,853 $19,579 $35,206 $46,281 
2

Table of Contents
image2a32a.jpg
METLIFE
CORPORATE OVERVIEW
For the Three Months Ended
Unaudited (In millions, except per share data)September 30, 2021December 31, 2021March 31, 2022June 30, 2022September 30, 2022
Net income (loss) available to MetLife, Inc.'s common shareholders$1,521 $1,176 $606 $103 $331 
Adjustments from net income (loss) available to MetLife, Inc.'s common shareholders to adjusted earnings available to common shareholders:
Less: Net investment gains (losses) (84)(126)(518)(685)(414)
Less: Net derivative gains (losses)(218)(196)(859)(1,195)(480)
Less: Goodwill impairment— — — — — 
Less: Other adjustments to net income (loss) (1)(333)(501)(183)(253)(24)
Less: Provision for income tax (expense) benefit 99 167 444 616 288 
Add: Net income (loss) attributable to noncontrolling interests
Add: Preferred stock redemption premium— — — — — 
Adjusted earnings available to common shareholders2,062 1,838 1,727 1,626 966 
Less: Total notable items (2)(140)140 — 77 34 
Adjusted earnings available to common shareholders, excluding total notable items (2)$2,202 $1,698 $1,727 $1,549 $932 
Net income (loss) available to MetLife, Inc.'s common shareholders per diluted common share$1.77 $1.39 $0.73 $0.13 $0.41 
Less: Net investment gains (losses)(0.10)(0.15)(0.62)(0.84)(0.52)
Less: Net derivative gains (losses)(0.25)(0.23)(1.03)(1.47)(0.60)
Less: Goodwill impairment— — — — — 
Less: Other adjustments to net income (loss)(0.37)(0.59)(0.22)(0.31)(0.03)
Less: Provision for income tax (expense) benefit0.11 0.20 0.53 0.76 0.36 
Add: Net income (loss) attributable to noncontrolling interests0.01 0.01 0.01 0.01 0.01 
Add: Preferred stock redemption premium— — — — — 
Adjusted earnings available to common shareholders per diluted common share 2.39 2.17 2.08 2.00 1.21 
Less: Total notable items per diluted common share (2)(0.16)0.17 — 0.09 0.04 
Adjusted earnings available to common shareholders, excluding total notable items, per diluted common share (2), (3)$2.56 $2.01 $2.08 $1.90 $1.16 
For the Three Months Ended
Unaudited (In millions, except per share data)September 30, 2021December 31, 2021March 31, 2022June 30, 2022September 30, 2022
Notable items impacting adjusted earnings available to common shareholders (2):
Actuarial assumption review and other insurance adjustments$(140)$— $— $77 $34 
Tax adjustments — 140 — — — 
Total notable items $(140)$140 $— $77 $34 
Notable items impacting adjusted earnings available to common shareholders per diluted common share (2):
Actuarial assumption review and other insurance adjustments$(0.16)$— $— $0.09 $0.04 
Tax adjustments— 0.17 — — — 
Total notable items $(0.16)$0.17 $— $0.09 $0.04 
For the Three Months Ended
Unaudited (In millions)September 30, 2021December 31, 2021March 31, 2022June 30, 2022September 30, 2022
Weighted average common shares outstanding - diluted861.2 845.2 830.5 814.5 800.7 
(1)See Page A-1 for further detail.
(2)These notable items represent a positive (negative) impact to adjusted earnings available to common shareholders and adjusted earnings available to common shareholders per diluted common share. The per share data for each notable item is calculated on a standalone basis and may not sum to total notable items. Notable items reflect the unexpected impact of events that affect MetLife's results, but that were unknown and that MetLife could not anticipate when it devised its business plan. Notable items also include certain items regardless of the extent anticipated in the business plan, to help investors have a better understanding of MetLife's results and to evaluate and forecast those results. See Page A-2 for further detail.
(3)Calculated on a standalone basis and may not equal (i) adjusted earnings available to common shareholders per diluted common share, less (ii) total notable items per diluted common share.

3

Table of Contents
image2a32a.jpg
METLIFE
CORPORATE OVERVIEW (CONTINUED)
UnauditedSeptember 30, 2021December 31, 2021March 31, 2022June 30, 2022September 30, 2022
Book value per common share (1) $77.24 $77.12 $61.55 $41.73 $27.00 
Book value per common share, excluding AOCI other than FCTA (1) $57.29 $57.65 $57.12 $55.54 $54.37 
Book value per common share - tangible common stockholders' equity (1) $45.35 $45.61 $45.02 $43.62 $42.49 
For the Three Months Ended
UnauditedSeptember 30, 2021December 31, 2021March 31, 2022June 30, 2022September 30, 2022
Return on MetLife, Inc.'s (2):
Common stockholders' equity 9.3 %7.3 %4.3 %1.0 %4.9 %
Adjusted return on MetLife, Inc.'s (2):
Common stockholders' equity 12.6 %11.4 %12.1 %15.6 %14.2 %
Common stockholders' equity, excluding AOCI other than FCTA 17.0 %15.3 %14.7 %14.3 %8.9 %
Common stockholders' equity, excluding total notable items (excludes AOCI other than FCTA) (3)18.2 %14.2 %14.7 %13.7 %8.6 %
Tangible common stockholders' equity21.7 %19.6 %18.8 %18.4 %11.5 %
For the Three Months Ended
Unaudited (In millions)September 30, 2021December 31, 2021March 31, 2022June 30, 2022September 30, 2022
Common shares outstanding, beginning of period861.1 844.5 825.5 814.8 797.6 
Share repurchases (16.7)(19.4)(13.6)(17.3)(10.3)
Newly issued shares0.1 0.4 2.9 0.1 — 
Common shares outstanding, end of period 844.5 825.5 814.8 797.6 787.3 
Weighted average common shares outstanding - basic854.9 838.1 823.8 809.7 795.8 
Dilutive effect of the exercise or issuance of stock-based awards 6.3 7.1 6.7 4.8 4.9 
Weighted average common shares outstanding - diluted861.2 845.2 830.5 814.5 800.7 
MetLife Policyholder Trust Shares131.1 129.3 127.8 126.2 125.1 
(1) Calculated using common shares outstanding, end of period.
(2) Annualized using quarter-to-date results. See Page A-3 for further detail.
(3)Notable items reflect the unexpected impact of events that affect MetLife’s results, but that were unknown and that MetLife could not anticipate when it devised its business plan. Notable items also include certain items regardless of the extent anticipated in the business plan, to help investors have a better understanding of MetLife's results and to evaluate and forecast those results. Notable items can affect MetLife’s results either positively or negatively. See Page A-2 for further detail.

4

Table of Contents
image2a32a.jpg
METLIFE
KEY ADJUSTED EARNINGS STATEMENT LINE ITEMS
For the Three Months EndedFor the Year-to-Date Period Ended
Unaudited (In millions)September 30, 2021December 31, 2021March 31, 2022June 30, 2022September 30, 2022September 30, 2021September 30, 2022
Total revenues$16,905 $20,089 $15,756 $15,556 $22,270 $50,991 $53,582 
Less: Net investment gains (losses)(84)(126)(518)(685)(414)1,655 (1,617)
Less: Net derivative gains (losses)(218)(196)(859)(1,195)(480)(2,032)(2,534)
Less: Adjustments related to net investment gains (losses) and net derivative gains (losses)46 13 (8)(11)(9)58 (28)
Less: Other adjustments to revenues:
GMIB fees
25 24 23 22 21 74 66 
Investment hedge adjustments
(228)(235)(215)(232)(252)(660)(699)
Operating joint venture adjustments
(1)— (6)(5)(1)(10)
Unit-linked contract income
114 253 (498)(688)(321)699 (1,507)
Securitization entities income
— — — — — — — 
Certain partnership distributions
(1)(1)— (2)— (7)(2)
Settlement of foreign currency earnings hedges
— — — — — — — 
TSA fees
73 53 47 48 40 168 135 
Divested businesses
92 93 66 — — 1,004 66 
Total adjusted revenues$17,087 $20,211 $17,724 $18,298 $23,690 $50,033 $59,712 
For the Three Months EndedFor the Year-to-Date Period Ended
Unaudited (In millions)September 30, 2021December 31, 2021March 31, 2022June 30, 2022September 30, 2022September 30, 2021September 30, 2022
Net investment income$5,568 $5,233 $4,284 $3,583 $3,585 $16,162 $11,452 
Less: Adjustments to net investment income:
Investment hedge adjustments(228)(235)(215)(232)(252)(660)(699)
Operating joint venture adjustments(1)— (6)(5)(1)(10)
Unit-linked contract income114 253 (498)(688)(321)699 (1,507)
Securitization entities income— — — — — — — 
Certain partnership distributions(1)(1)— (2)— (7)(2)
Divested businesses 16 15 11 — — 52 11 
Adjusted net investment income$5,668 $5,201 $4,992 $4,504 $4,163 $16,079 $13,659 
For the Three Months EndedFor the Year-to-Date Period Ended
Unaudited (In millions)September 30, 2021December 31, 2021March 31, 2022June 30, 2022September 30, 2022September 30, 2021September 30, 2022
Variable investment income (Included in net investment income above)$1,789 $1,269 $1,185 $389 $(53)$4,381 $1,521 
For the Three Months EndedFor the Year-to-Date Period Ended
Unaudited (In millions)September 30, 2021December 31, 2021March 31, 2022June 30, 2022September 30, 2022September 30, 2021September 30, 2022
Premiums, fees and other revenues$11,639 $15,178 $12,849 $13,853 $19,579 $35,206 $46,281 
Less: Adjustments to premiums, fees and other revenues:
Unearned revenue adjustments
46 13 (8)(11)(9)58 (28)
GMIB fees
25 24 23 22 21 74 66 
Settlement of foreign currency earnings hedges
— — — — — — — 
TSA fees
73 53 47 48 40 168 135 
Divested businesses
76 78 55 — — 952 55 
Adjusted premiums, fees and other revenues$11,419 $15,010 $12,732 $13,794 $19,527 $33,954 $46,053 
Adjusted premiums, fees and other revenues, on a constant currency basis$10,948 $14,650 $12,399 $13,620 $19,527 
5

Table of Contents
image2a32a.jpg
METLIFE
KEY ADJUSTED EARNINGS STATEMENT LINE ITEMS (CONTINUED)
For the Three Months EndedFor the Year-to-Date Period Ended
Unaudited (In millions)September 30, 2021December 31, 2021March 31, 2022June 30, 2022September 30, 2022September 30, 2021September 30, 2022
Total expenses$14,863 $18,783 $15,041 $15,558 $21,851 $44,171 $52,450 
Less: Adjustments related to net investment gains (losses) and net derivative gains (losses)31 63 (19)(98)37 (113)
Less: Goodwill impairment— — — — — — — 
Less: Other adjustments to expenses:
PBC hedge adjustment
25 19 
Inflation and pass-through adjustments
— 99 39 152 88 (96)279 
GMIB costs and amortization of DAC and VOBA related to GMIB fees and GMIB costs
129 93 (44)(109)(190)302 (343)
Market value adjustments and amortization of DAC, VOBA and negative VOBA related to market value adjustments
21 23 12 (34)(66)60 (88)
PAB hedge adjustments
(1)— — — — (2)— 
Unit-linked contract costs
116 246 (505)(695)(302)692 (1,502)
Securitization entities debt expense
— — — — — — — 
Noncontrolling interests(7)(9)(7)(4)(8)(19)(19)
Regulatory implementation costs
— — 
Acquisition, integration and other costs
(1)13 14 10 34 
TSA fees
73 53 47 48 40 168 135 
Divested businesses
81 126 55 13 909 76 
Total adjusted expenses$14,410 $18,082 $15,449 $16,167 $22,353 $42,082 $53,969 
For the Three Months EndedFor the Year-to-Date Period Ended
Unaudited (In millions)September 30, 2021December 31, 2021March 31, 2022June 30, 2022September 30, 2022September 30, 2021September 30, 2022
Capitalization of DAC $(635)$(666)$(650)$(622)$(615)$(2,052)$(1,887)
Less: Divested businesses(15)(15)(11)— — (104)(11)
Adjusted capitalization of DAC$(620)$(651)$(639)$(622)$(615)$(1,948)$(1,876)
For the Three Months EndedFor the Year-to-Date Period Ended
Unaudited (In millions)September 30, 2021December 31, 2021March 31, 2022June 30, 2022September 30, 2022September 30, 2021September 30, 2022
Other expenses $2,869 $3,110 $2,917 $2,873 $2,893 $8,753 $8,683 
Less: Noncontrolling interests
(7)(9)(7)(4)(8)(19)(19)
Less: Regulatory implementation costs
— — 
Less: Acquisition, integration and other costs
(1)13 14 10 34 
Less: TSA fees
73 53 47 48 40 168 135 
Less: Divested businesses
41 81 32 13 277 53 
Adjusted other expenses$2,760 $2,985 $2,838 $2,806 $2,833 $8,314 $8,477 
Adjusted other expenses on a constant currency basis$2,557 $2,816 $2,691 $2,733 $2,833 

6

Table of Contents
image2a32a.jpg
METLIFE
EXPENSE DETAIL AND RATIOS
For the Three Months EndedFor the Year-to-Date Period Ended
Unaudited (In millions, except ratio data)September 30, 2021December 31, 2021March 31, 2022June 30, 2022September 30, 2022September 30, 2021September 30, 2022
Other expenses$2,869 $3,110 $2,917 $2,873 $2,893 $8,753 $8,683 
Capitalization of DAC(635)(666)(650)(622)(615)(2,052)(1,887)
Other expenses, net of capitalization of DAC$2,234 $2,444 $2,267 $2,251 $2,278 $6,701 $6,796 
Premiums, fees and other revenues$11,639 $15,178 $12,849 $13,853 $19,579 $35,206 $46,281 
Expense ratio19.2 %16.1 %17.6 %16.2 %11.6 %19.0 %14.7 %
For the Three Months EndedFor the Year-to-Date Period Ended
Unaudited (In millions)September 30, 2021December 31, 2021March 31, 2022June 30, 2022September 30, 2022September 30, 2021September 30, 2022
Adjusted other expenses by major category
Direct expenses$1,266 $1,483 $1,337 $1,341 $1,360 $3,713 $4,038 
Pension, postretirement and postemployment benefit costs44 52 25 24 24 112 73 
Premium taxes, other taxes, and licenses & fees142 147 151 137 172 460 460 
Commissions and other variable expenses1,308 1,303 1,325 1,304 1,277 4,029 3,906 
Adjusted other expenses
2,760 2,985 2,838 2,806 2,833 8,314 8,477 
Adjusted capitalization of DAC(620)(651)(639)(622)(615)(1,948)(1,876)
Adjusted other expenses, net of adjusted capitalization of DAC
2,140 2,334 2,199 2,184 2,218 6,366 6,601 
Less: Total notable items related to adjusted other expenses (1)— — — — — (84)— 
Adjusted other expenses, net of adjusted capitalization of DAC, excluding total notable items related to adjusted other expenses (1)
$2,140 $2,334 $2,199 $2,184 $2,218 $6,450 $6,601 
For the Three Months EndedFor the Year-to-Date Period Ended
Unaudited (In millions, except ratio data)September 30, 2021December 31, 2021March 31, 2022June 30, 2022September 30, 2022September 30, 2021September 30, 2022
Employee related costs$789 $906 $899 $866 $875 $2,479 $2,640 
Third party staffing costs347 413 375 371 349 982 1,095 
General and administrative expenses130 164 63 104 136 252 303 
Direct expenses1,266 1,483 1,337 1,341 1,360 3,713 4,038 
Less: Total notable items related to direct expenses (1)— — — — — (84)— 
Direct expenses, excluding total notable items related to direct expenses (1)$1,266 $1,483 $1,337 $1,341 $1,360 $3,797 $4,038 
Adjusted other expenses, net of adjusted capitalization of DAC
$2,140 $2,334 $2,199 $2,184 $2,218 $6,366 $6,601 
Less: Total notable items related to adjusted other expenses (1)— — — — — (84)— 
Adjusted other expenses, net of adjusted capitalization of DAC, excluding total notable items related to adjusted other expenses (1)
$2,140 $2,334 $2,199 $2,184 $2,218 $6,450 $6,601 
Adjusted premiums, fees and other revenues$11,419 $15,010 $12,732 $13,794 $19,527 $33,954 $46,053 
Less: PRT(24)3,551 1,258 2,564 8,466 (38)12,288 
Adjusted premiums, fees and other revenues, excluding PRT$11,443 $11,459 $11,474 $11,230 $11,061 $33,992 $33,765 
Direct expense ratio 11.1 %9.9 %10.5 %9.7 %7.0 %10.9 %8.8 %
Direct expense ratio, excluding total notable items related to direct expenses and PRT (1)11.1 %12.9 %11.7 %11.9 %12.3 %11.2 %12.0 %
Adjusted expense ratio18.7 %15.5 %17.3 %15.8 %11.4 %18.7 %14.3 %
Adjusted expense ratio, excluding total notable items related to adjusted other expenses and PRT (1)18.7 %20.4 %19.2 %19.4 %20.1 %19.0 %19.5 %
(1)Notable items are related to “litigation reserves and settlement costs.” Notable items reflect the unexpected impact of events that affect MetLife’s results, but that were unknown and that MetLife could not anticipate when it devised its business plan. Notable items also include certain items regardless of the extent anticipated in the business plan, to help investors have a better understanding of MetLife's results and to evaluate and forecast those results. Notable items can affect MetLife’s results either positively or negatively. See Page A-2 for further detail.

7

Table of Contents
image2a32a.jpg
METLIFE
CONSOLIDATED BALANCE SHEETS
Unaudited (In millions)September 30, 2021December 31, 2021March 31, 2022June 30, 2022September 30, 2022
ASSETS
Investments:
Fixed maturity securities available-for-sale, at estimated fair value$341,038 $340,274 $320,079 $284,178 $270,765 
Equity securities, at estimated fair value941 1,269 988 1,085 973 
Contractholder-directed equity securities and fair value option securities, at estimated fair value 12,055 12,142 11,418 9,875 8,954 
Mortgage loans80,964 79,353 79,968 82,055 82,437 
Policy loans9,186 9,111 9,036 8,876 8,783 
Real estate and real estate joint ventures12,182 12,216 12,379 12,376 12,532 
Other limited partnership interests13,480 14,625 14,570 14,636 14,387 
Short-term investments, principally at estimated fair value7,150 7,176 3,146 3,043 5,266 
Other invested assets18,683 18,655 18,696 19,901 22,299 
Total investments495,679 494,821 470,280 436,025 426,396 
Cash and cash equivalents, principally at estimated fair value18,956 20,047 23,488 20,548 22,200 
Accrued investment income3,354 3,185 3,251 3,154 3,355 
Premiums, reinsurance and other receivables17,816 17,149 17,926 17,769 17,666 
Deferred policy acquisition costs and value of business acquired16,191 16,061 18,409 20,248 21,523 
Current income tax recoverable— 184 39 274 194 
Deferred income tax asset (1)168 189 225 616 2,700 
Goodwill9,638 9,535 9,510 9,151 9,005 
Assets held-for-sale7,462 7,238 4,582 — — 
Other assets (1)11,446 11,426 11,518 11,279 11,294 
Separate account assets180,954 179,873 165,056 143,829 135,771 
Total assets$761,664 $759,708 $724,284 $662,893 $650,104 
LIABILITIES AND EQUITY
Liabilities
Future policy benefits$197,086 $199,721 $195,789 $193,474 $199,671 
Policyholder account balances203,973 203,473 206,762 200,580 198,251 
Other policy-related balances17,735 17,751 19,553 19,284 19,491 
Policyholder dividends payable525 478 450 457 429 
Policyholder dividend obligation1,952 1,682 — — — 
Payables for collateral under securities loaned and other transactions31,382 31,920 30,481 23,819 24,890 
Short-term debt346 341 323 196 183 
Long-term debt 14,010 13,933 13,848 13,677 14,520 
Collateral financing arrangement806 766 754 741 729 
Junior subordinated debt securities3,155 3,156 3,156 3,157 3,158 
Current income tax payable103 — — — — 
Deferred income tax liability9,850 9,693 5,690 1,301 172 
Liabilities held-for-sale6,757 6,634 4,297 — — 
Other liabilities 23,697 22,538 23,888 25,011 27,509 
Separate account liabilities180,954 179,873 165,056 143,829 135,771 
Total liabilities692,331 691,959 670,047 625,526 624,774 
Equity
Preferred stock, at par value— — — — — 
Common stock, at par value12 12 12 12 12 
Additional paid-in capital33,457 33,511 33,531 33,548 33,589 
Retained earnings40,426 41,197 41,406 41,101 41,032 
Treasury stock, at cost(16,956)(18,157)(19,072)(20,188)(20,862)
Accumulated other comprehensive income (loss)12,111 10,919 (1,912)(17,372)(28,695)
Total MetLife, Inc.'s stockholders' equity69,050 67,482 53,965 37,101 25,076 
Noncontrolling interests283 267 272 266 254 
Total equity69,333 67,749 54,237 37,367 25,330 
Total liabilities and equity$761,664 $759,708 $724,284 $662,893 $650,104 
(1)Certain amounts in prior periods are reclassified to conform to current period presentation.

8

Table of Contents
image2a32a.jpg
METLIFE
SUMMARY OF ADJUSTED EARNINGS AVAILABLE TO COMMON SHAREHOLDERS 
  For the Three Months Ended
Unaudited (In millions)September 30, 2021December 31, 2021March 31, 2022June 30, 2022September 30, 2022
Adjusted earnings before provision for income tax
U.S.
GROUP BENEFITS$141 $25 $143 $507 $507 
RETIREMENT AND INCOME SOLUTIONS989 784 733 489 434 
TOTAL U.S.$1,130 $809 $876 $996 $941 
ASIA806 819 813 545 292 
LATIN AMERICA28 149 192 352 220 
EMEA116 60 68 84 79 
METLIFE HOLDINGS761 603 472 456 69 
CORPORATE & OTHER(164)(311)(146)(302)(264)
Total adjusted earnings before provision for income tax
$2,677 $2,129 $2,275 $2,131 $1,337 
Provision for income tax expense (benefit)
U.S.
GROUP BENEFITS$30 $$31 $107 $108 
RETIREMENT AND INCOME SOLUTIONS205 164 152 101 89 
TOTAL U.S.$235 $169 $183 $208 $197 
ASIA237 233 233 159 95 
LATIN AMERICA(1)24 50 85 49 
EMEA22 18 16 20 19 
METLIFE HOLDINGS155 121 95 92 10 
CORPORATE & OTHER(96)(303)(92)(88)(63)
Total provision for income tax expense (benefit)
$552 $262 $485 $476 $307 
Adjusted earnings available to common shareholders
U.S.
GROUP BENEFITS$111 $20 $112 $400 $399 
RETIREMENT AND INCOME SOLUTIONS784 620 581 388 345 
TOTAL U.S.$895 $640 $693 $788 $744 
ASIA569 586 580 386 197 
LATIN AMERICA29 125 142 267 171 
EMEA94 42 52 64 60 
METLIFE HOLDINGS606 482 377 364 59 
CORPORATE & OTHER (1)(131)(37)(117)(243)(265)
Total adjusted earnings available to common shareholders (1)$2,062 $1,838 $1,727 $1,626 $966 
(1)Includes impact of preferred stock dividends of $63 million, $29 million, $63 million, $29 million and $64 million for the three months ended September 30, 2021, December 31, 2021, March 31, 2022, June 30, 2022 and September 30, 2022, respectively.
9

Table of Contents
image2a32a.jpg
METLIFE
ADJUSTED RETURN ON ALLOCATED EQUITY AND ALLOCATED TANGIBLE EQUITY (1), (2)
 
ADJUSTED RETURN ON ALLOCATED EQUITY
  For the Three Months Ended
Unaudited September 30, 2021December 31, 2021March 31, 2022June 30, 2022September 30, 2022
U.S.
GROUP BENEFITS15.3 %2.8 %9.4 %33.7 %33.6 %
RETIREMENT AND INCOME SOLUTIONS48.9 %38.6 %34.8 %23.3 %20.7 %
TOTAL U.S.38.4 %27.5 %24.3 %27.6 %26.1 %
ASIA15.5 %16.0 %16.1 %10.7 %5.5 %
LATIN AMERICA4.2 %18.1 %20.8 %39.1 %25.1 %
EMEA13.2 %5.9 %9.2 %11.4 %10.7 %
METLIFE HOLDINGS23.2 %18.5 %13.7 %13.2 %2.1 %
ADJUSTED RETURN ON ALLOCATED TANGIBLE EQUITY (3)
  For the Three Months Ended
Unaudited September 30, 2021December 31, 2021March 31, 2022June 30, 2022September 30, 2022
U.S.
44.8 %32.2 %32.6 %37.0 %35.0 %
ASIA
23.2 %23.9 %24.1 %16.1 %8.2 %
LATIN AMERICA
6.6 %28.5 %32.5 %61.1 %39.1 %
EMEA
22.8 %10.2 %13.7 %16.9 %15.8 %
METLIFE HOLDINGS
25.4 %20.3 %15.0 %14.5 %2.4 %
(1) Annualized using quarter-to-date results.
(2) Allocated equity and allocated tangible equity are presented below:
  ALLOCATED EQUITYALLOCATED TANGIBLE EQUITY
Unaudited (In millions)2021202220212022
U.S.
GROUP BENEFITS
$2,899$4,745
RETIREMENT AND INCOME SOLUTIONS
6,4186,672
TOTAL U.S.
$9,317$11,417$8,116 $8,653 
ASIA
$14,648$14,437$9,824 $9,639 
LATIN AMERICA
$2,757$2,730$1,757 $1,748 
EMEA
$2,844$2,250$1,683 $1,543 
METLIFE HOLDINGS
$10,428$11,011$9,581 $10,125 
(3) Adjusted earnings available to common shareholders used to calculate the adjusted return on allocated tangible equity excludes the impact of amortization on VODA and VOCRA, net of income tax, as presented below:
For the Three Months Ended
Unaudited (In millions)September 30, 2021December 31, 2021March 31, 2022June 30, 2022September 30, 2022
U.S.$14$13$13$13$13
ASIA $1$1$1$1$1
LATIN AMERICA$$$$$
EMEA $2$1$1$1$1
METLIFE HOLDINGS$3$4$3$4$2

10

Table of Contents
image2a32a.jpg
U.S.
STATEMENTS OF ADJUSTED EARNINGS AVAILABLE TO COMMON SHAREHOLDERS
  For the Three Months EndedFor the Year-to-Date Period Ended
Unaudited (In millions)September 30, 2021December 31, 2021March 31, 2022June 30, 2022September 30, 2022September 30, 2021September 30, 2022
Adjusted revenues
Premiums$5,746 $9,439 $7,164 $8,254 $14,164 $16,919 $29,582 
Universal life and investment-type product policy fees279 282 297 284 286 858 867 
Net investment income2,098 1,942 1,874 1,710 1,716 6,106 5,300 
Other revenues383 379 426 405 516 1,159 1,347 
Total adjusted revenues8,506 12,042 9,761 10,653 16,682 25,042 37,096 
Adjusted expenses
Policyholder benefits and claims and policyholder dividends6,118 9,958 7,566 8,320 14,265 17,999 30,151 
Interest credited to policyholder account balances362 342 347 387 478 1,080 1,212 
Capitalization of DAC(17)(17)(23)(14)(23)(48)(60)
Amortization of DAC and VOBA26 10 14 14 15 50 43 
Amortization of negative VOBA— — — — — — — 
Interest expense on debt
Other expenses886 937 979 949 1,003 2,695 2,931 
Total adjusted expenses7,376 11,233 8,885 9,657 15,741 21,780 34,283 
Adjusted earnings before provision for income tax1,130 809 876 996 941 3,262 2,813 
Provision for income tax expense (benefit)235 169 183 208 197 681 588 
Adjusted earnings895 640 693 788 744 2,581 2,225 
Preferred stock dividends— — — — — — — 
Adjusted earnings available to common shareholders$895 $640 $693 $788 $744 $2,581 $2,225 
Adjusted premiums, fees and other revenues$6,408 $10,100 $7,887 $8,943 $14,966 $18,936 $31,796 
Less: PRT
(24)3,551 1,258 2,564 8,466 (38)12,288 
Adjusted premiums, fees and other revenues, excluding PRT$6,432 $6,549 $6,629 $6,379 $6,500 $18,974 $19,508 
11

Table of Contents
image2a32a.jpg
U.S.
GROUP BENEFITS
STATEMENTS OF ADJUSTED EARNINGS AVAILABLE TO COMMON SHAREHOLDERS
For the Three Months EndedFor the Year-to-Date Period Ended
Unaudited (In millions)September 30, 2021December 31, 2021March 31, 2022June 30, 2022September 30, 2022September 30, 2021September 30, 2022
Adjusted revenues
Premiums$5,006 $5,278 $5,433 $5,210 $5,161 $15,197 $15,804 
Universal life and investment-type product policy fees204 206 216 210 215 623 641 
Net investment income290 296 280 278 279 864 837 
Other revenues307 307 355 336 331 932 1,022 
Total adjusted revenues5,807 6,087 6,284 6,034 5,986 17,616 18,304 
Adjusted expenses
Policyholder benefits and claims and policyholder dividends4,853 5,206 5,259 4,649 4,565 14,584 14,473 
Interest credited to policyholder account balances33 32 31 32 34 95 97 
Capitalization of DAC(5)(4)(4)(6)(4)(15)(14)
Amortization of DAC and VOBA21 20 
Amortization of negative VOBA— — — — — — — 
Interest expense on debt— — — — 
Other expenses777 820 850 844 876 2,356 2,570 
Total adjusted expenses5,666 6,062 6,141 5,527 5,479 17,041 17,147 
Adjusted earnings before provision for income tax141 25 143 507 507 575 1,157 
Provision for income tax expense (benefit)30 31 107 108 123 246 
Adjusted earnings111 20 112 400 399 452 911 
Preferred stock dividends— — — — — — — 
Adjusted earnings available to common shareholders$111 $20 $112 $400 $399 $452 $911 
Adjusted premiums, fees and other revenues$5,517 $5,791 $6,004 $5,756 $5,707 $16,752 $17,467 
12

Table of Contents
image2a32a.jpg
U.S.
RETIREMENT AND INCOME SOLUTIONS
STATEMENTS OF ADJUSTED EARNINGS AVAILABLE TO COMMON SHAREHOLDERS
For the Three Months EndedFor the Year-to-Date Period Ended
Unaudited (In millions)September 30, 2021December 31, 2021March 31, 2022June 30, 2022September 30, 2022September 30, 2021September 30, 2022
Adjusted revenues
Premiums$740 $4,161 $1,731 $3,044 $9,003 $1,722 $13,778 
Universal life and investment-type product policy fees75 76 81 74 71 235 226 
Net investment income1,808 1,646 1,594 1,432 1,437 5,242 4,463 
Other revenues76 72 71 69 185 227 325 
Total adjusted revenues2,699 5,955 3,477 4,619 10,696 7,426 18,792 
Adjusted expenses
Policyholder benefits and claims and policyholder dividends1,265 4,752 2,307 3,671 9,700 3,415 15,678 
Interest credited to policyholder account balances329 310 316 355 444 985 1,115 
Capitalization of DAC(12)(13)(19)(8)(19)(33)(46)
Amortization of DAC and VOBA18 29 23 
Amortization of negative VOBA— — — — — — — 
Interest expense on debt
Other expenses109 117 129 105 127 339 361 
Total adjusted expenses1,710 5,171 2,744 4,130 10,262 4,739 17,136 
Adjusted earnings before provision for income tax989 784 733 489 434 2,687 1,656 
Provision for income tax expense (benefit)205 164 152 101 89 558 342 
Adjusted earnings784 620 581 388 345 2,129 1,314 
Preferred stock dividends— — — — — — — 
Adjusted earnings available to common shareholders$784 $620 $581 $388 $345 $2,129 $1,314 
Adjusted premiums, fees and other revenues$891 $4,309 $1,883 $3,187 $9,259 $2,184 $14,329 
Less: PRT
(24)3,551 1,258 2,564 8,466 (38)12,288 
Adjusted premiums, fees and other revenues, excluding PRT$915 $758 $625 $623 $793 $2,222 $2,041 
13

Table of Contents
image2a32a.jpg
U.S.
GROUP BENEFITS
FUTURE POLICY BENEFITS AND POLICYHOLDER ACCOUNT BALANCES
  For the Three Months Ended
Unaudited (In millions)September 30, 2021December 31, 2021March 31, 2022June 30, 2022September 30, 2022
Balance, beginning of period$19,783 $19,682 $19,825 $19,996 $20,132 
Premiums and deposits5,897 6,227 6,483 6,121 6,014 
Surrenders and withdrawals(673)(657)(683)(688)(685)
Benefit payments(4,895)(5,165)(5,213)(4,631)(4,511)
Net flows329 405 587 802 818 
Net transfers from (to) separate accounts— 
Interest125 125 124 129 137 
Policy charges(146)(147)(150)(155)(153)
Other(410)(240)(394)(643)(698)
Balance, end of period$19,682 $19,825 $19,996 $20,132 $20,239 
SEPARATE ACCOUNT LIABILITIES
  For the Three Months Ended
Unaudited (In millions)September 30, 2021December 31, 2021March 31, 2022June 30, 2022September 30, 2022
Balance, beginning of period$1,233 $1,220 $1,292 $1,182 $986 
Premiums and deposits68 68 69 69 69 
Surrenders and withdrawals(16)(19)(21)(17)(11)
Benefit payments(2)— (5)(2)(3)
Net flows50 49 43 50 55 
Investment performance(4)80 (88)(183)(43)
Net transfers from (to) general account(1)— (4)(3)(3)
Policy charges(58)(58)(60)(60)(60)
Other— (1)— — 
Balance, end of period$1,220 $1,292 $1,182 $986 $935 
14

Table of Contents
image2a32a.jpg
U.S.
GROUP BENEFITS
OTHER EXPENSES BY MAJOR CATEGORY
  For the Three Months Ended
Unaudited (In millions)September 30, 2021December 31, 2021March 31, 2022June 30, 2022September 30, 2022
Direct and allocated expenses$400 $434 $438 $436 $444 
Pension, postretirement and postemployment benefit costs
Premium taxes, other taxes, and licenses & fees73 74 77 73 88 
Commissions and other variable expenses296 305 334 334 342 
Adjusted other expenses$777 $820 $850 $844 $876 
OTHER STATISTICAL INFORMATION (1)
  For the Three Months Ended
Unaudited (In millions, except ratios)September 30, 2021December 31, 2021March 31, 2022June 30, 2022September 30, 2022
Group Life (2)
Adjusted premiums, fees and other revenues$2,074 $2,151 $2,180 $2,126 $2,125 
Mortality ratio106.2 %106.3 %103.8 %85.8 %86.0 %
Group Non-Medical Health (3)
Adjusted premiums, fees and other revenues$2,352 $2,388 $2,519 $2,481 $2,475 
Interest adjusted benefit ratio (4)70.7 %74.2 %72.5 %73.1 %70.8 %
(1) Results are derived from insurance and non-administrative services-only contracts.
(2) Excludes certain experience-rated contracts and includes accidental death and dismemberment.
(3) Includes dental, group and individual disability, accident & health, critical illness, vision and other health.
(4) Reflects actual claims experience and excludes the impact of interest credited on future policyholder benefits. The product within Group Non-Medical Health with interest credited on future policyholder benefits is disability.

15

Table of Contents
image2a32a.jpg
U.S.
RETIREMENT AND INCOME SOLUTIONS
 
FUTURE POLICY BENEFITS AND POLICYHOLDER ACCOUNT BALANCES
  For the Three Months Ended
Unaudited (In millions)September 30, 2021December 31, 2021March 31, 2022June 30, 2022September 30, 2022
Balance, beginning of period$136,524 $134,283 $136,331 $136,782 $137,214 
Premiums and deposits20,813 20,151 25,113 26,017 31,052 
Surrenders and withdrawals(20,936)(17,271)(20,104)(23,750)(22,157)
Benefit payments(1,379)(1,495)(1,488)(1,479)(1,540)
Net flows(1,502)1,385 3,521 788 7,355 
Net transfers from (to) separate accounts— (26)— — 
Interest942 943 954 1,005 1,132 
Policy charges(43)(28)(45)(46)(46)
Other(1,638)(253)(3,953)(1,315)(1,091)
Balance, end of period$134,283 $136,331 $136,782 $137,214 $144,564 
SEPARATE ACCOUNT LIABILITIES
  For the Three Months Ended
Unaudited (In millions)September 30, 2021December 31, 2021March 31, 2022June 30, 2022September 30, 2022
Balance, beginning of period$82,432 $81,091 $79,925 $69,123 $61,622 
Premiums and deposits1,027 838 2,617 1,309 927 
Surrenders and withdrawals (1)(3,214)(2,781)(8,953)(1,424)(1,053)
Benefit payments(27)(36)(25)(20)(33)
Net flows(2,214)(1,979)(6,361)(135)(159)
Investment performance256 954 (3,138)(3,168)(2,286)
Net transfers from (to) general account— (1)26 — — 
Policy charges(87)(82)(94)(84)(82)
Other704 (58)(1,235)(4,114)(257)
Balance, end of period$81,091 $79,925 $69,123 $61,622 $58,838 
SYNTHETIC GICS (2)
For the Three Months Ended
Unaudited (In millions)September 30, 2021December 31, 2021March 31, 2022June 30, 2022September 30, 2022
Balance, beginning of period$37,773 $39,365 $40,121 $43,485 $44,841 
Premiums and deposits (1)1,857 1,547 3,598 1,268 157 
Surrenders and withdrawals(463)(993)(436)(132)(173)
Net flows 1,394 554 3,162 1,136 (16)
Interest198 202 202 220 241 
Balance, end of period$39,365 $40,121 $43,485 $44,841 $45,066 
LONGEVITY REINSURANCE (3)
Unaudited (In millions)September 30, 2021December 31, 2021March 31, 2022June 30, 2022September 30, 2022
Balance, end of period$9,358 $14,824 $14,898 $14,753 $13,427 
(1)Includes $119 million, $750 million, $1,884 million, $0 and $0 of transfers from separate account GICs to synthetic GICs at September 30, 2021, December 31, 2021, March 31, 2021, June 30, 2022 and September 30, 2022, respectively. These transfers are reported as surrenders and withdrawals on the separate account liabilities table and premiums and deposits on the synthetic GICs table.
(2)A synthetic GIC is a contract that simulates the performance of a traditional GIC through the use of financial instruments and is reported as a derivative. A key difference between a synthetic GIC and a traditional GIC is that the contractholder owns the assets underlying the synthetic GIC. The assets and corresponding contractholder account balance are not on MetLife, Inc.'s consolidated balance sheet, as they are for a traditional GIC. The contractholder account balance is reported at contract value in the table above.
(3)The contract value presented represents notional amounts based on the present value of fixed annuity premiums related to longevity reinsurance contracts associated with the UK pension risk transfer market.

16

Table of Contents
image2a32a.jpg
U.S.
RETIREMENT AND INCOME SOLUTIONS
OTHER EXPENSES BY MAJOR CATEGORY
For the Three Months Ended
Unaudited (In millions)September 30, 2021December 31, 2021March 31, 2022June 30, 2022September 30, 2022
Direct and allocated expenses$57 $60 $65 $61 $64 
Pension, postretirement and postemployment benefit costs— — 
Premium taxes, other taxes, and licenses & fees15 22 
Commissions and other variable expenses47 39 59 39 41 
Adjusted other expenses$109 $117 $129 $105 $127 
SPREAD
For the Three Months Ended
UnauditedSeptember 30, 2021December 31, 2021March 31, 2022June 30, 2022September 30, 2022
Investment income yield excluding variable investment income yield3.77 %3.72 %3.68 %3.94 %4.27 %
Variable investment income yield1.63 %1.11 %0.92 %0.13 %(0.30)%
Total investment income yield5.40 %4.83 %4.60 %4.07 %3.97 %
Average crediting rate2.84 %2.81 %2.79 %2.91 %3.26 %
Annualized general account spread2.56 %2.02 %1.81 %1.16 %0.71 %
Annualized general account spread excluding variable investment income yield0.93 %0.91 %0.89 %1.03 %1.01 %

17

Table of Contents
image2a32a.jpg
ASIA
STATEMENTS OF ADJUSTED EARNINGS AVAILABLE TO COMMON SHAREHOLDERS 
For the Three Months EndedFor the Year-to-Date Period Ended
Unaudited (In millions)September 30, 2021December 31, 2021March 31, 2022June 30, 2022September 30, 2022September 30, 2021September 30, 2022
Adjusted revenues
Premiums$1,594 $1,560 $1,553 $1,395 $1,347 $4,861 $4,295 
Universal life and investment-type product policy fees477 443 448 498 421 1,371 1,367 
Net investment income1,354 1,276 1,242 1,012 827 3,776 3,081 
Other revenues17 19 21 24 21 54 66 
Total adjusted revenues3,442 3,298 3,264 2,929 2,616 10,062 8,809 
Adjusted expenses
Policyholder benefits and claims and policyholder dividends1,220 1,258 1,228 1,185 1,257 3,750 3,670 
Interest credited to policyholder account balances513 497 498 493 497 1,498 1,488 
Capitalization of DAC(373)(404)(392)(370)(358)(1,203)(1,120)
Amortization of DAC and VOBA470 289 288 321 190 1,080 799 
Amortization of negative VOBA(5)(7)(8)(8)(11)(20)(27)
Interest expense on debt— — — — — — — 
Other expenses811 846 837 763 749 2,542 2,349 
Total adjusted expenses2,636 2,479 2,451 2,384 2,324 7,647 7,159 
Adjusted earnings before provision for income tax806 819 813 545 292 2,415 1,650 
Provision for income tax expense (benefit)237 233 233 159 95 703 487 
Adjusted earnings569 586 580 386 197 1,712 1,163 
Preferred stock dividends— — — — — — — 
Adjusted earnings available to common shareholders$569 $586 $580 $386 $197 $1,712 $1,163 
Adjusted premiums, fees and other revenues$2,088 $2,022 $2,022 $1,917 $1,789 $6,286 $5,728 
18

Table of Contents
image2a32a.jpg
ASIA
ADJUSTED PREMIUMS, FEES AND OTHER REVENUES
For the Three Months Ended
Unaudited (In millions)September 30, 2021December 31, 2021March 31, 2022June 30, 2022September 30, 2022
Adjusted premiums, fees and other revenues$2,088 $2,022 $2,022 $1,917 $1,789 
Adjusted premiums, fees and other revenues, on a constant currency basis $1,762 $1,743 $1,777 $1,816 $1,789 
Add: Operating joint ventures, on a constant currency basis (1), (2)302 300 374 301 393 
Adjusted premiums, fees and other revenues, including operating joint ventures, on a constant currency basis$2,064 $2,043 $2,151 $2,117 $2,182 
OTHER EXPENSES BY MAJOR CATEGORY
For the Three Months Ended
Unaudited (In millions)September 30, 2021December 31, 2021March 31, 2022June 30, 2022September 30, 2022
Direct and allocated expenses$305 $319 $326 $291 $285 
Pension, postretirement and postemployment benefit costs22 31 20 19 17 
Premium taxes, other taxes, and licenses & fees39 41 39 31 36 
Commissions and other variable expenses445 455 452 422 411 
Adjusted other expenses$811 $846 $837 $763 $749 
Adjusted other expenses, net of adjusted capitalization of DAC$438 $442 $445 $393 $391 
Adjusted other expenses on a constant currency basis$670 $719 $726 $720 $749 
Add: Operating joint ventures, on a constant currency basis (1), (2)94 96 111 102 111 
Adjusted other expenses, including operating joint ventures, on a constant currency basis$764 $815 $837 $822 $860 
Adjusted other expenses, including operating joint ventures, net of adjusted capitalization of DAC, on a constant currency basis
$438 $454 $472 $455 $480 
SALES ON A CONSTANT CURRENCY BASIS
For the Three Months Ended
Unaudited (In millions)September 30, 2021December 31, 2021March 31, 2022June 30, 2022September 30, 2022
Japan:
Life$159 $185 $180 $105 $101 
Accident & Health53 62 73 70 66 
Annuities65 71 97 130 202 
Other
Total Japan279 320 352 307 372 
Other Asia180 242 194 158 213 
   Total sales$459 $562 $546 $465 $585 
OTHER STATISTICAL INFORMATION
For the Three Months Ended
Unaudited (In millions)September 30, 2021December 31, 2021March 31, 2022June 30, 2022September 30, 2022
Adjusted earnings available to common shareholders$569 $586 $580 $386 $197 
Adjusted earnings available to common shareholders, on a constant currency basis$555 $565 $559 $380 $197 
(1)Adjusted premiums, fees and other revenues as well as other expenses are reported as part of net investment income on the statements of adjusted earnings available to common shareholders for operating joint ventures.
(2)Includes MetLife, Inc.'s percentage interest in operating joint ventures of: (i) China, (ii) India, (iii) Malaysia and (iv) Vietnam, which are consolidated using the equity method of accounting.

19

Table of Contents
image2a32a.jpg
ASIA
ASIA GENERAL ACCOUNT ASSETS UNDER MANAGEMENT AND RELATED MEASURES
Unaudited (In millions)September 30, 2021December 31, 2021March 31, 2022June 30, 2022September 30, 2022
GA AUM $141,304 $140,317 $131,989 $117,597 $109,930 
GA AUM (at amortized cost)$130,777 $130,310 $129,935 $122,257 $119,302 
GA AUM (at amortized cost), on a constant currency basis$114,728 $115,997 $118,116 $117,928 $119,302 
  Add: Operating joint ventures, on a constant currency basis (1)5,590 6,106 6,834 7,045 7,240 
GA AUM (at amortized cost), including operating joint ventures, on a constant currency basis$120,318 $122,103 $124,950 $124,973 $126,542 
(1)Includes MetLife, Inc.'s percentage interest in operating joint ventures of: (i) China, (ii) India, (iii) Malaysia and (iv) Vietnam, which are consolidated using the equity method of accounting and reported in other invested assets, a component of total investments.

20

Table of Contents
image2a32a.jpg
LATIN AMERICA
STATEMENTS OF ADJUSTED EARNINGS AVAILABLE TO COMMON SHAREHOLDERS
 
For the Three Months EndedFor the Year-to-Date Period Ended
Unaudited (In millions)September 30, 2021December 31, 2021March 31, 2022June 30, 2022September 30, 2022September 30, 2021September 30, 2022
Adjusted revenues
Premiums$705 $673 $732 $826 $823 $1,936 $2,381 
Universal life and investment-type product policy fees274 278 290 296 290 831 876 
Net investment income306 358 322 459 399 913 1,180 
Other revenues11 10 10 30 29 
Total adjusted revenues1,294 1,320 1,353 1,591 1,522 3,710 4,466 
Adjusted expenses
Policyholder benefits and claims and policyholder dividends885 773 769 811 874 2,370 2,454 
Interest credited to policyholder account balances63 67 68 84 89 182 241 
Capitalization of DAC(109)(110)(113)(120)(130)(304)(363)
Amortization of DAC and VOBA62 80 80 90 68 205 238 
Amortization of negative VOBA— — — — — — — 
Interest expense on debt10 
Other expenses363 360 354 370 398 1,041 1,122 
Total adjusted expenses1,266 1,171 1,161 1,239 1,302 3,498 3,702 
Adjusted earnings before provision for income tax28 149 192 352 220 212 764 
Provision for income tax expense (benefit)(1)24 50 85 49 46 184 
Adjusted earnings29 125 142 267 171 166 580 
Preferred stock dividends— — — — — — — 
Adjusted earnings available to common shareholders$29 $125 $142 $267 $171 $166 $580 
Adjusted premiums, fees and other revenues$988 $962 $1,031 $1,132 $1,123 $2,797 $3,286 
21

Table of Contents
image2a32a.jpg
LATIN AMERICA
OTHER EXPENSES BY MAJOR CATEGORY
For the Three Months Ended
Unaudited (In millions)September 30, 2021December 31, 2021March 31, 2022June 30, 2022September 30, 2022
Direct and allocated expenses$126 $132 $126 $122 $134 
Pension, postretirement and postemployment benefit costs— 
Premium taxes, other taxes, and licenses & fees10 12 11 12 
Commissions and other variable expenses225 220 215 236 251 
Adjusted other expenses$363 $360 $354 $370 $398 
Adjusted other expenses, net of adjusted capitalization of DAC$254 $250 $241 $250 $268 
Adjusted other expenses on a constant currency basis$343 $354 $343 $354 $398 
Adjusted other expenses, net of adjusted capitalization of DAC, on a constant currency basis$240 $245 $234 $239 $268 
SALES ON A CONSTANT CURRENCY BASIS
For the Three Months Ended
Unaudited (In millions)September 30, 2021December 31, 2021March 31, 2022June 30, 2022September 30, 2022
Mexico112 124 154 125 128 
Chile56 57 63 75 79 
All other68 60 55 64 81 
Total sales$236 $241 $272 $264 $288 
OTHER STATISTICAL INFORMATION
For the Three Months Ended
Unaudited (In millions)September 30, 2021December 31, 2021March 31, 2022June 30, 2022September 30, 2022
Adjusted premiums, fees and other revenues$988 $962 $1,031 $1,132 $1,123 
Adjusted earnings available to common shareholders$29 $125 $142 $267 $171 
Adjusted premiums, fees and other revenues, on a constant currency basis$930 $948 $996 $1,085 $1,123 
Adjusted earnings available to common shareholders, on a constant currency basis$19 $118 $132 $254 $171 

22

Table of Contents
image2a32a.jpg
EMEA
STATEMENTS OF ADJUSTED EARNINGS AVAILABLE TO COMMON SHAREHOLDERS
 
For the Three Months EndedFor the Year-to-Date Period Ended
Unaudited (In millions)September 30, 2021December 31, 2021March 31, 2022June 30, 2022September 30, 2022September 30, 2021September 30, 2022
Adjusted revenues
Premiums$532 $520 $509 $492 $475 $1,751 $1,476 
Universal life and investment-type product policy fees128 93 88 86 62 302 236 
Net investment income46 44 41 38 40 171 119 
Other revenues10 39 25 
Total adjusted revenues716 665 647 624 585 2,263 1,856 
Adjusted expenses
Policyholder benefits and claims and policyholder dividends268 297 282 237 239 944 758 
Interest credited to policyholder account balances17 20 17 20 16 66 53 
Capitalization of DAC(110)(110)(101)(108)(96)(359)(305)
Amortization of DAC and VOBA118 82 86 95 79 274 260 
Amortization of negative VOBA(1)(2)(1)(2)(1)(5)(4)
Interest expense on debt— — — — — — — 
Other expenses308 318 296 298 269 1,006 863 
Total adjusted expenses600 605 579 540 506 1,926 1,625 
Adjusted earnings before provision for income tax116 60 68 84 79 337 231 
Provision for income tax expense (benefit)22 18 16 20 19 78 55 
Adjusted earnings94 42 52 64 60 259 176 
Preferred stock dividends— — — — — — — 
Adjusted earnings available to common shareholders$94 $42 $52 $64 $60 $259 $176 
Adjusted premiums, fees and other revenues$670 $621 $606 $586 $545 $2,092 $1,737 
23

Table of Contents
image2a32a.jpg
EMEA
OTHER EXPENSES BY MAJOR CATEGORY
For the Three Months Ended
Unaudited (In millions)September 30, 2021December 31, 2021March 31, 2022June 30, 2022September 30, 2022
Direct and allocated expenses$98 $102 $97 $101 $91 
Pension, postretirement and postemployment benefit costs
Premium taxes, other taxes, and licenses & fees
Commissions and other variable expenses202 210 192 191 174 
Adjusted other expenses$308 $318 $296 $298 $269 
Adjusted other expenses, net of adjusted capitalization of DAC$198 $208 $195 $190 $173 
Adjusted other expenses on a constant currency basis $266 $282 $271 $284 $269 
Adjusted other expenses, net of adjusted capitalization of DAC, on a constant currency basis$175 $187 $180 $183 $173 
OTHER STATISTICAL INFORMATION
  For the Three Months Ended
Unaudited (In millions)September 30, 2021December 31, 2021March 31, 2022June 30, 2022September 30, 2022
Adjusted premiums, fees and other revenues$670 $621 $606 $586 $545 
Adjusted earnings available to common shareholders$94 $42 $52 $64 $60 
Adjusted premiums, fees and other revenues, on a constant currency basis$583 $554 $553 $560 $545 
Adjusted earnings available to common shareholders, on a constant currency basis$75 $33 $44 $59 $60 
Total sales on a constant currency basis$159 $167 $218 $211 $175 
24

Table of Contents
image2a32a.jpg
METLIFE HOLDINGS
STATEMENTS OF ADJUSTED EARNINGS AVAILABLE TO COMMON SHAREHOLDERS
For the Three Months EndedFor the Year-to-Date Period Ended
Unaudited (In millions)September 30, 2021December 31, 2021March 31, 2022June 30, 2022September 30, 2022September 30, 2021September 30, 2022
Adjusted revenues
Premiums$805 $862 $776 $760 $745 $2,471 $2,281 
Universal life and investment-type product policy fees279 275 269 339 232 826 840 
Net investment income1,771 1,490 1,409 1,280 1,118 4,960 3,807 
Other revenues57 69 44 23 39 188 106 
Total adjusted revenues2,912 2,696 2,498 2,402 2,134 8,445 7,034 
Adjusted expenses
Policyholder benefits and claims and policyholder dividends1,611 1,585 1,518 1,433 1,659 4,683 4,610 
Interest credited to policyholder account balances212 208 202 203 202 632 607 
Capitalization of DAC(8)(8)(7)(8)(6)(25)(21)
Amortization of DAC and VOBA80 67 76 74 (20)190 130 
Amortization of negative VOBA— — — — — — — 
Interest expense on debt
Other expenses255 240 236 242 228 752 706 
Total adjusted expenses2,151 2,093 2,026 1,946 2,065 6,236 6,037 
Adjusted earnings before provision for income tax761 603 472 456 69 2,209 997 
Provision for income tax expense (benefit)155 121 95 92 10 449 197 
Adjusted earnings606 482 377 364 59 1,760 800 
Preferred stock dividends— — — — — — — 
Adjusted earnings available to common shareholders$606 $482 $377 $364 $59 $1,760 $800 
Adjusted premiums, fees and other revenues$1,141 $1,206 $1,089 $1,122 $1,016 $3,485 $3,227 
25

Table of Contents
image2a32a.jpg
METLIFE HOLDINGS
FUTURE POLICY BENEFITS AND POLICYHOLDER ACCOUNT BALANCES
LIFE & OTHER (1)
For the Three Months Ended
Unaudited (In millions)September 30, 2021December 31, 2021March 31, 2022June 30, 2022September 30, 2022
Balance, beginning of period$81,993 $82,115 $82,383 $81,617 $81,626 
Premiums and deposits (2), (3)1,070 1,121 1,035 966 936 
Surrenders and withdrawals(532)(529)(504)(520)(496)
Benefit payments(818)(805)(907)(734)(788)
Net flows(280)(213)(376)(288)(348)
Net transfers from (to) separate accounts12 10 10 17 
Interest838 839 835 839 853 
Policy charges(183)(180)(181)(180)(180)
Other(265)(188)(1,052)(372)(370)
Balance, end of period$82,115 $82,383 $81,617 $81,626 $81,598 
ANNUITIESFor the Three Months Ended
Unaudited (In millions)September 30, 2021December 31, 2021March 31, 2022June 30, 2022September 30, 2022
Balance, beginning of period$18,270 $18,341 $18,061 $17,676 $17,606 
Premiums and deposits (2), (3)72 89 84 91 68 
Surrenders and withdrawals(326)(410)(323)(327)(348)
Benefit payments(144)(152)(161)(148)(147)
Net flows(398)(473)(400)(384)(427)
Net transfers from (to) separate accounts61 52 66 69 32 
Interest125 125 119 119 119 
Policy charges(4)(4)(4)(4)(4)
Other287 20 (166)130 316 
Balance, end of period$18,341 $18,061 $17,676 $17,606 $17,642 
SEPARATE ACCOUNT LIABILITIES
LIFE & OTHER
For the Three Months Ended
Unaudited (In millions)September 30, 2021December 31, 2021March 31, 2022June 30, 2022September 30, 2022
Balance, beginning of period$7,424 $7,248 $7,512 $6,776 $5,527 
Premiums and deposits (3)56 57 59 56 53 
Surrenders and withdrawals(61)(64)(61)(38)(39)
Benefit payments(15)(19)(18)(15)(12)
Net flows(20)(26)(20)
Investment performance(80)367 (646)(1,176)(225)
Net transfers from (to) general account(12)(10)(8)(10)(17)
Policy charges(66)(65)(66)(66)(65)
Other(2)— 
Balance, end of period$7,248 $7,512 $6,776 $5,527 $5,225 
ANNUITIES
For the Three Months Ended
Unaudited (In millions)September 30, 2021December 31, 2021March 31, 2022June 30, 2022September 30, 2022
Balance, beginning of period$41,543 $39,840 $40,173 $36,079 $30,163 
Premiums and deposits (3)61 74 72 74 55 
Surrenders and withdrawals(1,127)(1,177)(866)(728)(648)
Benefit payments(116)(135)(124)(105)(99)
Net flows(1,182)(1,238)(918)(759)(692)
Investment performance
(258)1,819 (2,937)(4,919)(1,594)
Net transfers from (to) general account(61)(52)(66)(69)(32)
Policy charges(203)(195)(174)(170)(166)
Other(1)
Balance, end of period$39,840 $40,173 $36,079 $30,163 $27,680 
(1) Long-term care and Japan reinsurance are reported as part of "Other" within Life & Other.
(2) Includes premiums and deposits directed to the general account investment option of variable products.
(3) Includes company-sponsored internal exchanges.
26

Table of Contents
image2a32a.jpg
METLIFE HOLDINGS
OTHER EXPENSES BY MAJOR CATEGORY
  For the Three Months Ended
Unaudited (In millions)September 30, 2021December 31, 2021March 31, 2022June 30, 2022September 30, 2022
Direct and allocated expenses$165 $163 $167 $160 $164 
Pension, postretirement and postemployment benefit costs— 
Premium taxes, other taxes, and licenses & fees16 16 16 17 20 
Commissions and other variable expenses70 57 52 64 44 
Adjusted other expenses$255 $240 $236 $242 $228 
OTHER STATISTICAL INFORMATION
For the Three Months Ended
Unaudited (In millions, except ratios)September 30, 2021December 31, 2021March 31, 2022June 30, 2022September 30, 2022
Life (1)
Adjusted premiums, fees and other revenues$734 $791 $704 $758 $657 
Interest adjusted benefit ratio53.3 %54.3 %54.1 %33.2 %53.9 %
Lapse Ratio (2)
Traditional life4.0 %4.0 %4.2 %4.4 %4.5 %
Variable & universal life3.3 %3.3 %3.4 %3.3 %3.3 %
Fixed annuity6.8 %6.8 %6.3 %6.2 %6.6 %
Variable annuity9.7 %10.2 %10.0 %9.8 %9.5 %
(1) Represents the traditional life and variable & universal life components of Life & Other. Results are derived from insurance contracts.                                        
(2) Lapse ratios are calculated based on the average of the most recent 12 months of experience.

27

Table of Contents
image2a32a.jpg
CORPORATE & OTHER
STATEMENTS OF ADJUSTED EARNINGS AVAILABLE TO COMMON SHAREHOLDERS
For the Three Months EndedFor the Year-to-Date Period Ended
Unaudited (In millions)September 30, 2021December 31, 2021March 31, 2022June 30, 2022September 30, 2022September 30, 2021September 30, 2022
Adjusted revenues
Premiums$16 $(19)$(4)$(6)$(7)$54 $(17)
Universal life and investment-type product policy fees— — (1)
Net investment income93 91 104 63 153 172 
Other revenues108 117 101 98 96 303 295 
Total adjusted revenues217 190 201 99 151 511 451 
Adjusted expenses
Policyholder benefits and claims and policyholder dividends(2)(7)(2)(3)36 (12)
Interest credited to policyholder account balances— — — — — — — 
Capitalization of DAC(3)(2)(3)(2)(2)(9)(7)
Amortization of DAC and VOBA
Amortization of negative VOBA— — — — — — — 
Interest expense on debt236 219 219 219 231 683 669 
Other expenses137 284 136 184 186 278 506 
Total adjusted expenses381 501 347 401 415 995 1,163 
Adjusted earnings before provision for income tax(164)(311)(146)(302)(264)(484)(712)
Provision for income tax expense (benefit)(96)(303)(92)(88)(63)(288)(243)
Adjusted earnings(68)(8)(54)(214)(201)(196)(469)
Preferred stock dividends63 29 63 29 64 166 156 
Adjusted earnings available to common shareholders$(131)$(37)$(117)$(243)$(265)$(362)$(625)
Adjusted premiums, fees and other revenues$124 $99 $97 $94 $88 $358 $279 
ADJUSTED EARNINGS AVAILABLE TO COMMON SHAREHOLDERS BY SOURCE
  For the Three Months EndedFor the Year-to-Date Period Ended
Unaudited (In millions)September 30, 2021December 31, 2021March 31, 2022June 30, 2022September 30, 2022September 30, 2021September 30, 2022
Business activities$41 $45 $36 $34 $36 $98 $106 
Net investment income95 89 104 60 159 170 
Interest expense on debt(247)(228)(227)(226)(240)(716)(693)
Corporate initiatives and projects(25)(54)(12)(21)(15)(74)(48)
Other(28)(163)(47)(95)(105)49 (247)
Provision for income tax (expense) benefit and other tax-related items96 303 92 88 63 288 243 
Preferred stock dividends(63)(29)(63)(29)(64)(166)(156)
Adjusted earnings available to common shareholders$(131)$(37)$(117)$(243)$(265)$(362)$(625)
28

Table of Contents
image2a32a.jpg
INVESTMENTS
INVESTMENT PORTFOLIO RESULTS BY ASSET CATEGORY AND ANNUALIZED YIELDS
This yield table presentation is consistent with how we measure our investment performance for management purposes, and we believe it enhances understanding of our investment portfolio results.
At or For the Three Months Ended (1)At or For the Year Ended (1)
Unaudited (In millions, except yields)September 30, 2021December 31, 2021March 31, 2022June 30, 2022September 30, 2022September 30, 2021September 30, 2022
Fixed Maturity Securities
Yield3.71 %3.77 %3.52 %3.66 %3.81 %3.73 %3.66 %
Investment income (2), (3)$2,761 $2,816 $2,638 $2,709 $2,773 $8,330 $8,120 
Investment gains (losses)130 (2)(599)(671)(286)72 (1,556)
Ending carrying value (4)342,591 341,876 321,656 285,573 272,079 342,591 272,079 
Mortgage Loans
Yield4.12 %4.23 %4.13 %4.11 %4.37 %4.18 %4.20 %
Investment income (3)837 847 823 832 898 2,583 2,553 
Investment gains (losses)43 (119)44 48 47 101 139 
Ending carrying value80,964 79,353 79,968 82,055 82,437 80,964 82,437 
Real Estate and Real Estate Joint Ventures
Yield6.00 %6.36 %7.82 %8.98 %5.75 %4.28 %7.51 %
Investment income181 194 241 277 179 385 697 
Investment gains (losses)66 20 159 — 482 163 
Ending carrying value12,182 12,216 12,379 12,376 12,532 12,182 12,532 
Policy Loans
Yield5.09 %5.02 %5.13 %5.09 %5.18 %5.14 %5.13 %
Investment income118 115 116 114 114 359 344 
Ending carrying value9,186 9,111 9,036 8,876 8,783 9,186 8,783 
Equity Securities
Yield4.85 %3.76 %3.48 %2.46 %6.40 %4.69 %4.14 %
Investment income14 28 26 
Investment gains (losses)(33)11 (50)(42)(23)97 (115)
Ending carrying value941 1,269 988 1,085 973 941 973 
Other Limited Partnership Interests
Yield (5)48.43 %30.11 %25.35 %4.69 %(5.35)%45.04 %8.26 %
Investment income (5)1,542 1,058 926 171 (194)3,877 903 
Investment gains (losses)(4)11 18 (2)(1)(17)15 
Ending carrying value (6)13,480 14,625 14,570 14,636 14,387 13,480 14,387 
Cash and Short-term Investments
Yield0.70 %0.93 %1.08 %1.53 %2.54 %0.76 %1.74 %
Investment income20 25 30 43 78 62 151 
Investment gains (losses)15 14 42 63 12 119 
Ending carrying value26,106 27,223 26,634 23,591 27,466 26,106 27,466 
Other Invested Assets
Investment income 342 291 364 484 426 906 1,274 
Investment gains (losses)12 51 47 69 (14)48 102 
Ending carrying value18,683 18,655 18,696 19,901 22,299 18,683 22,299 
Total Investments
Investment income yield5.36 %4.94 %4.72 %4.29 %3.98 %5.09 %4.33 %
Investment fees and expenses yield(0.12)%(0.13)%(0.13)%(0.12)%(0.12)%(0.12)%(0.12)%
Net Investment Income Yield5.24 %4.81 %4.59 %4.17 %3.86 %4.97 %4.21 %
Investment income$5,809 $5,354 $5,145 $4,635 $4,288 $16,530 $14,068 
Investment fees and expenses(125)(138)(142)(131)(125)(399)(398)
Net investment income including divested businesses5,684 5,216 5,003 4,504 4,163 16,131 13,670 
Less: Net investment income from divested businesses16 15 11 — — 52 11 
Adjusted Net Investment Income (7)$5,668 $5,201 $4,992 $4,504 $4,163 $16,079 $13,659 
Ending Carrying Value$504,133 $504,328 $483,927 $448,093 $440,956 $504,133 $440,956 
Investment Portfolio Gains (Losses) including divested businesses$220 $(13)$(522)$(397)$(214)$795 $(1,133)
Less: Divested businesses— — — — 28 — 
Investment Portfolio Gains (Losses) (8)$220 $(15)$(522)$(397)$(214)$767 $(1,133)
Gross investment gains352 331 310 597 259 1,380 1,166 
Gross investment losses(156)(242)(548)(1,084)(541)(608)(2,173)
Net credit loss (provision) release and (impairments)24 (104)(284)90 68 (5)(126)
Investment Portfolio Gains (Losses) (8)220 (15)(522)(397)(214)767 (1,133)
Investment portfolio gains (losses) income tax (expense) benefit(60)17 116 92 51 (163)259 
Investment Portfolio Gains (Losses), Net of Income Tax$160 $$(406)$(305)$(163)$604 $(874)
Derivative gains (losses) including Divested businesses $(445)$(431)$(1,074)$(1,427)$(732)$(2,690)$(3,233)
Less: Derivative gains (losses) from divested businesses— — — — — (1)— 
Derivative gains (losses) (8)(445)(431)(1,074)(1,427)(732)(2,689)(3,233)
Derivative gains (losses) income tax (expense) benefit127 96 265 396 196 663 857 
Derivative Gains (Losses), Net of Income Tax$(318)$(335)$(809)$(1,031)$(536)$(2,026)$(2,376)
See footnotes on Page 32.

29

Table of Contents
image2a32a.jpg
INVESTMENTS
 
SUMMARY OF FIXED MATURITY SECURITIES AVAILABLE-FOR-SALE
BY SECTOR AND QUALITY DISTRIBUTION
September 30, 2021December 31, 2021March 31, 2022June 30, 2022September 30, 2022
Unaudited (In millions, except ratios)Amount% of TotalAmount% of TotalAmount% of TotalAmount% of TotalAmount% of Total
U.S. corporate$92,012 27.0 %$93,034 27.3 %$87,136 27.2 %$80,555 28.3 %$78,824 29.1 %
Foreign corporate63,922 18.7 %63,640 18.7 %61,129 19.1 %54,177 19.1 %49,927 18.4 %
Foreign government63,380 18.6 %61,609 18.1 %57,282 17.9 %48,016 16.9 %44,050 16.3 %
U.S. government and agency48,100 14.1 %46,599 13.7 %40,334 12.6 %33,690 11.9 %31,562 11.7 %
Residential mortgage-backed30,267 8.9 %30,404 8.9 %30,080 9.4 %27,303 9.6 %27,145 10.0 %
Asset-backed securities and collateralized loan obligations17,403 5.1 %18,569 5.5 %19,305 6.0 %17,054 6.0 %16,766 6.2 %
Municipals14,040 4.1 %14,212 4.2 %12,958 4.1 %12,513 4.4 %12,014 4.4 %
Commercial mortgage-backed11,914 3.5 %12,207 3.6 %11,855 3.7 %10,870 3.8 %10,477 3.9 %
Fixed Maturity Securities Available-For-Sale$341,038 100.0 %$340,274 100.0 %$320,079 100.0 %$284,178 100.0 %$270,765 100.0 %
NRSRONAIC
RATINGDESIGNATION
Aaa / Aa / A1$239,158 70.1 %$239,394 70.4 %$222,096 69.4 %$195,090 68.7 %$185,780 68.6 %
Baa284,831 24.9 %85,209 25.0 %82,616 25.8 %74,783 26.3 %71,276 26.3 %
Ba312,876 3.8 %11,973 3.5 %11,788 3.7 %11,129 3.9 %10,652 4.0 %
B43,584 1.0 %3,150 0.9 %2,923 0.9 %2,653 0.9 %2,618 1.0 %
Caa and lower5565 0.2 %526 0.2 %480 0.1 %389 0.2 %306 0.1 %
In or near default624 — %22 — %176 0.1 %134 — %133 — %
Total Fixed Maturity Securities Available-For-Sale (9)$341,038 100.0 %$340,274 100.0 %$320,079 100.0 %$284,178 100.0 %$270,765 100.0 %
GROSS UNREALIZED GAINS AND LOSSES
FIXED MATURITY SECURITIES AVAILABLE-FOR-SALE
Unaudited (In millions)September 30, 2021December 31, 2021March 31, 2022June 30, 2022September 30, 2022
Gross unrealized gains$33,349 $31,901 $16,145 $8,666 $5,488 
Gross unrealized losses2,247 2,420 9,583 23,759 36,982 
Net Unrealized Gains (Losses)$31,102 $29,481 $6,562 $(15,093)$(31,494)
See footnotes on Page 32.

30

Table of Contents
image2a32a.jpg
INVESTMENTS
SUMMARY OF MORTGAGE LOANS
Unaudited (In millions)September 30, 2021December 31, 2021March 31, 2022June 30, 2022September 30, 2022
          
Commercial mortgage loans$51,336 $50,553 $51,117 $52,348 $52,273 
Agricultural mortgage loans18,353 18,111 17,882 18,563 18,923 
Residential mortgage loans11,838 11,323 11,584 11,606 11,708 
Mortgage loans held-for-sale— — — 24 — 
Mortgage Loans81,527 79,987 80,583 82,541 82,904 
Valuation allowances(563)(634)(615)(486)(467)
Mortgage Loans, net$80,964 $79,353 $79,968 $82,055 $82,437 
SUMMARY OF COMMERCIAL MORTGAGE LOANS
BY REGION AND PROPERTY TYPE
 
September 30, 2021December 31, 2021March 31, 2022June 30, 2022September 30, 2022
Unaudited (In millions, except ratios)Amount% of TotalAmount% of TotalAmount% of TotalAmount% of TotalAmount% of Total
Pacific$10,249 20.0 %$9,676 19.1 %$9,824 19.2 %$9,901 18.9 %$9,805 18.7 %
Non-U.S.9,501 18.5 %9,969 19.7 %10,064 19.7 %9,726 18.6 %8,977 17.2 %
Middle Atlantic7,877 15.3 %7,537 14.9 %7,876 15.4 %7,918 15.1 %7,748 14.8 %
South Atlantic7,047 13.7 %6,800 13.5 %6,849 13.4 %6,852 13.1 %6,691 12.8 %
West South Central3,434 6.7 %3,492 6.9 %3,587 7.0 %3,943 7.5 %4,005 7.7 %
New England2,623 5.1 %2,748 5.4 %2,752 5.4 %2,781 5.3 %2,754 5.3 %
Mountain1,996 3.9 %1,993 4.0 %2,078 4.1 %2,268 4.3 %2,269 4.3 %
East North Central2,229 4.3 %2,129 4.2 %2,013 3.9 %1,489 2.9 %1,596 3.1 %
East South Central824 1.6 %759 1.5 %725 1.4 %636 1.2 %635 1.2 %
West North Central649 1.3 %663 1.3 %458 0.9 %428 0.8 %471 0.9 %
Multi-Region and Other4,907 9.6 %4,787 9.5 %4,891 9.6 %6,406 12.3 %7,322 14.0 %
Total$51,336 100.0 %$50,553 100.0 %$51,117 100.0 %$52,348 100.0 %$52,273 100.0 %
Office$22,573 44.0 %$22,388 44.3 %$22,170 43.4 %$21,923 41.9 %$21,144 40.5 %
Apartment8,910 17.4 %9,121 18.0 %9,578 18.7 %10,536 20.1 %10,793 20.6 %
Retail8,684 16.9 %8,548 16.9 %8,766 17.2 %8,524 16.3 %8,305 15.9 %
Industrial5,562 10.8 %5,096 10.1 %5,055 9.9 %4,902 9.4 %5,068 9.7 %
Hotel3,175 6.2 %3,201 6.3 %3,137 6.1 %3,323 6.3 %3,261 6.2 %
Other2,432 4.7 %2,199 4.4 %2,411 4.7 %3,140 6.0 %3,702 7.1 %
Total$51,336 100.0 %$50,553 100.0 %$51,117 100.0 %$52,348 100.0 %$52,273 100.0 %

31

Table of Contents
image2a32a.jpg
INVESTMENTS
FOOTNOTES
(1)We calculate yields using adjusted net investment income as a percent of average quarterly asset carrying values. Adjusted net investment income excludes realized gains and losses from sales and disposals, includes the impact of changes in foreign currency exchange rates and reflects the adjustments described on Page A-7 and presented on Page A-1. Average quarterly asset carrying values exclude unrealized gains (losses), collateral received in connection with our securities lending program, annuities funding structured settlement claims, freestanding derivative assets, collateral received from derivative counterparties and contractholder-directed equity securities. In addition, average quarterly asset carrying values include invested assets reclassified to held-for-sale, while ending carrying values exclude invested assets reclassified to held-for-sale. A yield is not presented for other invested assets, as it is not considered a meaningful measure of performance for this asset class.
(2)Fixed maturity securities includes investment income related to fair value option securities of $6 million, $75 million, ($65) million, ($89) million and ($43) million for the three months ended September 30, 2021, December 31, 2021, March 31, 2022, June 30, 2022 and September 30, 2022, respectively, and $92 million and ($197) million for the year-to-date periods ended September 30, 2021 and September 30, 2022, respectively.
(3)Investment income from fixed maturity securities and mortgage loans includes prepayment fees.
(4)The following table presents the components of total fixed maturity securities and a reconciliation to ending carrying value presented for fixed maturity securities.
September 30, 2021December 31, 2021March 31, 2022June 30, 2022September 30, 2022
Fixed maturity securities available-for-sale$341,038 $340,274 $320,079 $284,178 $270,765 
Contractholder-directed equity securities and fair value option securities12,055 12,142 11,418 9,875 8,954 
Total fixed maturity securities353,093 352,416 331,497 294,053 279,719 
Less: Contractholder-directed equity securities10,502 10,540 9,841 8,480 7,640 
Fixed maturity securities$342,591 $341,876 $321,656 $285,573 $272,079 
(5)Other limited partnership interests includes investment income related to private equity investments of $1,516 million, $1,059 million, $984 million, $216 million and ($188) million for the three months ended September 30, 2021, December 31, 2021, March 31, 2022, June 30, 2022 and September 30, 2022, respectively, and $3,839 million and $1,012 million for the year-to-date period ended September 30, 2021 and September 30, 2022, respectively. The annualized yields for these periods were 50.19%, 31.64%, 28.16%, 6.17%, (5.37%), 47.26% and 9.64%, respectively.
(6)Other limited partnership interests includes ending carrying value related to private equity investments of $12,811 million, $13,963 million, $13,971 million, $14,092 million and $13,855 million at September 30, 2021, December 31, 2021, March 31, 2022, June 30, 2022 and September 30, 2022, respectively.
(7)Adjusted net investment income reflects the adjustments as presented on Page 5.
(8)Investment portfolio gains (losses) and Derivative gains (losses) reflect the non-GAAP adjustments as presented below:
For the Three Months EndedFor the Year-to-Date Period Ended
September 30, 2021December 31, 2021March 31, 2022June 30, 2022September 30, 2022September 30, 2021September 30, 2022
Net investment gains (losses) $(84)$(126)$(518)$(685)$(414)$1,655 $(1,617)
Less: Operating joint venture adjustments— (1)10 
Less: Change in estimated fair value of other limited partnership interests and real estate joint ventures22 (1)(18)23 (12)
Less: Non-investment portfolio gains (losses)(314)(135)(9)(286)(187)836 (482)
Less: Divested businesses— — — — 28 — 
Investment portfolio gains (losses) $220 $(15)$(522)$(397)$(214)$767 $(1,133)
For the Three Months EndedFor the Year-to-Date Period Ended
September 30, 2021December 31, 2021March 31, 2022June 30, 2022September 30, 2022September 30, 2021September 30, 2022
Net derivative gains (losses) $(218)$(196)$(859)$(1,195)$(480)$(2,032)$(2,534)
Less: Investment hedge adjustments228 235 215 232 252 660 699 
Less: PAB hedge adjustments(1)— — — — (2)— 
Less: Divested businesses— — — — — (1)— 
Derivative gains (losses) $(445)$(431)$(1,074)$(1,427)$(732)$(2,689)$(3,233)
(9)Fixed maturity securities available-for-sale are presented by NRSRO rating, except for non-agency residential mortgage-backed securities (“RMBS”) and commercial mortgage-backed securities (“CMBS”), which are presented using NAIC designations for modeled securities. In addition, the applicable NAIC designation from the NAIC published comparison of NRSRO ratings to NAIC designations is provided. NRSRO ratings are based on availability of applicable ratings. If no NRSRO rating is available, then an internally developed rating is used. If no NAIC designation is available, then, as permitted by the NAIC, an internally developed designation is used. NRSRO ratings and NAIC designations are as of the dates shown. Over time, credit ratings and designations can migrate, up or down, through the NRSRO's and NAIC's continuous monitoring process. NAIC designations are generally similar to the credit quality ratings of the NRSRO, except for (i) non-agency RMBS and CMBS and (ii) securities rated Ca or C by NRSROs, included within Caa and lower, that are designated NAIC 6; accordingly, NAIC designations may not correspond to NRSRO ratings.
32

Table of Contents
image2a32a.jpg
imagk06.jpg
Appendix


Table of Contents
image2a32a.jpg
APPENDIX
METLIFE
RECONCILIATION DETAIL
For the Three Months EndedFor the Year-to-Date Period Ended
Unaudited (In millions)September 30, 2021December 31, 2021March 31, 2022June 30, 2022September 30, 2022September 30, 2021September 30, 2022
Reconciliation to Adjusted Earnings Available to Common Shareholders
Net income (loss) available to MetLife, Inc.'s common shareholders$1,521 $1,176 $606 $103 $331 $5,177 $1,040 
Add: Preferred stock dividends63 29 63 29 64 166 156 
Add: Preferred stock redemption premium— — — — — — 
Add: Net Income (loss) attributable to noncontrolling interests15 16 
Net income (loss) 1,589 1,211 674 138 400 $5,364 $1,212 
Less: adjustments from net income (loss) to adjusted earnings:
Net investment gains (losses)(84)(126)(518)(685)(414)1,655 (1,617)
Net derivative gains (losses)(218)(196)(859)(1,195)(480)(2,032)(2,534)
Premiums - Divested businesses
57 60 41 — — 922 41 
Universal life and investment-type product policy fees
Unearned revenue adjustments46 13 (8)(11)(9)58 (28)
GMIB fees25 24 23 22 21 74 66 
Divested businesses13 13 11 — — 13 11 
Net investment income
Investment hedge adjustments(228)(235)(215)(232)(252)(660)(699)
Operating joint venture adjustments(1)— (6)(5)(1)(10)
Unit-linked contract income114 253 (498)(688)(321)699 (1,507)
Securitization entities income— — — — — — — 
Certain partnership distributions(1)(1)— (2)— (7)(2)
Divested businesses16 15 11 — — 52 11 
Other revenues
Settlement of foreign currency earnings hedges— — — — — — — 
TSA fees73 53 47 48 40 168 135 
Divested businesses— — 17 
Policyholder benefits and claims and policyholder dividends
PBC hedge adjustments(8)(7)(7)(6)(6)(25)(19)
PDO adjustments— — — — — — — 
Inflation and pass-through adjustments— (99)(39)(152)(88)96 (279)
GMIB costs(116)(88)45 125 171 (314)341 
Market value adjustments(21)(23)(12)34 66 (60)88 
Divested businesses(36)(41)(22)— — (618)(22)
Interest credited to policyholder account balances
PAB hedge adjustments— — — — — 
Unit-linked contract costs(116)(246)505 695 302 (692)1,502 
Divested businesses(5)(5)(3)— — (5)(3)
Capitalization of DAC - Divested businesses
15 15 11 — — 104 11 
Amortization of DAC and VOBA
Related to NIGL and NDGL(31)(63)19 (4)98 (37)113 
Related to GMIB fees and GMIB costs(13)(5)(1)(16)19 12 
Related to market value adjustments— — — — — — — 
Divested businesses(14)(14)(9)— — (112)(9)
Amortization of negative VOBA
Related to market value adjustments— — — — — — — 
Divested businesses— — — — — — — 
Interest expense on debt
Securitization entities debt expense— — — — — — — 
Divested businesses— — — — — (1)— 
Other expenses
Noncontrolling interests19 19 
Regulatory implementation costs— (1)— (2)(1)(3)(3)
Acquisition, integration and other costs(2)(7)(13)(14)(10)(34)
TSA fees(73)(53)(47)(48)(40)(168)(135)
Divested businesses(41)(81)(32)(8)(13)(277)(53)
Goodwill impairment— — — — — — — 
Provision for income tax (expense) benefit99 167 444 616 288 213 1,348 
Adjusted earnings2,125 1,867 1,790 1,655 1,030 6,282 4,475 
Less: Preferred stock dividends63 29 63 29 64 166 156 
Adjusted earnings available to common shareholders$2,062 $1,838 $1,727 $1,626 $966 $6,116 $4,319 
A-1

Table of Contents
image2a32a.jpg
APPENDIX
METLIFE
NOTABLE ITEMS (1)
METLIFE TOTAL
For the Three Months EndedFor the Year-to-Date Period Ended
Unaudited (In millions)September 30, 2021December 31, 2021March 31, 2022June 30, 2022September 30, 2022September 30, 2021September 30, 2022
Actuarial assumption review and other insurance adjustments$(140)$— $— $77 $34 $(140)$111 
Litigation reserves and settlement costs— — — — — 66 — 
Tax adjustments— 140 — — — — — 
Total notable items$(140)$140 $— $77 $34 $(74)$111 
U.S.
For the Three Months EndedFor the Year-to-Date Period Ended
Unaudited (In millions)September 30, 2021December 31, 2021March 31, 2022June 30, 2022September 30, 2022September 30, 2021September 30, 2022
Actuarial assumption review and other insurance adjustments $— $— $— $— $91 $— $91 
Total notable items$— $— $— $— $91 $— $91 
GROUP BENEFITS
For the Three Months EndedFor the Year-to-Date Period Ended
Unaudited (In millions)September 30, 2021December 31, 2021March 31, 2022June 30, 2022September 30, 2022September 30, 2021September 30, 2022
Actuarial assumption review and other insurance adjustments $— $— $— $— $— $— $— 
Total notable items $— $— $— $— $— $— $— 
RETIREMENT AND INCOME SOLUTIONS
  For the Three Months EndedFor the Year-to-Date Period Ended
Unaudited (In millions)September 30, 2021December 31, 2021March 31, 2022June 30, 2022September 30, 2022September 30, 2021September 30, 2022
Actuarial assumption review and other insurance adjustments $— $— $— $— $91 $— $91 
Total notable items $— $— $— $— $91 $— $91 
(1) These notable items represent a positive (negative) impact to adjusted earnings available to common shareholders. Notable items reflect the unexpected impact of events that affect MetLife's results, but that were unknown and that MetLife could not anticipate when it devised its business plan. Notable items also include certain items regardless of the extent anticipated in the business plan to help investors have a better understanding of MetLife's results and to evaluate and forecast those results.

A-2

Table of Contents
image2a32a.jpg
APPENDIX
METLIFE
NOTABLE ITEMS (CONTINUED) (1)
ASIA
  For the Three Months EndedFor the Year-to-Date Period Ended
Unaudited (In millions)September 30, 2021December 31, 2021March 31, 2022June 30, 2022September 30, 2022September 30, 2021September 30, 2022
Actuarial assumption review and other insurance adjustments
$(79)$— $— $— $23 $(79)$23 
Total notable items
$(79)$— $— $— $23 $(79)$23 
LATIN AMERICA
  
For the Three Months EndedFor the Year-to-Date Period Ended
Unaudited (In millions)
September 30, 2021December 31, 2021March 31, 2022June 30, 2022September 30, 2022September 30, 2021September 30, 2022
Actuarial assumption review and other insurance adjustments
$(2)$— $— $— $$(2)$
Total notable items
$(2)$— $— $— $$(2)$
EMEA
  
For the Three Months EndedFor the Year-to-Date Period Ended
Unaudited (In millions)
September 30, 2021December 31, 2021March 31, 2022June 30, 2022September 30, 2022September 30, 2021September 30, 2022
Actuarial assumption review and other insurance adjustments
$(6)$— $— $— $$(6)$
Total notable items
$(6)$— $— $— $$(6)$
METLIFE HOLDINGS
  
For the Three Months EndedFor the Year-to-Date Period Ended
Unaudited (In millions)
September 30, 2021December 31, 2021March 31, 2022June 30, 2022September 30, 2022September 30, 2021September 30, 2022
Actuarial assumption review and other insurance adjustments
$(53)$— $— $77 $(91)$(53)$(14)
Total notable items
$(53)$— $— $77 $(91)$(53)$(14)
CORPORATE & OTHER
  
For the Three Months EndedFor the Year-to-Date Period Ended
Unaudited (In millions)
September 30, 2021December 31, 2021March 31, 2022June 30, 2022September 30, 2022September 30, 2021September 30, 2022
Litigation reserves and settlement costs$— $— $— $— $— $66 $— 
Tax adjustments— 140 — — — — — 
Total notable items$— $140 $— $— $— $66 $— 
(1)These notable items represent a positive (negative) impact to adjusted earnings available to common shareholders. Notable items reflect the unexpected impact of events that affect MetLife's results, but that were unknown and that MetLife could not anticipate when it devised its business plan. Notable items also include certain items regardless of the extent anticipated in the business plan, to help investors have a better understanding of MetLife's results and to evaluate and forecast those results.
A-3

Table of Contents
image2a32a.jpg
APPENDIX
METLIFE
EQUITY DETAILS, BOOK VALUE DETAILS AND RETURN ON EQUITY
Unaudited (In millions)September 30, 2021December 31, 2021March 31, 2022June 30, 2022September 30, 2022
Total MetLife, Inc.'s stockholders' equity$69,050 $67,482 $53,965 $37,101 $25,076 
Less: Preferred stock
3,818 3,818 3,818 3,818 3,818 
MetLife, Inc.'s common stockholders' equity 65,232 63,664 50,147 33,283 21,258 
Less: Net unrealized investment gains (losses), net of income tax
18,658 17,671 5,182 (9,457)(20,008)
  Defined benefit plans adjustment, net of income tax(1,805)(1,598)(1,577)(1,555)(1,536)
Total MetLife, Inc.'s common stockholders' equity, excluding AOCI other than FCTA$48,379 $47,591 $46,542 $44,295 $42,802 
Less: Goodwill, net of income tax
9,317 9,221 9,163 8,828 8,683 
  VODA and VOCRA, net of income tax
763 718 699 679 663 
Total MetLife, Inc.'s tangible common stockholders' equity$38,299 $37,652 $36,680 $34,788 $33,456 
Unaudited (In millions)September 30, 2021December 31, 2021March 31, 2022June 30, 2022September 30, 2022
Total MetLife, Inc.'s common stockholders' equity, excluding AOCI other than FCTA$48,379 $47,591 $46,542 $44,295 $42,802 
Less: Accumulated year-to-date total notable items (2)
(74)66 — 77 111 
Total MetLife, Inc.'s common stockholders' equity, excluding total notable items (excludes AOCI other than FCTA) (2)$48,453 $47,525 $46,542 $44,218 $42,691 
Unaudited (In millions, except per share data)September 30, 2021December 31, 2021March 31, 2022June 30, 2022September 30, 2022
Book value per common share $77.24 $77.12 $61.55 $41.73 $27.00 
Less: Net unrealized investment gains (losses), net of income tax
22.09 21.41 6.36 (11.86)(25.42)
  Defined benefit plans adjustment, net of income tax
(2.14)(1.94)(1.93)(1.95)(1.95)
Book value per common share, excluding AOCI other than FCTA$57.29 $57.65 $57.12 $55.54 $54.37 
Less: Goodwill, net of income tax
11.04 11.17 11.24 11.07 11.04 
  VODA and VOCRA, net of income tax
0.90 0.87 0.86 0.85 0.84 
Book value per common share - tangible common stockholders' equity$45.35 $45.61 $45.02 $43.62 $42.49 
Common shares outstanding, end of period 844.5 825.5 814.8 797.6 787.3 
For the Three Months Ended (1)
Unaudited (In millions, except ratios)September 30, 2021December 31, 2021March 31, 2022June 30, 2022September 30, 2022
Return on MetLife, Inc.'s:
Common stockholders' equity 9.3 %7.3 %4.3 %1.0 %4.9 %
Adjusted return on MetLife, Inc.'s:
Common stockholders' equity 12.6 %11.4 %12.1 %15.6 %14.2 %
Common stockholders' equity, excluding AOCI other than FCTA 17.0 %15.3 %14.7 %14.3 %8.9 %
Common stockholders' equity, excluding total notable items (excludes AOCI other than FCTA) (2)18.2 %14.2 %14.7 %13.7 %8.6 %
Tangible common stockholders' equity (3) 21.7 %19.6 %18.8 %18.4 %11.5 %
Average common stockholders' equity $65,276 $64,448 $56,906 $41,715 $27,271 
Average common stockholders' equity, excluding AOCI other than FCTA $48,464 $47,985 $47,067 $45,419 $43,549 
Average common stockholders' equity, excluding total notable items (excludes AOCI other than FCTA) (2)$48,468 $47,989 $47,067 $45,380 $43,455 
Average tangible common stockholders' equity
$38,335 $37,976 $37,166 $35,734 $34,122 
(1) Annualized using quarter-to-date results.
(2)Notable items reflect the unexpected impact of events that affect MetLife’s results, but that were unknown and that MetLife could not anticipate when it devised its business plan. Notable items also include certain items regardless of the extent anticipated in the business plan, to help investors have a better understanding of MetLife's results and to evaluate and forecast those results. Notable items can affect MetLife’s results either positively or negatively. See Page A-2 for further detail.
(3)Adjusted earnings available to common shareholders used to calculate the adjusted return on tangible common stockholders' equity excludes the impact of amortization of VODA and VOCRA, net of income tax, for the three months ended September 30, 2021, December 31, 2021, March 31, 2022, June 30, 2022 and September 30, 2022 of $20 million, $19 million, $18 million, $19 million and $17 million, respectively.
A-4

Table of Contents
image2a32a.jpg
APPENDIX
METLIFE
ADJUSTED PREMIUMS, FEES AND OTHER REVENUES, OTHER EXPENSES AND ADJUSTED EARNINGS AVAILABLE TO COMMON SHAREHOLDERS - CONSTANT CURRENCY BASIS
 ADJUSTED PREMIUMS, FEES AND OTHER REVENUES, ON A CONSTANT CURRENCY BASIS
For the Three Months Ended
Unaudited (In millions)September 30, 2021December 31, 2021March 31, 2022June 30, 2022September 30, 2022
U.S. (1)$6,408 $10,100 $7,887 $8,943 $14,966 
ASIA 1,762 1,743 1,777 1,816 1,789 
LATIN AMERICA930 948 996 1,085 1,123 
EMEA 583 554 553 560 545 
METLIFE HOLDINGS (1)1,141 1,206 1,089 1,122 1,016 
CORPORATE & OTHER (1)124 99 97 94 88 
Adjusted premiums, fees and other revenues, on a constant currency basis$10,948 $14,650 $12,399 $13,620 $19,527 
Adjusted premiums, fees and other revenues$11,419 $15,010 $12,732 $13,794 $19,527 
ASIA (including operating joint ventures) (2), (3)$2,064 $2,043 $2,151 $2,117 $2,182 
 OTHER EXPENSES ON A CONSTANT CURRENCY BASIS
For the Three Months Ended
Unaudited (In millions)September 30, 2021December 31, 2021March 31, 2022June 30, 2022September 30, 2022
U.S. (1)$886 $937 $979 $949 $1,003 
ASIA 670 719 726 720 749 
LATIN AMERICA343 354 343 354 398 
EMEA266 282 271 284 269 
METLIFE HOLDINGS (1)255 240 236 242 228 
CORPORATE & OTHER (1)137 284 136 184 186 
Adjusted other expenses on a constant currency basis$2,557 $2,816 $2,691 $2,733 $2,833 
Adjusted other expenses$2,760 $2,985 $2,838 $2,806 $2,833 
ASIA (including operating joint ventures) (2), (3)$764 $815 $837 $822 $860 
 ADJUSTED EARNINGS AVAILABLE TO COMMON SHAREHOLDERS ON A CONSTANT CURRENCY BASIS
For the Three Months Ended
Unaudited (In millions)September 30, 2021December 31, 2021March 31, 2022June 30, 2022September 30, 2022
U.S. (1)$895 $640 $693 $788 $744 
ASIA 555 565 559 380 197 
LATIN AMERICA19 118 132 254 171 
EMEA 75 33 44 59 60 
METLIFE HOLDINGS (1)606 482 377 364 59 
CORPORATE & OTHER (1)(131)(37)(117)(243)(265)
Adjusted earnings available to common shareholders on a constant currency basis$2,019 $1,801 $1,688 $1,602 $966 
Adjusted earnings available to common shareholders$2,062 $1,838 $1,727 $1,626 $966 
 (1) Amounts on a reported basis, as constant currency impact is not significant.
 (2) Adjusted premiums, fees and other revenues as well as other expenses are reported as part of net investment income on the statements of adjusted earnings available to common shareholders on Page 18 for operating joint ventures.
 (3) Includes MetLife, Inc.'s percentage interest in operating joint ventures of: (i) China, (ii) India, (iii) Malaysia and (iv) Vietnam, which are consolidated using the equity method of accounting.
A-5

Table of Contents
image2a32a.jpg
METLIFE
NON-GAAP AND OTHER FINANCIAL DISCLOSURES

In this QFS, MetLife presents certain measures of its performance on a consolidated and segment basis that are not calculated in accordance with GAAP. We believe that these non-GAAP financial measures enhance the understanding for MetLife and its investors of MetLife's performance by highlighting the results of operations and the underlying profitability drivers of our business. Segment-specific financial measures are calculated using only the portion of consolidated results attributable to that specific segment.

The following non-GAAP financial measures should not be viewed as substitutes for the most directly comparable financial measures calculated in accordance with GAAP:
Non-GAAP financial measures:Comparable GAAP financial measures:
(i)total adjusted revenues(i)total revenues
(ii)total adjusted expenses(ii)total expenses
(iii)adjusted premiums, fees and other revenues(iii)premiums, fees and other revenues
(iv)adjusted premiums, fees & other revenues, excluding PRT (iv)premiums, fees and other revenues
(v)adjusted net investment income(v)net investment income
(vi)adjusted earnings(vi)net income (loss)
(vii)adjusted earnings available to common shareholders(vii)net income (loss) available to MetLife, Inc.’s common shareholders
(viii)adjusted earnings available to common shareholders, excluding total notable items(viii)net income (loss) available to MetLife, Inc.’s common shareholders
(ix)adjusted earnings available to common shareholders per diluted common share(ix)net income (loss) available to MetLife, Inc.’s common shareholders per diluted common share
(x)adjusted earnings available to common shareholders, excluding total notable items, per diluted common share(x)net income (loss) available to MetLife, Inc.’s common shareholders per diluted common share
(xi)adjusted return on equity(xi)return on equity
(xii)adjusted return on equity, excluding AOCI other than FCTA(xii)return on equity
(xiii)adjusted return on equity, excluding total notable items (excludes AOCI other than FCTA)(xiii)return on equity
(xiv)adjusted tangible return on equity(xiv)return on equity
(xv)investment portfolio gains (losses)(xv)net investment gains (losses)
(xvi)derivative gains (losses)(xvi)net derivative gains (losses)
(xvii)adjusted capitalization of DAC(xvii)capitalization of DAC
(xviii)total MetLife, Inc.’s tangible common stockholders’ equity(xviii)total MetLife, Inc.’s stockholders’ equity
(xix)total MetLife, Inc.’s common stockholders’ equity, excluding AOCI other than FCTA(xix)total MetLife, Inc.’s stockholders’ equity
(xx)total MetLife, Inc.’s common stockholders’ equity, excluding total notable items (excludes AOCI other than FCTA)(xx)total MetLife, Inc.’s stockholders’ equity
(xxi)book value per common share, excluding AOCI other than FCTA(xxi)book value per common share
(xxii)book value per common share - tangible common stockholders' equity(xxii)book value per common share
(xxiii)adjusted other expenses(xxiii)other expenses
(xxiv)adjusted other expenses, net of adjusted capitalization of DAC(xxiv)other expenses, net of capitalization of DAC
(xxv)adjusted other expenses, net of adjusted capitalization of DAC, excluding total notable items related to adjusted other expenses(xxv)other expenses, net of capitalization of DAC
(xxvi)adjusted expense ratio(xxvi)expense ratio
(xxvii)adjusted expense ratio, excluding total notable items related to adjusted other expenses and PRT(xxvii)expense ratio
(xxviii)direct expenses(xxviii)other expenses
(xxix)direct expenses, excluding total notable items related to direct expenses(xxix)other expenses
(xxx)direct expense ratio(xxx)expense ratio
(xxxi)direct expense ratio, excluding total notable items related to direct expenses and PRT(xxxi)expense ratio
Any of these financial measures shown on a constant currency basis reflect the impact of changes in foreign currency exchange rates and are calculated using the average foreign currency exchange rates for the most recent period. As a result, comparable prior period amounts are updated each period to reflect the most recent period average foreign currency exchange rates.
Reconciliations of these non-GAAP financial measures to the most directly comparable GAAP financial measures are included in this QFS and in this period’s earnings news release, which is available at www.metlife.com.

A-6

Table of Contents
image2a32a.jpg
METLIFE
NON-GAAP AND OTHER FINANCIAL DISCLOSURES (CONTINUED)
Our definitions of non-GAAP and other financial measures discussed in this QFS may differ from those used by other companies:

Adjusted earnings and related measures
adjusted earnings;
adjusted earnings available to common shareholders;
adjusted earnings available to common shareholders, excluding total notable items;
adjusted earnings available to common shareholders per diluted common share;
adjusted earnings available to common shareholders, excluding total notable items per diluted common share; and
adjusted earnings available to common shareholders on a constant currency basis.
These measures are used by management to evaluate performance and allocate resources. Consistent with GAAP guidance for segment reporting, adjusted earnings and components of, or other financial measures based on, adjusted earnings are also MetLife’s GAAP measures of segment performance. Adjusted earnings and other financial measures based on adjusted earnings are also the measures by which MetLife senior management’s and many other employees’ performance is evaluated for the purposes of determining their compensation under applicable compensation plans. Adjusted earnings and other financial measures based on adjusted earnings allow analysis of MetLife's performance relative to its business plan and facilitate comparisons to industry results.

Adjusted earnings is defined as adjusted revenues less adjusted expenses, net of income tax. Adjusted earnings available to common shareholders is defined as adjusted earnings less preferred stock dividends.
Adjusted revenues and adjusted expenses
These financial measures, along with the related adjusted premiums, fees and other revenues, focus on our primary businesses principally by excluding the impact of market volatility, which could distort trends, and revenues and costs related to non-core products and certain entities required to be consolidated under GAAP. Also, these measures exclude results of discontinued operations under GAAP and other businesses that have been or will be sold or exited by MetLife but do not meet the discontinued operations criteria under GAAP (“Divested businesses”). Divested businesses also include the net impact of transactions with exited businesses that have been eliminated in consolidation under GAAP and costs relating to businesses that have been or will be sold or exited by MetLife that do not meet the criteria to be included in results of discontinued operations under GAAP. Adjusted revenues also excludes NIGL and NDGL. Adjusted expenses also excludes goodwill impairments.
The following additional adjustments are made to revenues, in the line items indicated, in calculating adjusted revenues:
Universal life and investment-type product policy fees excludes the amortization of unearned revenue related to NIGL and NDGL (“Unearned revenue adjustments”) and certain variable annuity GMIB fees (“GMIB fees”);
Net investment income: (i) includes adjustments for earned income on derivatives and amortization of premium on derivatives that are hedges of investments or that are used to replicate certain investments, but do not qualify for hedge accounting treatment (“Investment hedge adjustments”), (ii) excludes post-tax adjusted earnings adjustments relating to insurance joint ventures accounted for under the equity method (“Operating joint venture adjustments”), (iii) excludes certain amounts related to contractholder-directed equity securities (“Unit-linked contract income”), (iv) excludes certain amounts related to securitization entities that are VIEs consolidated under GAAP (“Securitization entities income”), and (v) includes distributions of profits from certain other limited partnership interests that were previously accounted for under the cost method, but are now accounted for at estimated fair value, where the change in estimated fair value is recognized in NIGL under GAAP ("Certain partnership distributions"); and
Other revenues is adjusted for settlements of foreign currency earnings hedges and excludes fees received in association with services provided under transition service agreements ("TSA fees").
The following additional adjustments are made to expenses, in the line items indicated, in calculating adjusted expenses:
Policyholder benefits and claims and policyholder dividends excludes: (i) amortization of basis adjustments associated with de-designated fair value hedges of future policy benefits ("PBC hedge adjustments"), (ii) changes in the policyholder dividend obligation related to NIGL and NDGL (“PDO adjustments”), (iii) inflation-indexed benefit adjustments associated with contracts backed by inflation-indexed investments and amounts associated with periodic crediting rate adjustments based on the total return of a contractually referenced pool of assets and other pass-through adjustments (“Inflation and pass-through adjustments”), (iv) benefits and hedging costs related to GMIBs (“GMIB costs”), and (v) market value adjustments associated with surrenders or terminations of contracts (“Market value adjustments”);
Interest credited to policyholder account balances includes adjustments for earned income on derivatives and amortization of premium on derivatives that are hedges of policyholder account balances but do not qualify for hedge accounting treatment (“PAB hedge adjustments”) and excludes certain amounts related to net investment income earned on contractholder-directed equity securities (“Unit-linked contract costs”);
Amortization of DAC and VOBA excludes amounts related to: (i) NIGL and NDGL, (ii) GMIB fees and GMIB costs, and (iii) Market value adjustments;
Amortization of negative VOBA excludes amounts related to Market value adjustments;
Interest expense on debt excludes certain amounts related to securitization entities that are VIEs consolidated under GAAP (“Securitization entities debt expense”); and
Other expenses excludes: (i) noncontrolling interests, (ii) implementation of new insurance regulatory requirements costs (“Regulatory implementation costs”) and (iii) acquisition, integration and other costs. Other expenses includes TSA fees.
Adjusted earnings also excludes the recognition of certain contingent assets and liabilities that could not be recognized at acquisition or adjusted for during the measurement period under GAAP business combination accounting guidance.

The tax impact of the adjustments mentioned above are calculated net of the U.S. or foreign statutory tax rate, which could differ from MetLife's effective tax rate. Additionally, the provision for income tax (expense) benefit also includes the impact related to the timing of certain tax credits, as well as certain tax reforms.

In addition, adjusted earnings available to common shareholders excludes the impact of preferred stock redemption premium which is reported as a reduction to net income (loss) available to MetLife, Inc.’s common shareholders.
Investment portfolio gains (losses) and derivative gains (losses)

These are measures of investment and hedging activity. Investment portfolio gains (losses) principally excludes amounts that are reported within net investment gains (losses) but do not relate to the performance of the investment portfolio, such as gains (losses) on sales and divestitures of businesses, as well as investment portfolio gains (losses) of divested businesses. Derivative gains (losses) principally excludes earned income on derivatives and amortization of premium on derivatives, where such derivatives are either hedges of investments or are used to replicate certain investments, and where such derivatives do not qualify for hedge accounting. This earned income and amortization of premium is reported within adjusted earnings and not within derivative gains (losses).
A-7


Table of Contents
image2a32a.jpg
METLIFE
NON-GAAP AND OTHER FINANCIAL DISCLOSURES (CONTINUED)
Return on equity, allocated equity, tangible equity and related measures
Total MetLife, Inc.’s common stockholders’ equity, excluding AOCI other than FCTA: Total MetLife, Inc.’s common stockholders’ equity, excluding the net unrealized investment gains (losses) and defined benefit plans adjustment components of AOCI, net of income tax.
Total MetLife, Inc.’s common stockholders’ equity, excluding total notable items (excludes AOCI other than FCTA): Total MetLife, Inc.’s common stockholders’ equity, excluding the net unrealized investment gains (losses), defined benefit plans adjustment components of AOCI and total notable items, net of income tax.
Return on MetLife, Inc.’s common stockholders’ equity: net income (loss) available to MetLife, Inc.’s common shareholders divided by MetLife, Inc.'s average common stockholders’ equity.
Adjusted return on MetLife, Inc.’s common stockholders’ equity: adjusted earnings available to common shareholders divided by MetLife, Inc.'s average common stockholders’ equity.
Adjusted return on MetLife, Inc.’s common stockholders’ equity, excluding AOCI other than FCTA: adjusted earnings available to common shareholders divided by MetLife, Inc.'s average common stockholders’ equity, excluding AOCI other than FCTA.
Adjusted return on MetLife, Inc.’s common stockholders’ equity, excluding total notable items (excludes AOCI other than FCTA): adjusted earnings available to common shareholders, excluding total notable items, divided by MetLife, Inc.'s average common stockholders’ equity, excluding total notable items (excludes AOCI other than FCTA).
Allocated equity: portion of MetLife, Inc.’s common stockholders’ equity that management allocates to each of its segments and sub-segments based on local capital requirements and economic capital. Economic capital is an internally developed risk capital model, the purpose of which is to measure the risk in the business and to provide a basis upon which capital is deployed. MetLife management periodically reviews this model to ensure that it remains consistent with emerging industry practice standards and the local capital requirements; allocated equity may be adjusted if warranted by such review. Allocated equity excludes the impact of AOCI other than FCTA.
Adjusted return on allocated equity: adjusted earnings available to common shareholders divided by allocated equity.
The above measures represent a level of equity consistent with the view that, in the ordinary course of business, we do not plan to sell most investments for the sole purpose of realizing gains or losses.
Total MetLife, Inc.’s tangible common stockholders’ equity or tangible equity: Total MetLife, Inc.’s common stockholders’ equity, excluding AOCI other than FCTA, reduced by the impact of goodwill, VODA and VOCRA, all net of income tax.
Adjusted return on MetLife, Inc.’s tangible common stockholders’ equity: adjusted earnings available to common shareholders, excluding amortization of VODA and VOCRA, net of income tax, divided by MetLife, Inc.’s average tangible common stockholders’ equity.
Allocated tangible equity: Allocated equity reduced by the impact of goodwill, VODA and VOCRA, all net of income tax.
Adjusted return on allocated tangible equity: adjusted earnings available to common shareholders, excluding amortization of VODA and VOCRA, net of income tax, divided by allocated tangible equity.
The above measures are, when considered in conjunction with regulatory capital ratios, a measure of capital adequacy.
Expense ratio, direct expense ratio, adjusted expense ratio and related measures
Expense ratio: other expenses, net of capitalization of DAC, divided by premiums, fees and other revenues.
Direct expense ratio: adjusted direct expenses divided by adjusted premiums, fees and other revenues.
Direct expense ratio, excluding total notable items related to direct expenses and PRT: adjusted direct expenses, excluding total notable items related to direct expenses, divided by adjusted premiums, fees and other revenues, excluding PRT.
Adjusted expense ratio: adjusted other expenses, net of adjusted capitalization of DAC, divided by adjusted premiums, fees and other revenues.
Adjusted expense ratio, excluding total notable items related to adjusted other expenses and PRT: adjusted other expenses, net of adjusted capitalization of DAC, excluding total notable items related to adjusted other expenses, divided by adjusted premiums, fees and other revenues, excluding PRT.
Asia general account assets under management and related measures
Asia GA AUM is used by MetLife to describe assets in its Asia GA investment portfolio which are actively managed and stated at estimated fair value. Asia GA AUM is comprised of Asia GA total investments and cash and cash equivalents, excluding policy loans, contractholder-directed equity securities, fair value option securities and certain other invested assets, as substantially all of these assets are not actively managed in MetLife’s Asia GA investment portfolio. Mortgage loans (including commercial, agricultural and residential) and real estate equity (including real estate and real estate joint ventures) included in Asia GA AUM (at net asset value, net of deduction for encumbering debt) have been adjusted from carrying value to estimated fair value. At the segment level, intersegment balances (intercompany activity, primarily related to investments in subsidiaries, that eliminate at the MetLife consolidated level) are excluded from Asia GA AUM.

Asia GA AUM (at amortized cost) excludes the following adjustments: (i) unrealized gain (loss) on investments carried at estimated fair value and (ii) adjustments from carrying value to estimated fair value on mortgage loans (including commercial, agricultural and residential) and real estate and real estate joint ventures. Asia GA AUM (at amortized cost) is presented net of related allowance for credit loss.
Other items
The following additional information is relevant to an understanding of our performance results:
Statistical sales information for Latin America, Asia and EMEA: calculated using 10% of single-premium deposits (mainly from retirement products such as variable annuity, fixed annuity and pensions), 20% of single-premium deposits from credit insurance and 100% of annualized full-year premiums and fees from recurring-premium policy sales of all products (mainly from risk and protection products such as individual life, accident & health and group). Sales statistics do not correspond to revenues under GAAP, but are used as relevant measures of business activity.
A-8

Table of Contents
image2a32a.jpg
METLIFE
ACRONYMS
 
AOCIAccumulated other comprehensive income (loss)
DACDeferred policy acquisition costs
EMEAEurope, the Middle East and Africa
FCTAForeign currency translation adjustments
GAGeneral account
GA AUMGeneral account assets under management
GAAPAccounting principles generally accepted in the United States of America
GICsGuaranteed interest contracts
GMIBGuaranteed minimum income benefits
NAICNational Association of Insurance Commissioners
NDGLNet derivative gains (losses)
NIGLNet investment gains (losses)
NRSRONationally Recognized Statistical Rating Organization
PABPolicyholder account balances
PBCPolicyholder benefits and claims
PDOPolicyholder dividend obligation
PRTPension risk transfers
QFSQuarterly financial supplement
TSATransition service agreement
VIEVariable interest entity
VOBAValue of business acquired
VOCRAValue of customer relationships acquired
VODAValue of distribution agreements
A-9

Table of Contents

imagk06.jpg
navigatinglifetogethera04a.jpg

3Q22 Supplemental Slides1 John McCallion Chief Financial Officer Exhibit 99.3 1 These slides highlight information in MetLife, Inc.'s earnings release, quarterly financial supplement and other prior public disclosures.


2 Table of contents Topic Page No. Net income (loss) to adjusted earnings 3 Actuarial assumption review & other insurance adjustments 4 Adjusted earnings, ex. total notable items, by segment 5 Variable investment income (VII) 6 Direct expense ratio 8 Value of new business (VNB) 9 Cash & capital 10 Appendix 11


3 Net income (loss) to adjusted earnings 3Q22 (post-tax) $ in millions $ per share1 Net Income (Loss) $331 $0.41 Less: Net Investment Gains (Losses) (327) (0.41) Net Derivative Gains (Losses)2 (106) (0.13) Investment Hedge Adjustments (199) (0.25) Actuarial Assumption Review2,3 20 0.02 Other2 (23) (0.03) Adjusted Earnings $966 $1.21 Less Notable Items: Actuarial Assumption Review3 34 0.04 Adjusted Earnings ex. Total Notable Items $932 $1.16 1 The per share data for each item is calculated on a standalone basis and may not sum to the total. 2 The Actuarial Assumption Review line item reflecting $20 million of after-tax gains includes $273 million after-tax derivative losses and $293 million of other after-tax gains. These amounts are therefore not included in the Net Derivative Gains (Losses) or Other line items. 3 Includes other insurance adjustments.


4 3Q22 actuarial assumption review & other insurance adjustments ($ in millions - post-tax) Adjusted Earnings Non-Adjusted Earnings Net Income RIS1 $91 — $91 Asia 23 5 28 Latin America 7 — 7 EMEA 4 (2) 2 MetLife Holdings (91) 17 (74) Total $34 $20 $54 Total per Share2 $0.04 $0.02 $0.07 Impact Highlights • MLH: Unfavorable impacts in Annuities partially offset by positive impacts in Life – Annuities: Lowered variable annuity annuitization and lapse assumptions – Life: Higher earned rates and favorable mortality • RIS: Reinsurance recapture gain • U.S. mean reversion interest rate unchanged at 2.75% • Maintained our long-term mortality assumptions 1 Retirement and Income Solutions. 2 The per share data for each item is calculated on a standalone basis and may not sum to the total.


5 ($ in millions - post-tax) 3Q22 3Q21 % Change % Change (Constant Rate) Key Drivers1 Favorable Unfavorable Group Benefits $399 $111 259% Underwriting Margins; Volume Growth Expense Margins; Investment Margins Retirement and Income Solutions 254 784 (68%) Volume Growth Investment Margins; Underwriting Margins U.S. 653 895 (27%) Asia 174 648 (73%) (73%) Volume Growth Investment Margins; Underwriting Margins Latin America 164 31 NM2 NM2 Underwriting Margins; Volume Growth EMEA 56 100 (44%) (31%) Underwriting Margins MetLife Holdings 150 659 (77%) Underwriting Margins Investment Margins; Equity Markets Corporate & Other (265) (131) Taxes; Investment Margins; Expenses Adjusted Earnings ex. Total Notable Items $932 $2,202 (58%) (57%) Adjusted EPS ex. Total Notable Items $1.16 $2.56 (55%) (54%) Adjusted earnings, ex. total notable items, by segment 1 To be discussed on MetLife, Inc.'s third quarter 2022 earnings conference call and audio webcast. 2 Not Meaningful.


6 $1,789 $1,269 $1,185 $389 ($53) 3Q21 4Q21 1Q22 2Q22 3Q22 3Q22 VII driven by negative private equity returns1 ($ in millions - pre-tax) Private Equity Other 1 Quarterly VII range of $450 million - $500 million, based on full year 2022 guidance range of $1.8 - $2.0 billion. ($53) $0


7 ($ in millions - post-tax1) 3Q21 4Q21 1Q22 2Q22 3Q22 Group Benefits $17 $17 $12 $7 $(1) Retirement and Income Solutions 449 324 277 75 (35) U.S. 466 341 289 82 (36) Asia 373 307 288 101 (18) Latin America 22 17 16 16 — EMEA — — — — — MetLife Holdings 487 266 208 85 (21) Corporate & Other 65 72 135 23 33 Total Variable Investment Income $1,413 $1,003 $936 $307 $(42) 1 Assumes a 21% U.S. statutory tax rate. VII by segment


8 11.1% 12.9% 11.7% 11.9% 12.3% 3Q21 4Q21 1Q22 2Q22 3Q22 1 Direct expense ratio, excluding total notable items related to direct expenses and pension risk transfers. 12.3% Target 3Q22 direct expense ratio1 of 12.3% in line with target


9 Value of new business1 $3.1 $3.8 $3.8 $3.2 $2.8 $1.3 $2.1 $1.8 $1.9 $1.9 Capital Deployed Value of New Business 2017 2018 2019 2020 2021 ($ in billions) Internal Rate of Return Payback Period 15% 7 Years 15% 7 Years 17% 6 Years 14% 7 Years 1 Excludes MetLife Holdings; Value of New Business is the present value of future profits net of the cost of capital and time value of guarantees from new sales. 17% 6 Years


10 Holding Company Cash1 $5.1 $5.4 $4.2 $4.5 $5.2 3Q21 4Q21 1Q22 2Q22 3Q22 Cash & capital 1 Includes cash and liquid assets at MetLife, Inc. and other holding companies at quarter-end. 2 Includes MetLife, Inc.'s principal U.S. insurance subsidiaries, excluding American Life Insurance Company for both periods. 3 Solvency ratio of MetLife's insurance subsidiary in Japan, which is calculated quarterly and does not reflect conditions and factors occurring after June 30, 2022. $3.0B to $4.0B Cash Buffer Capital • Share repurchases of ~ $0.7 billion in 3Q22 – $0.2 billion shares repurchased in October 2022 • Expected total U.S. Statutory Adjusted Capital2 of $18.7 billion at 9/30/22, down 2% sequentially • Japan Solvency Margin ratio3 of 617% at 6/30/22 ($ in billions)


Appendix


12 Group Benefits underwriting impacted by COVID-19 mortality 1 Results are derived from insurance and non-administrative services-only contracts. 2 Excludes certain experience-rated contracts and includes accidental death and dismemberment. 3 COVID-19 reported deaths. 4 Includes an IBNR release related to COVID-19 claims of roughly 1.5 points benefit to the mortality ratio or approximately $25 million benefit to adjusted earnings for each of 1Q22 and 2Q22. Group Benefits Adjusted Earnings 106.2% 106.3% 103.8% 85.8% 86.0% Ratio (as reported) Ratio ex. COVID-19 3Q 2021 4Q 2021 1Q 2022 2Q 2022 3Q 2022 85.0% 90.0% 95.0% 100.0% 105.0% 110.0% Group Life Mortality Ratio1,2 3Q22 Highlights COVID-19 Impact to Adjusted Earnings (~$290M) (~$300M) $111M $20M COVID-19 Impact on Ratio3 85-90% target range • COVID-19 life claims remain low • Minimal non-COVID-19 excess mortality ~18 pts ~18 pts $112M (~$230M) ~14 pts $400M (~$10M)4 ~1 pt4 $399M (~$10M)4 ~1 pt4


13 Cautionary Statement on Forward-Looking Statements The forward-looking statements in this presentation, using words such as “anticipate,” “assume,” “believe,” “continue,” “could,” “estimate,” “expect,” “if,” “intend,” “likely,” “may,” “plan,” “potential,” “project,” “should,” “will,” and “would,” are based on assumptions and expectations that involve risks and uncertainties, including the “Risk Factors” MetLife, Inc. describes in its U.S. Securities and Exchange Commission filings. MetLife’s future results could differ, and it does not undertake any obligation to publicly correct or update any of these statements.


14 Explanatory Note on Non-GAAP and Other Financial Information Any references in this presentation (except in this Explanatory Note on Non-GAAP Financial Information and Reconciliations) to: Should be read as, respectively: (i) net income (loss); (i) net income (loss) available to MetLife, Inc.’s common shareholders; (ii) net income (loss) per share; (ii) net income (loss) available to MetLife, Inc.’s common shareholders per diluted common share; (iii) adjusted earnings; (iii) adjusted earnings available to common shareholders; (iv) adjusted earnings per share; (iv) adjusted earnings available to common shareholders per diluted common share; (v) book value per share; and (v) book value per common share; and (vi) book value per share, excluding AOCI other than FCTA. (vi) book value per common share, excluding AOCI other than FCTA. In this presentation, MetLife presents certain measures of its performance on a consolidated and segment basis that are not calculated in accordance with accounting principles generally accepted in the United States of America (GAAP). MetLife believes that these non-GAAP financial measures enhance the understanding for MetLife and its investors of MetLife's performance by highlighting the results of operations and the underlying profitability drivers of the business. Segment-specific financial measures are calculated using only the portion of consolidated results attributable to that specific segment.


15 Explanatory Note on Non-GAAP and Other Financial Information (Continued) The following non-GAAP financial measures should not be viewed as substitutes for the most directly comparable financial measures calculated in accordance with GAAP: Non-GAAP financial measures: Comparable GAAP financial measures: (i) adjusted premiums, fees and other revenues; (i) premiums, fees and other revenues; (ii) adjusted premiums, fees and other revenues, excluding pension risk transfers (PRT); (ii) premiums, fees and other revenues; (iii) adjusted capitalization of deferred policy acquisition costs (DAC); (iii) capitalization of DAC; (iv) adjusted earnings available to common shareholders; (iv) net income (loss) available to MetLife, Inc.’s common shareholders; (v) adjusted earnings available to common shareholders, excluding total notable items; (v) net income (loss) available to MetLife, Inc.’s common shareholders; (vi) adjusted earnings available to common shareholders per diluted common share; (vi) net income (loss) available to MetLife, Inc.’s common shareholders per diluted common share; (vii) adjusted earnings available to common shareholders, excluding total notable items, per diluted common share; (vii) net income (loss) available to MetLife, Inc.’s common shareholders per diluted common share; (viii) total MetLife, Inc.’s common stockholders’ equity, excluding AOCI other than FCTA; (viii) total MetLife, Inc.’s stockholders’ equity; (ix) book value per common share, excluding AOCI other than FCTA; (ix) book value per common share; (x) adjusted other expenses; (x) other expenses; (xi) adjusted other expenses, net of adjusted capitalization of DAC; (xi) other expenses, net of capitalization of DAC; (xii) adjusted other expenses, net of adjusted capitalization of DAC, excluding total notable items related to adjusted other expenses; (xii) other expenses, net of capitalization of DAC; (xiii) adjusted expense ratio; (xiii) expense ratio; (xiv) adjusted expense ratio, excluding total notable items related to adjusted other expenses and PRT; (xiv) expense ratio; (xv) direct expenses; (xv) other expenses; (xvi) direct expenses, excluding total notable items related to direct expenses; (xvi) other expenses; (xvii) direct expense ratio; and (xvii) expense ratio; and (xviii) direct expense ratio, excluding total notable items related to direct expenses and PRT. (xviii) expense ratio.


16 Any of these financial measures shown on a constant currency basis reflect the impact of changes in foreign currency exchange rates and are calculated using the average foreign currency exchange rates for the most recent period and applied to the comparable prior period. Reconciliations of these non-GAAP financial measures to the most directly comparable GAAP financial measures are included in this presentation and in this period’s quarterly financial supplement and earnings news release, which are available at www.metlife.com. Reconciliations of these non-GAAP measures to the most directly comparable GAAP measures are not accessible on a forward-looking basis because we believe it is not possible without unreasonable effort to provide other than a range of net investment gains and losses and net derivative gains and losses, which can fluctuate significantly within or outside the range and from period to period and may have a material impact on net income. MetLife’s definitions of non-GAAP and other financial measures discussed in this presentation may differ from those used by other companies: Adjusted earnings and related measures • adjusted earnings; • adjusted earnings available to common shareholders; • adjusted earnings available to common shareholders on a constant currency basis; • adjusted earnings available to common shareholders, excluding total notable items; • adjusted earnings available to common shareholders, excluding total notable items, on a constant currency basis; • adjusted earnings available to common shareholders per diluted common share; • adjusted earnings available to common shareholders on a constant currency basis per diluted common share; • adjusted earnings available to common shareholders, excluding total notable items per diluted common share; and • adjusted earnings available to common shareholders, excluding total notable items, on a constant currency basis per diluted common share. These measures are used by management to evaluate performance and allocate resources. Consistent with GAAP guidance for segment reporting, adjusted earnings and components of, or other financial measures based on, adjusted earnings are also MetLife’s GAAP measures of segment performance. Adjusted earnings and other financial measures based on adjusted earnings are also the measures by which MetLife senior management’s and many other employees’ performance is evaluated for the purposes of determining their compensation under applicable compensation plans. Adjusted earnings and other financial measures based on adjusted earnings allow analysis of MetLife's performance relative to its business plan and facilitate comparisons to industry results. Adjusted earnings is defined as adjusted revenues less adjusted expenses, net of income tax. Adjusted loss is defined as negative adjusted earnings. Adjusted earnings available to common shareholders is defined as adjusted earnings less preferred stock dividends. Adjusted revenues and adjusted expenses These financial measures, along with the related adjusted premiums, fees and other revenues, focus on our primary businesses principally by excluding the impact of market volatility, which could distort trends, and revenues and costs related to non- core products and certain entities required to be consolidated under GAAP. Also, these measures exclude results of discontinued operations under GAAP and other businesses that have been or will be sold or exited by MetLife but do not meet the discontinued operations criteria under GAAP (Divested businesses). Divested businesses also include the net impact of transactions with exited businesses that have been eliminated in consolidation under GAAP and costs relating to businesses that have been or will be sold or exited by MetLife that do not meet the criteria to be included in results of discontinued operations under GAAP. Adjusted revenues also excludes net investment gains (losses) (NIGL) and net derivative gains (losses) (NDGL). Adjusted expenses also excludes goodwill impairments. Explanatory Note on Non-GAAP and Other Financial Information (Continued)


17 Explanatory Note on Non-GAAP and Other Financial Information (Continued) The following additional adjustments are made to revenues, in the line items indicated, in calculating adjusted revenues: • Universal life and investment-type product policy fees excludes the amortization of unearned revenue related to NIGL and NDGL (Unearned revenue adjustments) and certain variable annuity guaranteed minimum income benefits (GMIB) fees (GMIB fees); • Net investment income: (i) includes adjustments for earned income on derivatives and amortization of premium on derivatives that are hedges of investments or that are used to replicate certain investments, but do not qualify for hedge accounting treatment (Investment hedge adjustments), (ii) excludes post-tax adjusted earnings adjustments relating to insurance joint ventures accounted for under the equity method, (iii) excludes certain amounts related to contractholder- directed equity securities, (iv) excludes certain amounts related to securitization entities that are variable interest entities (VIEs) consolidated under GAAP and (v) includes distributions of profits from certain other limited partnership interests that were previously accounted for under the cost method, but are now accounted for at estimated fair value, where the change in estimated fair value is recognized in NIGL under GAAP; and • Other revenues is adjusted for settlements of foreign currency earnings hedges and excludes fees received in association with services provided under transition service agreements (TSA fees). The following additional adjustments are made to expenses, in the line items indicated, in calculating adjusted expenses: • Policyholder benefits and claims and policyholder dividends excludes: (i) amortization of basis adjustments associated with de-designated fair value hedges of future policy benefits, (ii) changes in the policyholder dividend obligation related to NIGL and NDGL, (iii) inflation-indexed benefit adjustments associated with contracts backed by inflation-indexed investments and amounts associated with periodic crediting rate adjustments based on the total return of a contractually referenced pool of assets and other pass-through adjustments, (iv) benefits and hedging costs related to GMIBs (GMIB costs), and (v) market value adjustments associated with surrenders or terminations of contracts (Market value adjustments); • Interest credited to policyholder account balances includes adjustments for earned income on derivatives and amortization of premium on derivatives that are hedges of policyholder account balances but do not qualify for hedge accounting treatment and excludes certain amounts related to net investment income earned on contractholder-directed equity securities; • Amortization of DAC and value of business acquired (VOBA) excludes amounts related to: (i) NIGL and NDGL, (ii) GMIB fees and GMIB costs and (iii) Market value adjustments; • Amortization of negative VOBA excludes amounts related to Market value adjustments; • Interest expense on debt excludes certain amounts related to securitization entities that are VIEs consolidated under GAAP; and • Other expenses excludes: (i) noncontrolling interests, (ii) implementation of new insurance regulatory requirements costs (Regulatory implementation costs), and (iii) acquisition, integration and other costs. Other expenses includes TSA fees. Adjusted earnings also excludes the recognition of certain contingent assets and liabilities that could not be recognized at acquisition or adjusted for during the measurement period under GAAP business combination accounting guidance. The tax impact of the adjustments mentioned above are calculated net of the U.S. or foreign statutory tax rate, which could differ from MetLife's effective tax rate. Additionally, the provision for income tax (expense) benefit also includes the impact related to the timing of certain tax credits, as well as certain tax reforms. In addition, adjusted earnings available to common shareholders excludes the impact of preferred stock redemption premium, which is reported as a reduction to net income (loss) available to MetLife, Inc.’s common shareholders. Return on equity and related measures • Total MetLife, Inc.’s common stockholders’ equity, excluding AOCI other than FCTA: total MetLife, Inc.’s common stockholders’ equity, excluding the net unrealized investment gains (losses) and defined benefit plans adjustment components of AOCI, net of income tax. Expense ratio, direct expense ratio, adjusted expense ratio and related measures • Expense ratio: other expenses, net of capitalization of DAC, divided by premiums, fees and other revenues. • Direct expense ratio: adjusted direct expenses, divided by adjusted premiums, fees and other revenues. • Direct expense ratio, excluding total notable items related to direct expenses and PRT: adjusted direct expenses, excluding total notable items related to direct expenses, divided by adjusted premiums, fees and other revenues, excluding PRT. • Adjusted expense ratio: adjusted other expenses, net of adjusted capitalization of DAC, divided by adjusted premiums, fees and other revenues. • Adjusted expense ratio, excluding total notable items related to adjusted other expenses and PRT: adjusted other expenses, net of adjusted capitalization of DAC, excluding total notable items related to adjusted other expenses, divided by adjusted premiums, fees and other revenues, excluding PRT.


18 Explanatory Note on Non-GAAP and Other Financial Information (Continued) Statistical sales information: • U.S.: ◦ Group Benefits: calculated using 10% of single premium deposits and 100% of annualized full-year premiums and fees from recurring premium policy sales of all products. ◦ Retirement and Income Solutions: calculated using 10% of single premium deposits and 100% of annualized full-year premiums and fees only from recurring premium policy sales of specialized benefit resources and corporate- owned life insurance. • Latin America, Asia and EMEA: calculated using 10% of single-premium deposits (mainly from retirement products such as variable annuity, fixed annuity and pensions), 20% of single-premium deposits from credit insurance and 100% of annualized full-year premiums and fees from recurring-premium policy sales of all products (mainly from risk and protection products such as individual life, accident & health and group). Sales statistics do not correspond to revenues under GAAP, but are used as relevant measures of business activity. The following additional information is relevant to an understanding of MetLife’s performance results and outlook: • Volume growth, as discussed in the context of business growth, is the period over period percentage change in adjusted earnings available to common shareholders attributable to adjusted premiums, fees and other revenues and assets under management levels, applying a model in which certain margins and factors are held constant. The most significant of such items are underwriting margins, investment margins, changes in equity market performance, expense margins and the impact of changes in foreign currency exchange rates. • Notable items reflect the unexpected impact of events that affect MetLife’s results, but that were unknown and that MetLife could not anticipate when it devised its business plan. Notable items also include certain items regardless of the extent anticipated in the business plan, to help investors have a better understanding of MetLife's results and to evaluate and forecast those results. Notable items represent a positive (negative) impact to adjusted earnings available to common shareholders. • Holding company cash and liquid assets are held by MetLife, Inc. collectively with other MetLife holding companies and include cash and cash equivalents, short term investments and publicly traded securities excluding assets that are pledged or otherwise committed. Assets pledged or otherwise committed include amounts received in connection with securities lending, repurchase agreements, derivatives, regulatory deposits, the collateral financing arrangement, funding agreements and secured borrowings, as well as amounts held in the closed block. • Not Meaningful (NM) indicates a percentage change in a financial metric over a specified period of time and reflects changes in factors that are subject to volatility, and should not, accordingly be viewed as representative of a reasonable trend currently or in the future. For example, ($ in millions) Three months ended September 30, 2022 Three months ended September 30, 2021 Change Adjusted earnings excluding notables - Latin America $164 $31 429% Adjusted earnings excluding notables (constant currency) - Latin America $164 $21 681%


19 Reconciliation of Net Income (Loss) Available to MetLife, Inc.'s Common Shareholders to Adjusted Earnings Available to Common Shareholders 3Q22 3Q21 Earnings Per Weighted Average Common Share Diluted1 Earnings Per Weighted Average Common Share Diluted1 (In millions, except per share data) Net Income (loss) available to MetLife, Inc.'s common shareholders $ 331 $ 0.41 $ 1,521 $ 1.77 Adjustments from net income (loss) available to MetLife, Inc.'s common shareholders to adjusted earnings available to common shareholders: Less: Net investment gains (losses) (414) (0.52) (84) (0.10) Less: Net derivative gains (losses) (480) (0.60) (218) (0.25) Less: Other adjustments to net income (loss) (24) (0.03) (333) (0.37) Less: Provision for income tax (expense) benefit 288 0.36 99 0.11 Less: Income (loss) from discontinued operations, net of income tax — — — — Add: Net income (loss) attributable to noncontrolling interests 5 0.01 5 0.01 Add: Preferred stock redemption premium — — — 0.01 Adjusted earnings available to common shareholders 966 1.21 2,062 2.39 Less: Total notable items 34 0.04 (140) (0.16) Adjusted earnings available to common shareholders, excluding total notable items $ 932 $ 1.16 $ 2,202 $ 2.56 Adjusted earnings available to common shareholders on a constant currency basis $ 966 $ 1.21 $ 2,019 $ 2.34 Adjusted earnings available to common shareholders, excluding total notable items, on a $ 932 $ 1.16 $ 2,159 $ 2.51 constant currency basis Weighted average common shares outstanding - diluted 800.7 861.2 1Adjusted earnings available to common shareholders, excluding total notable items, per diluted common share is calculated on a standalone basis and may not equal (i) adjusted earnings available to common shareholders per diluted common share, less (ii) total notable items per diluted common share.


20 Reconciliation to Adjusted Earnings Available to Common Shareholders, Excluding Total Notable Items 3Q22 U.S.1 Group Benefits1 Retirement & Income Solutions1 Asia Latin America EMEA MetLife Holdings1 Corporate & Other1 (In millions) Adjusted earnings available to common shareholders $ 744 $ 399 $ 345 $ 197 $ 171 $ 60 $ 59 $ (265) Less: Total notable items 91 — 91 23 7 4 (91) — Adjusted earnings available to common shareholders, excluding total notable items $ 653 $ 399 $ 254 $ 174 $ 164 $ 56 $ 150 $ (265) Adjusted earnings available to common shareholders on a constant currency basis $ 197 $ 171 $ 60 Adjusted earnings available to common shareholders, excluding total notable items, on a constant currency basis $ 174 $ 164 $ 56 3Q21 U.S.1 Group Benefits1 Retirement & Income Solutions1 Asia Latin America EMEA MetLife Holdings1 Corporate & Other1 (In millions) Adjusted earnings available to common shareholders $ 895 $ 111 $ 784 $ 569 $ 29 $ 94 $ 606 $ (131) Less: Total notable items — — — (79) (2) (6) (53) — Adjusted earnings available to common shareholders, excluding total notable items $ 895 $ 111 $ 784 $ 648 $ 31 $ 100 $ 659 $ (131) Adjusted earnings available to common shareholders on a constant currency basis $ 555 $ 19 $ 75 Adjusted earnings available to common shareholders, excluding total notable items, on a constant currency basis $ 634 $ 21 $ 81 1Results on a constant currency basis are not included as constant currency impact is not significant.


21 Expense Detail and Ratios (In millions, except ratio data) 3Q21 4Q21 1Q22 2Q22 3Q22 Reconciliation of Capitalization of DAC to Adjusted Capitalization of DAC Capitalization of DAC $ (635) $ (666) $ (650) $ (622) $ (615) Less: Divested businesses (15) (15) (11) — — Adjusted capitalization of DAC $ (620) $ (651) $ (639) $ (622) $ (615) Reconciliation of Other Expenses to Adjusted Other Expenses Other expenses $ 2,869 $ 3,110 $ 2,917 $ 2,873 $ 2,893 Less: Noncontrolling interests (7) (9) (7) (4) (8) Less: Regulatory implementation costs — 1 — 2 1 Less: Acquisition, integration and other costs 2 (1) 7 13 14 Less: TSA fees 73 53 47 48 40 Less: Divested businesses 41 81 32 8 13 Adjusted other expenses $ 2,760 $ 2,985 $ 2,838 $ 2,806 $ 2,833 Other Detail and Ratios Other expenses $ 2,869 $ 3,110 $ 2,917 $ 2,873 $ 2,893 Capitalization of DAC (635) (666) (650) (622) (615) Other expenses, net of capitalization of DAC $ 2,234 $ 2,444 $ 2,267 $ 2,251 $ 2,278 Premiums, fees and other revenues $ 11,639 $ 15,178 $ 12,849 $ 13,853 $ 19,579 Expense ratio 19.2 % 16.1 % 17.6 % 16.2 % 11.6 % Direct expenses $ 1,266 $ 1,483 $ 1,337 $ 1,341 $ 1,360 Less: Total notable items related to direct expenses — — — — — Direct expenses, excluding total notable items related to direct expenses $ 1,266 $ 1,483 $ 1,337 $ 1,341 $ 1,360 Adjusted other expenses $ 2,760 $ 2,985 $ 2,838 $ 2,806 $ 2,833 Adjusted capitalization of DAC (620) (651) (639) (622) (615) Adjusted other expenses, net of adjusted capitalization of DAC $ 2,140 $ 2,334 $ 2,199 $ 2,184 $ 2,218 Less: Total notable items related to adjusted other expenses — — — — — Adjusted other expenses, net of adjusted capitalization of DAC, excluding total notable items related to adjusted other expenses $ 2,140 $ 2,334 $ 2,199 $ 2,184 $ 2,218 Adjusted premiums, fees and other revenues $ 11,419 $ 15,010 $ 12,732 $ 13,794 $ 19,527 Less: PRT (24) 3,551 1,258 2,564 8,466 Adjusted premiums, fees and other revenues, excluding PRT $ 11,443 $ 11,459 $ 11,474 $ 11,230 $ 11,061 Direct expense ratio 11.1 % 9.9 % 10.5 % 9.7 % 7.0 % Direct expense ratio, excluding total notable items related to direct expenses and PRT 11.1 % 12.9 % 11.7 % 11.9 % 12.3 % Adjusted expense ratio 18.7 % 15.5 % 17.3 % 15.8 % 11.4 % Adjusted expense ratio, excluding total notable items related to adjusted other expenses and PRT 18.7 % 20.4 % 19.2 % 19.4 % 20.1 %


22 Premiums, Fees and Other Revenues 3Q21 4Q21 1Q22 2Q22 3Q22 Total Company - Premiums, Fees and Other Revenues (In millions) Premiums, fees and other revenues $ 11,639 $ 15,178 $ 12,849 $ 13,853 $ 19,579 Less: Unearned revenue adjustments 46 13 (8) (11) (9) Less: GMIB fees 25 24 23 22 21 Less: TSA fees 73 53 47 48 40 Less: Divested businesses 76 78 55 — — Adjusted premiums, fees and other revenues $ 11,419 $ 15,010 $ 12,732 $ 13,794 $ 19,527


23