
mgy-20220216
0001698990false00016989902022-02-162022-02-16

UNITED STATES
SECURITIES AND EXCHANGE COMMISSION
Washington, D.C. 20549
FORM 8-K
CURRENT REPORT
Pursuant to Section 13 or 15(d)
of the Securities Exchange Act of 1934
Date of report (Date of earliest event reported): February 16, 2022
Magnolia Oil & Gas Corporation
(Exact name of registrant as specified in its charter)
Delaware001-3808381-5365682
(State or other jurisdiction
of incorporation)
(Commission
File Number)
(I.R.S. Employer
Identification Number)
Nine Greenway Plaza, Suite 1300
Houston, Texas 77046
(Address of principal executive offices, including zip code)
(713) 842-9050
Registrant’s telephone number, including area code
Check the appropriate box below if the Form 8-K filing is intended to simultaneously satisfy the filing obligation of the registrant under any of the following provisions:
Written communications pursuant to Rule 425 under the Securities Act (17 CFR 230.425)
Soliciting material pursuant to Rule 14a-12 under the Exchange Act (17 CFR 240.14a-12)
Pre-commencement communications pursuant to Rule 14d-2(b) under the Exchange Act (17 CFR 240.14d-2(b))
Pre-commencement communications pursuant to Rule 13e-4(c) under the Exchange Act (17 CFR 240.13e-4(c))
Indicate by check mark whether the registrant is an emerging growth company as defined in Rule 405 of the Securities Act of 1933 (§230.405 of this chapter) or Rule 12b-2 of the Securities Exchange Act of 1934 (§240.12b-2 of this chapter).
Emerging growth company
If an emerging growth company, indicate by check mark if the registrant has elected not to use the extended transition period for complying with any new or revised financial accounting standards provided pursuant to Section 13(a) of the Exchange Act. ☐
Securities registered pursuant to section 12(b) of the Act:
Title of each classTrading Symbol(s)Name of each exchange on which registered
Class A Common Stock, par value $0.0001 Per ShareMGYNew York Stock Exchange


Item 2.02    Results of Operations and Financial Condition.

On February 16, 2022, Magnolia Oil & Gas Corporation (the “Company”) issued a press release, a copy of which is attached hereto as Exhibit 99.1 and incorporated by reference herein, announcing its financial and operational results for the fourth quarter and full-year ended December 31, 2021.
The information furnished pursuant to this Item 2.02 (including Exhibit 99.1) shall not be deemed to be “filed” for the purposes of Section 18 of the Securities Exchange Act of 1934, as amended (the “Exchange Act”), or otherwise be subject to the liabilities of that section, nor shall it be deemed to be incorporated by reference into any filing under the Securities Act of 1933, as amended (the “Securities Act”), or the Exchange Act.

Item 7.01    Regulation FD Disclosure

On February 16, 2022, the Company provided information in an earnings presentation on its website, www.magnoliaoilgas.com, regarding its financial and operational results for the fourth quarter and full-year ended December 31, 2021.
The earnings presentation, which is attached hereto as Exhibit 99.2, is being furnished and shall not be deemed to be “filed” for purposes of Section 18 of the Exchange Act, or otherwise be subject to the liabilities of that section, nor shall it be deemed to be incorporated by reference into any filing under the Securities Act or the Exchange Act.

Item 9.01    Financial Statements and Exhibits.
(d)    Exhibits.
Exhibit
NumberDescription
99.1
99.2
104Cover Page Interactive Data File (formatted as inline XBRL)


SIGNATURES
Pursuant to the requirements of the Securities Exchange Act of 1934, the registrant has duly caused this report to be signed on its behalf by the undersigned hereunto duly authorized.
MAGNOLIA OIL & GAS CORPORATION
Date: February 16, 2022
By:       /s/ Timothy D. Yang
Name:  Timothy D. Yang
Title:    Executive Vice President,
             General Counsel and Corporate Secretary

2
Exhibit 99.1
Magnolia Oil & Gas Corporation Announces 2021 Fourth Quarter and Year-End Results

HOUSTON, TX, February 16, 2022 - Magnolia Oil & Gas Corporation (“Magnolia,” “we,” “our,” or the “Company”) (NYSE: MGY) today announced its financial and operational results for the fourth quarter and full year 2021.

Fourth Quarter Summary Financial Results:
(In millions, except per share data)For the
Quarter Ended
December 31, 2021
For the
Year Ended
December 31, 2021
Production (Mboe/d)69.4 66.0 
Net income$192.1 $559.7 
Diluted earnings per share0.82 2.36 
Adjusted EBITDAX(1)
260.6 828.9 
Capital expenditures - D&C72.1 231.9 
Cash balance$367.0 $367.0 
Diluted weighted average total shares outstanding(2)
231.0 239.3 

Fourth Quarter and Full Year 2021 Highlights:
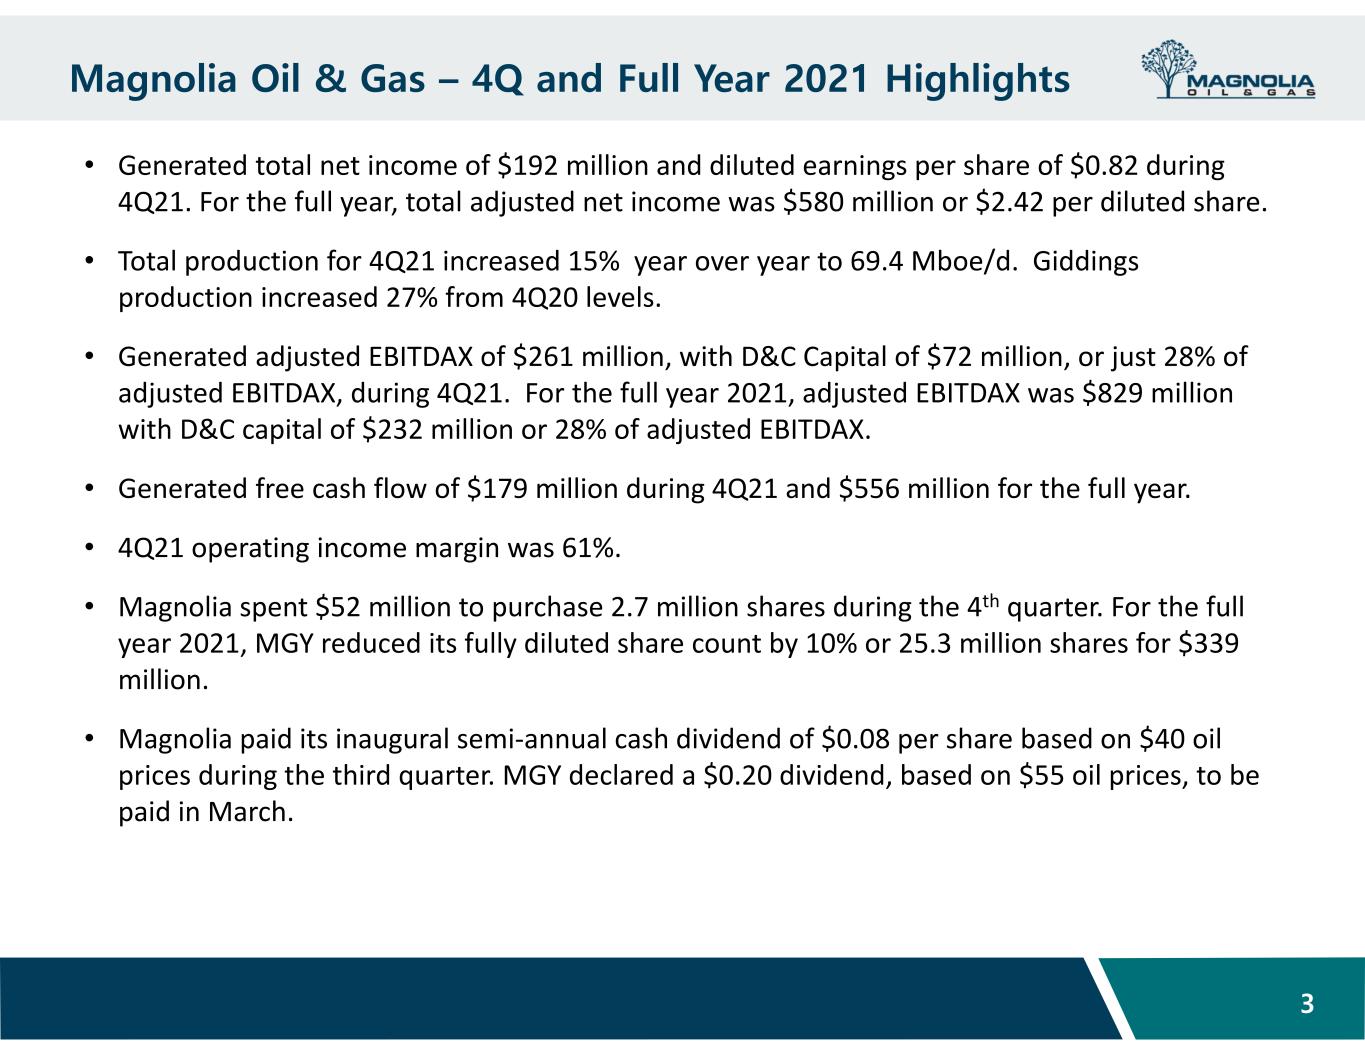
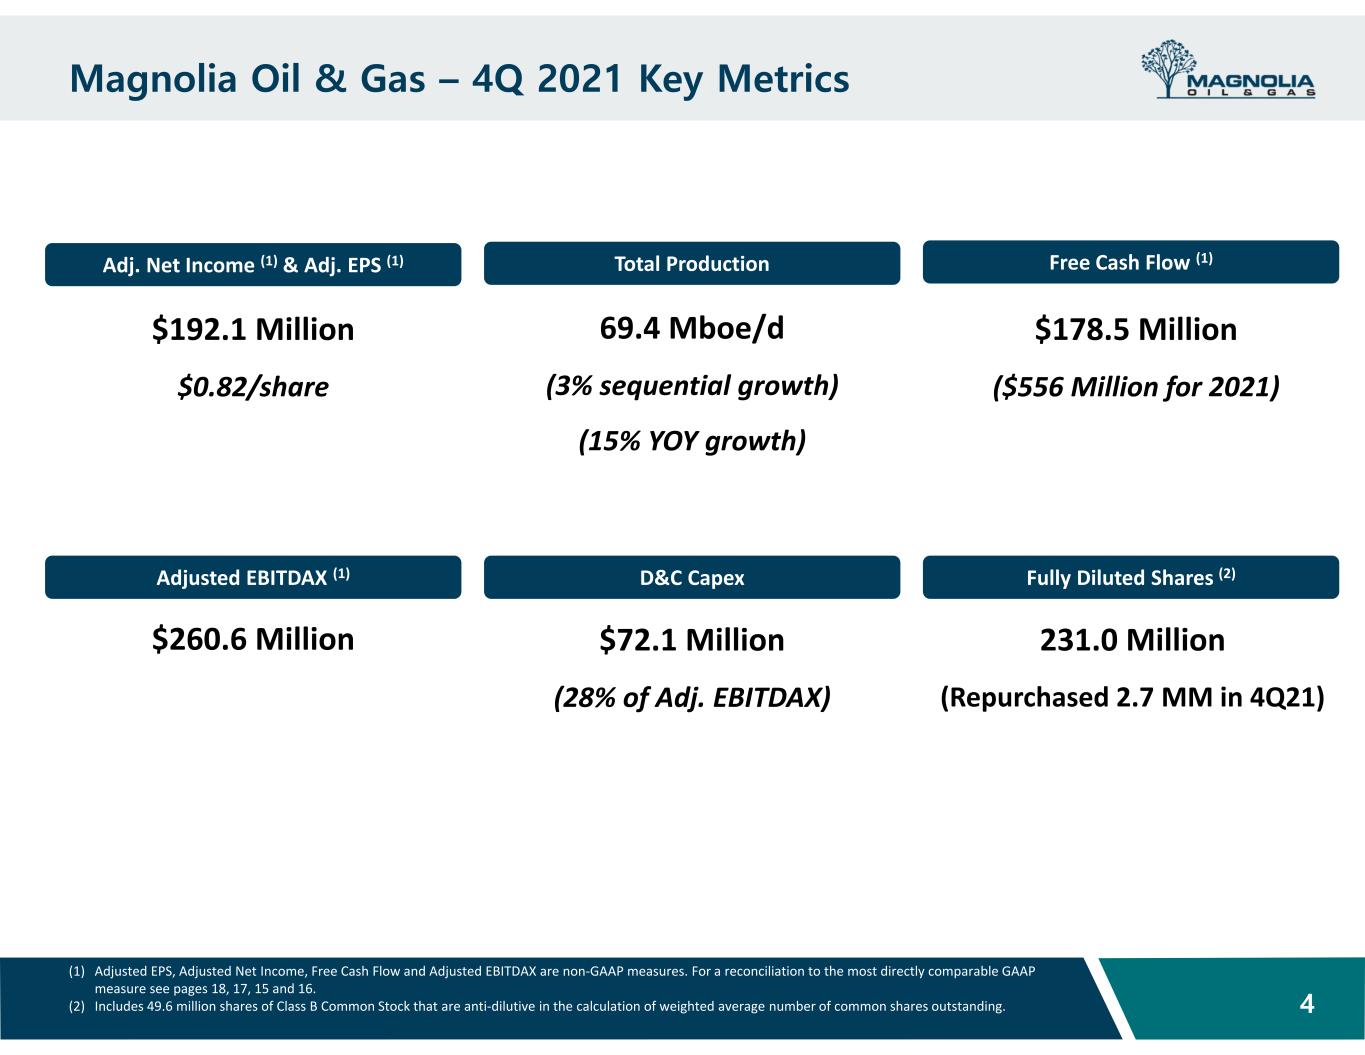
Magnolia reported fourth quarter and full-year 2021 net income attributable to Class A Common Stock of $150.2 million, or $0.82 per diluted share, and $417.3 million or $2.36 per diluted share, respectively. Fourth quarter and full-year 2021 total net income was $192.1 million and $559.7 million, respectively.
Adjusted EBITDAX was $260.6 million during the fourth quarter of 2021, with drilling and completions (“D&C”) capital of $72.1 million, representing just 28% of quarterly adjusted EBITDAX. Adjusted EBITDAX for the full-year 2021 was $828.9 million with total D&C capital of $231.9 million, also representing 28% of adjusted EBITDAX, and well below our annual spending limit of 55% of EBITDAX.
Net cash provided by operating activities was $260.5 million during the fourth quarter and $788.5 million during full-year 2021. The Company generated free cash flow(1) of $178.5 million during the fourth quarter and $555.9 million during full-year 2021.
Total production in the fourth quarter of 2021 grew 15% from the fourth quarter of 2020 to 69.4 thousand barrels of oil equivalent per day (“Mboe/d”). Production for full-year 2021 averaged 66.0 Mboe/d representing year-over-year volume growth of 7%.
Production at Giddings and Other in the fourth quarter of 2021 grew 27% compared to the prior year fourth quarter to 36.0 Mboe/d including year-over-year oil production growth of more than 40%. This was accomplished with asset level D&C spending of around 35% of asset level adjusted EBITDAX, leading to significant free cash flow generation at Giddings. We continue to achieve further operational efficiencies at Giddings including an increase in drilling feet per day, fewer drilling days per well, and an improvement in stimulation stages per day.
Magnolia added 31.0 MMboe of proved developed reserves, excluding acquisitions and price-related revisions, representing the reserve additions from our 2021 drilling program. These proved developed additions provide an organic proved developed Finding & Development (“F&D”) cost of $7.48/boe(3).
Magnolia repurchased 2.7 million shares during the fourth quarter, reducing the Company’s total diluted shares outstanding by 25.3 million shares(4) or approximately 10% compared to the prior year. Magnolia’s board recently increased the existing share repurchase authorization by an additional 10 million with 15.8 million Class A Common shares remaining on the current authorization. This action accommodates our ongoing share repurchase plan during the year and is specifically allocated toward open market repurchases.


(1) Adjusted EBITDAX, and free cash flow are non-GAAP financial measures. For reconciliations to the most comparable GAAP measures, please see “Non-GAAP Financial Measures” at the end of this press release.
(2) Weighted average total shares outstanding include diluted weighted average shares of Class A Common Stock outstanding during the period and shares of Class B Common Stock, which are anti-dilutive in the calculation of weighted average number of common shares outstanding.
(3) Organic F&D costs per boe means total costs incurred as defined by GAAP excluding property acquisition costs, exploration expenses and asset retirement obligation costs divided by the summation of annual proved developed reserves, on a boe basis, attributable to extensions, revisions of previous estimates (excluding price revisions) and transfers from proved undeveloped reserves at year-end 2021.
(4) Includes 3.6 million non-compete shares that were paid in cash in lieu of stock.
1


Together with the initiation of a dividend payment and our share reduction efforts, Magnolia returned $358 million to its shareholders last year or approximately 65% of full-year 2021 free cash flow and ended the year with $367 million of cash on the balance sheet. The Company remains undrawn on its $450.0 million revolving credit facility, with no debt maturities until 2026 and has no plans to increase its debt levels.
Magnolia’s board recently declared its final semi-annual dividend for 2021 of $0.20 a share payable on March 1, 2022. This final payment is based on Magnolia’s full-year 2021 financial results recast using oil prices of $55 per barrel.

“2021 was a defining year for Magnolia,” said Chairman, President and CEO Steve Chazen. “We achieved several new company records including EBIT margins and earnings per share. We also initiated our first dividend payment during the year and were able to significantly reduce our share count. Perhaps our greatest accomplishment for the year was moving our Giddings asset into full development. The positioning of Giddings toward full development provided a significant improvement in operating efficiencies which resulted in lower overall capital required to grow our total company production. We spent just 28 percent of our EBITDAX on drilling and completing wells, which resulted in year-over-year production growth of 7 percent.

“Our disciplined capital spending and our team’s continued focus on managing our costs provided strong pre-tax margins and generated significant free cash flow. During the year, we returned approximately 65 percent of our free cash flow to our shareholders in the form of significant share repurchases and our dividend. We repurchased more than 25 million shares reducing our diluted share count by 10 percent. Notwithstanding the significant return of cash to shareholders, our year-end cash balance nearly doubled from the prior year resulting in zero net debt.

“Our plan for 2022 is expected to build on many of last year’s achievements. After adding a second drilling rig during mid-2021, we plan to continue to operate a two-rig drilling program which we expect to generate high single digit full-year production growth. While we continue to limit our capital spending to 55 percent of EBITDAX, our spending percentage would be well-below this level in the current product price environment, providing significant free cash flow. We expect that our free cash flow would be allocated toward areas that would improve the per share value of the company including small, accretive bolt-on oil and gas property acquisitions and repurchasing at least 1 percent of our outstanding shares per quarter. So far this year, we have repurchased 2 million shares. The combination of organic production growth and share reduction is supportive of a growing dividend and Magnolia’s double-digit return investment proposition.”

Operational Update

Fourth quarter total company production averaged 69.4 Mboe/d, a 3% sequential increase from third quarter levels and growth of 15% from the prior year’s fourth quarter. Production grew during the quarter despite spending only 28% of adjusted EBITDAX on drilling and completing wells. Fourth quarter 2021 turn-in lines were more weighted to the Karnes area which resulted in a sequential quarterly production increase of 9% to 33.4 Mboe/d. Giddings and Other production averaged 36.0 Mboe/d which increased 27% from the prior year quarter.

Magnolia continues to operate two drilling rigs and plans to maintain this level of activity for the balance of the year. One rig will continue to drill multi-well development pads in our Giddings area consisting primarily of wells with greater than 7,000-foot laterals and with four wells per pad. The second rig will drill a mix of wells in both the Karnes and Giddings areas, including some appraisal wells in Giddings.

2021 Oil and Gas Reserves Replacement and F&D Costs

Magnolia’s total proved developed reserves at year-end 2021 were 109.8 MMboe. Excluding acquisitions and price related revisions, the company added 31.0 MMboe of proved developed reserves during the year. Total costs incurred excluding property acquisition costs, exploration expenses and asset retirement obligation costs were $231.9 million in 2021 resulting in organic proved developed F&D costs of $7.48 per boe.

Total 2021 proved reserves increased to 135.4 MMboe from 112.3 MMboe at year end 2020 and replaced 196%(5) of 2021 production. Magnolia books only one year of proved undeveloped reserves and as a result, 81% of its 2021 proved reserves were developed. The proved undeveloped reserves represent what we expect to convert to proved developed producing during 2022.


(5) Calculated as the sum of the 2021 change in total proved reserves of 23.1 MMboe and 2021 production of 24.1 MMboe divided by 2021 production.
2


Additional Guidance

Based on our 2-rig drilling plan for full-year 2022, we estimate our D&C capital to be approximately $350 million which is expected to deliver high single-digit, year-over-year production growth. Non-operated capital is expected to be similar to last year’s level. Most of the growth is expected to come from our development program at Giddings, with production at the field expected to average about 40 Mboe/d during the year. Within the current product price environment, we would expect that our full-year 2022 D&C spending to be well-below our limit of 55% of EBITDAX.

For the first quarter of 2022, we expect our D&C capital to be in the range of $85 to $90 million and total production to be approximately 70 to 72 Mboe/d. Oil price differentials are anticipated to be approximately a $3 per barrel discount to Magellan East Houston and Magnolia remains completely unhedged for all its oil and natural gas production. The fully diluted share count for the first quarter of 2022 is expected to be approximately 228 million shares which is 9 percent lower than first quarter 2021 levels.

Annual Report on Form 10-K

Magnolia's financial statements and related footnotes will be available in its Annual Report on Form 10-K for the year ended December 31, 2021, which is expected to be filed with the U.S. Securities and Exchange Commission (“SEC”) on February 17, 2022.
3


Conference Call and Webcast

Magnolia will host an investor conference call on Thursday, February 17, 2021 at 9:00 a.m. Central (10:00 a.m. Eastern) to discuss these operating and financial results. Interested parties may join the webcast by visiting Magnolia's website at www.magnoliaoilgas.com/investors/events-and-presentations and clicking on the webcast link or by dialing 1-844-701-1059. A replay of the webcast will be posted on Magnolia's website following completion of the call.


About Magnolia Oil & Gas Corporation

Magnolia (MGY) is a publicly traded oil and gas exploration and production company with operations primarily in South Texas in the core of the Eagle Ford Shale and Austin Chalk formations. Magnolia focuses on generating value for shareholders through steady production growth, strong pre-tax margins, and free cash flow. For more information, visit www.magnoliaoilgas.com.


Cautionary Note Regarding Forward-Looking Statements

The information in this press release includes forward-looking statements within the meaning of Section 27A of the Securities Act of 1933, as amended, and Section 21E of the Securities Exchange Act of 1934, as amended. All statements, other than statements of present or historical fact included in this press release, regarding Magnolia’s strategy, future operations, financial position, estimated revenues and losses, projected costs, prospects, plans and objectives of management are forward looking statements. When used in this press release, the words could, should, will, may, believe, anticipate, intend, estimate, expect, project, the negative of such terms and other similar expressions are intended to identify forward-looking statements, although not all forward-looking statements contain such identifying words. These forward-looking statements are based on management’s current expectations and assumptions about future events. Except as otherwise required by applicable law, Magnolia disclaims any duty to update any forward-looking statements, all of which are expressly qualified by the statements in this section, to reflect events or circumstances after the date of this press release. Magnolia cautions you that these forward-looking statements are subject to all of the risks and uncertainties, most of which are difficult to predict and many of which are beyond the control of Magnolia, incident to the development, production, gathering and sale of oil, natural gas and natural gas liquids. In addition, Magnolia cautions you that the forward looking statements contained in this press release are subject to the following factors: (i) the length, scope and severity of the ongoing coronavirus disease 2019 (“COVID-19”) pandemic, including the emergence and spread of variant strains of COVID-19, including the effects of related public health concerns and the impact of continued actions taken by governmental authorities and other third parties in response to the pandemic and its impact on commodity prices and, supply and demand considerations; (ii) the outcome of any legal proceedings that may be instituted against Magnolia; (iii) Magnolia’s ability to realize the anticipated benefits of its acquisitions, which may be affected by, among other things, competition and the ability of Magnolia to grow and manage growth profitably; (iv) changes in applicable laws or regulations; and (v) the possibility that Magnolia may be adversely affected by other economic, business, and/or competitive factors. Should one or more of the risks or uncertainties described in this press release occur, or should underlying assumptions prove incorrect, actual results and plans could differ materially from those expressed in any forward-looking statements. Additional information concerning these and other factors that may impact the operations and projections discussed herein can be found in Magnolia’s filings with the SEC, including its Annual Report on Form 10-K for the fiscal year ended December 31, 2021, which is expected to be filed with the SEC on February 17, 2022. Magnolia’s SEC filings are available publicly on the SEC’s website at www.sec.gov.


Contacts for Magnolia Oil & Gas Corporation

Investors
Brian Corales
(713) 842-9036
[email protected]

Media
Art Pike
(713) 842-9057
[email protected]
4


Magnolia Oil & Gas Corporation
Operating Highlights
 
For the Quarters Ended
For the Years Ended
 December 31, 2021December 31, 2020December 31, 2021December 31, 2020
Production:
Oil (MBbls)2,844 2,646 11,190 11,610 
Natural gas (MMcf)11,820 10,168 43,436 39,429 
Natural gas liquids (MBbls)1,572 1,237 5,669 4,449 
Total (Mboe)6,386 5,577 24,099 22,631 
Average daily production:
Oil (Bbls/d)30,913 28,756 30,659 31,722 
Natural gas (Mcf/d)128,475 110,522 119,003 107,728 
Natural gas liquids (Bbls/d)17,085 13,440 15,532 12,156 
Total (boe/d)69,411 60,617 66,025 61,833 
Revenues (in thousands):
Oil revenues$216,596 $107,373 $747,896 $421,520 
Natural gas revenues59,890 23,930 172,648 70,416 
Natural gas liquids revenues55,667 19,487 157,807 49,367 
Total revenues$332,153 $150,790 $1,078,351 $541,303 
Average sales price:
Oil (per Bbl)$76.16 $40.58 $66.83 $36.31 
Natural gas (per Mcf)5.07 2.35 3.97 1.79 
Natural gas liquids (per Bbl)35.41 15.75 27.84 11.10 
Total (per boe)$52.01 $27.04 $44.75 $23.92 
NYMEX WTI (per Bbl)$77.17 $42.67 $67.96 $39.40 
NYMEX Henry Hub (per Mcf)$5.84 $2.66 $3.86 $2.08 
Realization to benchmark:
Oil (% of WTI)99 %95 %98 %92 %
Natural gas (% of Henry Hub)87 %88 %103 %86 %
Operating expenses (in thousands):
Lease operating expenses$28,064 $17,917 $93,021 $79,192 
Gathering, transportation, and processing13,466 9,622 45,535 35,442 
Taxes other than income17,177 8,376 55,834 31,250 
Depreciation, depletion and amortization53,420 45,080 187,688 283,353 
Operating costs per boe:
Lease operating expenses$4.39 $3.21 $3.86 $3.50 
Gathering, transportation, and processing2.11 1.73 1.89 1.57 
Taxes other than income2.69 1.50 2.32 1.38 
Depreciation, depletion and amortization8.37 8.08 7.79 12.52 
5


Magnolia Oil & Gas Corporation
Consolidated Statements of Operations
(In thousands, except per share data)
For the Quarters Ended
For the Years Ended
 December 31, 2021December 31, 2020December 31, 2021December 31, 2020
REVENUES 
Oil revenues$216,596 $107,373 $747,896 $421,520 
Natural gas revenues59,890 23,930 172,648 70,416 
Natural gas liquids revenues55,667 19,487 157,807 49,367 
Total revenues332,153 150,790 1,078,351 541,303 
OPERATING EXPENSES
Lease operating expenses28,064 17,917 93,021 79,192 
Gathering, transportation and processing13,466 9,622 45,535 35,442 
Taxes other than income17,177 8,376 55,834 31,250 
Exploration expenses1,685 3,744 4,125 567,333 
Impairment of oil and natural gas properties— — — 1,381,258 
Asset retirement obligations accretion864 1,315 4,929 5,718 
Depreciation, depletion and amortization53,420 45,080 187,688 283,353 
Amortization of intangible assets— 3,626 9,346 14,505 
General and administrative expenses15,463 18,445 75,279 68,918 
Total operating costs and expenses130,139 108,125 475,757 2,466,969 
OPERATING INCOME (LOSS)202,014 42,665 602,594 (1,925,666)
OTHER INCOME (EXPENSE)
Income from equity method investee— 54 — 2,113 
Interest expense, net(7,483)(7,353)(31,002)(28,698)
Gain (loss) on derivatives, net— 2,774 (3,110)565 
Other income, net37 3,872 85 3,363 
Total other expense, net(7,446)(653)(34,027)(22,657)
INCOME (LOSS) BEFORE INCOME TAXES194,568 42,012 568,567 (1,948,323)
Income tax expense (benefit)2,423 — 8,851 (79,340)
NET INCOME (LOSS)192,145 42,012 559,716 (1,868,983)
LESS: Net income (loss) attributable to noncontrolling interest41,916 14,267 142,434 (660,593)
NET INCOME (LOSS) ATTRIBUTABLE TO CLASS A COMMON STOCK$150,229 $27,745 $417,282 $(1,208,390)
NET INCOME (LOSS) PER SHARE OF CLASS A COMMON STOCK
Basic$0.83 $0.17 $2.38 $(7.27)
Diluted$0.82 $0.16 $2.36 $(7.27)
WEIGHTED AVERAGE NUMBER OF COMMON SHARES OUTSTANDING
Basic180,655 164,907 174,364 166,270 
Diluted181,411 169,326 175,360 166,270 
WEIGHTED AVERAGE NUMBER OF CLASS B SHARES OUTSTANDING(1)
49,568 85,790 63,973 85,790 
(1) Shares of Class B Common Stock, and corresponding Magnolia LLC Units, are anti-dilutive in the calculation of weighted average number of common shares outstanding.
6


Magnolia Oil & Gas Corporation
Summary Cash Flow Data
(In thousands)
For the Quarters Ended For the Years Ended
December 31, 2021December 31, 2020December 31, 2021December 31, 2020
CASH FLOWS FROM OPERATING ACTIVITIES
NET INCOME (LOSS)$192,145 $42,012 $559,716 $(1,868,983)
Adjustments to reconcile net income (loss) to net cash provided by operating activities:
Depreciation, depletion and amortization53,420 45,080 187,688 283,353 
Amortization of intangible assets— 3,626 9,346 14,505 
Exploration expenses, non-cash888 2,370 888 563,999 
Impairment of oil and natural gas properties— — — 1,381,258 
Asset retirement obligations accretion864 1,315 4,929 5,718 
Amortization of deferred financing costs1,140 918 4,290 3,628 
Unrealized (gain) on derivatives, net— (2,485)277 (277)
(Gain) on sale of equity method investment— (5,071)— (5,071)
Deferred taxes— — — (77,834)
Stock based compensation2,593 1,158 11,736 10,029 
Other— 1,332 (84)(728)
Net change in operating assets and liabilities9,492 (11,133)9,691 524 
Net cash provided by operating activities260,542 79,122 788,477 310,121 
CASH FLOWS FROM INVESTING ACTIVITIES
Acquisitions(7,529)— (18,345)(73,702)
Proceeds from sale of equity method investment— 27,074 — 27,074 
Additions to oil and natural gas properties(73,682)(40,532)(236,426)(197,858)
Changes in working capital associated with additions to oil and natural gas properties1,133 (5,382)13,568 (24,354)
Other investing78 (307)(2,239)(1,148)
Net cash used in investing activities(80,000)(19,147)(243,442)(269,988)
CASH FLOW FROM FINANCING ACTIVITIES
Class A Common Stock repurchases(55,325)(15,718)(125,641)(28,681)
Class B Common Stock purchases and cancellations— — (171,671)— 
Non-compete settlement— — (42,073)— 
Dividends paid(27)— (14,131)— 
Distributions to noncontrolling interest owners(1,501)(85)(7,207)(680)
Cash paid for debt modification— — (4,976)— 
Other financing activities(1,730)(144)(4,915)(844)
Net cash used in financing activities(58,583)(15,947)(370,614)(30,205)
NET CHANGE IN CASH AND CASH EQUIVALENTS121,959 44,028 174,421 9,928 
Cash and cash equivalents – Beginning of period245,023 148,533 192,561 182,633 
Cash and cash equivalents – End of period$366,982 $192,561 $366,982 $192,561 

7


Magnolia Oil & Gas Corporation
Summary Balance Sheet Data
(In thousands)
December 31, 2021December 31, 2020
Cash and cash equivalents$366,982 $192,561 
Other current assets151,811 88,965 
Property, plant and equipment, net1,216,087 1,149,527 
Other assets11,862 22,367 
Total assets$1,746,742 $1,453,420 
Current liabilities$218,545 $128,949 
Long-term debt, net388,087 391,115 
Other long-term liabilities94,861 93,934 
Common stock24 26 
Additional paid in capital1,689,500 1,712,544 
Treasury stock(164,599)(38,958)
Accumulated deficit(708,168)(1,125,450)
Noncontrolling interest228,492 291,260 
Total liabilities and equity$1,746,742 $1,453,420 


8


Magnolia Oil & Gas Corporation
Costs Incurred, Proved Developed Reserves, Organic F&D Cost Per Boe and Reserve Replacement Ratio

The following tables summarize the Company's costs incurred in oil and gas property acquisition, exploration and development activities, reconciliation of changes in proved developed reserves, calculation of organic proved developed F&D cost per boe and calculation of proved developed reserve replacement ratio for the years ended December 31, 2021 and 2020.

For the Years Ended
(In thousands)December 31, 2021December 31, 2020
Costs incurred:
Proved property acquisition costs$12,354 $49,246 
Unproved properties acquisition costs10,483 25,966 
Total acquisition costs22,837 75,212 
Exploration and development costs240,815 188,352 
Total costs incurred263,652 263,564 
Less: Total acquisition costs(22,837)(75,212)
Less: Asset retirement obligations(1,153)12,839 
Less: Exploration expenses(3,237)(3,334)
Less: Leasehold acquisition costs(4,521)(2,966)
Drilling and completions capital(A)$231,904 $194,891 


For the Years Ended
(In MMboe)December 31, 2021December 31, 2020
Proved developed reserves:
Beginning of period85.8 86.8 
End of period109.8 85.8 
Increase (decrease) in proved developed reserves24.0 (1.0)
Production(B)24.1 22.6 
Increase in proved developed reserves plus production48.1 21.6 
Less: Purchases of reserves in place(0.4)(2.0)
Increase in proved developed reserves, excluding acquisitions(C)47.7 19.6 
Less: Price-related revisions(16.7)10.8 
Increase in proved developed reserves, excluding acquisitions and price-related revisions
(D)31.0 30.4 

For the Years Ended
December 31, 2021December 31, 2020
Organic proved developed F&D cost per boe(A)/(D)$7.48 $6.41 
Reserve replacement ratio(C)/(B)198 %87 %
9


Magnolia Oil & Gas Corporation
Non-GAAP Financial Measures


Reconciliation of net income (loss) to adjusted EBITDAX

In this press release, we refer to adjusted EBITDAX, a supplemental non-GAAP financial measure that is used by management and external users of our consolidated financial statements, such as industry analysts, investors, lenders, and rating agencies. We define adjusted EBITDAX as net income (loss) before interest expense, income taxes, depreciation, depletion and amortization, amortization of intangible assets, exploration expenses, and accretion of asset retirement obligations, adjusted to exclude the effect of certain items included in net income (loss).

Our management believes that adjusted EBITDAX is useful because it allows them to more effectively evaluate our operating performance and compare the results of our operations from period to period and against our peers without regard to our financing methods or capital structure. We also believe that securities analysts, investors, and other interested parties may use adjusted EBITDAX in the evaluation of our Company. We exclude the items listed above from net income (loss) in arriving at adjusted EBITDAX because these amounts can vary substantially from company to company within our industry depending upon accounting methods and book values of assets, capital structures and the method by which the assets were acquired. Adjusted EBITDAX should not be considered as an alternative to, or more meaningful than, net income (loss) as determined in accordance with GAAP or as an indicator of our operating performance or liquidity. Certain items excluded from adjusted EBITDAX are significant components in understanding and assessing a company’s financial performance, such as a company’s cost of capital and tax structure, as well as the historic costs of depreciable assets, none of which are components of adjusted EBITDAX. Our presentation of adjusted EBITDAX should not be construed as an inference that our results will be unaffected by unusual or non-recurring items. Our computations of adjusted EBITDAX may not be comparable to other similarly titled measures of other companies.

The following table presents a reconciliation of net income (loss) to adjusted EBITDAX, our most directly comparable financial measure, calculated and presented in accordance with GAAP:
For the Quarters Ended
For the Years Ended
(In thousands)
December 31, 2021
December 31, 2020
December 31, 2021
December 31, 2020
NET INCOME (LOSS)$192,145 $42,012 $559,716 $(1,868,983)
Exploration expenses1,685 3,744 4,125 567,333 
Asset retirement obligations accretion864 1,315 4,929 5,718 
Depreciation, depletion and amortization53,420 45,080 187,688 283,353 
Amortization of intangible assets— 3,626 9,346 14,505 
Interest expense, net7,483 7,353 31,002 28,698 
Income tax expense (benefit)2,423 — 8,851 (79,340)
EBITDAX258,020 103,130 805,657 (1,048,716)
Impairment of oil and natural gas properties— — — 1,381,258 
Service agreement transition costs(1)
— — 11,189 — 
Non-cash stock based compensation expense2,593 1,158 11,736 10,029 
Unrealized (gain) loss on derivatives, net— (2,485)277 (277)
(Gain) on sale of equity method investment— (5,071)— (5,071)
Inventory write down— 1,386 — 1,386 
Adjusted EBITDAX$260,613 $98,118 $828,859 $338,609 

(1) Costs incurred during the transition period related to the termination of the Services Agreement with EnerVest Operating L.L.C. included within “General and administrative expenses” on the Company's consolidated statements of operations.
10


Magnolia Oil & Gas Corporation
Non-GAAP Financial Measures

Reconciliation of net income (loss) attributable to Class A Common Stock to adjusted earnings

Our presentation of adjusted earnings and adjusted earnings per share are non-GAAP measures because they exclude the effect of certain items included in net income (loss) attributable to Class A Common Stock. Management uses adjusted earnings and adjusted earnings per share to evaluate our operating and financial performance because it eliminates the impact of certain items that management does not consider to be representative of the Company’s on-going business operations. As a performance measure, adjusted earnings may be useful to investors in facilitating comparisons to others in the Company’s industry because certain items can vary substantially in the oil and gas industry from company to company depending upon accounting methods, book value of assets, and capital structure, among other factors. Management believes excluding these items facilitates investors and analysts in evaluating and comparing the underlying operating and financial performance of our business from period to period by eliminating differences caused by the existence and timing of certain expense and income items that would not otherwise be apparent on a GAAP basis. However, our presentation of adjusted earnings and adjusted earnings per share may not be comparable to similar measures of other companies in our industry.
For the
Quarter Ended
December 31, 2021
Per Share Diluted EPS
For the
Quarter Ended
December 31, 2020
Per Share Diluted EPS
(In thousands, except per share data)
NET INCOME ATTRIBUTABLE TO CLASS A COMMON STOCK$150,229 $0.82 $27,745 $0.16 
Adjustments:
Impairment of unproved properties(1)
— — 2,370 0.01 
Unrealized (gain) on derivatives, net— — (2,485)(0.01)
(Gain) on sale of equity method investment— — (5,071)(0.03)
Inventory write down— — 1,386 0.01 
Seismic purchases— — 1,100 0.01 
Noncontrolling interest impact of adjustments— — 917 — 
ADJUSTED NET INCOME ATTRIBUTABLE TO
CLASS A COMMON STOCK
$150,229 $0.82 $25,962 $0.15 
For the
Year Ended
December 31, 2021
Per Share Diluted EPSFor the
Year Ended
December 31, 2020
Per Share Diluted EPS
(In thousands, except per share data)
NET INCOME (LOSS) ATTRIBUTABLE TO CLASS A COMMON STOCK$417,282 $2.36 $(1,208,390)$(7.27)
Adjustments:
Impairment of proved oil and natural gas properties— — 1,381,258 8.31 
Impairment of unproved properties(1)
— — 563,999 3.39 
Service agreement transition costs(2)
11,189 0.06 — — 
Accelerated amortization of intangible5,877 0.03 — — 
Unrealized (gain) loss on derivatives, net277 — (277)— 
(Gain) on sale of equity method investment— — (5,071)(0.03)
Inventory write down— — 1,386 0.01 
Seismic purchases1,841 0.01 1,100 0.01 
Interest expense costs related to debt modification1,147 0.01 — — 
Noncontrolling interest impact of adjustments(5,093)(0.03)(658,210)(3.96)
Change in estimated income tax(3,291)(0.02)(78,327)(0.48)
ADJUSTED NET INCOME (LOSS) ATTRIBUTABLE TO
CLASS A COMMON STOCK
$429,229 $2.42 $(2,532)$(0.02)
(1) Impairment of unproved properties is included within “Exploration expenses” on the consolidated statements of operations.
(2) Costs incurred during the transition period related to the termination of the Services Agreement with EnerVest Operating L.L.C. included within “General and administrative expenses” on the Company's consolidated statements of operations.

11


Magnolia Oil & Gas Corporation
Non-GAAP Financial Measures

Reconciliation of net income (loss) to adjusted net income (loss)

Our presentation of adjusted net income (loss) is a non-GAAP measures because it excludes the effect of certain items included in net income (loss). Management uses adjusted net income (loss) to evaluate our operating and financial performance because it eliminates the impact of certain items that management does not consider to be representative of the Company’s on-going business operations. As a performance measure, adjusted net income (loss) may be useful to investors in facilitating comparisons to others in the Company’s industry because certain items can vary substantially in the oil and gas industry from company to company depending upon accounting methods, book value of assets, and capital structure, among other factors. Management believes adjusting these items facilitates investors and analysts in evaluating and comparing the underlying operating and financial performance of our business from period to period by eliminating differences caused by the existence and timing of certain expense and income items that would not otherwise be apparent on a GAAP basis. However, our presentation of adjusted net income (loss) may not be comparable to similar measures of other companies in our industry.
For the Quarters Ended
For the Years Ended
(In thousands)
December 31, 2021
December 31, 2020
December 31, 2021
December 31, 2020
NET INCOME (LOSS)$192,145 $42,012 $559,716 $(1,868,983)
Adjustments:
Impairment of proved oil and natural gas properties— — — 1,381,258 
Impairment of unproved properties(1)
— 2,370 — 563,999 
Service agreement transition costs(2)
— — 11,189 — 
Accelerated amortization of intangible— — 5,877 — 
Unrealized (gain) loss on derivatives, net— (2,485)277 (277)
(Gain) on sale of equity method investment— (5,071)— (5,071)
Inventory write down— 1,386 — 1,386 
Interest expense costs related to debt modification— — 1,147 — 
Seismic purchases— 1,100 1,841 1,100 
Change in estimated income tax(3)
— — (192)(78,047)
ADJUSTED NET INCOME (LOSS)$192,145 $39,312 $579,855 $(4,635)
Diluted weighted average shares of Class A Common Stock outstanding during the period181,411 169,326 175,360 166,270 
Weighted average shares of Class B Common Stock outstanding during the period(4)
49,568 85,790 63,973 85,790 
Total weighted average shares of Class A and B Common Stock, including dilutive impact of other securities(4)
230,979 255,116 239,333 252,060 

(1) Impairment of unproved properties is included within “Exploration expenses” on the consolidated statements of operations.
(2) Costs incurred during the transition period related to the termination of the Services Agreement with EnerVest Operating L.L.C. included within “General and administrative expenses” on the Company's consolidated statements of operations.
(3) Represents corporate income taxes at an assumed effective tax rate of 2% and 22% for the years ended December 31, 2021 and 2020, respectively.
(4) Shares of Class B Common Stock, and corresponding Magnolia LLC Units, are anti-dilutive in the calculation of weighted average number of common shares outstanding.
12


Magnolia Oil & Gas Corporation
Non-GAAP Financial Measures

Reconciliation of revenue to adjusted cash operating margin and to operating income margin

Our presentation of adjusted cash operating margin and total adjusted cash operating costs are supplemental non-GAAP financial measures that are used by management. Total adjusted cash operating costs exclude the impact of non-cash activity. We define adjusted cash operating margin per boe as total revenues per boe less operating expenses per boe. Management believes that total adjusted cash operating costs per boe and adjusted cash operating margin per boe provide relevant and useful information, which is used by our management in assessing the Company’s profitability and comparability of results to our peers.

As a performance measure, total adjusted cash operating costs and adjusted cash operating margin may be useful to investors in facilitating comparisons to others in the Company’s industry because certain items can vary substantially in the oil and gas industry from company to company depending upon accounting methods, book value of assets, and capital structure, among other factors. Management believes excluding these items facilitates investors and analysts in evaluating and comparing the underlying operating and financial performance of our business from period to period by eliminating differences caused by the existence and timing of certain expense and income items that would not otherwise be apparent on a GAAP basis. However, our presentation of adjusted cash operating margin may not be comparable to similar measures of other companies in our industry.

For the Quarters Ended
(In $/boe)
December 31, 2021
December 31, 2020
Revenue$52.01 $27.04 
Total cash operating costs:
Lease operating expenses (1)
(4.37)(3.20)
Gathering, transportation and processing(2.11)(1.73)
Taxes other than income(2.69)(1.50)
Exploration expenses (2)
(0.12)(0.25)
General and administrative expenses (3)
(2.03)(3.11)
Total adjusted cash operating costs(11.32)(9.79)
Adjusted cash operating margin$40.69 $17.25 
Margin (%)78 %64 %
Non-cash costs:
Depreciation, depletion and amortization$(8.37)$(8.08)
Asset retirement obligations accretion(0.14)(0.24)
Amortization of intangible assets— (0.65)
Non-cash stock based compensation(0.41)(0.21)
Exploration expenses, non-cash (0.14)(0.42)
Total non-cash costs(9.06)(9.60)
Operating income margin$31.63 $7.65 
Margin (%)61 %28 %

(1) Lease operating expenses exclude non-cash stock based compensation of $0.2 million, or $0.02 per boe, and $0.05 million, or $0.01 per boe, for the quarters ended December 31, 2021 and 2020, respectively.
(2) Exploration expenses exclude non-cash exploration activity of $0.9 million, or $0.14 per boe, and $2.4 million, or $0.42 per boe, for the quarters ended December 31, 2021 and 2020, respectively.
(3) General and administrative expenses exclude non-cash stock based compensation of $2.4 million, or $0.39 per boe, and $1.1 million, or $0.20 per boe, for the quarters ended December 31, 2021 and 2020, respectively.
13


Magnolia Oil & Gas Corporation
Non-GAAP Financial Measures

Reconciliation of net cash provided by operating activities to free cash flow

Free cash flow is a non-GAAP financial measure. Free cash flow is defined as cash flows from operations before net change in operating assets and liabilities less additions to oil and natural gas properties and changes in working capital associated with additions to oil and natural gas properties. Management believes free cash flow is useful for investors and widely accepted by those following the oil and gas industry as financial indicators of a company’s ability to generate cash to internally fund drilling and completion activities, fund acquisitions, and service debt. It is also used by research analysts to value and compare oil and gas exploration and production companies and is frequently included in published research when providing investment recommendations. Free cash flow, therefore, is an additional measure of liquidity, but is not a measure of financial performance under GAAP and should not be considered an alternative to cash flows from operating, investing, or financing activities.

For the Quarters EndedFor the Years Ended
(In thousands)December 31, 2021December 31, 2020December 31, 2021December 31, 2020
Net cash provided by operating activities$260,542 $79,122 $788,477 $310,121 
Add back: net change in operating assets and liabilities(9,492)11,133 (9,691)(524)
Cash flows from operations before net change in operating assets and liabilities251,050 90,255 778,786 309,597 
Additions to oil and natural gas properties(73,682)(40,532)(236,426)(197,858)
Changes in working capital associated with additions to oil and natural gas properties1,133 (5,382)13,568 (24,354)
Free cash flow$178,501 $44,341 $555,928 $87,385 
14
Fourth Quarter 2021 Earnings Presentation February 17, 2022 Stephen Chazen – Chairman, President & CEO Christopher Stavros – Executive Vice President & CFO Brian Corales – Vice President, Investor Relations Exhibit 99.2

 
Disclaimer 2 FORWARD LOOKING STATEMENTS The information in this presentation and the oral statements made in connection therewith include “forward‐looking statements” within the meaning of Section 27A of the Securities Act of 1933, as amended  (the “Securities Act”), and Section 21E of the Securities Exchange Act of 1934, as amended. All statements, other than statements of present or historical fact included in this presentation, regarding Magnolia Oil  & Gas Corporation’s (“Magnolia,” “we,” “us,” “our” or the “Company”) financial and production guidance, strategy, future operations, financial position, estimated revenues, and losses, projected costs,  prospects, plans and objectives of management are forward‐looking statements. When used in this presentation, including any oral statements made in connection therewith, the words could, should, will, may,  believe, anticipate, intend, estimate, expect, project, the negative of such terms and other similar expressions are intended to identify forward‐looking statements, although not all forward‐looking statements  contain such identifying words. These forward‐looking statements are based on management’s current expectations and assumptions about future events. Except as otherwise required by applicable law,  Magnolia disclaims any duty to update any forward‐looking statements, all of which are expressly qualified by the statements in this section, to reflect events or circumstances after the date of this presentation.  Magnolia cautions you that these forward‐looking statements are subject to all of the risks and uncertainties, most of which are difficult to predict and many of which are beyond the control of Magnolia,  incident to the development, production, gathering and sale of oil, natural gas and natural gas liquids. In addition, Magnolia cautions you that the forward looking statements contained in this press release are  subject to the following factors: (i) the length, scope and severity of the ongoing coronavirus disease 2019 (“COVID‐19”) pandemic, including the emergence and spread of variant strains of COVID‐19, including  the effects of related public health concerns and the impact of continued or new actions taken by governmental authorities and other third parties in response to the pandemic and its impact on commodity  prices and supply and demand considerations; (ii) the outcome of any legal proceedings that may be instituted against Magnolia; (iii) Magnolia’s ability to realize the anticipated benefits of its acquisitions, which  may be affected by, among other things, competition and the ability of Magnolia to grow and manage growth profitably; (iv) changes in applicable laws or regulations; and (v) the possibility that Magnolia may be  adversely affected by other economic, business, and/or competitive factors. Should one or more of the risks or uncertainties described in this press release occur, or should underlying assumptions prove  incorrect, actual results and plans could differ materially from those expressed in any forward‐looking statements. Additional information concerning these and other factors that may impact Magnolia's  operations and projections can be found in its filings with the Securities and Exchange Commission (the "SEC"), including its Annual Report on Form 10‐K for the fiscal year ended December 31, 2021, which is  expected to be filed with the SEC on February 17, 2022. Magnolia’s SEC filings are available publicly on the SEC’s website at www.sec.gov. NON‐GAAP FINANCIAL MEASURES This presentation includes non‐GAAP financial measures, including free cash flow, EBITDAX, adjusted EBITDAX, adjusted net income, adjusted earnings, adjusted cash operating costs and adjusted cash operating  margin. Magnolia believes these metrics are useful because they allow Magnolia to more effectively evaluate its operating performance and compare the results of its operations from period to period and  against its peers without regard to accounting methods or capital structure. Magnolia does not consider these non‐GAAP measures in isolation or as an alternative to similar financial measures determined in  accordance with GAAP. The computations of these non‐GAAP measures may not be comparable to other similarly titled measures of other companies. Magnolia excludes certain items from net income in arriving at adjusted net income and adjusted earnings because these amounts can vary substantially from company to company within its industry depending  upon accounting methods, book values of assets and the method by which the assets were acquired. Adjusted EBITDAX, adjusted net income, and adjusted earnings should not be considered as alternatives to,  or more meaningful than, net income as determined in accordance with GAAP. Certain items excluded from free cash flow, adjusted EBITDAX, adjusted net income, adjusted earnings, adjusted cash operating  costs and adjusted cash operating margin are significant components in understanding and assessing a company’s financial performance, and should not be construed as an inference that its results will be  unaffected by unusual or non‐recurring terms.  As performance measures, adjusted EBITDAX, adjusted net income, adjusted earnings, adjusted cash operating costs and adjusted cash operating margin may be useful to investors in facilitating comparisons to  others in the Company’s industry because certain items can vary substantially in the oil and gas industry from company to company depending upon accounting methods, book value of assets, and capital  structure, among other factors. Management believes excluding these items facilitates investors and analysts in evaluating and comparing the underlying operating and financial performance of our business  from period to period by eliminating differences caused by the existence and timing of certain expense and income items that would not otherwise be apparent on a GAAP basis. As a liquidity measure,  management believes free cash flow is useful for investors and widely accepted by those following the oil and gas industry as financial indicators of a company’s ability to generate cash to internally fund drilling  and completion activities, fund acquisitions, and service debt. Our presentation of adjusted EBITDAX, adjusted net income, free cash flow, adjusted earnings, adjusted cash operating costs and adjusted cash  operating margin may not be comparable to similar measures of other companies in our industry. A free cash flow reconciliation is shown on page 15, adjusted EBITDAX reconciliation is shown on page 16 of the  presentation, adjusted net income reconciliation is shown on page 17, adjusted earnings reconciliation is shown on page 18 and adjusted cash operating costs and adjusted cash operating margin reconciliations  are shown on page 7. INDUSTRY AND MARKET DATA This presentation has been prepared by Magnolia and includes market data and other statistical information from sources believed by Magnolia to be reliable, including independent industry publications,  governmental publications or other published independent sources. Some data is also based on the good faith estimates of Magnolia, which are derived from its review of internal sources as well as the  independent sources described above. Although Magnolia believes these sources are reliable, it has not independently verified the information and cannot guarantee its accuracy and completeness.

 
Magnolia Oil & Gas – 4Q and Full Year 2021 Highlights 3 • Generated total net income of $192 million and diluted earnings per share of $0.82 during  4Q21. For the full year, total adjusted net income was $580 million or $2.42 per diluted share. • Total production for 4Q21 increased 15%  year over year to 69.4 Mboe/d.  Giddings  production increased 27% from 4Q20 levels. • Generated adjusted EBITDAX of $261 million, with D&C Capital of $72 million, or just 28% of  adjusted EBITDAX, during 4Q21.  For the full year 2021, adjusted EBITDAX was $829 million  with D&C capital of $232 million or 28% of adjusted EBITDAX. • Generated free cash flow of $179 million during 4Q21 and $556 million for the full year. • 4Q21 operating income margin was 61%. • Magnolia spent $52 million to purchase 2.7 million shares during the 4th quarter. For the full  year 2021, MGY reduced its fully diluted share count by 10% or 25.3 million shares for $339  million. • Magnolia paid its inaugural semi‐annual cash dividend of $0.08 per share based on $40 oil  prices during the third quarter. MGY declared a $0.20 dividend, based on $55 oil prices, to be  paid in March.  

 
Magnolia Oil & Gas – 4Q 2021 Key Metrics 4 Adj. Net Income (1) & Adj. EPS (1) Total Production 69.4 Mboe/d  (3% sequential growth) (15% YOY growth) Adjusted EBITDAX (1) $260.6 Million D&C Capex $72.1 Million (28% of Adj. EBITDAX) Fully Diluted Shares (2) 231.0 Million (Repurchased 2.7 MM in 4Q21) Free Cash Flow (1) $178.5 Million ($556 Million for 2021) (1) Adjusted EPS, Adjusted Net Income, Free Cash Flow and Adjusted EBITDAX are non‐GAAP measures. For a reconciliation to the most directly comparable GAAP  measure see pages 18, 17, 15 and 16. (2) Includes 49.6 million shares of Class B Common Stock that are anti‐dilutive in the calculation of weighted average number of common shares outstanding. $192.1 Million  $0.82/share
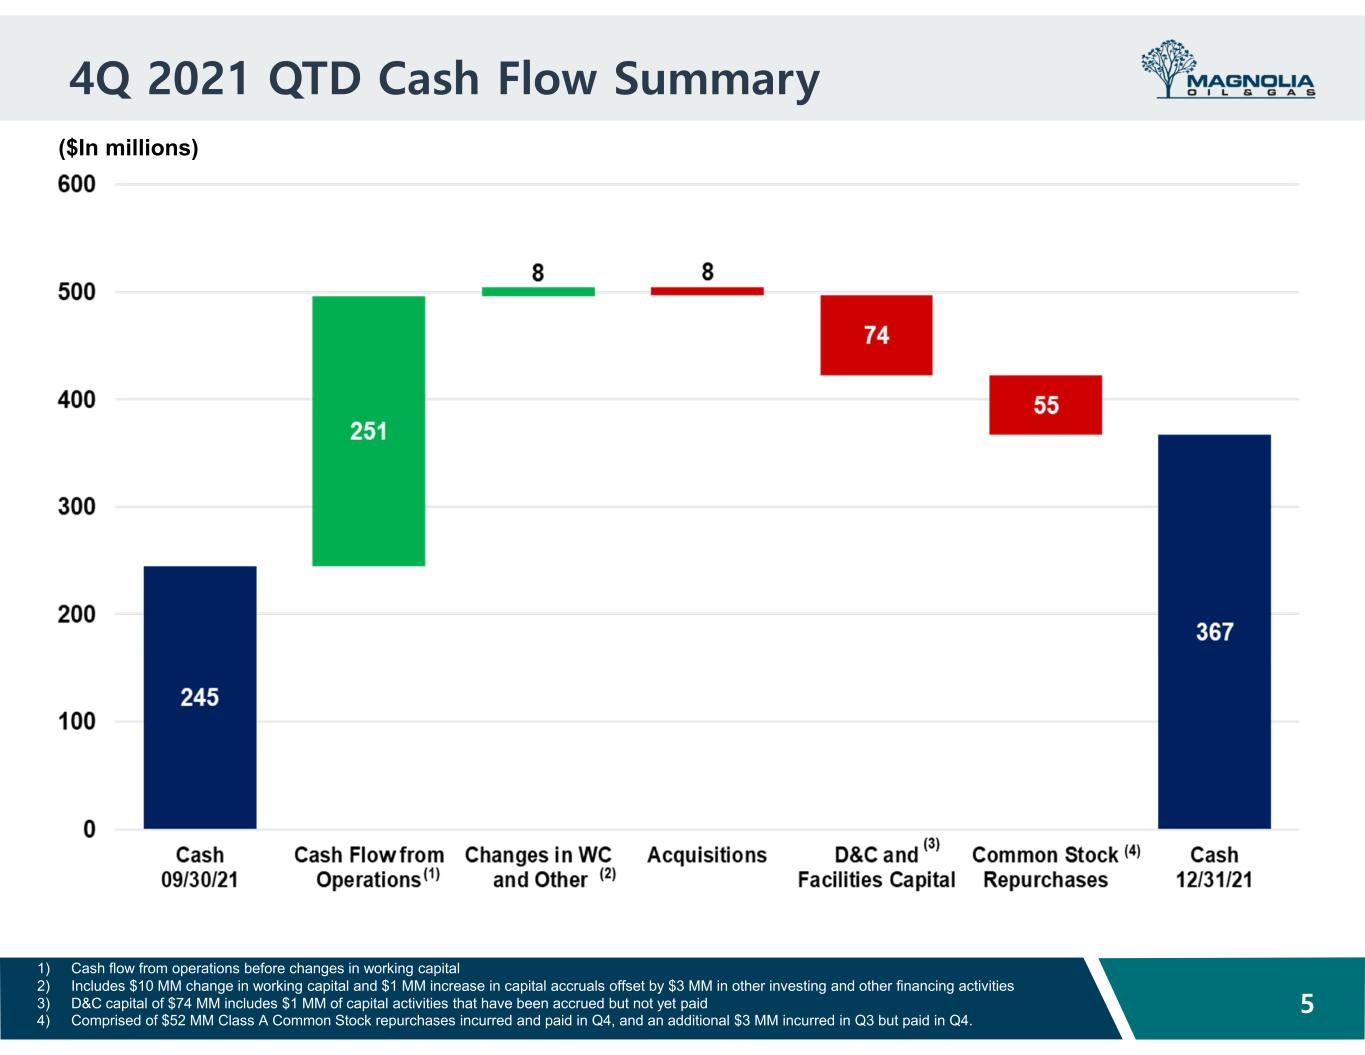

 
4Q 2021 QTD Cash Flow Summary ($In millions) 1) Cash flow from operations before changes in working capital 2) Includes $10 MM change in working capital and $1 MM increase in capital accruals offset by $3 MM in other investing and other financing activities 3) D&C capital of $74 MM includes $1 MM of capital activities that have been accrued but not yet paid 4) Comprised of $52 MM Class A Common Stock repurchases incurred and paid in Q4, and an additional $3 MM incurred in Q3 but paid in Q4. 5
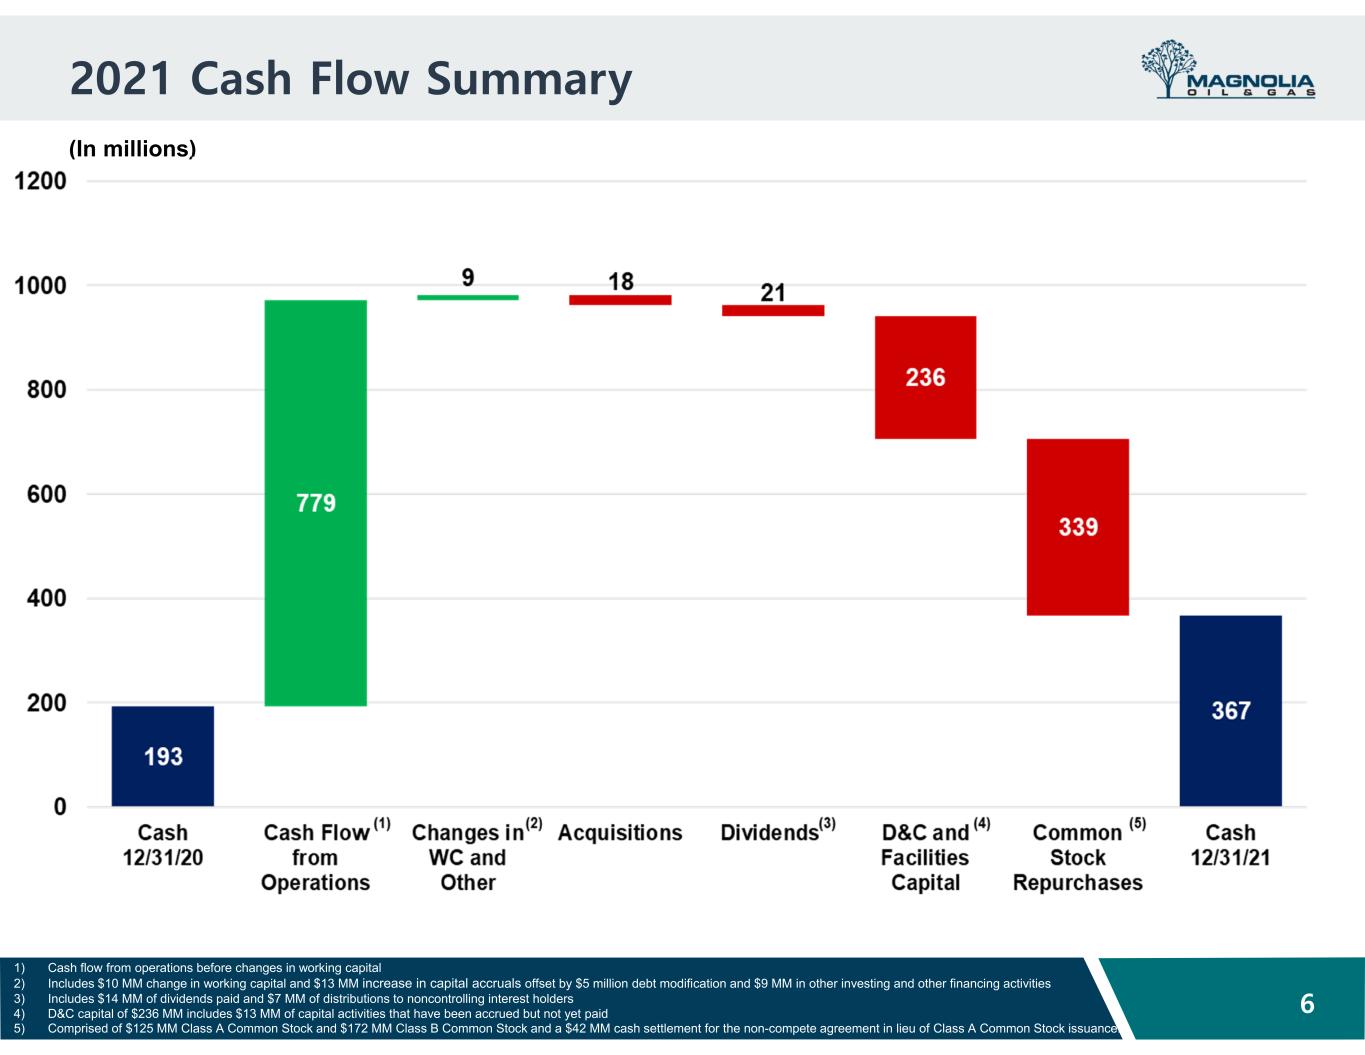

 
2021 Cash Flow Summary (In millions) 1) Cash flow from operations before changes in working capital 2) Includes $10 MM change in working capital and $13 MM increase in capital accruals offset by $5 million debt modification and $9 MM in other investing and other financing activities 3) Includes $14 MM of dividends paid and $7 MM of distributions to noncontrolling interest holders 4) D&C capital of $236 MM includes $13 MM of capital activities that have been accrued but not yet paid 5) Comprised of $125 MM Class A Common Stock and $172 MM Class B Common Stock and a $42 MM cash settlement for the non-compete agreement in lieu of Class A Common Stock issuance. 6
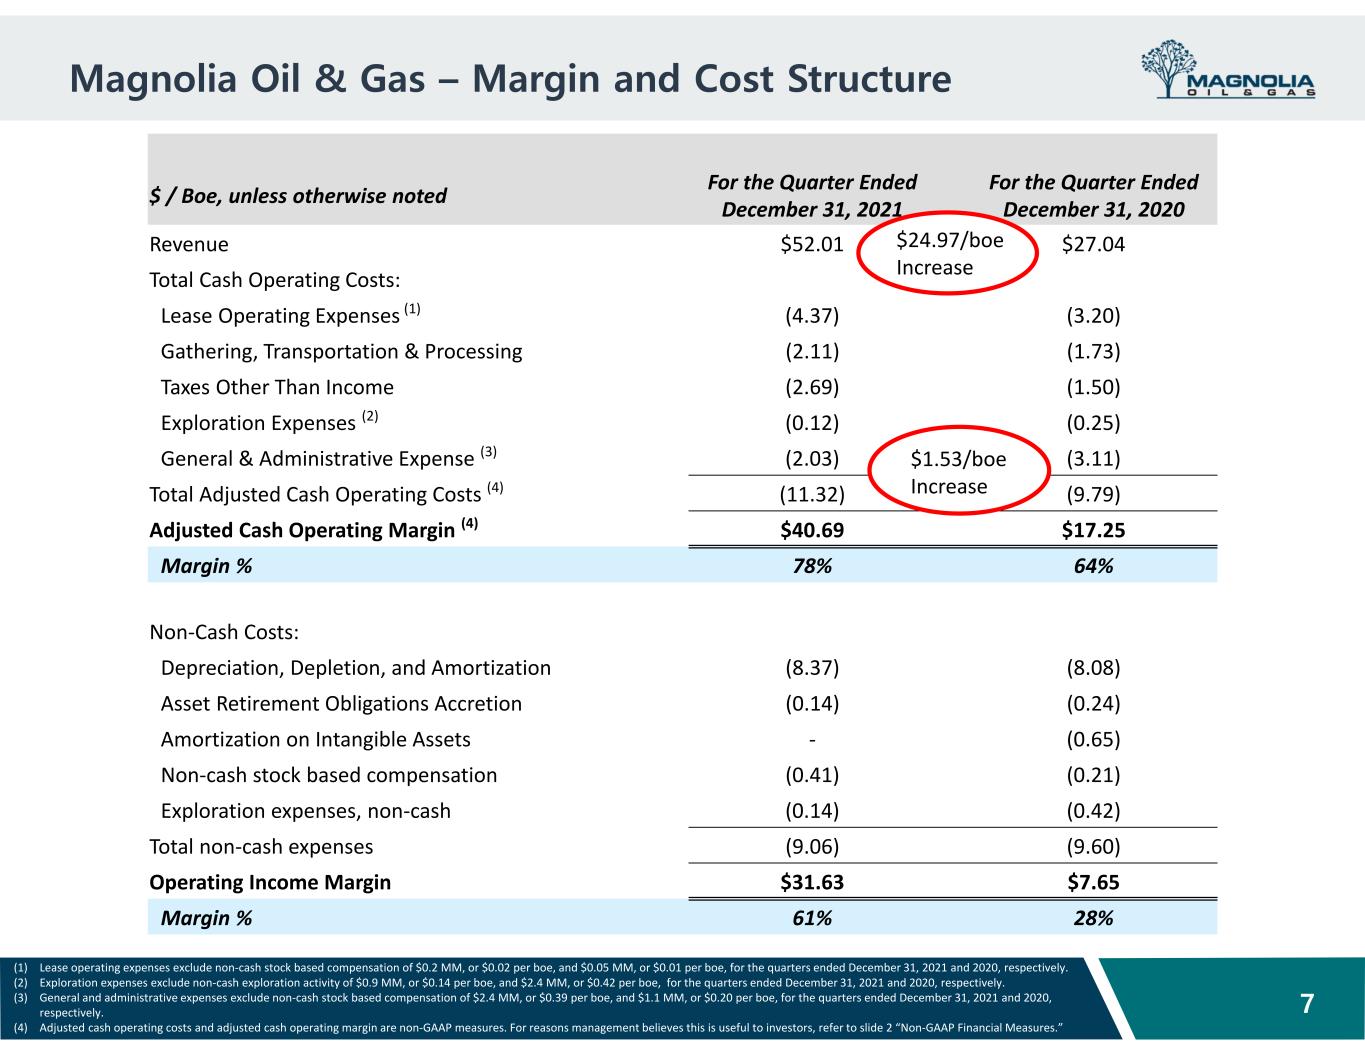

 
Magnolia Oil & Gas – Margin and Cost Structure 7 (1) Lease operating expenses exclude non‐cash stock based compensation of $0.2 MM, or $0.02 per boe, and $0.05 MM, or $0.01 per boe, for the quarters ended December 31, 2021 and 2020, respectively.  (2) Exploration expenses exclude non‐cash exploration activity of $0.9 MM, or $0.14 per boe, and $2.4 MM, or $0.42 per boe,  for the quarters ended December 31, 2021 and 2020, respectively. (3) General and administrative expenses exclude non‐cash stock based compensation of $2.4 MM, or $0.39 per boe, and $1.1 MM, or $0.20 per boe, for the quarters ended December 31, 2021 and 2020,  respectively. (4) Adjusted cash operating costs and adjusted cash operating margin are non‐GAAP measures. For reasons management believes this is useful to investors, refer to slide 2 “Non‐GAAP Financial Measures.” $ / Boe, unless otherwise noted For the Quarter Ended  December 31, 2021 For the Quarter Ended  December 31, 2020 Revenue $52.01  $27.04  Total Cash Operating Costs: Lease Operating Expenses (1) (4.37) (3.20) Gathering, Transportation & Processing (2.11) (1.73) Taxes Other Than Income (2.69) (1.50) Exploration Expenses (2) (0.12) (0.25) General & Administrative Expense (3) (2.03) (3.11) Total Adjusted Cash Operating Costs (4) (11.32) (9.79) Adjusted Cash Operating Margin (4) $40.69  $17.25  Margin % 78% 64% Non‐Cash Costs: Depreciation, Depletion, and Amortization (8.37) (8.08) Asset Retirement Obligations Accretion (0.14) (0.24) Amortization on Intangible Assets ‐ (0.65) Non‐cash stock based compensation (0.41) (0.21) Exploration expenses, non‐cash (0.14) (0.42) Total non‐cash expenses (9.06) (9.60) Operating Income Margin  $31.63  $7.65  Margin % 61% 28% $24.97/boe  Increase $1.53/boe  Increase
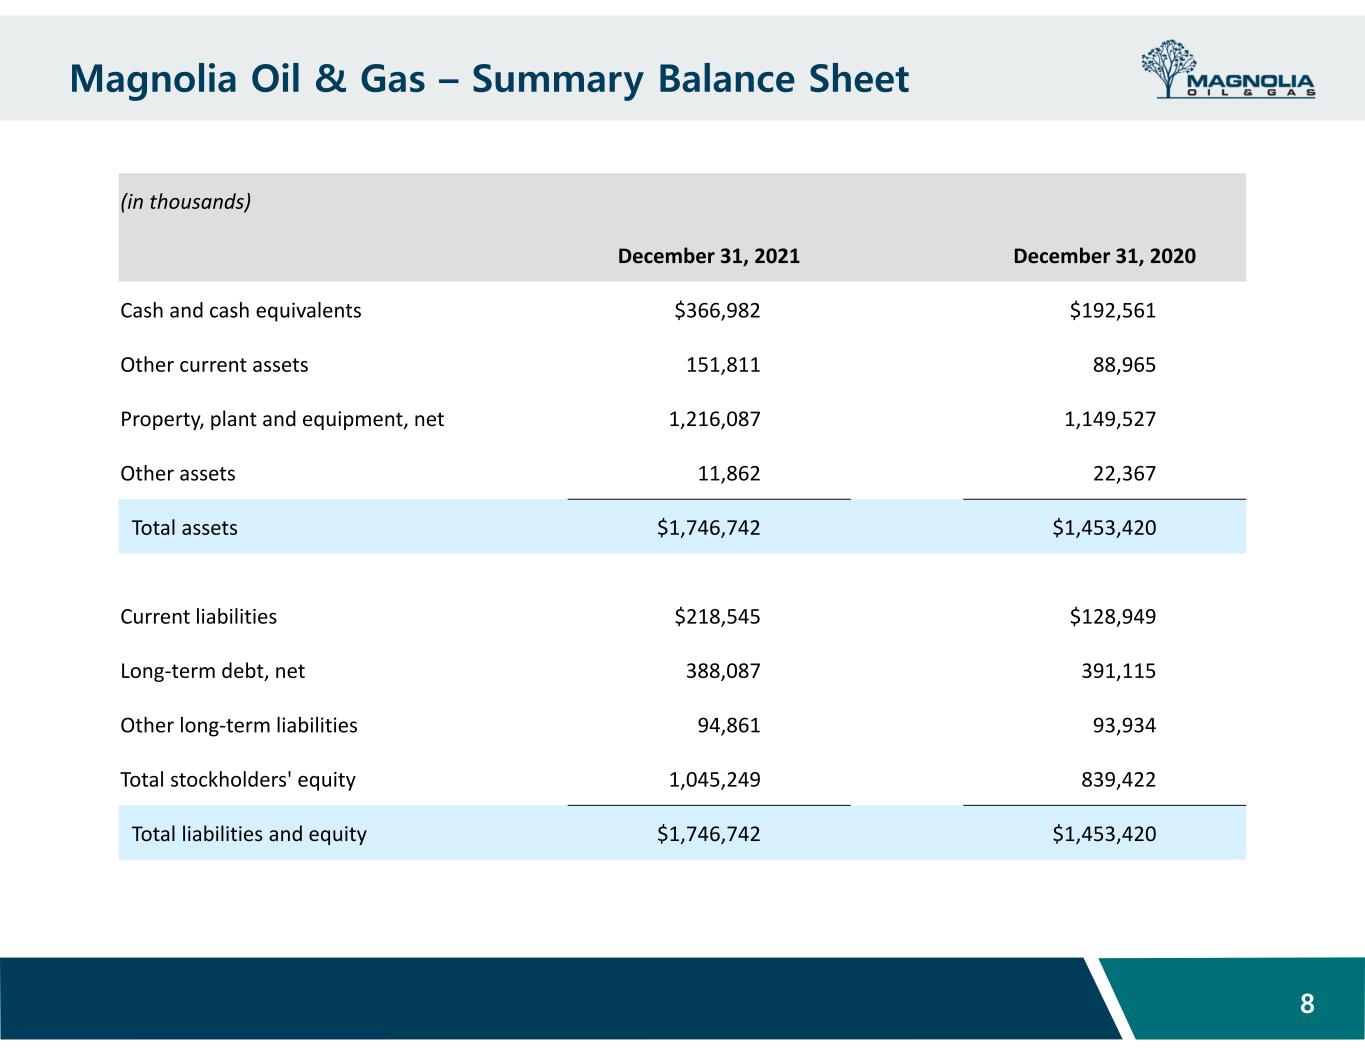

 
Magnolia Oil & Gas – Summary Balance Sheet 8 (in thousands) December 31, 2021 December 31, 2020 Cash and cash equivalents $366,982  $192,561  Other current assets 151,811  88,965  Property, plant and equipment, net 1,216,087  1,149,527  Other assets 11,862  22,367  Total assets $1,746,742  $1,453,420  Current liabilities $218,545  $128,949  Long‐term debt, net 388,087  391,115  Other long‐term liabilities 94,861  93,934  Total stockholders' equity 1,045,249  839,422  Total liabilities and equity $1,746,742  $1,453,420 
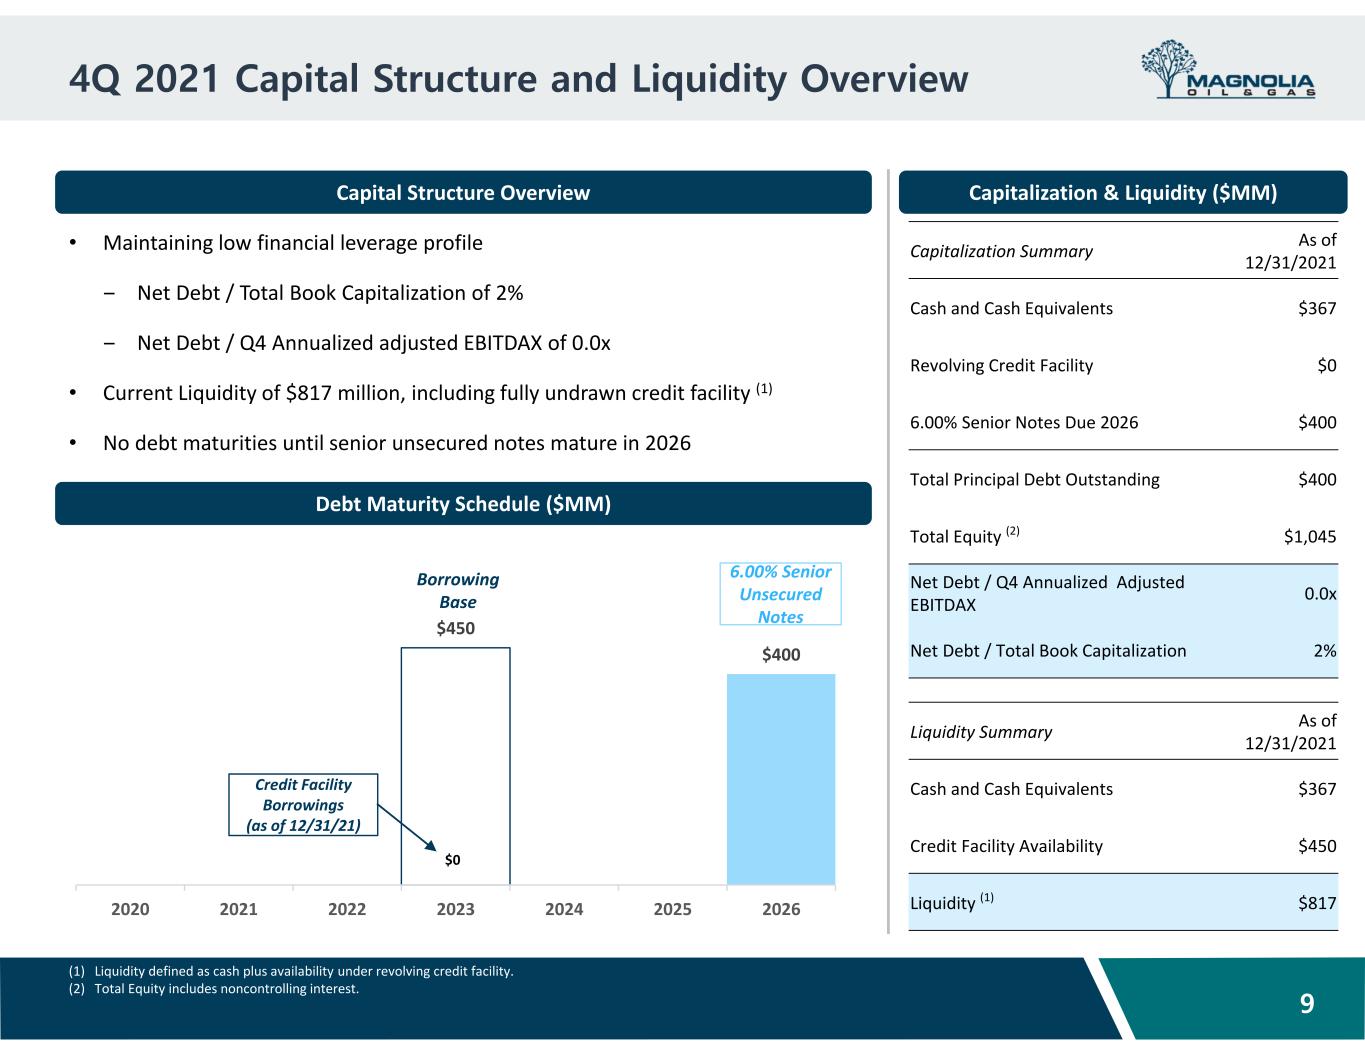

 
4Q 2021 Capital Structure and Liquidity Overview 9 Capital Structure Overview • Maintaining low financial leverage profile ‒ Net Debt / Total Book Capitalization of 2% ‒ Net Debt / Q4 Annualized adjusted EBITDAX of 0.0x • Current Liquidity of $817 million, including fully undrawn credit facility (1) • No debt maturities until senior unsecured notes mature in 2026  Debt Maturity Schedule ($MM) (1) Liquidity defined as cash plus availability under revolving credit facility. (2) Total Equity includes noncontrolling interest.  Capitalization & Liquidity ($MM) $450  $400  2020 2021 2022 2023 2024 2025 2026 Borrowing  Base Credit Facility  Borrowings  (as of 12/31/21) $0 6.00% Senior  Unsecured  Notes Capitalization Summary As of  12/31/2021 Cash and Cash Equivalents $367  Revolving Credit Facility $0  6.00% Senior Notes Due 2026 $400  Total Principal Debt Outstanding $400  Total Equity (2) $1,045  Net Debt / Q4 Annualized  Adjusted  EBITDAX 0.0x Net Debt / Total Book Capitalization 2% Liquidity Summary As of  12/31/2021 Cash and Cash Equivalents $367  Credit Facility Availability $450  Liquidity (1) $817 
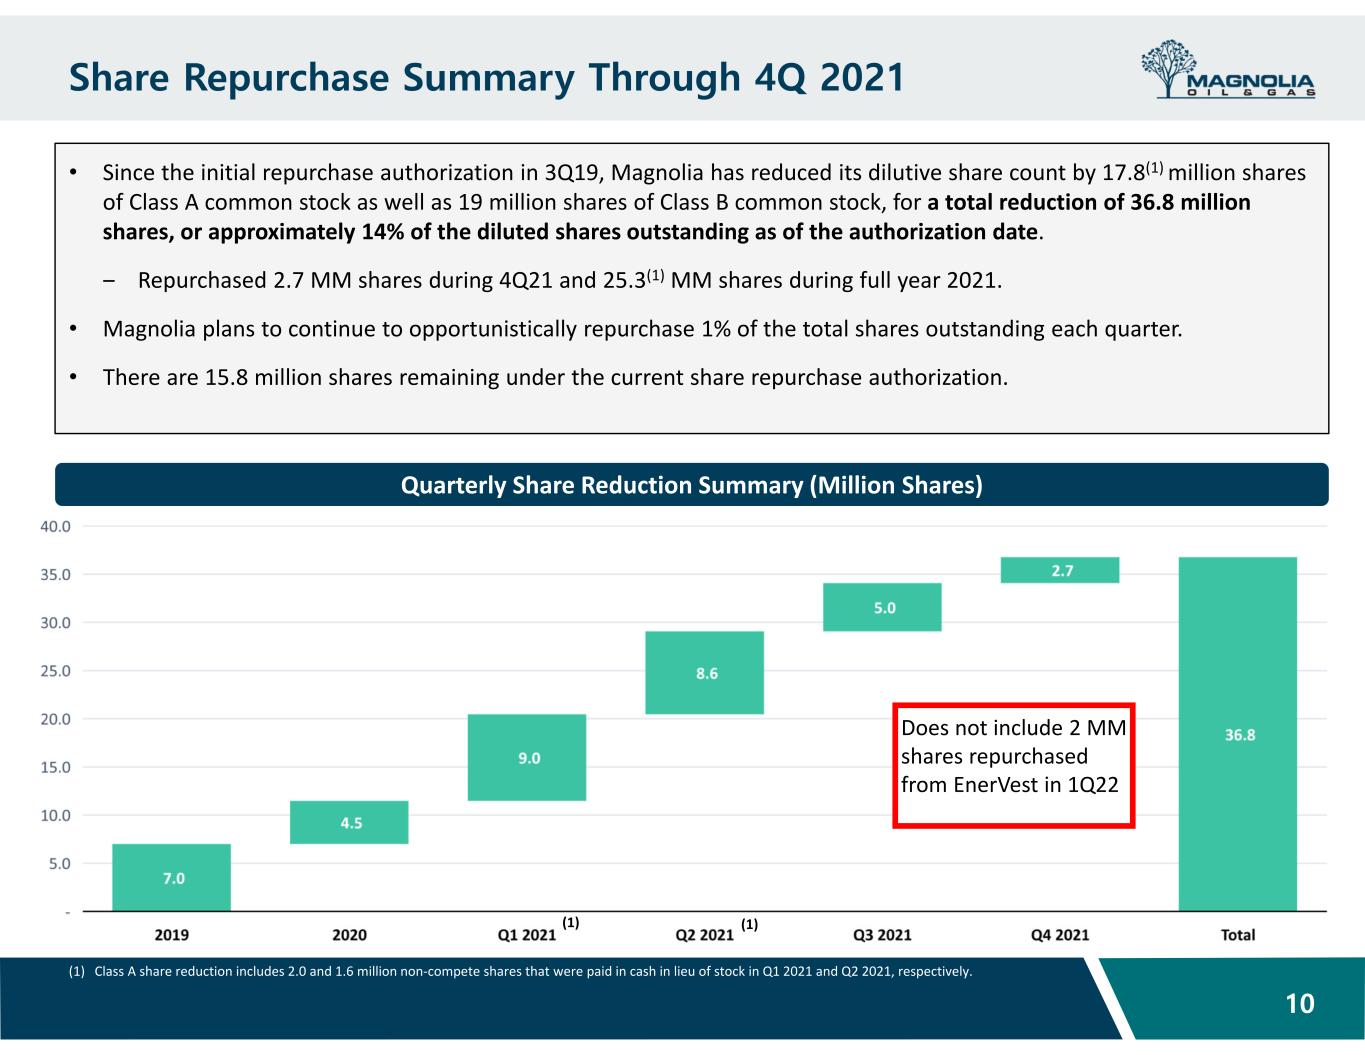

 
Share Repurchase Summary Through 4Q 2021 10 Quarterly Share Reduction Summary (Million Shares) • Since the initial repurchase authorization in 3Q19, Magnolia has reduced its dilutive share count by 17.8(1) million shares  of Class A common stock as well as 19 million shares of Class B common stock, for a total reduction of 36.8 million  shares, or approximately 14% of the diluted shares outstanding as of the authorization date. ‒ Repurchased 2.7 MM shares during 4Q21 and 25.3(1) MM shares during full year 2021. • Magnolia plans to continue to opportunistically repurchase 1% of the total shares outstanding each quarter. • There are 15.8 million shares remaining under the current share repurchase authorization.  (1) Class A share reduction includes 2.0 and 1.6 million non‐compete shares that were paid in cash in lieu of stock in Q1 2021 and Q2 2021, respectively. (1) (1) Does not include 2 MM  shares repurchased  from EnerVest in 1Q22
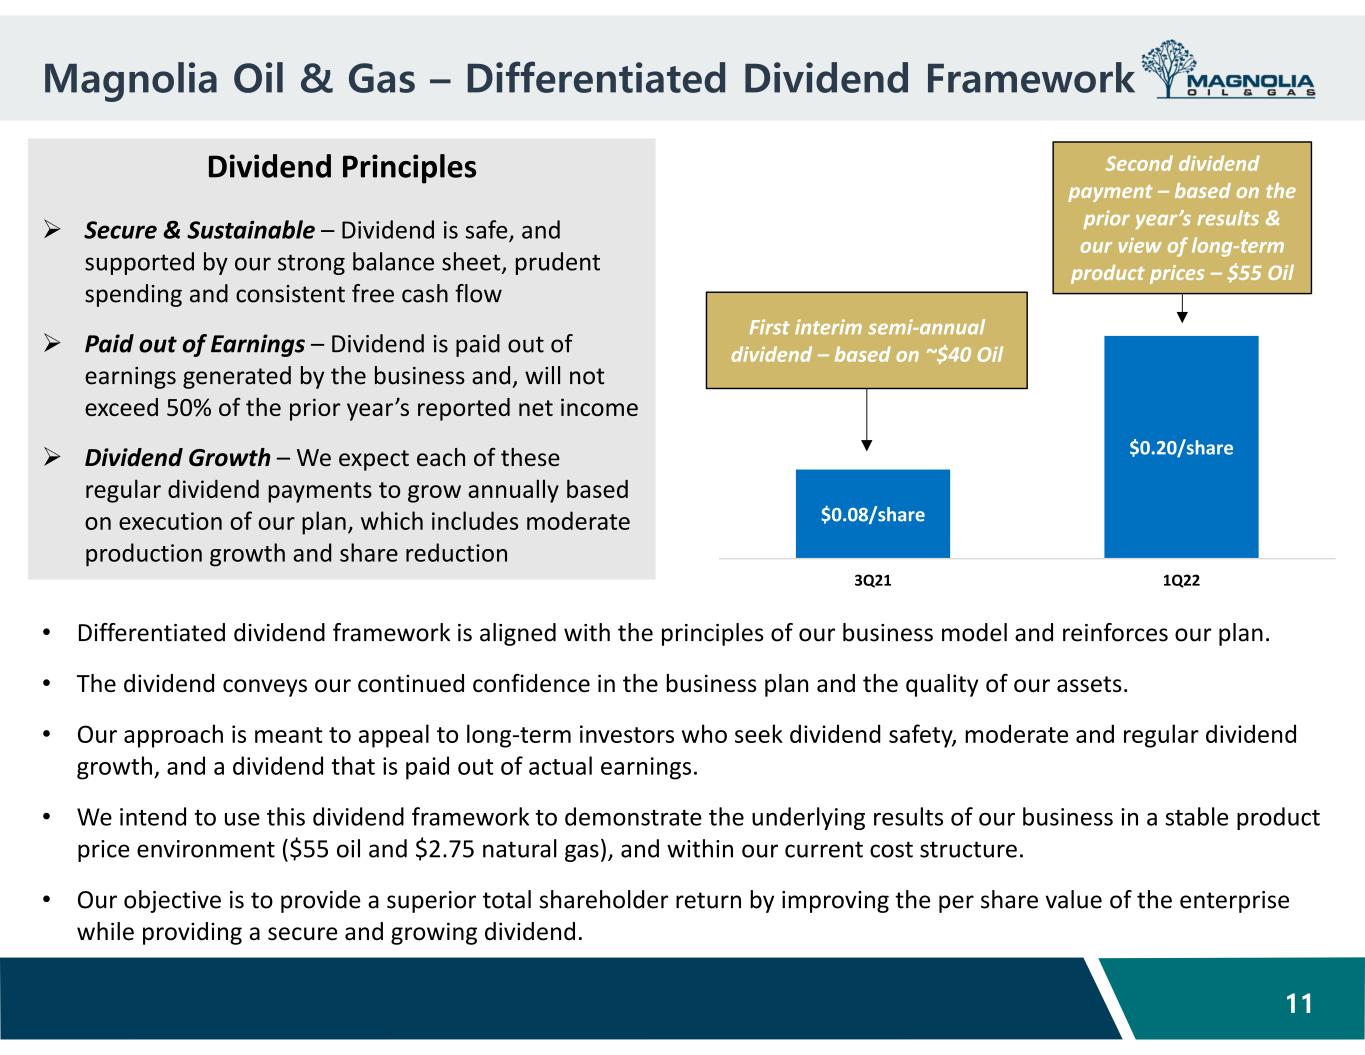

 
$0.08/share $0.20/share 3Q21 1Q22 Magnolia Oil & Gas – Differentiated Dividend Framework 11 • Differentiated dividend framework is aligned with the principles of our business model and reinforces our plan. • The dividend conveys our continued confidence in the business plan and the quality of our assets.   • Our approach is meant to appeal to long‐term investors who seek dividend safety, moderate and regular dividend  growth, and a dividend that is paid out of actual earnings.  • We intend to use this dividend framework to demonstrate the underlying results of our business in a stable product  price environment ($55 oil and $2.75 natural gas), and within our current cost structure.   • Our objective is to provide a superior total shareholder return by improving the per share value of the enterprise  while providing a secure and growing dividend.  Dividend Principles  Secure & Sustainable – Dividend is safe, and  supported by our strong balance sheet, prudent  spending and consistent free cash flow  Paid out of Earnings – Dividend is paid out of  earnings generated by the business and, will not  exceed 50% of the prior year’s reported net income  Dividend Growth – We expect each of these  regular dividend payments to grow annually based  on execution of our plan, which includes moderate  production growth and share reduction First interim semi‐annual  dividend – based on ~$40 Oil Second dividend  payment – based on the  prior year’s results &  our view of long‐term  product prices – $55 Oil
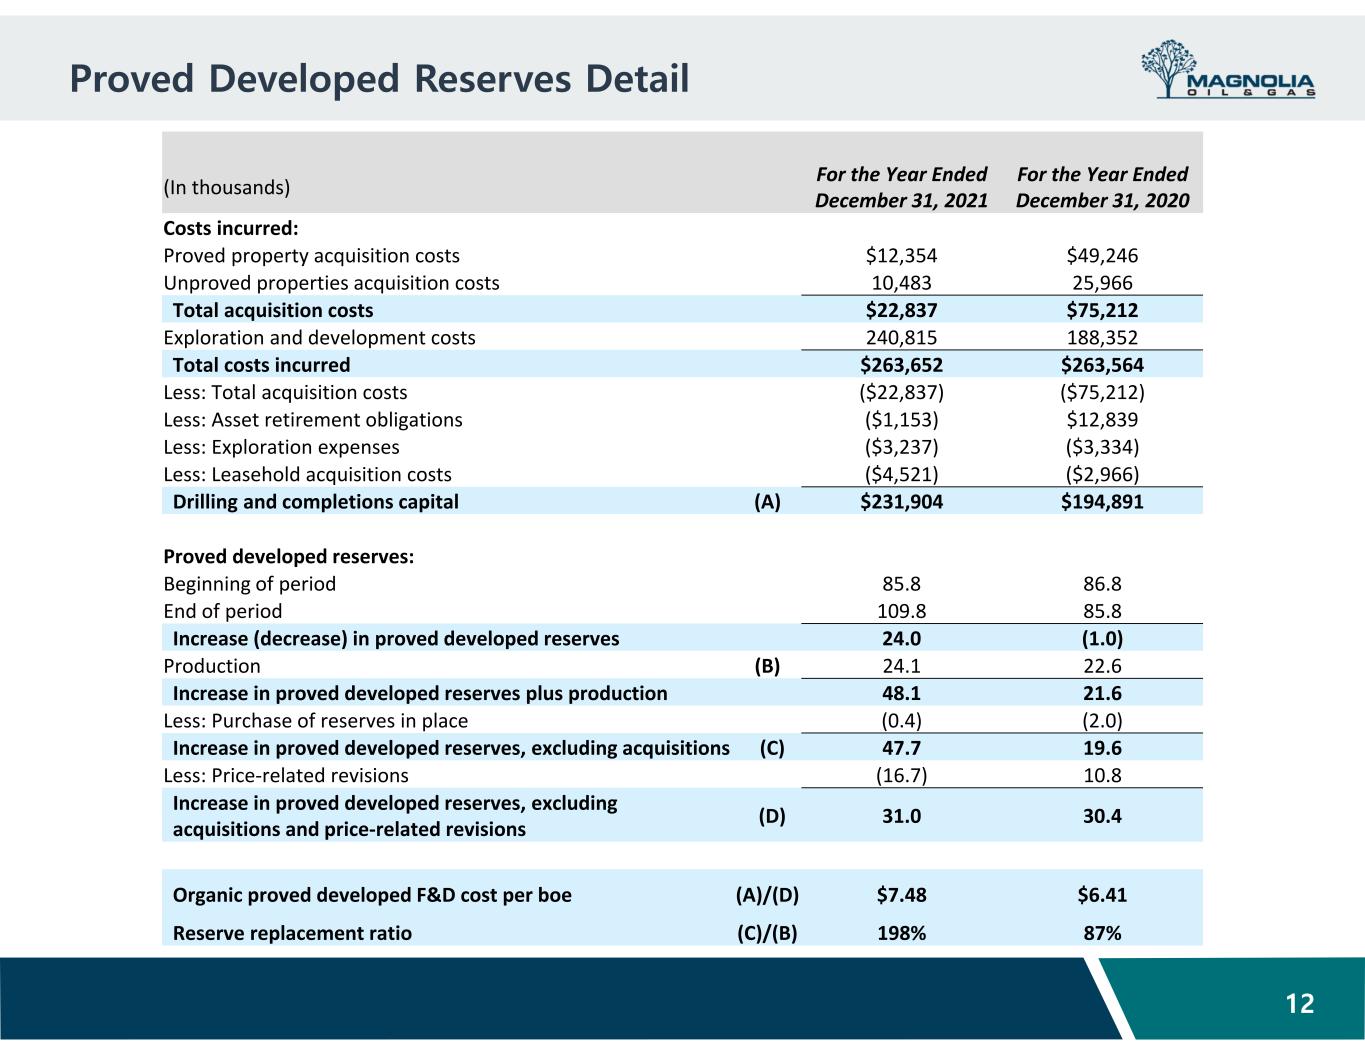

 
Proved Developed Reserves Detail 12 (In thousands) For the Year Ended  December 31, 2021 For the Year Ended  December 31, 2020 Costs incurred: Proved property acquisition costs $12,354  $49,246  Unproved properties acquisition costs 10,483  25,966  Total acquisition costs $22,837  $75,212  Exploration and development costs 240,815  188,352  Total costs incurred $263,652  $263,564  Less: Total acquisition costs ($22,837) ($75,212) Less: Asset retirement obligations ($1,153) $12,839  Less: Exploration expenses ($3,237) ($3,334) Less: Leasehold acquisition costs ($4,521) ($2,966) Drilling and completions capital (A) $231,904  $194,891  Proved developed reserves: Beginning of period 85.8  86.8  End of period 109.8  85.8  Increase (decrease) in proved developed reserves 24.0  (1.0) Production (B) 24.1  22.6  Increase in proved developed reserves plus production 48.1  21.6  Less: Purchase of reserves in place (0.4) (2.0) Increase in proved developed reserves, excluding acquisitions (C) 47.7  19.6  Less: Price‐related revisions (16.7) 10.8  Increase in proved developed reserves, excluding acquisitions and price‐related revisions (D) 31.0  30.4  Organic proved developed F&D cost per boe (A)/(D) $7.48  $6.41  Reserve replacement ratio (C)/(B) 198% 87%

 
Appendix
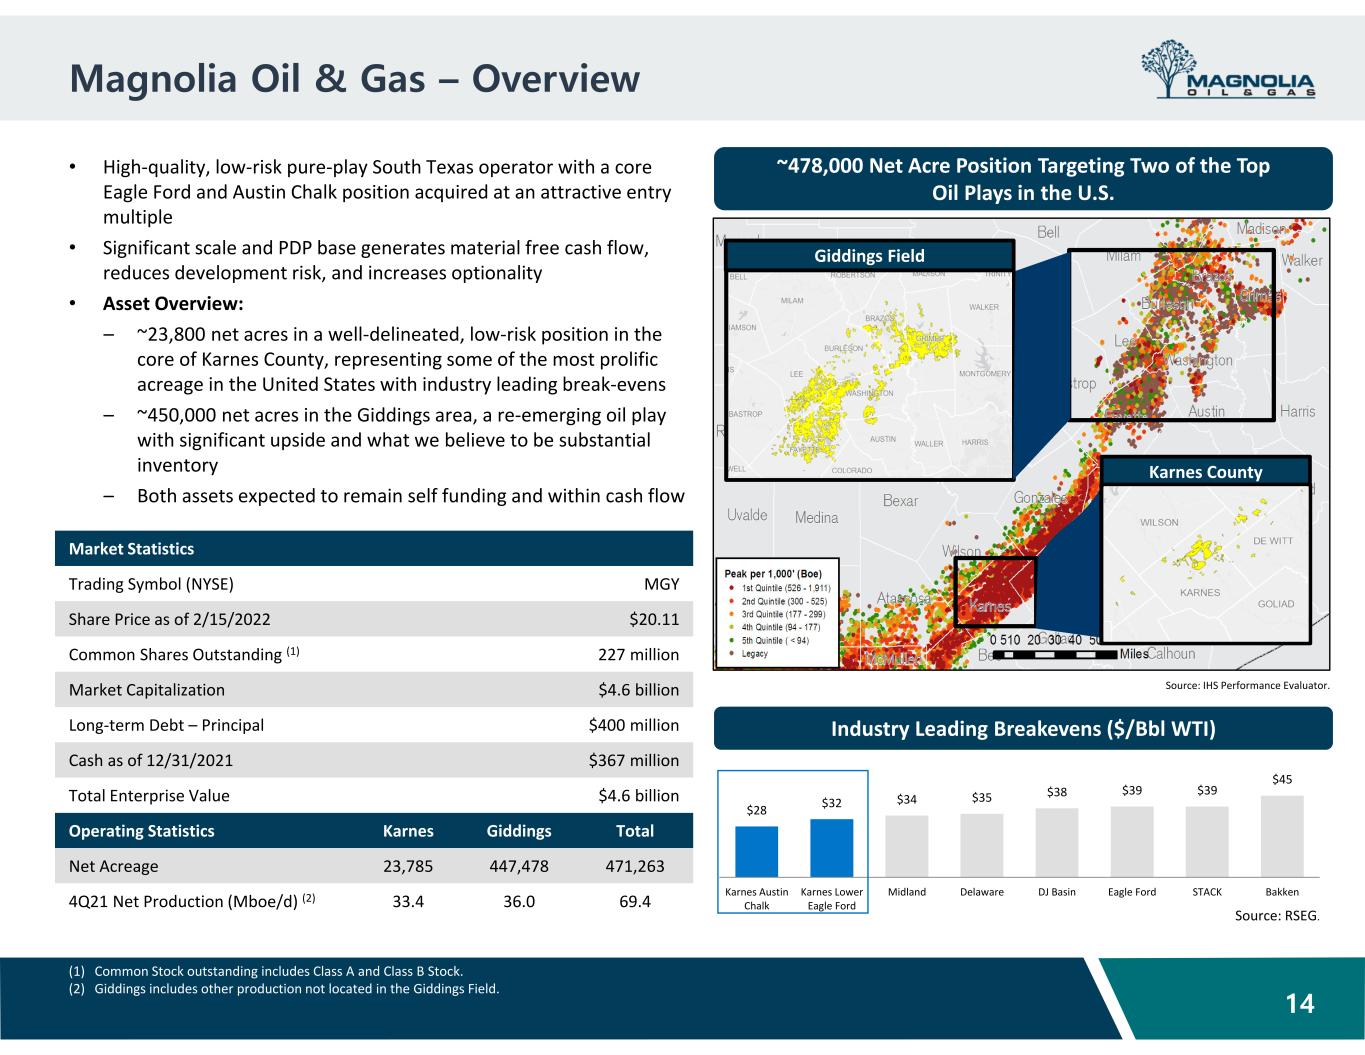

 
Magnolia Oil & Gas – Overview • High‐quality, low‐risk pure‐play South Texas operator with a core  Eagle Ford and Austin Chalk position acquired at an attractive entry  multiple • Significant scale and PDP base generates material free cash flow,  reduces development risk, and increases optionality • Asset Overview: – ~23,800 net acres in a well‐delineated, low‐risk position in the  core of Karnes County, representing some of the most prolific  acreage in the United States with industry leading break‐evens – ~450,000 net acres in the Giddings area, a re‐emerging oil play  with significant upside and what we believe to be substantial  inventory – Both assets expected to remain self funding and within cash flow 14 ~478,000 Net Acre Position Targeting Two of the Top  Oil Plays in the U.S. Market Statistics Trading Symbol (NYSE) MGY Share Price as of 2/15/2022 $20.11 Common Shares Outstanding (1) 227 million Market Capitalization $4.6 billion Long‐term Debt – Principal $400 million Cash as of 12/31/2021 $367 million Total Enterprise Value  $4.6 billion Operating Statistics Karnes  Giddings  Total Net Acreage 23,785 447,478 471,263 4Q21 Net Production (Mboe/d) (2) 33.4 36.0 69.4 Industry Leading Breakevens ($/Bbl WTI) $28  $32  $34  $35  $38  $39  $39  $45  Karnes Austin Chalk Karnes Lower Eagle Ford Midland Delaware DJ Basin Eagle Ford STACK Bakken Source: RSEG. (1) Common Stock outstanding includes Class A and Class B Stock. (2) Giddings includes other production not located in the Giddings Field. Karnes County Giddings Field Source: IHS Performance Evaluator. Wilson Dewitt Gonzales
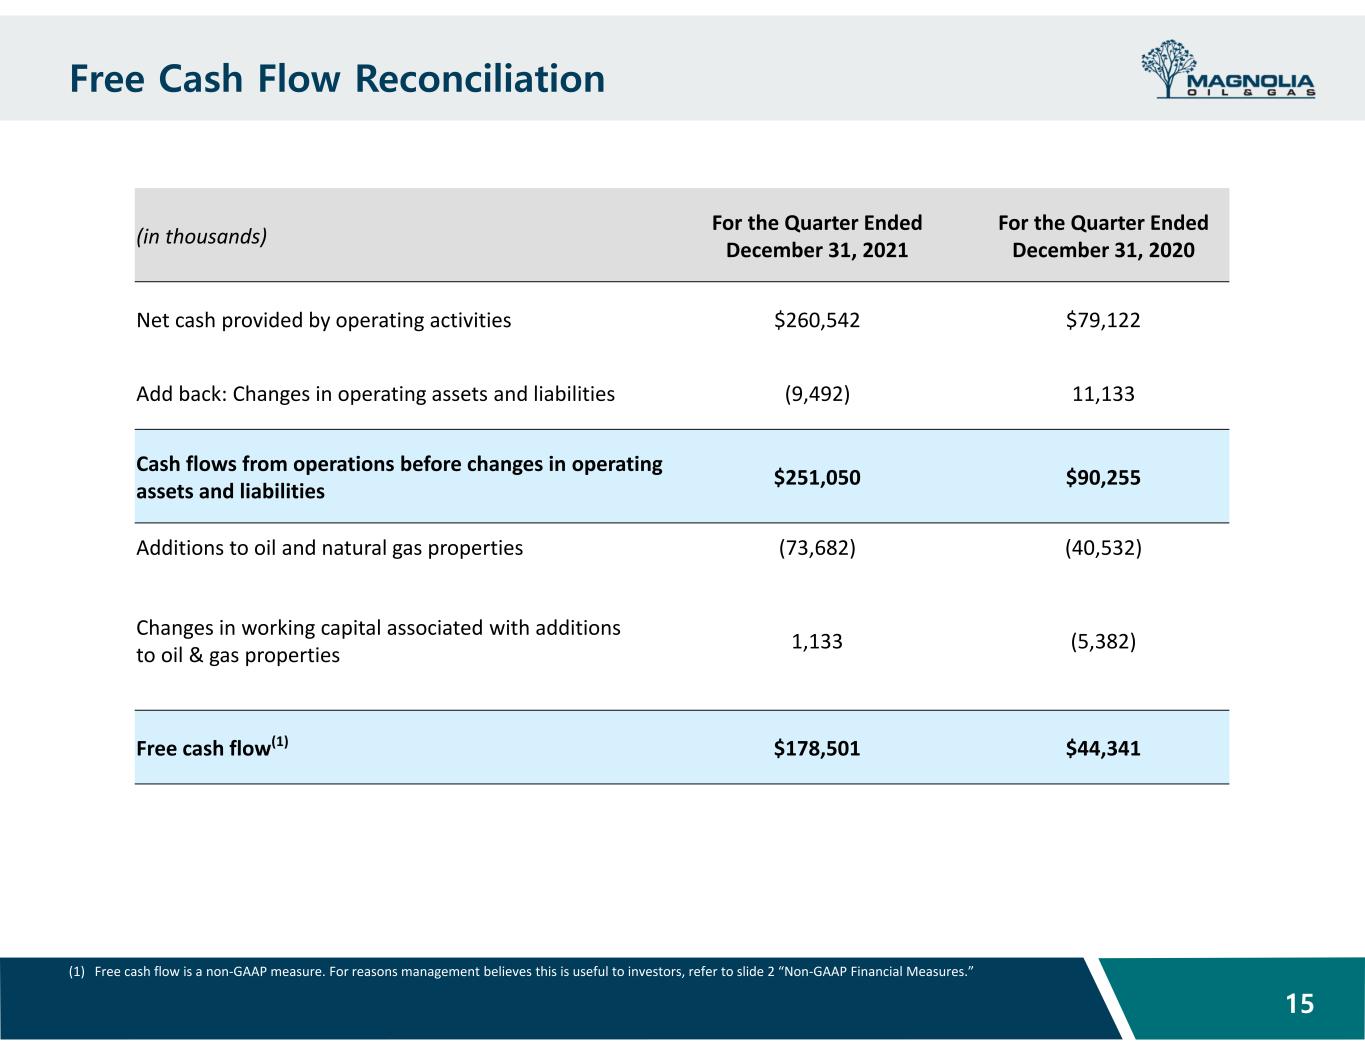

 
Free Cash Flow Reconciliation 15 (1) Free cash flow is a non‐GAAP measure. For reasons management believes this is useful to investors, refer to slide 2 “Non‐GAAP Financial Measures.” (in thousands) For the Quarter Ended  December 31, 2021 For the Quarter Ended  December 31, 2020 Net cash provided by operating activities $260,542  $79,122  Add back: Changes in operating assets and liabilities (9,492) 11,133  Cash flows from operations before changes in operating  assets and liabilities $251,050  $90,255  Additions to oil and natural gas properties (73,682) (40,532) Changes in working capital associated with additions to oil & gas properties 1,133  (5,382) Free cash flow(1) $178,501  $44,341 
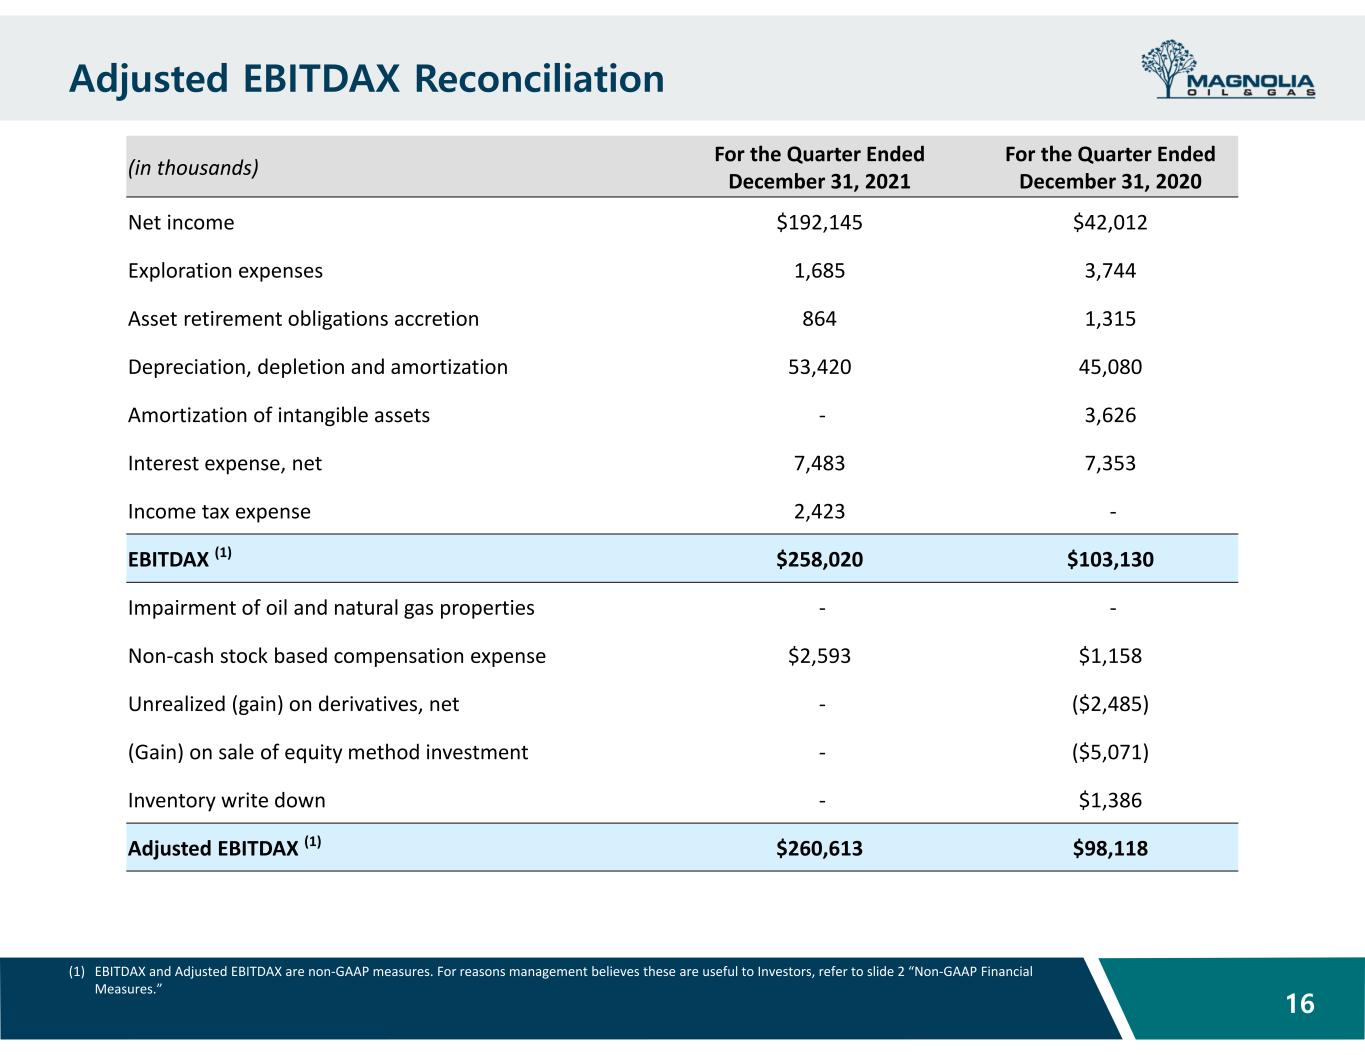

 
Adjusted EBITDAX Reconciliation 16 (1) EBITDAX and Adjusted EBITDAX are non‐GAAP measures. For reasons management believes these are useful to Investors, refer to slide 2 “Non‐GAAP Financial  Measures.” (in thousands) For the Quarter Ended  December 31, 2021 For the Quarter Ended  December 31, 2020 Net income $192,145  $42,012  Exploration expenses 1,685  3,744  Asset retirement obligations accretion  864  1,315  Depreciation, depletion and amortization 53,420  45,080  Amortization of intangible assets ‐ 3,626  Interest expense, net 7,483  7,353  Income tax expense 2,423  ‐ EBITDAX (1) $258,020  $103,130  Impairment of oil and natural gas properties ‐ ‐ Non‐cash stock based compensation expense $2,593  $1,158  Unrealized (gain) on derivatives, net ‐ ($2,485) (Gain) on sale of equity method investment ‐ ($5,071) Inventory write down ‐ $1,386  Adjusted EBITDAX (1) $260,613  $98,118 
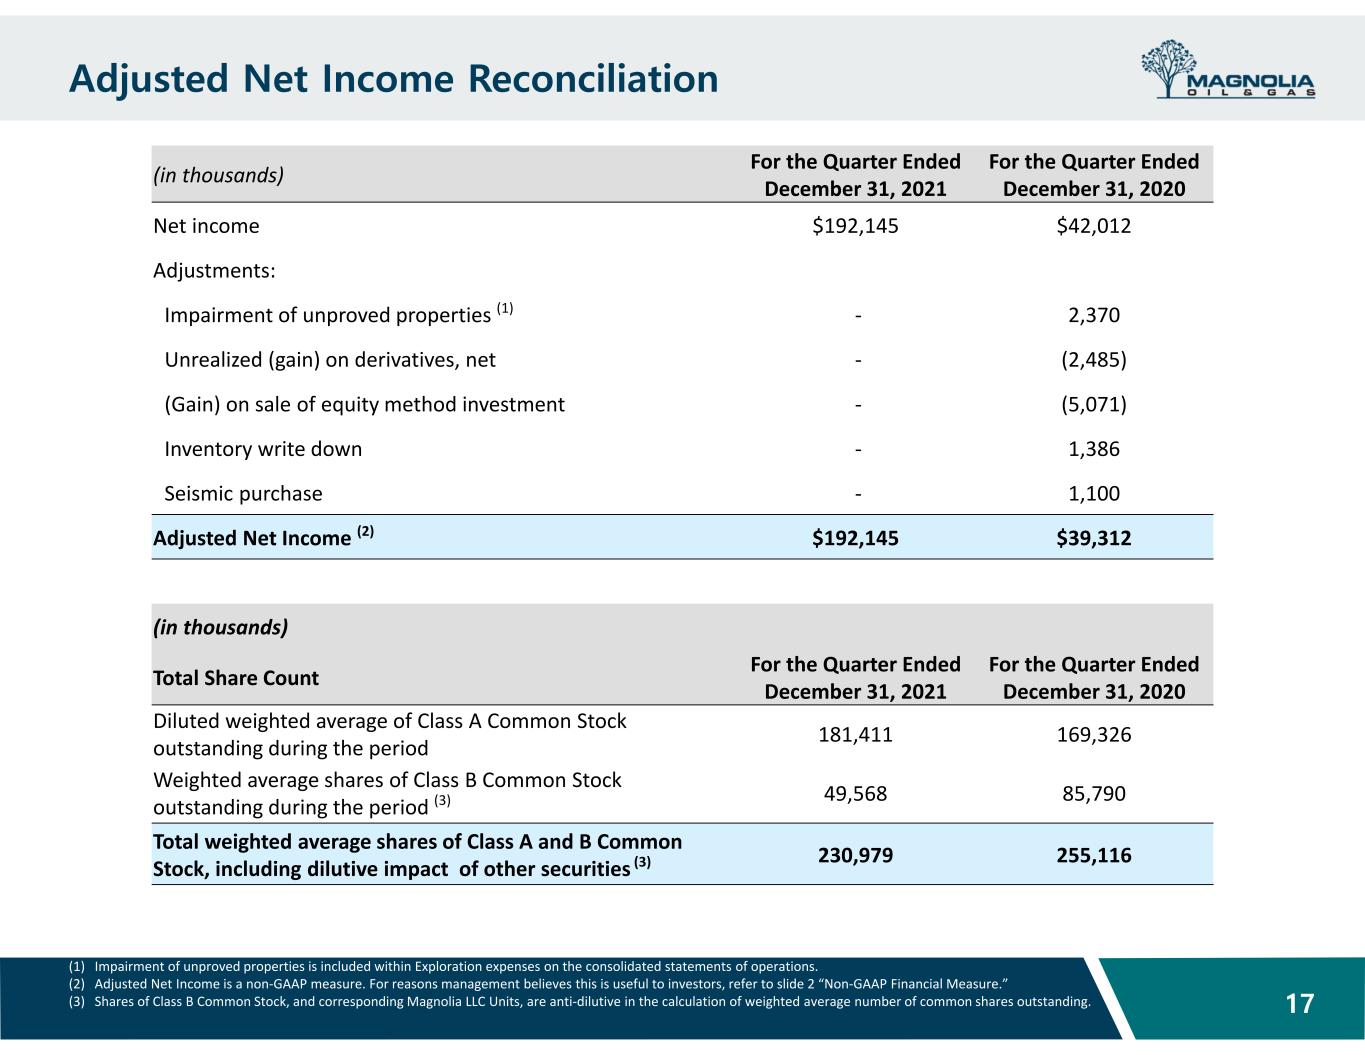

 
Adjusted Net Income Reconciliation 17 (1) Impairment of unproved properties is included within Exploration expenses on the consolidated statements of operations. (2) Adjusted Net Income is a non‐GAAP measure. For reasons management believes this is useful to investors, refer to slide 2 “Non‐GAAP Financial Measure.” (3) Shares of Class B Common Stock, and corresponding Magnolia LLC Units, are anti‐dilutive in the calculation of weighted average number of common shares outstanding. (in thousands) For the Quarter Ended  December 31, 2021 For the Quarter Ended  December 31, 2020 Net income  $192,145  $42,012  Adjustments: Impairment of unproved properties (1) ‐ 2,370  Unrealized (gain) on derivatives, net ‐ (2,485) (Gain) on sale of equity method investment ‐ (5,071) Inventory write down ‐ 1,386  Seismic purchase ‐ 1,100  Adjusted Net Income (2) $192,145  $39,312  (in thousands) Total Share Count For the Quarter Ended  December 31, 2021 For the Quarter Ended  December 31, 2020 Diluted weighted average of Class A Common Stock  outstanding during the period 181,411  169,326  Weighted average shares of Class B Common Stock  outstanding during the period (3) 49,568  85,790  Total weighted average shares of Class A and B Common  Stock, including dilutive impact  of other securities (3) 230,979  255,116 
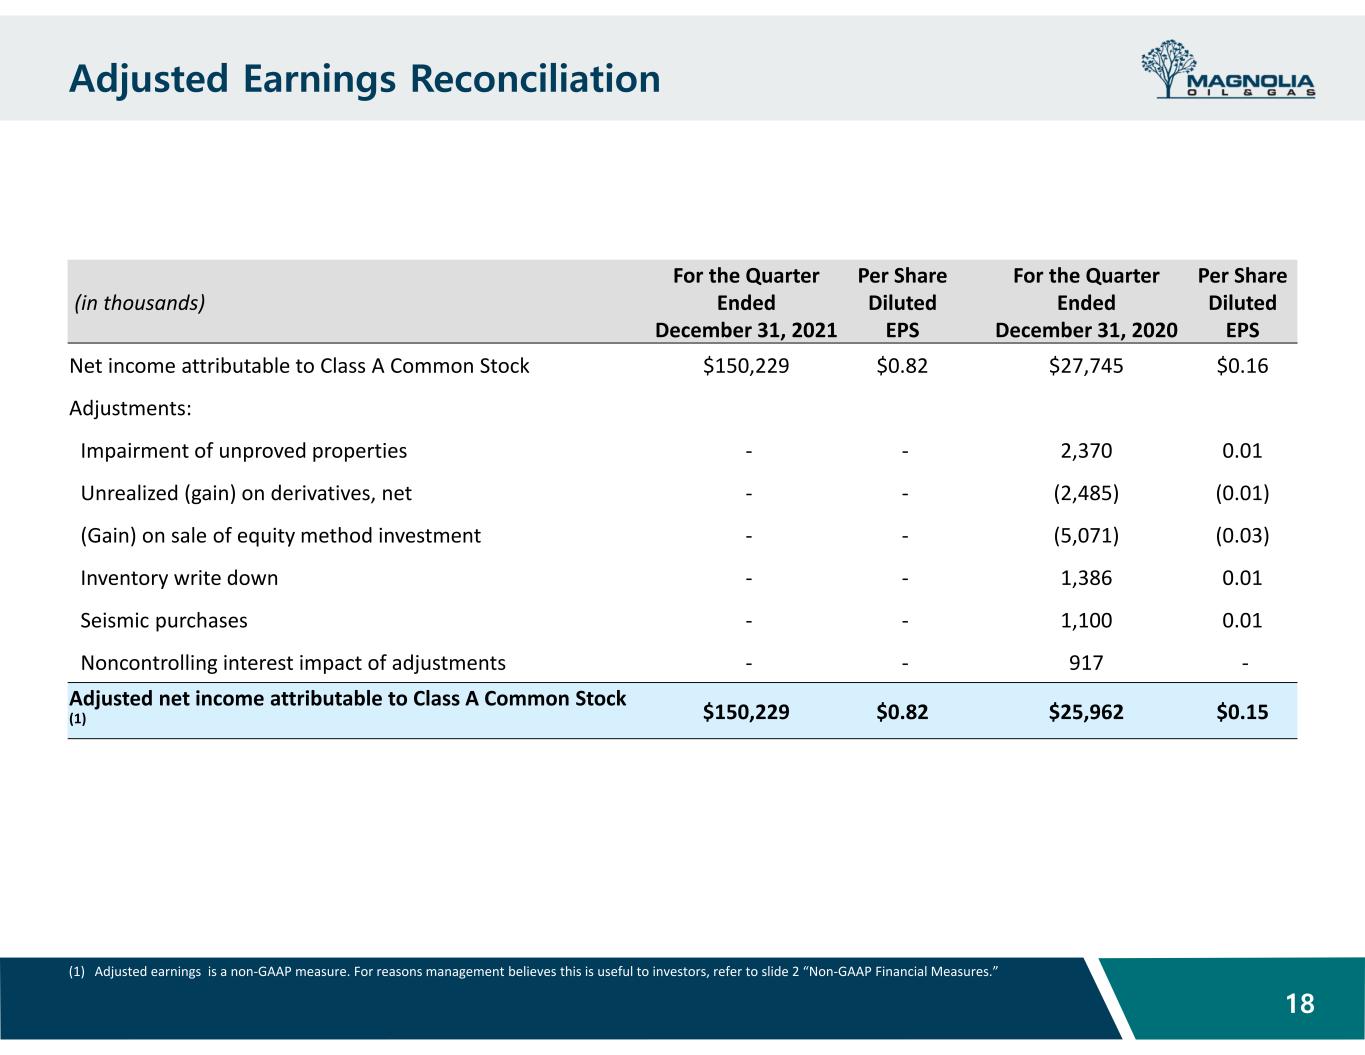

 
Adjusted Earnings Reconciliation 18 (1) Adjusted earnings  is a non‐GAAP measure. For reasons management believes this is useful to investors, refer to slide 2 “Non‐GAAP Financial Measures.” (in thousands) For the Quarter  Ended  December 31, 2021 Per Share  Diluted  EPS For the Quarter  Ended  December 31, 2020 Per Share  Diluted  EPS Net income attributable to Class A Common Stock $150,229  $0.82  $27,745  $0.16  Adjustments: Impairment of unproved properties ‐ ‐ 2,370 0.01 Unrealized (gain) on derivatives, net ‐ ‐ (2,485) (0.01) (Gain) on sale of equity method investment ‐ ‐ (5,071) (0.03) Inventory write down ‐ ‐ 1,386  0.01  Seismic purchases ‐ ‐ 1,100  0.01  Noncontrolling interest impact of adjustments ‐ ‐ 917  ‐ Adjusted net income attributable to Class A Common Stock  (1) $150,229  $0.82  $25,962  $0.15 
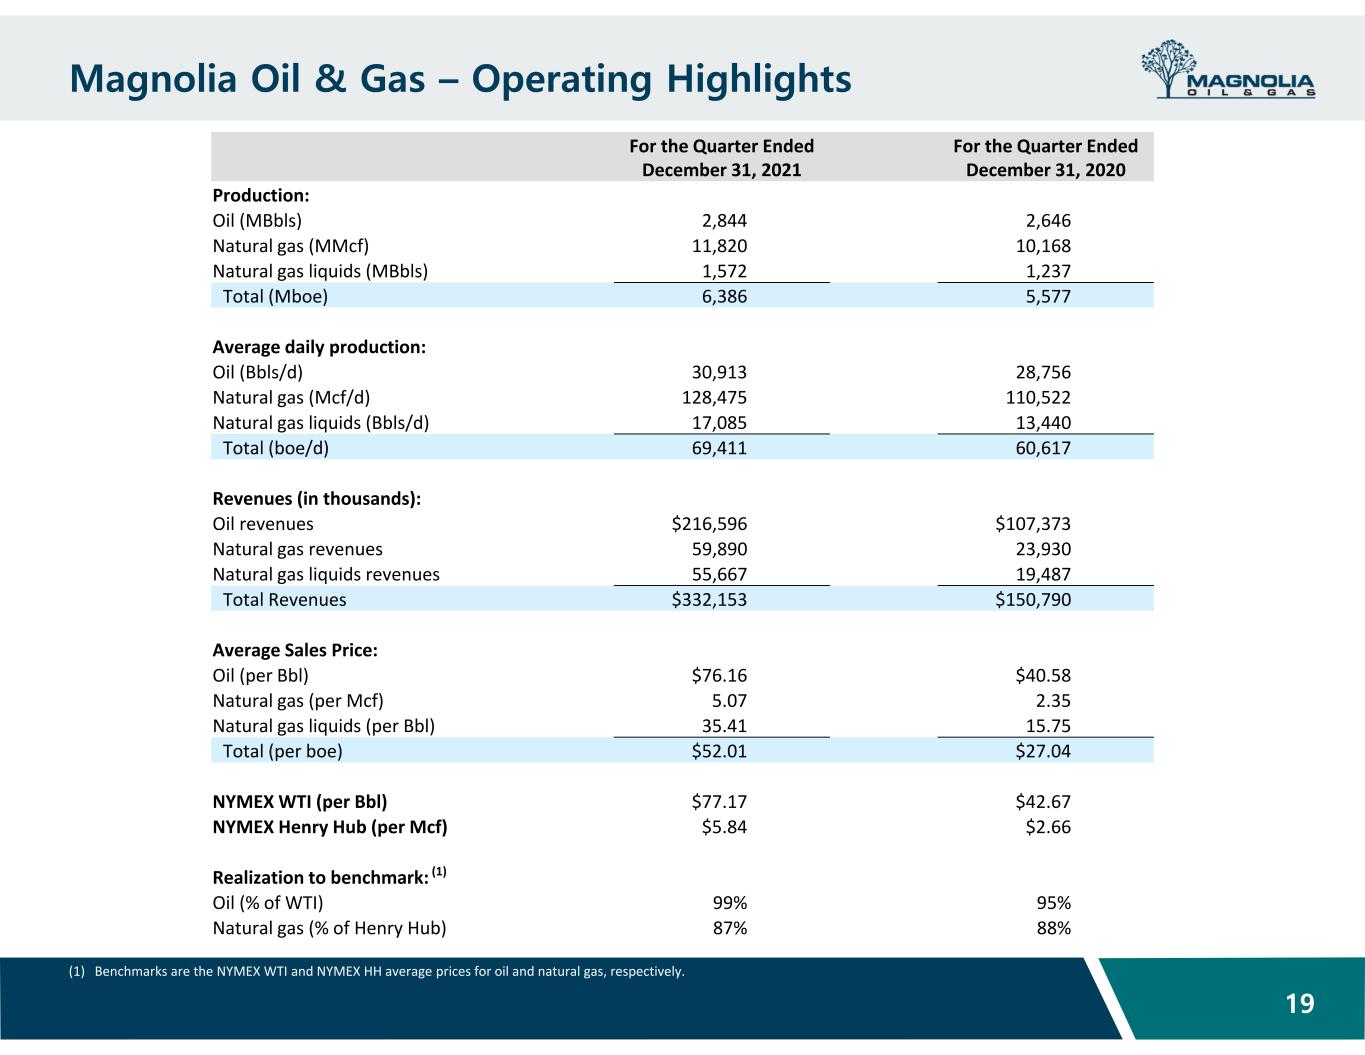

 
Magnolia Oil & Gas – Operating Highlights 19 (1) Benchmarks are the NYMEX WTI and NYMEX HH average prices for oil and natural gas, respectively. For the Quarter Ended  December 31, 2021 For the Quarter Ended  December 31, 2020 Production: Oil (MBbls) 2,844  2,646  Natural gas (MMcf) 11,820  10,168  Natural gas liquids (MBbls) 1,572  1,237  Total (Mboe) 6,386  5,577  Average daily production: Oil (Bbls/d) 30,913  28,756  Natural gas (Mcf/d) 128,475  110,522  Natural gas liquids (Bbls/d) 17,085  13,440  Total (boe/d) 69,411  60,617  Revenues (in thousands): Oil revenues $216,596  $107,373  Natural gas revenues 59,890  23,930  Natural gas liquids revenues 55,667  19,487  Total Revenues $332,153  $150,790  Average Sales Price: Oil (per Bbl) $76.16  $40.58  Natural gas (per Mcf) 5.07  2.35  Natural gas liquids (per Bbl) 35.41  15.75  Total (per boe) $52.01  $27.04  NYMEX WTI (per Bbl) $77.17  $42.67  NYMEX Henry Hub (per Mcf) $5.84  $2.66  Realization to benchmark: (1) Oil (% of WTI) 99% 95% Natural gas (% of Henry Hub) 87% 88%
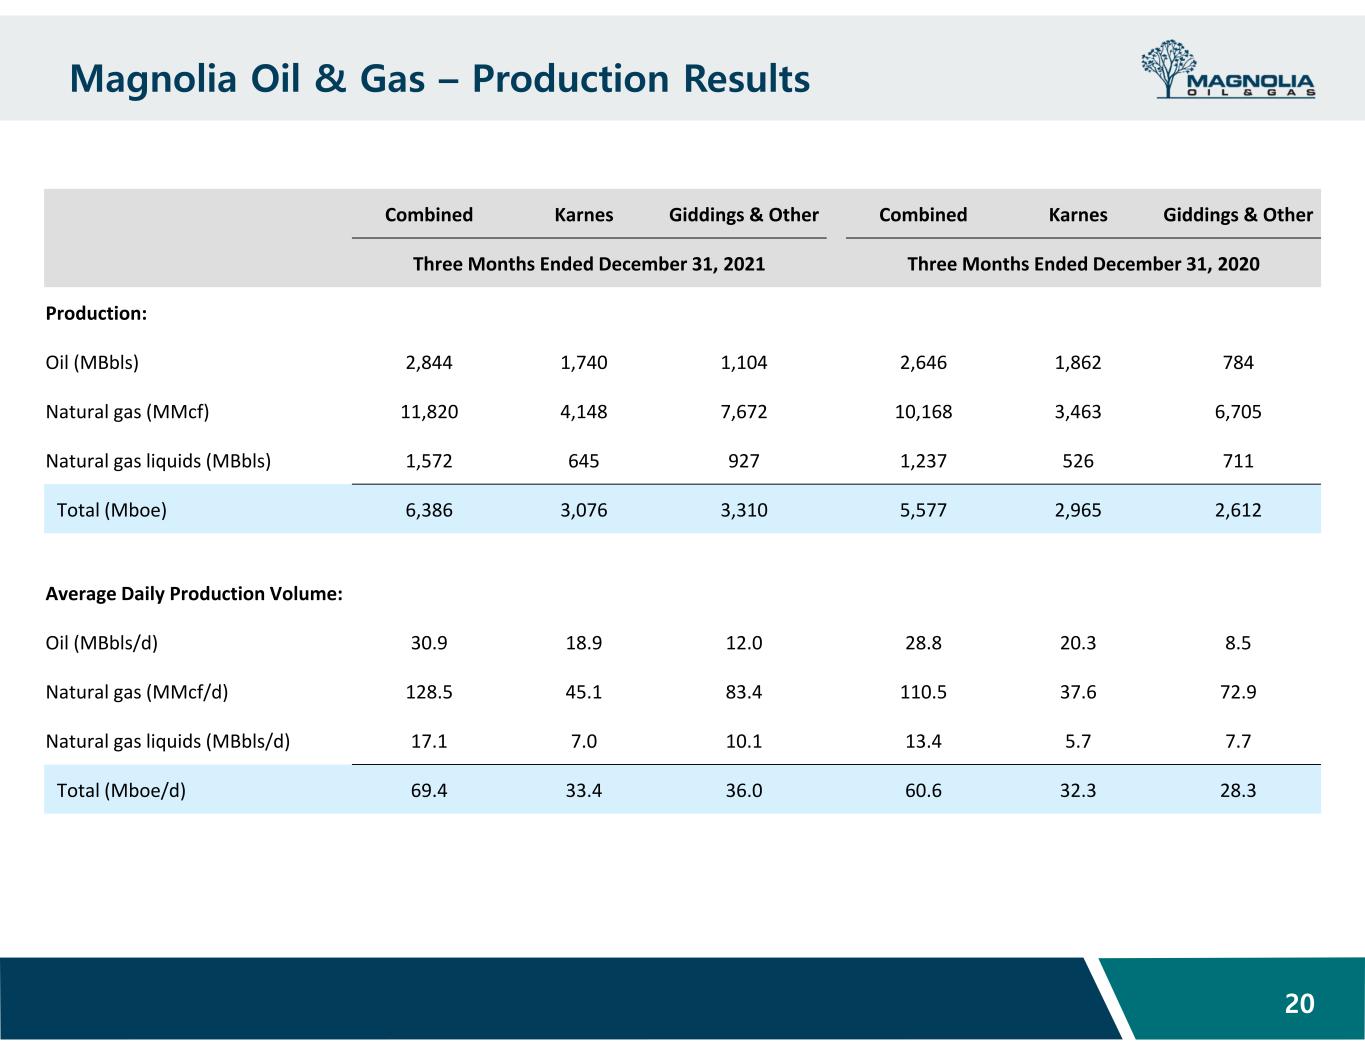

 
Magnolia Oil & Gas – Production Results 20 Combined Karnes Giddings & Other Combined Karnes Giddings & Other Three Months Ended December 31, 2021 Three Months Ended December 31, 2020 Production: Oil (MBbls) 2,844  1,740  1,104  2,646  1,862  784  Natural gas (MMcf) 11,820  4,148  7,672  10,168  3,463  6,705  Natural gas liquids (MBbls) 1,572  645  927  1,237  526  711  Total (Mboe) 6,386  3,076  3,310  5,577  2,965  2,612  Average Daily Production Volume: Oil (MBbls/d) 30.9  18.9  12.0  28.8  20.3  8.5  Natural gas (MMcf/d) 128.5  45.1  83.4  110.5  37.6  72.9  Natural gas liquids (MBbls/d) 17.1  7.0  10.1  13.4  5.7  7.7  Total (Mboe/d) 69.4  33.4  36.0  60.6  32.3  28.3 
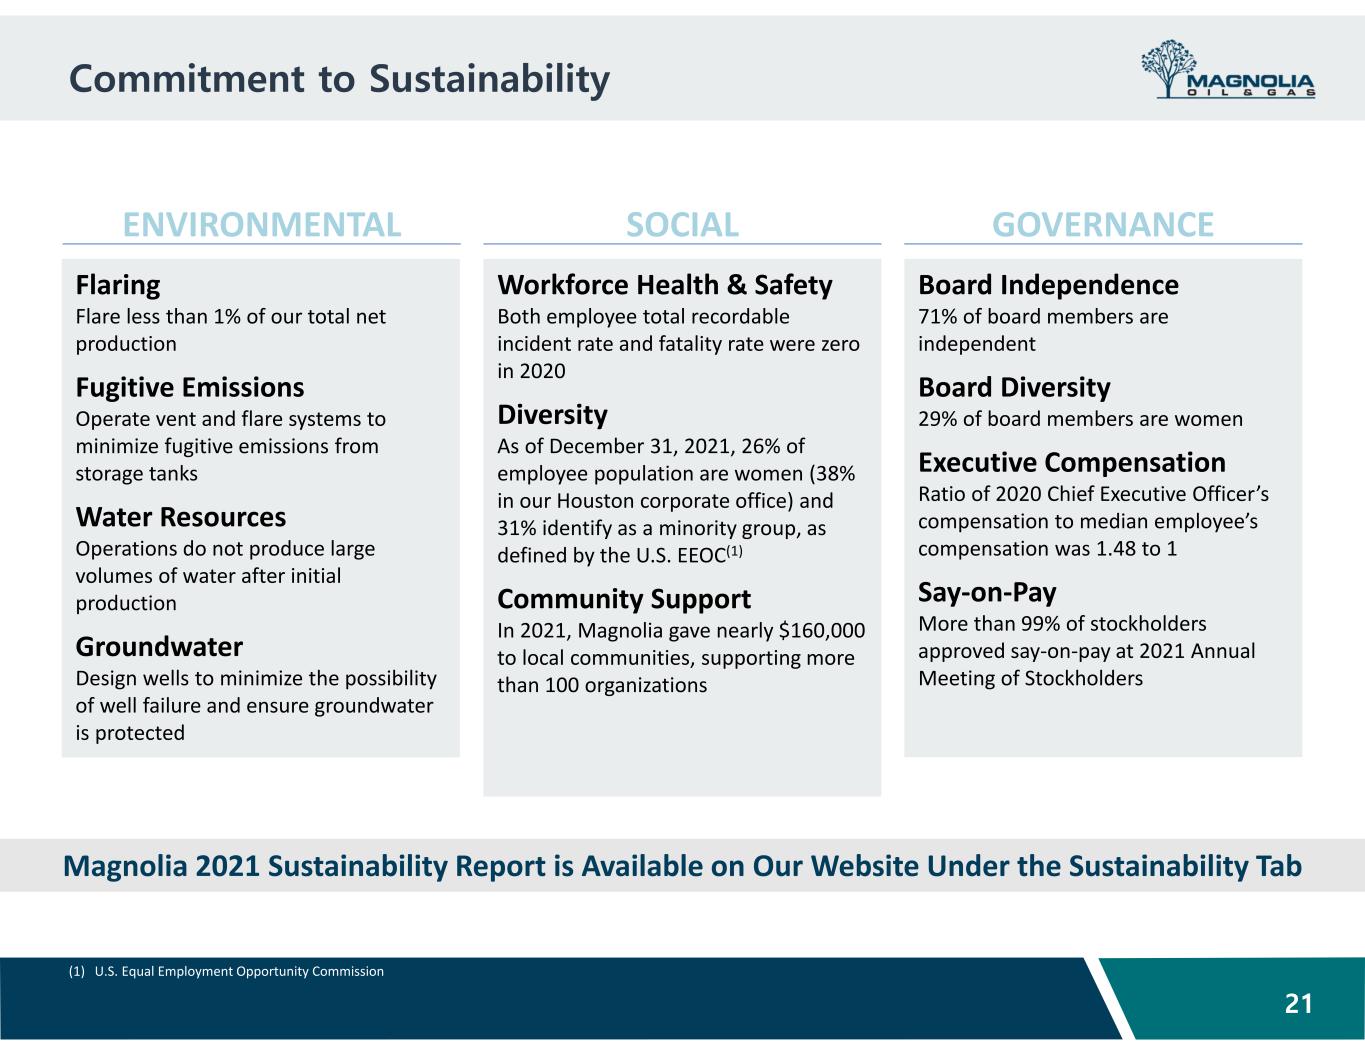

 
Commitment to Sustainability 21 ENVIRONMENTAL SOCIAL GOVERNANCE Flaring Flare less than 1% of our total net  production  Fugitive Emissions Operate vent and flare systems to  minimize fugitive emissions from  storage tanks Water Resources Operations do not produce large  volumes of water after initial  production Groundwater Design wells to minimize the possibility  of well failure and ensure groundwater  is protected Workforce Health & Safety Both employee total recordable  incident rate and fatality rate were zero  in 2020  Diversity As of December 31, 2021, 26% of  employee population are women (38%  in our Houston corporate office) and  31% identify as a minority group, as  defined by the U.S. EEOC(1) Community Support In 2021, Magnolia gave nearly $160,000  to local communities, supporting more  than 100 organizations Board Independence 71% of board members are  independent Board Diversity 29% of board members are women Executive Compensation Ratio of 2020 Chief Executive Officer’s  compensation to median employee’s  compensation was 1.48 to 1 Say‐on‐Pay More than 99% of stockholders  approved say‐on‐pay at 2021 Annual  Meeting of Stockholders Magnolia 2021 Sustainability Report is Available on Our Website Under the Sustainability Tab (1) U.S. Equal Employment Opportunity Commission