
mgy-20210504
0001698990false00016989902021-05-042021-05-04

UNITED STATES
SECURITIES AND EXCHANGE COMMISSION
Washington, D.C. 20549
FORM 8-K
CURRENT REPORT
Pursuant to Section 13 or 15(d)
of the Securities Exchange Act of 1934
Date of report (Date of earliest event reported): May 4, 2021
Magnolia Oil & Gas Corporation
(Exact name of registrant as specified in its charter)
Delaware001-3808381-5365682
(State or other jurisdiction
of incorporation)
(Commission
File Number)
(I.R.S. Employer
Identification Number)
Nine Greenway Plaza, Suite 1300
Houston, Texas 77046
(Address of principal executive offices, including zip code)
(713) 842-9050
Registrant’s telephone number, including area code
Check the appropriate box below if the Form 8-K filing is intended to simultaneously satisfy the filing obligation of the registrant under any of the following provisions:
Written communications pursuant to Rule 425 under the Securities Act (17 CFR 230.425)
Soliciting material pursuant to Rule 14a-12 under the Exchange Act (17 CFR 240.14a-12)
Pre-commencement communications pursuant to Rule 14d-2(b) under the Exchange Act (17 CFR 240.14d-2(b))
Pre-commencement communications pursuant to Rule 13e-4(c) under the Exchange Act (17 CFR 240.13e-4(c))
Indicate by check mark whether the registrant is an emerging growth company as defined in Rule 405 of the Securities Act of 1933 (§230.405 of this chapter) or Rule 12b-2 of the Securities Exchange Act of 1934 (§240.12b-2 of this chapter).
Emerging growth company
If an emerging growth company, indicate by check mark if the registrant has elected not to use the extended transition period for complying with any new or revised financial accounting standards provided pursuant to Section 13(a) of the Exchange Act. ☐
Securities registered pursuant to section 12(b) of the Act:
Title of each classTrading Symbol(s)Name of each exchange on which registered
Class A Common Stock, par value $0.0001 Per ShareMGYNew York Stock Exchange


Item 2.02    Results of Operations and Financial Condition.

On May 4, 2021, Magnolia Oil & Gas Corporation (the “Company”) issued a press release, a copy of which is attached hereto as Exhibit 99.1 and incorporated by reference herein, announcing its financial and operational results for the quarter ended March 31, 2021.
The information furnished pursuant to this Item 2.02 (including Exhibit 99.1) shall not be deemed to be “filed” for the purposes of Section 18 of the Securities Exchange Act of 1934, as amended (the “Exchange Act”), or otherwise be subject to the liabilities of that section, nor shall it be deemed to be incorporated by reference into any filing under the Securities Act of 1933, as amended (the “Securities Act”), or the Exchange Act.

Item 7.01    Regulation FD Disclosure

On May 4, 2021, the Company provided information in an earnings presentation on its website, www.magnoliaoilgas.com, regarding its financial and operational results for the quarter ended March 31, 2021.
The earnings presentation, which is attached hereto as Exhibit 99.2, is being furnished and shall not be deemed to be “filed” for purposes of Section 18 of the Exchange Act, or otherwise be subject to the liabilities of that section, nor shall it be deemed to be incorporated by reference into any filing under the Securities Act or the Exchange Act.

Item 9.01    Financial Statements and Exhibits.
(d)    Exhibits.
Exhibit
NumberDescription
99.1
99.2
104Cover Page Interactive Data File (formatted as inline XBRL)


SIGNATURES
Pursuant to the requirements of the Securities Exchange Act of 1934, the registrant has duly caused this report to be signed on its behalf by the undersigned hereunto duly authorized.
MAGNOLIA OIL & GAS CORPORATION
Date: May 4, 2021
By:       /s/ Timothy D. Yang
Name:  Timothy D. Yang
Title:    Executive Vice President,
             General Counsel and Corporate Secretary

2

Magnolia Oil & Gas Corporation Announces First Quarter 2021 Results

HOUSTON, TX, May 4, 2021 - Magnolia Oil & Gas Corporation (“Magnolia,” “we,” “our,” or the “Company”) (NYSE: MGY) today announced its financial and operational results for the first quarter of 2021.

First Quarter 2021 Highlights:
(In millions, except per share data)For the
Quarter Ended
March 31, 2021
Net income$91.5 
Earnings per share - diluted0.37 
Adjusted net income(1)
93.8 
Adjusted earnings per share(1)
0.38 
Adjusted EBITDAX(1)
150.8 
Capital expenditures - D&C38.9 
Cash balance as of March 31, 2021$178.2 
Average daily production (Mboe/d)62.3 
Diluted weighted average total shares outstanding(2)
249.9 

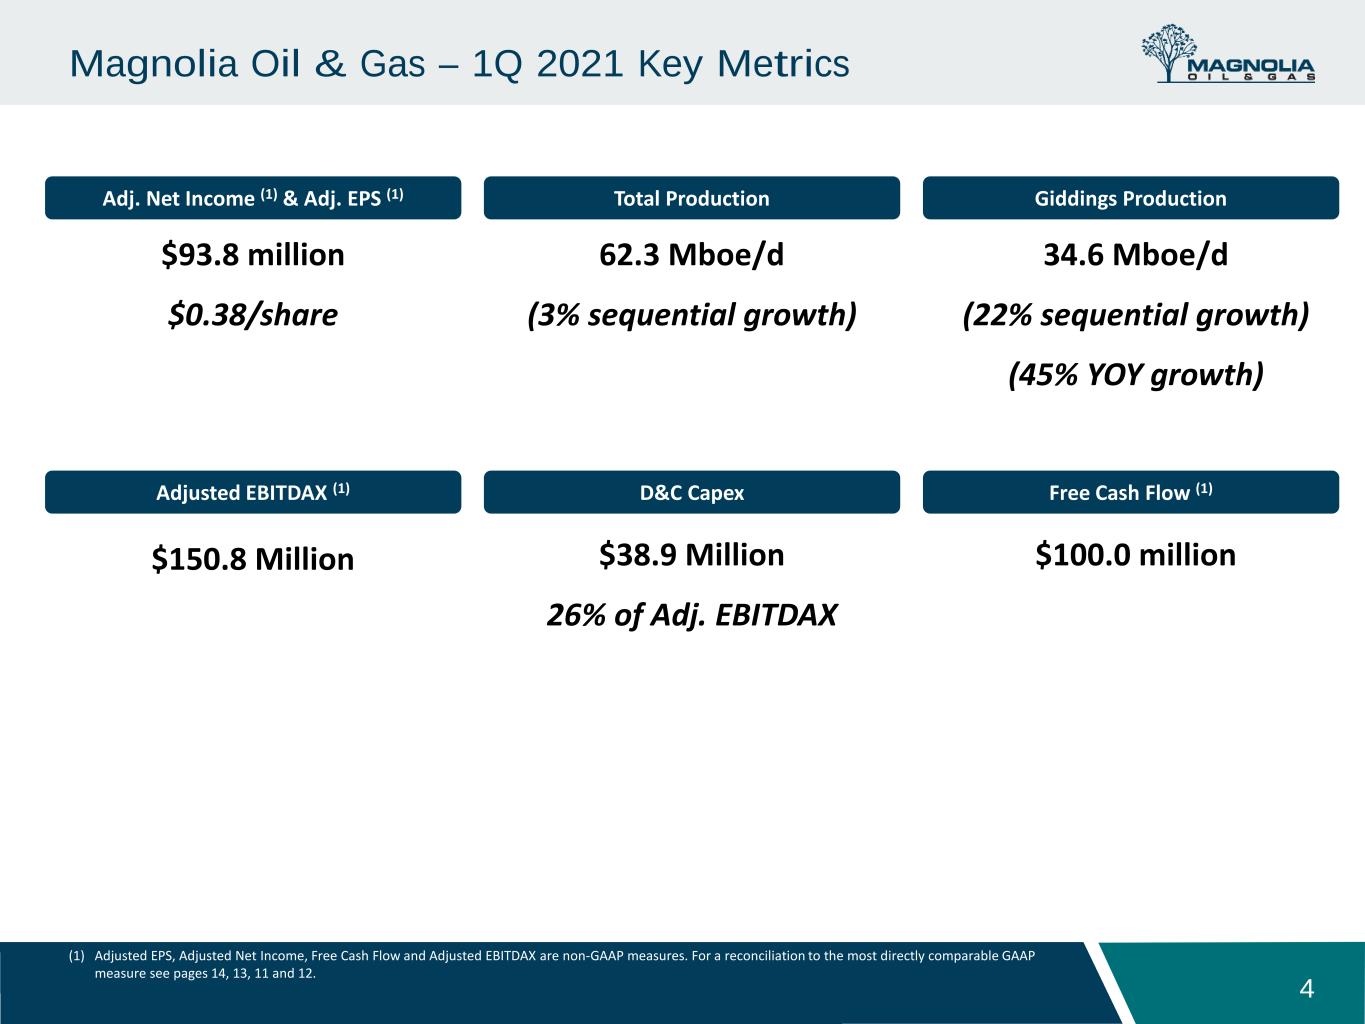
Magnolia reported first quarter 2021 net income attributable to Class A Common Stock of $63.2 million, or $0.37 per diluted share. First quarter 2021 total net income was $91.5 million and adjusted net income was $93.8 million, or $0.38 per diluted share.

Adjusted EBITDAX for the first quarter of 2021 was $150.8 million, a 54% sequential quarterly increase driven by both higher overall production and stronger product prices. Total capital allocated to drilling and completions (“D&C”) during the first quarter was $38.9 million, or 26% of adjusted EBITDAX.

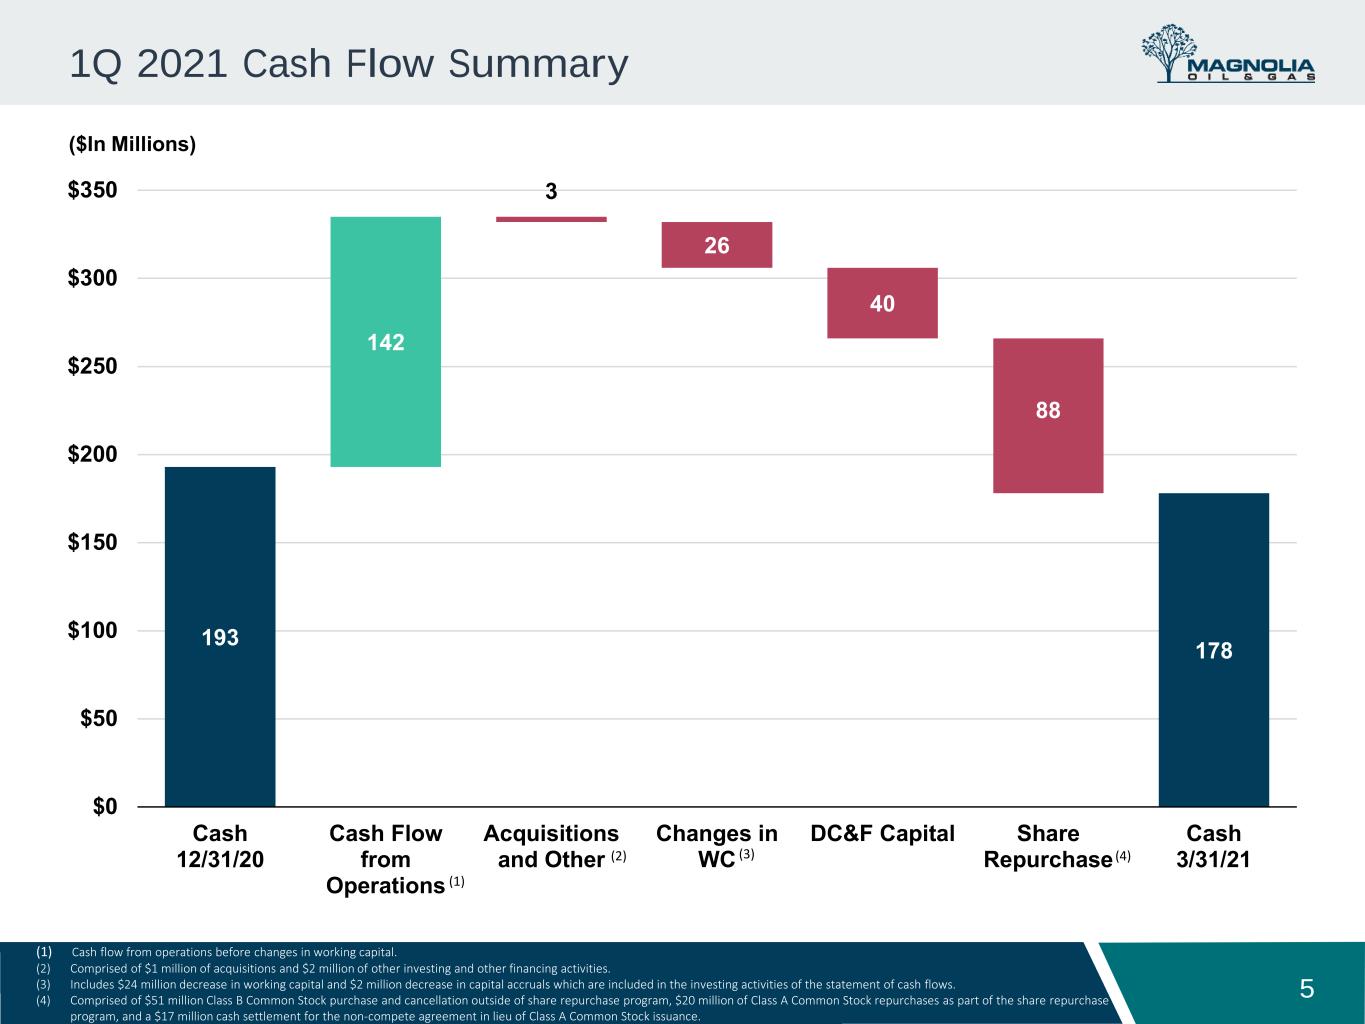
Net cash provided by operating activities was $118.2 million and the Company generated free cash flow(1) of $100.0 million during the first quarter.

During the first quarter of 2021, we generated operating income as a percent of revenue of 48%, compared to 29% during fourth quarter 2020.

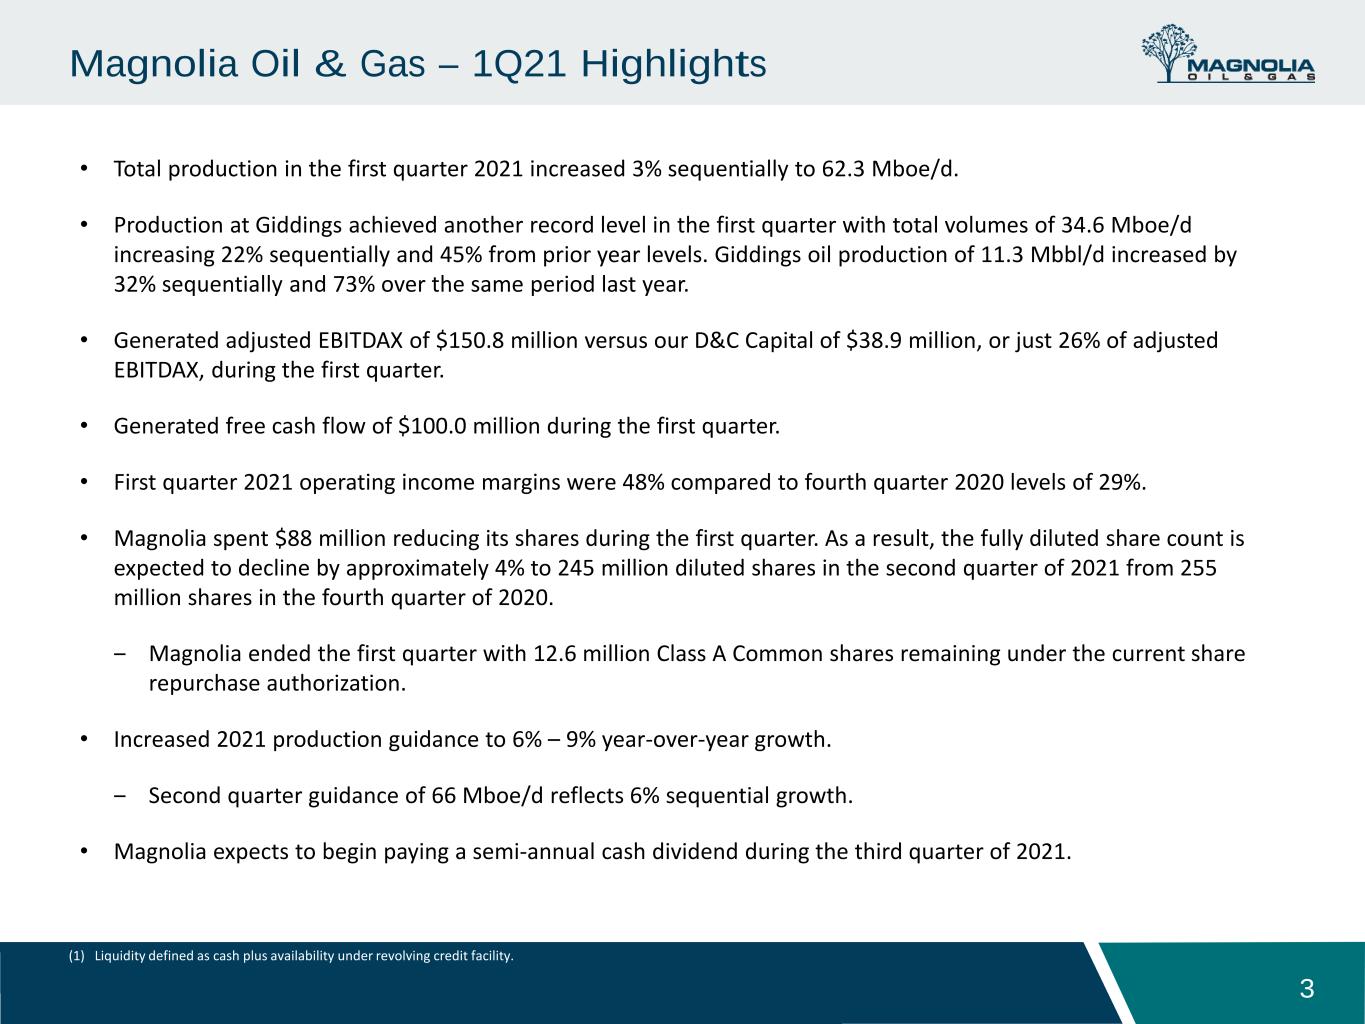
Total production in the first quarter of 2021 increased 3% sequentially to 62.3 thousand barrels of oil equivalent per day (“Mboe/d”). Production at Giddings achieved another record level in the first quarter with total volumes of 34.6 Mboe/d increasing 22% sequentially and 45% from prior year levels. Giddings oil production of 11.3 Mbbl/d increased by 32% sequentially and 73% over the same period last year.

Magnolia spent $88 million reducing its shares during the first quarter of 2021. As a result, the fully diluted share count is expected to decline by approximately 4% to 245 million diluted shares in the second quarter of 2021 from 255 million shares in the fourth quarter of 2020. Magnolia ended the first quarter with 12.6 million Class A Common shares remaining under the current share repurchase authorization.

Magnolia had approximately $178.2 million of cash on its balance sheet at the end of the first quarter of 2021 and remains undrawn on its $450.0 million revolving credit facility. The Company has no debt maturities until 2026 and has no plans to increase its debt levels.

As stated earlier this year, Magnolia expects to begin paying a semi-annual cash dividend during the third quarter of 2021.


(1) Adjusted net income, adjusted earnings per share, adjusted EBITDAX, and free cash flow are non-GAAP financial measures. For reconciliations to the most comparable GAAP measures, please see “Non-GAAP Financial Measures” at the end of this press release.
(2) Weighted average total shares outstanding include diluted weighted average shares of Class A Common Stock outstanding during the period and shares of Class B Common Stock, which are anti-dilutive in the calculation of weighted average number of common shares outstanding.
1


“Magnolia had a very strong start to 2021, achieving record quarterly earnings. The characteristics of our strategy and business model should gain momentum through the year as our per share and unit metrics continue to improve,” said Chairman, President and CEO Steve Chazen. “Our disciplined approach toward allocating capital to our assets is expected to generate moderate growth and strong profit margins this year, while generating meaningful free cash flow.

“Despite lower capital spending, total production continued to grow in the first quarter, demonstrating the quality of our assets. The growth in volumes was driven by record production from the Giddings area, which increased 22 percent sequentially and 45 percent compared to the prior-year quarter. Based on continued strong well results in Giddings and increased activity in Karnes, we now expect our full-year 2021 production to grow 6 to 9 percent compared to prior year levels, while spending somewhat less than $300 million.

“Our ongoing free cash flow generation and strong financial position will allow us to allocate the excess cash toward accretive, small bolt-on property acquisitions, or repurchasing our shares. We used our free cash flow and some of our balance sheet cash to reduce our share count by roughly 4 percent compared to fourth quarter 2020 levels. We continue to target repurchasing around 1 percent of our outstanding shares each quarter. In addition, Magnolia plans to pay its first semi-annual dividend during the third quarter of this year. Magnolia’s oil production remains unhedged as part of our strategy, allowing us to fully capture the benefit of improved prices.”


Operational Update

First quarter total company production averaged 62.3 Mboe/d, representing a 3 percent increase from fourth quarter 2020 levels. The higher production outcome was a result of better-than-expected production at our Giddings asset and as several new wells were turned in-line. Giddings and Other production averaged 34.6 Mboe/d representing a 22 percent increase in sequential volumes and a 45 percent increase from the same prior-year quarter. Oil production at Giddings averaged 11.3 Mbbl/d, a 32 percent sequential increase and a 73 percent increase compared to last year’s first quarter. Production in the Karnes area averaged 27.7 Mboe/d during the first quarter of 2021.

We plan to add a second drilling rig this summer. One rig will continue drilling multi-well pads in our Giddings area. The second rig will operate in both the Karnes and Giddings areas, including some appraisal wells at Giddings. Total well costs associated with drilling, completion and facilities continue to average about $6 million per well at Giddings and we expect to drill about 2 wells per month.


Guidance

Inclusive of the additional rig for the back half of the year, we expect Magnolia’s capital spending for drilling and completing wells to be somewhat less than $300 million this year. Our D&C capital is expected to increase during the second quarter and during the second half of the year, which coincides with the added activity. Magnolia’s total production for 2021 is currently expected to grow 6 to 9 percent compared to full-year 2020 levels.

Looking at the second quarter of 2021, total production is forecast to be about 66 Mboe/d, a 6 percent increase from first quarter production levels. Oil price differentials are anticipated to be approximately a $3 per barrel discount to Magellan East Houston (“MEH”) during the second quarter. The fully diluted share count for the second quarter of 2021 is expected to be approximately 245 million shares which is 4 percent lower than fourth quarter 2020 levels.


Quarterly Report on Form 10-Q

Magnolia's financial statements and related footnotes will be available in its Quarterly Report on Form 10-Q for the three months ended March 31, 2021, which is expected to be filed with the U.S. Securities and Exchange Commission (“SEC”) on May 5, 2021.
2


Conference Call and Webcast

Magnolia will host an investor conference call on Wednesday, May 5, 2021 at 10:00 a.m. Central (11:00 a.m. Eastern) to discuss these operating and financial results. Interested parties may join the webcast by visiting Magnolia's website at www.magnoliaoilgas.com/investors/events-and-presentations and clicking on the webcast link or by dialing 1-844-701-1059. A replay of the webcast will be posted on Magnolia's website following completion of the call.


About Magnolia Oil & Gas Corporation

Magnolia (MGY) is a publicly traded oil and gas exploration and production company with operations primarily in South Texas in the core of the Eagle Ford Shale and Austin Chalk formations. Magnolia focuses on generating value for shareholders through steady production growth, strong pre-tax margins, and free cash flow. For more information, visit www.magnoliaoilgas.com.


Cautionary Note Regarding Forward-Looking Statements

The information in this press release includes forward-looking statements within the meaning of Section 27A of the Securities Act of 1933, as amended, and Section 21E of the Securities Exchange Act of 1934, as amended. All statements, other than statements of present or historical fact included in this press release, regarding Magnolia’s strategy, future operations, financial position, estimated revenues, and losses, projected costs, prospects, plans and objectives of management are forward looking statements. When used in this press release, the words could, should, will, may, believe, anticipate, intend, estimate, expect, project, the negative of such terms and other similar expressions are intended to identify forward-looking statements, although not all forward-looking statements contain such identifying words. These forward-looking statements are based on management’s current expectations and assumptions about future events and are based on currently available information as to the outcome and timing of future events. Except as otherwise required by applicable law, Magnolia disclaims any duty to update any forward-looking statements, all of which are expressly qualified by the statements in this section, to reflect events or circumstances after the date of this press release. Magnolia cautions you that these forward-looking statements are subject to all of the risks and uncertainties, most of which are difficult to predict and many of which are beyond the control of Magnolia, incident to the development, production, gathering and sale of oil, natural gas and natural gas liquids. In addition, Magnolia cautions you that the forward looking statements contained in this press release are subject to the following factors: (i) the length, scope and severity of the ongoing coronavirus disease 2019 (“COVID-19”) pandemic, including the effects of related public health concerns and the impact of continued actions taken by governmental authorities and other third parties in response to the pandemic and its impact on commodity prices as well as supply and demand considerations; (ii) the outcome of any legal proceedings that may be instituted against Magnolia; (iii) Magnolia’s ability to realize the anticipated benefits of its acquisitions, which may be affected by, among other things, competition and the ability of Magnolia to grow and manage growth profitably; (iv) changes in applicable laws or regulations; and (v) the possibility that Magnolia may be adversely affected by other economic, business, and/or competitive factors. Should one or more of the risks or uncertainties described in this press release occur, or should underlying assumptions prove incorrect, actual results and plans could differ materially from those expressed in any forward-looking statements. Additional information concerning these and other factors that may impact the operations and projections discussed herein can be found in Magnolia’s filings with the SEC, including its Annual Report on Form 10-K for the fiscal year ended December 31, 2020. Magnolia’s SEC filings are available publicly on the SEC’s website at www.sec.gov.


Contacts for Magnolia Oil & Gas Corporation

Investors
Brian Corales
(713) 842-9036
[email protected]

Media
Art Pike
(713) 842-9057
[email protected]
3


Magnolia Oil & Gas Corporation
Operating Highlights
 
For the Quarters Ended
 March 31, 2021March 31, 2020
Production:
Oil (MBbls)2,593 3,391 
Natural gas (MMcf)10,240 10,053 
Natural gas liquids (MBbls)1,304 1,155 
Total (Mboe)5,604 6,222 
Average daily production:
Oil (Bbls/d)28,808 37,259 
Natural gas (Mcf/d)113,783 110,475 
Natural gas liquids (Bbls/d)14,490 12,688 
Total (boe/d)62,262 68,360 
Revenues (in thousands):
Oil revenues$146,413 $154,686 
Natural gas revenues34,764 16,175 
Natural gas liquids revenues26,486 10,504 
Total Revenues$207,663 $181,365 
Average sales price:
Oil (per Bbl)$56.47 $45.62 
Natural gas (per Mcf)3.39 1.61 
Natural gas liquids (per Bbl)20.31 9.09 
Total (per boe)$37.06 $29.15 
NYMEX WTI (per Bbl)$57.80 $46.08 
NYMEX Henry Hub (per Mcf)$2.70 $1.95 
Realization to benchmark:
Oil (% of WTI)98 %99 %
Natural Gas (% of Henry Hub)126 %83 %
Operating expenses (in thousands):
Lease operating expenses$19,392 $24,163 
Gathering, transportation and processing8,799 8,020 
Taxes other than income10,762 10,018 
Depreciation, depletion and amortization42,944 142,671 
Operating costs per boe:
Lease operating expenses$3.46 $3.88 
Gathering, transportation and processing1.57 1.29 
Taxes other than income1.92 1.61 
Depreciation, depletion and amortization7.66 22.93 
4


Magnolia Oil & Gas Corporation
Consolidated Statements of Operations
(In thousands, except per share data)
For the Quarters Ended
 March 31, 2021March 31, 2020
REVENUES 
Oil revenues$146,413 $154,686 
Natural gas revenues34,764 16,175 
Natural gas liquids revenues26,486 10,504 
Total revenues207,663 181,365 
OPERATING EXPENSES
Lease operating expenses19,392 24,163 
Gathering, transportation and processing8,799 8,020 
Taxes other than income10,762 10,018 
Exploration expense2,062 556,427 
Impairment of oil and natural gas properties— 1,381,258 
Asset retirement obligations accretion1,331 1,438 
Depreciation, depletion and amortization42,944 142,671 
Amortization of intangible assets2,113 3,626 
General and administrative expenses20,364 18,080 
Total operating expenses107,767 2,145,701 
OPERATING INCOME (LOSS)99,896 (1,964,336)
OTHER INCOME (EXPENSE)
Income from equity method investee— 440 
Interest expense, net(7,294)(6,757)
Loss on derivatives, net(482)— 
Other expense, net(229)(472)
Total other expense, net(8,005)(6,789)
INCOME (LOSS) BEFORE INCOME TAXES91,891 (1,971,125)
Income tax expense (benefit)399 (75,826)
NET INCOME (LOSS)91,492 (1,895,299)
LESS: Net income (loss) attributable to noncontrolling interest28,248 (668,289)
NET INCOME (LOSS) ATTRIBUTABLE TO CLASS A COMMON STOCK63,244 (1,227,010)
NET INCOME (LOSS) PER COMMON SHARE
Basic$0.38 $(7.34)
Diluted$0.37 $(7.34)
WEIGHTED AVERAGE NUMBER OF COMMON SHARES OUTSTANDING
Basic166,952 167,149 
Diluted169,636 167,149 
WEIGHTED AVERAGE NUMBER OF CLASS B SHARES OUTSTANDING(1)
80,253 85,790 
(1) Shares of Class B Common Stock, and corresponding Magnolia LLC Units, are anti-dilutive in the calculation of weighted average number of common shares outstanding.
5


Magnolia Oil & Gas Corporation
Summary Cash Flow Data
(In thousands)
For the Quarters Ended
March 31, 2021March 31, 2020
CASH FLOWS FROM OPERATING ACTIVITIES
NET INCOME (LOSS)$91,492 $(1,895,299)
Adjustments to reconcile net income (loss) to net cash provided by operating activities:
Depreciation, depletion and amortization42,944 142,671 
Amortization of intangible assets2,113 3,626 
Exploration expense, non-cash— 555,189 
Impairment of oil and natural gas properties— 1,381,258 
Asset retirement obligations accretion1,331 1,438 
Amortization of deferred financing costs910 896 
Loss on derivatives, net482 — 
Deferred tax expense (benefit)— (74,654)
Stock based compensation2,705 2,879 
Other(84)(440)
Net change in operating assets and liabilities(23,740)17,314 
Net cash provided by operating activities118,153 134,878 
CASH FLOWS FROM INVESTING ACTIVITIES
Acquisitions, other(558)(69,390)
Additions to oil and natural gas properties(40,166)(101,391)
Changes in working capital associated with additions to oil and natural gas properties(1,744)7,181 
Other investing(416)(200)
Net cash used in investing activities(42,884)(163,800)
CASH FLOW FROM FINANCING ACTIVITIES
Distributions to noncontrolling interest owners(155)(284)
Class A Common Stock repurchases(20,281)(6,483)
Class B Common Stock purchase and cancellation(50,781)— 
Non-compete settlement in lieu of Class A Common Stock issuance(17,152)— 
Other financing activities(1,267)(452)
Net cash used in financing activities(89,636)(7,219)
NET CHANGE IN CASH AND CASH EQUIVALENTS(14,367)(36,141)
Cash and cash equivalents – Beginning of period192,561 182,633 
Cash and cash equivalents – End of period$178,194 $146,492 

6


Magnolia Oil & Gas Corporation
Summary Balance Sheet Data
(In thousands)
March 31, 2021December 31, 2020
Cash and cash equivalents$178,194 $192,561 
Other current assets111,024 88,965 
Property, plant and equipment, net1,147,802 1,149,527 
Other assets18,828 22,367 
Total assets$1,455,848 $1,453,420 
Current liabilities$125,935 $128,949 
Long-term debt, net391,448 391,115 
Other long-term liabilities94,453 93,934 
Common stock25 26 
Additional paid in capital1,731,234 1,712,544 
Treasury stock(59,239)(38,958)
Retained earnings (accumulated deficit)(1,062,206)(1,125,450)
Noncontrolling interest234,198 291,260 
Total liabilities and equity$1,455,848 $1,453,420 


7


Magnolia Oil & Gas Corporation
Non-GAAP Financial Measures


Reconciliation of net income (loss) to adjusted EBITDAX

In this press release, we refer to adjusted EBITDAX, a supplemental non-GAAP financial measure that is used by management and external users of our consolidated financial statements, such as industry analysts, investors, lenders, and rating agencies. We define adjusted EBITDAX as net income (loss) before interest expense, income taxes, depreciation, depletion and amortization, amortization of intangible assets, exploration costs, and accretion of asset retirement obligations, adjusted to exclude the effect of certain items included in net income (loss). Adjusted EBITDAX is not a measure of net income in accordance with GAAP.

Our management believes that adjusted EBITDAX is useful because it allows them to more effectively evaluate our operating performance and compare the results of our operations from period to period and against our peers without regard to our financing methods or capital structure. We also believe that securities analysts, investors, and other interested parties may use adjusted EBITDAX in the evaluation of our Company. We exclude the items listed above from net income (loss) in arriving at adjusted EBITDAX because these amounts can vary substantially from company to company within our industry depending upon accounting methods and book values of assets, capital structures and the method by which the assets were acquired. Adjusted EBITDAX should not be considered as an alternative to, or more meaningful than, net income (loss) as determined in accordance with GAAP or as an indicator of our operating performance or liquidity. Certain items excluded from adjusted EBITDAX are significant components in understanding and assessing a company’s financial performance, such as a company’s cost of capital and tax structure, as well as the historic costs of depreciable assets, none of which are components of adjusted EBITDAX. Our presentation of adjusted EBITDAX should not be construed as an inference that our results will be unaffected by unusual or non-recurring items. Our computations of adjusted EBITDAX may not be comparable to other similarly titled measures of other companies.

The following table presents a reconciliation of net income (loss) to adjusted EBITDAX, our most directly comparable financial measure, calculated and presented in accordance with GAAP:
For the Quarters Ended
(In thousands)
March 31, 2021
March 31, 2020
NET INCOME (LOSS)$91,492 $(1,895,299)
Exploration expense2,062 556,427 
Asset retirement obligations accretion1,331 1,438 
Depreciation, depletion and amortization42,944 142,671 
Amortization of intangible assets2,113 3,626 
Interest expense, net7,294 6,757 
Income tax expense (benefit)399 (75,826)
EBITDAX147,635 (1,260,206)
Impairment of oil and natural gas properties— 1,381,258 
Non-cash stock based compensation expense2,705 2,879 
Unrealized loss on derivatives, net482 — 
Adjusted EBITDAX$150,822 $123,931 

8


Magnolia Oil & Gas Corporation
Non-GAAP Financial Measures

Reconciliation of net income (loss) attributable to Class A Common Stock to adjusted earnings

Our presentation of adjusted earnings and adjusted earnings per share are non-GAAP measures because they exclude the effect of certain items included in net income (loss) attributable to Class A Common Stock. Management uses adjusted earnings and adjusted earnings per share to evaluate our operating and financial performance because it eliminates the impact of certain items that management does not consider to be representative of the Company’s on-going business operations. As a performance measure, adjusted earnings may be useful to investors in facilitating comparisons to others in the Company’s industry because certain items can vary substantially in the oil and gas industry from company to company depending upon accounting methods, book value of assets, and capital structure, among other factors. Management believes excluding these items facilitates investors and analysts in evaluating and comparing the underlying operating and financial performance of our business from period to period by eliminating differences caused by the existence and timing of certain expense and income items that would not otherwise be apparent on a GAAP basis. However, our presentation of adjusted earnings and adjusted earnings per share may not be comparable to similar measures of other companies in our industry.
For the
Quarter Ended
March 31, 2021
Per Share Diluted EPS
For the
Quarter Ended
March 31, 2020
Per Share Diluted EPS
(In thousands, except per share data)
NET INCOME (LOSS) ATTRIBUTABLE TO CLASS A COMMON STOCK$63,244 $0.37 $(1,227,010)$(7.34)
Adjustments:
Impairment of proved oil and natural gas properties— — 1,381,258 8.26 
Impairment of unproved properties(1)
— — 555,175 3.32 
Unrealized loss on derivatives, net482 — — — 
Seismic purchases1,860 0.01 — — 
Noncontrolling interest impact of adjustments(723)— (656,527)(3.93)
Change in estimated income tax(7)— (71,362)(0.42)
ADJUSTED NET INCOME (LOSS) ATTRIBUTABLE TO
CLASS A COMMON STOCK
$64,856 $0.38 $(18,466)$(0.11)

(1) Impairment of unproved properties is included within Exploration expense on the consolidated statements of operations.
9


Magnolia Oil & Gas Corporation
Non-GAAP Financial Measures

Reconciliation of net income (loss) to adjusted net income (loss)

Our presentation of adjusted net income (loss) is a non-GAAP measures because it excludes the effect of certain items included in net income and adjusts for income taxes assuming the exchange of all outstanding Magnolia LLC Units and corresponding Class B Common Stock for shares of Class A Common Stock. Management uses adjusted net income (loss) to evaluate our operating and financial performance because it eliminates the impact of certain items that management does not consider to be representative of the Company’s on-going business operations. As a performance measure, adjusted net income (loss) may be useful to investors in facilitating comparisons to others in the Company’s industry because certain items can vary substantially in the oil and gas industry from company to company depending upon accounting methods, book value of assets, and capital structure, among other factors. Management believes adjusting these items facilitates investors and analysts in evaluating and comparing the underlying operating and financial performance of our business from period to period by eliminating differences caused by the existence and timing of certain expense and income items that would not otherwise be apparent on a GAAP basis. However, our presentation of adjusted net income (loss) may not be comparable to similar measures of other companies in our industry.
For the Quarters Ended
(In thousands)
March 31, 2021
March 31, 2020
NET INCOME (LOSS)$91,492 $(1,895,299)
Income tax expense (benefit)
399 (75,826)
INCOME (LOSS) BEFORE INCOME TAXES91,891 (1,971,125)
Adjustments:
Impairment of proved oil and natural gas properties— 1,381,258 
Impairment of unproved properties(1)
— 555,175 
Unrealized loss on derivatives, net482 — 
Seismic purchases1,860 — 
ADJUSTED INCOME (LOSS) BEFORE INCOME TAXES94,233 (34,692)
Adjusted income tax expense (benefit)(2)
405 (7,452)
ADJUSTED NET INCOME (LOSS)$93,828 $(27,240)
Diluted weighted average shares of Class A Common Stock outstanding during the period169,636 167,149 
Weighted average shares of Class B Common Stock outstanding during the period(3)
80,253 85,790 
Total weighted average shares of Class A and B Common Stock, including dilutive impact of other securities(3)
249,889 252,939 

(1) Impairment of unproved properties is included within Exploration expense on the consolidated statements of operations.
(2) Represents corporate income taxes at an assumed effective tax rate of 0.4% and 21.5% for the quarters ended March 31, 2021 and 2020, respectively.
(3) Shares of Class B Common Stock, and corresponding Magnolia LLC Units, are anti-dilutive in the calculation of weighted average number of common shares outstanding.
10


Magnolia Oil & Gas Corporation
Non-GAAP Financial Measures

Reconciliation of revenue to adjusted cash operating margin and to operating income margin

Our presentation of adjusted cash operating margin and total adjusted cash operating costs are supplemental non-GAAP financial measures that are used by management. Total adjusted cash operating costs exclude the impact of non-cash activity. We define adjusted cash operating margin per boe as total revenues per boe less operating expenses per boe. Management believes that total adjusted cash operating costs per boe and adjusted cash operating margin per boe provide relevant and useful information, which is used by our management in assessing the Company’s profitability and comparability of results to our peers.

As a performance measure, total adjusted cash operating costs and adjusted cash operating margin may be useful to investors in facilitating comparisons to others in the Company’s industry because certain items can vary substantially in the oil and gas industry from company to company depending upon accounting methods, book value of assets, and capital structure, among other factors. Management believes excluding these items facilitates investors and analysts in evaluating and comparing the underlying operating and financial performance of our business from period to period by eliminating differences caused by the existence and timing of certain expense and income items that would not otherwise be apparent on a GAAP basis. However, our presentation of adjusted cash operating margin may not be comparable to similar measures of other companies in our industry.

For the Quarters Ended
(in $/boe)March 31, 2021December 31, 2020
Revenue$37.06 $26.76 
Total cash operating costs:
Lease operating expenses(1)
(3.44)(3.19)
Gathering, transportation and processing(1.57)(1.45)
Taxes other than income(1.92)(1.50)
Exploration expense(2)
(0.37)(0.25)
General and administrative expenses(3)
(3.17)(3.11)
Total adjusted cash operating costs(10.47)(9.50)
Adjusted cash operating margin$26.59 $17.26 
Margin (%)72 %64 %
Non-cash costs:
Depreciation, depletion and amortization$(7.66)$(8.08)
Asset retirement obligations accretion(0.24)(0.24)
Amortization of intangible assets(0.38)(0.65)
Non-cash stock based compensation(0.48)(0.21)
Non-cash exploration expense— (0.42)
Total non-cash costs(8.76)(9.60)
Operating income margin$17.83 $7.66 
Margin (%)48 %29 %

(1) Lease operating expenses exclude non-cash stock based compensation of $0.1 million, or $0.02 per boe, and $0.1 million, or $0.01 per boe, for the quarters ended March 31, 2021 and December 31, 2020, respectively.
(2) Exploration expense excludes unproved property impairment of $2.4 million, or $0.42 per boe, for the quarter ended December 31, 2020.
(3) General and administrative expenses exclude non-cash stock based compensation of $2.6 million, or $0.46 per boe, and $1.1 million, or $0.20 per boe, for the quarters ended March 31, 2021 and December 31, 2020, respectively.

11


Magnolia Oil & Gas Corporation
Non-GAAP Financial Measures

Reconciliation of net cash provided by operating activities to free cash flow

Free cash flow is a non-GAAP financial measure. Free cash flow is defined as cash flows from operations before net change in operating assets and liabilities less additions to oil and natural gas properties and changes in working capital associated with additions to oil and natural gas properties. Management believes free cash flow is useful for investors and widely accepted by those following the oil and gas industry as financial indicators of a company’s ability to generate cash to internally fund drilling and completion activities, fund acquisitions, and service debt. It is also used by research analysts to value and compare oil and gas exploration and production companies and are frequently included in published research when providing investment recommendations. Free cash flow, therefore, is an additional measure of liquidity, but is not a measure of financial performance under GAAP and should not be considered an alternative to cash flows from operating, investing, or financing activities.

For the Quarters Ended
(In thousands)March 31, 2021March 31, 2020
Net cash provided by operating activities$118,153 $134,878 
Add back: net change in operating assets and liabilities23,740 (17,314)
Cash flows from operations before net change in operating assets and liabilities141,893 117,564 
Additions to oil and natural gas properties(40,166)(101,391)
Changes in working capital associated with additions to oil and natural gas properties(1,744)7,181 
Free cash flow$99,983 $23,354 
12
First Quarter 2021 Earnings Presentation May 5, 2021 Stephen Chazen – Chairman, President & CEO Christopher Stavros – Executive Vice President & CFO Brian Corales – Vice President, Investor Relations

 
Disclaimer 2 FORWARD LOOKING STATEMENTS The information in this presentation and the oral statements made in connection therewith include “forward-looking statements” within the meaning of Section 27A of the Securities Act of 1933, as amended (the “Securities Act”), and Section 21E of the Securities Exchange Act of 1934, as amended. All statements, other than statements of present or historical fact included in this presentation, regarding Magnolia Oil & Gas Corporation’s (“Magnolia,” “we,” “us,” “our” or the “Company”) financial and production guidance, strategy, future operations, financial position, estimated revenues, and losses, projected costs, prospects, plans and objectives of management are forward-looking statements. When used in this presentation, including any oral statements made in connection therewith, the words “could,” “should,” “will,” “may,” “believe,” “anticipate,” “intend,” “estimate,” “expect,” “project,” the negative of such terms and other similar expressions are intended to identify forward-looking statements, although not all forward-looking statements contain such identifying words. These forward-looking statements are based on management’s current expectations and assumptions about future events. Except as otherwise required by applicable law, Magnolia disclaims any duty to update any forward-looking statements, all of which are expressly qualified by the statements in this section, to reflect events or circumstances after the date of this presentation. Magnolia cautions you that these forward-looking statements are subject to all of the risks and uncertainties, most of which are difficult to predict and many of which are beyond the control of Magnolia, incident to the development, production, gathering and sale of oil, natural gas and natural gas liquids. In addition, Magnolia cautions you that the forward looking statements contained in this press release are subject to the following factors: (i) the length, scope and severity of the ongoing coronavirus disease 2019 (“COVID-19”) pandemic, including the effects of related public health concerns and the impact of continued actions taken by governmental authorities and other third parties in response to the pandemic and its impact on commodity prices, supply and demand considerations, and storage capacity; (ii) the outcome of any legal proceedings that may be instituted against Magnolia; (iii) Magnolia’s ability to realize the anticipated benefits of its acquisitions, which may be affected by, among other things, competition and the ability of Magnolia to grow and manage growth profitably; (iv) changes in applicable laws or regulations; and (v) the possibility that Magnolia may be adversely affected by other economic, business, and/or competitive factors. Should one or more of the risks or uncertainties described in this press release occur, or should underlying assumptions prove incorrect, actual results and plans could differ materially from those expressed in any forward-looking statements. Additional information concerning these and other factors that may impact Magnolia's operations and projections can be found in its filings with the Securities and Exchange Commission (the "SEC"), its Annual Report on Form 10-K for the fiscal year ended December 31, 2020, filed with the SEC on February 23, 2021. Magnolia’s SEC filings are available publicly on the SEC’s website at www.sec.gov. NON-GAAP FINANCIAL MEASURES This presentation includes non-GAAP financial measures, including free cash flow, EBITDAX, adjusted EBITDAX, adjusted net income, adjusted earnings, adjusted cash operating costs and adjusted cash operating margin. Magnolia believes these metrics are useful because they allow Magnolia to more effectively evaluate its operating performance and compare the results of its operations from period to period and against its peers without regard to accounting methods or capital structure. Magnolia does not consider these non-GAAP measures in isolation or as an alternative to similar financial measures determined in accordance with GAAP. The computations of these non-GAAP measures may not be comparable to other similarly titled measures of other companies. Magnolia excludes certain items from net income in arriving at adjusted net income and adjusted earnings because these amounts can vary substantially from company to company within its industry depending upon accounting methods, book values of assets and the method by which the assets were acquired. Adjusted EBITDAX, adjusted net income, and adjusted earnings should not be considered as alternatives to, or more meaningful than, net income as determined in accordance with GAAP. Certain items excluded from free cash flow, adjusted EBITDAX, adjusted net income, adjusted earnings, adjusted cash operating costs and adjusted cash operating margin are significant components in understanding and assessing a company’s financial performance, and should not be construed as an inference that its results will be unaffected by unusual or non-recurring terms. As performance measures, adjusted EBITDAX, adjusted net income, adjusted earnings, adjusted cash operating costs and adjusted cash operating margin may be useful to investors in facilitating comparisons to others in the Company’s industry because certain items can vary substantially in the oil and gas industry from company to company depending upon accounting methods, book value of assets, and capital structure, among other factors. Management believes excluding these items facilitates investors and analysts in evaluating and comparing the underlying operating and financial performance of our business from period to period by eliminating differences caused by the existence and timing of certain expense and income items that would not otherwise be apparent on a GAAP basis. As a liquidity measure, management believes free cash flow is useful for investors and widely accepted by those following the oil and gas industry as financial indicators of a company’s ability to generate cash to internally fund drilling and completion activities, fund acquisitions, and service debt. Our presentation of adjusted EBITDAX, adjusted net income, free cash flow, adjusted earnings, adjusted cash operating costs and adjusted cash operating margin may not be comparable to similar measures of other companies in our industry. A free cash flow reconciliation is shown on page 11, adjusted EBITDAX reconciliation is shown on page 12 of the presentation, adjusted net income reconciliation is shown on page 13, adjusted earnings reconciliation is shown on page 14 and adjusted cash operating costs and adjusted cash operating margin reconciliations are shown on page 8. INDUSTRY AND MARKET DATA This presentation has been prepared by Magnolia and includes market data and other statistical information from sources believed by Magnolia to be reliable, including independent industry publications, governmental publications or other published independent sources. Some data is also based on the good faith estimates of Magnolia, which are derived from its review of internal sources as well as the independent sources described above. Although Magnolia believes these sources are reliable, it has not independently verified the information and cannot guarantee its accuracy and completeness.

 
Magnolia Oil & Gas – 1Q21 Highlights 3 • Total production in the first quarter 2021 increased 3% sequentially to 62.3 Mboe/d. • Production at Giddings achieved another record level in the first quarter with total volumes of 34.6 Mboe/d increasing 22% sequentially and 45% from prior year levels. Giddings oil production of 11.3 Mbbl/d increased by 32% sequentially and 73% over the same period last year. • Generated adjusted EBITDAX of $150.8 million versus our D&C Capital of $38.9 million, or just 26% of adjusted EBITDAX, during the first quarter. • Generated free cash flow of $100.0 million during the first quarter. • First quarter 2021 operating income margins were 48% compared to fourth quarter 2020 levels of 29%. • Magnolia spent $88 million reducing its shares during the first quarter. As a result, the fully diluted share count is expected to decline by approximately 4% to 245 million diluted shares in the second quarter of 2021 from 255 million shares in the fourth quarter of 2020. ‒ Magnolia ended the first quarter with 12.6 million Class A Common shares remaining under the current share repurchase authorization. • Increased 2021 production guidance to 6% – 9% year-over-year growth. ‒ Second quarter guidance of 66 Mboe/d reflects 6% sequential growth. • Magnolia expects to begin paying a semi-annual cash dividend during the third quarter of 2021. (1) Liquidity defined as cash plus availability under revolving credit facility.

 
Magnolia Oil & Gas – 1Q 2021 Key Metrics 4 Adj. Net Income (1) & Adj. EPS (1) Total Production 62.3 Mboe/d (3% sequential growth) Adjusted EBITDAX (1) $150.8 Million D&C Capex $38.9 Million 26% of Adj. EBITDAX Free Cash Flow (1) $100.0 million Giddings Production 34.6 Mboe/d (22% sequential growth) (45% YOY growth) (1) Adjusted EPS, Adjusted Net Income, Free Cash Flow and Adjusted EBITDAX are non-GAAP measures. For a reconciliation to the most directly comparable GAAP measure see pages 14, 13, 11 and 12. $93.8 million $0.38/share

 
1Q 2021 Cash Flow Summary 193 142 3 26 40 88 178 $0 $50 $100 $150 $200 $250 $300 $350 Cash 12/31/20 Cash Flow from Operations Acquisitions and Other Changes in WC DC&F Capital Share Repurchase Cash 3/31/21 ($In Millions) (1) Cash flow from operations before changes in working capital. (2) Comprised of $1 million of acquisitions and $2 million of other investing and other financing activities. (3) Includes $24 million decrease in working capital and $2 million decrease in capital accruals which are included in the investing activities of the statement of cash flows. (4) Comprised of $51 million Class B Common Stock purchase and cancellation outside of share repurchase program, $20 million of Class A Common Stock repurchases as part of the share repurchase program, and a $17 million cash settlement for the non-compete agreement in lieu of Class A Common Stock issuance. 5 (1) (2) (3) (4)
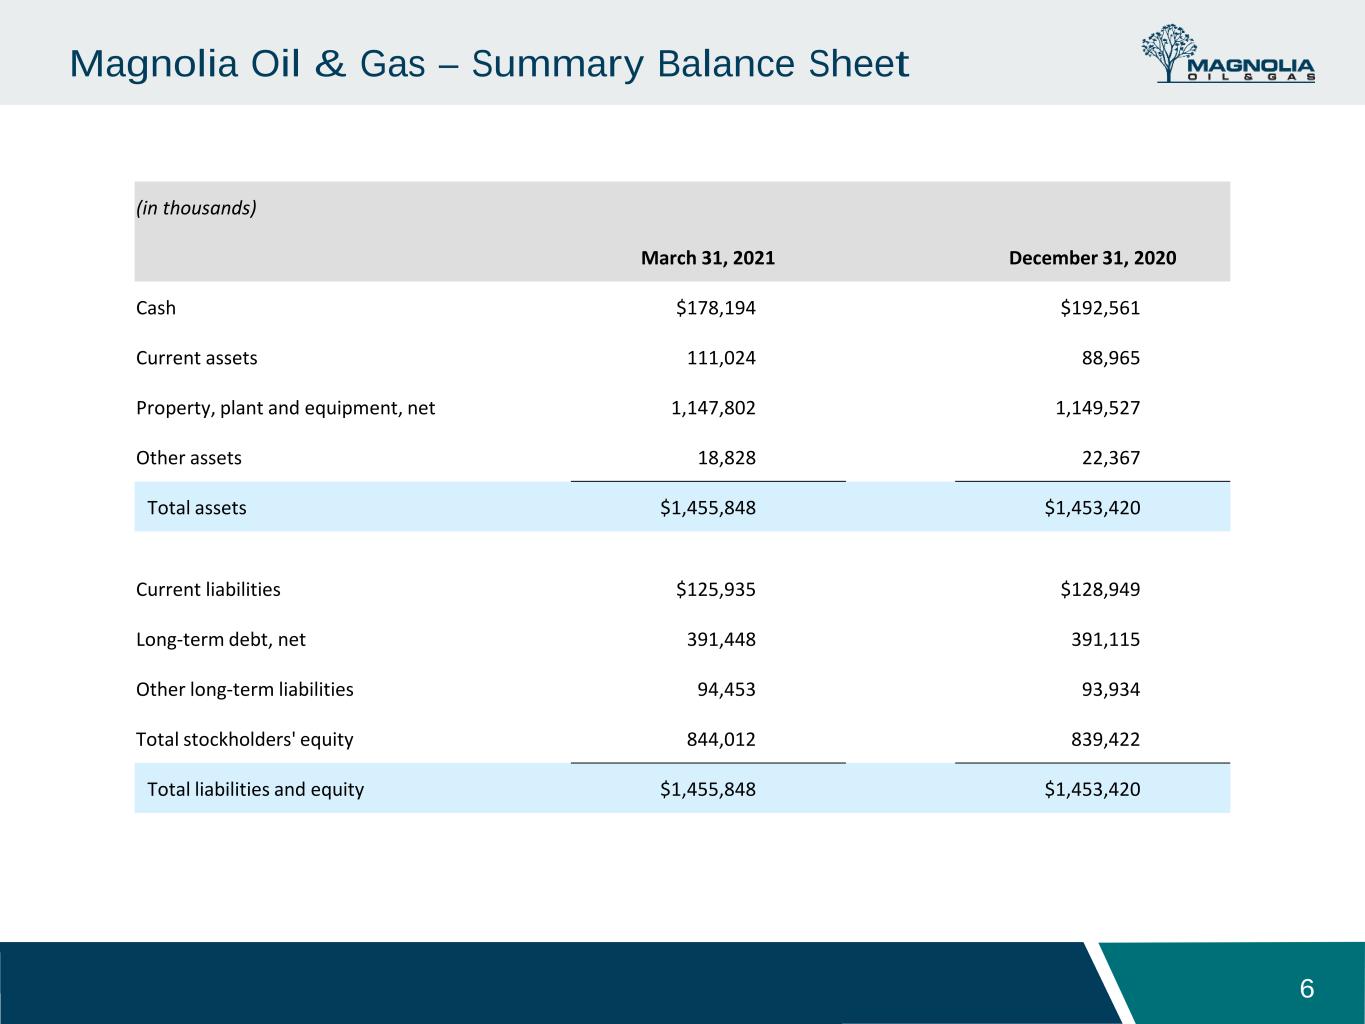

 
Magnolia Oil & Gas – Summary Balance Sheet 6 (in thousands) March 31, 2021 December 31, 2020 Cash $178,194 $192,561 Current assets 111,024 88,965 Property, plant and equipment, net 1,147,802 1,149,527 Other assets 18,828 22,367 Total assets $1,455,848 $1,453,420 Current liabilities $125,935 $128,949 Long-term debt, net 391,448 391,115 Other long-term liabilities 94,453 93,934 Total stockholders' equity 844,012 839,422 Total liabilities and equity $1,455,848 $1,453,420
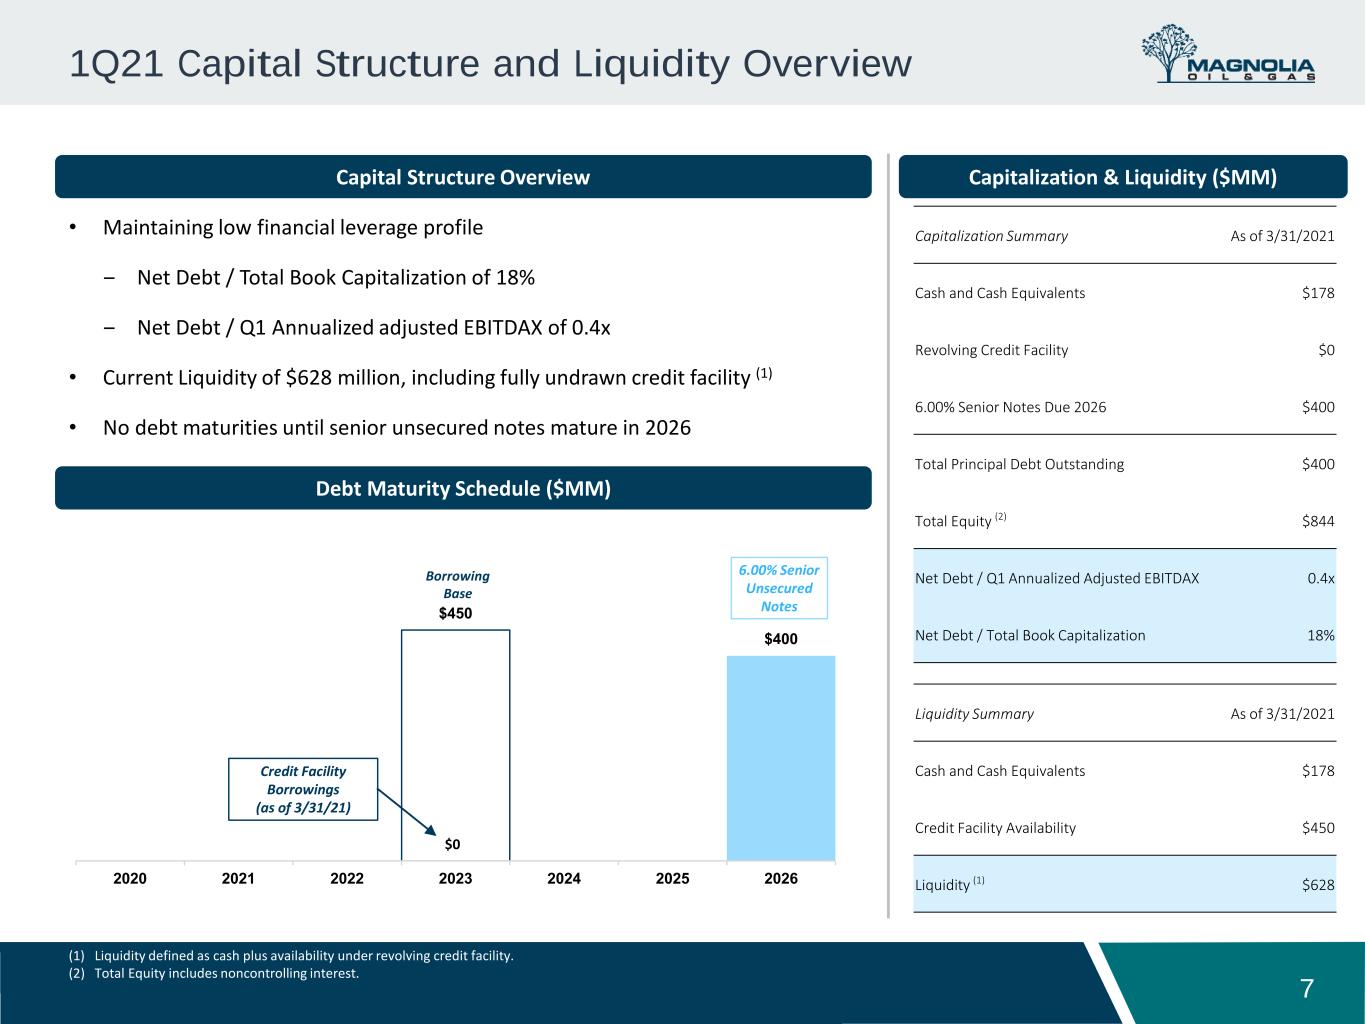

 
1Q21 Capital Structure and Liquidity Overview 7 Capital Structure Overview • Maintaining low financial leverage profile ‒ Net Debt / Total Book Capitalization of 18% ‒ Net Debt / Q1 Annualized adjusted EBITDAX of 0.4x • Current Liquidity of $628 million, including fully undrawn credit facility (1) • No debt maturities until senior unsecured notes mature in 2026 Debt Maturity Schedule ($MM) (1) Liquidity defined as cash plus availability under revolving credit facility. (2) Total Equity includes noncontrolling interest. Capitalization & Liquidity ($MM) $450 $400 2020 2021 2022 2023 2024 2025 2026 Borrowing Base Credit Facility Borrowings (as of 3/31/21) $0 6.00% Senior Unsecured Notes Capitalization Summary As of 3/31/2021 Cash and Cash Equivalents $178 Revolving Credit Facility $0 6.00% Senior Notes Due 2026 $400 Total Principal Debt Outstanding $400 Total Equity (2) $844 Net Debt / Q1 Annualized Adjusted EBITDAX 0.4x Net Debt / Total Book Capitalization 18% Liquidity Summary As of 3/31/2021 Cash and Cash Equivalents $178 Credit Facility Availability $450 Liquidity (1) $628
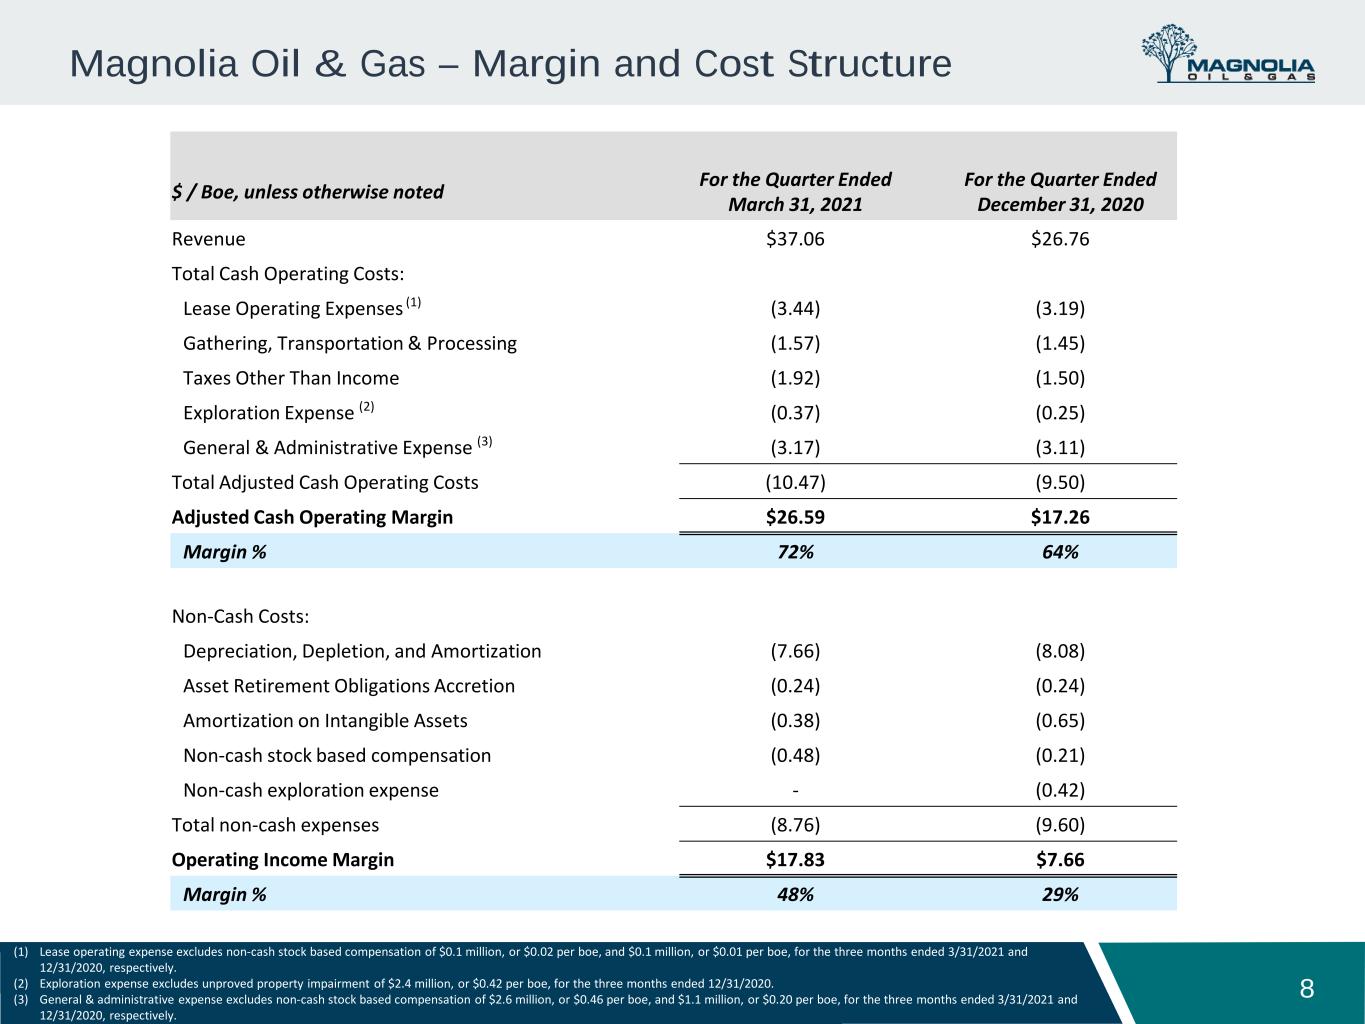

 
Magnolia Oil & Gas – Margin and Cost Structure 8 (1) Lease operating expense excludes non-cash stock based compensation of $0.1 million, or $0.02 per boe, and $0.1 million, or $0.01 per boe, for the three months ended 3/31/2021 and 12/31/2020, respectively. (2) Exploration expense excludes unproved property impairment of $2.4 million, or $0.42 per boe, for the three months ended 12/31/2020. (3) General & administrative expense excludes non-cash stock based compensation of $2.6 million, or $0.46 per boe, and $1.1 million, or $0.20 per boe, for the three months ended 3/31/2021 and 12/31/2020, respectively. $ / Boe, unless otherwise noted For the Quarter Ended March 31, 2021 For the Quarter Ended December 31, 2020 Revenue $37.06 $26.76 Total Cash Operating Costs: Lease Operating Expenses (1) (3.44) (3.19) Gathering, Transportation & Processing (1.57) (1.45) Taxes Other Than Income (1.92) (1.50) Exploration Expense (2) (0.37) (0.25) General & Administrative Expense (3) (3.17) (3.11) Total Adjusted Cash Operating Costs (10.47) (9.50) Adjusted Cash Operating Margin $26.59 $17.26 Margin % 72% 64% Non-Cash Costs: Depreciation, Depletion, and Amortization (7.66) (8.08) Asset Retirement Obligations Accretion (0.24) (0.24) Amortization on Intangible Assets (0.38) (0.65) Non-cash stock based compensation (0.48) (0.21) Non-cash exploration expense - (0.42) Total non-cash expenses (8.76) (9.60) Operating Income Margin $17.83 $7.66 Margin % 48% 29%

 
Appendix
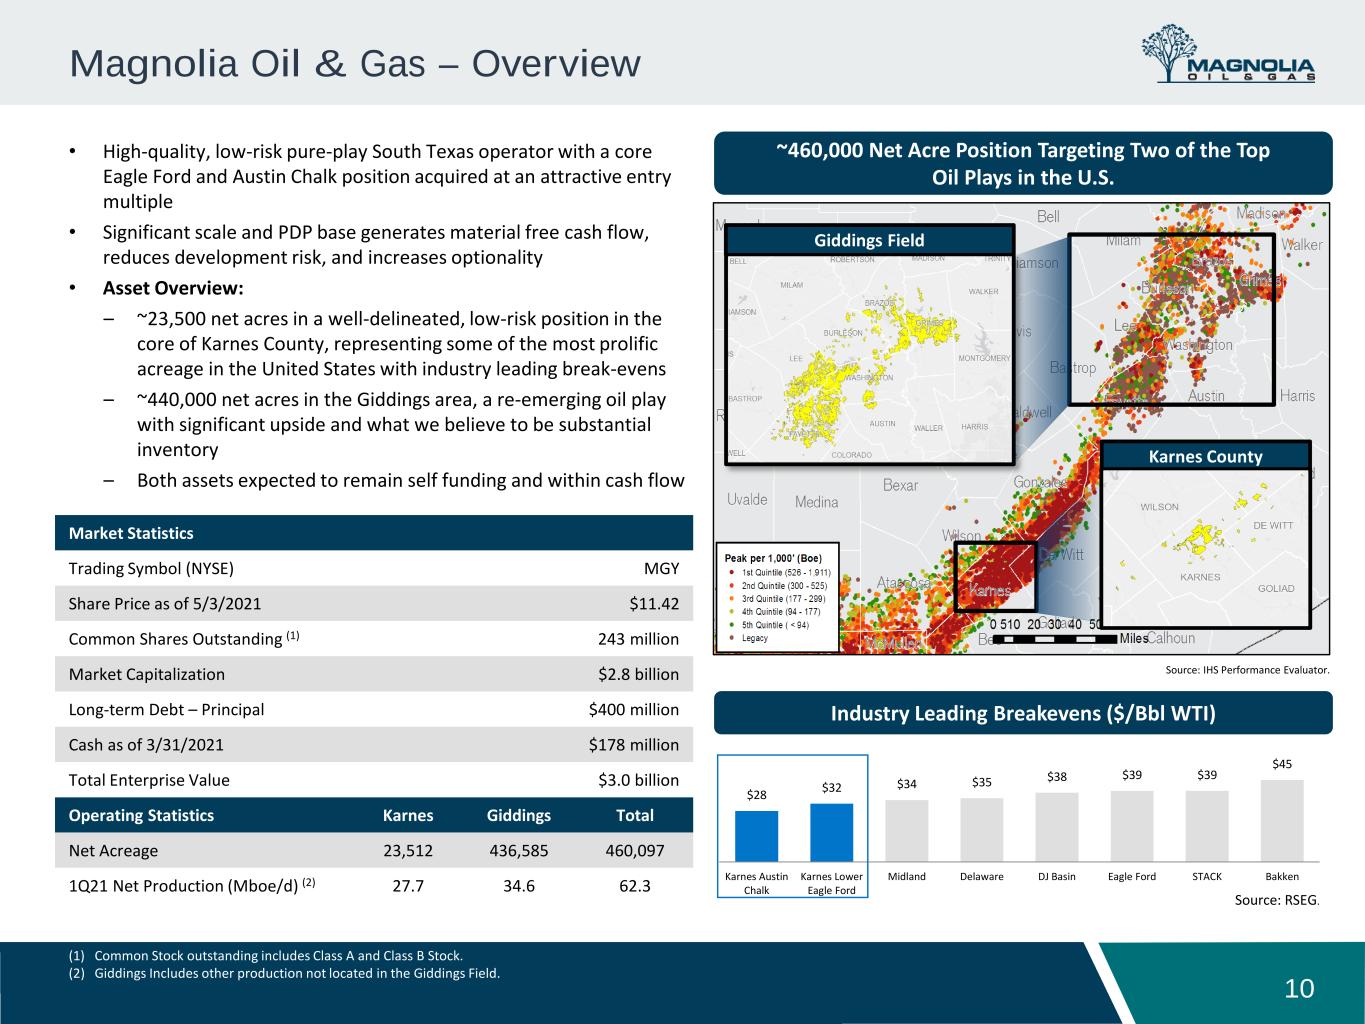

 
Magnolia Oil & Gas – Overview • High-quality, low-risk pure-play South Texas operator with a core Eagle Ford and Austin Chalk position acquired at an attractive entry multiple • Significant scale and PDP base generates material free cash flow, reduces development risk, and increases optionality • Asset Overview: – ~23,500 net acres in a well-delineated, low-risk position in the core of Karnes County, representing some of the most prolific acreage in the United States with industry leading break-evens – ~440,000 net acres in the Giddings area, a re-emerging oil play with significant upside and what we believe to be substantial inventory – Both assets expected to remain self funding and within cash flow 10 ~460,000 Net Acre Position Targeting Two of the Top Oil Plays in the U.S. Market Statistics Trading Symbol (NYSE) MGY Share Price as of 5/3/2021 $11.42 Common Shares Outstanding (1) 243 million Market Capitalization $2.8 billion Long-term Debt – Principal $400 million Cash as of 3/31/2021 $178 million Total Enterprise Value $3.0 billion Operating Statistics Karnes Giddings Total Net Acreage 23,512 436,585 460,097 1Q21 Net Production (Mboe/d) (2) 27.7 34.6 62.3 Industry Leading Breakevens ($/Bbl WTI) $28 $32 $34 $35 $38 $39 $39 $45 Karnes Austin Chalk Karnes Lower Eagle Ford Midland Delaware DJ Basin Eagle Ford STACK Bakken Source: RSEG. (1) Common Stock outstanding includes Class A and Class B Stock. (2) Giddings Includes other production not located in the Giddings Field. Karnes County Giddings Field Source: IHS Performance Evaluator. Wilson Dewitt Gonzales
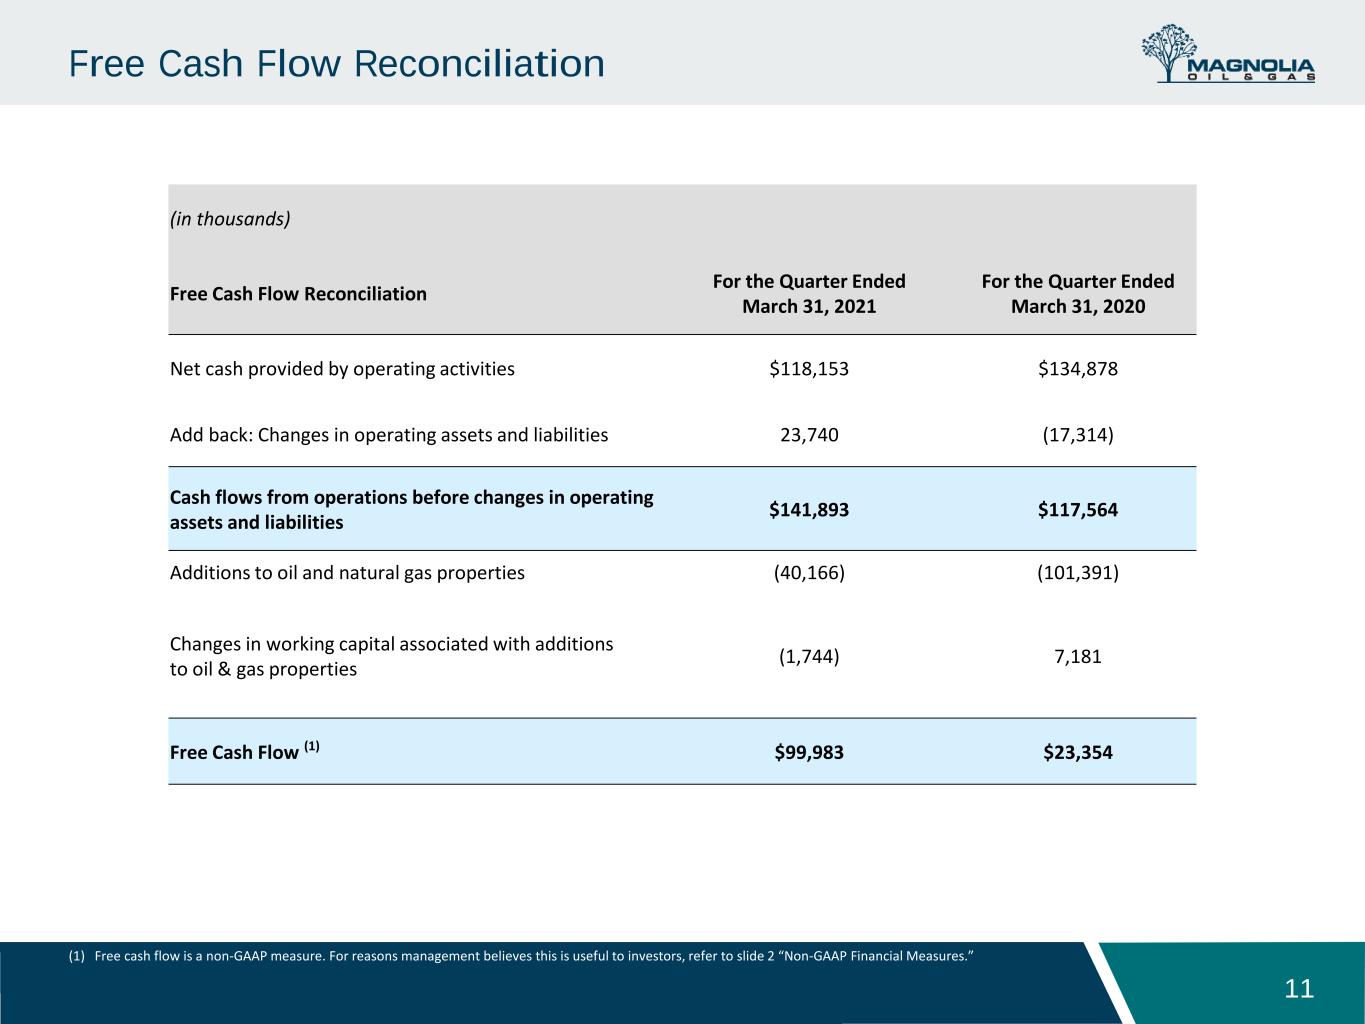

 
Free Cash Flow Reconciliation 11 (1) Free cash flow is a non-GAAP measure. For reasons management believes this is useful to investors, refer to slide 2 “Non-GAAP Financial Measures.” (in thousands) Free Cash Flow Reconciliation For the Quarter Ended March 31, 2021 For the Quarter Ended March 31, 2020 Net cash provided by operating activities $118,153 $134,878 Add back: Changes in operating assets and liabilities 23,740 (17,314) Cash flows from operations before changes in operating assets and liabilities $141,893 $117,564 Additions to oil and natural gas properties (40,166) (101,391) Changes in working capital associated with additions to oil & gas properties (1,744) 7,181 Free Cash Flow (1) $99,983 $23,354
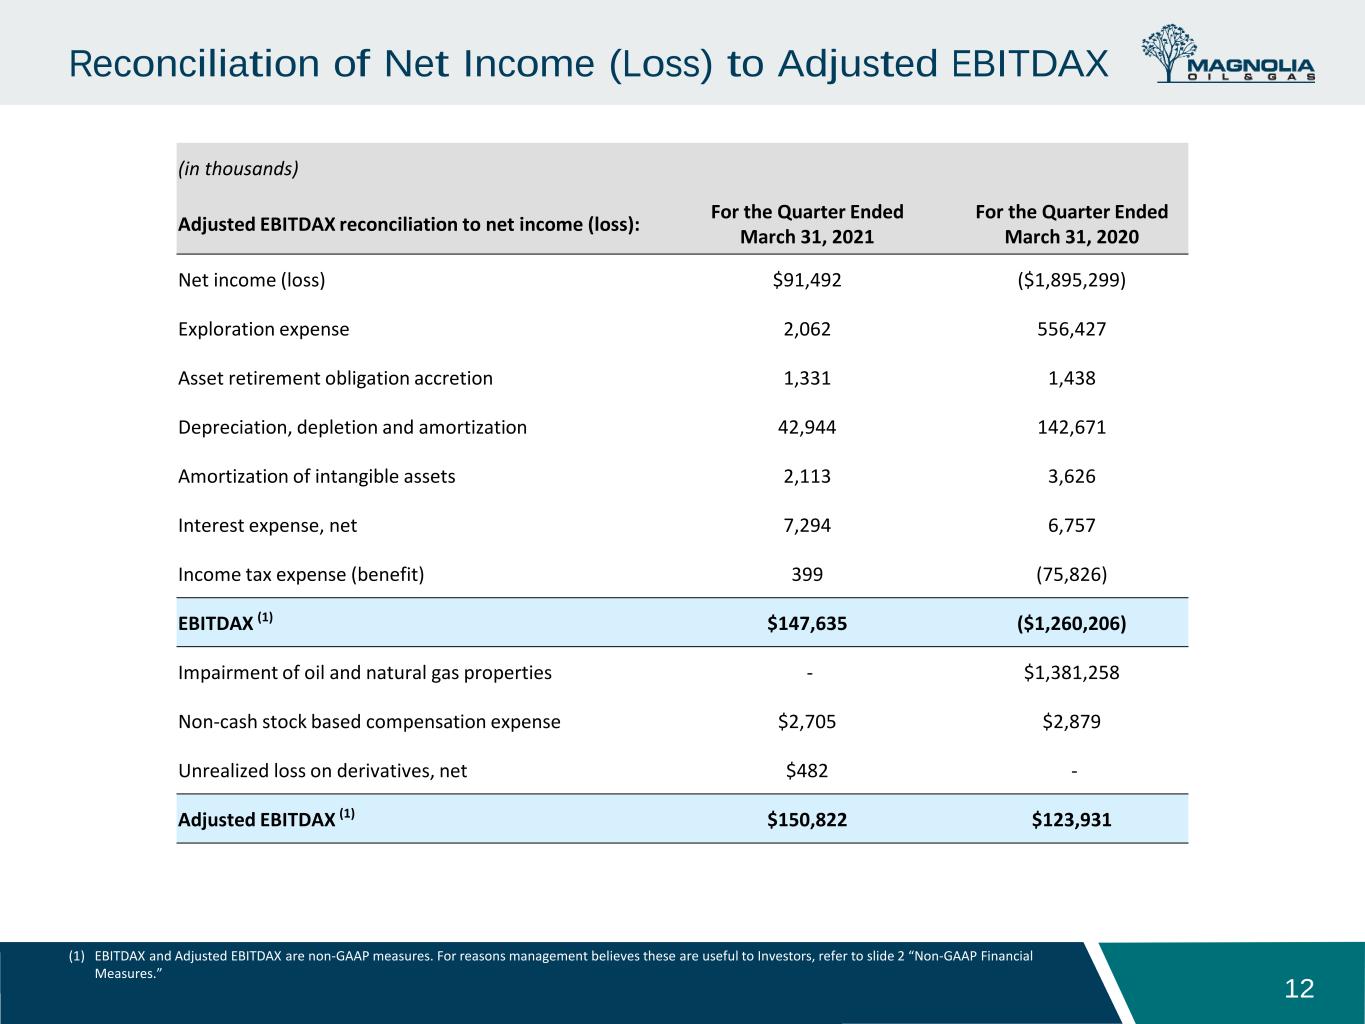

 
Reconciliation of Net Income (Loss) to Adjusted EBITDAX 12 (1) EBITDAX and Adjusted EBITDAX are non-GAAP measures. For reasons management believes these are useful to Investors, refer to slide 2 “Non-GAAP Financial Measures.” (in thousands) Adjusted EBITDAX reconciliation to net income (loss): For the Quarter Ended March 31, 2021 For the Quarter Ended March 31, 2020 Net income (loss) $91,492 ($1,895,299) Exploration expense 2,062 556,427 Asset retirement obligation accretion 1,331 1,438 Depreciation, depletion and amortization 42,944 142,671 Amortization of intangible assets 2,113 3,626 Interest expense, net 7,294 6,757 Income tax expense (benefit) 399 (75,826) EBITDAX (1) $147,635 ($1,260,206) Impairment of oil and natural gas properties - $1,381,258 Non-cash stock based compensation expense $2,705 $2,879 Unrealized loss on derivatives, net $482 - Adjusted EBITDAX (1) $150,822 $123,931
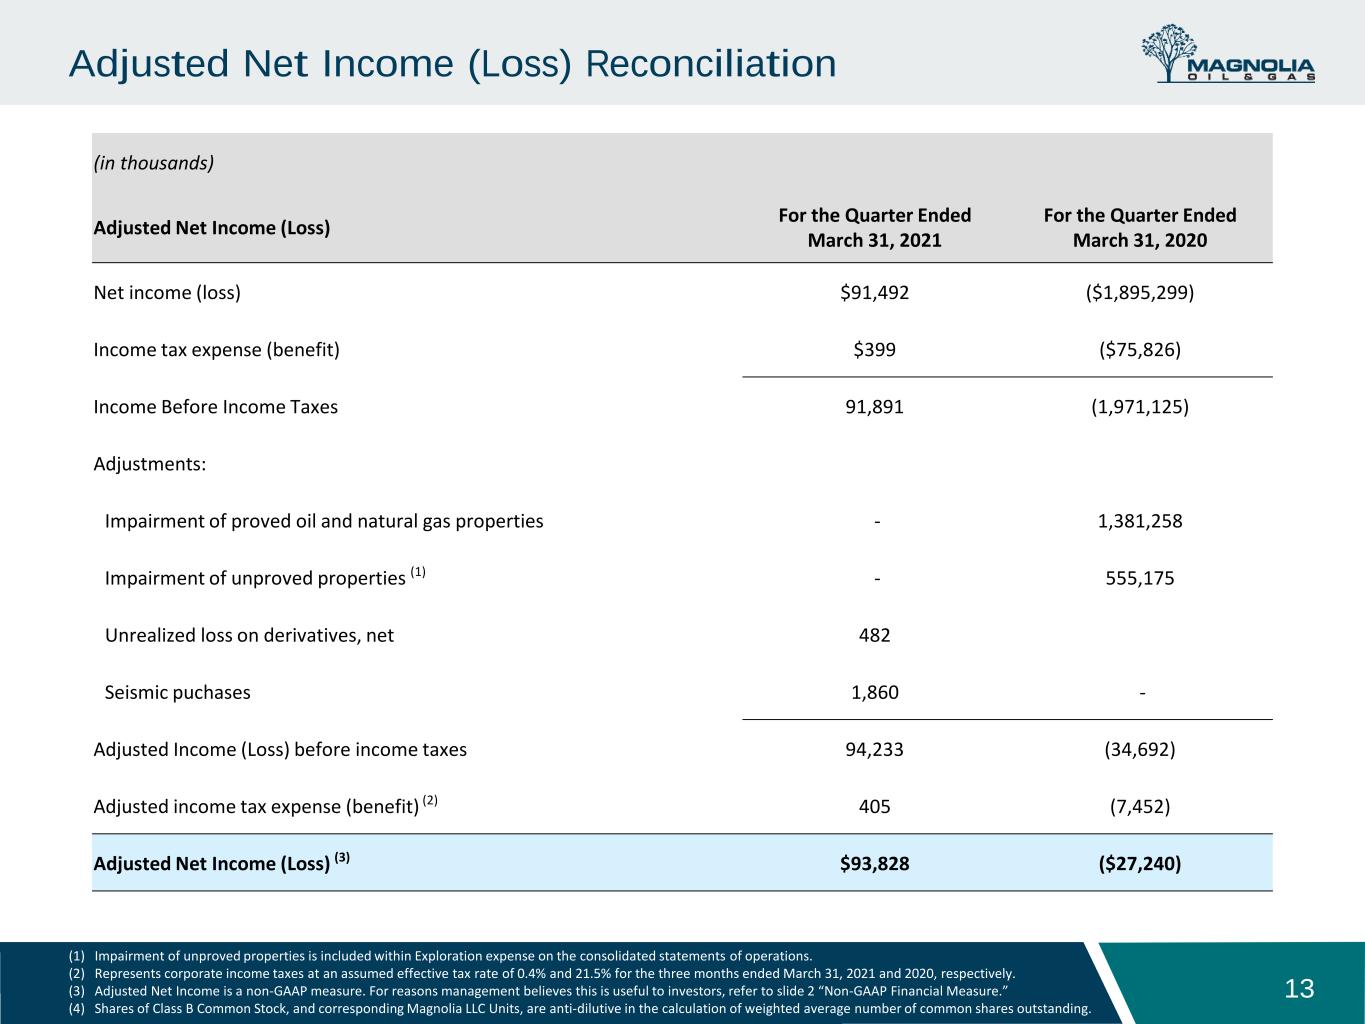

 
Adjusted Net Income (Loss) Reconciliation 13 (1) Impairment of unproved properties is included within Exploration expense on the consolidated statements of operations. (2) Represents corporate income taxes at an assumed effective tax rate of 0.4% and 21.5% for the three months ended March 31, 2021 and 2020, respectively. (3) Adjusted Net Income is a non-GAAP measure. For reasons management believes this is useful to investors, refer to slide 2 “Non-GAAP Financial Measure.” (4) Shares of Class B Common Stock, and corresponding Magnolia LLC Units, are anti-dilutive in the calculation of weighted average number of common shares outstanding. (in thousands) Adjusted Net Income (Loss) For the Quarter Ended March 31, 2021 For the Quarter Ended March 31, 2020 Net income (loss) $91,492 ($1,895,299) Income tax expense (benefit) $399 ($75,826) Income Before Income Taxes 91,891 (1,971,125) Adjustments: Impairment of proved oil and natural gas properties - 1,381,258 Impairment of unproved properties (1) - 555,175 Unrealized loss on derivatives, net 482 Seismic puchases 1,860 - Adjusted Income (Loss) before income taxes 94,233 (34,692) Adjusted income tax expense (benefit) (2) 405 (7,452) Adjusted Net Income (Loss) (3) $93,828 ($27,240)
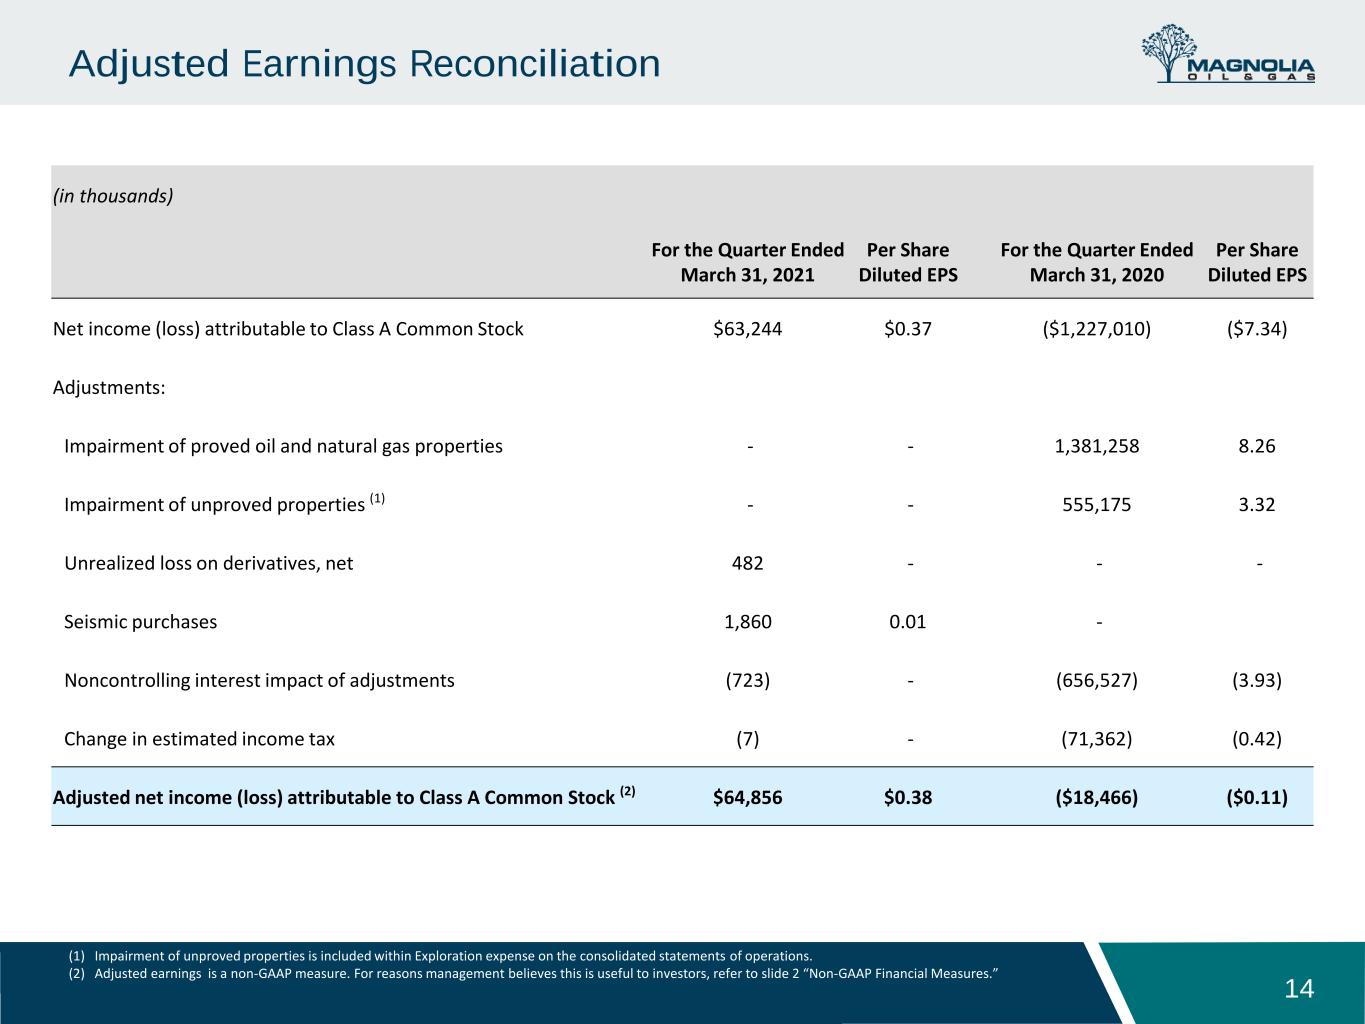

 
Adjusted Earnings Reconciliation 14 (1) Impairment of unproved properties is included within Exploration expense on the consolidated statements of operations. (2) Adjusted earnings is a non-GAAP measure. For reasons management believes this is useful to investors, refer to slide 2 “Non-GAAP Financial Measures.” (in thousands) For the Quarter Ended March 31, 2021 Per Share Diluted EPS For the Quarter Ended March 31, 2020 Per Share Diluted EPS Net income (loss) attributable to Class A Common Stock $63,244 $0.37 ($1,227,010) ($7.34) Adjustments: Impairment of proved oil and natural gas properties - - 1,381,258 8.26 Impairment of unproved properties (1) - - 555,175 3.32 Unrealized loss on derivatives, net 482 - - - Seismic purchases 1,860 0.01 - Noncontrolling interest impact of adjustments (723) - (656,527) (3.93) Change in estimated income tax (7) - (71,362) (0.42) Adjusted net income (loss) attributable to Class A Common Stock (2) $64,856 $0.38 ($18,466) ($0.11)
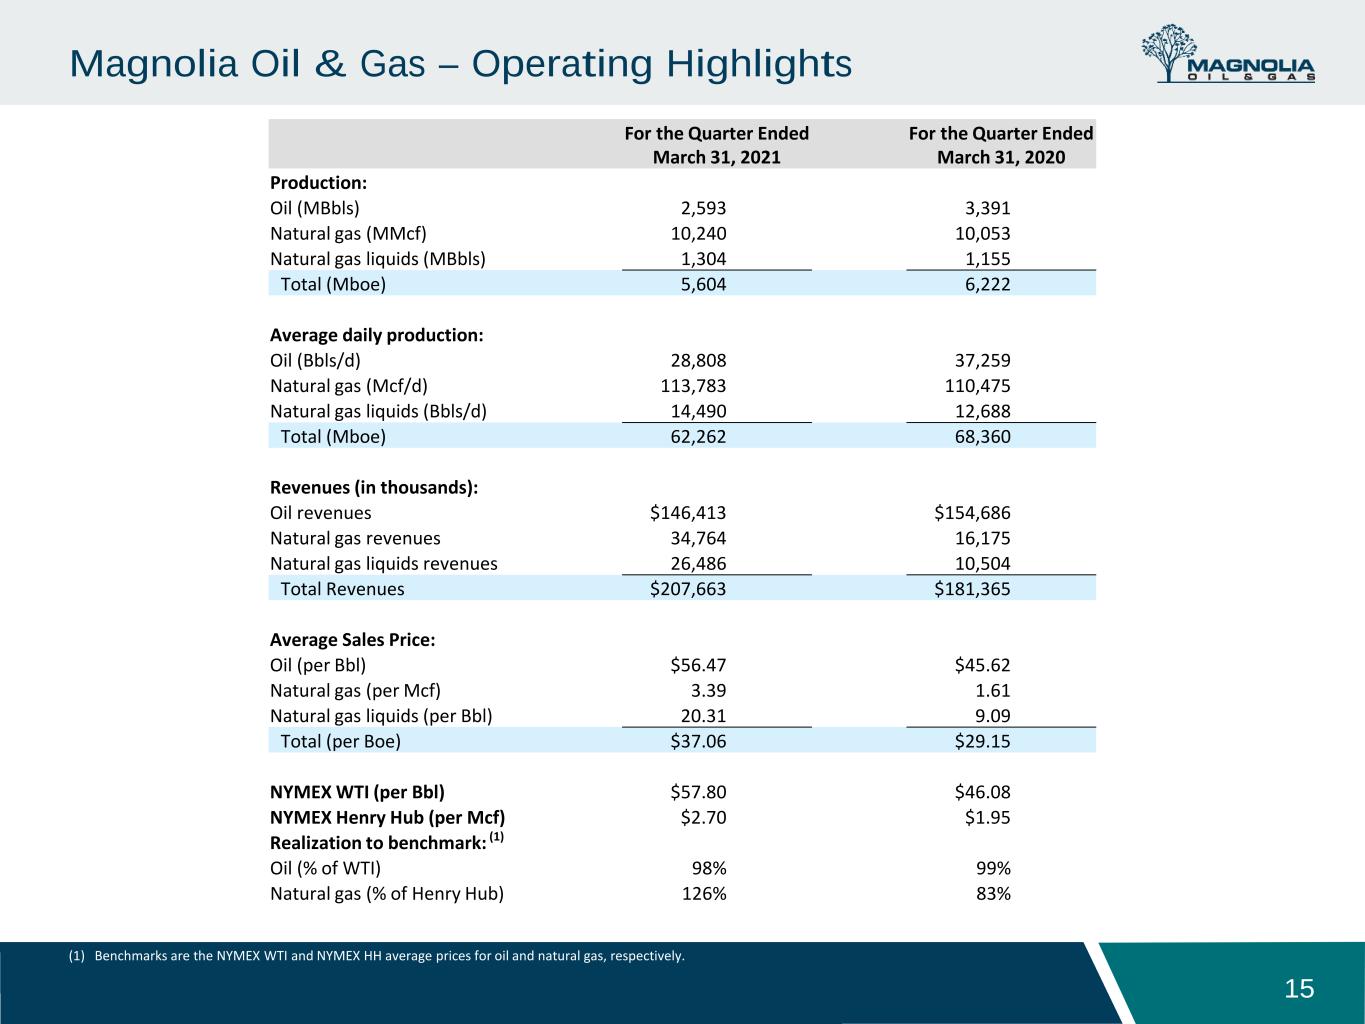

 
Magnolia Oil & Gas – Operating Highlights 15 (1) Benchmarks are the NYMEX WTI and NYMEX HH average prices for oil and natural gas, respectively. For the Quarter Ended March 31, 2021 For the Quarter Ended March 31, 2020 Production: Oil (MBbls) 2,593 3,391 Natural gas (MMcf) 10,240 10,053 Natural gas liquids (MBbls) 1,304 1,155 Total (Mboe) 5,604 6,222 Average daily production: Oil (Bbls/d) 28,808 37,259 Natural gas (Mcf/d) 113,783 110,475 Natural gas liquids (Bbls/d) 14,490 12,688 Total (Mboe) 62,262 68,360 Revenues (in thousands): Oil revenues $146,413 $154,686 Natural gas revenues 34,764 16,175 Natural gas liquids revenues 26,486 10,504 Total Revenues $207,663 $181,365 Average Sales Price: Oil (per Bbl) $56.47 $45.62 Natural gas (per Mcf) 3.39 1.61 Natural gas liquids (per Bbl) 20.31 9.09 Total (per Boe) $37.06 $29.15 NYMEX WTI (per Bbl) $57.80 $46.08 NYMEX Henry Hub (per Mcf) $2.70 $1.95 Realization to benchmark: (1) Oil (% of WTI) 98% 99% Natural gas (% of Henry Hub) 126% 83%
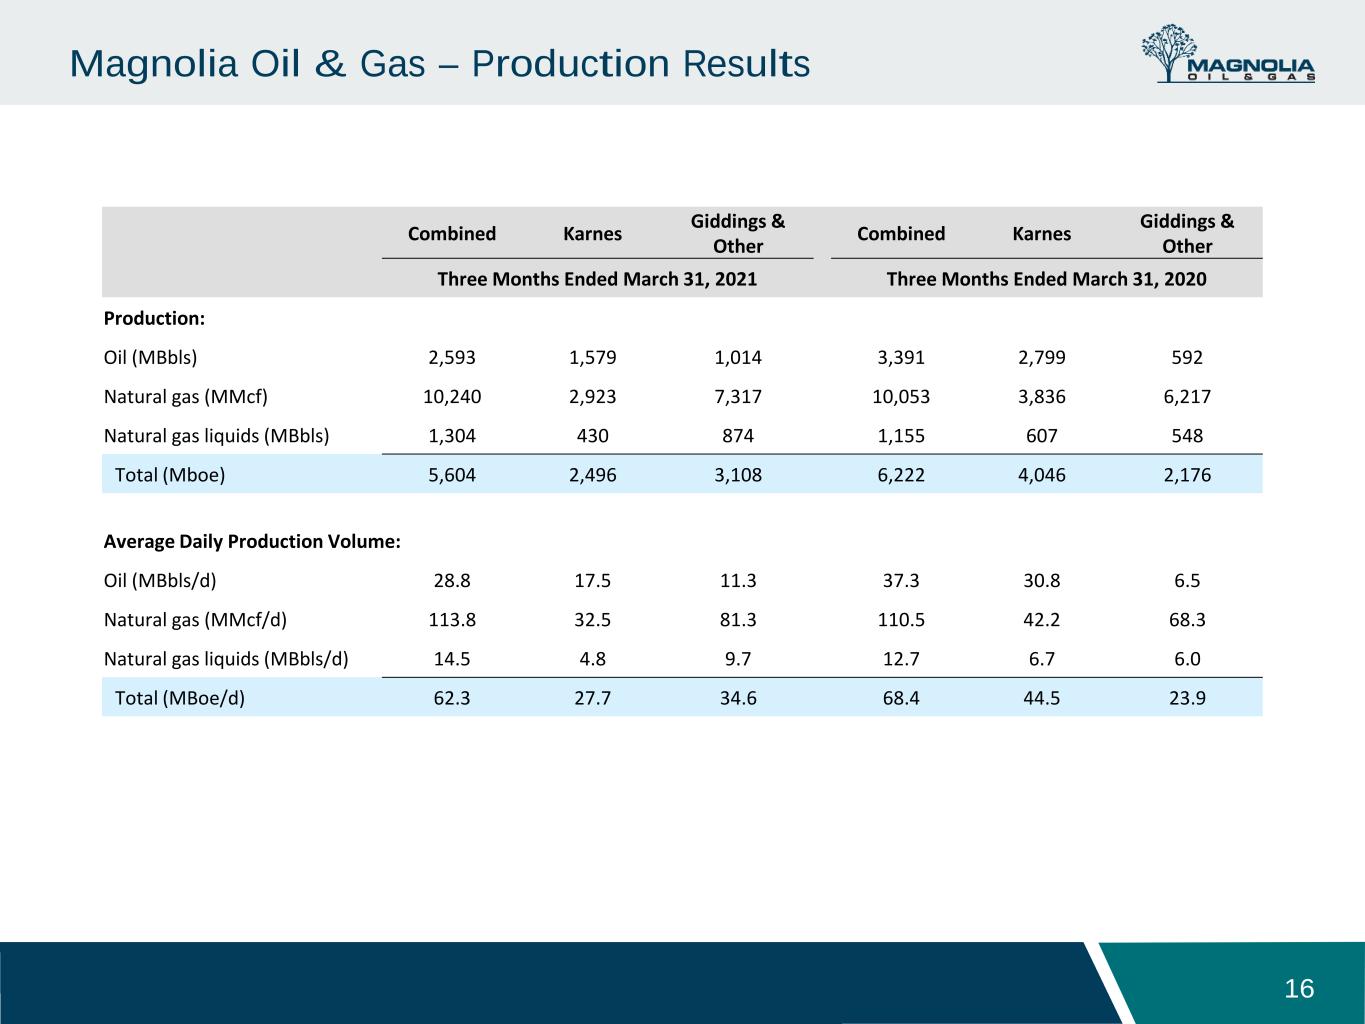

 
Magnolia Oil & Gas – Production Results 16 Combined Karnes Giddings & Other Combined Karnes Giddings & Other Three Months Ended March 31, 2021 Three Months Ended March 31, 2020 Production: Oil (MBbls) 2,593 1,579 1,014 3,391 2,799 592 Natural gas (MMcf) 10,240 2,923 7,317 10,053 3,836 6,217 Natural gas liquids (MBbls) 1,304 430 874 1,155 607 548 Total (Mboe) 5,604 2,496 3,108 6,222 4,046 2,176 Average Daily Production Volume: Oil (MBbls/d) 28.8 17.5 11.3 37.3 30.8 6.5 Natural gas (MMcf/d) 113.8 32.5 81.3 110.5 42.2 68.3 Natural gas liquids (MBbls/d) 14.5 4.8 9.7 12.7 6.7 6.0 Total (MBoe/d) 62.3 27.7 34.6 68.4 44.5 23.9