0000856982falseMERIT MEDICAL SYSTEMS INC00008569822022-10-262022-10-26

​

​

​

UNITED STATES

SECURITIES AND EXCHANGE COMMISSION

Washington, D.C.  20549

​

FORM 8-K

​

CURRENT REPORT

​

Pursuant to Section 13 or 15(d) of the Securities Exchange Act of 1934

Date of Report (date of earliest event reported): October 26, 2022

​

Graphic

​

Merit Medical Systems, Inc.

(Exact name of registrant as specified in its charter)

​

​

​

​

​

​

Utah


0-18592


87-0447695

(State or other jurisdiction of

​

(Commission

​

(I.R.S. Employer

incorporation or organization)

​

File Number)

​

Identification No.)

​

​

​

​

1600 West Merit Parkway


​

South Jordan, Utah

​

84095

(Address of principal executive offices)

​

(Zip Code)

​

(801) 253-1600

(Registrant's telephone number, including area code)

​

N/A

(Former name or former address, if changed since last report)

​

Check the appropriate box below if the Form 8-K filing is intended to simultaneously satisfy the filing obligation of the registrant under any of the following provisions:

​

☐   Written communications pursuant to Rule 425 under the Securities Act (17 CFR 230.425)

​

☐    Soliciting material pursuant to Rule 14a-12 under the Exchange Act (17 CFR 240.14a-12)

​

☐    Pre-commencement communications pursuant to Rule 14d-2(b) under the Exchange Act (17 CFR 240.14d-2(b))

​

☐    Pre-commencement communications pursuant to Rule 13e-4(c) under the Exchange Act (17 CFR 240.13e-4(c))

​

Securities registered pursuant to Section 12(b) of the Act:

​

Title of each class


Trading Symbol(s)


Name of each exchange on which registered

Common Stock, no par value

​

MMSI

​

NASDAQ Global Select Market System

​

Indicate by check mark whether the registrant is an emerging growth company as defined in Rule 405 of the Securities Act of 1933 (§230.405 of this chapter) or Rule 12b-2 of the Securities Exchange Act of 1934 (§240.12b-2 of this chapter).

​

Emerging growth company        ☐

​

If an emerging growth company, indicate by check mark if the registrant has elected not to use the extended transition period for complying with any new or revised financial accounting standards provided pursuant to Section 13(a) of the Exchange Act. ☐

​

​

​

​

​

Item 2.02.   Results of Operations and Financial Condition.

​

On October 26, 2022, Merit Medical Systems, Inc. (the “Company”) issued a press release announcing its operating and financial results for the quarter ended September 30, 2022. A copy of the press release is furnished as Exhibit 99.1 to this report and incorporated herein by reference.

​

Item 7.01. Regulation FD Disclosure.

​

On October 26, 2022, the Company is conducting a conference call to discuss its operating and financial results for the quarter ended September 30, 2022. A live webcast and slide presentation will also be available for the conference call on the Company’s website. A copy of the slide presentation is furnished as Exhibit 99.2 to this report.

​

The information contained in Item 2.02 and Item 7.01 of this Current Report on Form 8-K (including the exhibits attached hereto) is furnished pursuant to General Instruction B.2. of Form 8-K and shall not be deemed to be “filed” for purposes of Section 18 of the Securities Exchange Act of 1934, as amended (the “Exchange Act”), or otherwise subject to the liabilities of that section, nor shall it be deemed incorporated by reference in any filing made by the Company under the Securities Act of 1933, as amended, or the Exchange Act.

​

Item 9.01.   Financial Statements and Exhibits.

​

(d)            Exhibits

​

EXHIBIT NUMBER


DESCRIPTION

​

​

​

99.1

​

Press Release, dated October 26, 2022, entitled “Merit Medical Reports Results for Quarter Ended September 30, 2022” including unaudited financial information.

99.2

​

Conference Call Presentation.

104

​

The cover page from this Current Report on Form 8-K, formatted in Inline XBRL.

​

​

​

2

​

SIGNATURES

​

Pursuant to the requirements of the Securities Exchange Act of 1934, as amended, the registrant has duly caused this report to be signed on its behalf by the undersigned hereunto duly authorized.

​

​

MERIT MEDICAL SYSTEMS, INC.

​

​

​

​

​

​

Date: October 26, 2022

By:

/s/ Brian G. Lloyd

​

​

Brian G. Lloyd

​

​

Chief Legal Officer and Corporate Secretary

​

​

​

3

Exhibit 99.1

Graphic

​

​

​

​

​

​

​

​

​

​

​

​

​

​

Contacts:

​

​

​

​

​

​

PR/Media Inquiries:

Teresa Johnson

Merit Medical

Investor Inquiries:

Mike Piccinino, CFA, IRC

Westwicke - ICR

​

​

​

​

+1-801-208-4295

+1-443-213-0509

​

​

​

​

[email protected]

[email protected]

​

​

​

​

​

​

​

​

FOR IMMEDIATE RELEASE

MERIT MEDICAL REPORTS RESULTS FOR
QUARTER ENDED SEPTEMBER 30, 2022

​

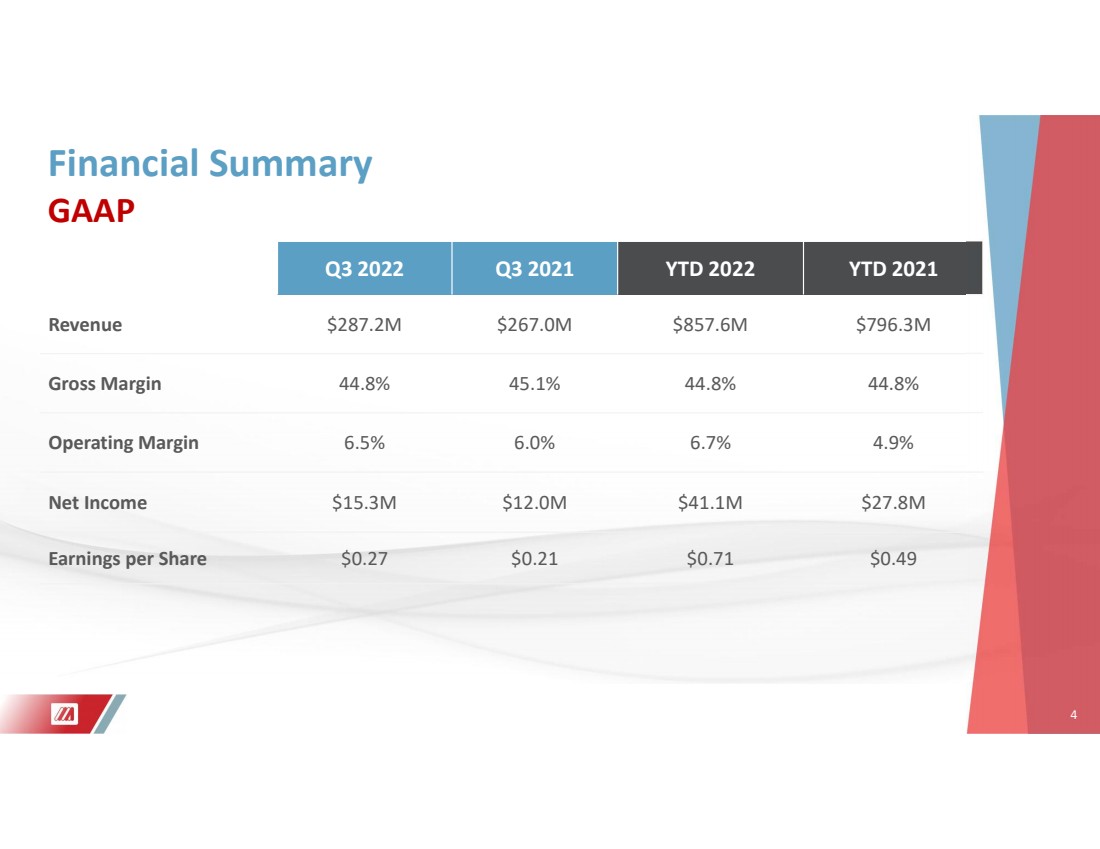
●Q3 2022 reported revenue of $287.2 million, up 7.5% compared to Q3 2021
●Q3 2022 constant currency revenue, organic* up 10.5% compared to Q3 2021
●Q3 2022 GAAP operating margin of 6.5%, compared to 6.0% in Q3 2021
●Q3 2022 non-GAAP operating margin* of 16.1%, compared to 14.8% in Q3 2021
●Q3 2022 GAAP EPS $0.27, compared to $0.21 in Q3 2021
●Q3 2022 non-GAAP EPS* of $0.64, compared to $0.52 in Q3 2021

*  Constant currency revenue; constant currency revenue, organic; non-GAAP EPS; non-GAAP net income; non-GAAP operating income and margin; non-GAAP gross profit and margin; and free cash flow are non-GAAP financial measures. A reconciliation of these financial measures to their most directly comparable GAAP financial measures is included under the heading “Non-GAAP Financial Measures” below.

SOUTH JORDAN, Utah, October 26, 2022 -- Merit Medical Systems, Inc. (NASDAQ: MMSI), a leading global manufacturer and marketer of healthcare technology, today announced revenue of $287.2 million for the quarter ended September 30, 2022, an increase of 7.5% compared to the quarter ended September 30, 2021. Constant currency revenue, organic, for the third quarter of 2022 increased 10.5% compared to the prior year period.

1


Merit’s revenue by operating segment and product category for the three and nine-month periods ended September 30, 2022 and 2021 was as follows (unaudited; in thousands, except for percentages):

​

​

​

​

​

​

​

​

​

​

​

​

​

​

​

​

​

​

​

​

​


Three Months Ended

​

​

Reported

​

​

​

​

Constant Currency

​


September 30, 

​

​

​

​

Impact of foreign

​

September 30, 

​

​

​

​


2022


2021

​

% Change

​

exchange

​

2022

​

% Change

Cardiovascular

​

​

​

​

​

​

​

​

​

​

​

​

​

​

​

​

​

​

Peripheral Intervention


$

110,698

​

$

101,059

​

9.5

%  

​

$

2,289

​

$

112,987

​

11.8

%  

Cardiac Intervention


86,848

​


79,813

​

8.8

%  

​

​

2,841

​

​

89,689

​

12.4

%  

Custom Procedural Solutions


45,692

​


49,435

​

(7.6)

%  

​

​

2,352

​

​

48,044

​

(2.8)

%  

OEM


35,711

​


29,397

​

21.5

%  

​

​

408

​

​

36,119

​

22.9

%  

Total


278,949

​


259,704

​

7.4

%  

​

​

7,890

​

​

286,839

​

10.4

%  

​

​

​

​

​

​

​

​

​

​

​

​

​

​

​

​

​

​

​

Endoscopy

​

​

​

​

​

​

​

​

​

​

​

​

​

​

​

​

​

​

Endoscopy Devices


8,226

​


7,317

​

12.4

%  

​

​

85

​

​

8,311

​

13.6

%  

​

​

​

​

​

​

​

​

​

​

​

​

​

​

​

​

​

​

​

Total


$

287,175

​

$

267,021

​

7.5

%  

​

$

7,975

​

$

295,150

​

10.5

%  

​

​

​

​

​

​

​

​

​

​

​

​

​

​

​

​

​

​

​

​

​


Nine Months Ended

​

​

Reported

​

​

​

​

Constant Currency

​


September 30, 

​

​

​

​

Impact of foreign

​

September 30, 

​

​

​

​


2022


2021

​

% Change

​

exchange

​

2022

​

% Change

Cardiovascular

​

​

​

​

​

​

​

​

​

​

​

​

​

​

​

​

​

​

Peripheral Intervention


$

327,426

​

$

299,573

​

9.3

%  

​

$

4,013

​

$

331,439

​

10.6

%  

Cardiac Intervention


257,909

​


240,203

​

7.4

%  

​

​

5,345

​

​

263,254

​

9.6

%  

Custom Procedural Solutions


141,047

​


143,492

​

(1.7)

%  

​

​

5,261

​

​

146,308

​

2.0

%  

OEM


106,173

​


89,734

​

18.3

%  

​

​

947

​

​

107,120

​

19.4

%  

Total


832,555

​


773,002

​

7.7

%  

​

​

15,566

​

​

848,121

​

9.7

%  

​

​

​

​

​

​

​

​

​

​

​

​

​

​

​

​

​

​

​

Endoscopy

​

​

​

​

​

​

​

​

​

​

​

​

​

​

​

​

​

​

Endoscopy Devices


25,011

​


23,257

​

7.5

%  

​

​

197

​

​

25,208

​

8.4

%  

​

​

​

​

​

​

​

​

​

​

​

​

​

​

​

​

​

​

​

Total


$

857,566

​

$

796,259

​

7.7

%  

​

$

15,763

​

$

873,329

​

9.7

%  

​

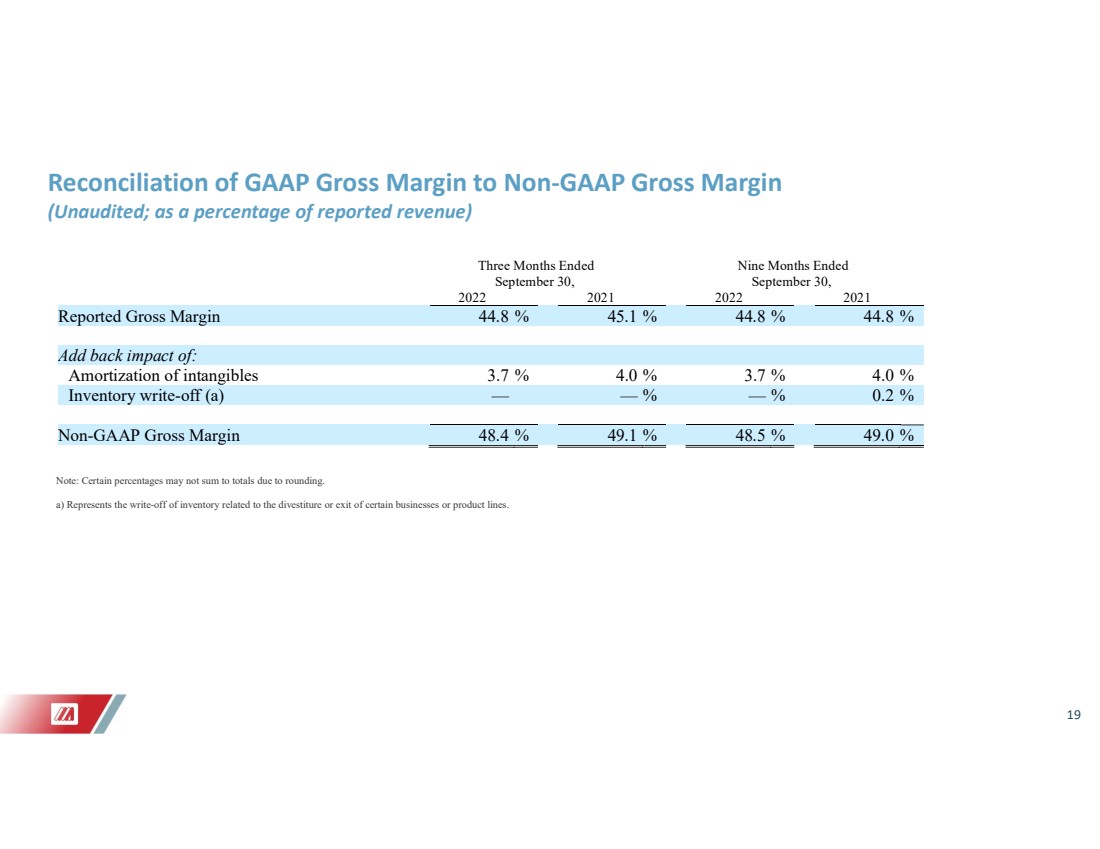
Merit’s GAAP gross margin for the third quarter of 2022 was 44.8%, compared to GAAP gross margin of 45.1% for the prior year period. Merit’s non-GAAP gross margin* for the third quarter of 2022 was 48.4%, compared to non-GAAP gross margin of 49.1% for the prior year period.

Merit’s GAAP net income for the third quarter of 2022 was $15.3 million, or $0.27 per share, compared to GAAP net income of $12.0 million, or $0.21 per share, for the third quarter of 2021. Merit’s non-GAAP net income* for the third quarter of 2022 was $37.0 million, or $0.64 per share, compared to non-GAAP net income of $30.2 million, or $0.52 per share, for the prior year period.

2


“We delivered better-than-expected revenue results for the third quarter of 2022, posting 10.5% constant currency sales growth fueled by solid execution from our team and more favorable than anticipated demand trends from customers in the U.S.,  EMEA and APAC regions.” said Fred P. Lampropoulos, Merit’s Chairman and Chief Executive Officer. “We also delivered better-than-expected profitability in the quarter, with approximately 23% growth year-over-year in both non-GAAP net income and non-GAAP earnings per share, driven by the combination of our strong revenue results and continued benefits from our multi-year strategic initiatives related to the Foundations for Growth Program.”

​

Mr. Lampropoulos continued: “Our updated guidance expectations for 2022 reflect continued confidence in our ability to drive solid constant currency revenue growth, improvements in our profitability profile and strong free cash flow generation in 2022. Overall, we continue to execute and are excited about the results we are seeing across our business. We remain committed to the financial targets that we outlined in the Foundations for Growth Program for the three-year period ending December 31, 2023, which call for our constant currency, organic revenue to increase at a CAGR of at least 5%, non-GAAP operating margins of at least 18% and cumulative free cash flow of more than $300 million.”

​

As of September 30, 2022, Merit had cash and cash equivalents of $51.5 million, total debt obligations of $216.9 million, and available borrowing capacity of approximately $509 million, compared to cash, cash equivalents and restricted cash of $67.8 million, total debt obligations of $243.1 million, and available borrowing capacity of approximately $490 million as of December 31, 2021.

​

​

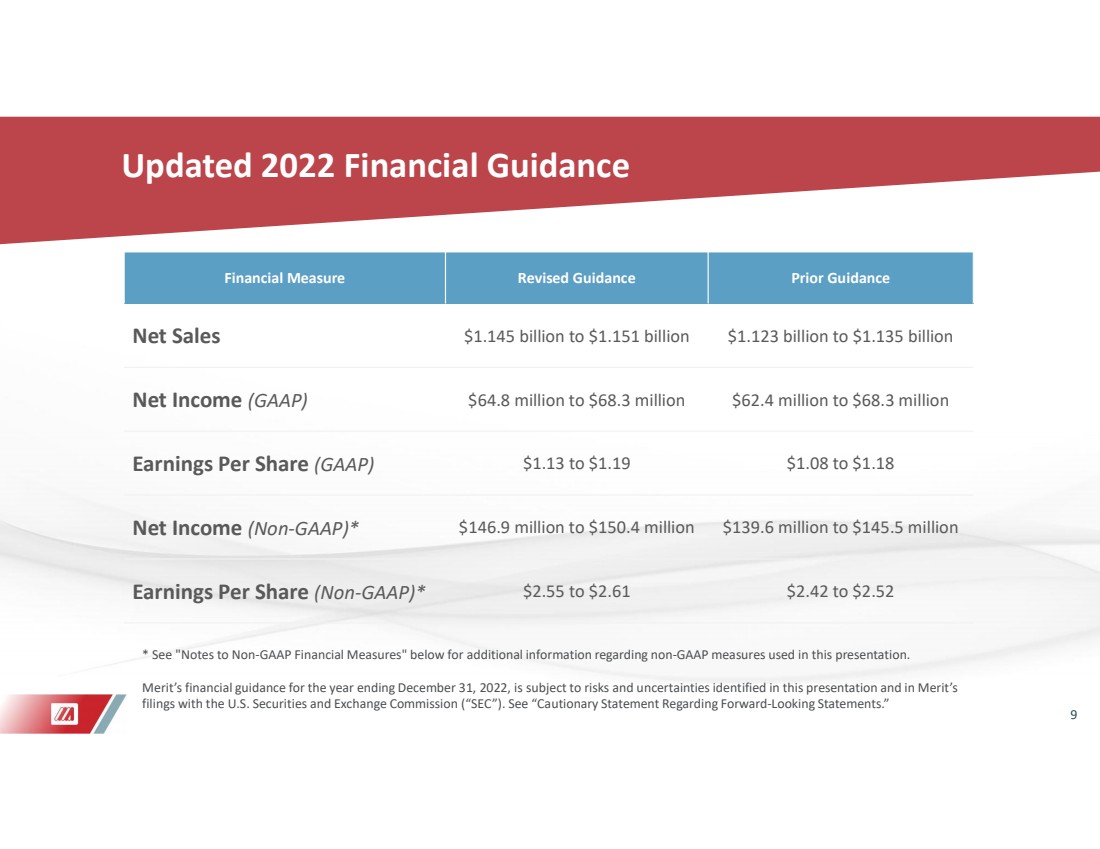
Updated Fiscal Year 2022 Financial Guidance

Based upon information currently available to Merit’s management, for the year ending December 31, 2022, absent material acquisitions, non-recurring transactions or other factors beyond Merit’s current expectations, Merit now expects the following:

​

​

​

​

​

​

​

​

​

​

​

​


Revised Guidance

​

As Reported

​

​

​

Prior Guidance

​

​

​

​

​

​

​

% Change

​

​

​

Financial Measure

​

December 31, 2022

​

December 31, 2021

​

from Prior Year

​

December 31, 2022

​

​

​

​

​

​

​

​

​

​

​

Net Sales

​

$1.145 - $1.151 billion

​

$1.075 billion

​

6.5% - 7.1%

​

$1.123 - $1.135 billion

​

Cardiovascular Segment

​

$1.112 - $1.117 billion

​

$1.043 billion

​

6.6% - 7.1%

​

$1.093 - $1.102 billion

​

Endoscopy Segment

​

$32.7 - $33.2 million

​

$31.5 million

​

3.8% - 5.4%

​

$30.0 - $34.0 million

​

​

​

​

​

​

​

​

​

​

​

GAAP

​


​

​

​

​


​

Net Income

​

$64.8 - $68.3 million

​

$48.5 million

​

​

​

$62.4 - $68.3 million

​

Earnings Per Share

​

$1.13 - $1.19

​

$0.84

​

​


$1.08 - $1.18

​

​

​

​

​

​

​

​

​

​

​

Non-GAAP

​


​

​

​

​


​

Net Income

​

$146.9 - $150.4 million

​

$136.2 million

​

​

​

$139.6 - $145.5 million

​

Earnings Per Share

​

$2.55 - $2.61

​

$2.37

​

​


$2.42 - $2.52

​

​

Merit’s financial guidance for the year ending December 31, 2022 is subject to risks and uncertainties identified in this release and Merit’s filings with the U.S. Securities and Exchange Commission (the “SEC”).

​

CONFERENCE CALL

Merit will hold its investor conference call today, Wednesday, October 26, 2022, at 5:00 p.m. Eastern (4:00 p.m. Central, 3:00 p.m. Mountain, and 2:00 p.m. Pacific). To access the conference call, please pre-register using the following link. Registrants will receive confirmation with dial-in details. A live webcast and slide deck will also be available at merit.com.

3


CONSOLIDATED BALANCE SHEETS

(in thousands)

​

​

​

​

​

​

​

​

​


September 30, 


​

​

​

​

2022

​

December 31, 

​

​

(Unaudited)

​

2021

ASSETS


​


​


Current Assets


​


​


Cash and cash equivalents

​

$

51,481

​

$

67,750

Trade receivables, net

​


155,828

​


152,301

Other receivables

​


10,827

​


17,763

Inventories

​


246,660

​


221,922

Prepaid expenses and other assets

​


27,388

​


16,149

Prepaid income taxes

​


3,515

​


3,550

Income tax refund receivables

​


4,164

​


2,777

Total current assets

​


499,863

​


482,212

​

​

​

​

​

​

​

Property and equipment, net

​


376,156

​


371,658

Intangible assets, net

​


284,107

​


319,269

Goodwill

​


358,056

​


361,741

Deferred income tax assets

​


5,467

​


6,080

Operating lease right-of-use assets

​


64,700

​


65,913

Other assets

​


44,388

​


41,421

Total Assets

​

$

1,632,737

​

$

1,648,294

​

​

​

​

​

​

​

LIABILITIES AND STOCKHOLDERS' EQUITY

​


​


Current Liabilities

​


​


Trade payables

​

$

63,206

​

$

55,624

Accrued expenses

​


124,504

​


159,014

Current portion of long-term debt

​


11,250

​


8,438

Current operating lease liabilities

​


10,310

​


10,668

Income taxes payable

​


3,765

​


2,536

Total current liabilities

​


213,035

​


236,280

​

​

​

​

​

​

​

Long-term debt

​


205,412

​


234,397

Deferred income tax liabilities

​


31,168

​


31,503

Long-term income taxes payable

​


347

​


347

Liabilities related to unrecognized tax benefits

​


932

​


932

Deferred compensation payable

​


14,786

​


18,111

Deferred credits

​


1,735

​


1,815

Long-term operating lease liabilities

​


59,989

​


61,526

Other long-term obligations

​


16,492

​


23,584

Total liabilities

​


543,896

​


608,495

​

​

​

​

​

​

​

Stockholders' Equity

​


​


Common stock

​


658,198

​


641,533

Retained earnings

​


447,372

​


406,257

Accumulated other comprehensive loss

​


(16,729)

​


(7,991)

Total stockholders' equity

​


1,088,841

​


1,039,799

Total Liabilities and Stockholders' Equity

​

$

1,632,737

​

$

1,648,294

​

​

​

​

​

4


CONSOLIDATED STATEMENTS OF INCOME

(Unaudited; in thousands except per share amounts)

​

​

​

​

​

​

​

​

​

​

​

​

​

​

​


Three Months Ended


Nine Months Ended

​

​

September 30, 

​

September 30, 

​


2022


2021


2022


2021

Net sales

​

$

287,175

​

$

267,021

​

$

857,566

​

$

796,259

Cost of sales

​


158,602

​


146,527

​


473,019

​


439,732

Gross profit

​


128,573

​


120,494

​


384,547

​


356,527

​

​

​

​

​

​

​

​

​

​

​

​

​

Operating expenses:

​


​


​


​


Selling, general and administrative

​


89,780

​


86,474

​


259,282

​


259,061

Research and development

​


19,221

​


16,974

​


55,074

​


50,841

Impairment charges

​


—

​


—

​


1,672

​


4,283

Contingent consideration expense

​


915

​


1,115

​


4,702

​


3,322

Acquired in-process research and development

​


—

​


—

​


6,671

​


—

Total operating expenses

​


109,916

​


104,563

​


327,401

​


317,507

​

​

​

​

​

​

​

​

​

​

​

​

​

Income from operations

​


18,657

​


15,931

​


57,146

​


39,020

​

​

​

​

​

​

​

​

​

​

​

​

​

Other income (expense):

​


​


​


​


Interest income

​


116

​


104

​


316

​


668

Interest expense

​


(1,831)

​


(1,233)

​


(4,180)

​


(4,156)

Other income (expense) — net

​


660

​


(625)

​


(808)

​


(1,796)

Total other expense — net

​


(1,055)

​


(1,754)

​


(4,672)

​


(5,284)

​

​

​

​

​

​

​

​

​

​

​

​

​

Income before income taxes

​


17,602

​


14,177

​


52,474

​


33,736

​

​

​

​

​

​

​

​

​

​

​

​

​

Income tax expense

​


2,330

​


2,210

​


11,359

​


5,895

​

​

​

​

​

​

​

​

​

​

​

​

​

Net income

​

$

15,272

​

$

11,967

​

$

41,115

​

$

27,841

​

​

​

​

​

​

​

​

​

​

​

​

​

Earnings per common share

​


​


​


​


Basic

​

$

0.27

​

$

0.21

​

$

0.73

​

$

0.50

Diluted

​

$

0.27

​

$

0.21

​

$

0.71

​

$

0.49

​

​

​

​

​

​

​

​

​

​

​

​

​

Weighted average shares outstanding

​


​


​


​


Basic

​


56,835

​


56,302

​


56,707

​


56,033

Diluted

​


57,586

​


57,549

​


57,573

​


57,274

​

​

​

5


​

CONSOLIDATED STATEMENTS OF CASH FLOWS

(In thousands - unaudited)

​

​

​

​

​

​

​

​

​

​

Nine Months Ended

​

​

September 30, 

​


2022


2021

CASH FLOWS FROM OPERATING ACTIVITIES:


​

​

​

Net income

​

$

41,115

​

$

27,841

Adjustments to reconcile net income to net cash provided by operating activities:

​


​


Depreciation and amortization

​


61,312

​


63,173

Loss on disposition of business

​

​

1,389

​


—

Write-off of certain intangible assets and other long-term assets

​


1,733

​


4,412

Amortization of right-of-use operating lease assets

​

​

7,819

​


8,941

Adjustments and payments related to contingent consideration liability

​

​

2,888

​


3,322

Acquired in-process research and development

​

​

6,671

​

​

—

Stock-based compensation expense

​


13,691

​


11,589

Other adjustments

​

​

568

​

​

1,002

Changes in operating assets and liabilities, net of acquisitions and divestitures

​


(50,903)

​


(18,864)

Total adjustments

​


45,168

​


73,575

Net cash, cash equivalents, and restricted cash provided by operating activities

​


86,283

​


101,416

​

​

​

​

​

​

​

CASH FLOWS FROM INVESTING ACTIVITIES:

​


​


Capital expenditures for property and equipment

​


(32,539)

​


(19,612)

Cash paid in acquisitions, net of cash acquired

​

​

(4,712)

​

​

(1,858)

Other investing, net

​

​

(2,817)

​

​

(1,084)

Net cash, cash equivalents, and restricted cash used in investing activities

​

​

(40,068)

​

​

(22,554)

​

​

​

​

​

​

​

CASH FLOWS FROM FINANCING ACTIVITIES:


​

​

​

Proceeds from issuance of common stock

​

​

6,733

​

​

17,814

Proceeds from (payments on) long-term debt, net

​

​

(26,257)

​

​

(72,625)

Contingent payments related to acquisitions

​


(32,862)

​


(10,579)

Payment of taxes related to an exchange of common stock

​


(2,125)

​


(576)

Net cash, cash equivalents, and restricted cash used in financing activities

​


(54,511)

​


(65,966)

Effect of exchange rates on cash

​


(5,862)

​


(908)

Net increase (decrease) in cash, cash equivalents and restricted cash

​


(14,158)

​


11,988

​

​

​

​

​

​

​

CASH, CASH EQUIVALENTS AND RESTRICTED CASH:

​


​


Beginning of period

​


67,750

​


56,916

End of period

​

$

53,592

​

$

68,904

​

​

​

​

​

​

​

RECONCILIATION OF CASH, CASH EQUIVALENTS AND RESTRICTED CASH TO THE CONSOLIDATED BALANCE SHEETS:

​

​

​

​

​

​

Cash and cash equivalents

​

​

51,481

​

​

68,904

Restricted cash reported in prepaid expenses and other current assets

​

​

2,111

​

​

—

Total cash, cash equivalents and restricted cash

​

$

53,592

​

$

68,904

​

​

​

​

6


Non-GAAP Financial Measures

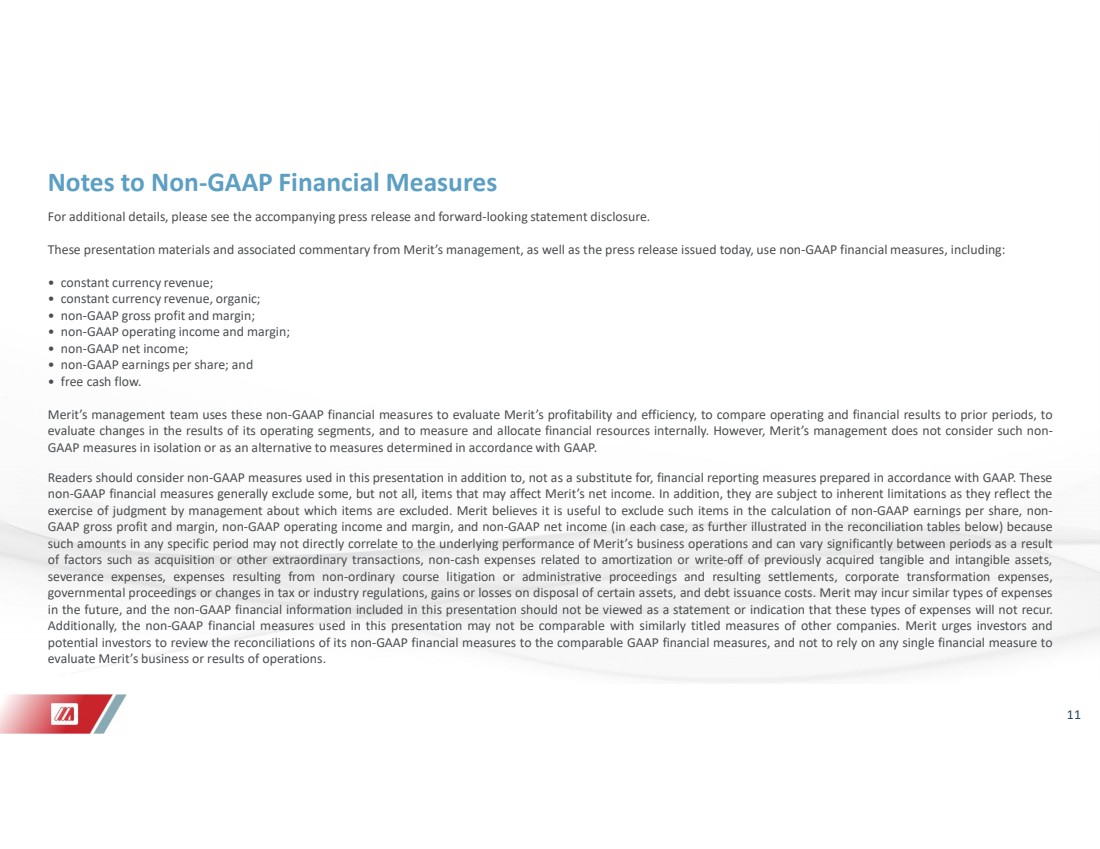
Although Merit’s financial statements are prepared in accordance with accounting principles generally accepted in the United States of America (“GAAP”), Merit’s management believes that certain non-GAAP financial measures referenced in this release provide investors with useful information regarding the underlying business trends and performance of Merit’s ongoing operations and can be useful for period-over-period comparisons of such operations. Non-GAAP financial measures used in this release include:

●constant currency revenue;
●constant currency revenue, organic;
●non-GAAP gross profit and margin;
●non-GAAP operating income and margin;
●non-GAAP net income;
●non-GAAP earnings per share; and
●free cash flow.

Merit’s management team uses these non-GAAP financial measures to evaluate Merit’s profitability and efficiency, to compare operating and financial results to prior periods, to evaluate changes in the results of its operating segments, and to measure and allocate financial resources internally. However, Merit’s management does not consider such non-GAAP measures in isolation or as an alternative to measures determined in accordance with GAAP.

Readers should consider non-GAAP measures used in this release in addition to, not as a substitute for, financial reporting measures prepared in accordance with GAAP. These non-GAAP financial measures generally exclude some, but not all, items that may affect Merit’s net income. In addition, they are subject to inherent limitations as they reflect the exercise of judgment by management about which items are excluded. Merit believes it is useful to exclude such items in the calculation of non-GAAP earnings per share, non-GAAP gross profit and margin, non-GAAP operating income and margin, and non-GAAP net income (in each case, as further illustrated in the reconciliation tables below) because such amounts in any specific period may not directly correlate to the underlying performance of Merit’s business operations and can vary significantly between periods as a result of factors such as acquisition or other extraordinary transactions, non-cash expenses related to amortization or write-off of previously acquired tangible and intangible assets, certain severance expenses, expenses resulting from non-ordinary course litigation or administrative proceedings and resulting settlements, corporate transformation expenses, governmental proceedings or changes in tax or industry regulations, gains or losses on disposal of certain assets, and debt issuance costs. Merit may incur similar types of expenses in the future, and the non-GAAP financial information included in this release should not be viewed as a statement or indication that these types of expenses will not recur. Additionally, the non-GAAP financial measures used in this release may not be comparable with similarly titled measures of other companies. Merit urges readers to review the reconciliations of its non-GAAP financial measures to the comparable GAAP financial measures, and not to rely on any single financial measure to evaluate Merit’s business or results of operations.

Constant Currency Revenue

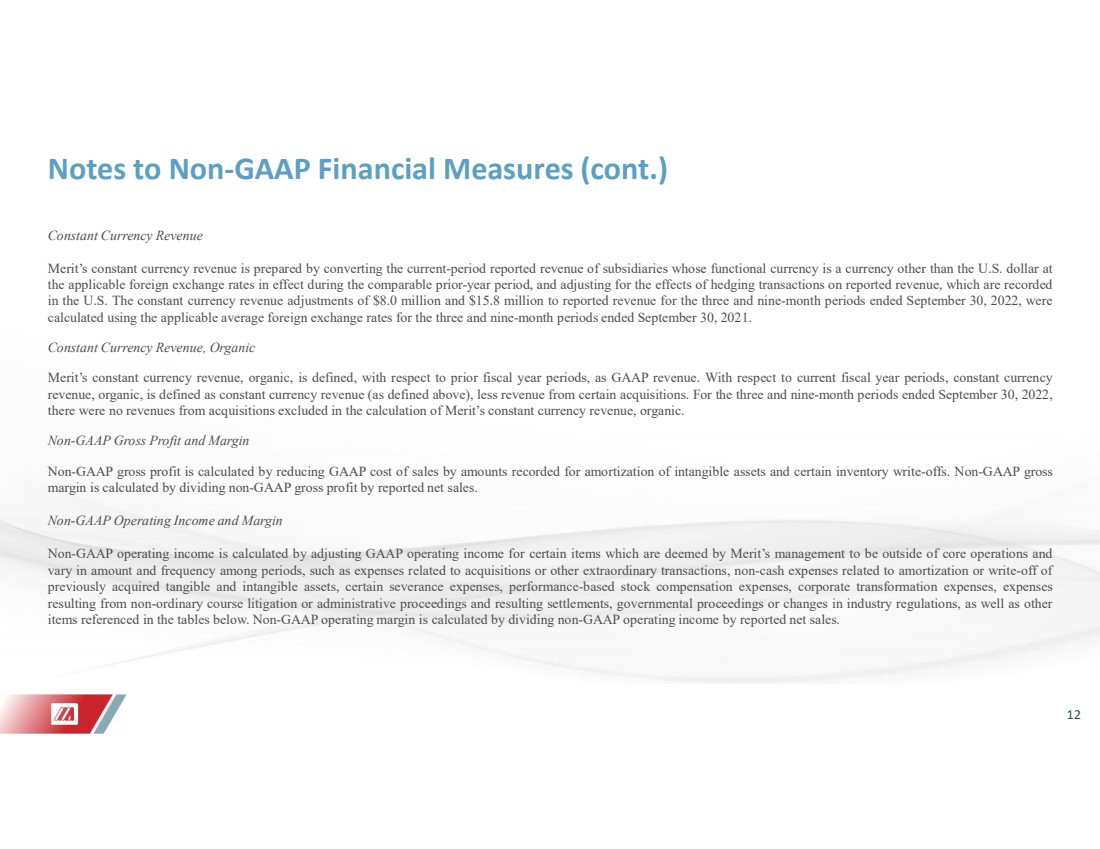
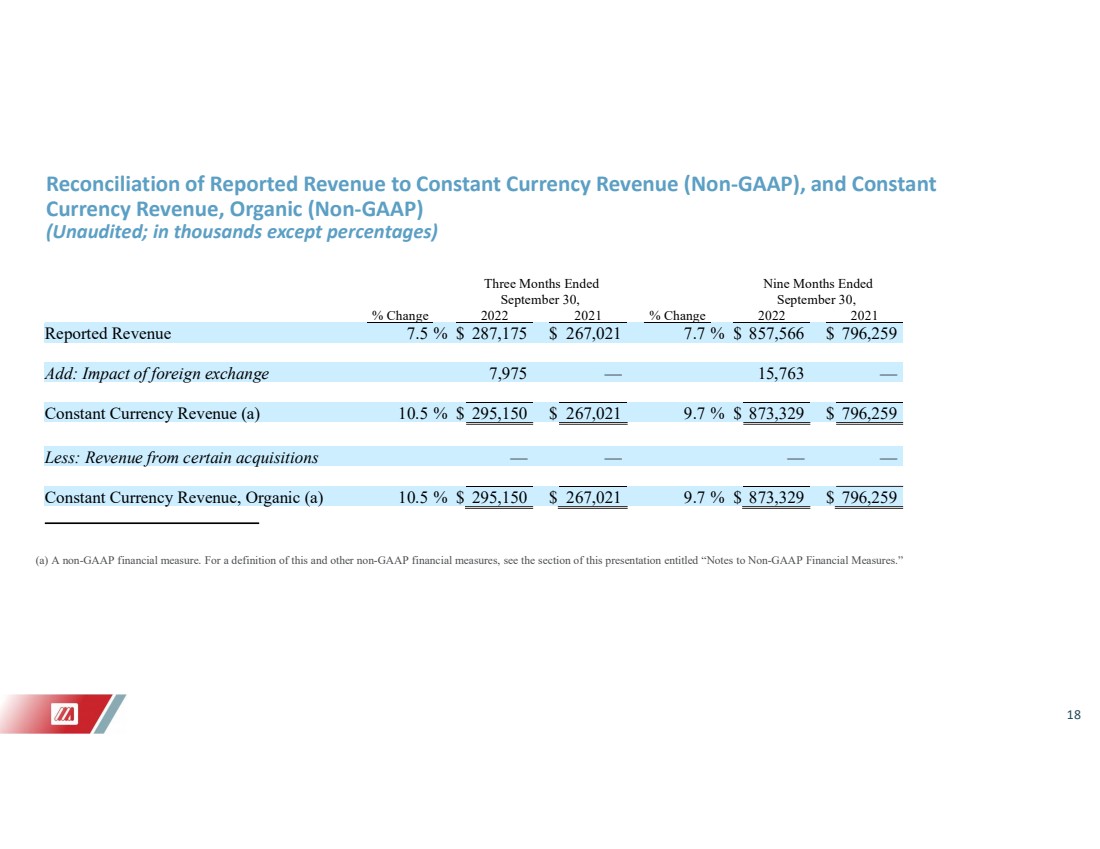
Merit’s constant currency revenue is prepared by converting the current-period reported revenue of subsidiaries whose functional currency is a currency other than the U.S. dollar at the applicable foreign exchange rates in effect during the comparable prior-year period, and adjusting for the effects of hedging transactions on reported revenue, which are recorded in the U.S. dollar. The constant currency revenue adjustments of $8.0 million and $15.8 million to reported revenue for the three and nine-month periods ended September 30, 2022, were calculated using the applicable average foreign exchange rates for the three and nine-month periods ended September 30, 2021.

Constant Currency Revenue, Organic

Merit’s constant currency revenue, organic, is defined, with respect to prior fiscal year periods, as GAAP revenue. With respect to current fiscal year periods, constant currency revenue, organic, is defined as constant currency revenue (as defined above), less revenue from certain acquisitions. For the three and nine-month periods ended September 30, 2022, there were no revenues from acquisitions excluded in the calculation of Merit’s constant currency revenue, organic.

7


Non-GAAP Gross Profit and Margin

Non-GAAP gross profit is calculated by reducing GAAP cost of sales by amounts recorded for amortization of intangible assets and certain inventory write-offs. Non-GAAP gross margin is calculated by dividing non-GAAP gross profit by reported net sales.

Non-GAAP Operating Income and Margin

Non-GAAP operating income is calculated by adjusting GAAP operating income for certain items which are deemed by Merit’s management to be outside of core operations and vary in amount and frequency among periods, such as expenses related to acquisitions or other extraordinary transactions, non-cash expenses related to amortization or write-off of previously acquired tangible and intangible assets, certain severance expenses, performance-based stock compensation expenses, corporate transformation expenses, expenses resulting from non-ordinary course litigation or administrative proceedings and resulting settlements, governmental proceedings or changes in industry regulations, as well as other items referenced in the tables below. Non-GAAP operating margin is calculated by dividing non-GAAP operating income by reported net sales.

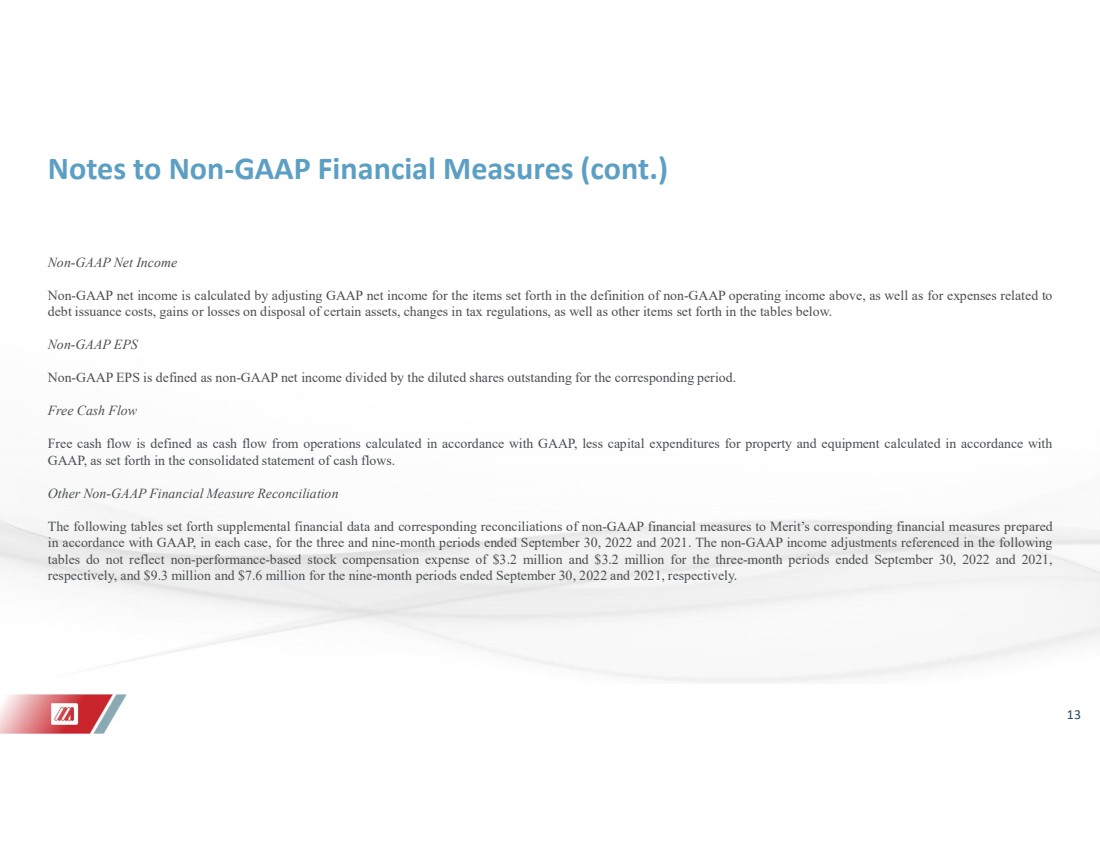
Non-GAAP Net Income

Non-GAAP net income is calculated by adjusting GAAP net income for the items set forth in the definition of non-GAAP operating income above, as well as for expenses related to debt issuance costs, gains or losses on disposal of certain assets, changes in tax regulations, and other items set forth in the tables below.

Non-GAAP EPS

Non-GAAP EPS is defined as non-GAAP net income divided by the diluted shares outstanding for the corresponding period.

Free Cash Flow

Free cash flow is defined as cash flow from operations calculated in accordance with GAAP, less capital expenditures for property and equipment calculated in accordance with GAAP, as set forth in the consolidated statement of cash flows.

Non-GAAP Financial Measure Reconciliations

The following tables set forth supplemental financial data and corresponding reconciliations of non-GAAP financial measures to Merit’s corresponding financial measures prepared in accordance with GAAP, in each case, for the three and nine-month periods ended September 30, 2022 and 2021. The non-GAAP income adjustments referenced in the following tables do not reflect non-performance-based stock compensation expense of approximately $3.2 million and $3.2 million for the three-month periods ended September 30, 2022 and 2021, respectively and $9.3 million and $7.6 million for the nine-month periods ended September 30, 2022 and 2021, respectively.

​

8


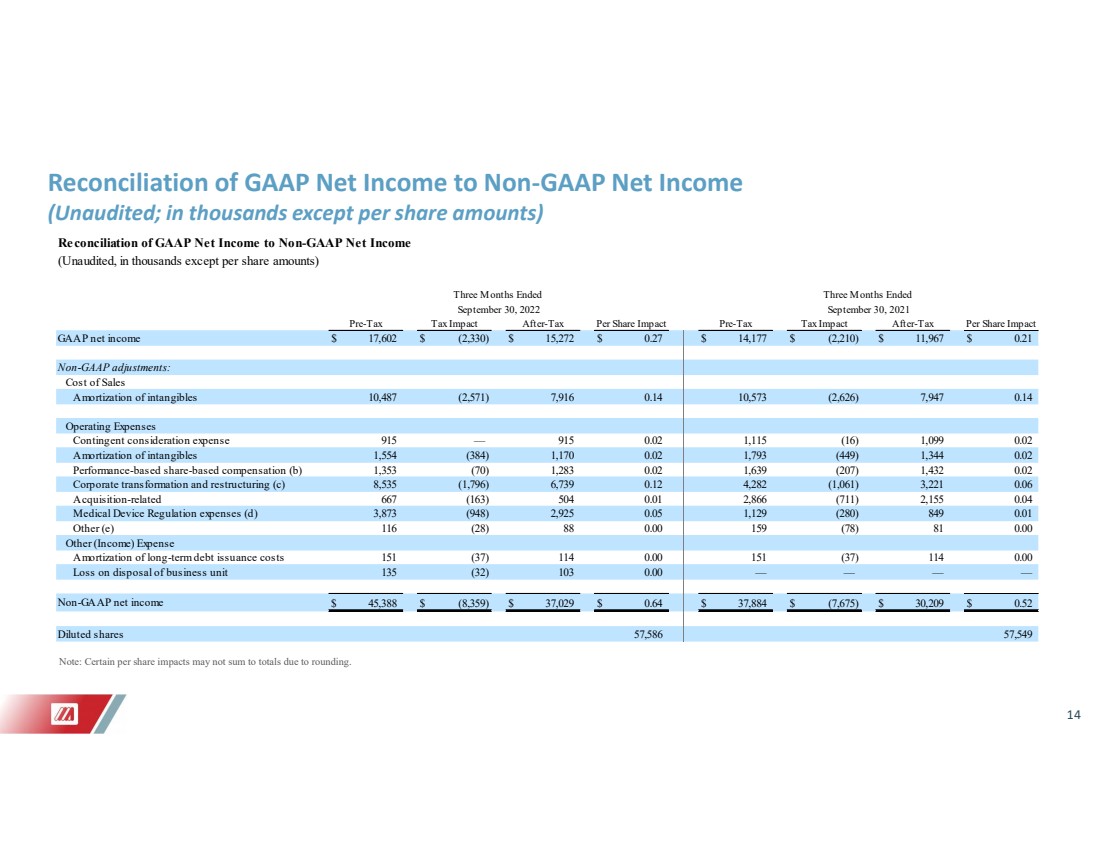
Reconciliation of GAAP Net Income to Non-GAAP Net Income

(Unaudited; in thousands except per share amounts)

​

​

​

​

​

​

​

​

​

​

​

​

​

​

​

​

Three Months Ended

​

​

September 30, 2022

​


Pre-Tax


Tax Impact


After-Tax


Per Share Impact

GAAP net income

​

$

17,602

​

$

(2,330)

​

$

15,272

​

$

0.27

​

​

​

​

​

​

​

​

​

​

​

​

​

Non-GAAP adjustments:


​


​


​


​


Cost of Sales

​

​


​

​


​

​


​

​


Amortization of intangibles

​

​

10,487

​

​

(2,571)

​

​

7,916

​

​

0.14

Operating Expenses

​

​

​

​

​

​

​

​


​

​


Contingent consideration expense

​

​

915

​

​

—

​

​

915

​

​

0.02

Amortization of intangibles

​

​

1,554

​

​

(384)

​

​

1,170

​

​

0.02

Performance-based share-based compensation (b)

​

​

1,353

​

​

(70)

​

​

1,283

​

​

0.02

Corporate transformation and restructuring (c)

​

​

8,535

​

​

(1,796)

​

​

6,739

​

​

0.12

Acquisition-related

​

​

667

​

​

(163)

​

​

504

​

​

0.01

Medical Device Regulation expenses (d)

​

​

3,873

​

​

(948)

​

​

2,925

​

​

0.05

Other (e)

​

​

116

​

​

(28)

​

​

88

​

​

0.00

Other (Income) Expense

​

​

​

​

​

​

​

​

​

​

​

​

Amortization of long-term debt issuance costs

​

​

151

​

​

(37)

​

​

114

​

​

0.00

Loss on disposal of business unit

​

​

135

​

​

(32)

​

​

103

​

​

0.00

​

​

​

​

​

​

​

​

​

​

​

​

​

Non-GAAP net income

​

$

45,388

​

$

(8,359)

​

$

37,029

​

$

0.64

​

​

​

​

​

​

​

​

​

​

​

​

​

Diluted shares

​


​


​


​


57,586

​

​

​

​

​

​

​

​

​

​

​

​

​

​

​

​

Three Months Ended

​

​

September 30, 2021

​

​

Pre-Tax

​

Tax Impact

​

After-Tax

​

Per Share Impact

GAAP net income


$

14,177


$

(2,210)


$

11,967


$

0.21

​

​

​

​

​

​

​

​

​

​

​

​

​

Non-GAAP adjustments:

​


​


​


​


Cost of Sales

​

​


​

​


​

​


​

​


Amortization of intangibles

​

​

10,573

​

​

(2,626)

​

​

7,947

​

​

0.14

Operating Expenses

​

​

​

​

​

​

​

​


​

​


Contingent consideration expense

​

​

1,115

​

​

(16)

​

​

1,099

​

​

0.02

Amortization of intangibles

​

​

1,793

​

​

(449)

​

​

1,344

​

​

0.02

Performance-based share-based compensation (b)

​

​

1,639

​

​

(207)

​

​

1,432

​

​

0.02

Corporate transformation and restructuring (c)

​

​

4,282

​

​

(1,061)

​

​

3,221

​

​

0.06

Acquisition-related

​

​

2,866

​

​

(711)

​

​

2,155

​

​

0.04

Medical Device Regulation expenses (d)

​

​

1,129

​

​

(280)

​

​

849

​

​

0.01

Other (e)

​

​

159

​

​

(78)

​

​

81

​

​

0.00

Other (Income) Expense

​

​

​

​

​

​

​

​


​

​

​

Amortization of long-term debt issuance costs

​

​

151

​

​

(37)

​

​

114

​

​

0.00

​

​

​

​

​

​

​

​

​

​

​

​

​

Non-GAAP net income

​

$

37,884

​

$

(7,675)

​

$

30,209

​

$

0.52

​

​

​

​

​

​

​

​

​

​

​

​

​

Diluted shares

​


​


​


​


57,549


Note: Certain per share impacts may not sum to totals due to rounding.

​

​

​

​

​

​

​

9


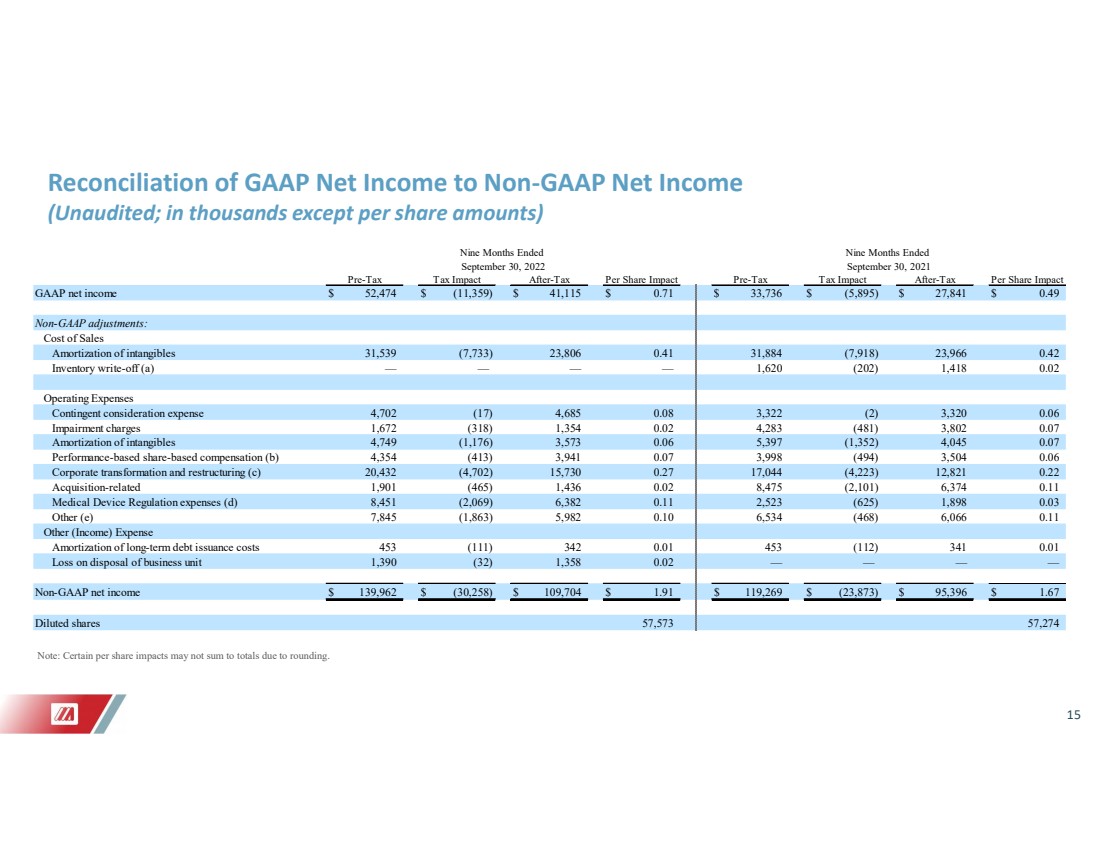
Reconciliation of GAAP Net Income to Non-GAAP Net Income

(Unaudited; in thousands except per share amounts)

​

​

​

​

​

​

​

​

​

​

​

​

​

​

​

​

Nine Months Ended

​

​

September 30, 2022

​


Pre-Tax


Tax Impact


After-Tax


Per Share Impact

GAAP net income

​

$

52,474

​

$

(11,359)

​

$

41,115

​

$

0.71

​

​

​

​

​

​

​

​

​

​

​

​

​

Non-GAAP adjustments:

​


​


​


​


Cost of Sales

​

​


​

​


​

​


​

​

​

Amortization of intangibles

​

​

31,539

​

​

(7,733)

​

​

23,806

​


0.41

Operating Expenses

​

​

​

​

​

​

​

​


​

​


Contingent consideration expense

​

​

4,702

​

​

(17)

​

​

4,685

​


0.08

Impairment charges

​

​

1,672

​

​

(318)

​

​

1,354

​


0.02

Amortization of intangibles

​

​

4,749

​

​

(1,176)

​

​

3,573

​


0.06

Performance-based share-based compensation (b)

​

​

4,354

​

​

(413)

​

​

3,941

​

​

0.07

Corporate transformation and restructuring (c)

​

​

20,432

​

​

(4,702)

​

​

15,730

​


0.27

Acquisition-related

​

​

1,901

​

​

(465)

​

​

1,436

​


0.02

Medical Device Regulation expenses (d)

​

​

8,451

​

​

(2,069)

​

​

6,382

​


0.11

Other (e)

​

​

7,845

​

​

(1,863)

​

​

5,982

​

​

0.10

Other (Income) Expense

​

​

​

​

​

​

​

​

​

​


​

Amortization of long-term debt issuance costs

​

​

453

​

​

(111)

​

​

342

​


0.01

Loss on disposal of business unit

​

​

1,390

​

​

(32)

​

​

1,358

​

​

0.02

​

​

​

​

​

​

​

​

​

​

​

​

​

Non-GAAP net income

​

$

139,962

​

$

(30,258)

​

$

109,704

​

$

1.91

​

​

​

​

​

​

​

​

​

​

​

​

​

Diluted shares

​


​

​


​


​


57,573

​

​

​

​

​

​

​

​

​

​

​

​

​

​

​

​

Nine Months Ended

​

​

September 30, 2021

​


Pre-Tax


Tax Impact


After-Tax


Per Share Impact

GAAP net income

​

$

33,736

​

$

(5,895)

​

$

27,841

​

$

0.49

​

​

​

​

​

​

​

​

​

​

​

​

​

Non-GAAP adjustments:

​


​


​


​


Cost of Sales

​


​


​


​


Amortization of intangibles

​


31,884

​


(7,918)

​


23,966

​


0.42

Inventory write-off (a)

​

​

1,620

​

​

(202)

​

​

1,418

​

​

0.02

Operating Expenses

​


​


​

​


​


​

Contingent consideration expense

​


3,322

​


(2)

​


3,320

​


0.06

Impairment charges

​

​

4,283

​

​

(481)

​

​

3,802

​

​

0.07

Amortization of intangibles

​


5,397

​


(1,352)

​


4,045

​


0.07

Performance-based share-based compensation (b)

​

​

3,998

​

​

(494)

​

​

3,504

​

​

0.06

Corporate transformation and restructuring (c)

​


17,044

​


(4,223)

​


12,821

​


0.22

Acquisition-related

​


8,475

​


(2,101)

​


6,374

​


0.11

Medical Device Regulation expenses (d)

​

​

2,523

​

​

(625)

​

​

1,898

​

​

0.03

Other (e)

​

​

6,534

​

​

(468)

​

​

6,066

​

​

0.11

Other (Income) Expense

​


​

​


​


​


​

Amortization of long-term debt issuance costs

​


453

​


(112)

​


341

​


0.01

​

​

​

​

​

​

​

​

​

​

​

​

​

Non-GAAP net income

​

$

119,269

​

$

(23,873)

​

$

95,396

​

$

1.67

​

​

​

​

​

​

​

​

​

​

​

​

​

Diluted shares

​


​

​


​


​


57,274


Note: Certain per share impacts may not sum to totals due to rounding.

​

​

​

​

10


​

​

​

​

​

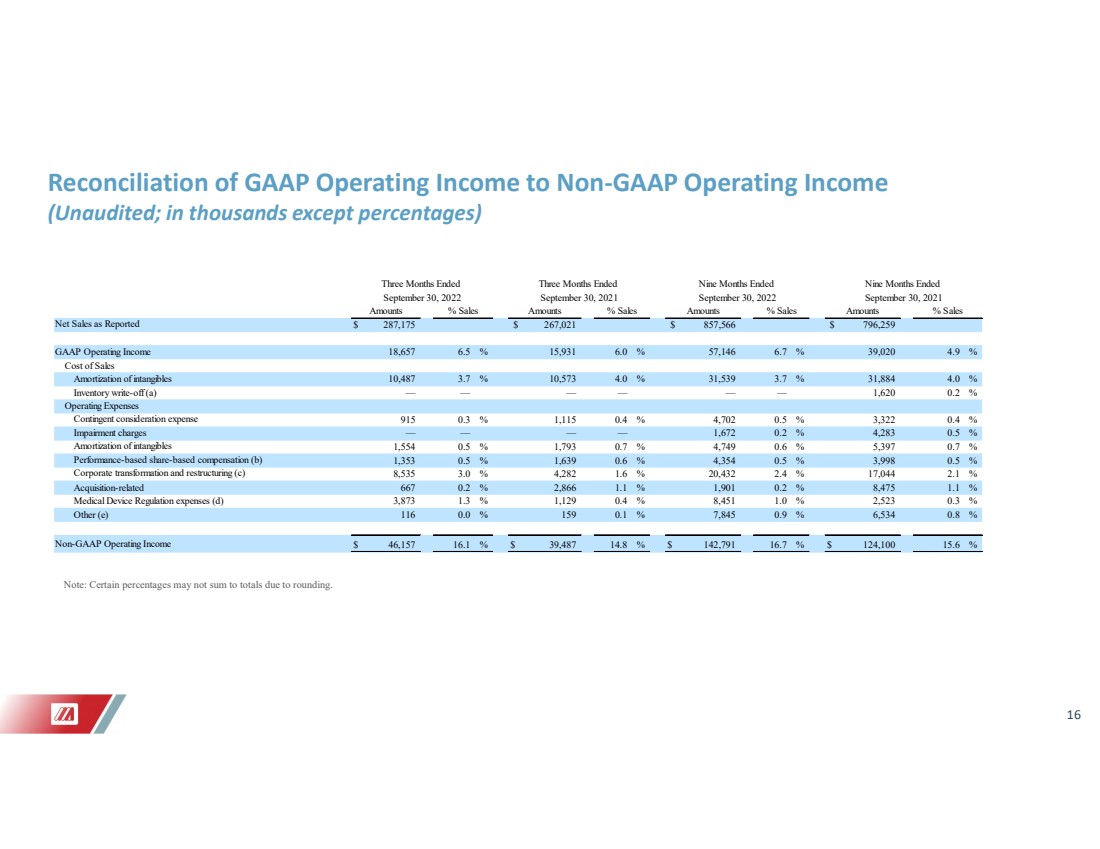
Reconciliation of Reported Operating Income to Non-GAAP Operating Income

(Unaudited; in thousands except percentages)

​

​

​

​

​

​

​

​

​

​

​

​

​

​

​

​

​

​

​

​

​

​

​

​

​

​

​

​

Three Months Ended

​

Three Months Ended

​

Nine Months Ended

​

Nine Months Ended

​

​

September 30, 2022

​

September 30, 2021

​

September 30, 2022

​

September 30, 2021

​


Amounts


% Sales


Amounts


% Sales


Amounts


% Sales


Amounts


% Sales

Net Sales as Reported

​

$

287,175

​

​

​

​

$

267,021

​

​

​

​

$

857,566

​

​

​

​

$

796,259

​

​

​

​

​

​

​

​

​

​

​

​

​

​

​

​

​

​

​

​

​

​

​

​

​

​

​

​

GAAP Operating Income

​

​

18,657

​

6.5

%

​

​

15,931

​

6.0

%

​

​

57,146

​

6.7

%

​

​

39,020

​

4.9

%

Cost of Sales

​

​

​

​

​

​

​

​

​

​

​

​

​

​

​

​

​

​

​

​

​

​

​

​

Amortization of intangibles

​

​

10,487

​

3.7

%

​

​

10,573

​

4.0

%

​

​

31,539

​

3.7

%

​

​

31,884

​

4.0

%

Inventory write-off (a)

​

​

—

​

—

​

​

​

—

​

—

​

​

​

—

​

—

​

​

​

1,620

​

0.2

%

Operating Expenses

​

​

​

​

​

​

​

​

​

​

​

​

​

​

​

​

​

​

​

​

​

​

​

​

Contingent consideration expense

​

​

915

​

0.3

%

​

​

1,115

​

0.4

%

​

​

4,702

​

0.5

%

​

​

3,322

​

0.4

%

Impairment charges

​

​

—

​

—

​

​

​

—

​

—

​

​

​

1,672

​

0.2

%

​

​

4,283

​

0.5

%

Amortization of intangibles

​

​

1,554

​

0.5

%

​

​

1,793

​

0.7

%

​

​

4,749

​

0.6

%

​

​

5,397

​

0.7

%

Performance-based share-based compensation (b)

​

​

1,353

​

0.5

%

​

​

1,639

​

0.6

%

​

​

4,354

​

0.5

%

​

​

3,998

​

0.5

%

Corporate transformation and restructuring (c)

​

​

8,535

​

3.0

%

​

​

4,282

​

1.6

%

​

​

20,432

​

2.4

%

​

​

17,044

​

2.1

%

Acquisition-related

​

​

667

​

0.2

%

​

​

2,866

​

1.1

%

​

​

1,901

​

0.2

%

​

​

8,475

​

1.1

%

Medical Device Regulation expenses (d)

​

​

3,873

​

1.3

%

​

​

1,129

​

0.4

%

​

​

8,451

​

1.0

%

​

​

2,523

​

0.3

%

Other (e)

​

​

116

​

0.0

%

​

​

159

​

0.1

%

​

​

7,845

​

0.9

%

​

​

6,534

​

0.8

%

​

​

​

​

​

​

​

​

​

​

​

​

​

​

​

​

​

​

​

​

​

​

​

​

​

Non-GAAP Operating Income

​

$

46,157

​

16.1

%

​

$

39,487

​

14.8

%

​

$

142,791

​

16.7

%

​

$

124,100

​

15.6

%


Note: Certain percentages may not sum to totals due to rounding

​

a)Represents the write-off of inventory related to the divestiture or exit of certain businesses or product lines.
b)Represents performance-based share-based compensation expense, including stock-settled and cash-settled awards.
c)Includes consulting expenses related to the Foundations for Growth Program and other transformation costs, including severance related to corporate initiatives.
d)Represents incremental expenses incurred to comply with the E.U. Medical Device Regulation (“MDR”).
e)The three-month period ended September 30, 2022 includes costs to comply with Merit’s corporate integrity agreement with the U.S. Department of Justice (the “DOJ”). The 2022 year-to-date period also includes acquired in-process research and development charges of $6.7 million and legal costs associated with a shareholder derivative proceeding. The 2021 periods include accrued contract termination costs of $6.1 million to renegotiate certain terms of an acquisition agreement and costs to comply with Merit’s corporate integrity agreement with the DOJ.

​

​

11


Reconciliation of Reported Revenue to Constant Currency Revenue (Non-GAAP), and Constant Currency Revenue, Organic (Non-GAAP)

(Unaudited; in thousands except percentages)

​

​

​

​

​

​

​

​

​

​

​

​

​

​

​

​

​

​

​

​

​

​

Three Months Ended

​

​

​

Nine Months Ended

​

​

​

​

September 30, 

​

​

​

September 30, 

​


% Change


2022


2021


% Change


2022


2021

Reported Revenue


7.5

%  

$

287,175

​

$

267,021


7.7

%  

$

857,566

​

$

796,259

​

​

​

​

​

​

​

​

​

​

​

​

​

​

​

​

​

Add: Impact of foreign exchange


​

​


7,975

​


—


​

​


15,763

​


—

​

​

​

​

​

​

​

​

​

​

​

​

​

​

​

​

​

Constant Currency Revenue (a)


10.5

%  

$

295,150

​

$

267,021


9.7

%  

$

873,329

​

$

796,259

​

​

​

​

​

​

​

​

​

​

​

​

​

​

​

​

​

Less: Revenue from certain acquisitions

​

​

​

​

—

​

​

—

​

​

​

​

—

​

​

—

​

​

​

​

​

​

​

​

​

​

​

​

​

​

​

​

​

Constant Currency Revenue, Organic (a)

​

10.5

%  

$

295,150

​

$

267,021

​

9.7

%  

$

873,329

​

$

796,259


​

(a)A non-GAAP financial measure. For a definition of this and other non-GAAP financial measures, see the section of this release entitled “Non-GAAP Financial Measures.”

12


Reconciliation of Reported Gross Margin to Non-GAAP Gross Margin (Non-GAAP)

(Unaudited; as a percentage of reported revenue)

​

​

​

​

​

​

​

​

​

​

​

​

​

​

​

Three Months Ended

​

​

Nine Months Ended


​

​

September 30, 

​

​

September 30, 


​


2022


​

2021


​

2022


​

2021


Reported Gross Margin


44.8

%  

​

45.1

%  

​

44.8

%  

​

44.8

%

​

​

​

​

​

​

​

​

​

​

​

​

​

Add back impact of:


​


​


​


​

Amortization of intangibles


3.7

%  

​

4.0

%  

​

3.7

%  

​

4.0

%

Inventory write-off (a)

​

—

​

​

—

%

​

—

%  

​

0.2

%

​

​

​

​

​

​

​

​

​

​

​

​

​

Non-GAAP Gross Margin


48.4

%  

​

49.1

%  

​

48.5

%  

​

49.0

%


Note: Certain percentages may not sum to totals due to rounding

​

(a)Represents the write-off of inventory related to the divestiture or exit of certain businesses or product lines.

​

​

​

ABOUT MERIT

Founded in 1987, Merit Medical Systems, Inc. is a leading global manufacturer and marketer of healthcare technology. Merit serves client hospitals worldwide with a domestic and international sales force and clinical support team totaling in excess of 700 individuals. Merit employs approximately 6,900 people worldwide with facilities in South Jordan, Utah; Pearland, Texas; Richmond, Virginia; Aliso Viejo, California; Maastricht and Venlo, The Netherlands; Paris, France; Galway, Ireland; Beijing, China; Tijuana, Mexico; Joinville, Brazil; Ontario, Canada; Melbourne, Australia; Tokyo, Japan; Reading, United Kingdom; Johannesburg, South Africa; and Singapore.

CAUTIONARY STATEMENT REGARDING FORWARD-LOOKING STATEMENTS

Statements contained in this release which are not purely historical, including, without limitation, statements regarding Merit’s forecasted plans, net sales, net income (GAAP and non-GAAP), operating income and margin (GAAP and non-GAAP), gross profit and margin (GAAP and non-GAAP), earnings per share (GAAP and non-GAAP), free cash flow, and other financial measures, future growth and profit expectations or forecasted economic conditions, or the implementation of, and results achieved through, Merit’s Foundations for Growth Program or other expense reduction initiatives, are forward-looking statements within the meaning of Section 27A of the Securities Act of 1933, as amended, and Section 21E of the Securities Exchange Act of 1934, as amended, and are subject to risks and uncertainties such as those described in Merit’s Annual Report on Form 10-K for the year ended December 31, 2021 (the “2021 Annual Report”) and other filings with the SEC. Such risks and uncertainties include inherent risks and uncertainties relating to Merit’s internal models or the projections in this release; disruptions in Merit’s supply chain, manufacturing or sterilization processes; reduced availability of, and price increases associated with, commodity components; adverse changes in freight, shipping and transportation expenses; risks relating to Merit’s potential inability to successfully manage growth through acquisitions generally, including the inability to effectively integrate acquired operations or products or commercialize technology developed internally or acquired through completed, proposed or future transactions; negative changes in economic and industry conditions in the United States or other countries, including inflation; fluctuations in interest or foreign currency exchange rates; risks and uncertainties associated with Merit’s information technology systems, including the potential for breaches of security and evolving regulations regarding privacy and data protection; governmental scrutiny and regulation of the medical device industry, including governmental inquiries, investigations and proceedings involving Merit; litigation and other judicial proceedings affecting Merit; restrictions on Merit’s liquidity or business operations resulting from its debt agreements; infringement of Merit’s technology or the assertion that Merit’s technology infringes the rights of other parties; product recalls and product liability claims; changes in customer purchasing patterns or the mix of products Merit sells; difficulties, delays and expenditures relating to development, testing and regulatory approval or clearance of Merit’s products, including the pursuit of approvals under the MDR, and risks that such products may not be developed successfully or approved for commercial use; the potential of fines, penalties or other adverse consequences if Merit’s employees or agents violate the U.S. Foreign Corrupt Practices Act or other laws or regulations; laws and regulations targeting fraud and abuse in the healthcare industry; potential for significant adverse changes in governing regulations, including reforms to the procedures for approval or clearance of Merit’s products by the U.S. Food & Drug Administration or comparable regulatory authorities in other jurisdictions; changes in tax laws and regulations in the United

13


States or other countries; termination of relationships with Merit’s suppliers, or failure of such suppliers to perform; risks and uncertainties associated with the COVID-19 pandemic and Merit’s response thereto; concentration of a substantial portion of Merit’s revenues among a few products and procedures; development of new products and technology that could render Merit’s existing or future products obsolete; market acceptance of new products; volatility in the market price of Merit’s common stock; modification or limitation of governmental or private insurance reimbursement policies; changes in healthcare policies or markets related to healthcare reform initiatives; failure to comply with applicable environmental laws; changes in key personnel; work stoppage or transportation risks; failure to introduce products in a timely fashion; price and product competition; availability of labor and materials; fluctuations in and obsolescence of inventory; and other factors referenced in the 2021 Annual Report and other materials filed with the SEC. All subsequent forward-looking statements attributable to Merit or persons acting on its behalf are expressly qualified in their entirety by these cautionary statements. Actual results will likely differ, and may differ materially, from anticipated results. Financial estimates are subject to change and are not intended to be relied upon as predictions of future operating results. Those estimates and all other forward-looking statements included in this document are made only as of the date of this document, and except as otherwise required by applicable law, Merit assumes no obligation to update or disclose revisions to estimates and all other forward-looking statements.

​

TRADEMARKS

Unless noted otherwise, trademarks and registered trademarks used in this release are the property of Merit Medical Systems, Inc. and its subsidiaries in the United States and other jurisdictions.

​

​

# # #

14


Exhibit 99.2

GRAPHIC

1 Merit Medical Investor Call October 26, 2022 Third Quarter 2022 Results Fred Lampropoulos Chairman and CEO Raul Parra CFO

GRAPHIC

2 CAUTIONARY STATEMENTREGARDING FORWARD-LOOKING STATEMENTS Thispresentationandanyaccompanyingmanagementcommentaryinclude“forward-lookingstatements,”asdefinedwithinapplicablesecuritieslawsandregulations.Allstatementsinthis presentation,otherthanstatementsofhistoricalfact,are“forward-lookingstatements”,including,withoutlimitation,statementsregardingMerit’sforecastedplans,netsales,netincome(GAAP andnon-GAAP),operatingincomeandmargin(GAAPandnon-GAAP),grossprofitandmargin(GAAPandnon-GAAP),earningspershare(GAAPandnon-GAAP),freecashflow,andotherfinancial measures,futuregrowthandprofitexpectationsorforecastedeconomicconditions,ortheimplementationof,andresultsachievedthrough,Merit’sFoundationsforGrowthProgramorother expensereductioninitiatives,orthedevelopmentorcommercializationofnewproducts,areforward-lookingstatementswithinthemeaningofSection27AoftheSecuritiesActof1933,as amended,andSection21EoftheSecuritiesExchangeActof1934,asamended,andaresubjecttorisksanduncertaintiessuchasthosedescribedinMerit’sAnnualReportonForm10-Kforthe yearendedDecember31,2021(the“2021AnnualReport”)andotherfilingswiththeSEC.SuchrisksanduncertaintiesincludeinherentrisksanduncertaintiesrelatingtoMerit’sinternalmodelsor theprojectionsinthisrelease;disruptionsinMerit’ssupplychain,manufacturingorsterilizationprocesses;reducedavailabilityof,andpriceincreasesassociatedwith,commoditycomponents; adversechangesinfreight,shippingandtransportationexpenses;risksrelatingtoMerit’spotentialinabilitytosuccessfullymanagegrowththroughacquisitionsgenerally,includingtheinabilityto effectivelyintegrateacquiredoperationsorproductsorcommercializetechnologydevelopedinternallyoracquiredthroughcompleted,proposedorfuturetransactions;negativechangesin economicandindustryconditionsintheUnitedStatesorothercountries,includinginflation;fluctuationsininterestorforeigncurrencyexchangerates;risksanduncertaintiesassociatedwith Merit’sinformationtechnologysystems,includingthepotentialforbreachesofsecurityandevolvingregulationsregardingprivacyanddataprotection;governmentalscrutinyandregulationofthe medicaldeviceindustry,includinggovernmentalinquiries,investigationsandproceedingsinvolvingMerit;litigationandotherjudicialproceedingsaffectingMerit;restrictionsonMerit’sliquidityor businessoperationsresultingfromitsdebtagreements;infringementofMerit’stechnologyortheassertionthatMerit’stechnologyinfringestherightsofotherparties;productrecallsandproduct liabilityclaims;changesincustomerpurchasingpatternsorthemixofproductsMeritsells;difficulties,delaysandexpendituresrelatingtodevelopment,testingandregulatoryapprovalor clearanceofMerit’sproducts,includingthepursuitofapprovalsundertheE.U.MedicalDeviceRegulation,andrisksthatsuchproductsmaynotbedevelopedsuccessfullyorapprovedfor commercialuse;thepotentialoffines,penaltiesorotheradverseconsequencesifMerit’semployeesoragentsviolatetheU.S.ForeignCorruptPracticesActorotherlawsorregulations;lawsand regulationstargetingfraudandabuseinthehealthcareindustry;potentialforsignificantadversechangesingoverningregulations,includingreformstotheproceduresforapprovalorclearanceof Merit’sproductsbytheU.S.Food&DrugAdministrationorcomparableregulatoryauthoritiesinotherjurisdictions;changesintaxlawsandregulationsintheUnitedStatesorothercountries; terminationofrelationshipswithMerit’ssuppliers,orfailureofsuchsupplierstoperform;risksanduncertaintiesassociatedwiththeCOVID-19pandemicandMerit’sresponsethereto; concentrationofasubstantialportionofMerit’srevenuesamongafewproductsandprocedures;developmentofnewproductsandtechnologythatcouldrenderMerit’sexistingorfuture productsobsolete;marketacceptanceofnewproducts;volatilityinthemarketpriceofMerit’scommonstock;modificationorlimitationofgovernmentalorprivateinsurancereimbursement policies;changesinhealthcarepoliciesormarketsrelatedtohealthcarereforminitiatives;failuretocomplywithapplicableenvironmentallaws;changesinkeypersonnel;workstoppageor transportationrisks;failuretointroduceproductsinatimelyfashion;priceandproductcompetition;availabilityoflaborandmaterials;fluctuationsinandobsolescenceofinventory;andother factorsreferencedinthe2021AnnualReportandothermaterialsfiledwiththeSEC. Allsubsequentforward-lookingstatementsattributabletoMeritorpersonsactingonitsbehalfareexpresslyqualifiedintheirentiretybythesecautionarystatements.Actualresultswilllikely differ,andmaydiffermaterially,fromanticipatedresults.Financialestimatesaresubjecttochangeandarenotintendedtoberelieduponaspredictionsoffutureoperatingresults.Those estimatesandallotherforward-lookingstatementsincludedinthisdocumentaremadeonlyasofthedateofthisdocument,andexceptasotherwiserequiredbyapplicablelaw,Meritassumesno obligationtoupdateordiscloserevisionstoestimatesandallotherforward-lookingstatements. 2

GRAPHIC

3 NON-GAAPFINANCIALMEASURES AlthoughMerit’sfinancialstatementsarepreparedinaccordancewithaccountingprinciplesgenerallyacceptedintheUnitedStatesof America(“GAAP”),Merit’smanagementbelievesthatcertainnon-GAAPfinancialmeasuresprovideinvestorswithusefulinformation regardingtheunderlyingbusinesstrendsandperformanceofMerit’songoingoperationsandcanbeusefulforperiod-over-period comparisonsofsuchoperations.Certainfinancialmeasuresincludedinthispresentation,orwhichmaybereferencedin management’sdiscussionofMerit’shistoricalandfutureoperationsandfinancialresults,havenotbeencalculatedinaccordancewith GAAP,and,therefore,arereferencedasnon-GAAPfinancialmeasures.Readersshouldconsidernon-GAAPmeasuresusedinthis presentationinadditionto,notasasubstitutefor,financialreportingmeasurespreparedinaccordancewithGAAP.Thesenon-GAAP financialmeasuresgenerallyexcludesome,butnotall,itemsthatmayaffectMerit'snetincome.Inaddition,theyaresubjectto inherentlimitationsastheyreflecttheexerciseofjudgmentbymanagementaboutwhichitemsareexcluded.Additionally,non-GAAP financialmeasuresusedinthispresentationmaynotbecomparablewithsimilarlytitledmeasuresofothercompanies.Meriturges readerstoreviewthereconciliationsofitsnon-GAAPfinancialmeasurestothecomparableGAAPfinancialmeasures,andnottorely onanysinglefinancialmeasuretoevaluateMerit’sbusinessorresultsofoperations.Pleasereferto“NotestoNon-GAAPFinancial Measures”attheendofthesematerialsformoreinformation. TRADEMARKS Unlessnotedotherwise,trademarksusedinthispresentationarethepropertyofMeritMedicalSystems,Inc.,intheUnitedStatesand otherjurisdictions. 3

GRAPHIC

4 Q3 2022Q3 2021YTD 2022YTD 2021 Revenue $287.2M$267.0M$857.6M$796.3M Gross Margin 44.8%45.1%44.8%44.8% Operating Margin 6.5%6.0%6.7%4.9% Net Income $15.3M$12.0M$41.1M$27.8M Earnings per Share $0.27$0.21$0.71$0.49 FinancialSummary GAAP 4

GRAPHIC

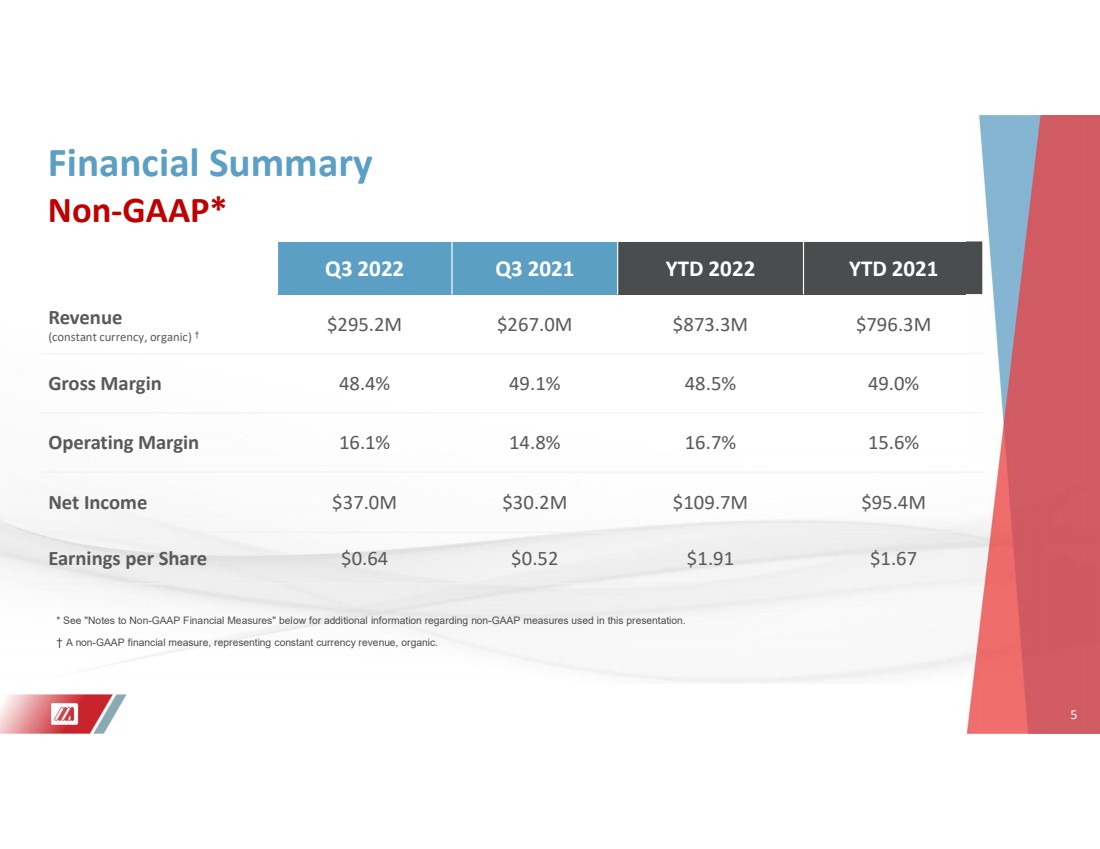
5 Q3 2022Q3 2021YTD 2022YTD 2021 Revenue (constant currency, organic) † $295.2M$267.0M$873.3M$796.3M Gross Margin 48.4%49.1%48.5%49.0% Operating Margin 16.1%14.8%16.7%15.6% Net Income $37.0M$30.2M$109.7M$95.4M Earnings per Share $0.64$0.52$1.91$1.67 FinancialSummary Non-GAAP* 5 * See "Notes to Non-GAAP Financial Measures" below for additional information regarding non-GAAP measures used in this presentation. † A non-GAAP financial measure, representing constant currency revenue, organic.

GRAPHIC

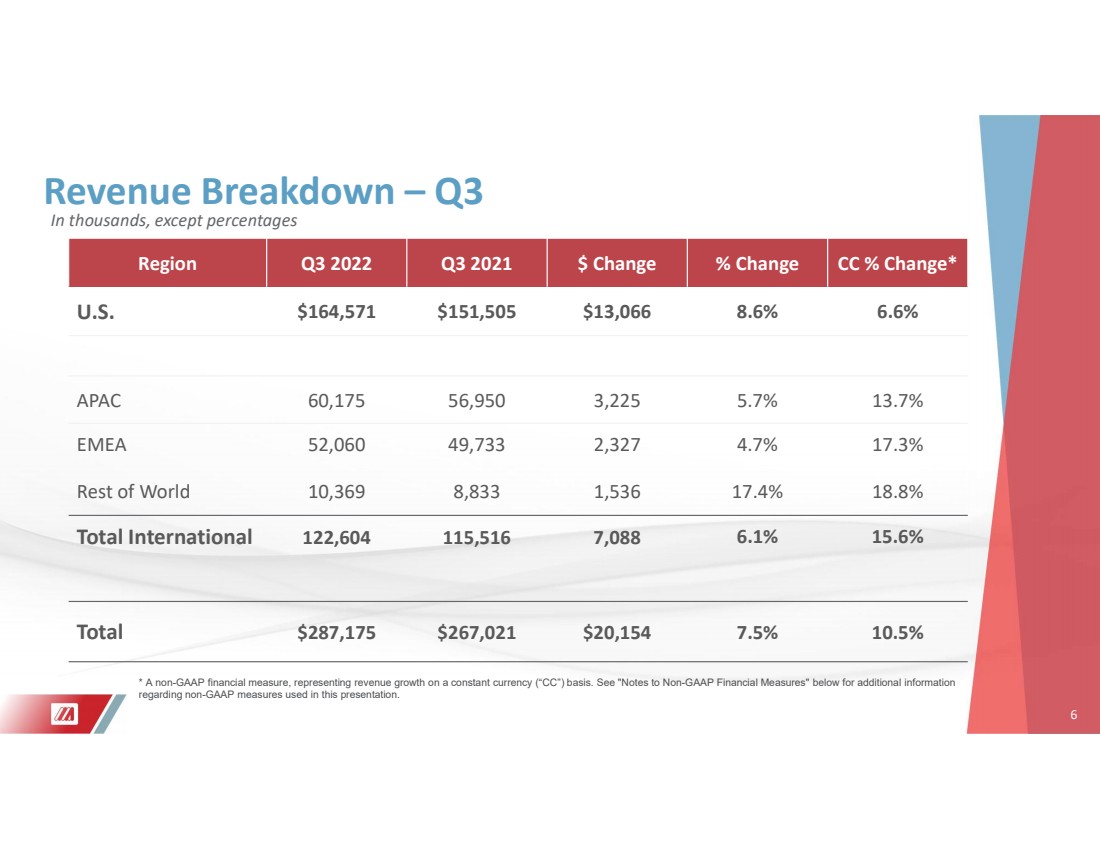
6 RevenueBreakdown–Q3 RegionQ3 2022Q3 2021$ Change% ChangeCC % Change* U.S. $164,571$151,505$13,0668.6%6.6% APAC60,17556,9503,2255.7%13.7% EMEA52,06049,7332,3274.7%17.3% Rest of World10,3698,8331,53617.4%18.8% Total International 122,604115,5167,088 6.1%15.6% Total $287,175$267,021$20,1547.5%10.5% 6 * A non-GAAP financial measure, representing revenue growth on a constant currency (“CC”) basis. See "Notes to Non-GAAP Financial Measures" below for additional information regarding non-GAAP measures used in this presentation. In thousands, except percentages

GRAPHIC

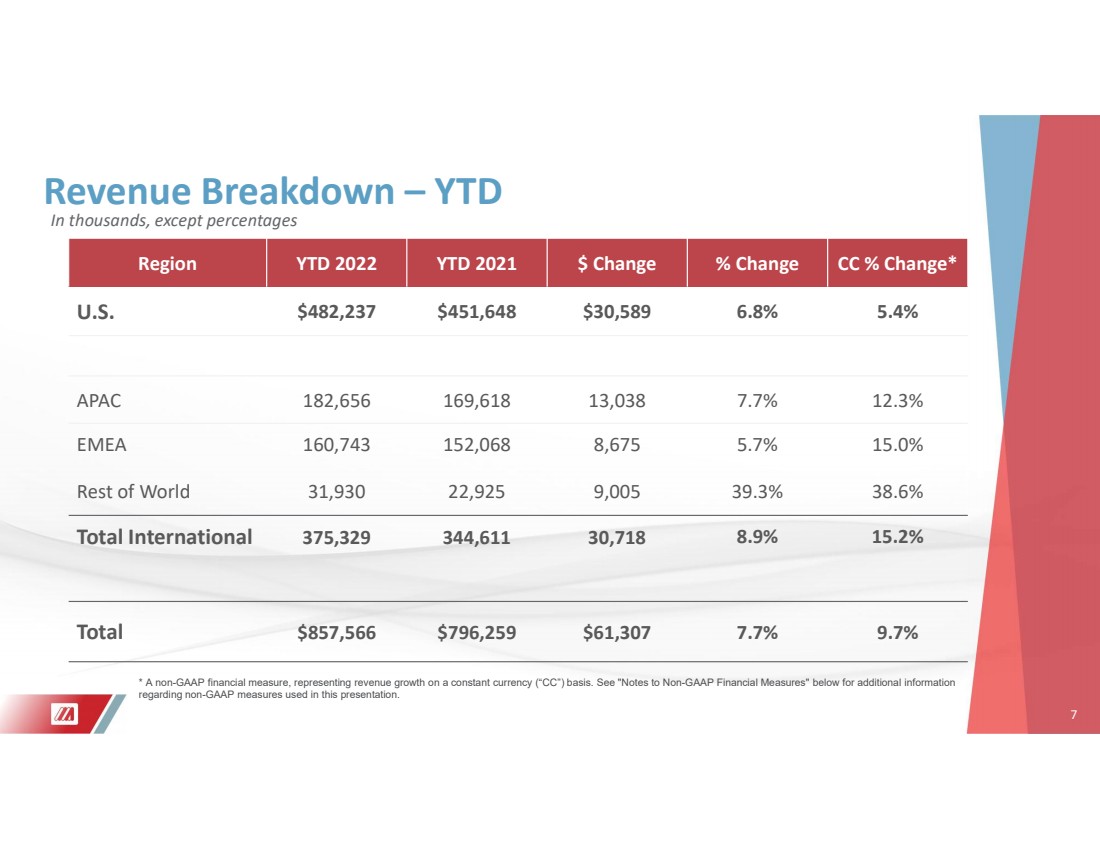
7 RevenueBreakdown–YTD RegionYTD 2022YTD 2021$ Change% ChangeCC % Change* U.S. $482,237$451,648$30,5896.8%5.4% APAC182,656169,61813,0387.7%12.3% EMEA160,743152,0688,6755.7%15.0% Rest of World31,93022,9259,00539.3%38.6% Total International 375,329344,61130,718 8.9%15.2% Total $857,566$796,259$61,3077.7%9.7% 7 * A non-GAAP financial measure, representing revenue growth on a constant currency (“CC”) basis. See "Notes to Non-GAAP Financial Measures" below for additional information regarding non-GAAP measures used in this presentation. In thousands, except percentages

GRAPHIC

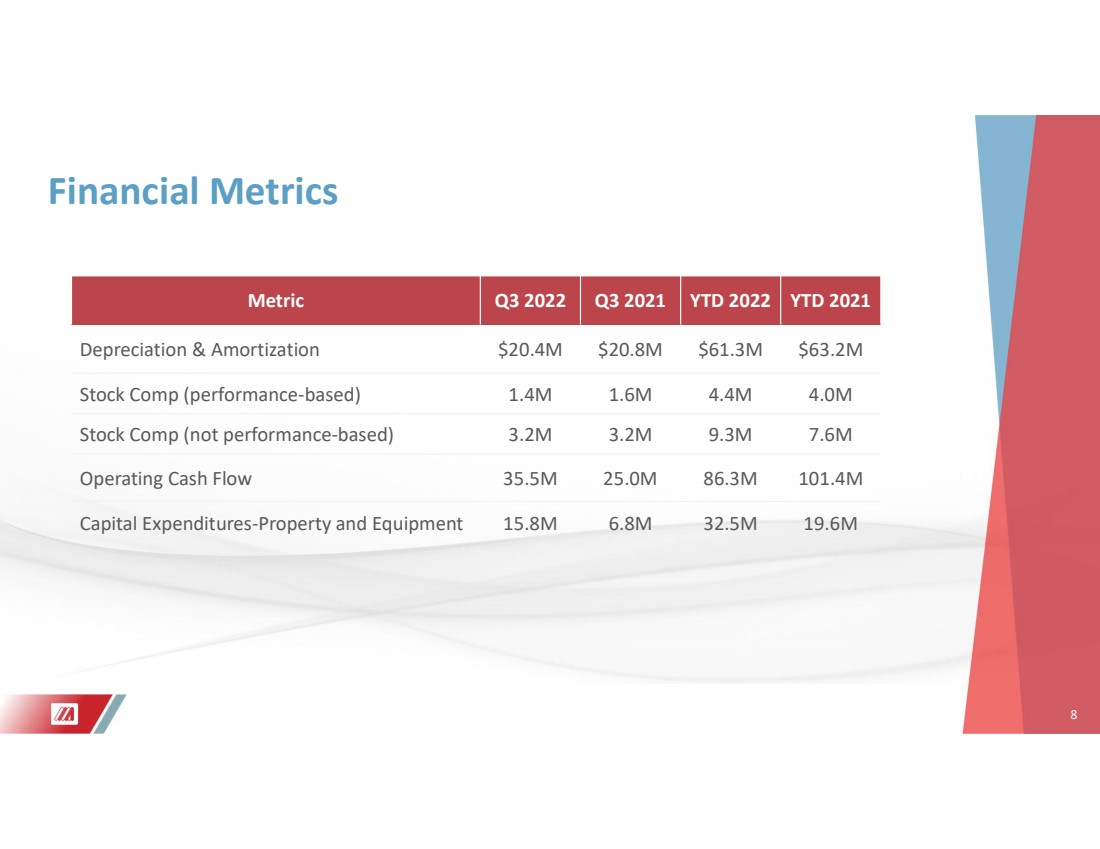
8 FinancialMetrics MetricQ3 2022Q3 2021YTD 2022YTD 2021 Depreciation & Amortization$20.4M$20.8M$61.3M$63.2M Stock Comp (performance-based)1.4M1.6M4.4M4.0M Stock Comp (not performance-based)3.2M3.2M9.3M7.6M Operating Cash Flow35.5M25.0M86.3M101.4M Capital Expenditures-Property and Equipment15.8M6.8M32.5M19.6M 8

GRAPHIC

9 * See "Notes to Non-GAAP Financial Measures" below for additional information regarding non-GAAP measures used in this presentation. Merit’s financial guidance for theyear ending December31, 2022,is subject to risks and uncertainties identified in this presentation and in Merit’s filings with the U.S. Securities and Exchange Commission (“SEC”). See “Cautionary Statement Regarding Forward-Looking Statements.” Financial MeasureRevised GuidancePrior Guidance Net Sales $1.145 billion to $1.151 billion$1.123 billion to $1.135 billion Net Income (GAAP) $64.8 million to $68.3 million$62.4 million to $68.3 million Earnings Per Share (GAAP) $1.13 to $1.19$1.08 to $1.18 Net Income (Non-GAAP)* $146.9 million to $150.4 million$139.6 million to $145.5 million Earnings Per Share (Non-GAAP)* $2.55 to $2.61$2.42 to $2.52 Updated 2022 Financial Guidance

GRAPHIC

10 Appendix 10

GRAPHIC

11 NotestoNon-GAAPFinancialMeasures Foradditionaldetails,pleaseseetheaccompanyingpressreleaseandforward-lookingstatementdisclosure. ThesepresentationmaterialsandassociatedcommentaryfromMerit’smanagement,aswellasthepressreleaseissuedtoday,usenon-GAAPfinancialmeasures,including: •constantcurrencyrevenue; •constantcurrencyrevenue,organic; •non-GAAPgrossprofitandmargin; •non-GAAPoperatingincomeandmargin; •non-GAAPnetincome; •non-GAAPearningspershare;and •freecashflow. Merit’smanagementteamusesthesenon-GAAPfinancialmeasurestoevaluateMerit’sprofitabilityandefficiency,tocompareoperatingandfinancialresultstopriorperiods,to evaluatechangesintheresultsofitsoperatingsegments,andtomeasureandallocatefinancialresourcesinternally.However,Merit’smanagementdoesnotconsidersuchnon- GAAPmeasuresinisolationorasanalternativetomeasuresdeterminedinaccordancewithGAAP. Readersshouldconsidernon-GAAPmeasuresusedinthispresentationinadditionto,notasasubstitutefor,financialreportingmeasurespreparedinaccordancewithGAAP.These non-GAAPfinancialmeasuresgenerallyexcludesome,butnotall,itemsthatmayaffectMerit’snetincome.Inaddition,theyaresubjecttoinherentlimitationsastheyreflectthe exerciseofjudgmentbymanagementaboutwhichitemsareexcluded.Meritbelievesitisusefultoexcludesuchitemsinthecalculationofnon-GAAPearningspershare,non- GAAPgrossprofitandmargin,non-GAAPoperatingincomeandmargin,andnon-GAAPnetincome(ineachcase,asfurtherillustratedinthereconciliationtablesbelow)because suchamountsinanyspecificperiodmaynotdirectlycorrelatetotheunderlyingperformanceofMerit’sbusinessoperationsandcanvarysignificantlybetweenperiodsasaresult offactorssuchasacquisitionorotherextraordinarytransactions,non-cashexpensesrelatedtoamortizationorwrite-offofpreviouslyacquiredtangibleandintangibleassets, severanceexpenses,expensesresultingfromnon-ordinarycourselitigationoradministrativeproceedingsandresultingsettlements,corporatetransformationexpenses, governmentalproceedingsorchangesintaxorindustryregulations,gainsorlossesondisposalofcertainassets,anddebtissuancecosts.Meritmayincursimilartypesofexpenses inthefuture,andthenon-GAAPfinancialinformationincludedinthispresentationshouldnotbeviewedasastatementorindicationthatthesetypesofexpenseswillnotrecur. Additionally,thenon-GAAPfinancialmeasuresusedinthispresentationmaynotbecomparablewithsimilarlytitledmeasuresofothercompanies.Meriturgesinvestorsand potentialinvestorstoreviewthereconciliationsofitsnon-GAAPfinancialmeasurestothecomparableGAAPfinancialmeasures,andnottorelyonanysinglefinancialmeasureto evaluateMerit’sbusinessorresultsofoperations.

GRAPHIC

12 NotestoNon-GAAPFinancialMeasures(cont.) ConstantCurrencyRevenue Merit’sconstantcurrencyrevenueispreparedbyconvertingthecurrent-periodreportedrevenueofsubsidiarieswhosefunctionalcurrencyisacurrencyotherthantheU.S.dollarat theapplicableforeignexchangeratesineffectduringthecomparableprior-yearperiod,andadjustingfortheeffectsofhedgingtransactionsonreportedrevenue,whicharerecorded intheU.S.Theconstantcurrencyrevenueadjustmentsof$8.0millionand$15.8milliontoreportedrevenueforthethreeandnine-monthperiodsendedSeptember30,2022,were calculatedusingtheapplicableaverageforeignexchangeratesforthethreeandnine-monthperiodsendedSeptember30,2021. ConstantCurrencyRevenue,Organic Merit’sconstantcurrencyrevenue,organic,isdefined,withrespecttopriorfiscalyearperiods,asGAAPrevenue.Withrespecttocurrentfiscalyearperiods,constantcurrency revenue,organic,isdefinedasconstantcurrencyrevenue(asdefinedabove),lessrevenuefromcertainacquisitions.Forthethreeandnine-monthperiodsendedSeptember30,2022, therewerenorevenuesfromacquisitionsexcludedinthecalculationofMerit’sconstantcurrencyrevenue,organic. Non-GAAPGrossProfitandMargin Non-GAAPgrossprofitiscalculatedbyreducingGAAPcostofsalesbyamountsrecordedforamortizationofintangibleassetsandcertaininventorywrite-offs.Non-GAAPgross marginiscalculatedbydividingnon-GAAPgrossprofitbyreportednetsales. Non-GAAPOperatingIncomeandMargin Non-GAAPoperatingincomeiscalculatedbyadjustingGAAPoperatingincomeforcertainitemswhicharedeemedbyMerit’smanagementtobeoutsideofcoreoperationsand varyinamountandfrequencyamongperiods,suchasexpensesrelatedtoacquisitionsorotherextraordinarytransactions,non-cashexpensesrelatedtoamortizationorwrite-offof previouslyacquiredtangibleandintangibleassets,certainseveranceexpenses,performance-basedstockcompensationexpenses,corporatetransformationexpenses,expenses resultingfromnon-ordinarycourselitigationoradministrativeproceedingsandresultingsettlements,governmentalproceedingsorchangesinindustryregulations,aswellasother itemsreferencedinthetablesbelow.Non-GAAPoperatingmarginiscalculatedbydividingnon-GAAPoperatingincomebyreportednetsales.

GRAPHIC

13 NotestoNon-GAAPFinancialMeasures(cont.) Non-GAAPNetIncome Non-GAAPnetincomeiscalculatedbyadjustingGAAPnetincomefortheitemssetforthinthedefinitionofnon-GAAPoperatingincomeabove,aswellasforexpensesrelatedto debtissuancecosts,gainsorlossesondisposalofcertainassets,changesintaxregulations,aswellasotheritemssetforthinthetablesbelow. Non-GAAPEPS Non-GAAPEPSisdefinedasnon-GAAPnetincomedividedbythedilutedsharesoutstandingforthecorrespondingperiod. FreeCashFlow FreecashflowisdefinedascashflowfromoperationscalculatedinaccordancewithGAAP,lesscapitalexpendituresforpropertyandequipmentcalculatedinaccordancewith GAAP,assetforthintheconsolidatedstatementofcashflows. OtherNon-GAAPFinancialMeasureReconciliation Thefollowingtablessetforthsupplementalfinancialdataandcorrespondingreconciliationsofnon-GAAPfinancialmeasurestoMerit’scorrespondingfinancialmeasuresprepared inaccordancewithGAAP,ineachcase,forthethreeandnine-monthperiodsendedSeptember30,2022and2021.Thenon-GAAPincomeadjustmentsreferencedinthefollowing tablesdonotreflectnon-performance-basedstockcompensationexpenseof$3.2millionand$3.2millionforthethree-monthperiodsendedSeptember30,2022and2021, respectively,and$9.3millionand$7.6millionforthenine-monthperiodsendedSeptember30,2022and2021,respectively.

GRAPHIC

14 ReconciliationofGAAPNetIncometoNon-GAAPNetIncome (Unaudited;inthousandsexceptpershareamounts) Note: Certain per share impacts may not sum to totals due to rounding. GAAP net income$17,602 $(2,330) $15,272 $0.27 $14,177 $(2,210) $11,967 $0.21 Non-GAAP adjustments: Cost of Sales Amortization of intangibles 10,487 (2,571) 7,916 0.14 10,573 (2,626) 7,947 0.14 Operating Expenses Contingent consideration expense 915 — 915 0.02 1,115 (16) 1,099 0.02 Amortization of intangibles 1,554 (384) 1,170 0.02 1,793 (449) 1,344 0.02 Performance-based share-based compensation (b) 1,353 (70) 1,283 0.02 1,639 (207) 1,432 0.02 Corporate transformation and restructuring (c) 8,535 (1,796) 6,739 0.12 4,282 (1,061) 3,221 0.06 Acquisition-related667 (163) 504 0.01 2,866 (711) 2,155 0.04 Medical Device Regulation expenses (d) 3,873 (948) 2,925 0.05 1,129 (280) 849 0.01 Other (e) 116 (28) 88 0.00 159 (78) 81 0.00 Other (Income) Expense Amortization of long-term debt issuance costs 151 (37) 114 0.00 151 (37) 114 0.00 Loss on disposal of business unit135 (32) 103 0.00 — — — — Non-GAAP net income $45,388 $(8,359) $37,029 $0.64 $37,884 $(7,675) $30,209 $0.52 Diluted shares 57,586 57,549 Reconciliation of GAAP Net Income to Non-GAAP Net Income (Unaudited, in thousands except per share amounts) Three Months Ended Three Months Ended September 30, 2022September 30, 2021 After-TaxPer Share Impact Pre-TaxTax ImpactAfter-TaxPer Share ImpactPre-TaxTax Impact

GRAPHIC

15 ReconciliationofGAAPNetIncometoNon-GAAPNetIncome (Unaudited;inthousandsexceptpershareamounts) Note: Certain per share impacts may not sum to totals due to rounding. GAAP net income $ 52,474 $ (11,359) $ 41,115 $ 0.71 $ 33,736 $ (5,895) $ 27,841 $ 0.49 Non-GAAP adjustments: Cost of Sales Amortization of intangibles 31,539 (7,733) 23,806 0.41 31,884 (7,918) 23,966 0.42 Inventory write-off (a) — — — — 1,620 (202) 1,418 0.02 Operating Expenses Contingent consideration expense 4,702 (17) 4,685 0.08 3,322 (2) 3,320 0.06 Impairment charges 1,672 (318) 1,354 0.02 4,283 (481) 3,802 0.07 Amortization of intangibles 4,749 (1,176) 3,573 0.06 5,397 (1,352) 4,045 0.07 Performance-based share-based compensation (b) 4,354 (413) 3,941 0.07 3,998 (494) 3,504 0.06 Corporate transformation and restructuring (c) 20,432 (4,702) 15,730 0.27 17,044 (4,223) 12,821 0.22 Acquisition-related 1,901 (465) 1,436 0.02 8,475 (2,101) 6,374 0.11 Medical Device Regulation expenses (d) 8,451 (2,069) 6,382 0.11 2,523 (625) 1,898 0.03 Other (e) 7,845 (1,863) 5,982 0.10 6,534 (468) 6,066 0.11 Other (Income) Expense Amortization of long-term debt issuance costs 453 (111) 342 0.01 453 (112) 341 0.01 Loss on disposal of business unit 1,390 (32) 1,358 0.02 — — — — Non-GAAP net income $139,962 $(30,258) $109,704 $1.91 $119,269 $(23,873) $95,396 $1.67 Diluted shares 57,573 57,274 After-Tax Per Share Impact Pre-Tax Tax Impact After-Tax Per Share Impact Pre-Tax Tax Impact Nine Months Ended Nine Months Ended September 30, 2022 September 30, 2021

GRAPHIC

16 ReconciliationofGAAPOperatingIncometoNon-GAAPOperatingIncome (Unaudited;inthousandsexceptpercentages) Note: Certain percentages may not sum to totals due to rounding. Net Sales as Reported $287,175 $267,021 $857,566 $796,259 GAAP Operating Income 18,657 6.5 %15,931 6.0 %57,146 6.7 %39,020 4.9 % Cost of Sales Amortization of intangibles 10,487 3.7 %10,573 4.0 %31,539 3.7 %31,884 4.0 % Inventory write-off (a)— — — — — — 1,620 0.2 % Operating Expenses Contingent consideration expense 915 0.3 %1,115 0.4 %4,702 0.5 %3,322 0.4 % Impairment charges — — — — 1,672 0.2 %4,283 0.5 % Amortization of intangibles 1,554 0.5 %1,793 0.7 %4,749 0.6 %5,397 0.7 % Performance-based share-based compensation (b) 1,353 0.5 %1,639 0.6 %4,354 0.5 %3,998 0.5 % Corporate transformation and restructuring (c) 8,535 3.0 %4,282 1.6 %20,432 2.4 %17,044 2.1 % Acquisition-related667 0.2 %2,866 1.1 %1,901 0.2 %8,475 1.1 % Medical Device Regulation expenses (d) 3,873 1.3 %1,129 0.4 %8,451 1.0 %2,523 0.3 % Other (e)116 0.0 %159 0.1 %7,845 0.9 %6,534 0.8 % Non-GAAP Operating Income $46,157 16.1%$39,487 14.8%$142,791 16.7%$124,100 15.6% Amounts% Sales Amounts% SalesAmounts% SalesAmounts% Sales Three Months Ended Three Months Ended Nine Months Ended Nine Months Ended September 30, 2022September 30, 2021September 30, 2022September 30, 2021

GRAPHIC

17 Footnotes to Reconciliations of GAAP Net Income to Non-GAAP Net Income and GAAP Operating Income to Non-GAAP Operating Income a)Representsthewrite-offofinventoryrelatedtothedivestitureorexitofcertainbusinessesorproductlines. b)Representsperformance-basedshare-basedcompensationexpense,includingstock-settledandcash-settledawards. c)IncludesconsultingexpensesrelatedtotheFoundationsforGrowthProgramandothertransformationcosts,including severancerelatedtocorporateinitiatives. d)RepresentsincrementalexpensesincurredtocomplywiththeE.U.MedicalDeviceRegulation(“MDR”). e)Thethree-monthperiodendedSeptember30,2022includescoststocomplywithMerit’scorporateintegrityagreementwith theU.S.DepartmentofJustice(the“DOJ”).The2022year-to-dateperiodalsoincludesacquiredin-processresearchand developmentchargesof$6.7millionandlegalcostsassociatedwithashareholderderivativeproceeding.The2021periods includeaccruedcontractterminationcostsof$6.1milliontorenegotiatecertaintermsofanacquisitionagreementandcosts tocomplywithMerit’scorporateintegrityagreementwiththeDOJ.

GRAPHIC

18 Reconciliation of Reported Revenue to Constant Currency Revenue (Non-GAAP), and Constant Currency Revenue, Organic (Non-GAAP) (Unaudited; in thousands except percentages) (a) A non-GAAP financial measure. For a definition of this and other non-GAAP financial measures, see the section of this presentation entitled “Notes to Non-GAAP Financial Measures.” Three Months Ended Nine Months Ended September 30, September 30, % Change 2022 2021 % Change 2022 2021 Reported Revenue 7.5 % $ 287,175 $ 267,021 7.7 % $ 857,566 $ 796,259 Add: Impact of foreign exchange 7,975 — 15,763 — Constant Currency Revenue (a) 10.5 % $ 295,150 $ 267,021 9.7 % $ 873,329 $ 796,259 Less: Revenue from certain acquisitions — — — — Constant Currency Revenue, Organic (a) 10.5 % $ 295,150 $ 267,021 9.7 % $ 873,329 $ 796,259

GRAPHIC

19 ReconciliationofGAAPGrossMargintoNon-GAAPGrossMargin (Unaudited;asapercentageofreportedrevenue) Note: Certain percentages may not sum to totals due to rounding. a) Represents the write-off of inventory related to the divestiture or exit of certain businesses or product lines. Three Months Ended Nine Months Ended September 30, September 30, 2022 2021 2022 2021 Reported Gross Margin 44.8 % 45.1 % 44.8 % 44.8 % Add back impact of: Amortization of intangibles 3.7 % 4.0 % 3.7 % 4.0 % Inventory write - off (a) — — % — % 0.2 % Non - GAAP Gross Margin 48.4 % 49.1 % 48.5 % 49.0 %

GRAPHIC