Exhibit 99.1

 |
News Release |
| 22 West Washington Street | Telephone: +1 312 696-6000 | |
| Chicago | Facsimile: +1 312 696-6009 | |
| Illinois 60602 |
Correction Notice: On July 27, 2023, Morningstar, Inc. (Nasdaq: MORN) issued this amended press release (originally published on July 26, 2023), which corrects the calculation and related percentage changes of adjusted diluted net income per share for the quarter-ended June 30, 2023.
FOR IMMEDIATE RELEASE
Morningstar, Inc. Reports Second-Quarter 2023 Financial Results
CHICAGO, July 26, 2023 - Morningstar, Inc. (Nasdaq: MORN), a leading provider of independent investment insights, posted solid second-quarter revenue growth, driven by the performance of its license-based products.
"Our license-based products continued to perform strongly, while transaction-based revenue was impacted by continued weakness in the issuance of commercial-mortgage-backed securities in the United States," said Kunal Kapoor, Morningstar's chief executive officer. "We're managing the business with a focus on returning to our historical peak margins. We are also delivering on the integration of LCD into PitchBook, and recently launched Direct Lens to broaden the capabilities available to Direct clients.”
The Company is introducing a quarterly shareholder letter to provide more context on its quarterly results and business, which can be found at shareholders.morningstar.com.
Second-Quarter 2023 Financial Highlights
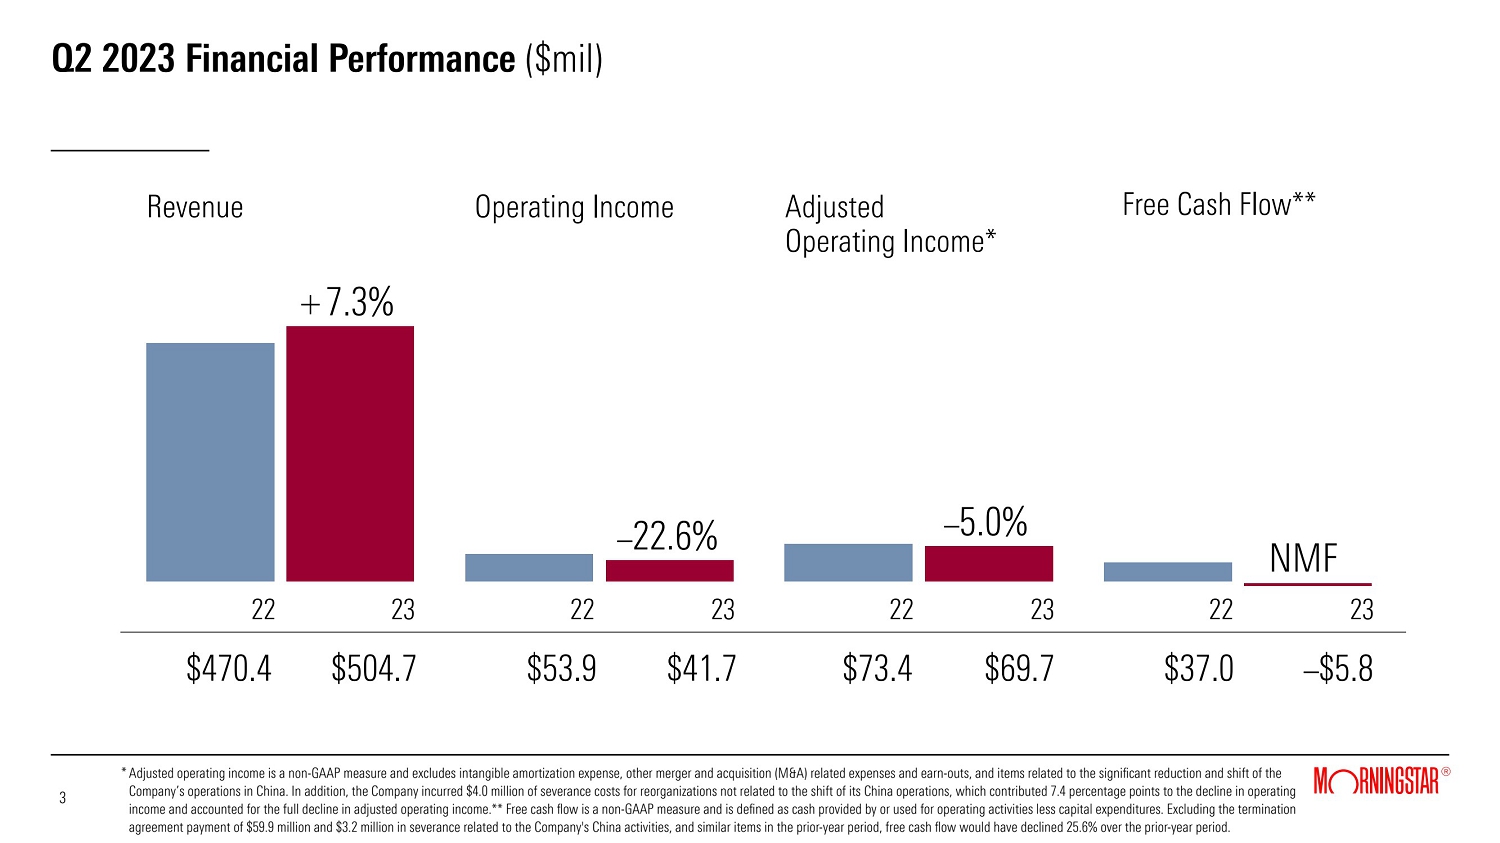
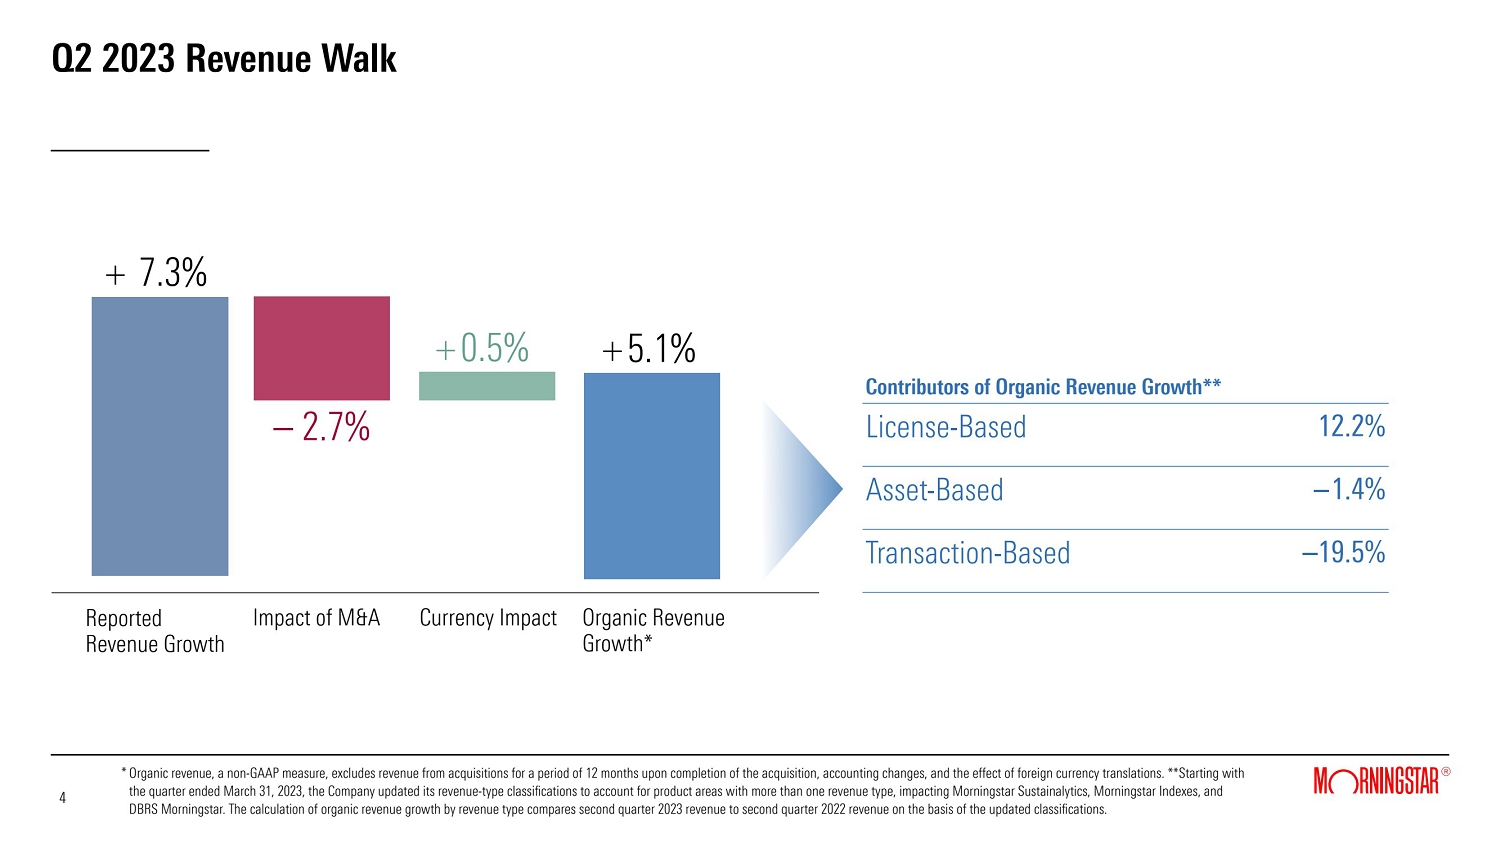
| • | Reported revenue grew 7.3% to $504.7 million; organic revenue grew 5.1%. |
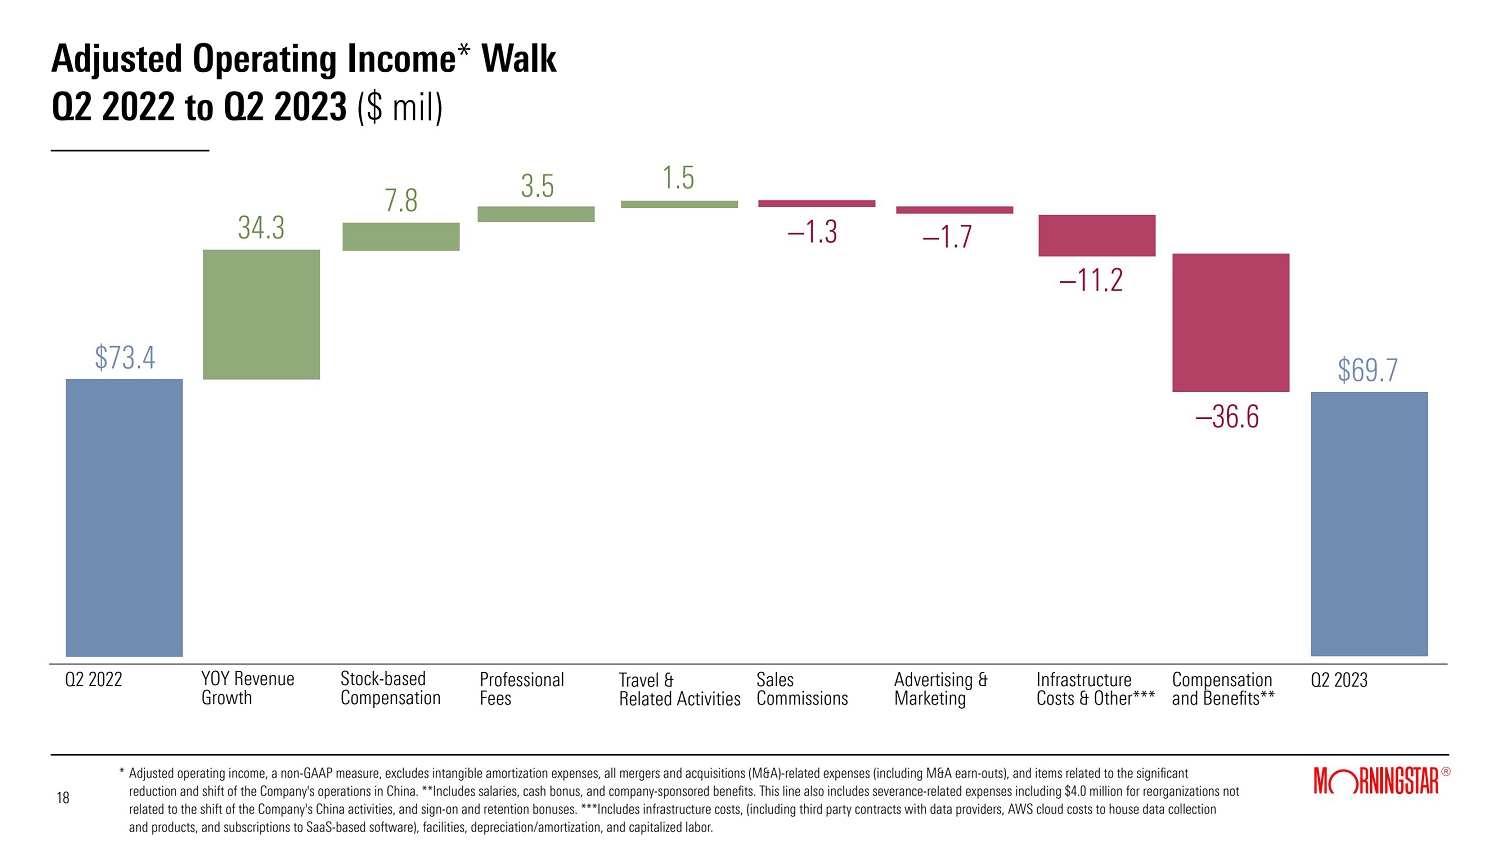
| • | Reported operating income declined 22.6% to $41.7 million; adjusted operating income declined 5.0%. Reported results included $4.0 million in severance costs related to reorganizations in certain areas of the business, excluding activities related to our China operations. These severance costs contributed 7.4 percentage points to the decline in operating income and accounted for the full decline in adjusted operating income. |
| • | Diluted net income per share increased 20.0% to $0.84 versus $0.70 in the prior-year period; adjusted diluted net income per share increased 11.1% to $1.30. |
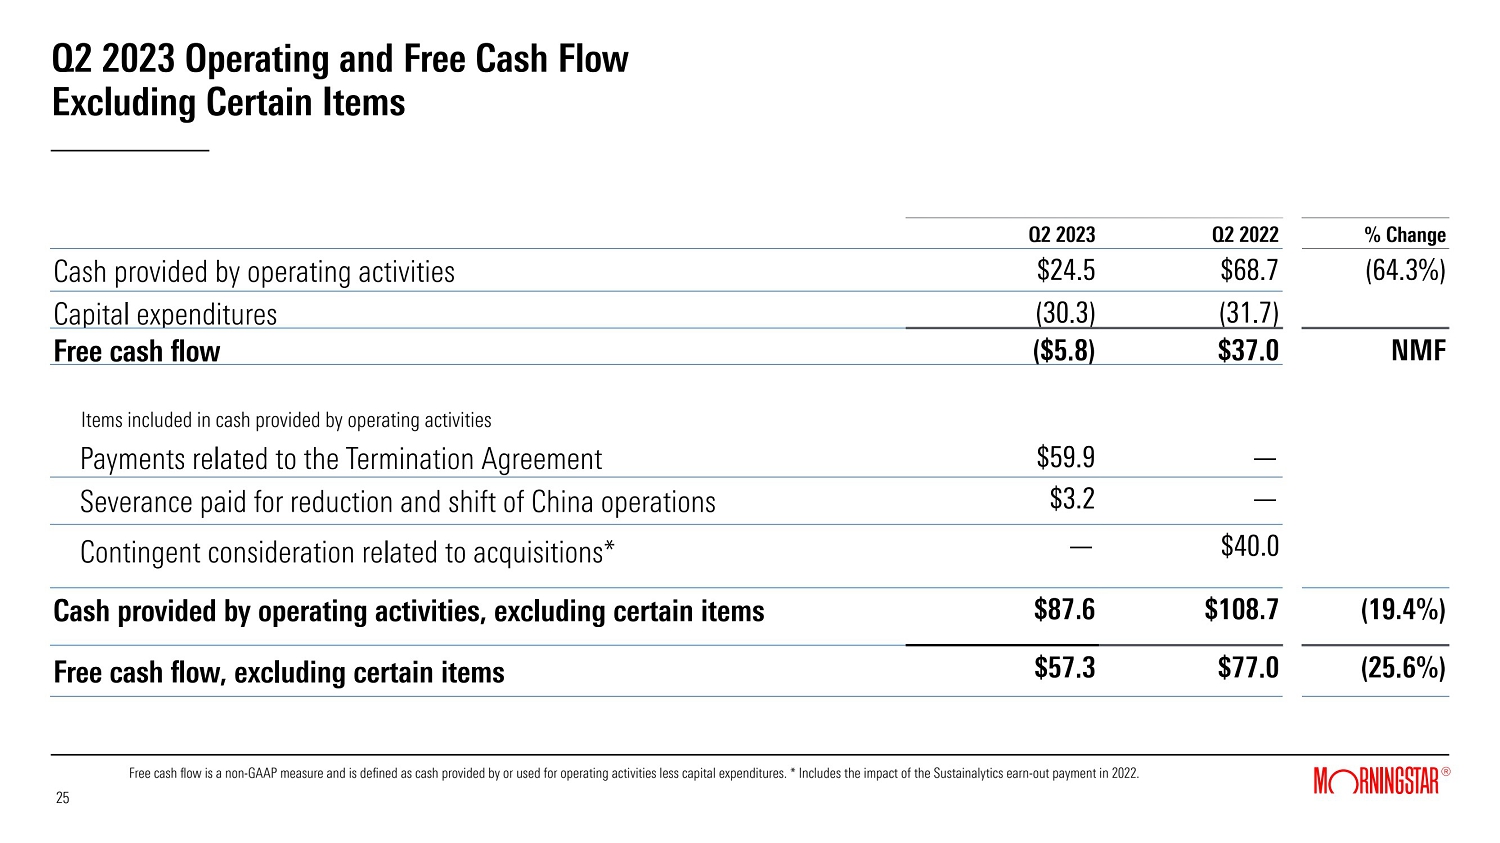
| • | Cash provided by operating activities decreased 64.3% to $24.5 million. Free cash flow was negative $5.8 million versus positive $37.0 million in the prior-year period. Cash flows were negatively impacted by certain items described below totaling $63.1 million. Excluding these items and similar items in the prior-year period for comparability, cash provided by operating activities and free cash flow would have decreased by 19.4% and 25.6%, respectively. |
Year-To-Date Financial Highlights
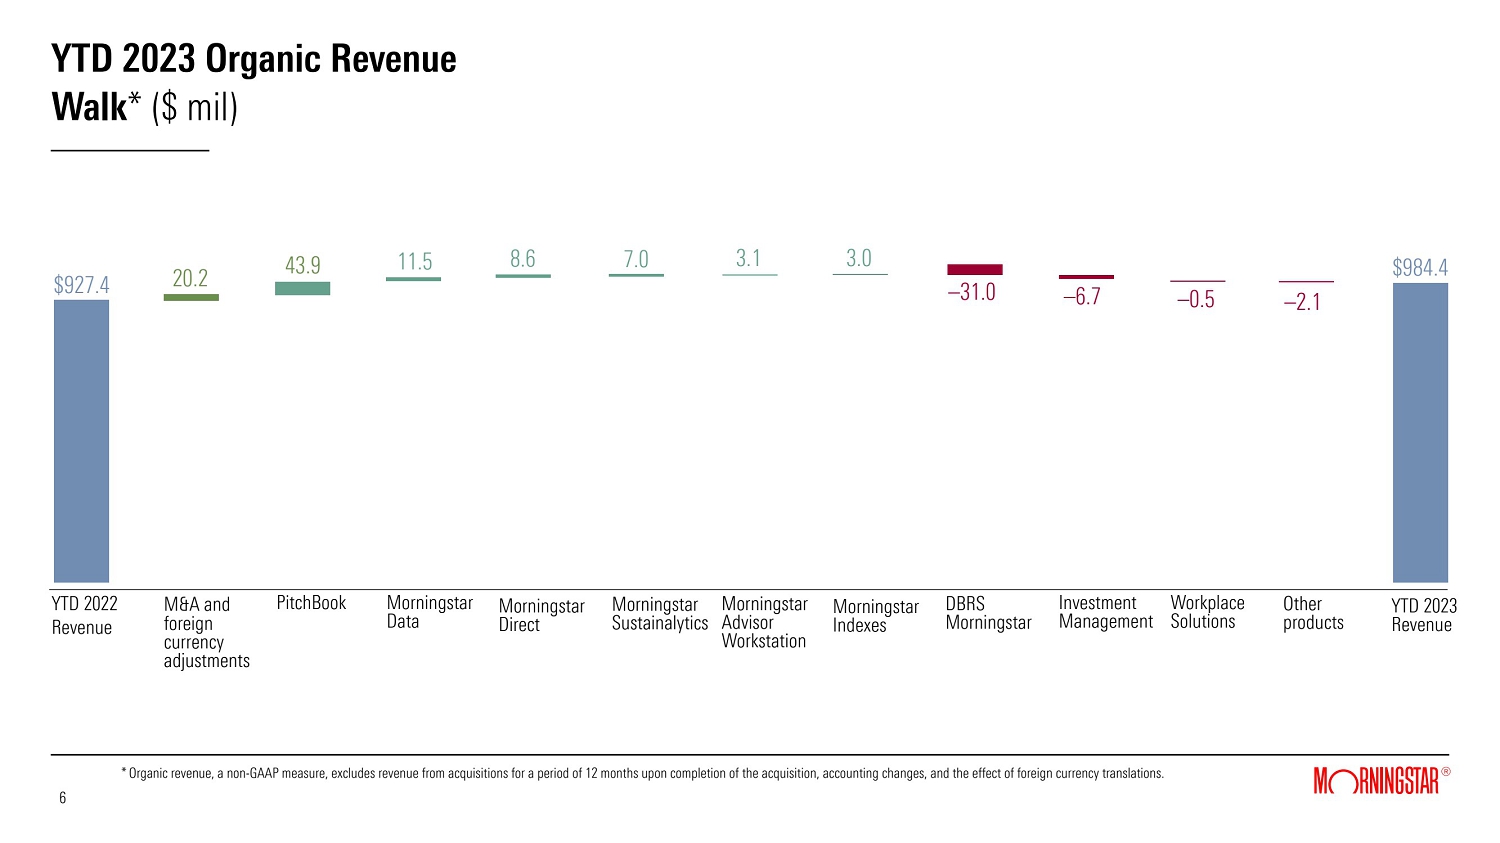
| • | Reported revenue increased 6.1% to $984.4 million; organic revenue growth was 4.0%. |
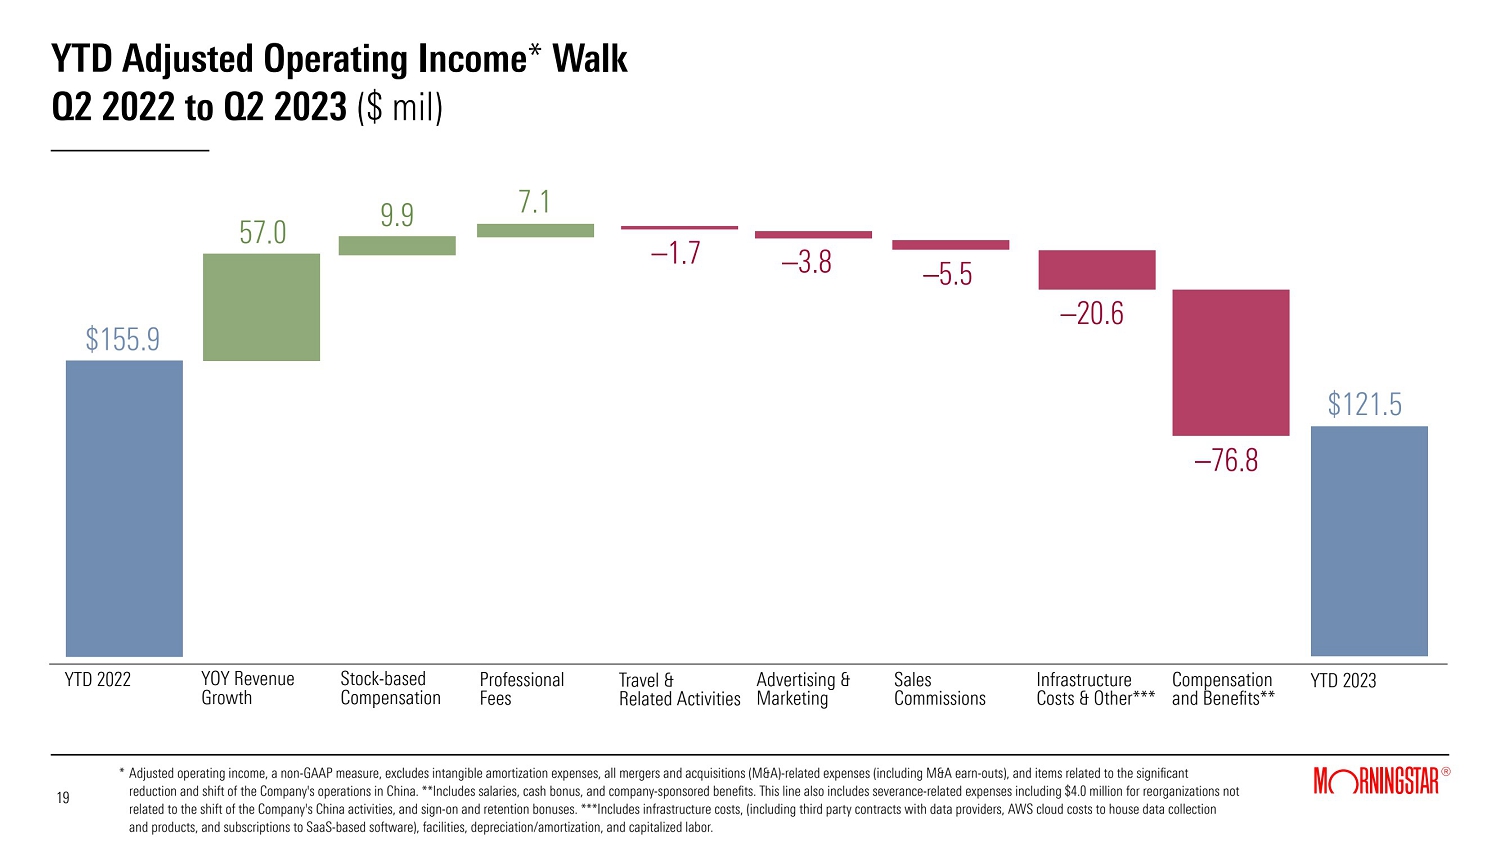
| • | Reported operating income decreased 40.0% to $66.2 million; adjusted operating income decreased by 22.1%. |
| • | Diluted net income per share decreased 62.1% to $0.67 versus $1.77 in the prior-year period; adjusted diluted net income per share decreased by 27.1% to $1.86. |
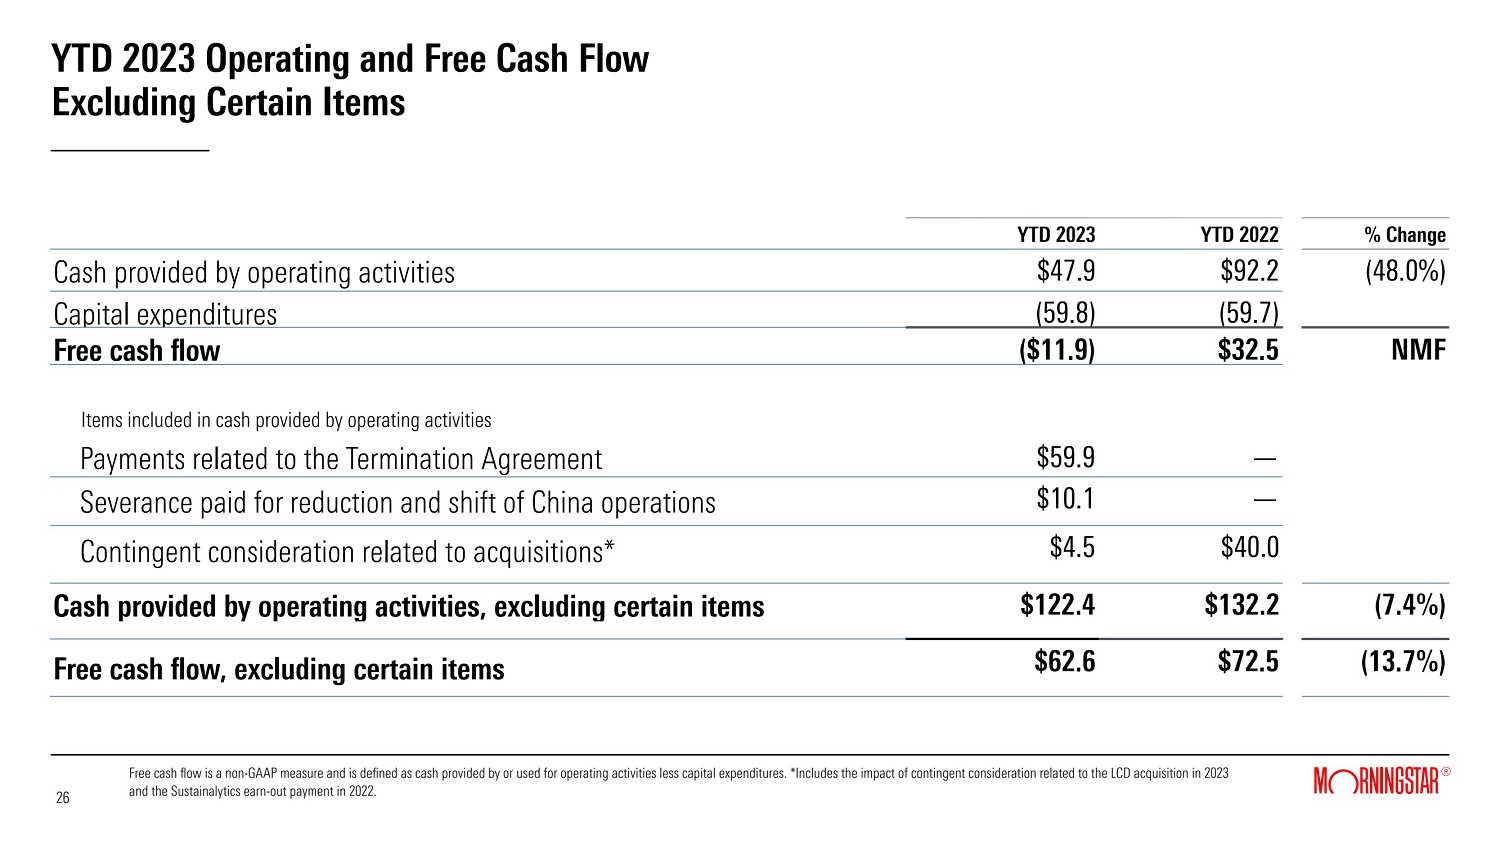
| • | Cash provided by operating activities decreased 48.0% to $47.9 million. Free cash flow was negative $11.9 million, compared to positive $32.5 million in the prior-year period. Cash flows were negatively impacted by certain items totaling $74.5 million. Excluding these items and similar items in the prior-year period for comparability, cash provided by operating activities and free cash flow would have decreased by 7.4% and 13.7%, respectively. |
Second-Quarter 2023 Results
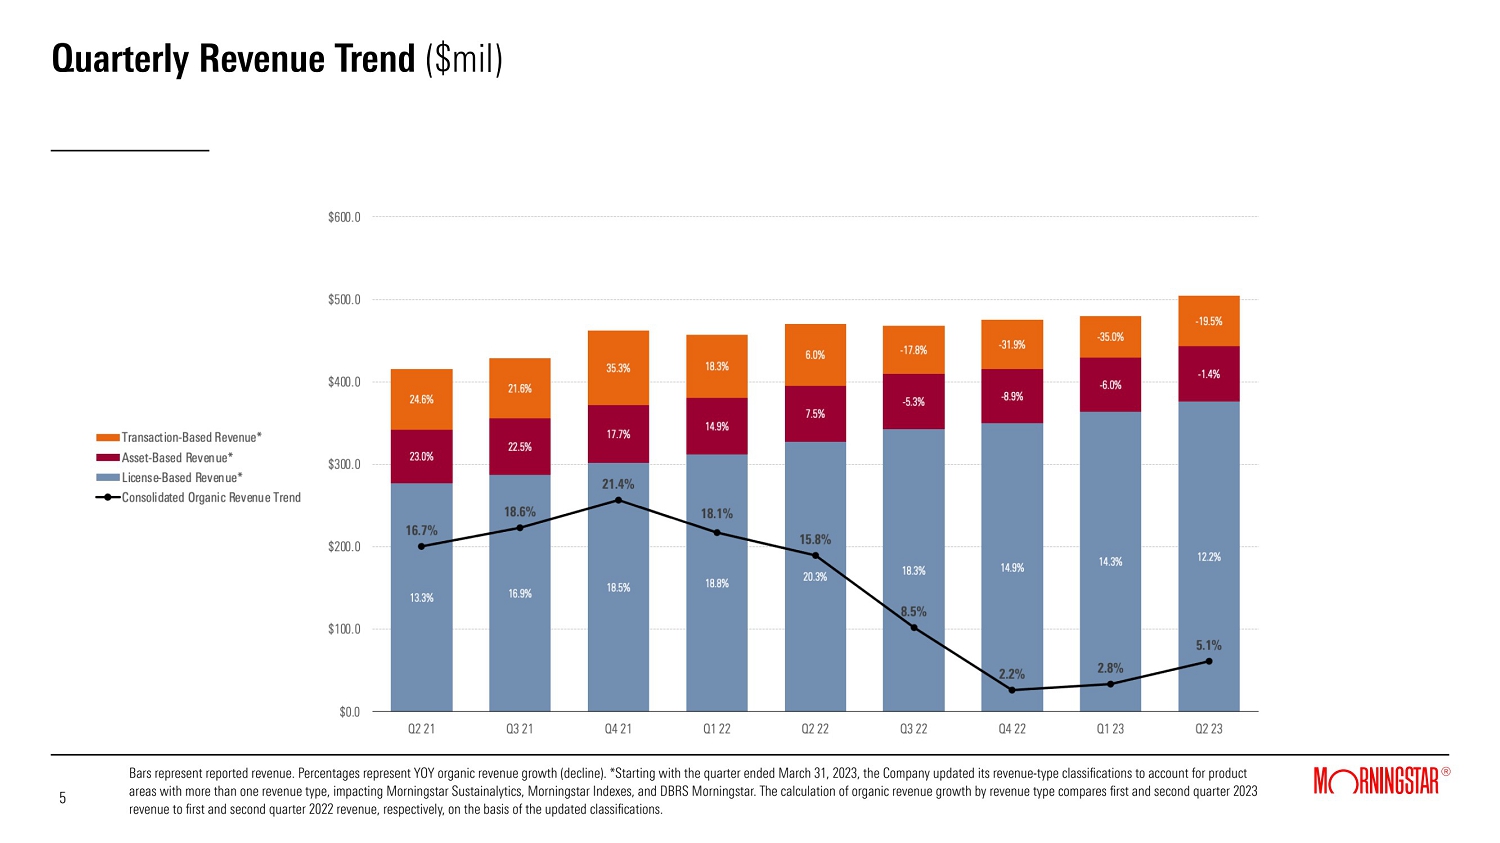
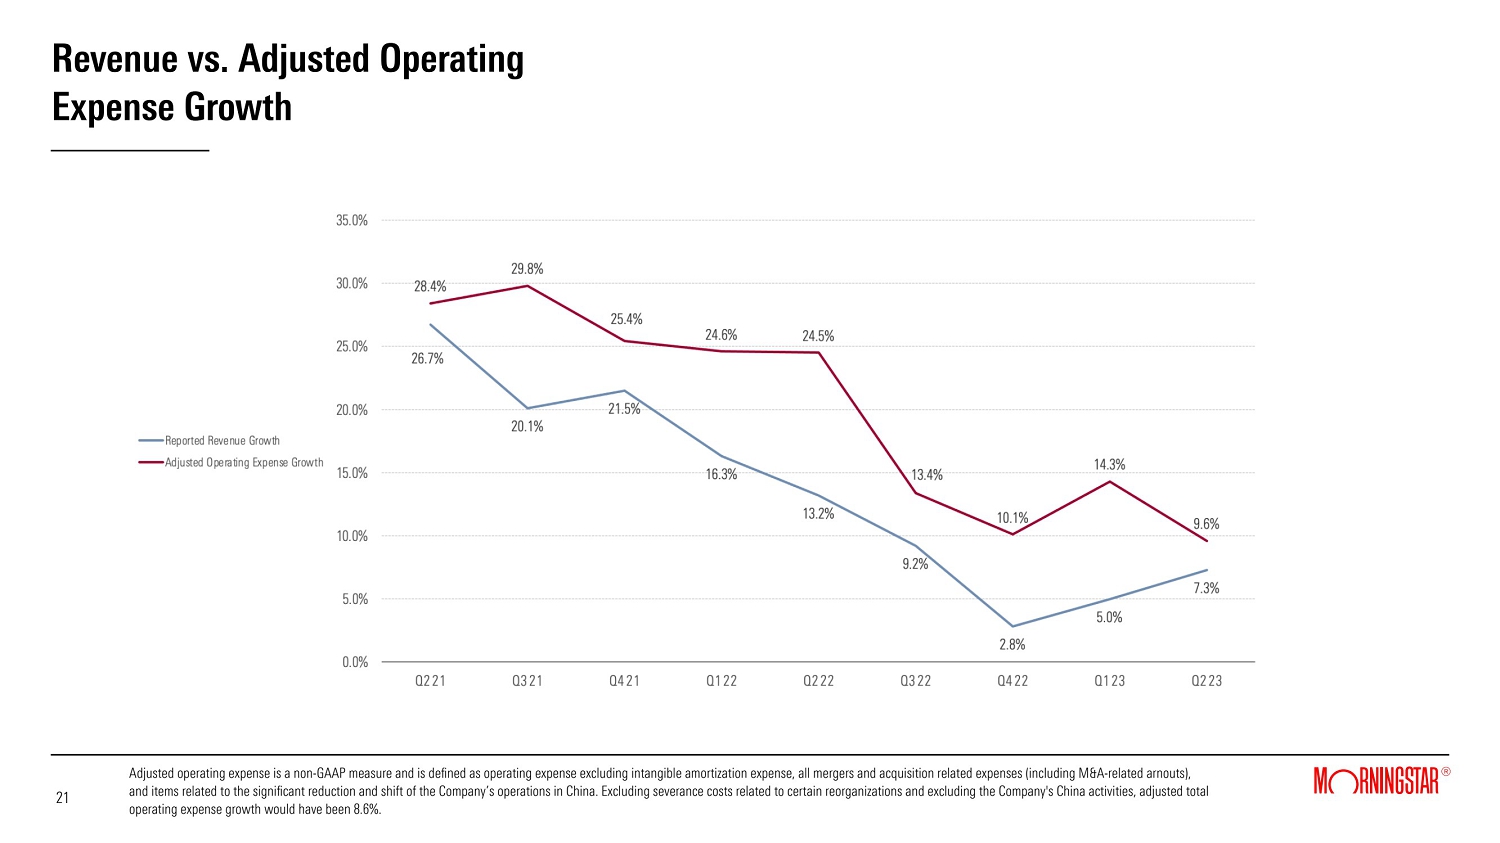
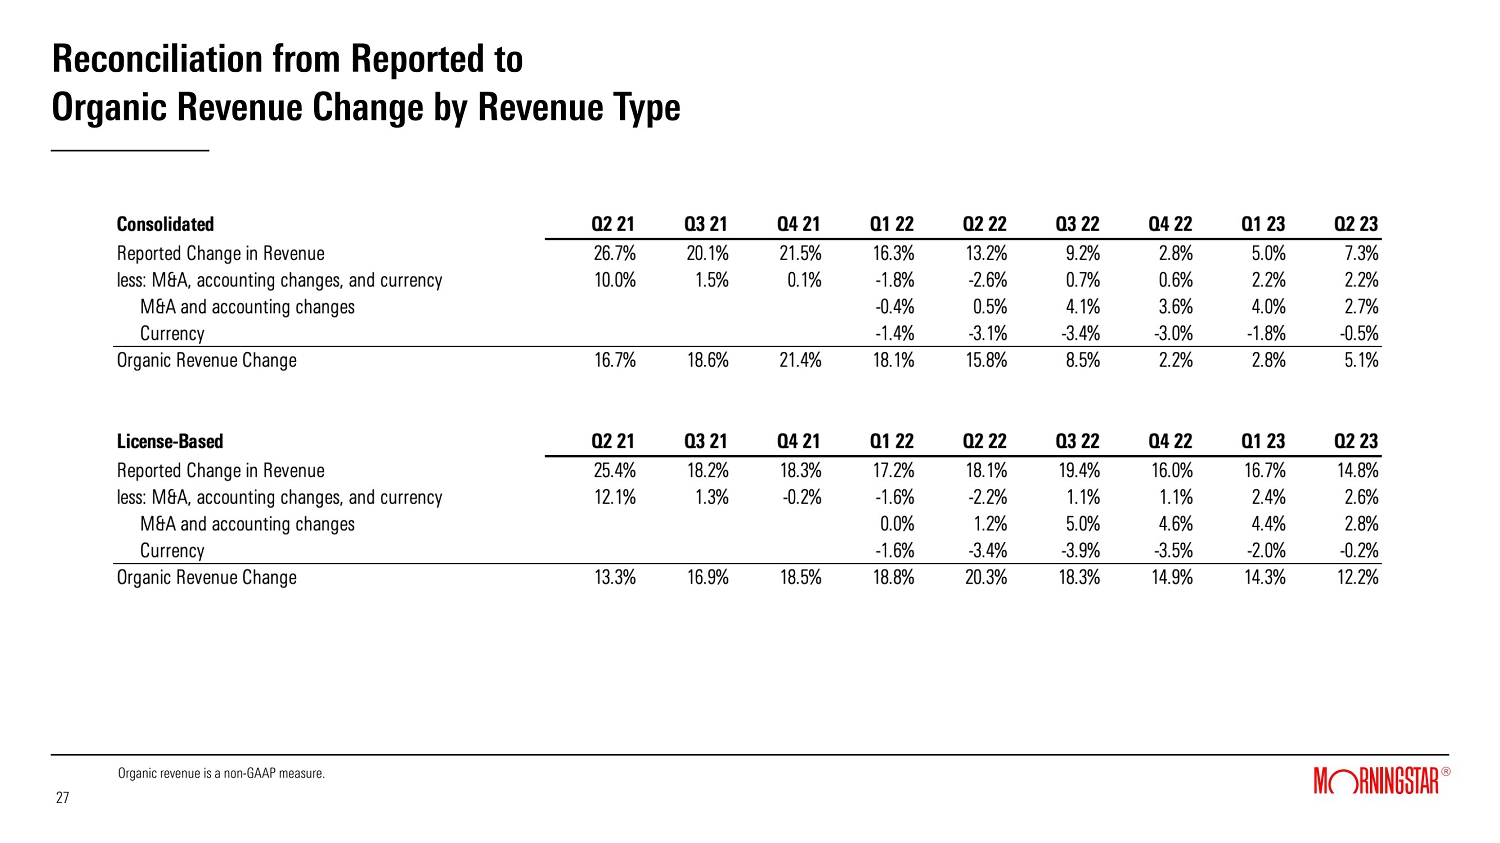
Revenue grew 7.3% to $504.7 million. Organic revenue, which excludes all M&A-related revenue and foreign currency effects, grew 5.1% versus the prior-year period, reflecting solid growth in the Company's license-based product areas, offset by declines in its transaction-based product areas, which continued to face market-driven headwinds.
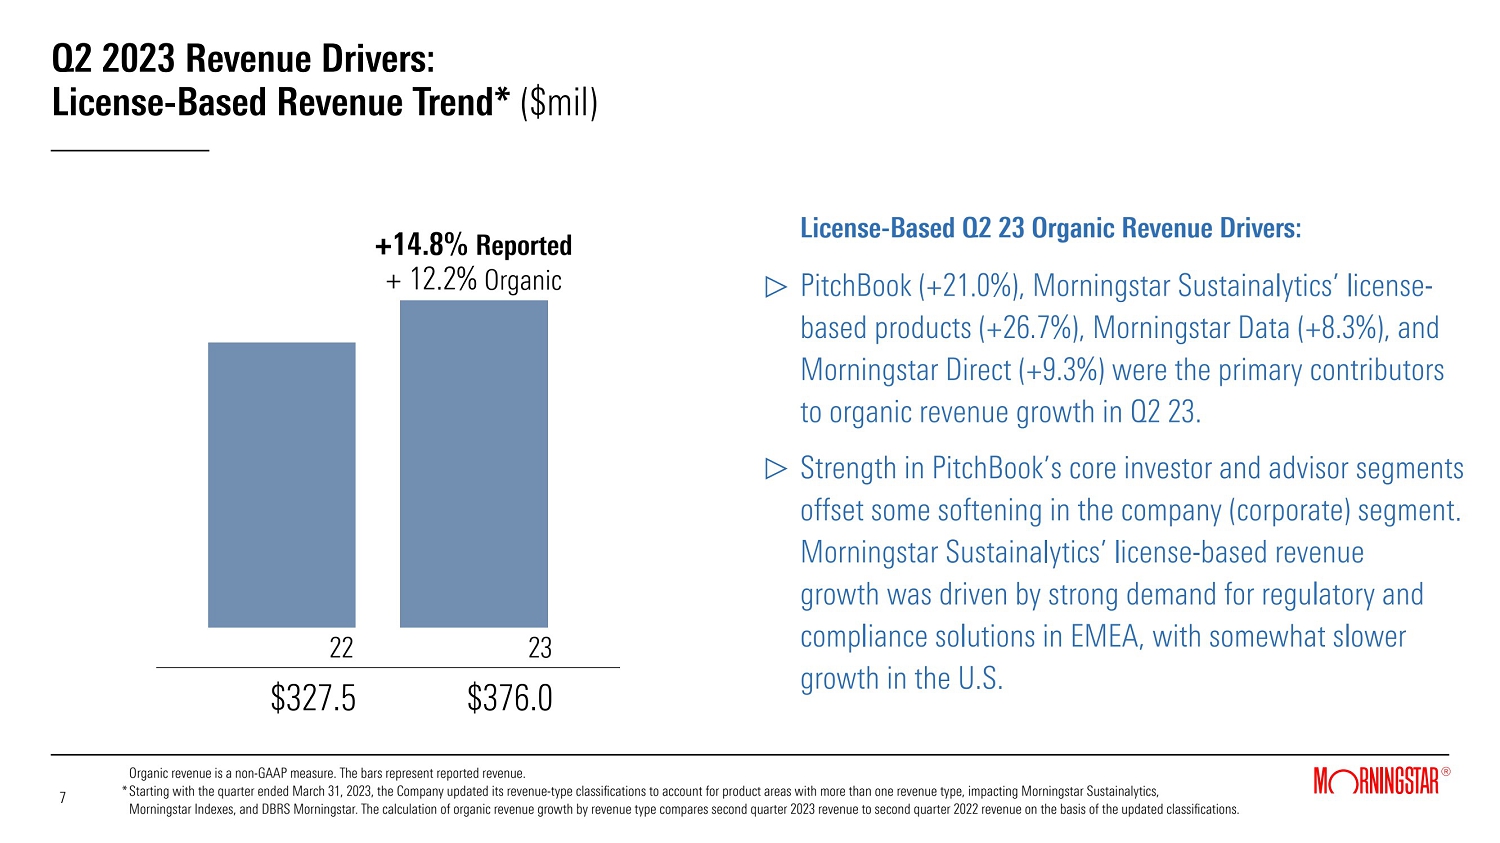
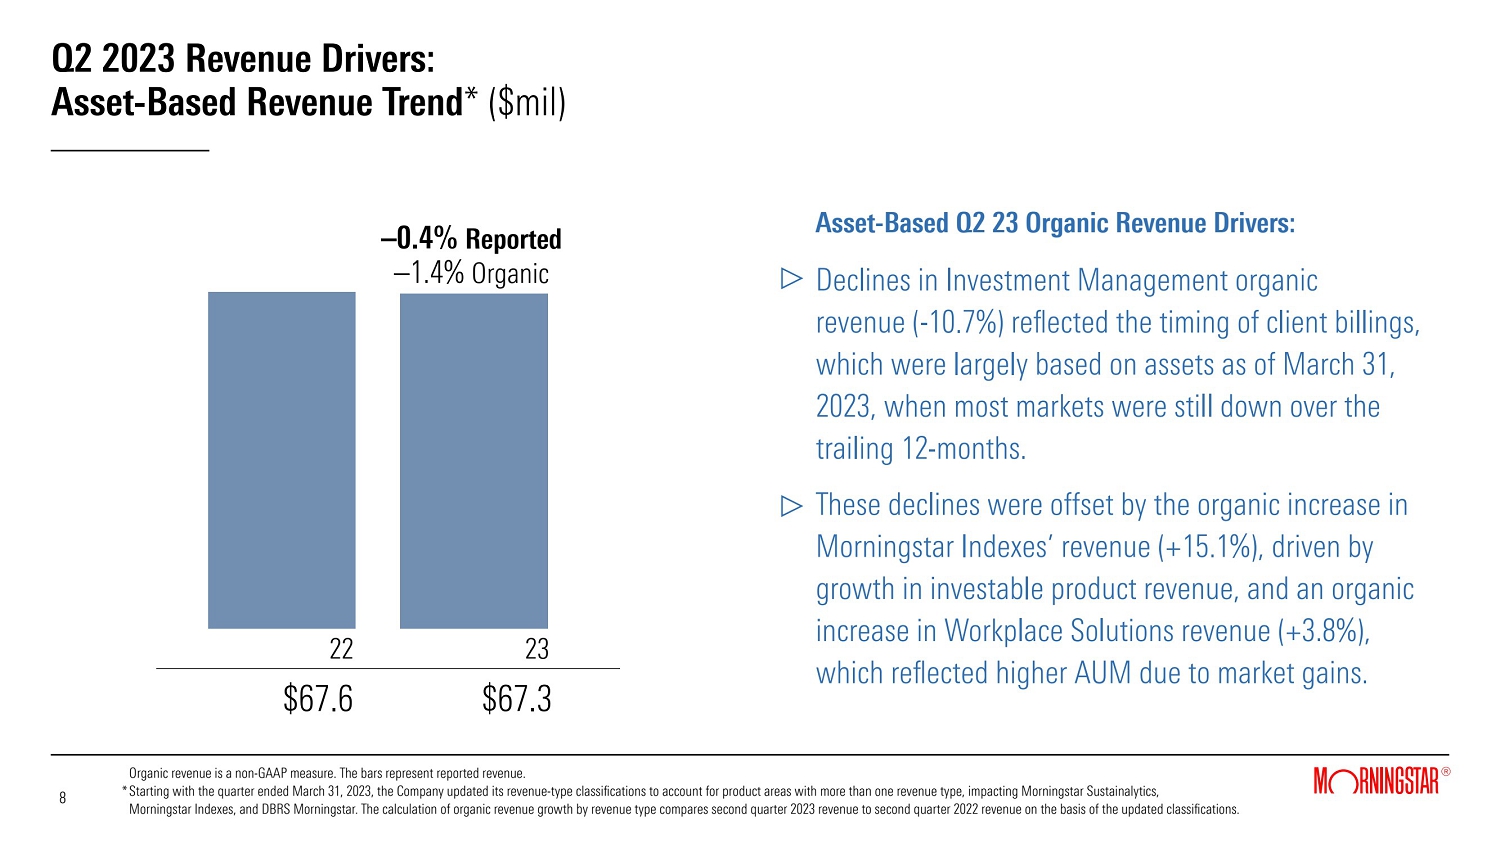
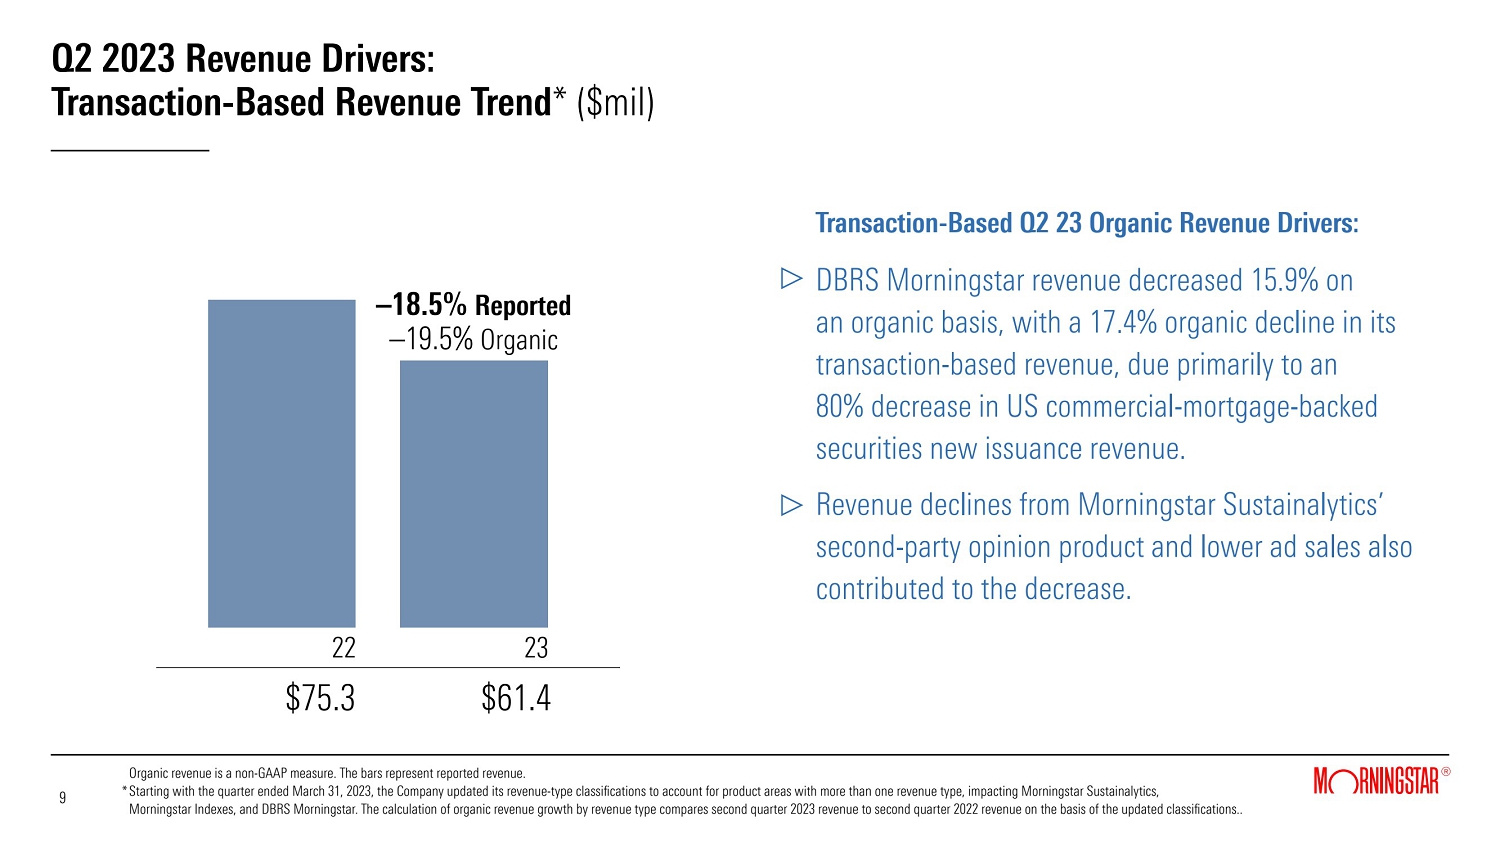
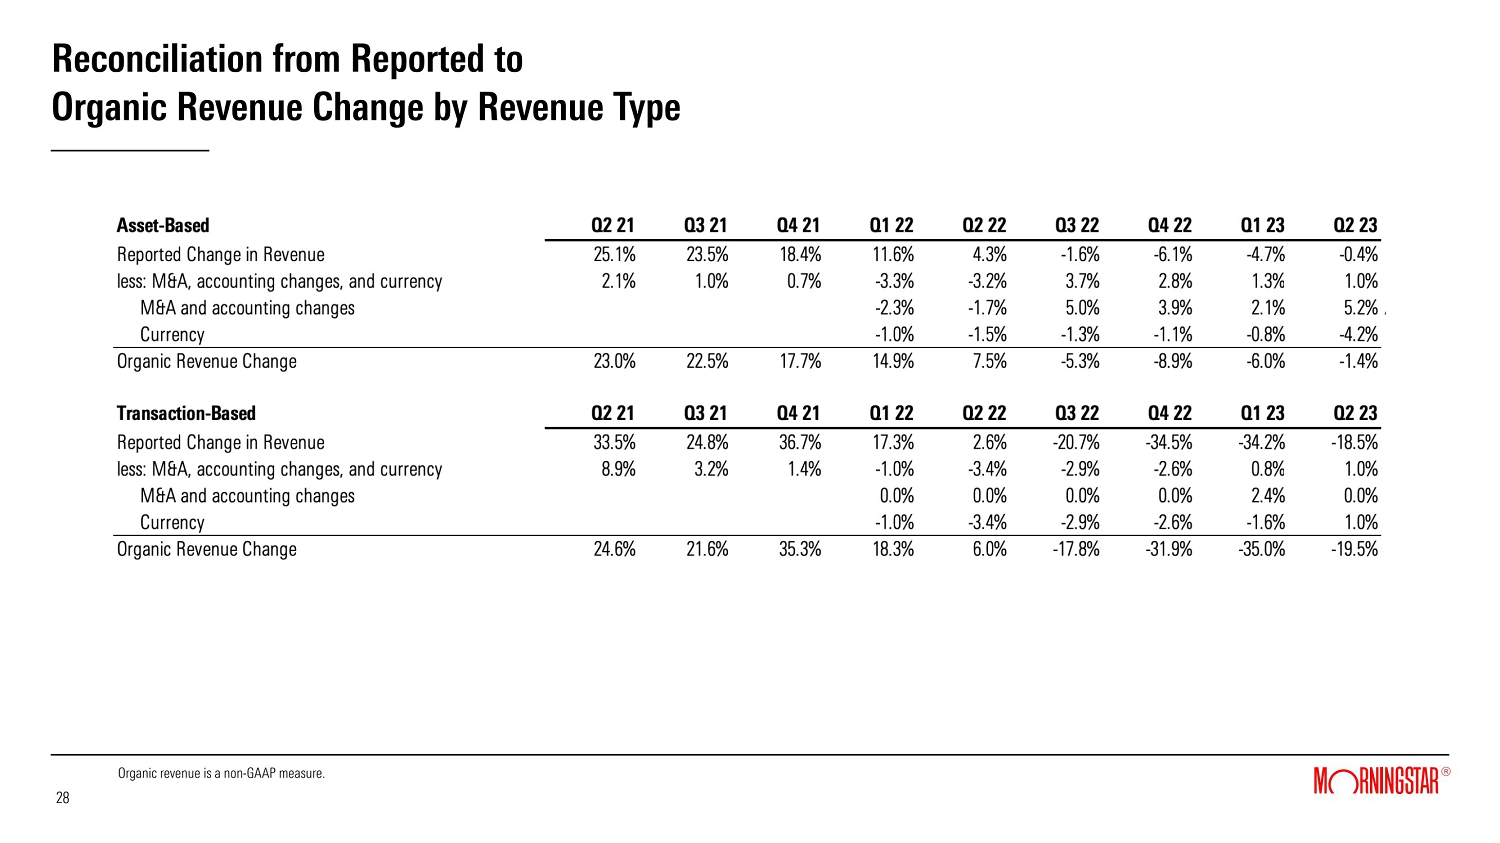
License-based revenue increased 14.8% versus the prior-year period, or 12.2% on an organic basis. PitchBook, Morningstar Sustainalytics' license-based products, Morningstar Data, and Morningstar Direct, all provided meaningful contributions to reported and organic revenue growth in the quarter. Asset-based revenue declined 0.4% year-over-year, or 1.4% organically, as growth in Morningstar Indexes' asset-based products and Workplace Solutions was offset by a decline in Investment Management revenue. Transaction-based revenue declined 18.5% compared to the prior-year period, or 19.5% on an organic basis, due to continued softness in U.S. commercial-mortgage-backed securities ratings activity, weakness in Morningstar Sustainalytics' second-party opinion product, and a decline in Morningstar.com ad revenue.
Page 2 of 15
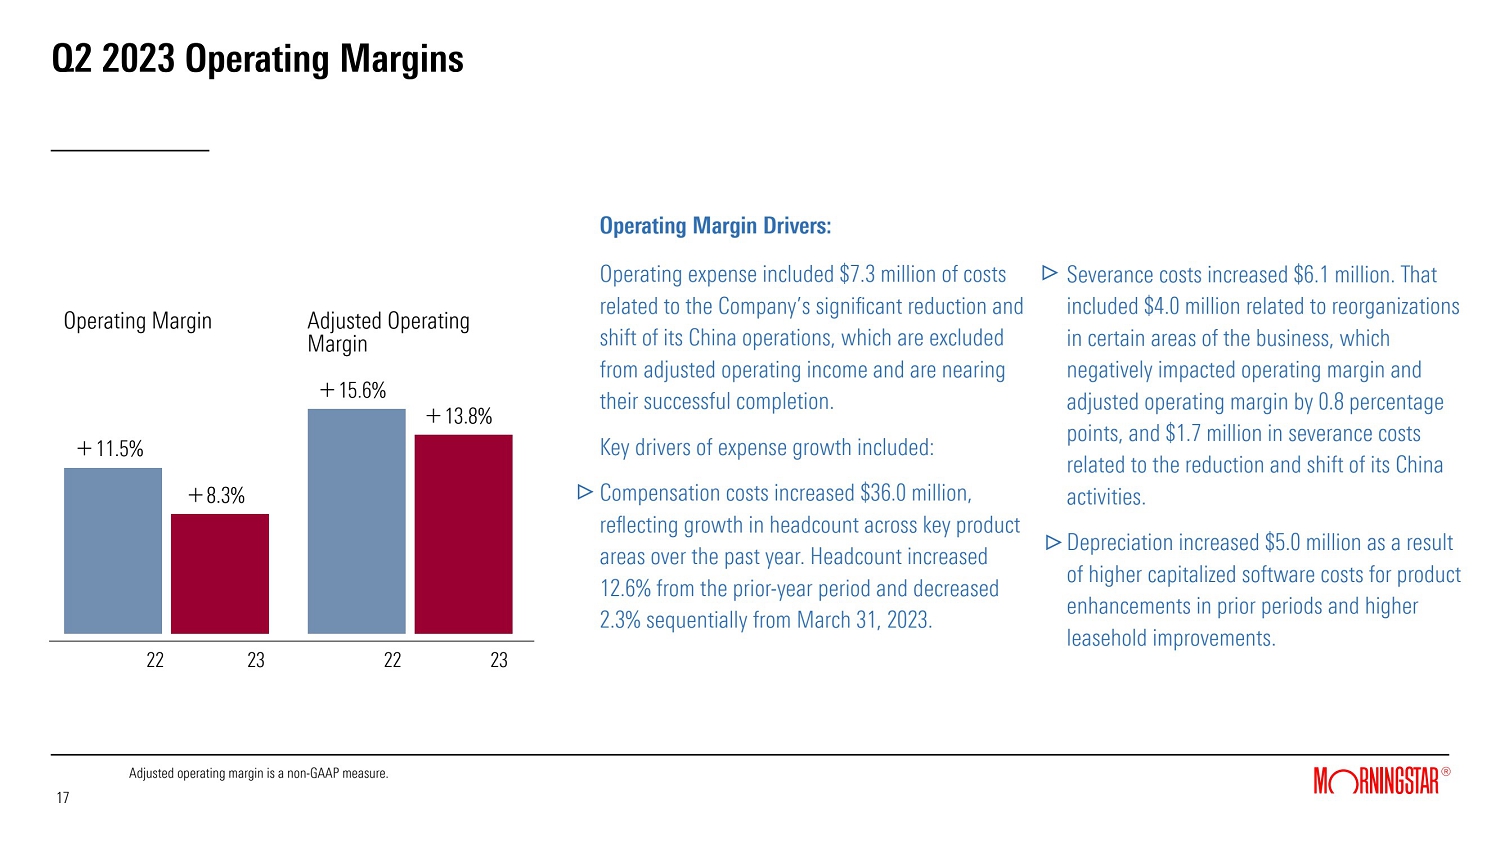
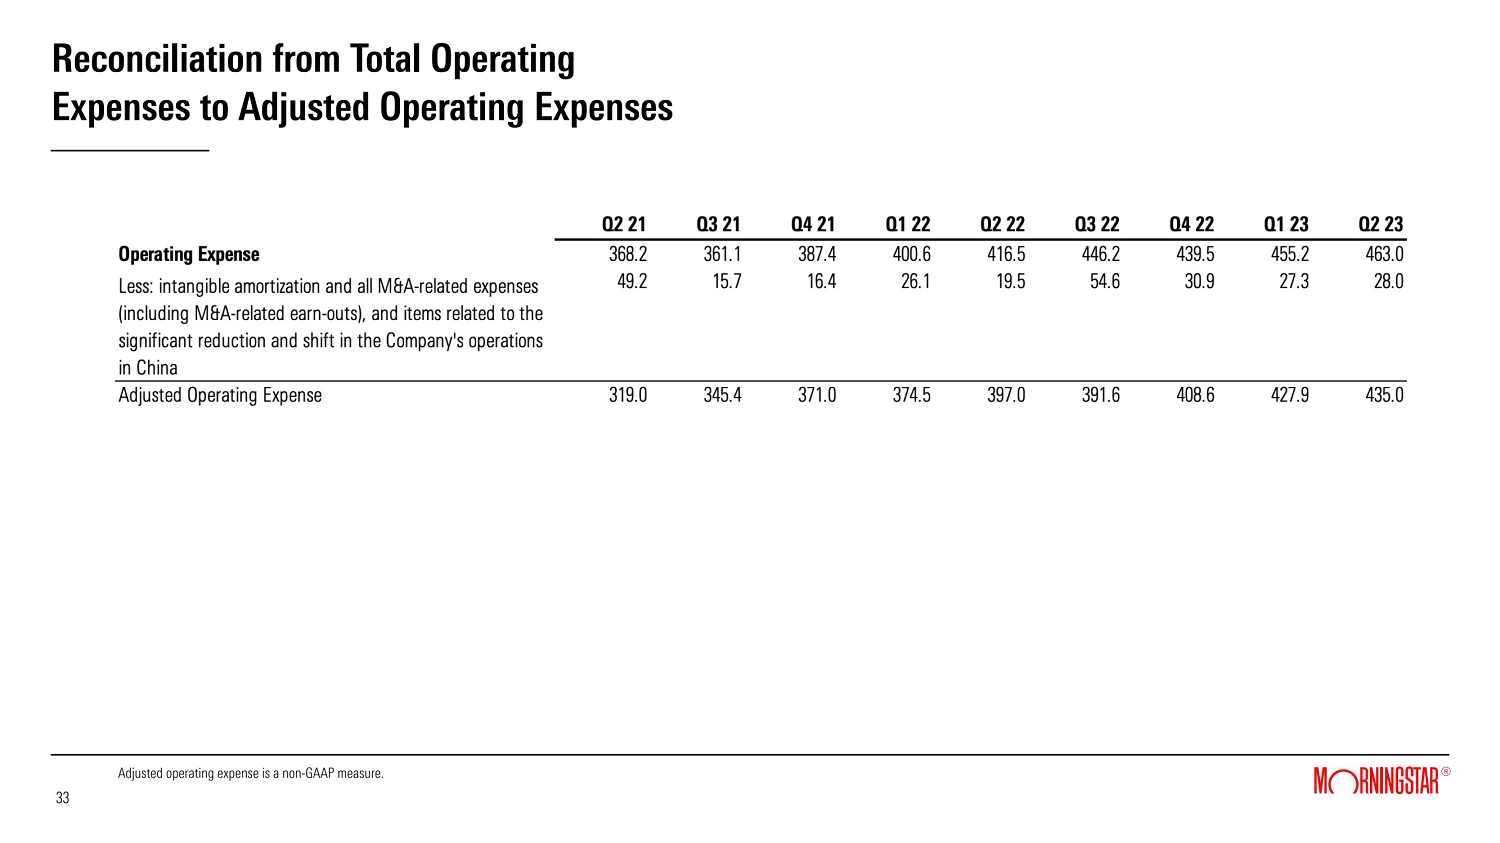
Operating expense increased 11.2% to $463.0 million, including costs of $7.3 million as the Company continued the reduction and shift of its China operations, which are nearing successful completion. Excluding the impact of these costs and M&A-related expenses and amortization, operating expense increased 9.6%. The largest contributors to operating expense growth were compensation costs, severance costs, and depreciation.
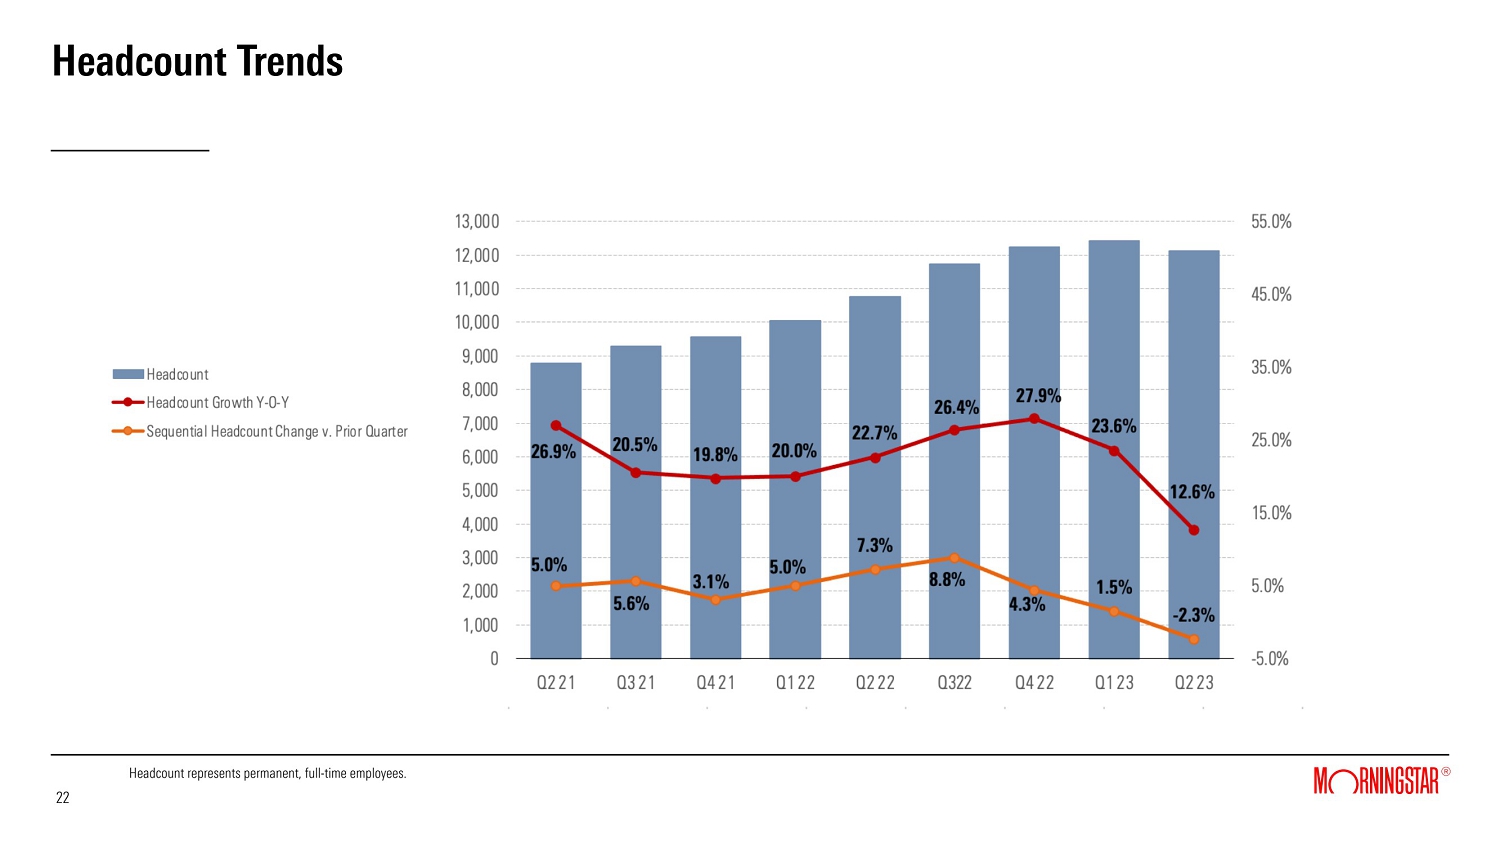
| • | Compensation costs increased $36.0 million, reflecting growth in headcount across key product areas over the past year. Headcount increased 12.6% from the prior-year period to 12,126 at the end of the quarter. The increase in headcount compared to the prior-year period was greatest for the PitchBook and Morningstar Sustainalytics product areas to support strategic growth initiatives. Headcount decreased 2.3% sequentially from Mar. 31, 2023. |
| • | Severance costs increased $6.1 million, including $4.0 million related to reorganizations in certain areas of the business as the Company identified opportunities for efficiencies, as well as $1.7 million in severance costs related to the reduction and shift of the Company's China operations. |
| • | Depreciation increased $5.0 million as a result of higher capitalized software costs for product enhancements in prior periods and higher leasehold improvements. |
The above increases were partially mitigated by a $7.3 million decline in stock-based compensation expense, primarily driven by the renewal of the PitchBook management bonus plan. The new three-year plan mirrors the incentive structure of prior plans, featuring lower target payouts in the first two years compared with the third year of the plan. In 2022, higher stock-based compensation was driven in large part by the overachievement of targets for the third year of the prior PitchBook management bonus plan.
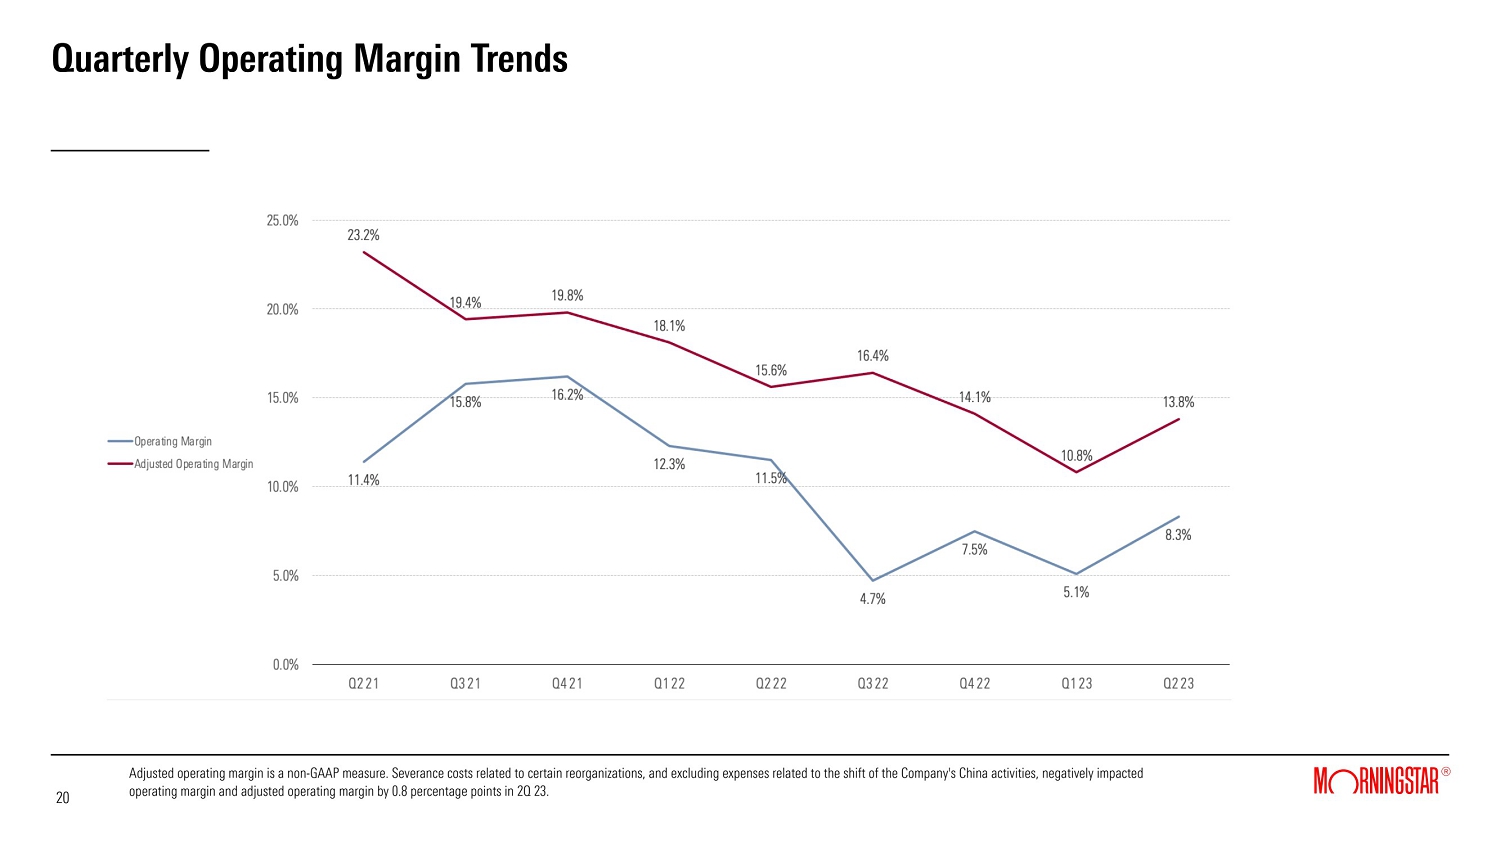
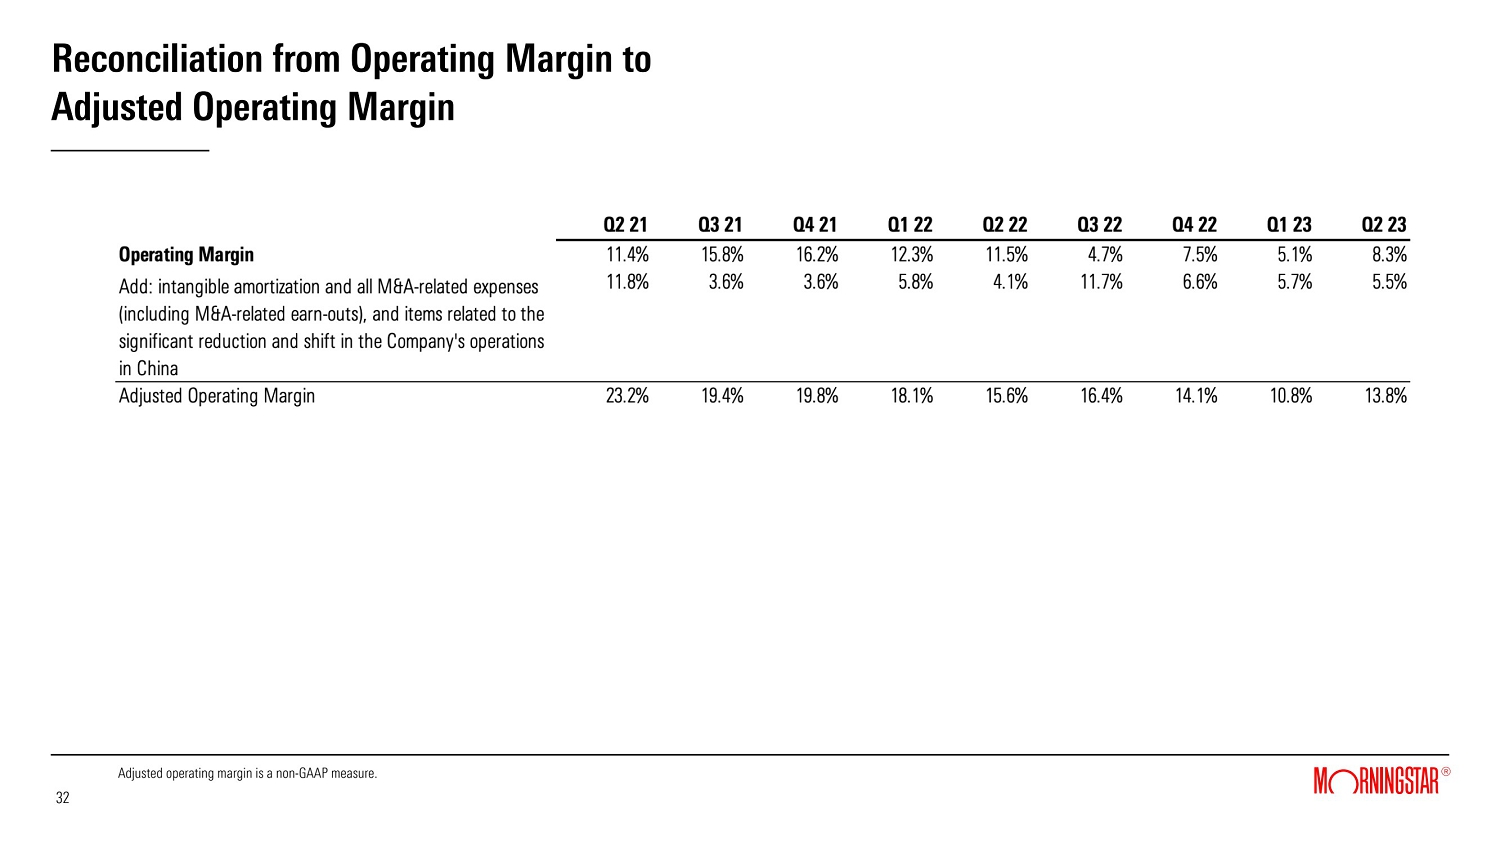
Second-quarter operating income was $41.7 million, a decline of 22.6%. Adjusted operating income was $69.7 million, a decline of 5.0%. Second-quarter operating margin was 8.3%, compared with 11.5% in the prior-year period. Adjusted operating margin was 13.8% in the second quarter of 2023, versus 15.6% in the prior-year period. Severance costs related to certain reorganizations excluding the Company's China activities, negatively impacted operating margin and adjusted operating margin by 0.8 percentage points.
Page 3 of 15
Net income in the second quarter of 2023 was $36.1 million, or $0.84 per diluted share, compared with net income of $30.1 million, or $0.70 per diluted share, in the second quarter of 2022, an increase of 20.0% on a per share basis. Adjusted diluted net income per share increased 11.1% to $1.30 in the second quarter of 2023, compared with $1.17 in the second quarter of the prior-year period.
The Company's effective tax rate was negative 20.7% in the second quarter of 2023 and positive 7.2% for the 2023 year-to-date period, reflecting a decrease of 40.4 and 17.3 percentage points, respectively, compared to the prior-year periods. The decrease in the second quarter was primarily due to the recognition of $13.7 million of tax benefits related to the approval of a retroactive tax election with respect to our 2021 and 2022 tax periods, which was referenced in the fourth quarter 2022 earnings release. The tax benefit increased diluted net income per share by $0.15.
Product Area Highlights
On a consolidated basis, PitchBook, Morningstar Sustainalytics, Morningstar Data, and Morningstar Direct were the top four contributors to organic revenue growth in the second quarter of 2023. (For performance of the largest product areas and key metrics, refer to the Supplemental Data table contained in this release and the Supplemental Presentation included on our Investor Relations website at shareholders.morningstar.com under "Financials — Financial Summary".)
Highlights of these and other product areas are provided below. Organic revenue excludes all M&A-related revenue and foreign currency effects. Foreign currency effects accounted for the entire difference between reported and organic growth in the quarter for Morningstar Data, Morningstar Direct, Morningstar Advisor Workstation, and DBRS Morningstar.
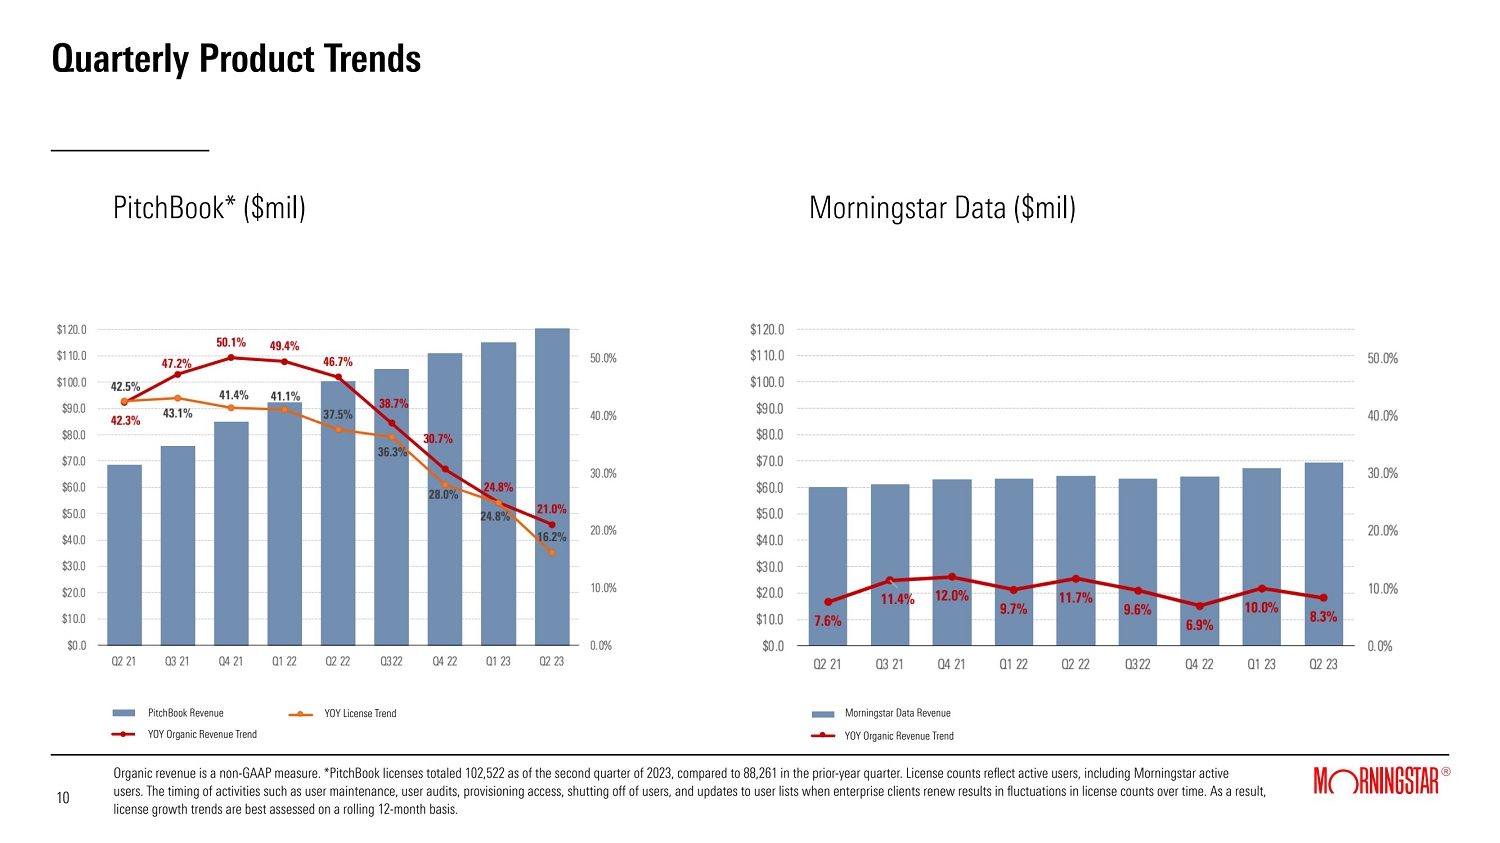
| • | PitchBook revenue grew 21.0% on a reported and organic basis, driven by continued strength in its core investor and advisor segments, which offset some softness in the company (corporate) segment, compared to a particularly strong prior-year period. Licenses grew 16.2%, reflecting both new client users and expansion with existing clients, as well as variability driven by user maintenance activities and updates to user lists when enterprise clients renew. During the quarter, product enhancements included the addition of Leveraged Commentary & Data (LCD) news and research to the PitchBook platform, providing users with centralized access to private equity and credit coverage, while the PitchBook newsletter surpassed two million subscribers. Results exclude contributions from the LCD acquisition. |
Page 4 of 15
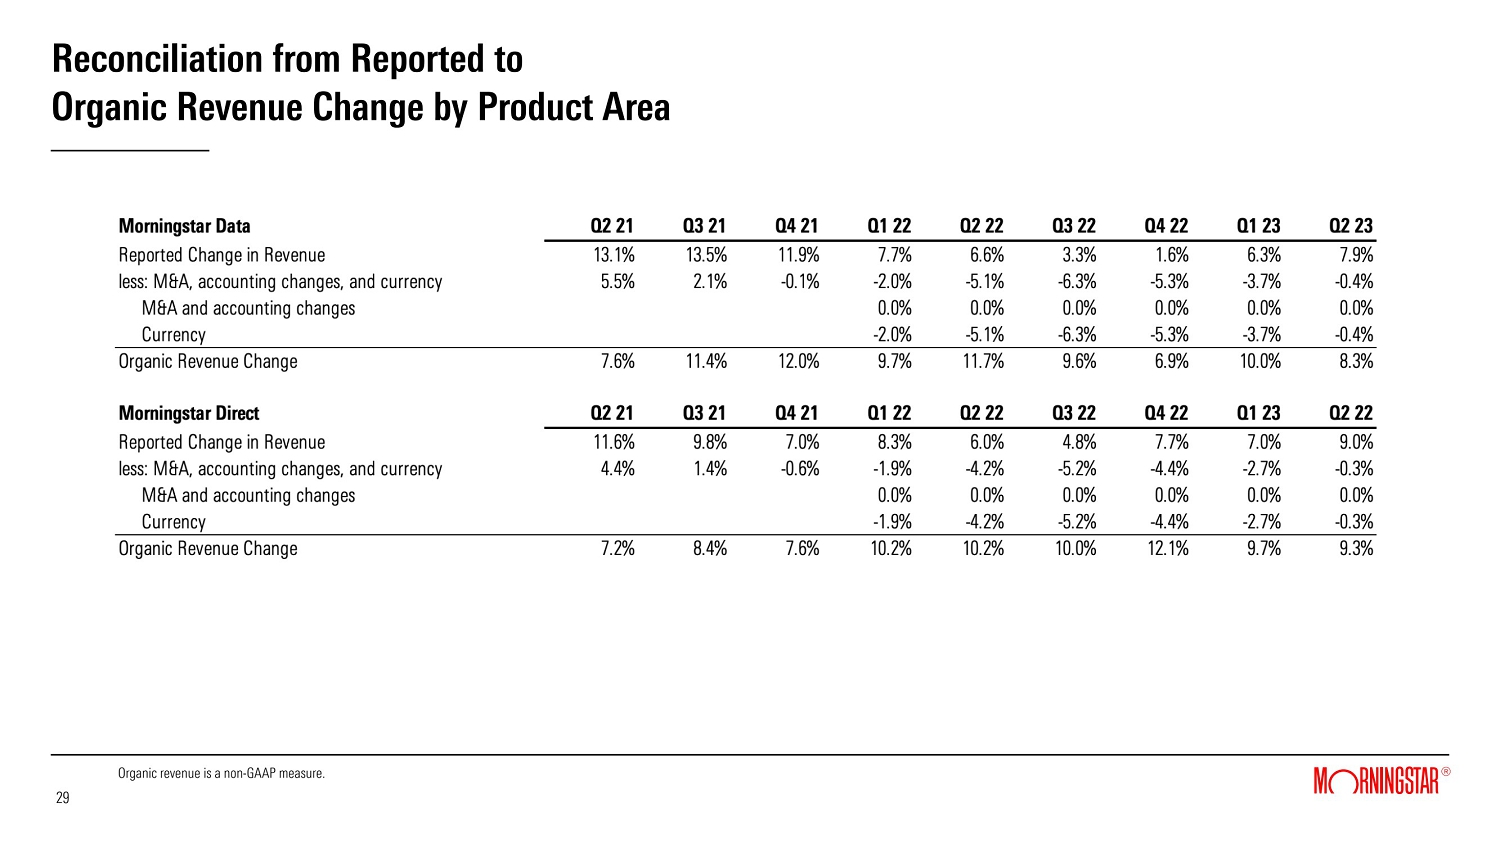
| • | Morningstar Data revenue grew 7.9%, or 8.3% on an organic basis, driven by increases in North America and supported by the addition of new asset- and wealth-management clients. At the product level, fund data continued to be the key driver of revenue growth, followed by growth in Morningstar Essentials and equity data. |
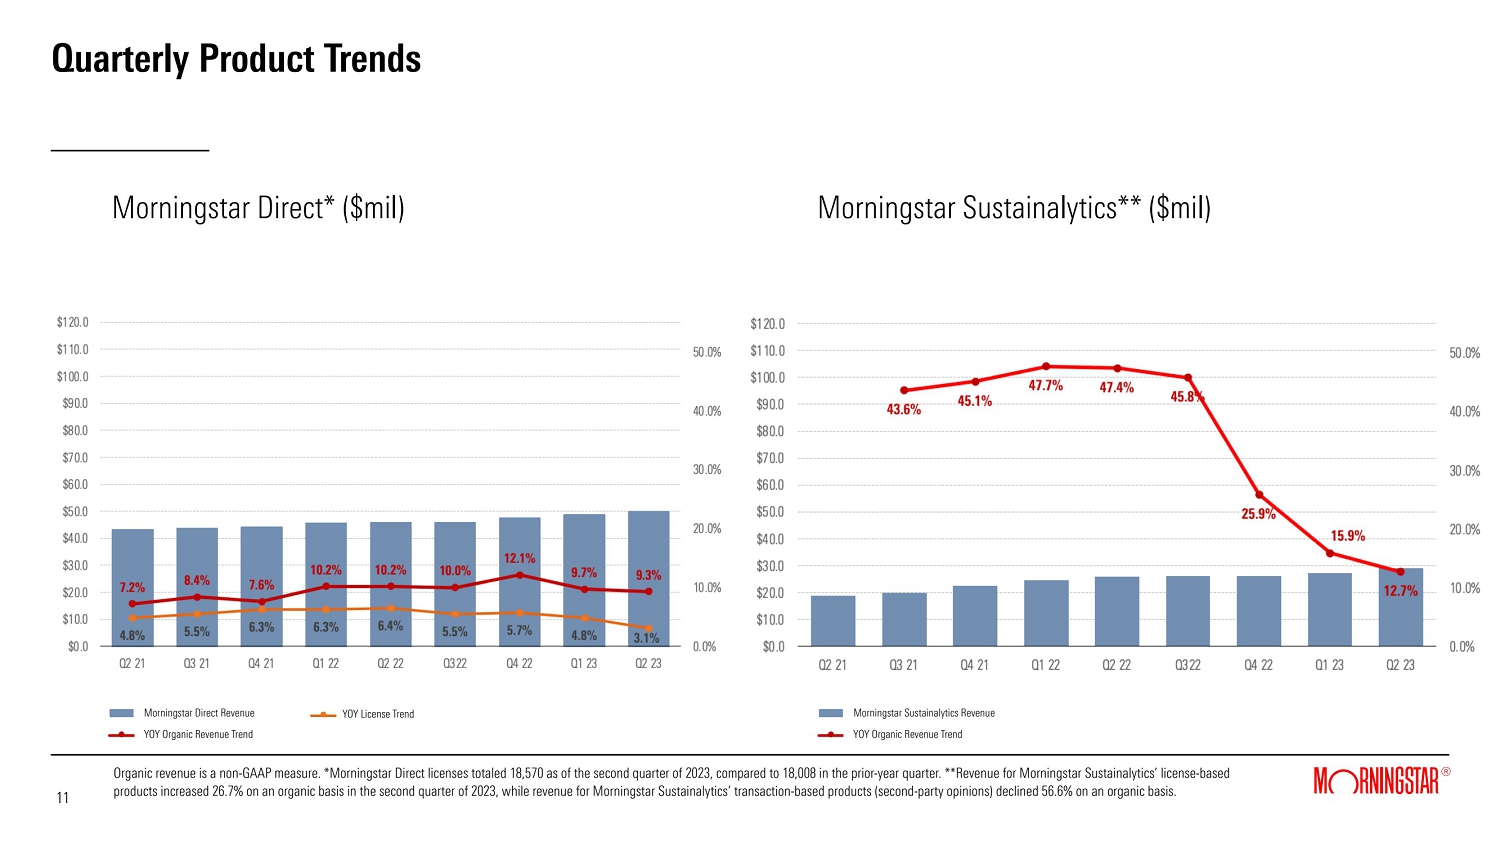
| • | Morningstar Direct revenue grew by 9.0%, or 9.3% on an organic basis, reflecting growth across all geographies and supported by the addition of new asset- and wealth-management clients. Direct licenses increased 3.1%. |
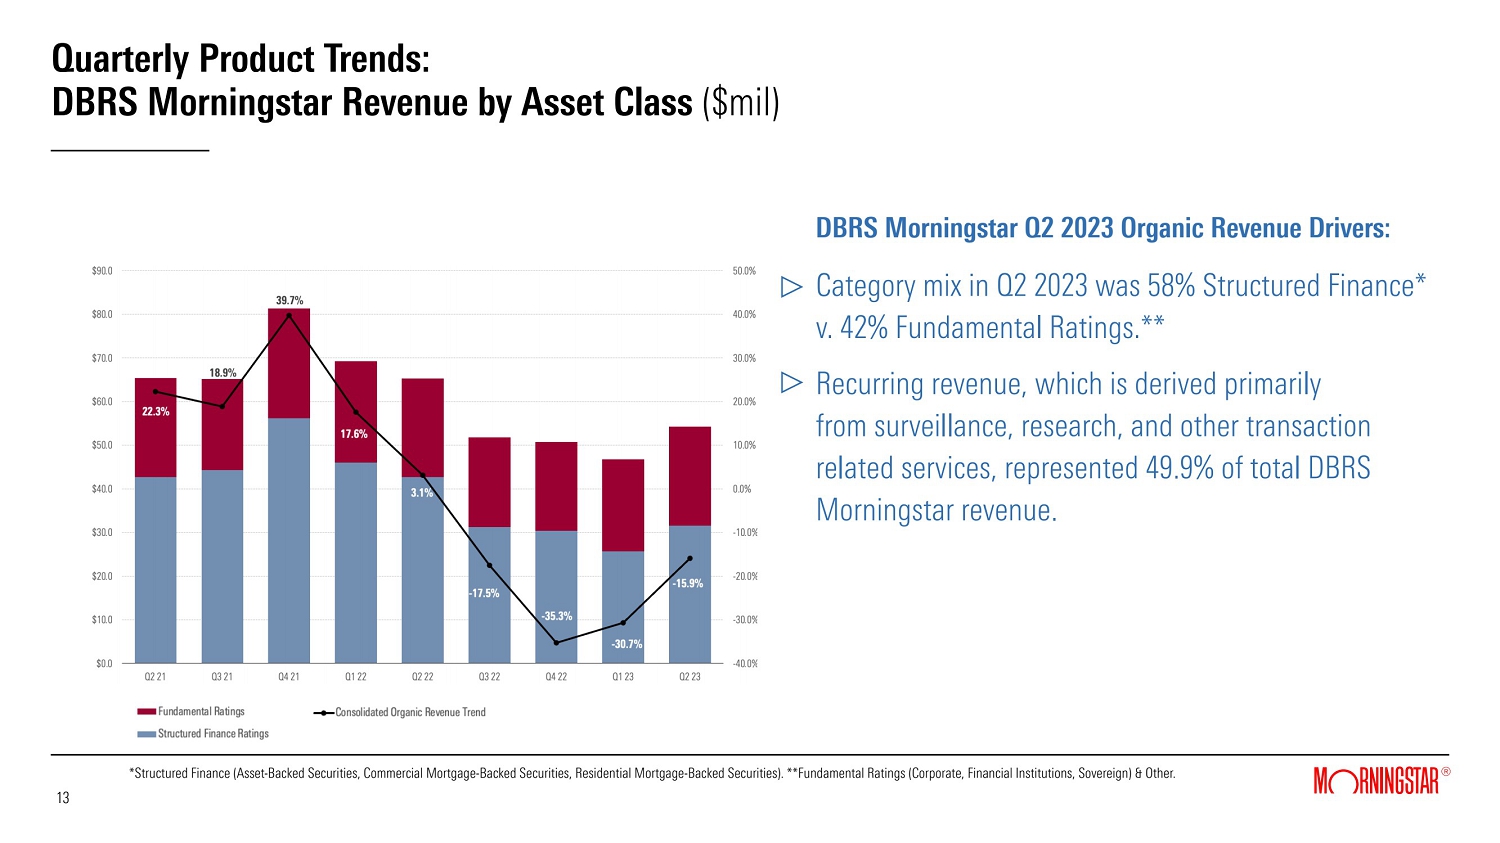
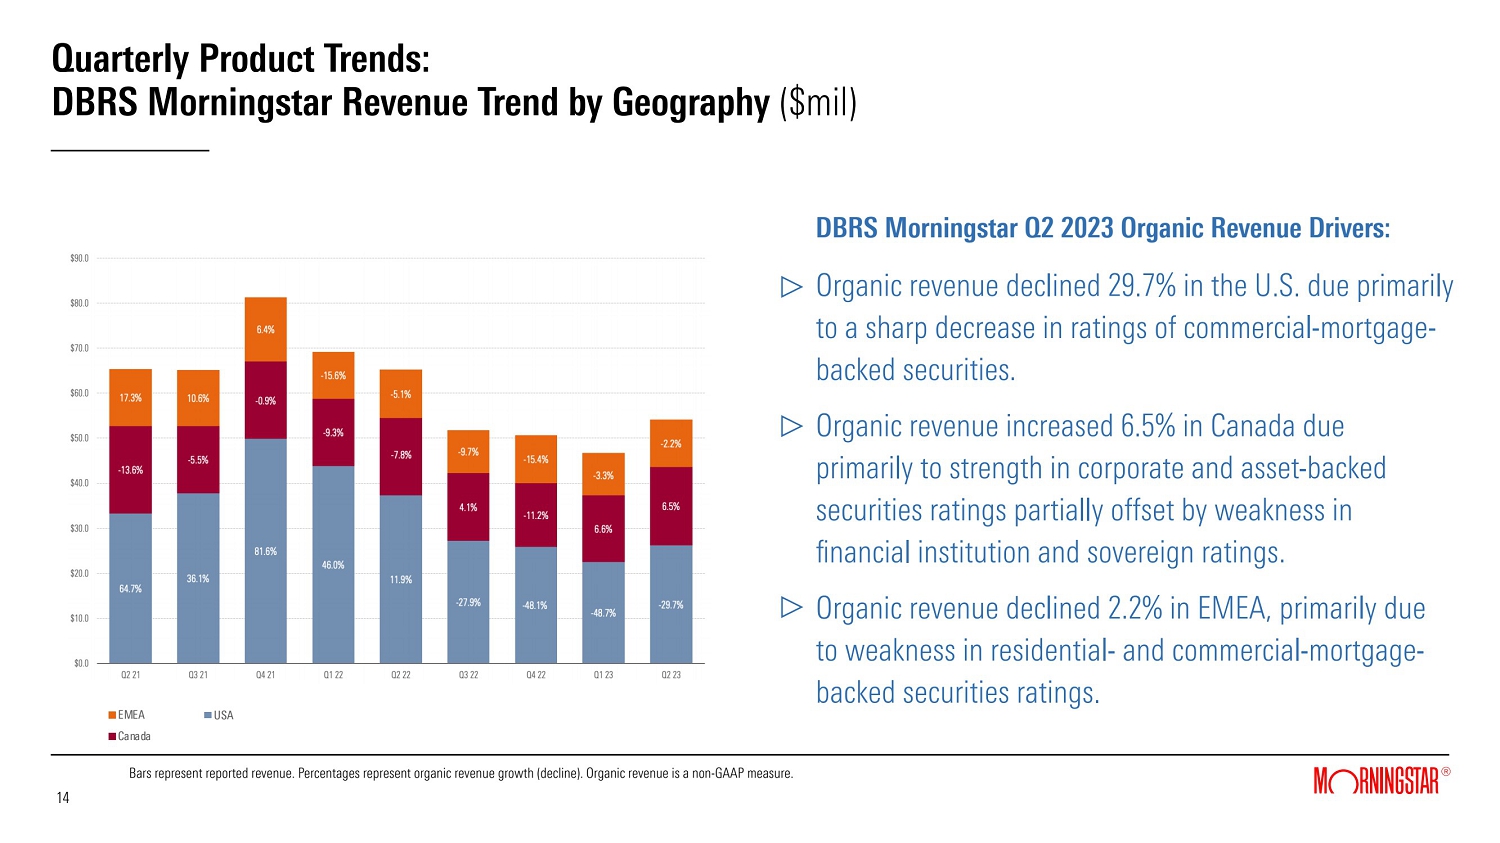
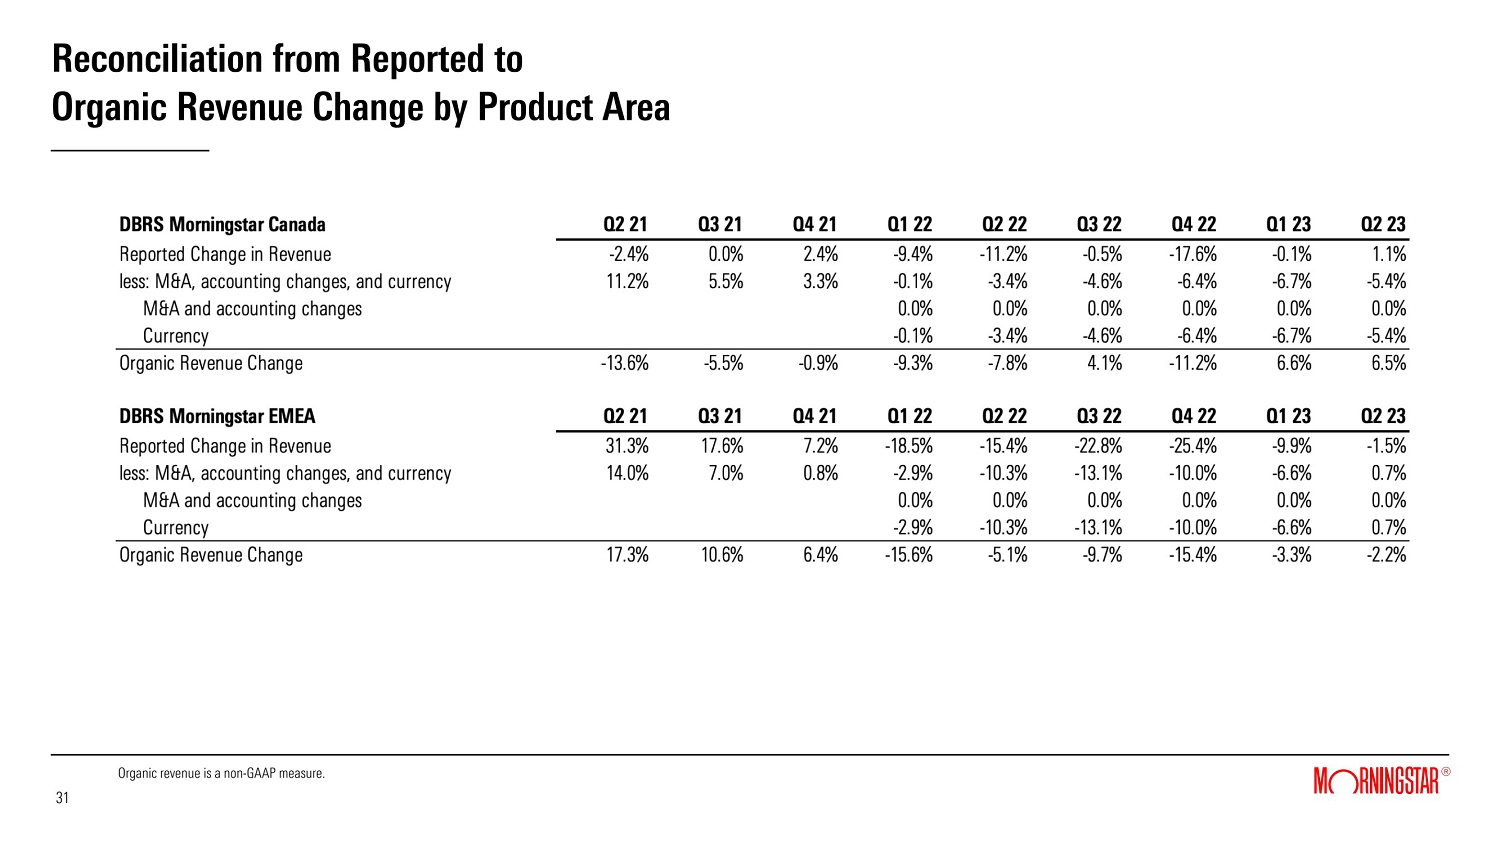
| • | DBRS Morningstar revenue declined 16.9%, or 15.9% on an organic basis, primarily as a result of a sharp drop in revenue from commercial mortgage-backed securities (CMBS) ratings, as U.S. CMBS new issuance ratings revenue decreased 80% compared to the prior-year period. Ratings revenue from financial institutions and sovereigns also declined. These decreases were partially mitigated by growth in revenue from asset-backed securities ratings and corporate credit ratings. Revenue related to data products also increased. Organic revenue declined sharply in the U.S. and modestly in Europe but grew in Canada. |
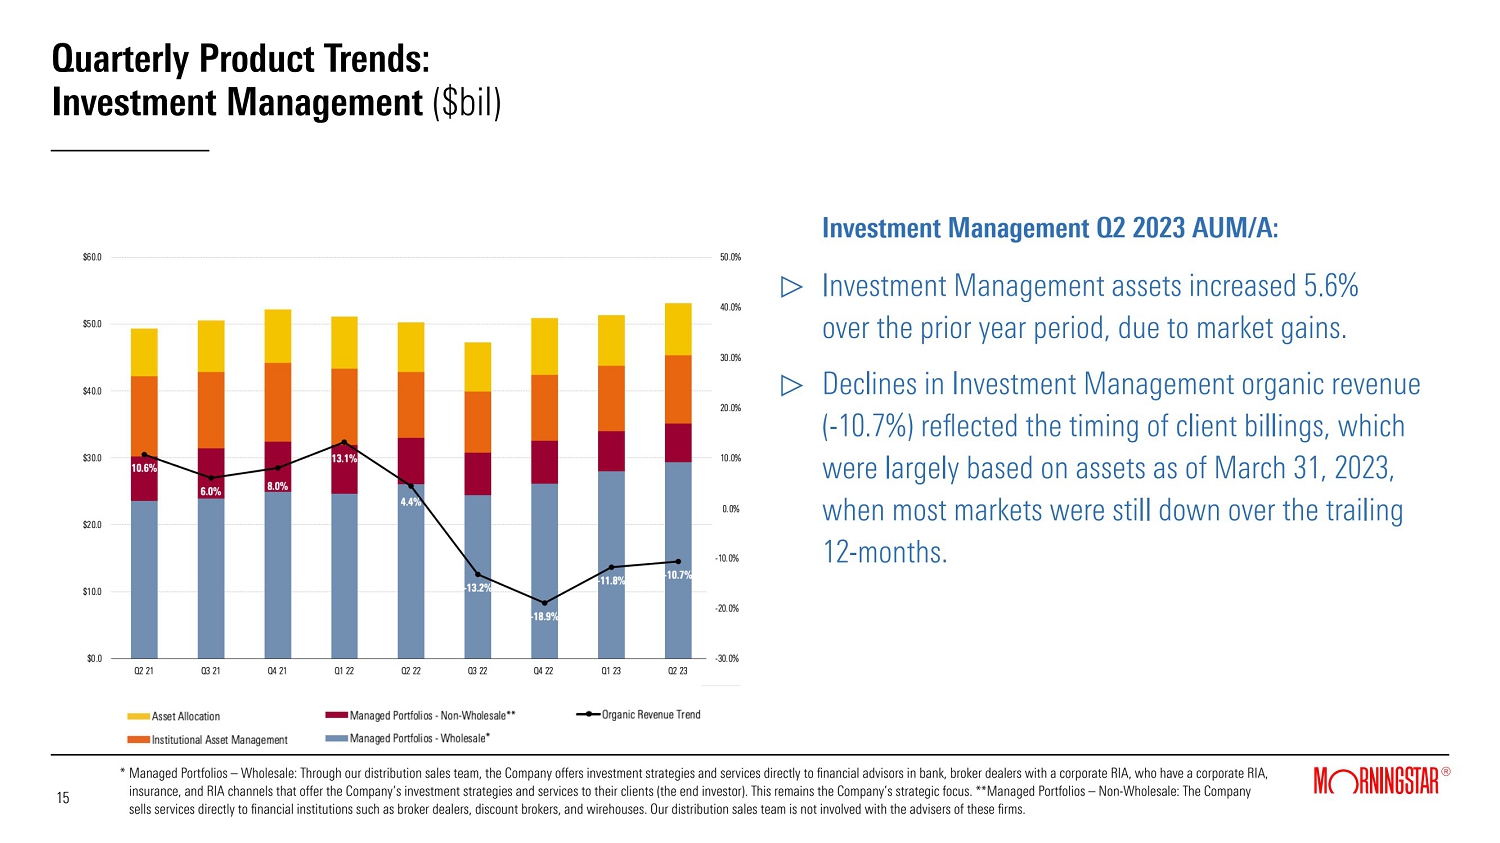
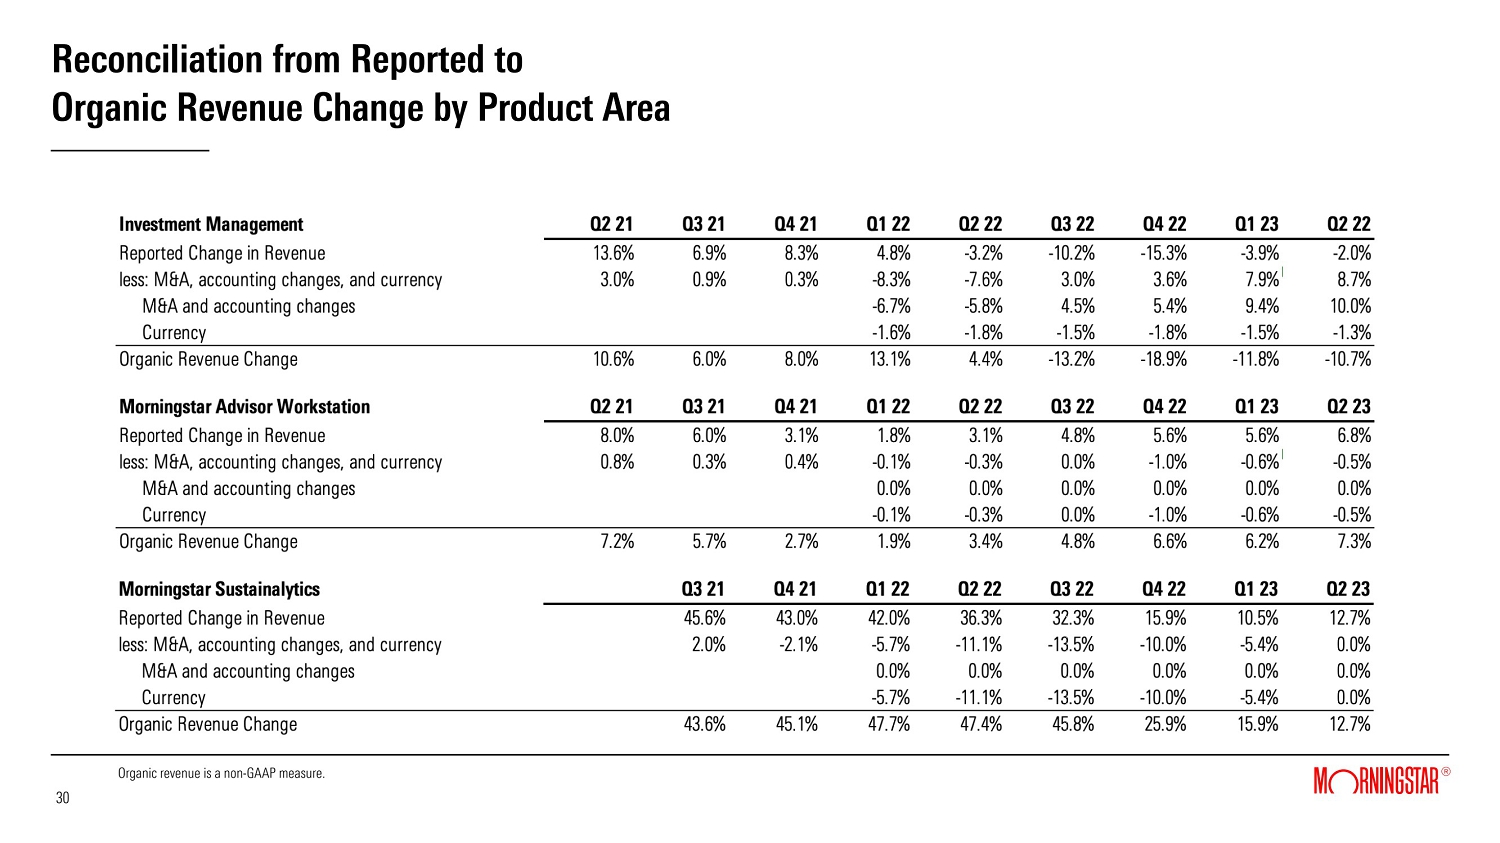
| • | Investment Management revenue declined 2.0%, or 10.7% on an organic basis. Reported assets under management and advisement (AUMA) increased 5.6% to $53.1 billion compared with the prior-year period, due to market gains. Despite this increase in AUMA, organic revenue decreased due to the timing of client contract billings, which were largely based on assets as of Mar. 31, 2023, and the decline in asset values across global markets over the prior 12-month period. Total AUMA included $5.1 billion of assets related to the acquisition of Praemium's U.K. and international offerings, which closed on June 30, 2022. Organic results exclude contributions from Praemium. |
| • | Morningstar Sustainalytics revenue grew 12.7% on a reported and organic basis. License-based revenue increased 26.2%, or 26.7% on an organic basis, while transaction-based revenue declined 56.5%, or 56.6% on an organic basis. License-based product revenue growth was driven by strong demand for regulatory and compliance solutions in EMEA, with somewhat slower growth in the U.S. reflecting softening in the retail asset management and wealth management segments. Although sustainable bond issuance rebounded, transaction-based revenue was impacted by constraints on demand for second-party opinions (SPOs) as some sustainable bond issuers came to market without new or updated SPOs, instead relying on Leadership in Environmental and Energy Design (LEED) certifications or SPOs initially obtained for bonds issued earlier under the same program. |
Page 5 of 15
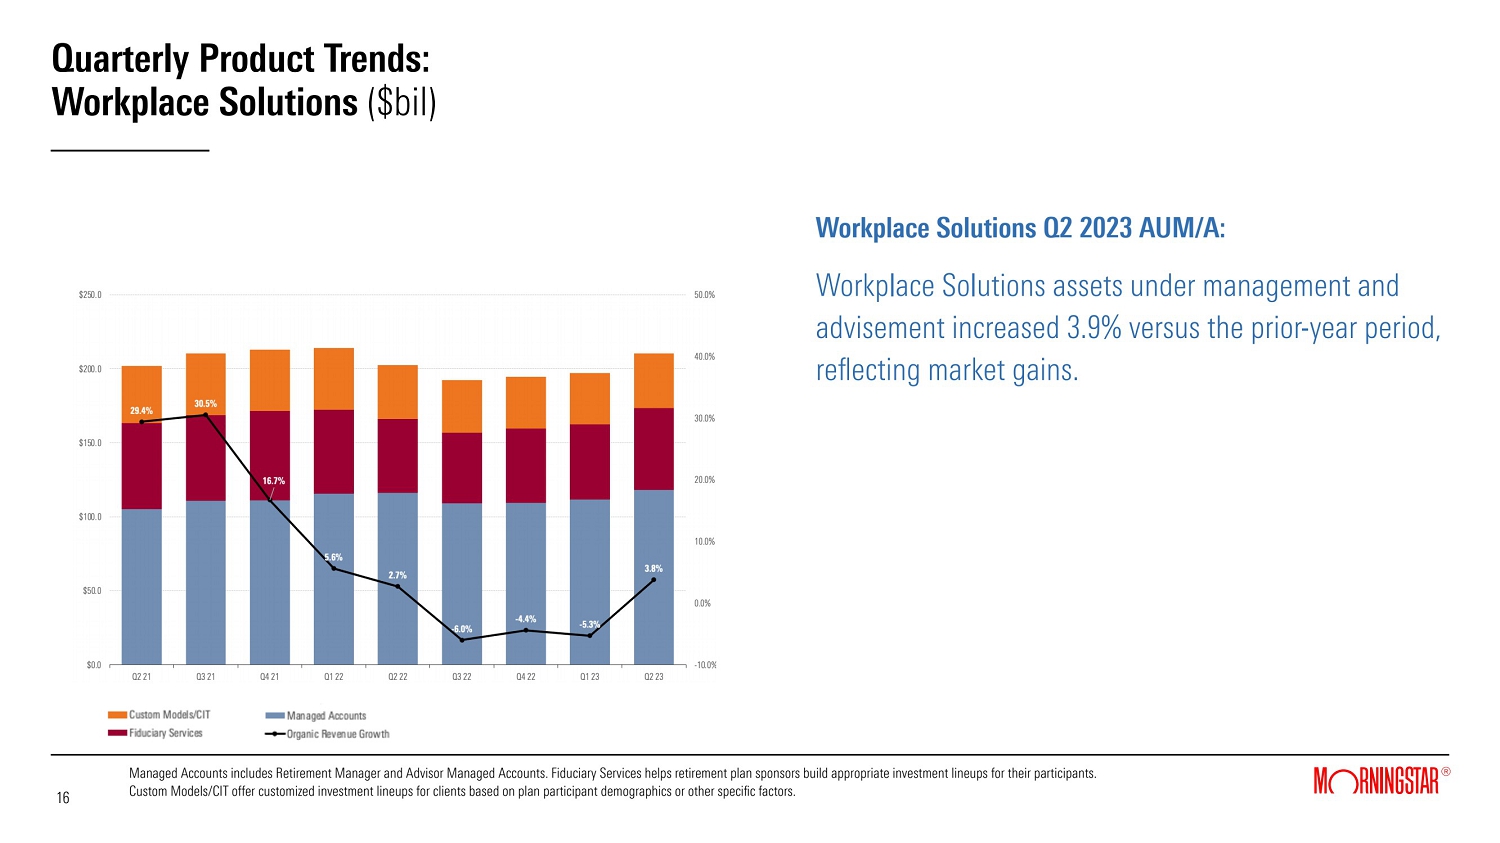
| • | Workplace Solutions revenue increased 3.8% on a reported and organic basis. AUMA increased 3.9% to $210.4 billion compared with the prior-year period, reflecting market gains. |
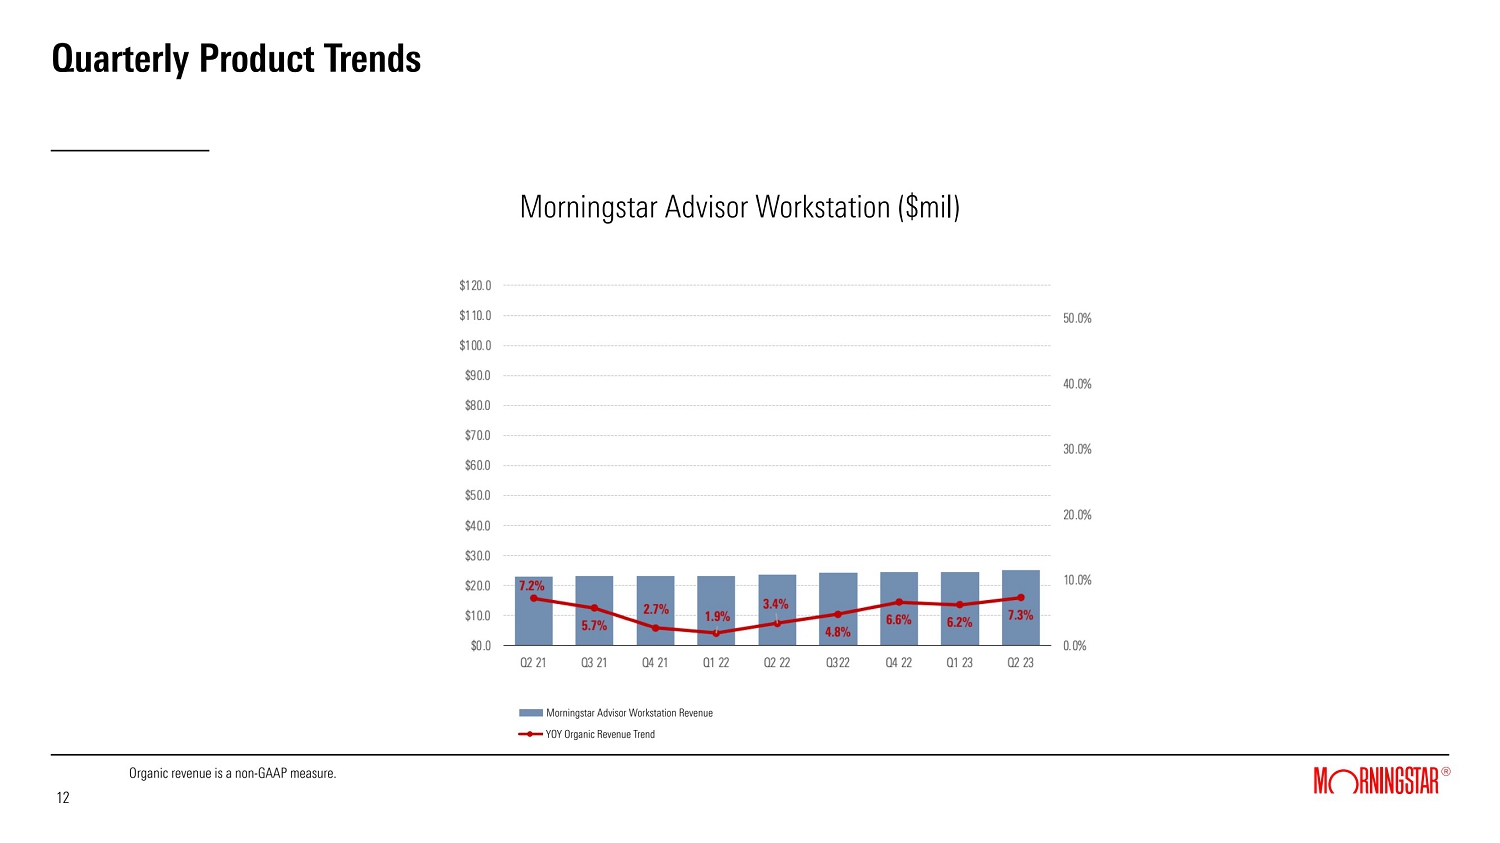
| • | Morningstar Advisor Workstation revenue grew 6.8%, or 7.3% on an organic basis. The January launch of the Investment Planning Experience, a new workflow which helps advisors meet demand for more personalized advice for investors, contributed to upsells with enterprise clients and the expansion of Advisor Workstation's footprint with individual advisors. The Company also integrated new capabilities into the App Hub and launched upgrades to the user experience for core Workstation features to provide a more robust platform experience for advisors. |
| • | Morningstar Indexes revenue grew 25.3%, or 15.1% on an organic basis. The increase in revenue was driven by growth in investable product revenue, supported in part by market gains. Licensed-data revenue also increased, with contributions from LCD-related index data, which was included in organic growth for the month of June. |
Reduction and Shift of China Operations
In July 2022, the Company began to significantly reduce its operations in Shenzhen, China and shift the work related to its global business functions, including global product and software development, managed investment data collection and analysis, and equity data collection and analysis, to other Morningstar locations. Costs related to this transition totaled $7.3 million in the second quarter of 2023, including severance and personnel costs; transformation costs, which consist of professional fees and the temporary duplication of headcount as the Company hires replacement roles in other markets and continues to employ certain Shenzhen-based staff through the transition; and asset impairment costs. Cash outflows for severance paid related to the transition totaled $3.2 million in the second quarter of 2023 and $10.1 million for the year-to-date period.
Page 6 of 15
The Company expects that these activities will be substantially complete by the end of the third quarter of 2023 and will result in lower ongoing run-rate costs from the overall net reduction in the related headcount and certain overhead expenses.
Balance Sheet and Capital Allocation
As of June 30, 2023, the Company had cash, cash equivalents, and investments totaling $378.2 million and $1.2 billion of debt, compared with $414.6 million and $1.1 billion, respectively, as of Dec. 31, 2022.
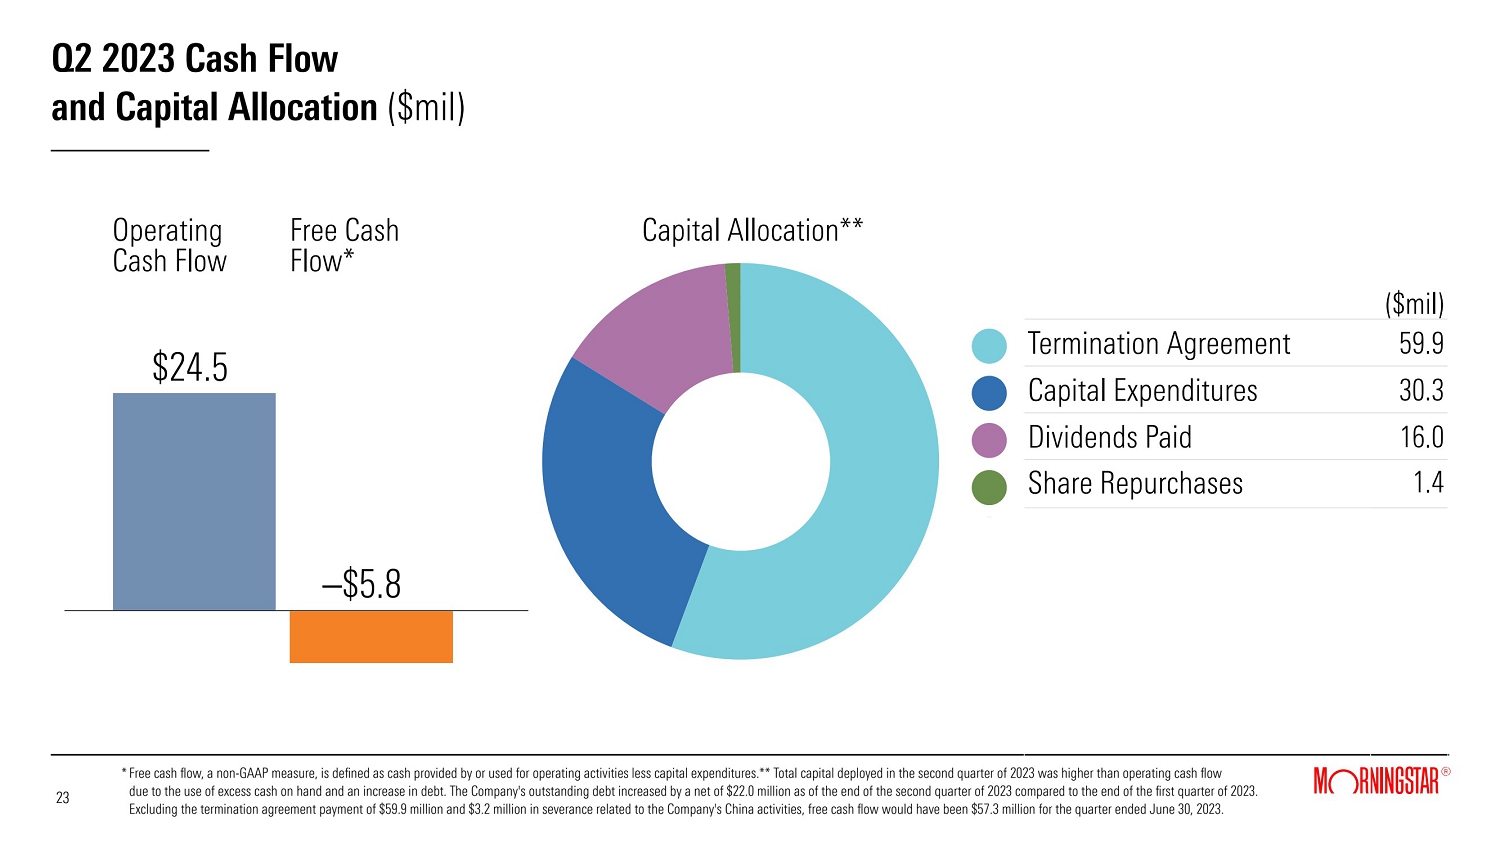
Cash provided by operating activities decreased 64.3% to $24.5 million for the second quarter of 2023, compared to the prior-year period. Free cash flow was negative $5.8 million, compared to positive $37.0 million in the prior-year period. The decreases in cash provided by operating activities and free cash flow were driven by the cash payment of $59.9 million related to the termination of the license agreement with Morningstar Japan K.K. (renamed SBI Global Asset Management Co, Ltd.), which is reflected in "Other assets and liabilities" within operating activities on the Condensed Consolidated Statements of Cash Flows, and $3.2 million in severance paid related to the reduction and shift of the Company's China operations. Excluding the impact of these items and M&A-related earn-out payments in the prior-year period, cash provided by operating activities and free cash flow would have decreased by 19.4% and 25.6%, respectively. These declines were primarily due to lower cash earnings in the quarter, which were impacted by higher interest expense. In addition, the Company paid $16.0 million in dividends in the quarter and repurchased $1.4 million in shares.
Use of Non-GAAP Financial Measures
The tables at the end of this press release include a reconciliation of the non-GAAP financial measures used by the Company to comparable GAAP measures and an explanation of why the Company uses them.
Investor Communication
Morningstar encourages all interested parties — including securities analysts, current shareholders, potential shareholders, and others — to submit questions in writing. Investors and others may send questions about Morningstar’s business to [email protected]. Morningstar will make written responses to selected inquiries available to all investors at the same time in Form 8-Ks furnished to the Securities and Exchange Commission, periodically.
Page 7 of 15
About Morningstar, Inc.
Morningstar, Inc. is a leading provider of independent investment insights in North America, Europe, Australia, and Asia. The Company offers an extensive line of products and services for individual investors, financial advisors, asset managers and owners, retirement plan providers and sponsors, and institutional investors in the debt and private capital markets. Morningstar provides data and research insights on a wide range of investment offerings, including managed investment products, publicly listed companies, private capital markets, debt securities, and real-time global market data. Morningstar also offers investment management services through its investment advisory subsidiaries, with approximately $264 billion in assets under advisement and management as of June 30, 2023. The Company operates through wholly- or majority-owned subsidiaries in 32 countries. For more information, visit www.morningstar.com/company. Follow Morningstar on Twitter @MorningstarInc.
Caution Concerning Forward-Looking Statements
This press release contains forward-looking statements as that term is used in the Private Securities Litigation Reform Act of 1995. These statements are based on our current expectations about future events or future financial performance. Forward-looking statements by their nature address matters that are, to different degrees, uncertain, and often contain words such as “may,” “could,” “expect,” “intend,” “plan,” “seek,” “anticipate,” “believe,” “estimate,” “predict,” “potential,” “prospects,” or “continue.” These statements involve known and unknown risks and uncertainties that may cause the events we discuss not to occur or to differ significantly from what we expect. For us, these risks and uncertainties include, among others, failing to maintain and protect our brand, independence, and reputation; liability related to cybersecurity and the protection of confidential information, including personal information about individuals; compliance failures, regulatory action, or changes in laws applicable to our credit ratings operations, investment advisory, ESG and index businesses; failing to innovate our product and service offerings, or anticipate our clients’ changing needs; prolonged volatility or downturns affecting the financial sector, global financial markets, and the global economy and its effect on our revenue from asset-based fees and our credit ratings business; failing to recruit, develop, and retain qualified employees; liability for any losses that result from errors in our automated advisory tools; inadequacy of our operational risk management and business continuity programs in the event of a material disruptive event; failing to realize the expected business or financial benefits of our acquisitions and investments; failing to scale our operations and increase productivity and its effect on our ability to implement our business plan; artificial intelligence and related new technologies
may present business, compliance, and reputational risks; failing to maintain growth across our businesses in today's fragmented geopolitical, regulatory and cultural world; liability relating to the information and data we collect, store, use, create, and distribute or the reports that we publish or are produced by our software products; the potential adverse effect of our indebtedness on our cash flows and financial flexibility; challenges in accounting for complexities in taxes in the global jurisdictions in which we operate that could materially affect our tax rate; and failing to protect our intellectual property rights or claims of intellectual property infringement against us. A more complete description of these risks and uncertainties can be found in our filings with the Securities and Exchange Commission, including our most recent Annual Report on Form 10-K and Quarterly Report on Form 10-Q. If any of these risks and uncertainties materialize, our actual future results and other future events may vary significantly from what we expect. We do not undertake to update our forward-looking statements as a result of new information or future events.
# # #
Page 8 of 15
Media Relations Contact:
Stephanie Lerdall, +1 312-244-7805, [email protected]
Investor Relations Contact:
Sarah Bush, +1 312-384-3754, [email protected]
©2023 Morningstar, Inc. All Rights Reserved.
MORN-E
Page 9 of 15
Morningstar, Inc. and Subsidiaries
Unaudited Condensed Consolidated Statements of Income
| Three months ended June 30, | Six months ended June 30, | |||||||||||||||||||||||
| (in millions, except per share amounts) | 2023 | 2022 | Change | 2023 | 2022 | Change | ||||||||||||||||||
| Revenue | $ | 504.7 | $ | 470.4 | 7.3 | % | $ | 984.4 | $ | 927.4 | 6.1 | % | ||||||||||||
| Operating expense: | ||||||||||||||||||||||||
| Cost of revenue | 216.4 | 197.6 | 9.5 | % | 435.2 | 388.9 | 11.9 | % | ||||||||||||||||
| Sales and marketing | 109.5 | 91.8 | 19.3 | % | 217.1 | 173.2 | 25.3 | % | ||||||||||||||||
| General and administrative | 90.1 | 87.1 | 3.4 | % | 174.1 | 177.4 | (1.9 | )% | ||||||||||||||||
| Depreciation and amortization | 47.0 | 40.0 | 17.5 | % | 91.8 | 77.6 | 18.3 | % | ||||||||||||||||
| Total operating expense | 463.0 | 416.5 | 11.2 | % | 918.2 | 817.1 | 12.4 | % | ||||||||||||||||
| Operating income | 41.7 | 53.9 | (22.6 | )% | 66.2 | 110.3 | (40.0 | )% | ||||||||||||||||
| Operating margin | 8.3 | % | 11.5 | % | (3.2 | )pp | 6.7 | % | 11.9 | % | (5.2 | )pp | ||||||||||||
| Non-operating income (loss), net: | ||||||||||||||||||||||||
| Interest expense, net | (14.1 | ) | (4.4 | ) | NMF | (27.4 | ) | (6.8 | ) | NMF | ||||||||||||||
| Expense from equity method transaction, net | — | — | —% | (11.8 | ) | — | NMF | |||||||||||||||||
| Other income (loss), net | 4.1 | (10.2 | ) | NMF | 6.8 | (1.2 | ) | NMF | ||||||||||||||||
| Non-operating income (loss), net | (10.0 | ) | (14.6 | ) | (31.5 | )% | (32.4 | ) | (8.0 | ) | NMF | |||||||||||||
| Income before income taxes and equity in investments of unconsolidated entities | 31.7 | 39.3 | (19.3 | )% | 33.8 | 102.3 | (67.0 | )% | ||||||||||||||||
| Equity in investments of unconsolidated entities | (1.8 | ) | (1.8 | ) | —% | (3.1 | ) | (1.4 | ) | NMF | ||||||||||||||
| Income tax expense (benefit) | (6.2 | ) | 7.4 | NMF | 2.2 | 24.7 | (91.1 | )% | ||||||||||||||||
| Consolidated net income | $ | 36.1 | $ | 30.1 | 19.9 | % | $ | 28.5 | $ | 76.2 | (62.6 | )% | ||||||||||||
| Net income per share: | ||||||||||||||||||||||||
| Basic | $ | 0.85 | $ | 0.71 | 19.7 | % | $ | 0.67 | $ | 1.78 | (62.4 | )% | ||||||||||||
| Diluted | $ | 0.84 | $ | 0.70 | 20.0 | % | $ | 0.67 | $ | 1.77 | (62.1 | )% | ||||||||||||
| Weighted average shares outstanding: | ||||||||||||||||||||||||
| Basic | 42.6 | 42.6 | —% | 42.6 | 42.8 | (0.5 | )% | |||||||||||||||||
| Diluted | 42.8 | 42.9 | (0.2 | )% | 42.8 | 43.1 | (0.7 | )% | ||||||||||||||||
NMF - Not meaningful, pp - percentage points
Page 10 of 15
Morningstar, Inc. and Subsidiaries
Unaudited Condensed Consolidated Balance Sheets
| As of June 30, | As of December 31, | |||||||
| (in millions) | 2023 | 2022 | ||||||
| Assets | ||||||||
| Current assets: | ||||||||
| Cash and cash equivalents | $ | 343.3 | $ | 376.6 | ||||
| Investments | 34.9 | 38.0 | ||||||
| Accounts receivable, net | 321.8 | 307.9 | ||||||
| Income tax receivable, net | 15.1 | — | ||||||
| Other current assets | 92.2 | 88.3 | ||||||
| Total current assets | 807.3 | 810.8 | ||||||
| Goodwill | 1,584.7 | 1,571.7 | ||||||
| Intangible assets, net | 518.5 | 548.6 | ||||||
| Property, equipment, and capitalized software, net | 205.6 | 199.4 | ||||||
| Operating lease assets | 173.6 | 191.6 | ||||||
| Investments in unconsolidated entities | 114.8 | 96.0 | ||||||
| Deferred tax asset, net | 11.5 | 10.8 | ||||||
| Other assets | 41.9 | 45.9 | ||||||
| Total assets | $ | 3,457.9 | $ | 3,474.8 | ||||
| Liabilities and equity | ||||||||
| Current liabilities: | ||||||||
| Deferred revenue | $ | 506.3 | $ | 455.6 | ||||
| Accrued compensation | 169.4 | 220.1 | ||||||
| Accounts payable and accrued liabilities | 69.0 | 76.2 | ||||||
| Operating lease liabilities | 36.3 | 37.3 | ||||||
| Current portion of long-term debt | 32.1 | 32.1 | ||||||
| Contingent consideration liability | — | 50.0 | ||||||
| Other current liabilities | 1.8 | 11.2 | ||||||
| Total current liabilities | 814.9 | 882.5 | ||||||
| Operating lease liabilities | 160.3 | 176.7 | ||||||
| Accrued compensation | 23.2 | 20.7 | ||||||
| Deferred tax liability, net | 58.2 | 62.9 | ||||||
| Long-term debt | 1,121.4 | 1,077.5 | ||||||
| Other long-term liabilities | 44.3 | 47.4 | ||||||
| Total liabilities | 2,222.3 | 2,267.7 | ||||||
| Total equity | 1,235.6 | 1,207.1 | ||||||
| Total liabilities and equity | $ | 3,457.9 | $ | 3,474.8 | ||||
Page 11 of 15
Morningstar, Inc. and Subsidiaries
Unaudited Condensed Consolidated Statements of Cash Flows
| Three months ended June 30, | Six months ended June 30, | |||||||||||||||
| (in millions) | 2023 | 2022 | 2023 | 2022 | ||||||||||||
| Operating activities | ||||||||||||||||
| Consolidated net income | $ | 36.1 | $ | 30.1 | $ | 28.5 | $ | 76.2 | ||||||||
| Adjustments to reconcile consolidated net income to net cash flows from operating activities | 52.4 | 61.4 | 61.4 | 103.9 | ||||||||||||
| Changes in operating assets and liabilities, net | (64.0 | ) | (22.8 | ) | (42.0 | ) | (87.9 | ) | ||||||||
| Cash provided by operating activities | 24.5 | 68.7 | 47.9 | 92.2 | ||||||||||||
| Investing activities | ||||||||||||||||
| Capital expenditures | (30.3 | ) | (31.7 | ) | (59.8 | ) | (59.7 | ) | ||||||||
| Acquisitions, net of cash acquired | — | (639.8 | ) | — | (646.6 | ) | ||||||||||
| Purchases of investments in unconsolidated entities | (0.8 | ) | (25.6 | ) | (0.9 | ) | (26.6 | ) | ||||||||
| Other, net | 4.0 | 5.8 | 32.9 | 7.9 | ||||||||||||
| Cash used for investing activities | (27.1 | ) | (691.3 | ) | (27.8 | ) | (725.0 | ) | ||||||||
| Financing activities | ||||||||||||||||
| Common shares repurchased | (1.4 | ) | (91.9 | ) | (1.4 | ) | (202.5 | ) | ||||||||
| Dividends paid | (16.0 | ) | (15.4 | ) | (31.9 | ) | (30.9 | ) | ||||||||
| Repayments of debt | (113.2 | ) | (190.9 | ) | (186.3 | ) | (220.9 | ) | ||||||||
| Proceeds from debt | 135.0 | 865.0 | 230.0 | 1,040.0 | ||||||||||||
| Payment for acquisition-related earn-outs | — | (16.2 | ) | (45.5 | ) | (16.2 | ) | |||||||||
| Other, net | (10.5 | ) | (13.5 | ) | (19.8 | ) | (20.6 | ) | ||||||||
| Cash provided by (used for) financing activities | (6.1 | ) | 537.1 | (54.9 | ) | 548.9 | ||||||||||
| Effect of exchange rate changes on cash and cash equivalents | (0.2 | ) | (17.8 | ) | 1.5 | (19.7 | ) | |||||||||
| Net decrease in cash and cash equivalents | (8.9 | ) | (103.3 | ) | (33.3 | ) | (103.6 | ) | ||||||||
| Cash and cash equivalents-beginning of period | 352.2 | 483.5 | 376.6 | 483.8 | ||||||||||||
| Cash and cash equivalents-end of period | $ | 343.3 | $ | 380.2 | $ | 343.3 | $ | 380.2 | ||||||||
Page 12 of 15
Morningstar, Inc. and Subsidiaries
Supplemental Data (Unaudited)
| Three months ended June 30, | Six months ended June 30, | |||||||||||||||||||||||||||||||
| (in millions) | 2023 | 2022 | Change | Organic (2) | 2023 | 2022 | Change | Organic (1) | ||||||||||||||||||||||||
| Revenue by type (1) | ||||||||||||||||||||||||||||||||
| License-based (3) | $ | 376.0 | $ | 327.5 | 14.8 | % | 12.2 | % | $ | 740.0 | $ | 639.4 | 15.7 | % | 13.2 | % | ||||||||||||||||
| Asset-based (4) | 67.3 | 67.6 | (0.4 | )% | (1.4 | )% | 132.6 | 136.1 | (2.6 | )% | (3.7 | )% | ||||||||||||||||||||
| Transaction-based (5) | 61.4 | 75.3 | (18.5 | )% | (19.5 | )% | 111.8 | 151.9 | (26.4 | )% | (27.3 | )% | ||||||||||||||||||||
| Key product area revenue | ||||||||||||||||||||||||||||||||
| PitchBook | $ | 121.2 | $ | 100.2 | 21.0 | % | 21.0 | % | $ | 236.0 | $ | 192.2 | 22.8 | % | 22.8 | % | ||||||||||||||||
| Morningstar Data | 69.4 | 64.3 | 7.9 | % | 8.3 | % | 136.7 | 127.6 | 7.1 | % | 9.1 | % | ||||||||||||||||||||
| DBRS Morningstar (6) | 54.2 | 65.2 | (16.9 | )% | (15.9 | )% | 101.0 | 134.4 | (24.9 | )% | (23.5 | )% | ||||||||||||||||||||
| Morningstar Direct | 49.9 | 45.8 | 9.0 | % | 9.3 | % | 98.7 | 91.4 | 8.0 | % | 9.5 | % | ||||||||||||||||||||
| Investment Management | 29.4 | 30.0 | (2.0 | )% | (10.7 | )% | 59.0 | 60.8 | (3.0 | )% | (11.3 | )% | ||||||||||||||||||||
| Morningstar Sustainalytics | 29.2 | 25.9 | 12.7 | % | 12.7 | % | 56.5 | 50.6 | 11.7 | % | 14.2 | % | ||||||||||||||||||||
| Workplace Solutions | 27.2 | 26.2 | 3.8 | % | 3.8 | % | 52.4 | 52.8 | (0.8 | )% | (0.8 | )% | ||||||||||||||||||||
| Morningstar Advisor Workstation | 25.2 | 23.6 | 6.8 | % | 7.3 | % | 49.7 | 46.8 | 6.2 | % | 6.8 | % | ||||||||||||||||||||
| As of June 30, | ||||||||||||||||||||||||||||||||
| Assets under management and advisement (approximate) ($bil) | 2023 | 2022 | Change | |||||||||||||||||||||||||||||
| Workplace Solutions | ||||||||||||||||||||||||||||||||
| Managed Accounts | $ | 118.1 | $ | 116.2 | 1.6 | % | ||||||||||||||||||||||||||
| Fiduciary Services | 55.4 | 49.8 | 11.2 | % | ||||||||||||||||||||||||||||
| Custom Models/CIT | 36.9 | 36.5 | 1.1 | % | ||||||||||||||||||||||||||||
| Workplace Solutions (total) | $ | 210.4 | $ | 202.5 | 3.9 | % | ||||||||||||||||||||||||||
| Investment Management | ||||||||||||||||||||||||||||||||
| Morningstar Managed Portfolios | $ | 35.1 | $ | 33.0 | 6.4 | % | ||||||||||||||||||||||||||
| Institutional Asset Management | 10.2 | 9.9 | 3.0 | % | ||||||||||||||||||||||||||||
| Asset Allocation Services | 7.8 | 7.4 | 5.4 | % | ||||||||||||||||||||||||||||
| Investment Management (total) | $ | 53.1 | $ | 50.3 | 5.6 | % | ||||||||||||||||||||||||||
| Asset value linked to Morningstar Indexes ($bil) | $ | 169.8 | $ | 133.9 | 26.8 | % | ||||||||||||||||||||||||||
| Our employees (approximate) | ||||||||||||||||||||||||||||||||
| Worldwide headcount | 12,126 | 10,767 | 12.6 | % | ||||||||||||||||||||||||||||
| Three months ended June 30, | Six months ended June 30, | |||||||||||||||||||||||
| 2023 | 2022 | Change | 2023 | 2022 | Change | |||||||||||||||||||
| Average assets under management and advisement ($bil) | $ | 258.0 | $ | 258.9 | (0.3 | )% | $ | 253.9 | $ | 261.0 | (2.7 | )% | ||||||||||||
(1) Starting with the quarter ended March 31, 2023, the Company updated its revenue-type classifications to account for product areas with more than one revenue type. Prior periods have not been restated to reflect the updated classifications. Revenue from Morningstar Sustainalytics' second-party opinions product was reclassified from license-based to transaction-based. Revenue from Morningstar Indexes data and services products was reclassified from asset-based to license-based. Revenue from DBRS Morningstar's data products was reclassified from transaction-based to license-based.
(2) Organic revenue is a non-GAAP measure that excludes acquisitions, divestitures, the impacts of the adoption of new accounting standards or revisions to accounting practices, and the effect of foreign currency translations. In addition, the calculation of organic revenue growth by product revenue type compares the three and six months ended June 30, 2023 revenue to the prior periods on the basis of the updated classifications.
(3) License-based revenue includes PitchBook, Morningstar Data, Morningstar Direct, Morningstar Sustainalytics' license-based products, Morningstar Indexes data and services products, DBRS Morningstar's data products, Morningstar Advisor Workstation, and other similar products.
(4) Asset-based revenue includes Investment Management, the majority of Workplace Solutions revenue, and Morningstar Indexes.
(5) Transaction-based revenue includes DBRS Morningstar, Morningstar Sustainalytics' second-party opinions product, Internet advertising, and Morningstar-sponsored conferences.
(6) For the three and six months ended June 30, 2023, DBRS Morningstar recurring revenue derived primarily from surveillance, research, and other transaction-related services was 49.9% and 52.5%, respectively. For the three and six months ended June 30, 2022, recurring revenue was 38.4% and 37.2%, respectively.
Page 13 of 15
Morningstar, Inc. and Subsidiaries
Reconciliations of Non-GAAP Measures with the Nearest Comparable GAAP Measures (Unaudited)
To supplement Morningstar’s condensed consolidated financial statements presented in accordance with U.S. Generally Accepted Accounting Principles (GAAP), Morningstar uses the following measures considered as non-GAAP by the Securities and Exchange Commission, including:
| • | consolidated revenue, excluding acquisitions, divestitures, adoption of new accounting standards or revision to accounting practices (accounting changes), and the effect of foreign currency translations (organic revenue), |
| • | consolidated operating income, excluding intangible amortization expense, all mergers and acquisitions (M&A)-related expenses (including M&A-related earn-outs), and items related to the significant reduction and shift of the Company's operations in China (adjusted operating income), |
| • | consolidated operating margin, excluding intangible amortization expense, all M&A-related expenses (including M&A-related earn-outs), and items related to the significant reduction and shift of the Company's operations in China (adjusted operating margin), |
| • | consolidated diluted net income per share, excluding intangible amortization expense, all M&A-related expenses (including M&A-related earn-outs), items related to the significant reduction and shift of the Company's operations in China, and certain non-operating gains/losses (adjusted diluted net income per share), and |
| • | cash provided by or used for operating activities less capital expenditures (free cash flow). |
These non-GAAP measures may not be comparable to similarly titled measures reported by other companies.
Morningstar presents organic revenue because the Company believes this non-GAAP measure helps investors better compare period-over-period results. Morningstar excludes revenue from acquired businesses from its organic revenue growth calculation for a period of 12 months after it completes the acquisition. For divestitures, Morningstar excludes revenue in the prior-year period for which there is no comparable revenue in the current period.
Morningstar presents adjusted operating income, adjusted operating margin, and adjusted net income per share to show the effect of significant acquisition activity, better compare period-over-period results, and improve overall understanding of the underlying performance of the business absent the impact of acquisitions.
In addition, Morningstar presents free cash flow solely as supplemental disclosure to help investors better understand how much cash is available after making capital expenditures. Morningstar's management team uses free cash flow to evaluate the health of its business. Free cash flow should not be considered an alternative to any measure required to be reported under GAAP (such as cash provided by (used for) operating, investing, and financing activities).
Page 14 of 15
| Three months ended June 30, | Six months ended June 30, | |||||||||||||||||||||||
| (in millions) | 2023 | 2022 | Change | 2023 | 2022 | Change | ||||||||||||||||||
| Reconciliation from consolidated revenue to organic revenue: | ||||||||||||||||||||||||
| Consolidated revenue | $ | 504.7 | $ | 470.4 | 7.3 | % | $ | 984.4 | $ | 927.4 | 6.1 | % | ||||||||||||
| Less: acquisitions | (12.7 | ) | — | NMF | (30.9 | ) | — | NMF | ||||||||||||||||
| Less: accounting changes | — | — | — | % | — | — | — | |||||||||||||||||
| Effect of foreign currency translations | 2.4 | — | NMF | 10.7 | — | NMF | ||||||||||||||||||
| Organic revenue | $ | 494.4 | $ | 470.4 | 5.1 | % | $ | 964.2 | $ | 927.4 | 4.0 | % | ||||||||||||
| Reconciliation from consolidated operating income to adjusted operating income: | ||||||||||||||||||||||||
| Consolidated operating income | $ | 41.7 | $ | 53.9 | (22.6 | )% | $ | 66.2 | $ | 110.3 | (40.0 | )% | ||||||||||||
| Add: Intangible amortization expense | 17.7 | 15.6 | 13.5 | % | 35.2 | 29.7 | 18.5 | % | ||||||||||||||||
| Add: M&A-related expenses | 3.0 | 3.9 | (23.1 | )% | 7.2 | 8.8 | (18.2 | )% | ||||||||||||||||
| Add: M&A-related earn-outs (1) | — | — | — | % | — | 7.1 | NMF | |||||||||||||||||
| Add: Severance and personnel expenses (2) | 2.9 | — | NMF | 4.1 | — | NMF | ||||||||||||||||||
| Add: Transformation costs (2) | 2.2 | — | NMF | 6.4 | — | NMF | ||||||||||||||||||
| Add: Asset impairment costs (2) | 2.2 | — | NMF | 2.4 | — | NMF | ||||||||||||||||||
| Adjusted operating income | $ | 69.7 | $ | 73.4 | (5.0 | )% | $ | 121.5 | $ | 155.9 | (22.1 | )% | ||||||||||||
| Reconciliation from consolidated operating margin to adjusted operating margin: | ||||||||||||||||||||||||
| Consolidated operating margin | 8.3 | % | 11.5 | % | (3.2) pp | 6.7 | % | 11.9 | % | (5.2 | ) pp | |||||||||||||
| Add: Intangible amortization expense | 3.5 | % | 3.3 | % | 0.2 pp | 3.6 | % | 3.2 | % | 0.4 | pp | |||||||||||||
| Add: M&A-related expenses | 0.6 | % | 0.8 | % | (0.2) pp | 0.7 | % | 0.9 | % | (0.2 | ) pp | |||||||||||||
| Add: M&A-related earn-outs (1) | — | % | — | % | 0.0 pp | — | % | 0.8 | % | (0.8 | ) pp | |||||||||||||
| Add: Severance and personnel expenses (2) | 0.6 | % | — | % | 0.6 pp | 0.4 | % | — | % | 0.4 | pp | |||||||||||||
| Add: Transformation costs (2) | 0.4 | % | — | % | 0.4 pp | 0.7 | % | — | % | 0.7 | pp | |||||||||||||
| Add: Asset impairment costs (2) | 0.4 | % | — | % | 0.4 pp | 0.2 | % | — | % | 0.2 | pp | |||||||||||||
| Adjusted operating margin | 13.8 | % | 15.6 | % | (1.8) pp | 12.3 | % | 16.8 | % | (4.5 | ) pp | |||||||||||||
| Reconciliation from consolidated diluted net income per share to adjusted diluted net income per share: | ||||||||||||||||||||||||
| Consolidated diluted net income per share | $ | 0.84 | $ | 0.70 | 20.0 | % | $ | 0.67 | $ | 1.77 | (62.1 | )% | ||||||||||||
| Add: Intangible amortization expense | 0.31 | 0.27 | 14.8 | % | 0.61 | 0.51 | 19.6 | % | ||||||||||||||||
| Add: M&A-related expenses | 0.05 | 0.07 | (28.6 | )% | 0.12 | 0.15 | (20.0 | )% | ||||||||||||||||
| Add: M&A-related earn-outs (1) | — | — | — | % | — | 0.16 | NMF | |||||||||||||||||
| Add: Severance and personnel expenses (2) | 0.05 | — | NMF | 0.07 | — | NMF | ||||||||||||||||||
| Add: Transformation costs (2) | 0.04 | — | NMF | 0.11 | — | NMF | ||||||||||||||||||
| Add: Asset impairment costs (2) | 0.04 | — | NMF | 0.04 | — | NMF | ||||||||||||||||||
| Less: Non-operating (gains) losses (3) | (0.03 | ) | 0.13 | NMF | 0.24 | (0.04 | ) | NMF | ||||||||||||||||
| Adjusted diluted net income per share | $ | 1.30 | $ | 1.17 | 11.1 | % | $ | 1.86 | $ | 2.55 | (27.1 | )% | ||||||||||||
| Reconciliation from cash provided by operating activities to free cash flow: | ||||||||||||||||||||||||
| Cash provided by operating activities | $ | 24.5 | $ | 68.7 | (64.3 | )% | $ | 47.9 | $ | 92.2 | (48.0 | )% | ||||||||||||
| Capital expenditures | (30.3 | ) | (31.7 | ) | (4.4 | )% | (59.8 | ) | (59.7 | ) | 0.2 | % | ||||||||||||
| Free cash flow | $ | (5.8 | ) | $ | 37.0 | NMF | $ | (11.9 | ) | $ | 32.5 | NMF | ||||||||||||
NMF - Not meaningful, pp - percentage points
(1) Reflects the impact of M&A-related earn-outs included in current period operating expense (compensation expense), primarily due to the earn-out for Morningstar Sustainalytics.
(2) Reflects costs associated with the significant reduction of the Company's operations in Shenzhen, China, and the shift of work related to its global business functions to other Morningstar locations.
Severance and personnel expenses include severance charges, incentive payments related to early signing of severance agreements, transition bonuses, and stock-based compensation related to the acceleration of vesting of restricted stock unit and market share unit awards. In addition, the reversal of accrued sabbatical liabilities is included in this category.
Transformation costs include professional fees and the temporary duplication of headcount. As the Company hires replacement roles in other markets and shifts capabilities, it expects to continue to employ certain Shenzhen-based staff through the transition period, which will result in elevated compensation costs on a temporary basis.
Asset impairment costs include the write-off or accelerated depreciation of fixed assets in the Shenzhen, China office that are not redeployed, in addition to lease abandonment costs as the Company plans to downsize its office space prior to the lease termination date.
(3) Non-operating (gains) losses in the three and six months ended June 30, 2023 and June 30, 2022, related to unrealized gains and losses on investments and interest expense. In addition, non-operating (gains) losses for the six months ended June 30, 2023 also includes expense from an equity method transaction, net.
Page 15 of 15