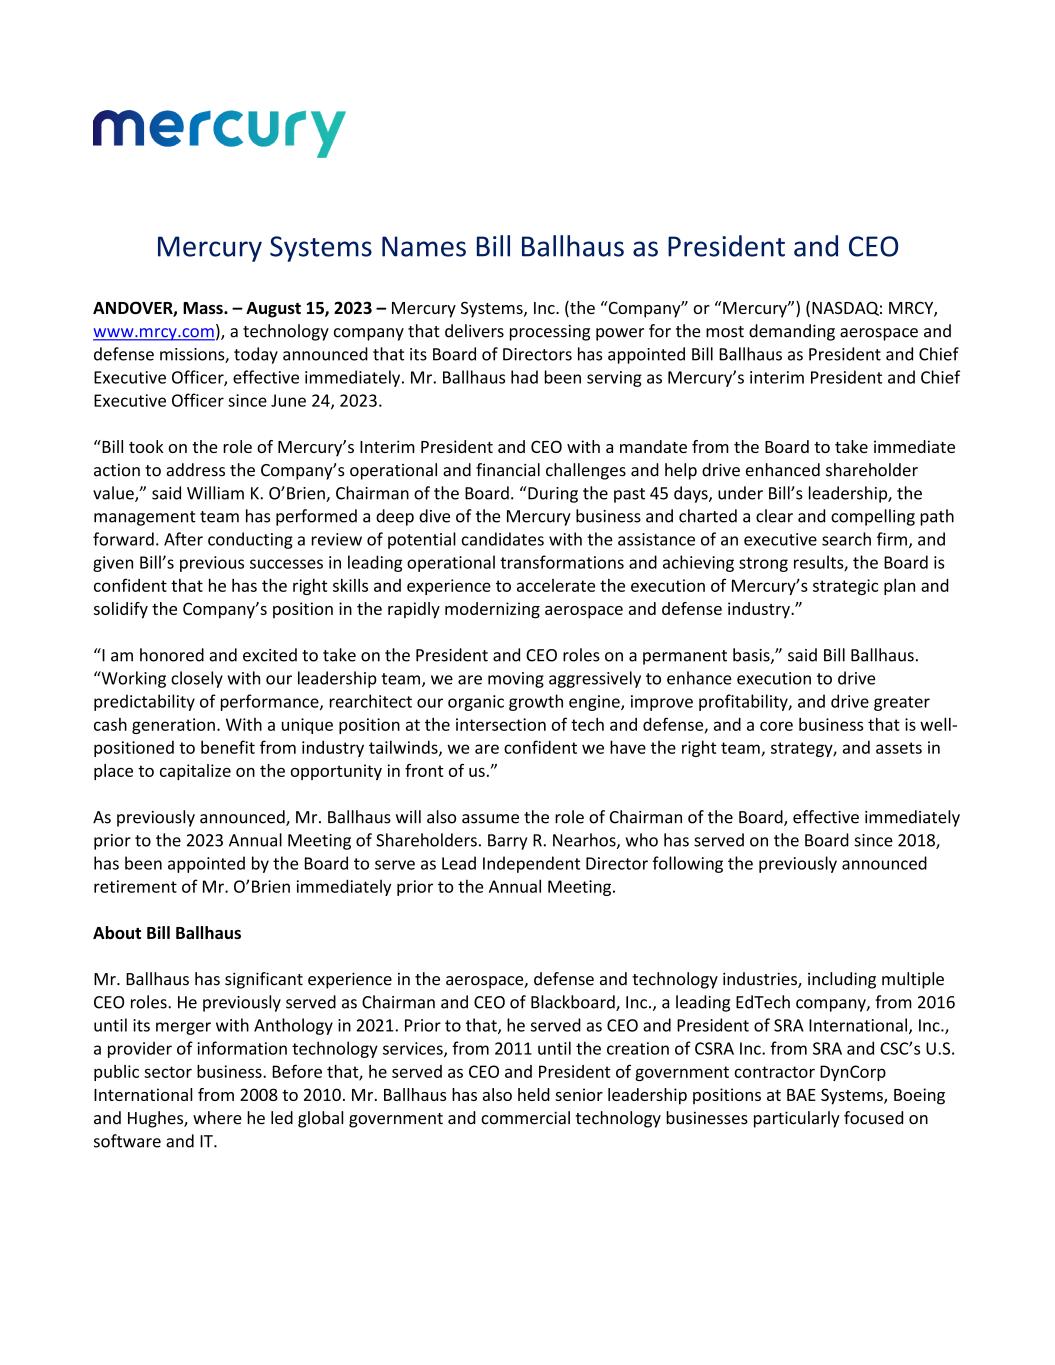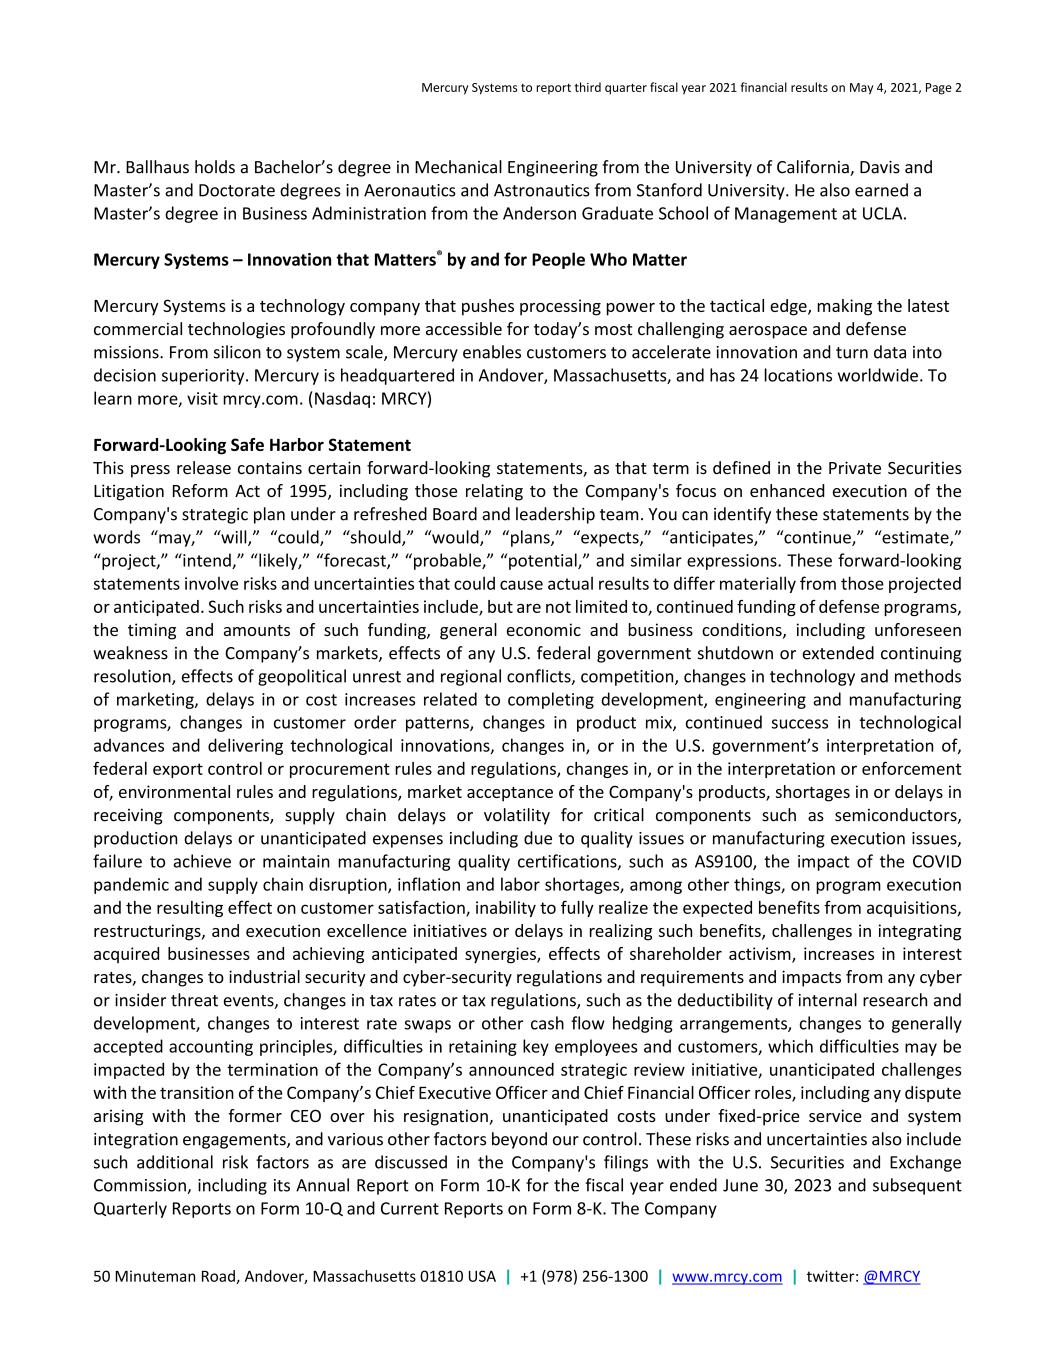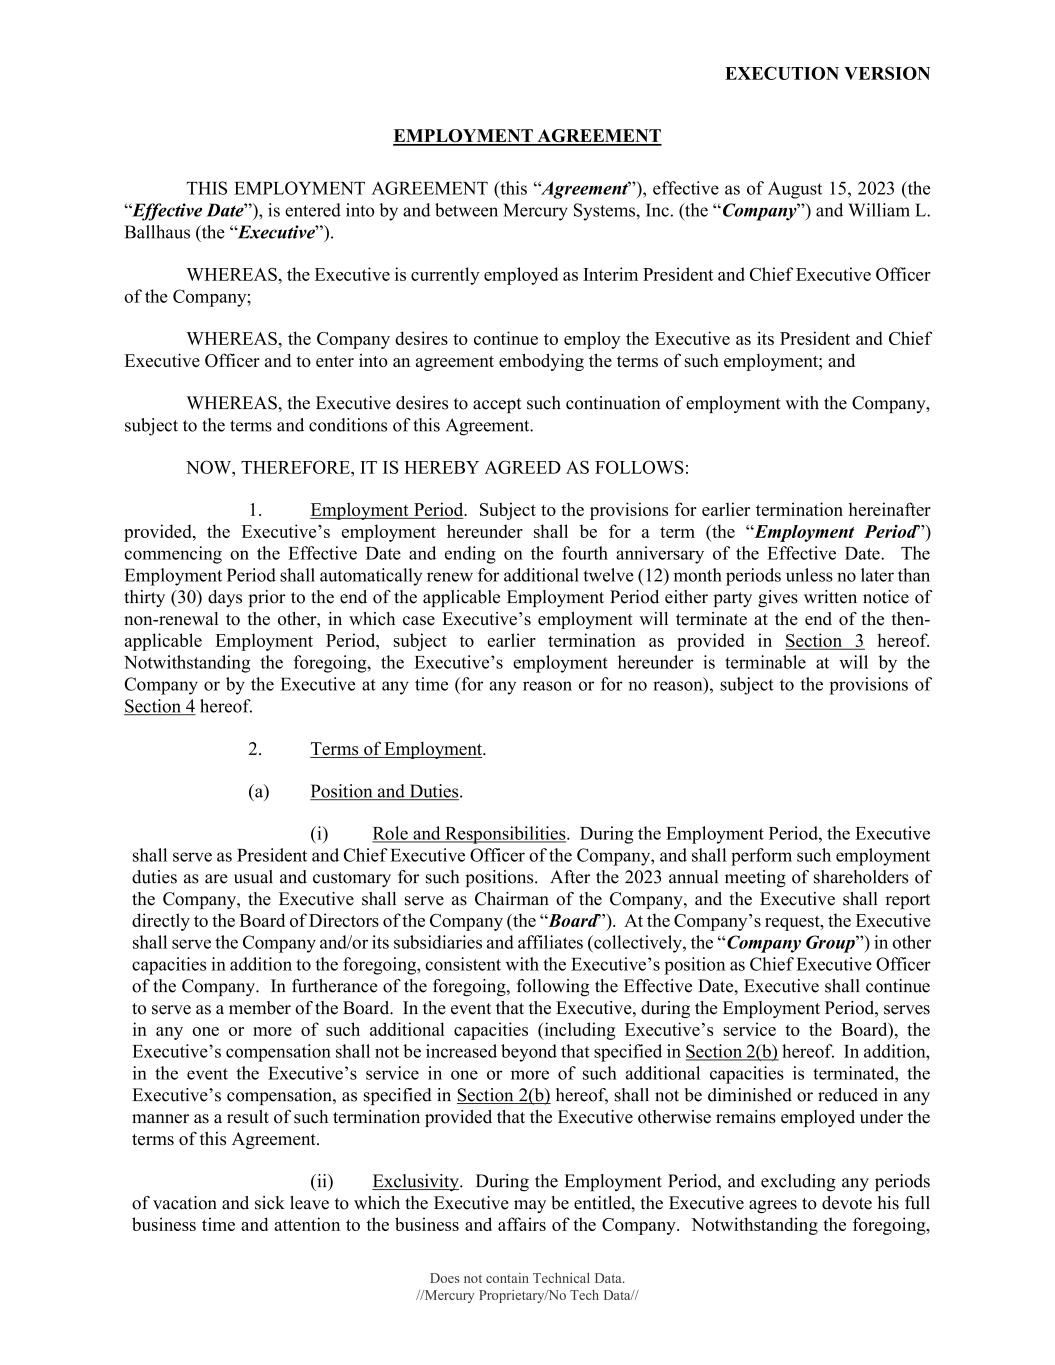
EXECUTION VERSION Does not contain Technical Data. //Mercury Proprietary/No Tech Data// EMPLOYMENT AGREEMENT THIS EMPLOYMENT AGREEMENT (this “Agreement”), effective as of August 15, 2023 (the “Effective Date”), is entered into by and between Mercury Systems, Inc. (the “Company”) and William L. Ballhaus (the “Executive”). WHEREAS, the Executive is currently employed as Interim President and Chief Executive Officer of the Company; WHEREAS, the Company desires to continue to employ the Executive as its President and Chief Executive Officer and to enter into an agreement embodying the terms of such employment; and WHEREAS, the Executive desires to accept such continuation of employment with the Company, subject to the terms and conditions of this Agreement. NOW, THEREFORE, IT IS HEREBY AGREED AS FOLLOWS: 1. Employment Period. Subject to the provisions for earlier termination hereinafter provided, the Executive’s employment hereunder shall be for a term (the “Employment Period”) commencing on the Effective Date and ending on the fourth anniversary of the Effective Date. The Employment Period shall automatically renew for additional twelve (12) month periods unless no later than thirty (30) days prior to the end of the applicable Employment Period either party gives written notice of non-renewal to the other, in which case Executive’s employment will terminate at the end of the then- applicable Employment Period, subject to earlier termination as provided in Section 3 hereof. Notwithstanding the foregoing, the Executive’s employment hereunder is terminable at will by the Company or by the Executive at any time (for any reason or for no reason), subject to the provisions of Section 4 hereof. 2. Terms of Employment. (a) Position and Duties. (i) Role and Responsibilities. During the Employment Period, the Executive shall serve as President and Chief Executive Officer of the Company, and shall perform such employment duties as are usual and customary for such positions. After the 2023 annual meeting of shareholders of the Company, the Executive shall serve as Chairman of the Company, and the Executive shall report directly to the Board of Directors of the Company (the “Board”). At the Company’s request, the Executive shall serve the Company and/or its subsidiaries and affiliates (collectively, the “Company Group”) in other capacities in addition to the foregoing, consistent with the Executive’s position as Chief Executive Officer of the Company. In furtherance of the foregoing, following the Effective Date, Executive shall continue to serve as a member of the Board. In the event that the Executive, during the Employment Period, serves in any one or more of such additional capacities (including Executive’s service to the Board), the Executive’s compensation shall not be increased beyond that specified in Section 2(b) hereof. In addition, in the event the Executive’s service in one or more of such additional capacities is terminated, the Executive’s compensation, as specified in Section 2(b) hereof, shall not be diminished or reduced in any manner as a result of such termination provided that the Executive otherwise remains employed under the terms of this Agreement. (ii) Exclusivity. During the Employment Period, and excluding any periods of vacation and sick leave to which the Executive may be entitled, the Executive agrees to devote his full business time and attention to the business and affairs of the Company. Notwithstanding the foregoing,
2 during the Employment Period, it shall not be a violation of this Agreement for the Executive to (A) manage his personal investments or (B) perform limited activities that the Board (or, after the Effective Date, the Nominating and Governance Committee thereof) has approved in writing, in each case, so long as such activities do not individually or in the aggregate materially interfere or conflict with the performance of the Executive’s duties and responsibilities under this Agreement. The Company and the Executive acknowledge and agree that the Executive shall be permitted to continue the activities described on Exhibit A, Section 1; provided, that the Executive’s time commitment with respect to such activities is not greater than his historical time commitment in more than a de minimis manner and so long as such activities do not individually or in the aggregate materially interfere or conflict with the performance of the Executive’s duties and responsibilities under this Agreement. The Executive agrees to provide information to the Nominating and Governance Committee of the Board at least annually, and upon request, regarding the time commitment and scope of such activities. To the extent that, as of the Effective Date, the Executive is engaged in any activities that are prohibited pursuant to the preceding sentence, including those activities described in Exhibit A, Section 2, the Executive shall have previously informed the Board of such activities and shall terminate the Executive’s engagement in such activities within sixty (60) days of the Effective Date, and a failure to do so shall be deemed a material breach of this Agreement. (iii) Principal Location. During the Employment Period, the Executive shall perform the services required by this Agreement from the Company’s offices in Arlington, Virginia, except for travel to other locations as may be necessary to fulfill the Executive’s duties and responsibilities hereunder. (iv) Security Clearance. During the Employment Period, the Executive shall at all times maintain an active security clearance at the level of the facility security clearance for the Company’s Andover, Massachusetts headquarters. As of August 7, 2023, the security clearance level for the headquarters is Top Secret. (b) Compensation, Benefits, Etc. (i) Base Salary. With retroactive effect as of July 1, 2023, and during the Employment Period, the Executive shall receive a base salary (the “Base Salary”) of $950,000 per annum. The Base Salary shall be paid in accordance with the Company’s normal payroll practices for executive salaries generally, but no less often than monthly. The Base Salary shall be reviewed at least annually by the Human Capital and Compensation Committee (the “HC3”) of the Board. The Base Salary may be modified by the Board in its sole discretion (including upon recommendation of the HC3), and the term “Base Salary” as utilized in this Agreement shall refer to the Base Salary as so modified. (ii) Annual Cash Bonus. In addition to the Base Salary, the Executive shall be eligible to earn, for each fiscal year of the Company ending during the Employment Period beginning with fiscal year 2024, a performance-based bonus (an “Annual Bonus”) under the Company’s annual incentive plan. Executive’s target Annual Bonus under the annual incentive plan adopted by the Board, as modified from time to time, for a fiscal year shall be 150% of the Base Salary in effect at the end of the third quarter of such fiscal year (the “Target Bonus”). The actual amount of Annual Bonus paid to Executive (if any) may range from 0% to 150 % of the Target Bonus based on the Company’s financial performance, positive or negative discretion of the HC3 or the Board, and other factors determined by the HC3 or the Board, in each case as determined by the HC3 or the Board. Unless otherwise set forth in the applicable annual incentive plan or Section 4 below, payment of any Annual Bonus(es), to the extent any Annual Bonus(es) become payable, will be contingent upon the Executive’s continued employment through the applicable payment date, which shall occur on the date on which annual bonuses are paid generally to the Company’s executive officers.
3 (iii) Benefits. During the Employment Period, the Executive (and the Executive’s spouse and/or eligible dependents to the extent provided in the applicable plans and programs) shall be eligible to participate in and be covered under the employee benefit plans and programs maintained by the Company for the benefit of its employees from time to time and on the same basis as other senior executives of the Company, including medical, dental, vision, basic life, short- and long-term disability and AD&D insurance programs and retirement plans, in each case, pursuant to the terms of such plans and programs. Nothing contained in this Section 2(b)(iii) shall create or be deemed to create any obligation on the part of the Company to adopt or maintain any health, welfare, retirement or other benefit plan or program at any time or to create any limitation on the Company’s ability to modify or terminate any such plan or program. (iv) Incentive Equity Awards. During the Employment Period, the Executive shall be eligible to participate in the Mercury Systems, Inc. Amended and Restated 2018 Stock Incentive Plan or any successor thereto (as amended from time to time, the “Stock Incentive Plan”) pursuant to the terms and conditions of the Stock Incentive Plan and any award agreement thereunder. The Executive will receive the awards set forth in subsections (A), (B) and (C) below, with the initial awards described in subsections (A), (B) and (C) below to be granted on the Company’s next annual grant date, which is expected to be August 17, 2023 (the actual date of grant referred to as the “Initial Grant Date”). The number of shares underlying awards granted on the Initial Grant Date, excluding the awards set forth in subsection (B) below, shall be calculated based on the target values set forth below and the average closing price of the Company’s common stock during the 30 calendar days prior to the Initial Grant Date. With respect to grants made after the Initial Grant Date, the awards shall be calculated based on such other price with respect to the Company’s common stock determined by a methodology that applies to all of the Company’s executive officers generally. (A) On the Initial Grant Date, the Executive shall be granted: (i) time- vesting restricted stock pursuant to the Stock Incentive Plan with an aggregate target value of $2,350,000, and (ii) performance-vesting restricted stock with an aggregate target value of $3,400,000. Consistent with annual grants made to other named executive officers of the Company, the Executive shall similarly be eligible for an annual equity award, the aggregate target value, terms and grant of which shall be determined and approved by the Board or the HC3. (B) In connection with his appointment as President and Chief Executive Officer, the Executive will receive a one-time grant of premium-priced stock options under the Stock Incentive Plan (as further described below, the “New Hire Option”). The New Hire Option shall be granted in four (4) tranches as follows: (w) 233,500 shares of the Company’s common stock with an exercise price equal to $42.00 (“Tranche 1”); (x) 233,500 shares of the Company’s common stock with an exercise price equal to $43.00 (“Tranche 2”); (y) 233,500 shares of the Company’s common stock with an exercise price equal to $46.00 (“Tranche 3”); and (z) 233,500 shares of the Company’s common stock with an exercise price equal to $49.00 (“Tranche 4”). Tranche 1 and Tranche 2 shall become vested and exercisable on the third anniversary of the Initial Grant Date (subject to the Executive’s continued employment through such date) and shall expire on the fourth anniversary of the Initial Grant Date. Tranche 3 and Tranche 4 shall become vested and exercisable on the fourth anniversary of the Initial Grant Date (subject to the Executive’s continued employment through such date) and shall expire on the fifth anniversary of the Initial Grant Date. Notwithstanding the foregoing, in the event that the exercise price of any tranche is less than 110% of the closing price of a share of the Company’s common stock on the Initial Grant Date, then the exercise price of such tranche shall be increased to 110% of such closing price (by way of example, if the closing price of a share of the Company’s common stock is $40.00 on the grant date, then the exercise prices for Tranche 1 and Tranche 2 shall be increased to $44.00, while the exercise prices for Tranche 3 and Tranche 4 shall be unaffected). For the avoidance of doubt, the New Hire Option shall constitute a Time-Based Equity Award for purposes of this Agreement.
4 (C) In connection with his appointment as President and Chief Executive Officer, the Executive shall be issued an award of restricted stock under the Stock Incentive Plan with a target value of $3,000,000 (the “Matching Grant”). The Matching Grant will become vested on the third anniversary of the Initial Grant Date if (x) the Executive is employed with the Company as of such third anniversary, (y) the Executive purchases at least $1,500,000 of shares of the Company’s common stock (the “Purchased Shares”) by December 15, 2023, and (z) the Executive continues to own as of such third anniversary a number of shares equal to the Purchased Shares, plus the number of shares of the Company’s common stock that the Executive owns on the Effective Date (excluding unvested awards). For the avoidance of doubt, from and after the date satisfaction of condition in (y) is met and provided that the condition in (z) is met as of the Date of Termination, the Matching Grant shall constitute a Time-Based Equity Award for purposes of this Agreement. In addition, for the purposes of Section 4(b)(iv), the acceleration period for the Matching Grant award will be 36 months rather than 24 months. (v) Expenses. During the Employment Period, the Executive shall be entitled to receive prompt reimbursement for all reasonable business expenses incurred by the Executive in connection with the performance of his duties under this Agreement in accordance with the policies, practices and procedures of the Company provided to employees of the Company. (vi) Fringe Benefits. During the Employment Period, the Executive shall be eligible to receive such fringe benefits and perquisites as are provided by the Company to its employees from time to time, in accordance with the policies, practices and procedures of the Company, and shall receive such additional fringe benefits and perquisites as the Company may, in its discretion, from time-to- time provide. Nothing contained in this Section 2(b)(vi) shall create or be deemed to create any obligation on the part of the Company to adopt, maintain or offer any fringe benefits or perquisites at any time or to create any limitation on the Company’s ability to modify or terminate any such policies, practices and procedures, benefits or perquisites. (vii) Vacation. During the Employment Period, the Executive shall be entitled to paid vacation in accordance with the plans, policies, programs and practices of the Company applicable to its executive officers. (viii) Executive Perquisites. During the Employment Period, the Company shall pay the Executive an allowance in the amount of $12,000 annually intended to be used by the Executive for personal tax and financial planning services. 3. Termination of Employment. (a) Death or Disability. The Executive’s employment shall terminate automatically upon the Executive’s death during the Employment Period. The Company may terminate the Executive’s employment in the event of the Executive’s Disability during the Employment Period. (b) Termination by the Company. The Company may terminate the Executive’s employment during the Employment Period for Cause or without Cause. (c) Termination by the Executive. The Executive’s employment may be terminated by the Executive for any reason, including with or without Good Reason. (d) Notice of Termination. Any termination by the Company or by the Executive shall be communicated by a Notice of Termination to the other parties hereto given in accordance with Section 10(b) hereof. The failure by the Executive or the Company to set forth in the Notice of Termination any fact or circumstance which contributes to a showing of Good Reason or Cause shall not waive any right of
5 the Executive or the Company, respectively, hereunder or preclude the Executive or the Company, respectively, from asserting such fact or circumstance in enforcing the Executive’s or the Company’s rights hereunder. If the Executive delivers a Notice of Termination to the Company, the Company may elect by written notice to the Executive to change the Date of Termination to an earlier date than the date in such Notice of Termination. Such change to the Date of Termination shall not affect the Company’s rights to dispute any assertion by the Executive, shall only affect the actual Date of Termination and, for the avoidance of doubt, will in no event be deemed a termination by the Company without Cause. (e) Termination of Offices and Directorships; Return of Property. Upon termination of the Executive’s employment for any reason, unless otherwise specified in a written agreement between the Executive and the Company, the Executive shall be deemed to have resigned from all offices, directorships, and other employment positions if any, then held with the Company Group, and shall take all actions reasonably requested by the Company to effectuate the foregoing. In addition, upon the termination of the Executive’s employment for any reason, the Executive agrees to return to the Company all documents of the Company Group (and all copies thereof) and all other Company Group property that the Executive has in his possession, custody or control. Such property includes, without limitation: (i) any materials of any kind that the Executive knows contain or embody any proprietary or confidential information of the Company Group (and all reproductions thereof), (ii) computers (including, but not limited to, laptop computers, desktop computers and similar devices) and other portable electronic devices (including, but not limited to, tablet computers), cellular phones/smartphones, credit cards, phone cards, entry cards, identification badges and keys, and (iii) any correspondence, drawings, manuals, letters, notes, notebooks, reports, programs, plans, proposals, financial documents, or any other documents concerning the customers, business plans, marketing strategies, products and/or processes of the Company Group and any information received from the Company Group regarding third parties. 4. Obligations of the Company upon Termination. In the event that the Executive’s employment under this Agreement terminates during the Employment Period for any reason, the Company will pay or provide to the Executive: (i) any earned but unpaid Base Salary, (ii) reimbursement of any business expenses incurred by the Executive prior to the Date of Termination that are reimbursable in accordance with Section 2(b)(v) hereof and (iii) any vested amounts due to the Executive under any plan, program or policy of the Company (together, the “Accrued Obligations”). The Accrued Obligations described in clauses (i) – (ii) of the preceding sentence shall be paid within 30 days after the Date of Termination (or such earlier date as may be required by applicable law) and the Accrued Obligations described in clause (iii) of the preceding sentence shall be paid in accordance with the terms of the governing plan or program. (a) Death or Disability. If the Executive’s employment with the Company is terminated during the Employment Period (x) due to the Executive’s death or (y) by the Company due to the Executive’s Disability, then subject to and conditioned upon compliance with Sections 4(d), 4(f) (in the event of a termination due to the Executive’s Disability), and 5 (in the event of a termination due to the Executive’s Disability) hereof, in addition to the Accrued Obligations: (i) Equity Acceleration – Time-Based Equity Awards. As of the Date of Termination, any unvested portion of each outstanding equity award that is subject solely to time-based vesting (a “Time-Based Equity Award”) held by the Executive shall vest and become exercisable or nonforfeitable; provided, however, that, the settlement of any awards subject to Section 409A (as defined below) shall occur at the time otherwise contemplated by the associated award agreement, subject to Sections 4(d) (in the event of a termination due to the Executive’s Disability), 4(f) and 10(d). If the Executive’s employment terminates pursuant to this Section 4(a), the New Hire Option shall be exercisable by the Executive (or the Executive’s estate) through twenty-four (24) months from the Date of Termination (or, if earlier, the originally scheduled expiration date).
6 (ii) Equity Acceleration – Performance-Based Equity Awards. Each outstanding equity award that is subject to performance-based vesting (a “Performance-Based Equity Award”) held by the Executive shall remain eligible to vest based on actual performance through the end of the applicable performance period. Any unvested Performance-Based Equity Award eligible to vest pursuant to this Section 4(a)(ii) shall become vested on the date, and to the extent, it would have otherwise become vested absent the Executive’s termination of employment; provided, however, that, the settlement of any awards subject to Section 409A shall occur at the time otherwise contemplated by the associated award agreement, subject to Sections 4(d), 4(f) (in the event of a termination due to the Executive’s Disability) and 10(d). (b) Without Cause, For Good Reason, or Non-Renewal of Employment Period (Outside of Change of Control Protection Period). If the Executive’s employment with the Company is terminated during the Employment Period (x) by the Company without Cause (for the avoidance of doubt, which shall not include a termination of the Executive’s employment by reason of the Executive’s Disability), (y) by the Executive for Good Reason, or (z) as a result of the Company’s non-renewal of any current or renewed Employment Period (each such termination referred to in clauses (x), (y) and (z), a “Qualifying Termination”), in each case, outside of the Change of Control Protection Period (as defined below), then, subject to and conditioned upon compliance with Sections 4(d), 4(f), 5 and 10(d) hereof, in addition to the Accrued Obligations: (i) Cash Salary Severance. The Company shall continue to pay to the Executive the Executive’s Base Salary in effect on the Date of Termination (provided, however, that if Executive terminates for Good Reason because of the Company’s reduction of the Executive’s Base Salary, then the Base Salary in effect before such material reduction will be the one continued) during the period beginning on the Date of Termination and ending on the twenty-four (24)-month anniversary of the Date of Termination in equal installments in accordance with the Company’s regular payroll practices as of the Date of Termination, with the first payment being due and payable on the Company’s next regular payday for executive officers following the sixty (60)-day anniversary of the Date of Termination (and such first payment shall be retroactive to the day immediately following the Executive’s Date of Termination). Notwithstanding the foregoing, the timing of such payments may be accelerated to the extent provided under Section 4(c)(i). (ii) Cash Bonus Severance. The Executive shall be paid an amount equal to two times (2.0x) the Target Bonus for the year in which the Date of Termination occurs (the “Bonus Severance”) (provided, however, that if Executive terminates for Good Reason because of the Company’s reduction of the Executive’s Target Bonus, then the Target Bonus in effect before such reduction will be the one used in this calculation). The Bonus Severance shall be payable in a single lump-sum payment within sixty (60) days following the Date of Termination. (iii) Pro-Rata Bonus. The Executive shall be paid an amount equal to the pro- rata portion of the Annual Bonus that would have otherwise been earned by the Executive (if any) for the year in which the Date of Termination occurs (pro-rated based on the number of days that the Executive was employed by the Company during such year), based on actual Company performance during the full year and target performance for any qualitative measures applicable solely to the Executive (the “Pro-Rata Bonus”). The Pro-Rata Bonus shall be payable no later than the date on which annual bonuses are paid generally to executive officers of the Company for the applicable year, but in all events within two and a half months following the fiscal year in which the Date of Termination occurs. (iv) Equity Acceleration – Time-Based Equity Awards. As of the Date of Termination, any portion of each outstanding Time-Based Equity Award held by the Executive in which the Executive would have vested if the Executive had remained employed with the Company for an
7 additional twenty-four (24) months after the Date of Termination shall vest and become exercisable or nonforfeitable; provided, however, that, the settlement of any awards subject to Section 409A shall occur at the time otherwise contemplated by the associated award agreement. Notwithstanding the foregoing, any such Time-Based Equity Awards that do not vest and become exercisable or nonforfeitable in accordance with this Section 4(b)(iv) shall remain outstanding following the Date of Termination for the sole purpose of determining whether a Change of Control occurs until the earlier of (x) the occurrence of a Change of Control, (y) the three (3)-month anniversary of the Date of Termination and (z) the date such awards were otherwise scheduled to expire or terminate in accordance with their terms; provided, however, that, for the avoidance of doubt, no such awards shall be eligible to vest during such three (3)-month period except as otherwise provided in Section 4(c)(iv) below and the Executive shall not be entitled to any other benefit (economic or otherwise) with respect to such Time-Based Equity Award during such period. (v) Equity Acceleration – Performance-Based Equity Awards. All of the Executive’s unvested Performance-Based Equity Awards shall remain outstanding following the Date of Termination for the sole purpose of determining whether a Change of Control occurs until the earlier of (x) the occurrence of a Change of Control, (y) the three (3)-month anniversary of the Date of Termination and (z) the date such awards were otherwise scheduled to expire or terminate in accordance with their terms; provided, however, that, for the avoidance of doubt, only a pro-rated portion of such awards shall be eligible to vest during such three (3)-month period in accordance with the following sentence (except as otherwise provided in Section 4(c)(v) below) and the Executive shall not otherwise be entitled to any other benefit (economic or otherwise) during such period with respect to such Performance-Based Equity Awards. Following the three (3)-month anniversary of the Date of Termination, a pro-rated portion of each outstanding Performance-Based Equity Award held by the Executive shall remain outstanding and eligible to vest (pro-rated based on the number of days the Executive was employed by the Company during the applicable vesting period) based on actual performance through the end of the applicable performance period. Except as set forth in the first sentence of this Section 4(b)(v), any unvested Performance-Based Equity Award eligible to vest pursuant to this Section 4(b)(v) shall become vested and exercisable or nonforfeitable on the date, and to the extent, it would have otherwise become vested absent the Executive’s termination of employment. (vi) COBRA. During the period commencing on the Date of Termination and ending on the earlier of the twenty-four (24)-month anniversary of the Date of Termination or the date that the Executive becomes eligible for substantially similar benefits under the health insurance policy of any subsequent employer (the “COBRA Period”), subject to the Executive’s valid election to continue healthcare coverage under Section 4980B of the Internal Revenue Code and the regulations thereunder (together, the “Code”), the Company shall continue to provide the Executive and the Executive’s eligible dependents with coverage under its group health plans at active employee rates, provided, however, that (A) if any plan pursuant to which such benefits are provided is not, or ceases prior to the expiration of the period of continuation coverage to be, exempt from the application of Section 409A under Treasury Regulation Section 1.409A-1(a)(5), or (B) the Company is otherwise unable to continue to cover the Executive under its group health plans without incurring penalties (including without limitation, pursuant to Section 2716 of the Public Health Service Act or the Patient Protection and Affordable Care Act), then, in either case, an amount equal to each remaining Company subsidy shall thereafter be paid to the Executive in substantially equal monthly installments over the continuation coverage period (or the remaining portion thereof); provided, further, that, absent earlier termination of the COBRA Period, on the Company’s first payroll date following the eighteen (18)-month anniversary of the Date of Termination, the Company will pay the remaining Company subsidies to the Executive in a lump sum cash payment. Notwithstanding anything in the foregoing to the contrary, in the event that a Change of Control is consummated during the three (3)-month period following the Date of Termination, then Executive will immediately cease to be entitled to the payments and benefits described in this Section 4(b), to the extent
8 not already received, and will instead be entitled to receive the payments described in Section 4(c) below, subject to adjustment to avoid a duplication of payments or benefits. (c) Without Cause, For Good Reason, or Non-Renewal of Employment Period (Within Change of Control Protection Period). If the Executive’s employment with the Company is terminated during the Employment Period as a result of a Qualifying Termination within three (3) months prior to or twenty-four (24) months following a Change of Control (the “Change of Control Protection Period”), then, subject to and conditioned upon compliance with Sections 4(d), 4(f), 5 and 10(d) hereof, in addition to the Accrued Obligations, in lieu of any severance benefits under Section 4(b) above: (i) Cash Salary Severance. To the extent the Change of Control constitutes a “change in control event” (as defined in Treasury Regulation §1.409A-3(i)(5)) (“409A Change in Control”), the Company shall pay to the Executive an amount equal to three times (3.0x) the Executive’s Base Salary in effect on the Date of Termination (provided, however, that if Executive terminates for Good Reason because of the Company’s reduction of the Executive’s Base Salary, then the Base Salary in effect before such material reduction will be the one used in this calculation) (the “CoC Salary Severance”), payable in a single lump-sum payment within sixty (60) days following the Date of Termination or the date the Change of Control is consummated, whichever is later. To the extent the Change of Control does not constitute a 409A Change in Control, the CoC Salary Severance shall instead be paid during the period beginning on the Date of Termination and ending on the twenty-four (24)-month anniversary of the Date of Termination in equal installments in accordance with the Company’s regular payroll practices as of the Date of Termination, with the first payment being due and payable on the Company’s next regular payday for executives following the sixty (60)-day anniversary of the Date of Termination (and such first payment shall be retroactive to the day immediately following the Executive’s Date of Termination). (ii) Cash Bonus Severance. The Executive shall be paid an amount equal to three times (3.0x) the Target Bonus for the year in which the Date of Termination occurs (the “CoC Bonus Severance”) (provided, however, that if Executive terminates for Good Reason because of the Company’s reduction of the Executive’s Target Bonus, then the Target Bonus in effect before such reduction will be the one used in this calculation). The CoC Bonus Severance shall be payable in a single lump-sum payment within sixty (60) days following the Date of Termination or the date the Change of Control is consummated, whichever is later. (iii) Pro-Rata Bonus. The Executive shall be paid an amount equal to the pro- rata portion of the Annual Bonus for the year in which the Date of Termination occurs (pro-rated based on the number of days the Executive was employed by the Company during such year), based on the greater of actual or target performance as of the Date of Termination and payable in a single lump-sum payment within sixty (60) days following the Date of Termination or the date the Change of Control is consummated, whichever is later. (iv) Equity Acceleration – Time-Based Equity Awards. As of the Date of Termination or the date of consummation of the Change of Control, whichever is later, any unvested portion of each outstanding Time-Based Equity Award held by the Executive as of the date of such Change of Control shall vest and become exercisable or nonforfeitable; provided, however, that, the settlement of any awards subject to Section 409A shall occur at the time otherwise contemplated by the associated award agreement. (v) Equity Acceleration – Performance-Based Equity Awards. As of the Date of Termination or the date of consummation of the Change of Control, whichever is later, any unvested outstanding Performance-Based Equity Awards held by the Executive as of the date of such Change of Control shall become vested and exercisable or nonforfeitable based on the greater of actual or target
9 performance as of the Date of Termination; provided, however, that, the settlement of any awards subject to Section 409A shall occur at the time otherwise contemplated by the associated award agreement. (vi) COBRA. During the COBRA Period, subject to the Executive’s valid election to continue healthcare coverage under Section 4980B of the Code, the Company shall continue to provide the Executive and the Executive’s eligible dependents with coverage under its group health plans at active employee rates, provided, however, that (A) if any plan pursuant to which such benefits are provided is not, or ceases prior to the expiration of the period of continuation coverage to be, exempt from the application of Section 409A under Treasury Regulation Section 1.409A-1(a)(5), or (B) the Company is otherwise unable to continue to cover the Executive under its group health plans without incurring penalties (including without limitation, pursuant to Section 2716 of the Public Health Service Act or the Patient Protection and Affordable Care Act), then, in either case, an amount equal to each remaining Company subsidy shall thereafter be paid to the Executive in substantially equal monthly installments over the continuation coverage period (or the remaining portion thereof); provided, further, that, absent earlier termination of the COBRA Period, on the Company’s first payroll date following the eighteen (18)-month anniversary of the Date of Termination, the Company will pay the remaining Company subsidies to the Executive in a lump sum cash payment. In the event that the Qualifying Termination occurs prior to the Change of Control, for the avoidance of doubt, any payments or benefits already received by the Executive pursuant to Section 4(b) shall be taken into account (or deducted from) any corresponding payments or benefits the Executive becomes entitled to pursuant this Section 4(c) and, to the extent payments under Section 4(b)(i) commenced prior to the Change of Control, payments under Section 4(c)(i) shall be made (or, in the case of a Change of Control that is not a 409A Change in Control, continue to be made) not later than the second (2nd) payroll date following the Change of Control. (d) Release. Notwithstanding the foregoing, it shall be a condition to the Executive’s (or the Executive’s estate) right to receive the amounts provided for in Section 4(a), Sections 4(b) and Sections 4(c) hereof that the Executive (or the Executive’s estate) execute and deliver to the Company an effective release of claims in substantially the form attached hereto as Exhibit B (the “Release”) within twenty-one (21) days (or, to the extent required by law to constitute a full release of age-discrimination related claims, forty-five (45) days) following the Date of Termination and that the Executive (or the Executive’s estate) not revoke such Release during any applicable revocation period. (e) For Cause or Without Good Reason. If the Executive’s employment is terminated for any reason not described in Sections 4(a), 4(b) or 4(c) hereof, the Company will pay only the Accrued Obligations to the Executive, and the Executive’s equity awards will be subject to the terms and conditions in their respective award agreements and the Stock Incentive Plan. (f) Six-Month Delay. Notwithstanding anything to the contrary in this Agreement, no compensation or benefits, including without limitation any severance payments or benefits payable under Section 4 hereof, shall be paid to the Executive during the six (6)-month period following the Executive’s “separation from service” from the Company (within the meaning of Section 409A, a “Separation from Service”) if the Company determines that paying such amounts at the time or times indicated in this Agreement would be a prohibited distribution under Section 409A(a)(2)(B)(i) of the Code. If the payment of any such amounts is delayed as a result of the previous sentence, then on the first day of the seventh month following the date of Separation from Service (or such earlier date upon which such amount can be paid under Section 409A without resulting in a prohibited distribution, including as a result of the Executive’s death), the Company shall pay the Executive a lump-sum amount equal to the cumulative amount that would have otherwise been payable to the Executive during such period.
10 (g) Exclusive Benefits. Except as expressly provided in this Section 4 or any equity award agreement between the Executive and the Company, the Executive shall not be entitled to any additional payments or benefits upon or in connection with the Executive’s termination of employment. (h) Definitions. For purposes of this Agreement, the following terms shall have the meanings indicated below: (i) “Cause” shall mean the occurrence of any one or more of the following events unless, with respect to clauses (A), (D), (E), (F), or (G), the Executive fully corrects the circumstances constituting Cause (provided such circumstances are capable of correction) within fifteen (15) days after receipt of the Notice of Termination (as defined below): (A) the Executive’s breach of fiduciary duty, breach of duty of loyalty, or willful and continued failure to perform substantially the duties and responsibilities of the Executive’s position with the Company Group after a written demand for performance is delivered to the Executive or the Executive’s gross negligence in the performance of his duties for the Company Group; (B) the Executive’s commission of, or a plea of nolo contendere to, a felony under the laws of the United States or any state thereof or any crime involving dishonesty or moral turpitude (or any similar crime in any jurisdiction outside the United States); (C) the Executive’s willful engagement in fraud or dishonesty with respect to any member of the Company Group or other misconduct which is, or is reasonably expected to be, materially injurious to any member of the Company Group; (D) the Executive’s unauthorized use or disclosure of confidential information or trade secrets of the Company Group; (E) any act or omission of the Executive that constitutes a material breach by the Executive of (x) any of his obligations under any agreement between any member of the Company Group and Executive (including, without limitation, this Agreement, any restrictive covenant obligations set forth in any equity award agreement, the Confidentiality Agreement, and the Director Confidentiality Agreement entered into between Executive and the Company), or (y) any material Company policy; (F) the Executive’s failure to cooperate with, or comply with instructions relating to any internal investigation by the Company Group or administrative, regulatory or judicial proceeding or investigation involving any member of the Company Group upon request by the Company Group (including, but not limited to, any instruction to preserve documentation related thereto); (G) any act, omission or statement by the Executive which is, or is reasonably expected to be, materially injurious to any member of the Company Group (including acts regarding sexual harassment or discrimination); or (H) the Executive’s failure to obtain and/or retain security clearances necessary for him to perform his duties and responsibilities for the Company. For purposes of this definition of “Cause,” no act, or failure to act, on Executive’s part shall be deemed “willful” unless committed or omitted by the Executive in bad faith and without reasonable belief that the Executive’s act or failure to act was in, or not opposed to, the best interest of the Company.
11 (ii) “Change of Control” shall mean the occurrence of any of the following: (A) Any “Person,” as such term is used in Sections 13(d) and 14(d) of the Exchange Act (other than the Company, any of its subsidiaries, or any trustee, fiduciary or other person or entity holding securities under any employee benefit plan or trust of the Company or any of its subsidiaries), together with all “affiliates” and “associates” (as such terms are defined in Rule 12b-2 under the Exchange Act) of such person, shall become the “beneficial owner” (as such term is defined in Rule 13d-3 under the Exchange Act), directly or indirectly, of securities of the Company representing thirty percent (30%) or more of the combined voting power of the Company’s then outstanding securities having the right to vote in an election of the Board (“Voting Securities”) (in such case other than as a result of an acquisition of securities directly from the Company or an acquisition of securities involving a Corporate Transaction of the type described in the exclusion set forth in clause (C) below); or (B) Persons who, as of the Effective Date, constitute the Company’s Board (the “Incumbent Directors”) cease for any reason, including, without limitation, as a result of a tender offer, proxy contest, merger or similar transaction, to constitute at least a majority of the Board, provided that any person becoming a director of the Company subsequent to the Effective Date shall be considered an Incumbent Director if such person’s election was approved by or such person was nominated for election by either (x) a vote of at least a majority of the Incumbent Directors or (y) a vote of at least a majority of the Incumbent Directors who are members of a nominating committee comprised, in the majority, of Incumbent Directors; but provided further, that any such person whose initial assumption of office is in connection with an actual or threatened election contest relating to the election of members of the Board or other actual or threatened solicitation of proxies or consents by or on behalf of a Person other than the Board, including by reason of agreement intended to avoid or settle any such actual or threatened contest or solicitation, shall not be considered an Incumbent Director; or (C) The consummation of a consolidation, merger or consolidation or sale or other disposition of all or substantially all of the assets of the Company (a “Corporate Transaction”); excluding, however, a Corporate Transaction in which the shareholders of the Company immediately prior to the Corporate Transaction, would, immediately after the Corporate Transaction, beneficially own (as such term is defined in Rule 13d-3 under the Exchange Act), directly or indirectly, shares representing in the aggregate more than fifty percent (50%) of the voting shares of the corporation issuing cash or securities in the Corporate Transaction (or of its ultimate parent corporation, if any). Notwithstanding the foregoing, a “Change of Control ” shall not be deemed to have occurred for purposes of the foregoing clause (A) solely as the result of an acquisition of securities by the Company that, by reducing the number of shares of Voting Securities outstanding, increases the proportionate number of shares of Voting Securities beneficially owned by any person to thirty percent (30%) or more of the combined voting power of all then outstanding Voting Securities; provided, however, that if any person referred to in this sentence shall thereafter become the beneficial owner of any additional shares of Voting Securities (other than pursuant to a stock split, stock dividend, or similar transaction or as a result of an acquisition of securities directly from the Company) and immediately thereafter beneficially owns thirty percent (30%) or more of the combined voting power of all then outstanding Voting Securities, then a “Change of Control” shall be deemed to have occurred for purposes of the foregoing clause (A) . (iii) “Date of Termination” shall mean the date on which the Executive’s employment with the Company terminates. (iv) “Disability” shall mean that, due to the Executive’s incapacity due to physical or mental illness, (A) the Executive shall have been, or is determined by the Board as reasonably likely to be, absent from the full-time performance of the Executive’s duties with the Company for a period
12 of ninety (90) calendar days in the aggregate in any twelve (12) month period, (B) the Company shall have given the Executive a Notice of Termination for Disability, and (C) within thirty (30) days after such Notice of Termination is given, the Executive shall not have returned to the full-time performance of the Executive’s duties (or it remains the case that the Executive is reasonably likely to be absent for such period as determined by the Board). (v) “Good Reason” shall mean the occurrence of any one or more of the following events without the Executive’s prior written consent, unless the Company fully corrects the circumstances constituting Good Reason (provided such circumstances are capable of correction) as provided below: (A) a material diminution in the Executive’s responsibilities, authority or duties as in effect on the Effective Date; (B) a change in the Executive’s title such that he is no longer Chief Executive Officer and Chairman of the Company, except for a change removing the Executive’s Chairman title (but not the Chief Executive Officer title) where the change was effectuated pursuant to an approved shareholder proposal to separate the titles of Chief Executive Officer and Chairman of the Company; (C) the Company’s reduction of the Executive’s Base Salary or Target Bonus, except for, in either case, across-the-board reductions similarly affecting all or substantially all named executive officers of the Company; (D) the Company’s material reduction of the aggregate target value of the Executive’s annual equity award, except for across-the-board reductions similarly affecting all or substantially all named executive officers of the Company; or (E) a material change in the geographic location at which the Executive is required to provide services to the Company (but, for the avoidance of doubt, not on account of business travel and not any relocation where the Executive is given the opportunity to work remotely). Notwithstanding the foregoing, the Executive will not be deemed to have resigned for Good Reason unless (1) the Executive provides the Company with written notice setting forth in reasonable detail the facts and circumstances claimed by the Executive to constitute Good Reason within sixty (60) days after the date of the occurrence of any event that the Executive knows or should reasonably have known to constitute Good Reason, (2) the Company fails to cure such acts or omissions within thirty (30) days following its receipt of such notice, and (3) the effective date of the Executive’s termination for Good Reason occurs no later than sixty (60) days after the expiration of the Company’s cure period. (vi) “Notice of Termination” shall mean a written notice which (i) indicates the specific termination provision in this Agreement relied upon, (ii) sets forth in reasonable detail the facts and circumstances claimed to provide a basis for termination of the Executive’s employment under the provision so indicated and (iii) if the Date of Termination is other than the date of receipt of such notice, specifies the termination date (which date shall be not more than thirty (30) days after the giving of such notice). (i) Mitigation. In no event shall the Executive be obligated to seek other employment or take any other action by way of mitigation of the amounts payable to the Executive under any of the provisions of this Agreement and any amounts payable pursuant to this Section 4 shall not be reduced by compensation the Executive earns on account of employment with another employer.
13 5. Confidential Information and Cooperation. (a) Confidentiality Agreement. The Executive shall execute and deliver to the Company the Confidentiality Agreement annexed hereto as Exhibit C (the “Confidentiality Agreement”). (b) Third-Party Agreements and Rights. The Executive hereby confirms that the Executive’s acceptance of employment with the Company and the performance of duties hereunder will not conflict with or result in a violation or breach of any contract, agreement, or understanding to which the Executive is a party or is otherwise bound. The Executive represents to the Company that the Executive’s execution of this Agreement and the Confidentiality Agreement, the Executive’s employment with the Company and the performance of the Executive’s proposed duties for the Company will not violate any obligations the Executive may have to any previous employer or other party. In the Executive’s work for the Company, the Executive will not disclose or make use of any information in violation of any agreements with or rights of any such previous employer or other party, and the Executive will not bring to the premises of the Company any copies or other tangible embodiments of non-public information belonging to or obtained from any such previous employment or other party. (c) Litigation and Regulatory Cooperation. During and after the Executive’s employment, the Executive shall cooperate fully with the Company Group in the defense or prosecution of any claims or actions now in existence or which may be brought in the future against or on behalf of the Company Group which relate to events or occurrences that transpired while the Executive was employed by the Company. The Executive’s full cooperation in connection with such claims or actions shall include, but not be limited to, being available to meet with counsel to prepare for discovery or trial and to act as a witness on behalf of the Company Group at mutually convenient times. During and after the Executive’s employment, the Executive also shall cooperate fully with the Company Group in connection with any investigation or review of any federal, state or local regulatory authority as any such investigation or review relates to events or occurrences that transpired while the Executive was employed by the Company. The Company shall reimburse the Executive for any reasonable and documented out-of-pocket expenses incurred in connection with the Executive’s performance of obligations pursuant to this Section 5(c), based on the standards and procedures applicable to expense reimbursement for the Company’s employees; and, to the extent applicable rules of professional responsibility would preclude the Company’s counsel from assisting the Executive in carrying out the provisions of this Section 5(c), pay the reasonable and documented attorney’s fees of counsel reasonably selected by the Executive in connection with the foregoing, provided that the Executive provides the Company with reasonable notice prior to retaining such counsel. (d) Injunction. The Executive agrees that it would be difficult to measure any damages caused to the Company Group which might result from any breach by the Executive of the promises set forth in the Confidentiality Agreement and in this Section 5, and that in any event money damages would be an inadequate remedy for any such breach. Accordingly the Executive agrees that if the Executive breaches, or proposes to breach, any portion of this Agreement, the Company Group shall be entitled, in addition to all other remedies that it may have, to an injunction or other appropriate equitable relief to restrain any such breach without showing or proving any actual damage to the Company Group . 6. Representations. The Executive hereby represents and warrants to the Company that (a) the Executive is entering into this Agreement voluntarily and that the performance of the Executive’s obligations hereunder will not violate any agreement between the Executive and any other person, firm, organization or other entity, and (b) the Executive is not bound by the terms of any agreement with any previous employer or other party to refrain from competing, directly or indirectly, with the business of such previous employer or other party that would be violated by the Executive’s entering into this Agreement and/or providing services to the Company pursuant to the terms of this Agreement.
14 7. Mutual Waiver of Jury Trial. THE PARTIES EACH WAIVE THEIR RESPECTIVE RIGHT TO A TRIAL BY JURY OF ANY CLAIM OR CAUSE OF ACTION BASED UPON OR ARISING OUT OF OR RELATED TO THIS AGREEMENT IN ANY ACTION, PROCEEDING OR OTHER LITIGATION OF ANY TYPE BROUGHT BY ANY OF THE PARTIES AGAINST ANY OTHER PARTY OR ANY AFFILIATE OF ANY OTHER SUCH PARTY, WHETHER WITH RESPECT TO CONTRACT CLAIMS, TORT CLAIMS OR OTHERWISE. THE PARTIES EACH AGREE THAT ANY SUCH CLAIM OR CAUSE OF ACTION WILL BE TRIED BY A COURT TRIAL WITHOUT A JURY. WITHOUT LIMITING THE FOREGOING, THE PARTIES FURTHER AGREE THAT THEIR RESPECTIVE RIGHT TO A TRIAL BY JURY IS WAIVED BY OPERATION OF THIS SECTION AS TO ANY ACTION, COUNTERCLAIM OR OTHER PROCEEDING WHICH SEEKS, IN WHOLE OR IN PART, TO CHALLENGE THE VALIDITY OR ENFORCEABILITY OF THIS AGREEMENT OR ANY PROVISION HEREOF. THIS WAIVER WILL APPLY TO ANY SUBSEQUENT AMENDMENTS, SUPPLEMENTS OR MODIFICATIONS TO THIS AGREEMENT. 8. Successors. (a) This Agreement is personal to the Executive and, without the prior written consent of the Company, shall not be assignable by the Executive otherwise than by will or the laws of descent and distribution. This Agreement shall inure to the benefit of and be enforceable by the Executive’s legal representatives. (b) This Agreement shall inure to the benefit of and be binding upon the Company and its successors and assigns, and such parties shall be bound by the Company’s obligations hereunder. 9. Clawback/Recoupment. Notwithstanding any other provision in this Agreement to the contrary, any compensation paid to the Executive pursuant to this Agreement or any other agreement or arrangement with the Company shall be subject to mandatory repayment by the Executive to the Company, to the extent any such compensation paid to the Executive is, or in the future becomes, subject to (i) any lawful clawback or recoupment policy adopted by the Company that applies to the Company’s executive officers, or (ii) any law, government regulation or stock exchange listing requirement which imposes mandatory recoupment, under circumstances set forth in such law, government regulation or stock exchange listing requirement. 10. Miscellaneous. (a) Governing Law. This Agreement shall be governed by and construed in accordance with the laws of the State of Virginia, without reference to principles of conflict of laws. The captions of this Agreement are not part of the provisions hereof and shall have no force or effect. (b) Notices. All notices and other communications hereunder shall be in writing and shall be given by hand delivery to the other party or by registered or certified mail, return receipt requested, postage prepaid, addressed as follows: If to the Executive: at the Executive’s most recent address on the records of the Company. If to the Company: Mercury Systems, Inc. Attention: General Counsel 50 Minuteman Road Andover, MA 01810
15 with a copy to: Latham & Watkins LLP 330 North Wabash Avenue Suite 2800 Chicago, IL 60611 Attn: Benjamin A. Rosemergy Email: [email protected] or to such other address as either party shall have furnished to the other in writing in accordance herewith. Notice and communications shall be effective when actually received by the addressee. (c) Sarbanes-Oxley Act of 2002. Notwithstanding anything herein to the contrary, if the Company determines, in its good faith judgment, that any transfer or deemed transfer of funds hereunder is likely to be construed as a personal loan prohibited by Section 13(k) of the Securities Exchange Act of 1934, as amended, and the rules and regulations promulgated thereunder (the “Exchange Act”), then such transfer or deemed transfer shall not be made to the extent necessary or appropriate so as not to violate the Exchange Act and the rules and regulations promulgated thereunder. (d) Section 409A of the Code. (i) To the extent applicable, this Agreement shall be interpreted in accordance with Section 409A of the Code and Department of Treasury regulations and other interpretive guidance issued thereunder (together, “Section 409A”). Notwithstanding any provision of this Agreement to the contrary, if the Company determines that any compensation or benefits payable under this Agreement may be subject to Section 409A, the Company shall work in good faith with the Executive to adopt such amendments to this Agreement or adopt other policies and procedures (including amendments, policies and procedures with retroactive effect), or take any other actions, that the Company determines are necessary or appropriate to avoid the imposition of taxes under Section 409A, including without limitation, actions intended to (A) exempt the compensation and benefits payable under this Agreement from Section 409A, and/or (B) comply with the requirements of Section 409A; provided, however, that this Section 10(d) shall not create an obligation on the part of the Company to adopt any such amendment, policy or procedure or take any such other action, nor shall the Company have any liability for failing to do so. Notwithstanding anything herein to the contrary, in no event shall any liability for failure to comply with the requirements of Section 409A be transferred from the Executive or any other individual to any member of the Company Group or any of their employees or agents pursuant to the terms of this Agreement or otherwise. (ii) Any right to a series of installment payments pursuant to this Agreement is to be treated as a right to a series of separate payments. To the extent permitted under Section 409A, any separate payment or benefit under this Agreement or otherwise shall not be deemed “nonqualified deferred compensation” subject to Section 409A to the extent provided in the exceptions in Treasury Regulation Section 1.409A-1(b)(4), Section 1.409A-1(b)(9) or any other applicable exception or provision of Section 409A. Any payments subject to Section 409A that are subject to execution of a waiver and release which may be executed and/or revoked in a calendar year following the calendar year in which the payment event (such as termination of employment) occurs shall commence payment only in the calendar year in which the consideration period or, if applicable, release revocation period ends, as necessary to comply with Section 409A. All payments of nonqualified deferred compensation subject to Section 409A to be made upon a termination of employment under this Agreement may only be made upon the Executive’s Separation from Service.
16 (iii) To the extent that any payments or reimbursements provided to the Executive under this Agreement are deemed to constitute compensation to the Executive to which Treasury Regulation Section 1.409A-3(i)(1)(iv) would apply, such amounts shall be paid or reimbursed reasonably promptly, but not later than December 31 of the year following the year in which the expense was incurred. The amount of any such payments eligible for reimbursement in one year shall not affect the payments or expenses that are eligible for payment or reimbursement in any other taxable year, and the Executive’s right to such payments or reimbursement of any such expenses shall not be subject to liquidation or exchange for any other benefit. (e) Severability. The invalidity or unenforceability of any provision of this Agreement shall not affect the validity or enforceability of any other provision of this Agreement. (f) Withholding. The Company may withhold from any amounts payable under this Agreement such federal, state, local or foreign taxes as shall be required to be withheld pursuant to any applicable law or regulation. (g) No Waiver. The Executive’s or the Company’s failure to insist upon strict compliance with any provision of this Agreement or the failure to assert any right the Executive or the Company may have hereunder shall not be deemed to be a waiver of such provision or right or any other provision or right of this Agreement. (h) Entire Agreement. As of the Effective Date, this Agreement, together with the Confidentiality Agreement, constitutes the final, complete and exclusive agreement between the Executive and the Company with respect to the subject matter hereof and replaces and supersedes any and all other agreements, offers or promises, whether oral or written, by any member of the Company Group, or representative thereof. (i) Amendment; Survival. No amendment or other modification of this Agreement shall be effective unless made in writing and signed by the parties hereto. The respective rights and obligations of the parties under this Agreement shall survive the Executive’s termination of employment and the termination of this Agreement to the extent necessary for the intended preservation of such rights and obligations. (j) Counterparts. This Agreement and any agreement referenced herein may be executed in two or more counterparts, each of which shall be deemed an original but which together shall constitute one and the same instrument. (k) Reimbursement of Attorneys’ Fees. The Company will promptly reimburse or directly pay the Executive’s legal fees, up to a maximum of $25,000, in connection with the review and negotiation of this Agreement (including other agreements referenced herein). [SIGNATURES APPEAR ON FOLLOWING PAGE]
[Signature Page to Employment Agreement] Does not contain Technical Data. //Mercury Proprietary/No Tech Data// IN WITNESS WHEREOF, the Executive has hereunto set the Executive’s hand and, pursuant to the authorization from the Board, the Company has caused these presents to be executed in its name on its behalf, all as of the day and year first above written. “COMPANY” By: /s/ Steven V. Ratner Name: Steven V. Ratner Title: Chief Human Resources Officer “EXECUTIVE” /s/ William L. Ballhaus William L. Ballhaus
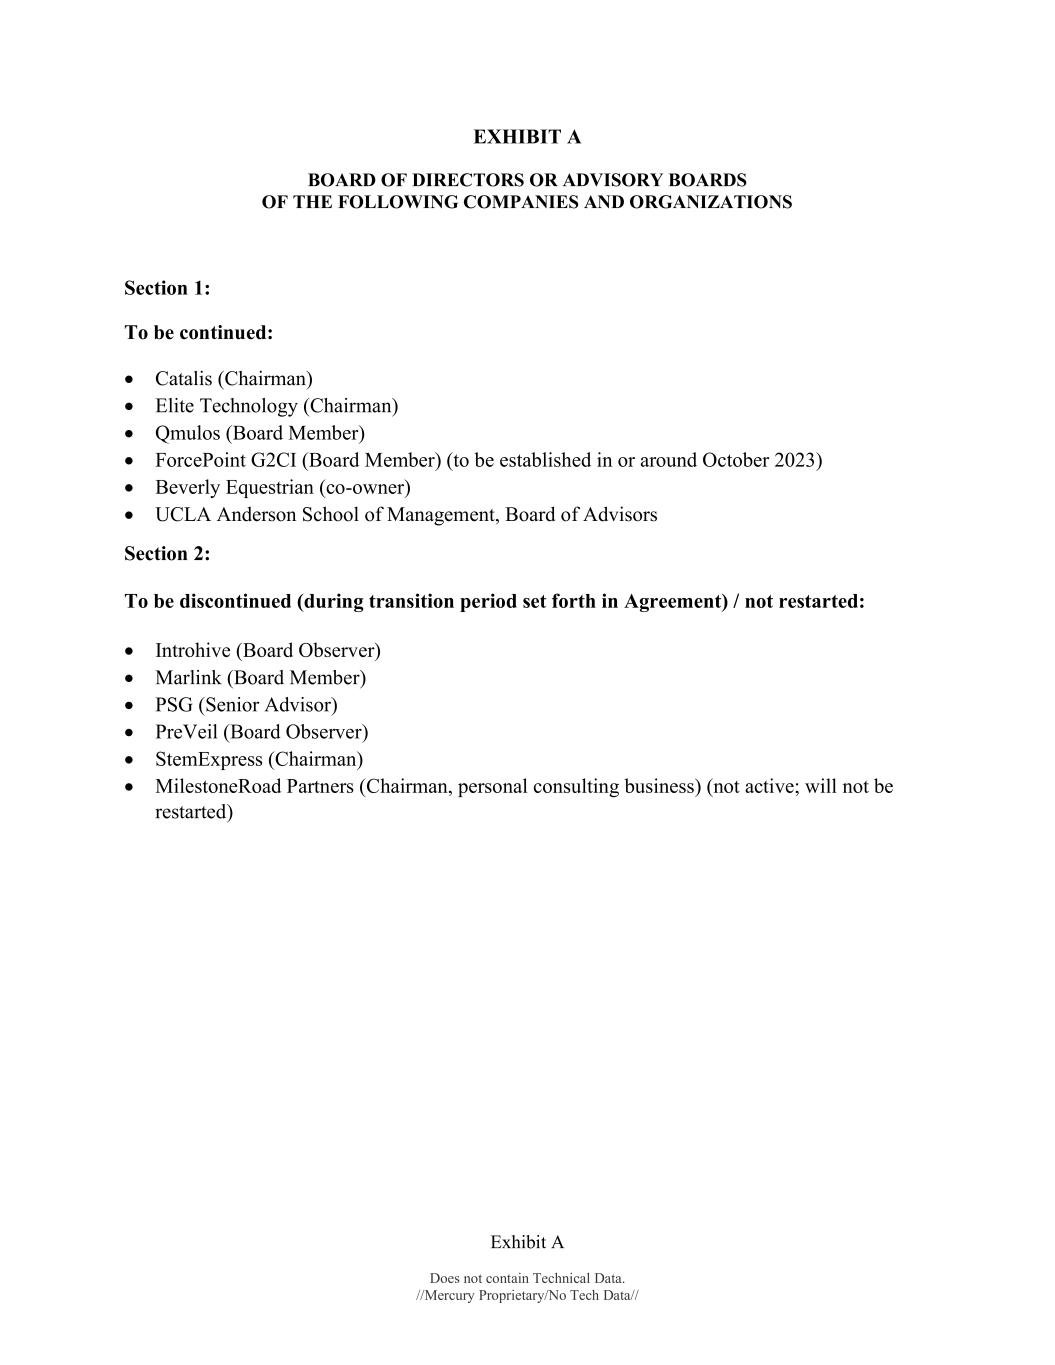
Exhibit A Does not contain Technical Data. //Mercury Proprietary/No Tech Data// EXHIBIT A BOARD OF DIRECTORS OR ADVISORY BOARDS OF THE FOLLOWING COMPANIES AND ORGANIZATIONS Section 1: To be continued: Catalis (Chairman) Elite Technology (Chairman) Qmulos (Board Member) ForcePoint G2CI (Board Member) (to be established in or around October 2023) Beverly Equestrian (co-owner) UCLA Anderson School of Management, Board of Advisors Section 2: To be discontinued (during transition period set forth in Agreement) / not restarted: Introhive (Board Observer) Marlink (Board Member) PSG (Senior Advisor) PreVeil (Board Observer) StemExpress (Chairman) MilestoneRoad Partners (Chairman, personal consulting business) (not active; will not be restarted)
Exhibit B Does not contain Technical Data. //Mercury Proprietary/No Tech Data// EXHIBIT B GENERAL RELEASE [The language in this General Release of Claims may change based on local laws, legal developments and evolving best practices as determined by the Company.] The undersigned, William L. Ballhaus (the “Releasor”), for good and valuable consideration, the receipt and sufficiency of which are hereby acknowledged, does hereby agree to the following General Release of Claims (the “Release”): 1. The Releasor, for Releasor and Releasor’s heirs, agents, representatives, and each of their respective affiliates, successors and assigns, as applicable (collectively, the “Releasing Parties”), hereby unconditionally and forever remises, releases, discharges and holds harmless, Mercury Systems, Inc. (the “Company”) and its subsidiaries, parent companies, affiliates and clients, and each of their respective direct and indirect equity holders, directors, managers, officers, employees, agents, trustees, representatives, insurers, and/or affiliates, and each of the successors and assigns of all of the foregoing (collectively, the “Released Parties”), of and from any and all actions, proceedings, claims, causes of action, suits, debts, sums of money, accounts, reckonings, bonds, bills, specialties, covenants, controversies, contracts, leases, agreements, promises, variances, trespasses, damages, judgments, executions, claims and demands, of any nature whatsoever, and of every kind and description, choate and inchoate, at law or in equity (collectively, “Claims”), which any of the Releasing Parties now has or ever might claim to have against any or all of the Released Parties, whether or not currently asserted or known, arising from or relating to any event, dispute or occurrence which arose at any time on or prior to the date hereof, including, without limitation, with respect to (i) the Releasor’s ownership of any equity or securities in, and/or the purchase thereof by, the Company, or its clients or affiliates; (ii) any and all Claims alleging discrimination, harassment, or retaliation on the basis of any characteristic protected under law, including but not limited to race, national origin, sex, religion, disability, union activity, or other protected activity; (iii) any Claims arising under the Age Discrimination in Employment Act (“ADEA”), as amended, 29 U.S.C. § 621, et seq.; the Title VII of the Civil Rights Act of 1964, as amended by the Civil Rights Act of 1991, 42 U.S.C. § 2000 et seq.; the Equal Pay Act, as amended, 29 U.S.C. § 206(d); the Civil Rights Act of 1866, 42 U.S.C. § 1981; the Family and Medical Leave Act of 1993, 29 U.S.C. § 2601 et seq.; the Americans with Disabilities Act of 1990, 42 U.S.C. § 12101 et seq.; the False Claims Act , 31 U.S.C. § 3729 et seq.; the Employee Retirement Income Security Act, as amended, 29 U.S.C. § 1001 et seq.; the Worker Adjustment and Retraining Notification Act, as amended, 29 U.S.C. § 2101 et seq. the Fair Labor Standards Act, 29 U.S.C. § 215 et seq., the Sarbanes-Oxley Act of 2002; [__________]1, all as may be amended from time to time, or any other federal, state, or local law, including any statutes, regulations, constitutions, ordinances, or orders regarding employment or otherwise; (iv) Claims for breach of contract (including any employment offer letter or agreement or other agreement entered into in connection with employment), violation of any policy, benefit plan, or covenant of any kind, and/or breach of the implied covenant of good faith and fair dealing; (v) Claims arising in tort, including, without limitation, wrongful dismissal or discharge, harassment, retaliation, fraud, negligence, misrepresentation, defamation, infliction of emotional distress, invasion of privacy, or violation of any public policy or common law; and (vi) Claims for damages or other remedies of any sort, including, without limitation, compensatory damages, punitive damages, injunctive relief and attorney’s fees. 2. The Releasor, on behalf of Releasor and the other Releasing Parties, specifically waives the benefits of any statutory or common law of any state, which in effect provides that a general release does not extend to claims which the Releasor does not know or suspect to exist in its favor. It is expressly 1 NTD: To include applicable state laws.
Exhibit B - 1 Does not contain Technical Data. //Mercury Proprietary/No Tech Data// understood and agreed that the releases contained herein are intended to cover and do cover all known facts and/or claims, as well as any further facts and/or claims within the scope of such released Claims not known or anticipated, but which may later develop or be discovered, including all the effects and consequences thereof, in each case arising from or relating to any event, dispute or occurrence which arose on or prior to the date hereof. The Releasor, on behalf of Releasor and the other Releasing Parties, acknowledges that the Releasor may hereafter discover facts in addition to, or different from, those which the Releasor now believes to be true with respect to the subject matter of the Claims released herein, but agrees that the Releasor has taken that possibility into account in reaching this agreement, and that the releases given herein shall be and remain in effect notwithstanding the discovery or existence of any such additional or different facts, as to which the Releasing Parties expressly assume the risk. In connection with such waiver and relinquishment, the Releasor, on behalf of the Releasor and the other Releasing Parties, hereby acknowledges that the Releasor is aware that Releasor’s attorneys may hereafter discover claims or facts in addition to, or different from, those which they now know or believe to exist with respect to the subject matter of, or any part of this Release, but that it is nonetheless their intention to fully, finally and forever settle and release all disputes and differences, known or unknown, suspected or unsuspected, as to the released matters, in each case arising from or relating to any event, dispute or occurrence which arose on or prior to the date hereof. 3. Without limiting the generality of the foregoing, the Releasor hereby agrees, on behalf of Releasor and the other Releasing Parties, that this General Release of Claims extends to all rights of the Releasor and the other Releasing Parties under Section 1542 of the California Civil Code and any similar law of any state or territory of the United States, all of which are hereby expressly waived by the Releasor. The Releasor, on behalf of Releasor and the other Releasing Parties, hereby waives and relinquishes all rights and benefits afforded by Section 1542 of the California Civil Code (if any). Section 1542 of the California Civil Code provides as follows: “A GENERAL RELEASE DOES NOT EXTEND TO CLAIMS THAT THE CREDITOR OR RELEASING PARTY DOES NOT KNOW OR SUSPECT TO EXIST IN HIS OR HER FAVOR AT THE TIME OF EXECUTING THE RELEASE AND THAT, IF KNOWN BY HIM OR HER, WOULD HAVE MATERIALLY AFFECTED HIS OR HER SETTLEMENT WITH THE DEBTOR OR RELEASED PARTY.” 4. The Releasor represents, warrants and covenants on behalf of Releasor and the other Releasing Parties that there has been, and there will be, no assignment or other transfer of any right or interest arising from or relating to any Releasing Party’s ownership of any securities of the Company or any of its direct or indirect subsidiaries, or any entity advised by the Company, or any Claims which they have or may have against the Released Parties, and the Releasor hereby agrees to indemnify and hold each Released Party harmless from any Claims, costs, expenses and reasonable attorney’s fees directly or indirectly incurred by any of the Released Parties as a result of any person asserting any right or interest pursuant to its assignment or transfer of any such right or interest. 5. The Releasor covenants and shall use reasonable best efforts to cause the other Releasing Parties, never to institute any Claim whether at law or in equity, against any or all of the Released Parties, in any court or administrative agency or before any other public or private tribunal. 6. The Releasor agrees that if the Releasor or any other Releasing Party hereafter commences, joins in, or in any manner seeks relief through any action (including, without limitation, any complaint, cross-claim, counterclaim, third-party complaint or interpleader complaint in any jurisdiction or any action before an administrative or regulatory agency) arising out of, based upon or relating to any of the Claims released by them hereunder, or in any manner assert against any Released Party any of the Claims released hereunder, then the Releasor will indemnify and hold harmless the Released Parties from any settlements, judgments, costs and expenses (including reasonable attorneys’ fees and costs) incurred by such person or entity as a result of or in connection with such action.
Exhibit B - 2 Does not contain Technical Data. //Mercury Proprietary/No Tech Data// 7. Notwithstanding anything to the contrary contained herein, in no event shall this Release apply to any Claims that may arise from (i) any rights or claims to indemnification under the organizational documents of the Company or any of its subsidiaries or any entity advised by the Company of which the Releasing Party is a director, manager, or officer, under directors and officers liability insurance or under applicable law, (ii) any claim Releasor may have relating to workers compensation or unemployment benefits under applicable state law, (iii) any ongoing rights under contracts relating to Releasor’s ownership of equity in the Company and any ongoing rights for post-termination payments and benefits under Releasor’s Employment Agreement with the Company, or (iv) any Claims that may not be released as a matter of law. Further, nothing herein shall restrict Releasor from filing a charge with, or participating in any proceeding conducted by, the Equal Employment Opportunity Commission or similar state agency; provided, however, this General Release of Claims does release any right to secure damages or other relief awarded in connection with such a proceeding brought by or on behalf of Releasor. 8. The Releasor acknowledges that (i) the Releasor has the right to consult with independent legal counsel in connection with this Release, the Company is herein advising Releasor in writing to consult with such counsel, and the Releasor either has consulted with such counsel or voluntarily chosen not to; (ii) the Releasor has read and understands this Release; and (iii) the Releasor intends to be legally bound by the same. 9. The Releasor has [twenty-one (21) or forty-five (45)]2 days to consider whether or not to sign this Release and, if the Releasor signs this Release prior to the expiration of such [twenty-one (21) or forty-five (45)] day period, the Releasor waives the remainder of that period. The Releasor waives the restarting of the [twenty-one (21) or forty-five (45)] day period in the event of any modification of this Release, whether or not material. The Releasor may revoke Releasor’s acceptance of this Release by delivering written notice of revocation to the General Counsel and Secretary of the Company within the seven (7) day period beginning on the day following the day the Releasor signs this Release (the “revocation period”). To be valid, such revocation must be express and in writing, and personally delivered or sent by certified mail and received by the Company before the expiration of the revocation period. If the Releasor does not revoke acceptance of this Release within the revocation period as provided herein, this Release will be legally binding, irrevocable, and enforceable on the day immediately following the last day of the revocation period. 10. [The Releasor acknowledges that the Releasor has received a list of job titles and ages of all employees eligible for similar severance benefits and the job titles and ages of all employees in the same job classification or organizational unit who are not eligible for similar severance benefits, as well as other information required under the Older Workers Benefits Protection Act to constitute a knowing and voluntary waiver.]3 11. The Releasor acknowledges and agrees that, if any provision of this Release is found, held, or deemed by a court of competent jurisdiction to be void, unlawful or unenforceable under any applicable statute or controlling law, the remainder of this Release shall continue in full force and effect. 12. This Release is deemed made and entered into in the State of Virginia, and in all respects shall be interpreted, enforced, and governed under the internal laws of the State of Virginia, to the extent not preempted by federal law. 2 45 days applies to termination in a layoff, restructuring or other job action affecting 2 or more persons (a group termination). 3 To be included in a group termination.

Exhibit B - 3 Does not contain Technical Data. //Mercury Proprietary/No Tech Data// IN WITNESS WHEREOF, the Releasor has executed and delivered this General Release of Claims on behalf of Releasor and the other Releasing Parties as of the day and year set forth below. Releasor: ________________________________ William L. Ballhaus Date: ____________, 20__

Does not contain Technical Data. //Mercury Proprietary/No Tech Data// EXHIBIT C CONFIDENTIALITY AGREEMENT
1 Does not contain Technical Data. //Mercury Proprietary/No Tech Data// MERCURY SYSTEMS, INC. Confidentiality Agreement A. Mercury Systems, Inc. has developed and uses commercially valuable technical and non-technical (business) information. In order to guard the legitimate interests (as defined below) of MERCURY, it is necessary for MERCURY to protect such information either by patenting it or keeping it confidential. I (the undersigned) will have access to such information during my employment with MERCURY, and may also contribute to or develop this type of information. I recognize that such information is the property of MERCURY, and that it is vital to the success of MERCURY’s business. B. PROPRIETARY INFORMATION means all information, whether or not in writing, concerning MERCURY’s business affairs, business relationships, products, technologies, or financial affairs which MERCURY has not made generally available to the public. By way of non-limiting illustration only, PROPRIETARY INFORMATION may include information such as (a) corporate information, including plans, strategies, methods, policies, resolutions, negotiations, and litigation, (b) marketing information, including strategies, methods, market analyses and projections, customer identities and other information about customers, and prospect identities and other information about prospects, (c) financial information, including cost and performance data, debt arrangements, equity structures, investors and holdings, purchasing and sales data, and price lists, (d) operational and technological information, including plans, specifications, manuals, forms, templates, software, designs, procedures, formulas, discoveries, INVENTIONS, improvements, concepts, and ideas, and (e) personnel information, including personnel lists, reporting or organizational structures, resumes, personnel data, compensation structures, performance evaluations, and termination arrangements or documents. PROPRIETARY INFORMATION includes MERCURY’s TRADE SECRETS and all information received in confidence by MERCURY from its customers or suppliers or other third parties. C. INVENTIONS means all ideas, inventions, discoveries, designs, developments, methods, modifications, improvements, processes, algorithms, databases, computer programs, formulas, techniques, trade secrets, graphics, images, audio or visual works, and other works of authorship created, conceived, developed, made, and/or reduced to practice by me solely or jointly with others during or outside working hours while in the employ of MERCURY which (a) relate to MERCURY’s business or any of the products or services being researched, developed, manufactured, or sold by MERCURY, or which may be used with any of such products or services, (b) result from tasks assigned to me by MERCURY, or (c) result from the use of PROPRIETARY INFORMATION of MERCURY or of premises or personal property (whether tangible or intangible) owned, leased, or contracted for by MERCURY, but, in each case, excluding any PRIOR INVENTIONS. I further understand that, to the extent this Agreement shall be construed in accordance with the laws of any state which precludes a requirement in an employee agreement to assign certain classes of inventions made by an employee, this Section C shall be interpreted not to apply to any INVENTION which a court rules and/or MERCURY agrees falls within such classes. D. PRIOR INVENTIONS means all unpatented, but potentially patentable, ideas and inventions that are (a) conceived or made by me solely or jointly with others prior to my employment with MERCURY, (b) that have not been assigned by me to former employers or any other entity and which I believe should be exempt from the assignment obligations of Section F. 4 below, and (c) are listed in Section F. 12 below. E. TRADE SECRETS means any formulas, patterns, drawings, data, devices, or compilations of information which are used in one’s business and give one an opportunity to obtain an advantage over competitors who do not know and use them. TRADE SECRETS include without limitation results that can be achieved by the use of a known process or technique. F. THEREFORE, in consideration of my employment and the compensation received by me from MERCURY and a cash payment of $200 and other good and valuable consideration, the full receipt and sufficiency of which are hereby expressly acknowledged, I hereby agree as follows: 1. I acknowledge the confidential and secret character of the PROPRIETARY INFORMATION of MERCURY and agree that such PROPRIETARY INFORMATION is the sole, exclusive and valuable property of MERCURY. Accordingly, I agree that I will not, during the course of my employment or at any time thereafter, and other than in the performance of my authorized work for MERCURY (a) use or make use of any PROPRIETARY INFORMATION of MERCURY, or (b) disclose to any party any PROPRIETARY INFORMATION of MERCURY. I also agree to this with respect to PROPRIETARY INFORMATION that MERCURY receives from third parties (such as, by way of non-limiting example, customers and suppliers) for use in connection with MERCURY business. I will deliver promptly to MERCURY upon termination of my employment with MERCURY, or at any time that MERCURY may so request, all memoranda, notes, records, manuals, drawings, programs, software, firmware, plans, models, blueprints, and any other documents of a proprietary nature belonging to MERCURY or that MERCURY has received from third parties (such as, by way of non-limiting example, customers and suppliers), including all copies or reproductions of such materials which I may possess or have under my control. I also agree to abide by MERCURY’s policies and procedures which were communicated and provided to me at the time of my hiring. If I become compelled by law, regulation (including without limitation the rules of any applicable securities exchange), court order, or other governmental authority to disclose any PROPRIETARY INFORMATION of MERCURY, I will, to the extent possible and permissible under applicable law, first give MERCURY prompt notice. I agree to cooperate reasonably with MERCURY in any proceeding to obtain a protective order or other remedy. If such protective order or other remedy is not obtained, I will only disclose that portion of such PROPRIETARY INFORMATION required to be disclosed, in the opinion of my legal counsel. I will request that confidential treatment be accorded such PROPRIETARY INFORMATION, where available.
2 Does not contain Technical Data. //Mercury Proprietary/No Tech Data// 2. I will fully and promptly disclose to MERCURY or its designees any and all INVENTIONS or PROPRIETARY INFORMATION, whether or not patentable or copyrightable, conceived or developed by me solely or jointly with others during my employment with MERCURY. I further agree to keep adequate records of any INVENTIONS, PROPRIETARY INFORMATION and TRADE SECRETS to which I contribute during my employment. 3. I agree that I will not, during the course of my employment with MERCURY, (a) make any contributions to open-source projects without obtaining approval from my manager in advance and in writing, which approval shall not be unreasonably withheld if such contributions are determined by MERCURY to be unrelated to MERCURY’s lines of business, or (b) use any open-source software, source code, information, or other intellectual property in the performance of my duties at MERCURY, except as may be expressly permitted by MERCURY’s Third-Party Source Code Policy. 4. I acknowledge that all work performed by me is on a work-for-hire basis. I hereby assign to MERCURY or its successor in interest, all of my rights, titles, and interests in all INVENTIONS, in all of MERCURY’s PROPRIETARY INFORMATION, and in all intellectual property rights in or related to any of the foregoing, including any related patents, patent applications, trademarks and trademark applications, copyrights and copyright applications, and other intellectual property rights in all countries and territories worldwide and under any international conventions, and all claims, causes of action, choses in action, rights of recovery and rights of set-off of any kind (including all damages and payments for past, present or future infringement or misappropriation or dilution of any INVENTIONS and the right to sue and recover for past infringements or misappropriations or dilutions of such INVENTIONS). I will, either during my employment with MERCURY or after my employment with MERCURY, without further compensation, do all lawful things, including without limitation rendering assistance and executing and delivering appropriate documents, as requested by MERCURY, to obtain and maintain patents, design patents, copyrights, trade names, and trademarks in the United States and in all foreign countries on and for any and all INVENTIONS, PROPRIETARY INFORMATION, and intellectual property rights. Any modifications to the rights and obligations established under this paragraph must be authorized in writing by MERCURY’s Board of Directors or General Counsel. In the event that MERCURY is unable, after reasonable effort, to secure my signature on any document that is required to enable MERCURY to apply for, prosecute, or obtain the issuance of any patent, copyright, trademark, trade name, trade secret, or other right of protection relating to an INVENTION, whether because of my physical or mental incapacity or for any other reason whatsoever, I hereby irrevocably designate and appoint MERCURY and its authorized officers and agents as my agent and attorney-in-fact, to act on my behalf to execute and file any such document or documents and to take all other lawfully permitted actions in order to further the application for, or the prosecution or issuance of, patents, copyrights, trademarks, trade names, trade secrets, or other rights of protection relating to such INVENTION with the same legal force and effect as if such document or documents were executed by me. If I use any PRIOR INVENTIONS in the course of my employment or incorporate any PRIOR INVENTIONS in any product, service or other offering of MERCURY, I hereby grant MERCURY a non-exclusive, royalty-free, perpetual and irrevocable, worldwide right to use and sublicense the use of such PRIOR INVENTIONS for the purpose of developing, marketing, selling and supporting MERCURY technology, products and services, either directly or through multiple tiers of distribution, but not for the purpose of marketing PRIOR INVENTIONS separately from MERCURY products or services. 5. At no time during my employment with MERCURY will I be employed by, render services for, or act on behalf of any person, company, or other entity that is engaged in a business or activity that is similar to, or competitive with, that of MERCURY, or with any business that is a supplier to or a customer of MERCURY, unless such employment, services, or action has been approved in writing by MERCURY’s Board of Directors or General Counsel. I further agree that during my employment with MERCURY and for one year thereafter I will not, directly or indirectly, (a) recruit, solicit for employment, or induce or divert any MERCURY associate to terminate his or her employment with MERCURY, or take any action to assist another party to so recruit, solicit, induce, or divert any such associate (provided however, that the foregoing clause shall not prohibit the solicitation or employment of a MERCURY associate responding to a general solicitation (e.g., advertisement) not specifically directed at any such associate), or (b) call upon, solicit, divert, or take away any of the customers, business, or prospective customers of MERCURY or any of its suppliers, provided that I had direct or otherwise substantial involvement with such customers, business, prospective customers, or suppliers, as the case may be. With respect to prospective customers, “direct or otherwise substantial involvement” shall include without limitation identifying them as prospects. I acknowledge that the activities carried on by MERCURY and its affiliates have worldwide business and commercial implications for MERCURY without any geographic limitation. I understand and agree that the non-competition and non- solicitation provisions in this section are necessary for the protection and benefit of MERCURY because of (a) my position with MERCURY, (b) the training that I have received at MERCURY’s expense, and (c) my access to MERCURY’s PROPRIETARY INFORMATION. I further agree that MERCURY would be irreparably harmed in the event of any breach of these provisions, and that money damages would not be an adequate remedy. Accordingly, in addition to any other remedies available at law or in equity, MERCURY shall be entitled to obtain injunctive relief in the event of any such breach or threatened breach. 6. At no time during my employment with MERCURY will I own any stock of, or derive any direct or indirect financial benefit from, any corporation or other entity engaged in activities that are competitive with those of MERCURY, unless such ownership
3 Does not contain Technical Data. //Mercury Proprietary/No Tech Data// or interest has first been approved in writing by either MERCURY’s Chief Executive Officer or General Counsel. The following investments shall not be deemed to violate the restrictions set forth in the preceding sentence: (a) the ownership of less than a one percent (1%) interest in a corporation or other entity whose shares are traded in a recognized stock exchange or traded in the over-the-counter market, even though that corporation or other entity may be engaged in activities that are competitive with those of MERCURY; (b) the ownership of any interest in any mutual fund, or the ownership of less than a five percent (5%) passive interest in any investment partnership or limited liability company that invests in a corporation or other entity engaged in activities that are competitive with those of MERCURY; and (c) any investments made by third-party money managers on my behalf, provided that I have no role in the selection or management of such investments. I will be subject to and abide by any policies that MERCURY may adopt regarding conflict of interest, whether consistent with or in replacement of the above, and all other policies of MERCURY. 7. I agree, during my employment with MERCURY and thereafter, to refrain from Disparaging (as defined below) MERCURY and its affiliates, including any of its services, technologies or practices, or any of its directors, officers, agents, representatives or equityholders, either orally or in writing. Nothing in this paragraph shall prohibit me from making truthful statements that are reasonably necessary to comply with applicable law, regulation or legal process, or to defend or enforce my rights under this Agreement. Furthermore, nothing in this paragraph shall prohibit me from making any disclosures as set forth in Section 8. For purposes of this Agreement, “Disparaging” means making remarks, comments or statements, whether written or oral, which could reasonably be seen to impugn the character, integrity, reputation or abilities of the person, entity or thing about which the remark, comment or statement is made. 8. Notwithstanding anything to the contrary herein, I acknowledge that MERCURY has provided me with the following notice of immunity rights in compliance with the requirements of the Defend Trade Secrets Act of 2016: (i) I shall not be held criminally or civilly liable under any federal or state trade secret law for the disclosure of Proprietary Information that is made in confidence to a federal, state or local government official or to an attorney solely for the purpose of reporting or investigating a suspected violation of law, (ii) I shall not be held criminally or civilly liable under any federal or state trade secret law for the disclosure of Proprietary Information that is made in a complaint or other document filed in a lawsuit or other proceeding, if such filing is made under seal and (iii) if I file a lawsuit for retaliation by MERCURY for reporting a suspected violation of law, I may disclose the Proprietary Information to my attorney and use the Proprietary Information in the court proceeding, if I file any document containing the Proprietary Information under seal, and do not disclose the Proprietary Information, except pursuant to court order. Notwithstanding anything to the contrary contained herein, nothing in this Agreement prohibits me from: (A) communicating directly with, cooperating with, or providing information to, or receiving financial awards from, any federal, state or local government agency, including without limitation the U.S. Securities and Exchange Commission, the U.S. Commodity Futures Trading Commission, the U.S. Department of Justice, the U.S. Equal Employment Opportunity Commission, or the U.S. National Labor Relations Board, without notifying or seeking permission from MERCURY, (B) exercising any rights I may have under Section 7 of the U.S. National Labor Relations Act, such as the right to engage in concerted activity, including collective action or discussion concerning wages or working conditions, (C) testifying under oath pursuant to legal process or otherwise making any disclosure of information required by law, or (D) discussing or disclosing information about unlawful acts in the workplace, such as harassment or discrimination based on a protected characteristic or any other conduct that I have reason to believe is unlawful. I do not need the prior authorization of MERCURY to make any such reports or disclosures and I shall not be not required to notify MERCURY that such reports or disclosures have been made. 9. This Agreement does not constitute, and shall not be deemed to constitute, a promise or guarantee of employment. I understand and agree that, except as may be provided in a written agreement signed by a duly authorized officer or director of MERCURY and me, my employment with MERCURY is at will. Accordingly, my employment can be terminated at any time, without cause or notice, at my option or MERCURY’s option. The at-will nature of my employment also means that I can be transferred or demoted, and my job title, compensation, benefits and other terms and conditions of employment can be reduced, at any time with or without cause. I acknowledge that such changes shall not affect the enforceability of any terms of this Agreement. My agreements not to use or disclose PROPRIETARY INFORMATION of MERCURY and to protect MERCURY’s property and interests in any INVENTIONS and/or PROPRIETARY INFORMATION shall survive the termination of my employment with MERCURY, regardless of the manner of such termination, and shall be binding upon my heirs, executors, administrators, legal representatives, and assigns. 10. Any reference to MERCURY herein shall include Mercury Systems, Inc., its subsidiaries and affiliates, and their respective successors and assigns. This Agreement may be modified only by an agreement in writing that is signed by MERCURY’s General Counsel. This entire Agreement shall be binding upon my heirs, executors, administrators, legal representatives, and assigns. This Agreement shall be governed by and interpreted in accordance with the laws of the State of Virginia applicable to agreements made and to be performed entirely within the State of Virginia, and without regard to any provisions or principles of such laws relating to conflicts of law. Any action, suit, or other legal proceeding brought pursuant to or in connection with this Agreement shall be brought only in the state or federal courts located in the State of Virginia. In any such action, I submit to the personal jurisdiction of the state and federal courts located in the State of Virginia and waive any objection to venue in such courts.
4 Does not contain Technical Data. //Mercury Proprietary/No Tech Data// 11. I agree not to disclose to MERCURY or use in my work at MERCURY any TRADE SECRETS of any of my prior employers or other third parties (except those third parties that have supplied TRADE SECRETS to MERCURY for use in connection with its business). I agree not to bring on to MERCURY’s premises any documents, items, or other materials containing TRADE SECRETS of any of my prior employers or other third parties (except those third parties that have supplied TRADE SECRETS to MERCURY for use in connection with its business). 12. I hereby represent, except as I have fully disclosed previously in writing to MERCURY, that my employment with MERCURY will not conflict with and will not be constrained by any prior employment agreement, consulting agreement, or other business arrangement to which I am (or was) a party. I understand that this includes (by way of non-limiting example) agreements or arrangements which have ongoing non-competition and non-solicitation obligations. All such existing agreements or arrangements are listed below. If not applicable, check “none” below. If additional space is required, use a separate sheet. None: ______ 13. I hereby represent that all PRIOR INVENTIONS are listed below. If not applicable, check “none” below. If additional space is required, use a separate sheet. None: ______ 14. MERCURY’s facilities contain export-controlled information and items as well as U.S. government-classified information and items. MERCURY is required by law to ensure that unauthorized persons do not have access to such information and items. To enable MERCURY to comply with all applicable requirements relating to such matters, MERCURY reserves the right, at any time while you are on MERCURY’s premises, to search your belongings and to require that you empty any pockets and other concealed areas of your clothing and display the contents of those pockets and areas to MERCURY’s authorized officers and agents. 15. I agree that in the event of a breach or threatened breach of the provisions of this Agreement, MERCURY’s remedies at law would be inadequate, and MERCURY shall be entitled to an injunction to enforce such provisions (without any bond or other security being required), but nothing herein shall be construed to preclude MERCURY from pursuing any remedy at law or in equity for any breach or threatened breach. 16. If any provision of this Agreement is wholly or partially unenforceable for any reason, such unenforceability shall not affect the enforceability of the balance of this Agreement, and all of the remaining provisions shall continue in full force and effect. 17. No waiver by MERCURY of a breach by me of any provision of this Agreement shall (a) constitute a waiver or relinquishment of such provision in the future, or (b) constitute a waiver of or consent to any subsequent breach by me of such provision. 18. I agree to abide by the requirements of the U.S. government with regard to export regulations as implemented by MERCURY in its export compliance program, including any obligations required therein for foreign nationals as applicable, to the extent that I am trained and involved in any products, design, services, or documentation exported, or considered a deemed export, by MERCURY. 19. The restrictions on confidentiality and non-disclosure as set forth in this Agreement do not prohibit or otherwise restrict me from lawfully reporting information relating to fraud, waste, and abuse in the Federal Government procurement process to a designated investigative or law enforcement representative of a Federal department or agency authorized to receive such information. SIGN NAME: DATE: PRINT NAME: WILLIAM L. BALLHAUS