|
Date of report (Date of earliest event reported):
|
||
|
|
||
|
|
||
|
(Exact Name of Registrant
as Specified in Charter) |
||
|
|
||
|
|
|
|
|
(State or Other Jurisdiction of Incorporation)
|
(Commission File Number)
|
(IRS Employer Identification No.)
|
|
|
||
|
|
|
|
|
(Address of Principal Executive Offices)
|
|
(Zip Code)
|
|
|
|
|
|
Registrant’s telephone number, including area code: (
|
||
|
|
||
|
(Former Name or Former Address, if Changed Since Last Report)
|
||
|
Title of each class
|
Trading Symbol(s)
|
Name of each exchange on which registered
|
|
|
|
|
|
Depositary
Shares, each representing 1/1,000th interest in a share of Floating Rate
|
|
|
|
Depositary Shares, each representing 1/1,000th interest in a share of Fixed-to-Floating Rate
|
|
|
|
Depositary Shares, each representing 1/1,000th interest in a share of Fixed-to-Floating Rate
|
|
|
|
Depositary Shares, each representing 1/1,000th interest in a share of Fixed-to-Floating Rate
|
|
|
|
Depositary Shares, each representing 1/1,000th interest in a share of Fixed-to-Floating Rate
|
|
|
|
Depositary Shares, each representing 1/1,000th interest in a share of 4.875%
|
|
|
|
of Morgan Stanley Finance LLC (and Registrant’s guarantee with respect thereto)
|
|
|
|
|
|
|
|
|
|
|
|
|
|
|
|
Item 2.02.
|
Results of Operations and Financial Condition
|
|
Item 7.01.
|
Regulation FD disclosure
|
|
Item 9.01.
|
Financial Statements and Exhibits.
|
|
(d)
|
Exhibits |
|
Exhibit
|
|
|
Number
|
Description
|
|
|
|
|
|
|
|
|
|
|
|
|
|
101
|
Interactive Data Files pursuant to Rule 406 of Regulation S-T formatted in Inline eXtensible Business Reporting Language (“Inline XBRL”).
|
|
|
|
| 104 | Cover Page Interactive Data File (formatted in Inline XBRL and contained in Exhibit 101). |
|
|
|
MORGAN STANLEY
(Registrant) |
|||
|
Date:
|
January 16, 2020
|
|
By:
|
/s/ Paul C. Wirth
|
|
|
|
|
|
|
Name:
|
Paul C. Wirth
|
|
|
|
|
|
Title:
|
Deputy Chief Financial Officer
|
|
Financial Summary4
|
||||||||||||||||
|
Firm ($MM, except per share data)
|
4Q 2019
|
4Q 2018
|
FY 2019
|
FY 2018
|
||||||||||||
|
Net revenues
|
$
|
10,857
|
$
|
8,548
|
$
|
41,419
|
$
|
40,107
|
||||||||
|
Compensation expense
|
$
|
5,228
|
$
|
3,787
|
$
|
18,837
|
$
|
17,632
|
||||||||
|
Non-compensation expenses
|
$
|
2,896
|
$
|
2,904
|
$
|
11,281
|
$
|
11,238
|
||||||||
|
Pre-tax income7
|
$
|
2,733
|
$
|
1,857
|
$
|
11,301
|
$
|
11,237
|
||||||||
|
Net income app. to MS
|
$
|
2,239
|
$
|
1,531
|
$
|
9,042
|
$
|
8,748
|
||||||||
|
Expense efficiency ratio8
|
75
|
%
|
78
|
%
|
73
|
%
|
72
|
%
|
||||||||
|
Earnings per diluted share
|
$
|
1.30
|
$
|
0.80
|
$
|
5.19
|
$
|
4.73
|
||||||||
|
Book value per share
|
$
|
45.82
|
$
|
42.20
|
$
|
45.82
|
$
|
42.20
|
||||||||
|
Tangible book value per share
|
$
|
40.01
|
$
|
36.99
|
$
|
40.01
|
$
|
36.99
|
||||||||
|
Return on equity5
|
11.3
|
%
|
7.7
|
%
|
11.7
|
%
|
11.8
|
%
|
||||||||
|
Return on tangible equity5
|
13.0
|
%
|
8.8
|
%
|
13.4
|
%
|
13.5
|
%
|
||||||||
|
Institutional Securities
|
||||||||||||||||
|
Net revenues
|
$
|
5,054
|
$
|
3,839
|
$
|
20,386
|
$
|
20,582
|
||||||||
|
Investment Banking
|
$
|
1,576
|
$
|
1,417
|
$
|
5,734
|
$
|
6,088
|
||||||||
|
Sales & Trading
|
$
|
3,194
|
$
|
2,487
|
$
|
13,695
|
$
|
13,777
|
||||||||
|
Wealth Management
|
||||||||||||||||
|
Net revenues
|
$
|
4,582
|
$
|
4,144
|
$
|
17,737
|
$
|
17,242
|
||||||||
|
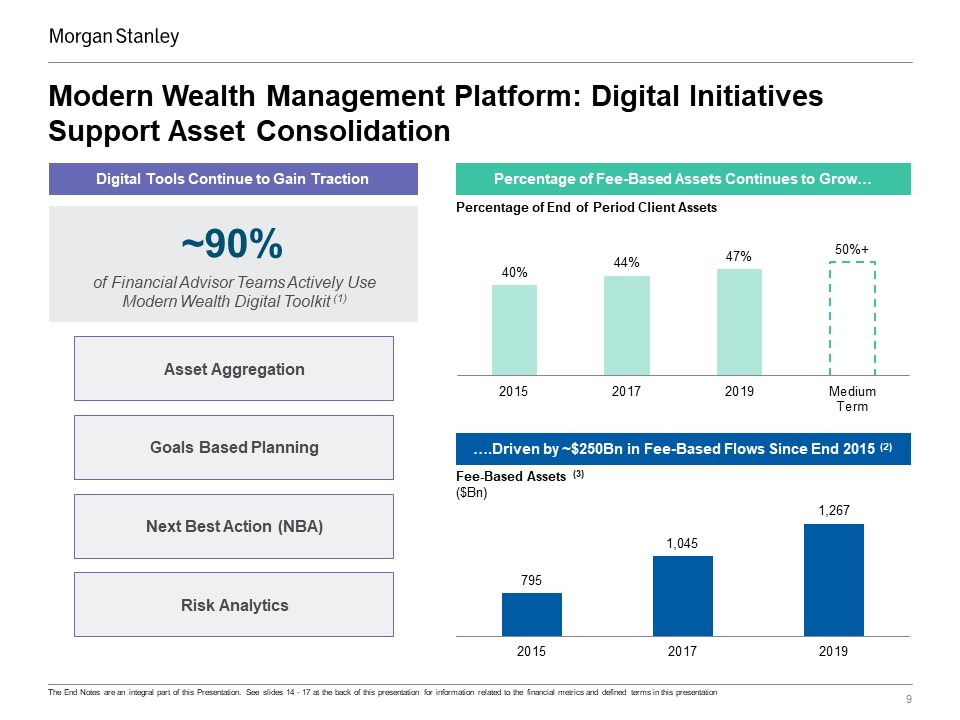
Fee-based client assets ($Bn)9
|
$
|
1,267
|
$
|
1,046
|
$
|
1,267
|
$
|
1,046
|
||||||||
|
Fee-based asset flows ($Bn)10
|
$
|
24.9
|
$
|
16.2
|
$
|
64.9
|
$
|
65.9
|
||||||||
|
Loans ($Bn)
|
$
|
80.1
|
$
|
72.2
|
$
|
80.1
|
$
|
72.2
|
||||||||
|
Investment Management
|
||||||||||||||||
|
Net revenues
|
$
|
1,356
|
$
|
684
|
$
|
3,763
|
$
|
2,746
|
||||||||
|
AUM ($Bn)11
|
$
|
552
|
$
|
463
|
$
|
552
|
$
|
463
|
||||||||
|
Long-term net flows ($Bn)12
|
$
|
6.7
|
$
|
(3.2
|
)
|
$
|
15.4
|
$
|
4.8
|
|||||||
|
Highlights
|
|
|
●
|
Fourth quarter net revenues 27% increase helped deliver record full year net revenues of $41.4 billion.
|
|
|
|
|
●
|
Achieved record full year net income reflecting the strength and balance of the franchise.
|
|
|
|
|
|
|
|
●
|
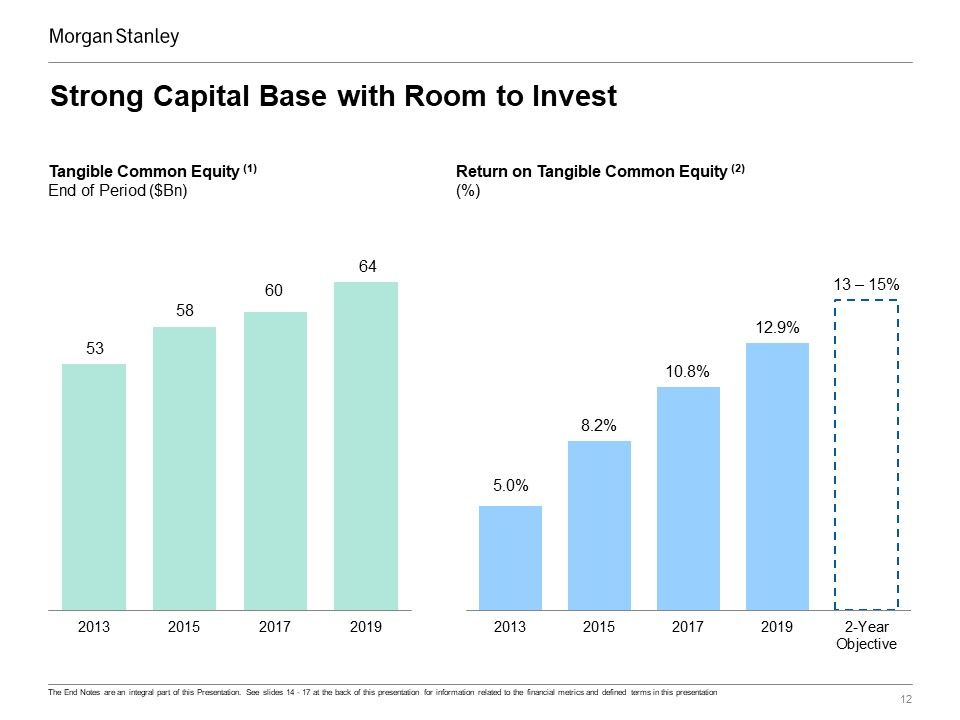
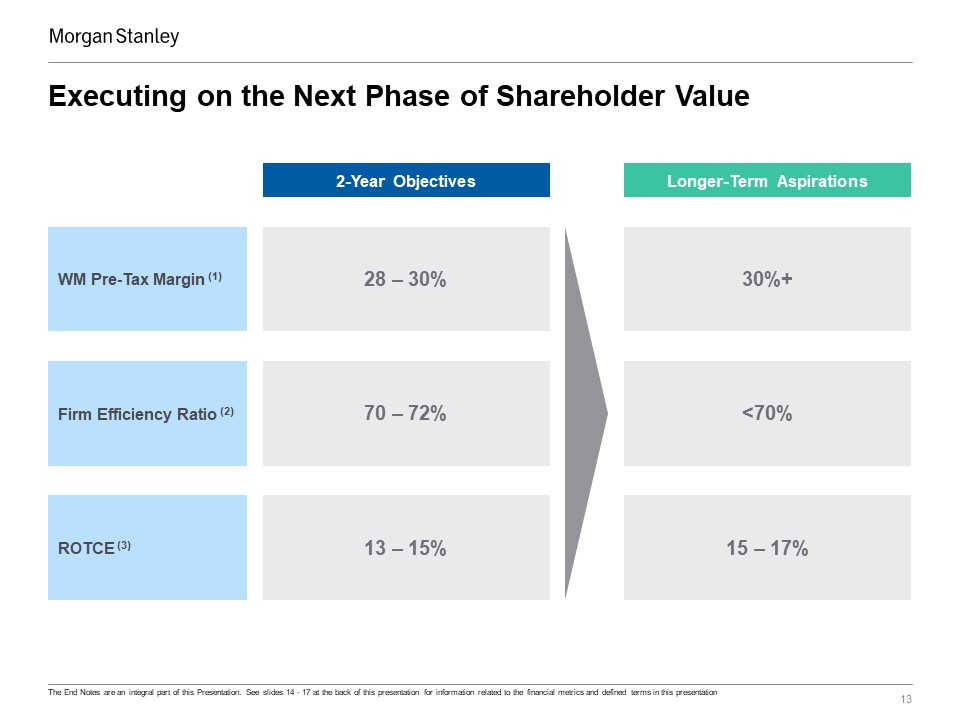
Full year ROE of 11.7%5 and ROTCE of 13.4%5 in line with our target ranges.
|
|
|
|
|
●
|
Institutional Securities reflects the fourth consecutive quarter of net revenues over $5 billion. Results for the full year reflect solid performance across products despite a mixed market backdrop.
|
|
|
|
|
●
|
Wealth Management delivered a pre-tax margin of 27.2% for the full year reflecting record net revenues and pre-tax income.6,7
|
|
|
|
|
●
|
Investment Management results reflect both a strong quarter and full year on accrued carried interest and higher fee revenues. AUM up 19% reflecting continued strong positive net flows.
|
|
Media Relations: Wesley McDade 212-761-2430
|
Investor Relations: Sharon Yeshaya 212-761-1632
|

|
Investment Banking revenues up 11% from a year ago:
|
|
|
|
|
|
●
|
Advisory revenues decreased from a year ago driven by lower levels of completed M&A activity.
|
|
|
|
|
●
|
Equity underwriting revenues increased from a year ago driven by higher revenues on IPOs, particularly in Asia, and follow-on offerings.
|
|
|
|
|
●
|
Fixed income underwriting revenues increased from a year ago primarily driven by higher investment grade and non-investment grade bond fees.
|
|
|
|
|
Sales and Trading net revenues up 28% from a year ago:
|
|
|
|
|
|
●
|
Equity sales and trading net revenues were in line with a year ago reflecting continued strength in prime brokerage and solid results in cash
equities, partially offset by declines in derivatives on lower volatility.
|
|
|
|
|
●
|
Fixed Income sales and trading net revenues increased from a year ago reflecting improvement across all businesses with particular strength in
credit products.
|
|
|
|
|
●
|
Other sales and trading net revenues compared with a year ago reflect gains on investments associated with certain employee deferred compensation
plans, offset by losses on economic hedges associated with corporate lending activity.
|
|
|
|
|
Investments and Other:
|
|
|
|
|
|
●
|
Investment revenues increased from a year ago driven by mark-to-market net gains on holdings of publicly traded investments compared with net
losses in the prior year.
|
|
|
|
|
●
|
Other revenues increased from a year ago primarily related to mark-to-market gains associated with corporate lending activity and a gain on sale
of a commodities related intangible asset.
|
|
|
|
|
Total Expenses:
|
|
|
|
|
|
●
|
Compensation expense increased from a year ago driven by higher
revenues, increases in the fair value of deferred compensation plan referenced investments and severance costs associated with the December employee action of $124 million.3
|
|
($ millions)
|
4Q 2019
|
4Q 2018
|
||||||
|
Net Revenues
|
$
|
5,054
|
$
|
3,839
|
||||
|
Investment Banking
|
$
|
1,576
|
$
|
1,417
|
||||
|
Advisory
|
$
|
654
|
$
|
734
|
||||
|
Equity underwriting
|
$
|
422
|
$
|
323
|
||||
|
Fixed income underwriting
|
$
|
500
|
$
|
360
|
||||
|
Sales and Trading
|
$
|
3,194
|
$
|
2,487
|
||||
|
Equity
|
$
|
1,920
|
$
|
1,929
|
||||
|
Fixed Income
|
$
|
1,273
|
$
|
564
|
||||
|
Other
|
$
|
1
|
$
|
(6
|
)
|
|||
|
Investments and Other
|
$
|
284
|
$
|
(65
|
)
|
|||
|
Investments
|
$
|
68
|
$
|
(52
|
)
|
|||
|
Other
|
$
|
216
|
$
|
(13
|
)
|
|||
|
Total Expenses
|
$
|
3,929
|
$
|
3,059
|
||||
|
Compensation
|
$
|
2,057
|
$
|
1,179
|
||||
|
Non-compensation
|
$
|
1,872
|
$
|
1,880
|
||||
|
|
||||||||

|
Net revenues up 11% from a year ago:
|
|
|
|
|
|
●
|
Asset management revenues increased from a year ago reflecting higher asset levels with record positive flows.
|
|
|
|
|
●
|
Transactional revenues13 increased from a year ago primarily driven by gains on investments associated with certain employee
deferred compensation plans and increases in investment banking activity.
|
|
|
|
|
●
|
Net interest income decreased 6% compared with a year ago primarily driven by changes in funding mix. Wealth Management client
liabilities14 were $90 billion at quarter end compared with $83 billion a year ago.
|
|
|
|
|
Total Expenses:
|
|
|
|
|
|
●
|
Compensation expense increased from a year ago primarily
driven by increases in the fair value of deferred compensation plan referenced investments and severance costs associated with the December employee action3 partially offset by decreases in retention note expense.
|
|
($ millions)
|
4Q 2019
|
4Q 2018
|
||||||
|
Net Revenues
|
$
|
4,582
|
$
|
4,144
|
||||
|
Asset management
|
$
|
2,655
|
$
|
2,576
|
||||
|
Transactional13
|
$
|
829
|
$
|
422
|
||||
|
Net interest
|
$
|
1,033
|
$
|
1,095
|
||||
|
Other
|
$
|
65
|
$
|
51
|
||||
|
Total Expenses
|
$
|
3,419
|
$
|
3,134
|
||||
|
Compensation
|
$
|
2,590
|
$
|
2,286
|
||||
|
Non-compensation
|
$
|
829
|
$
|
848
|
||||
|
Net revenues up 98% from a year ago:
|
|
|
|
|
|
●
|
Asset management revenues increased from a year ago driven by higher levels of AUM on strong net flows and higher performance fees.
|
|
|
|
|
●
|
Investment revenues increased from a year ago on accrued carried interest related to an underlying investment’s initial public offering, subject
to sales restrictions, within an Asia private equity fund managed on behalf of clients.
|
|
|
|
|
●
|
Other revenues were negative $50 million compared with negative $26 million in the prior year. Results include impairments of two distinct
equity method investments in third party asset managers, one in each year.
|
|
|
|
|
Total Expenses:
|
|
|
|
|
|
●
|
Compensation expense increased from a year ago principally due to
an increase in carried interest and severance costs associated with the December employee action.3
|
|
|
|
|
●
|
Non-compensation expenses increased from a year ago driven by higher brokerage and clearing costs, relating to higher fee revenue and client
capital raising.
|
|
($ millions)
|
4Q 2019
|
4Q 2018
|
||||||
|
Net Revenues
|
$
|
1,356
|
$
|
684
|
||||
|
Asset management
|
$
|
736
|
$
|
628
|
||||
|
Investments
|
$
|
670
|
$
|
82
|
||||
|
Other
|
$
|
(50
|
)
|
$
|
(26
|
)
|
||
|
Total Expenses
|
$
|
909
|
$
|
610
|
||||
|
Compensation
|
$
|
581
|
$
|
322
|
||||
|
Non-compensation
|
$
|
328
|
$
|
288
|
||||

|
Institutional Securities
|
|
|
|
|
|
●
|
Institutional Securities net revenues reflect a strong
performance across all businesses which resulted in pre-tax income of $5.5 billion compared with $6.3 billion in the prior year.7
|
|
|
|
|
●
|
Investment Banking net revenues declined from a year ago. Results reflect solid underwriting revenues which were essentially unchanged from
a strong prior year, offset by declines in advisory revenues on lower completed M&A volumes.
|
|
|
|
|
●
|
Sales and Trading net revenues were in line with the prior year. Fixed Income sales and trading increased 11% from a year ago on strong
client engagement while Equity sales and trading net revenues decreased in an environment characterized by lower cash market volumes and lower volatility in derivatives.
|
|
|
|
|
●
|
Investment revenues increased from a year ago reflecting mark-to-market net gains on publicly traded investments.
|
|
|
|
|
●
|
Other revenues increased from a year ago reflecting mark-to-market gains on corporate lending activity partially offset by lower results
in our Japanese joint venture Mitsubishi UFJ Morgan Stanley Securities Co., Ltd.
|
|
|
|
|
●
|
Compensation expense increased from a year ago driven by
increases in the fair value of deferred compensation plan referenced investments, higher salaries and severance costs associated with the December employee action,3 partially offset by lower discretionary incentive compensation.
|
|
|
|
|
●
|
Non-compensation expenses increased from a year ago reflecting higher technology costs, partially offset by lower professional services.
|
|
($ millions)
|
FY 2019
|
FY 2018
|
||||||
|
Net Revenues
|
$
|
20,386
|
$
|
20,582
|
||||
|
Investment Banking
|
$
|
5,734
|
$
|
6,088
|
||||
|
Sales and Trading
|
$
|
13,695
|
$
|
13,777
|
||||
|
Investments
|
$
|
325
|
$
|
182
|
||||
|
Other
|
$
|
632
|
$
|
535
|
||||
|
Total Expenses
|
$
|
14,896
|
$
|
14,322
|
||||
|
Compensation
|
$
|
7,433
|
$
|
6,958
|
||||
|
Non-compensation
|
$
|
7,463
|
$
|
7,364
|
||||

|
●
|
Wealth Management’s record pre-tax income of $4.8 billion
delivered a pre-tax margin of 27.2%.6,7
|
|
|
|
|
●
|
Asset management revenues increased modestly from a year ago as the impact of higher asset levels during the year were offset by lower fee
based client asset levels at the beginning of the year due to significant market declines in the fourth quarter of 2018.
|
|
|
|
|
●
|
Transactional revenues13 increased from a year ago primarily driven by gains on investments associated with certain employee deferred compensation
plans.
|
|
|
|
|
●
|
Net interest income remained essentially unchanged from a year ago reflecting higher costs due to changes in funding mix and increases in
mortgage securities prepayment amortization expense partially offset by the impact of higher average rates and growth in bank lending.
|
|
|
|
|
●
|
Other revenues increased from a year ago driven by higher realized gains on available for sale securities.
|
|
|
|
|
●
|
Compensation expense increased from a year ago primarily driven by increases in the fair value of deferred compensation plan referenced
investments and higher salaries, partially offset by decreases in retention note expense.
|
|
|
|
|
●
|
Non-compensation expenses decreased 3% from a year ago reflecting continued focus on expense discipline.
|
|
($ millions)
|
FY 2019
|
FY 2018
|
||||||
|
Net Revenues
|
$
|
17,737
|
$
|
17,242
|
||||
|
Asset management
|
$
|
10,199
|
$
|
10,158
|
||||
|
Transactional13
|
$
|
2,969
|
$
|
2,558
|
||||
|
Net interest
|
$
|
4,222
|
$
|
4,277
|
||||
|
Other
|
$
|
347
|
$
|
249
|
||||
|
Total Expenses
|
$
|
12,905
|
$
|
12,721
|
||||
|
Compensation
|
$
|
9,774
|
$
|
9,507
|
||||
|
Non-compensation
|
$
|
3,131
|
$
|
3,214
|
||||
|
●
|
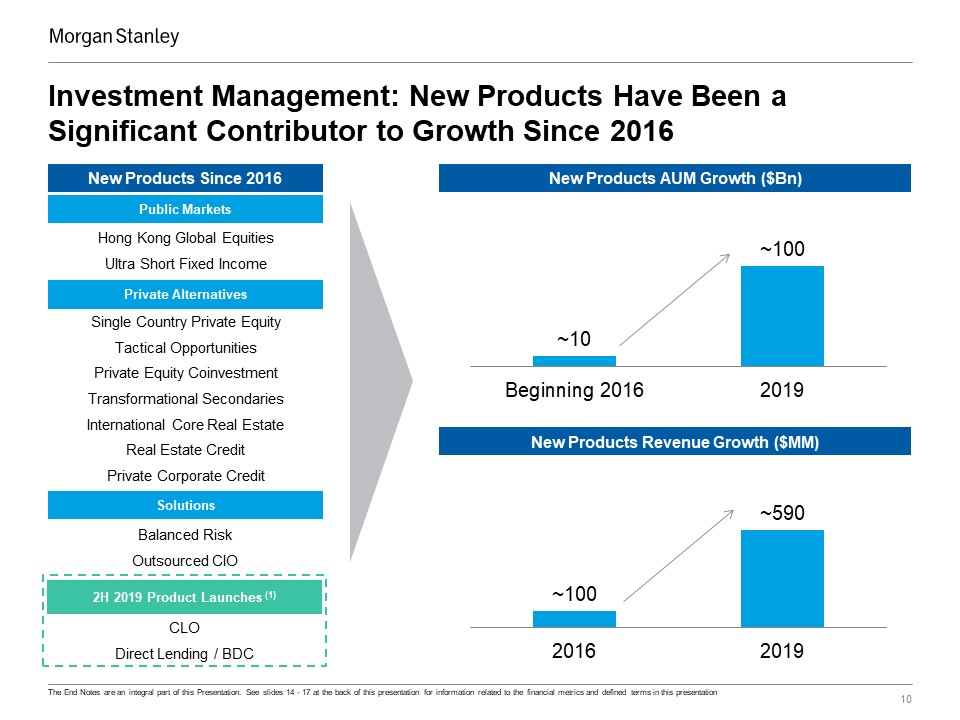
Investment Management net revenues increased 37% from a year
ago, resulting in pre-tax income of $985 million compared with $464 million in the prior year.7
|
|
|
|
|
●
|
Asset management revenues increased from a year ago driven by higher levels of AUM on strong net flows and higher performance fees.
|
|
|
|
|
●
|
Investment revenues increased from a year ago on accrued carried interest primarily in Asia private equity.
|
|
|
|
|
●
|
Other revenues were negative $79 million compared with positive revenues a year ago, driven by the deconsolidation of a fund and
impairments on equity method investments.
|
|
|
|
|
●
|
Compensation expense increased from a year ago principally due to an increase in carried interest.
|
|
|
|
|
●
|
Non-compensation expenses increased from a year ago driven by higher brokerage and clearing costs, relating to higher fee revenue and
client capital raising.
|
|
($ millions)
|
FY 2019
|
FY 2018
|
||||||
|
Net Revenues
|
$
|
3,763
|
$
|
2,746
|
||||
|
Asset management
|
$
|
2,629
|
$
|
2,468
|
||||
|
Investments
|
$
|
1,213
|
$
|
254
|
||||
|
Other
|
$
|
(79
|
)
|
$
|
24
|
|||
|
Total Expenses
|
$
|
2,778
|
$
|
2,282
|
||||
|
Compensation
|
$
|
1,630
|
$
|
1,167
|
||||
|
Non-compensation
|
$
|
1,148
|
$
|
1,115
|
||||

|
●
|
The Firm repurchased $1.5 billion of its outstanding common stock during the quarter as part of its Share Repurchase Program. During the
year ended December 31, 2019, the Firm repurchased $5.4 billion of its common stock or approximately 121 million shares.
|
|
|
|
|
●
|
The Board of Directors declared a $0.35 quarterly dividend per share, payable on February 14, 2020 to common shareholders of record on
January 31, 2020.
|
|
|
|
|
●
|
The effective tax rate for the current quarter was 15.7% and the full year was 18.3% which included intermittent net discrete tax benefits
of $158 million and $348 million, respectively. The effective tax rate in the prior year quarter was 16.2% and the full year was 20.9%, which included intermittent net discrete tax benefits of $111 million and $203 million,
respectively. The intermittent net discrete tax benefits in the current and prior year periods were primarily associated with remeasurement of reserves as a result of new information pertaining to the resolution of
multi-jurisdiction tax examinations and other tax matters.
|
|
4Q 2019
|
4Q 2018
|
FY 2019
|
FY 2018
|
|||||||||||||
|
Common Stock Repurchases
|
||||||||||||||||
|
Repurchases ($MM)
|
$
|
1,500
|
$
|
1,180
|
$
|
5,360
|
$
|
4,860
|
||||||||
|
Number of Shares (MM)
|
31
|
27
|
121
|
97
|
||||||||||||
|
Average Price
|
$
|
48.49
|
$
|
43.77
|
$
|
44.23
|
$
|
50.08
|
||||||||
|
Period End Shares (MM)
|
1,594
|
1,700
|
1,594
|
1,700
|
||||||||||||
|
Tax Rate
|
15.7
|
%
|
16.2
|
%
|
18.3
|
%
|
20.9
|
%
|
||||||||
|
Capital15
|
||||||||||||||||
|
Common Equity Tier 1 capital16
|
16.4
|
%
|
16.9
|
%
|
||||||||||||
|
Tier 1 capital16
|
18.6
|
%
|
19.2
|
%
|
||||||||||||
|
Tier 1 leverage17
|
8.2
|
%
|
8.4
|
%
|
||||||||||||
|
SLR18
|
6.3
|
%
|
6.5
|
%
|
||||||||||||


|
Quarter Ended
|
Percentage Change From:
|
Twelve Months Ended
|
Percentage
|
|||||||||||||||||||||||||||||
|
Dec 31, 2019
|
Sep 30, 2019
|
Dec 31, 2018
|
Sep 30, 2019
|
Dec 31, 2018
|
Dec 31, 2019
|
Dec 31, 2018
|
Change
|
|||||||||||||||||||||||||
|
Revenues:
|
||||||||||||||||||||||||||||||||
|
Investment banking
|
$
|
1,696
|
$
|
1,635
|
$
|
1,488
|
4
|
%
|
14
|
%
|
$
|
6,163
|
$
|
6,482
|
(5
|
%)
|
||||||||||||||||
|
Trading
|
2,314
|
2,608
|
1,736
|
(11
|
%)
|
33
|
%
|
11,095
|
11,551
|
(4
|
%)
|
|||||||||||||||||||||
|
Investments
|
739
|
87
|
28
|
*
|
*
|
1,540
|
437
|
*
|
||||||||||||||||||||||||
|
Commissions and fees
|
984
|
990
|
1,046
|
(1
|
%)
|
(6
|
%)
|
3,919
|
4,190
|
(6
|
%)
|
|||||||||||||||||||||
|
Asset management
|
3,451
|
3,363
|
3,266
|
3
|
%
|
6
|
%
|
13,083
|
12,898
|
1
|
%
|
|||||||||||||||||||||
|
Other
|
240
|
131
|
(5
|
)
|
83
|
%
|
*
|
925
|
743
|
24
|
%
|
|||||||||||||||||||||
|
Total non-interest revenues
|
9,424
|
8,814
|
7,559
|
7
|
%
|
25
|
%
|
36,725
|
36,301
|
1
|
%
|
|||||||||||||||||||||
|
Interest income
|
3,952
|
4,350
|
4,111
|
(9
|
%)
|
(4
|
%)
|
17,098
|
13,892
|
23
|
%
|
|||||||||||||||||||||
|
Interest expense
|
2,519
|
3,132
|
3,122
|
(20
|
%)
|
(19
|
%)
|
12,404
|
10,086
|
23
|
%
|
|||||||||||||||||||||
|
Net interest
|
1,433
|
1,218
|
989
|
18
|
%
|
45
|
%
|
4,694
|
3,806
|
23
|
%
|
|||||||||||||||||||||
|
Net revenues
|
10,857
|
10,032
|
8,548
|
8
|
%
|
27
|
%
|
41,419
|
40,107
|
3
|
%
|
|||||||||||||||||||||
|
Non-interest expenses:
|
||||||||||||||||||||||||||||||||
|
Compensation and benefits
|
5,228
|
4,427
|
3,787
|
18
|
%
|
38
|
%
|
18,837
|
17,632
|
7
|
%
|
|||||||||||||||||||||
|
Non-compensation expenses:
|
||||||||||||||||||||||||||||||||
|
Occupancy and equipment
|
375
|
353
|
358
|
6
|
%
|
5
|
%
|
1,428
|
1,391
|
3
|
%
|
|||||||||||||||||||||
|
Brokerage, clearing and exchange fees
|
633
|
637
|
598
|
(1
|
%)
|
6
|
%
|
2,493
|
2,393
|
4
|
%
|
|||||||||||||||||||||
|
Information processing and communications
|
567
|
557
|
529
|
2
|
%
|
7
|
%
|
2,194
|
2,016
|
9
|
%
|
|||||||||||||||||||||
|
Marketing and business development
|
200
|
157
|
220
|
27
|
%
|
(9
|
%)
|
660
|
691
|
(4
|
%)
|
|||||||||||||||||||||
|
Professional services
|
555
|
531
|
605
|
5
|
%
|
(8
|
%)
|
2,137
|
2,265
|
(6
|
%)
|
|||||||||||||||||||||
|
Other
|
566
|
660
|
594
|
(14
|
%)
|
(5
|
%)
|
2,369
|
2,482
|
(5
|
%)
|
|||||||||||||||||||||
|
Total non-compensation expenses
|
2,896
|
2,895
|
2,904
|
--
|
--
|
11,281
|
11,238
|
--
|
||||||||||||||||||||||||
|
Total non-interest expenses
|
8,124
|
7,322
|
6,691
|
11
|
%
|
21
|
%
|
30,118
|
28,870
|
4
|
%
|
|||||||||||||||||||||
|
Income (loss) from continuing operations before taxes
|
2,733
|
2,710
|
1,857
|
1
|
%
|
47
|
%
|
11,301
|
11,237
|
1
|
%
|
|||||||||||||||||||||
|
Income tax provision / (benefit) from continuing operations
|
428
|
492
|
300
|
(13
|
%)
|
43
|
%
|
2,064
|
2,350
|
(12
|
%)
|
|||||||||||||||||||||
|
Income (loss) from continuing operations
|
2,305
|
2,218
|
1,557
|
4
|
%
|
48
|
%
|
9,237
|
8,887
|
4
|
%
|
|||||||||||||||||||||
|
Gain (loss) from discontinued operations after tax
|
0
|
0
|
1
|
--
|
*
|
0
|
(4
|
)
|
*
|
|||||||||||||||||||||||
|
Net income (loss)
|
$
|
2,305
|
$
|
2,218
|
$
|
1,558
|
4
|
%
|
48
|
%
|
$
|
9,237
|
$
|
8,883
|
4
|
%
|
||||||||||||||||
|
Net income applicable to nonredeemable noncontrolling interests
|
66
|
45
|
27
|
47
|
%
|
144
|
%
|
195
|
135
|
44
|
%
|
|||||||||||||||||||||
|
Net income (loss) applicable to Morgan Stanley
|
2,239
|
2,173
|
1,531
|
3
|
%
|
46
|
%
|
9,042
|
8,748
|
3
|
%
|
|||||||||||||||||||||
|
Preferred stock dividend / Other
|
154
|
113
|
170
|
36
|
%
|
(9
|
%)
|
530
|
526
|
1
|
%
|
|||||||||||||||||||||
|
Earnings (loss) applicable to Morgan Stanley common shareholders
|
$
|
2,085
|
$
|
2,060
|
$
|
1,361
|
1
|
%
|
53
|
%
|
$
|
8,512
|
$
|
8,222
|
4
|
%
|
||||||||||||||||
|
Quarter Ended
|
Percentage Change From:
|
Twelve Months Ended
|
Percentage
|
|||||||||||||||||||||||||||||
|
Dec 31, 2019
|
Sep 30, 2019
|
Dec 31, 2018
|
Sep 30, 2019
|
Dec 31, 2018
|
Dec 31, 2019
|
Dec 31, 2018
|
Change
|
|||||||||||||||||||||||||
|
Financial Metrics:
|
||||||||||||||||||||||||||||||||
|
Earnings per basic share
|
$
|
1.33
|
$
|
1.28
|
$
|
0.81
|
4
|
%
|
64
|
%
|
$
|
5.26
|
$
|
4.81
|
9
|
%
|
||||||||||||||||
|
Earnings per diluted share
|
$
|
1.30
|
$
|
1.27
|
$
|
0.80
|
2
|
%
|
63
|
%
|
$
|
5.19
|
$
|
4.73
|
10
|
%
|
||||||||||||||||
|
|
||||||||||||||||||||||||||||||||
|
Return on average common equity
|
11.3
|
%
|
11.2
|
%
|
7.7
|
%
|
11.7
|
%
|
11.8
|
%
|
||||||||||||||||||||||
|
Return on average tangible common equity
|
13.0
|
%
|
12.9
|
%
|
8.8
|
%
|
13.4
|
%
|
13.5
|
%
|
||||||||||||||||||||||
|
|
||||||||||||||||||||||||||||||||
|
Book value per common share
|
$
|
45.82
|
$
|
45.49
|
$
|
42.20
|
$
|
45.82
|
$
|
42.20
|
||||||||||||||||||||||
|
Tangible book value per common share
|
$
|
40.01
|
$
|
39.73
|
$
|
36.99
|
$
|
40.01
|
$
|
36.99
|
||||||||||||||||||||||
|
|
||||||||||||||||||||||||||||||||
|
Excluding intermittent net discrete tax provision / benefit
|
||||||||||||||||||||||||||||||||
|
Adjusted earnings per diluted share
|
$
|
1.20
|
$
|
1.21
|
$
|
0.73
|
(1
|
%)
|
64
|
%
|
$
|
4.98
|
$
|
4.61
|
8
|
%
|
||||||||||||||||
|
Adjusted return on average common equity
|
10.5
|
%
|
10.7
|
%
|
7.1
|
%
|
11.2
|
%
|
11.5
|
%
|
||||||||||||||||||||||
|
Adjusted return on average tangible common equity
|
12.0
|
%
|
12.3
|
%
|
8.1
|
%
|
12.9
|
%
|
13.2
|
%
|
||||||||||||||||||||||
|
Financial Ratios:
|
||||||||||||||||||||||||||||||||
|
Pre-tax profit margin
|
25
|
%
|
27
|
%
|
22
|
%
|
27
|
%
|
28
|
%
|
||||||||||||||||||||||
|
Compensation and benefits as a % of net revenues
|
48
|
%
|
44
|
%
|
44
|
%
|
45
|
%
|
44
|
%
|
||||||||||||||||||||||
|
Non-compensation expenses as a % of net revenues
|
27
|
%
|
29
|
%
|
34
|
%
|
27
|
%
|
28
|
%
|
||||||||||||||||||||||
|
Firm expense efficiency ratio
|
75
|
%
|
73
|
%
|
78
|
%
|
73
|
%
|
72
|
%
|
||||||||||||||||||||||
|
Effective tax rate from continuing operations
|
15.7
|
%
|
18.2
|
%
|
16.2
|
%
|
18.3
|
%
|
20.9
|
%
|
||||||||||||||||||||||
|
Statistical Data:
|
||||||||||||||||||||||||||||||||
|
Period end common shares outstanding (millions)
|
1,594
|
1,624
|
1,700
|
(2
|
%)
|
(6
|
%)
|
|||||||||||||||||||||||||
|
Average common shares outstanding (millions)
|
||||||||||||||||||||||||||||||||
|
Basic
|
1,573
|
1,604
|
1,674
|
(2
|
%)
|
(6
|
%)
|
1,617
|
1,708
|
(5
|
%)
|
|||||||||||||||||||||
|
Diluted
|
1,602
|
1,627
|
1,705
|
(2
|
%)
|
(6
|
%)
|
1,640
|
1,738
|
(6
|
%)
|
|||||||||||||||||||||
|
Worldwide employees
|
60,431
|
60,532
|
60,348
|
--
|
--
|
|||||||||||||||||||||||||||
|
Fourth Quarter 2019 Earnings Results
|
|
|
Quarterly Financial Supplement
|
Page
|
|
Consolidated Financial Summary
|
1
|
|
Consolidated Financial Metrics, Ratios and Statistical Data
|
2
|
|
Consolidated Financial Information
|
3
|
|
Consolidated Average Common Equity and Regulatory Capital Information
|
4
|
|
Institutional Securities Income Statement Information, Financial Metrics and Ratios
|
5
|
|
Wealth Management Income Statement Information, Financial Metrics and Ratios
|
6
|
|
Wealth Management Financial Information and Statistical Data
|
7
|
|
Investment Management Income Statement Information, Financial Metrics and Ratios
|
8
|
|
Investment Management Financial Information and Statistical Data
|
9
|
|
Consolidated Loans and Lending Commitments
|
10
|
|
U.S. Bank Supplemental Financial Information
|
11
|
|
Definition of U.S. GAAP to Non-GAAP Measures
|
12
|
|
Definition of Performance Metrics and Terms
|
13 - 14
|
|
Supplemental Quantitative Details and Calculations
|
15 - 16
|
|
Legal Notice
|
17
|
|
Quarter Ended
|
Percentage Change From:
|
Twelve Months Ended
|
Percentage
|
|||||||||||||||||||||||||||||
|
Dec 31, 2019
|
Sep 30, 2019
|
Dec 31, 2018
|
Sep 30, 2019
|
Dec 31, 2018
|
Dec 31, 2019
|
Dec 31, 2018
|
Change
|
|||||||||||||||||||||||||
|
Net revenues
|
||||||||||||||||||||||||||||||||
|
Institutional Securities
|
$
|
5,054
|
$
|
5,023
|
$
|
3,839
|
1
|
%
|
32
|
%
|
$
|
20,386
|
$
|
20,582
|
(1
|
%)
|
||||||||||||||||
|
Wealth Management
|
4,582
|
4,358
|
4,144
|
5
|
%
|
11
|
%
|
17,737
|
17,242
|
3
|
%
|
|||||||||||||||||||||
|
Investment Management
|
1,356
|
764
|
684
|
77
|
%
|
98
|
%
|
3,763
|
2,746
|
37
|
%
|
|||||||||||||||||||||
|
Intersegment Eliminations
|
(135
|
)
|
(113
|
)
|
(119
|
)
|
(19
|
%)
|
(13
|
%)
|
(467
|
)
|
(463
|
)
|
(1
|
%)
|
||||||||||||||||
|
Net revenues
|
$
|
10,857
|
$
|
10,032
|
$
|
8,548
|
8
|
%
|
27
|
%
|
$
|
41,419
|
$
|
40,107
|
3
|
%
|
||||||||||||||||
|
Non-interest expenses
|
||||||||||||||||||||||||||||||||
|
Institutional Securities
|
$
|
3,929
|
$
|
3,716
|
$
|
3,059
|
6
|
%
|
28
|
%
|
$
|
14,896
|
$
|
14,322
|
4
|
%
|
||||||||||||||||
|
Wealth Management
|
3,419
|
3,120
|
3,134
|
10
|
%
|
9
|
%
|
12,905
|
12,721
|
1
|
%
|
|||||||||||||||||||||
|
Investment Management
|
909
|
599
|
610
|
52
|
%
|
49
|
%
|
2,778
|
2,282
|
22
|
%
|
|||||||||||||||||||||
|
Intersegment Eliminations
|
(133
|
)
|
(113
|
)
|
(112
|
)
|
(18
|
%)
|
(19
|
%)
|
(461
|
)
|
(455
|
)
|
(1
|
%)
|
||||||||||||||||
|
Non-interest expenses (1)
|
$
|
8,124
|
$
|
7,322
|
$
|
6,691
|
11
|
%
|
21
|
%
|
$
|
30,118
|
$
|
28,870
|
4
|
%
|
||||||||||||||||
|
Income (loss) before taxes
|
||||||||||||||||||||||||||||||||
|
Institutional Securities
|
$
|
1,125
|
$
|
1,307
|
$
|
780
|
(14
|
%)
|
44
|
%
|
$
|
5,490
|
$
|
6,260
|
(12
|
%)
|
||||||||||||||||
|
Wealth Management
|
1,163
|
1,238
|
1,010
|
(6
|
%)
|
15
|
%
|
4,832
|
4,521
|
7
|
%
|
|||||||||||||||||||||
|
Investment Management
|
447
|
165
|
74
|
171
|
%
|
*
|
985
|
464
|
112
|
%
|
||||||||||||||||||||||
|
Intersegment Eliminations
|
(2
|
)
|
0
|
(7
|
)
|
*
|
71
|
%
|
(6
|
)
|
(8
|
)
|
25
|
%
|
||||||||||||||||||
|
Income (loss) before taxes
|
$
|
2,733
|
$
|
2,710
|
$
|
1,857
|
1
|
%
|
47
|
%
|
$
|
11,301
|
$
|
11,237
|
1
|
%
|
||||||||||||||||
|
Net Income (loss) applicable to Morgan Stanley
|
||||||||||||||||||||||||||||||||
|
Institutional Securities
|
$
|
1,034
|
$
|
1,073
|
$
|
702
|
(4
|
%)
|
47
|
%
|
$
|
4,599
|
$
|
4,906
|
(6
|
%)
|
||||||||||||||||
|
Wealth Management
|
889
|
962
|
769
|
(8
|
%)
|
16
|
%
|
3,728
|
3,472
|
7
|
%
|
|||||||||||||||||||||
|
Investment Management
|
317
|
138
|
65
|
130
|
%
|
*
|
719
|
376
|
91
|
%
|
||||||||||||||||||||||
|
Intersegment Eliminations
|
(1
|
)
|
0
|
(5
|
)
|
*
|
80
|
%
|
(4
|
)
|
(6
|
)
|
33
|
%
|
||||||||||||||||||
|
Net Income (loss) applicable to Morgan Stanley
|
$
|
2,239
|
$
|
2,173
|
$
|
1,531
|
3
|
%
|
46
|
%
|
$
|
9,042
|
$
|
8,748
|
3
|
%
|
||||||||||||||||
|
Earnings (loss) applicable to Morgan Stanley common shareholders
|
$
|
2,085
|
$
|
2,060
|
$
|
1,361
|
1
|
%
|
53
|
%
|
$
|
8,512
|
$
|
8,222
|
4
|
%
|
||||||||||||||||
|
Quarter Ended
|
Percentage Change From:
|
Twelve Months Ended
|
Percentage
|
|||||||||||||||||||||||||||||
|
Dec 31, 2019
|
Sep 30, 2019
|
Dec 31, 2018
|
Sep 30, 2019
|
Dec 31, 2018
|
Dec 31, 2019
|
Dec 31, 2018
|
Change
|
|||||||||||||||||||||||||
|
Financial Metrics:
|
||||||||||||||||||||||||||||||||
|
Earnings per basic share
|
$
|
1.33
|
$
|
1.28
|
$
|
0.81
|
4
|
%
|
64
|
%
|
$
|
5.26
|
$
|
4.81
|
9
|
%
|
||||||||||||||||
|
Earnings per diluted share
|
$
|
1.30
|
$
|
1.27
|
$
|
0.80
|
2
|
%
|
63
|
%
|
$
|
5.19
|
$
|
4.73
|
10
|
%
|
||||||||||||||||
|
Return on average common equity
|
11.3
|
%
|
11.2
|
%
|
7.7
|
%
|
11.7
|
%
|
11.8
|
%
|
||||||||||||||||||||||
|
Return on average tangible common equity
|
13.0
|
%
|
12.9
|
%
|
8.8
|
%
|
13.4
|
%
|
13.5
|
%
|
||||||||||||||||||||||
|
Book value per common share
|
$
|
45.82
|
$
|
45.49
|
$
|
42.20
|
$
|
45.82
|
$
|
42.20
|
||||||||||||||||||||||
|
Tangible book value per common share
|
$
|
40.01
|
$
|
39.73
|
$
|
36.99
|
$
|
40.01
|
$
|
36.99
|
||||||||||||||||||||||
|
Excluding intermittent net discrete tax provision / benefit (1)(2)
|
||||||||||||||||||||||||||||||||
|
Adjusted earnings per diluted share
|
$
|
1.20
|
$
|
1.21
|
$
|
0.73
|
(1
|
%)
|
64
|
%
|
$
|
4.98
|
$
|
4.61
|
8
|
%
|
||||||||||||||||
|
Adjusted return on average common equity
|
10.5
|
%
|
10.7
|
%
|
7.1
|
%
|
11.2
|
%
|
11.5
|
%
|
||||||||||||||||||||||
|
Adjusted return on average tangible common equity
|
12.0
|
%
|
12.3
|
%
|
8.1
|
%
|
12.9
|
%
|
13.2
|
%
|
||||||||||||||||||||||
|
Financial Ratios:
|
||||||||||||||||||||||||||||||||
|
Pre-tax profit margin
|
25
|
%
|
27
|
%
|
22
|
%
|
27
|
%
|
28
|
%
|
||||||||||||||||||||||
|
Compensation and benefits as a % of net revenues
|
48
|
%
|
44
|
%
|
44
|
%
|
45
|
%
|
44
|
%
|
||||||||||||||||||||||
|
Non-compensation expenses as a % of net revenues
|
27
|
%
|
29
|
%
|
34
|
%
|
27
|
%
|
28
|
%
|
||||||||||||||||||||||
|
Firm expense efficiency ratio
|
75
|
%
|
73
|
%
|
78
|
%
|
73
|
%
|
72
|
%
|
||||||||||||||||||||||
|
Effective tax rate from continuing operations (1)(2)
|
15.7
|
%
|
18.2
|
%
|
16.2
|
%
|
18.3
|
%
|
20.9
|
%
|
||||||||||||||||||||||
|
Statistical Data:
|
||||||||||||||||||||||||||||||||
|
Period end common shares outstanding (millions)
|
1,594
|
1,624
|
1,700
|
(2
|
%)
|
(6
|
%)
|
|||||||||||||||||||||||||
|
Average common shares outstanding (millions)
|
||||||||||||||||||||||||||||||||
|
Basic
|
1,573
|
1,604
|
1,674
|
(2
|
%)
|
(6
|
%)
|
1,617
|
1,708
|
(5
|
%)
|
|||||||||||||||||||||
|
Diluted
|
1,602
|
1,627
|
1,705
|
(2
|
%)
|
(6
|
%)
|
1,640
|
1,738
|
(6
|
%)
|
|||||||||||||||||||||
|
Worldwide employees
|
60,431
|
60,532
|
60,348
|
--
|
--
|
|||||||||||||||||||||||||||
|
Quarter Ended
|
Percentage Change From:
|
Twelve Months Ended
|
Percentage
|
|||||||||||||||||||||||||||||
|
Dec 31, 2019
|
Sep 30, 2019
|
Dec 31, 2018
|
Sep 30, 2019
|
Dec 31, 2018
|
Dec 31, 2019
|
Dec 31, 2018
|
Change
|
|||||||||||||||||||||||||
|
Regional revenues
|
||||||||||||||||||||||||||||||||
|
Americas
|
$
|
7,890
|
$
|
7,489
|
$
|
6,312
|
5
|
%
|
25
|
%
|
$
|
30,226
|
$
|
29,301
|
3
|
%
|
||||||||||||||||
|
EMEA (Europe, Middle East, Africa)
|
1,374
|
1,409
|
1,200
|
(2
|
%)
|
15
|
%
|
6,061
|
6,092
|
(1
|
%)
|
|||||||||||||||||||||
|
Asia
|
1,593
|
1,134
|
1,036
|
40
|
%
|
54
|
%
|
5,132
|
4,714
|
9
|
%
|
|||||||||||||||||||||
|
Consolidated net revenues
|
$
|
10,857
|
$
|
10,032
|
$
|
8,548
|
8
|
%
|
27
|
%
|
$
|
41,419
|
$
|
40,107
|
3
|
%
|
||||||||||||||||
|
Balance sheet
|
||||||||||||||||||||||||||||||||
|
Deposits
|
$
|
190,356
|
$
|
180,738
|
$
|
187,820
|
5
|
%
|
1
|
%
|
||||||||||||||||||||||
|
Total assets
|
$
|
895,429
|
$
|
902,604
|
$
|
853,531
|
(1
|
%)
|
5
|
%
|
||||||||||||||||||||||
|
Global liquidity reserve
|
$
|
217,457
|
$
|
226,923
|
$
|
249,735
|
(4
|
%)
|
(13
|
%)
|
||||||||||||||||||||||
|
Long-term debt outstanding
|
$
|
190,060
|
$
|
192,362
|
$
|
188,117
|
(1
|
%)
|
1
|
%
|
||||||||||||||||||||||
|
Maturities of long-term debt outstanding (next 12 months)
|
$
|
20,402
|
$
|
23,498
|
$
|
24,694
|
(13
|
%)
|
(17
|
%)
|
||||||||||||||||||||||
|
|
||||||||||||||||||||||||||||||||
|
Common equity
|
$
|
73,029
|
$
|
73,862
|
$
|
71,726
|
(1
|
%)
|
2
|
%
|
||||||||||||||||||||||
|
Less: Goodwill and intangible assets
|
(9,249
|
)
|
(9,350
|
)
|
(8,847
|
)
|
(1
|
%)
|
5
|
%
|
||||||||||||||||||||||
|
Tangible common equity
|
$
|
63,780
|
$
|
64,512
|
$
|
62,879
|
(1
|
%)
|
1
|
%
|
||||||||||||||||||||||
|
|
||||||||||||||||||||||||||||||||
|
Preferred equity
|
$
|
8,520
|
$
|
8,520
|
$
|
8,520
|
--
|
--
|
||||||||||||||||||||||||
|
Quarter Ended
|
Percentage Change From:
|
Twelve Months Ended
|
Percentage
|
|||||||||||||||||||||||||||||
|
Dec 31, 2019
|
Sep 30, 2019
|
Dec 31, 2018
|
Sep 30, 2019
|
Dec 31, 2018
|
Dec 31, 2019
|
Dec 31, 2018
|
Change
|
|||||||||||||||||||||||||
|
Average Common Equity
|
||||||||||||||||||||||||||||||||
|
Institutional Securities
|
$
|
40.4
|
$
|
40.4
|
$
|
40.8
|
--
|
(1
|
%)
|
$
|
40.4
|
$
|
40.8
|
(1
|
%)
|
|||||||||||||||||
|
Wealth Management
|
18.2
|
18.2
|
16.8
|
--
|
8
|
%
|
18.2
|
16.8
|
8
|
%
|
||||||||||||||||||||||
|
Investment Management
|
2.5
|
2.5
|
2.6
|
--
|
(4
|
%)
|
2.5
|
2.6
|
(4
|
%)
|
||||||||||||||||||||||
|
Parent
|
12.4
|
12.3
|
10.7
|
1
|
%
|
16
|
%
|
11.6
|
9.8
|
18
|
%
|
|||||||||||||||||||||
|
Firm
|
$
|
73.5
|
$
|
73.4
|
$
|
70.9
|
--
|
4
|
%
|
$
|
72.7
|
$
|
70.0
|
4
|
%
|
|||||||||||||||||
|
Regulatory Capital
|
||||||||||||||||||||||||||||||||
|
Common Equity Tier 1 capital
|
$
|
64.7
|
$
|
64.3
|
$
|
62.1
|
1
|
%
|
4
|
%
|
||||||||||||||||||||||
|
Tier 1 capital
|
$
|
73.3
|
$
|
72.9
|
$
|
70.6
|
1
|
%
|
4
|
%
|
||||||||||||||||||||||
|
|
||||||||||||||||||||||||||||||||
|
Standardized Approach
|
||||||||||||||||||||||||||||||||
|
Risk-weighted assets
|
$
|
394.3
|
$
|
394.9
|
$
|
367.3
|
--
|
7
|
%
|
|||||||||||||||||||||||
|
Common Equity Tier 1 capital ratio
|
16.4
|
%
|
16.3
|
%
|
16.9
|
%
|
||||||||||||||||||||||||||
|
Tier 1 capital ratio
|
18.6
|
%
|
18.5
|
%
|
19.2
|
%
|
||||||||||||||||||||||||||
|
|
||||||||||||||||||||||||||||||||
|
Advanced Approach
|
||||||||||||||||||||||||||||||||
|
Risk-weighted assets
|
$
|
381.5
|
$
|
387.4
|
$
|
363.1
|
(2
|
%)
|
5
|
%
|
||||||||||||||||||||||
|
Common Equity Tier 1 capital ratio
|
17.0
|
%
|
16.6
|
%
|
17.1
|
%
|
||||||||||||||||||||||||||
|
Tier 1 capital ratio
|
19.2
|
%
|
18.8
|
%
|
19.5
|
%
|
||||||||||||||||||||||||||
|
|
||||||||||||||||||||||||||||||||
|
Leverage-based capital
|
||||||||||||||||||||||||||||||||
|
Tier 1 leverage ratio
|
8.2
|
%
|
8.2
|
%
|
8.4
|
%
|
||||||||||||||||||||||||||
|
Supplementary Leverage Ratio
|
6.3
|
%
|
6.3
|
%
|
6.5
|
%
|
||||||||||||||||||||||||||
|
Quarter Ended
|
Percentage Change From:
|
Twelve Months Ended
|
Percentage
|
|||||||||||||||||||||||||||||
|
Dec 31, 2019
|
Sep 30, 2019
|
Dec 31, 2018
|
Sep 30, 2019
|
Dec 31, 2018
|
Dec 31, 2019
|
Dec 31, 2018
|
Change
|
|||||||||||||||||||||||||
|
Revenues:
|
||||||||||||||||||||||||||||||||
|
Advisory
|
$
|
654
|
$
|
550
|
$
|
734
|
19
|
%
|
(11
|
%)
|
$
|
2,116
|
$
|
2,436
|
(13
|
%)
|
||||||||||||||||
|
Equity
|
422
|
401
|
323
|
5
|
%
|
31
|
%
|
1,708
|
1,726
|
(1
|
%)
|
|||||||||||||||||||||
|
Fixed income
|
500
|
584
|
360
|
(14
|
%)
|
39
|
%
|
1,910
|
1,926
|
(1
|
%)
|
|||||||||||||||||||||
|
Underwriting
|
922
|
985
|
683
|
(6
|
%)
|
35
|
%
|
3,618
|
3,652
|
(1
|
%)
|
|||||||||||||||||||||
|
Investment Banking
|
1,576
|
1,535
|
1,417
|
3
|
%
|
11
|
%
|
5,734
|
6,088
|
(6
|
%)
|
|||||||||||||||||||||
|
Equity
|
1,920
|
1,991
|
1,929
|
(4
|
%)
|
--
|
8,056
|
8,976
|
(10
|
%)
|
||||||||||||||||||||||
|
Fixed Income
|
1,273
|
1,430
|
564
|
(11
|
%)
|
126
|
%
|
5,546
|
5,005
|
11
|
%
|
|||||||||||||||||||||
|
Other
|
1
|
34
|
(6
|
)
|
(97
|
%)
|
*
|
93
|
(204
|
)
|
*
|
|||||||||||||||||||||
|
Sales & Trading
|
3,194
|
3,455
|
2,487
|
(8
|
%)
|
28
|
%
|
13,695
|
13,777
|
(1
|
%)
|
|||||||||||||||||||||
|
Investments
|
68
|
(18
|
)
|
(52
|
)
|
*
|
*
|
325
|
182
|
79
|
%
|
|||||||||||||||||||||
|
Other
|
216
|
51
|
(13
|
)
|
*
|
*
|
632
|
535
|
18
|
%
|
||||||||||||||||||||||
|
Net revenues
|
5,054
|
5,023
|
3,839
|
1
|
%
|
32
|
%
|
20,386
|
20,582
|
(1
|
%)
|
|||||||||||||||||||||
|
Compensation and benefits
|
2,057
|
1,768
|
1,179
|
16
|
%
|
74
|
%
|
7,433
|
6,958
|
7
|
%
|
|||||||||||||||||||||
|
Non-compensation expenses
|
1,872
|
1,948
|
1,880
|
(4
|
%)
|
--
|
7,463
|
7,364
|
1
|
%
|
||||||||||||||||||||||
|
Total non-interest expenses
|
3,929
|
3,716
|
3,059
|
6
|
%
|
28
|
%
|
14,896
|
14,322
|
4
|
%
|
|||||||||||||||||||||
|
Income (loss) before taxes
|
1,125
|
1,307
|
780
|
(14
|
%)
|
44
|
%
|
5,490
|
6,260
|
(12
|
%)
|
|||||||||||||||||||||
|
Net income (loss) applicable to Morgan Stanley (1)
|
$
|
1,034
|
$
|
1,073
|
$
|
702
|
(4
|
%)
|
47
|
%
|
$
|
4,599
|
$
|
4,906
|
(6
|
%)
|
||||||||||||||||
|
Pre-tax profit margin
|
22
|
%
|
26
|
%
|
20
|
%
|
27
|
%
|
30
|
%
|
||||||||||||||||||||||
|
Compensation and benefits as a % of net revenues
|
41
|
%
|
35
|
%
|
31
|
%
|
36
|
%
|
34
|
%
|
||||||||||||||||||||||
|
Non-compensation expenses as a % of net revenues
|
37
|
%
|
39
|
%
|
49
|
%
|
37
|
%
|
36
|
%
|
||||||||||||||||||||||
|
Return on Average Common Equity
|
9
|
%
|
10
|
%
|
6
|
%
|
10
|
%
|
11
|
%
|
||||||||||||||||||||||
|
Return on Average Tangible Common Equity (2)
|
9
|
%
|
10
|
%
|
6
|
%
|
10
|
%
|
11
|
%
|
||||||||||||||||||||||
|
Trading VaR (Average Daily 95% / One-Day VaR)(3)
|
$
|
39
|
$
|
42
|
$
|
49
|
||||||||||||||||||||||||||
|
Quarter Ended
|
Percentage Change From:
|
Twelve Months Ended
|
Percentage
|
|||||||||||||||||||||||||||||
|
Dec 31, 2019
|
Sep 30, 2019
|
Dec 31, 2018
|
Sep 30, 2019
|
Dec 31, 2018
|
Dec 31, 2019
|
Dec 31, 2018
|
Change
|
|||||||||||||||||||||||||
|
Revenues:
|
||||||||||||||||||||||||||||||||
|
Asset management
|
2,655
|
2,639
|
2,576
|
1
|
%
|
3
|
%
|
10,199
|
10,158
|
--
|
||||||||||||||||||||||
|
Transactional
|
829
|
595
|
422
|
39
|
%
|
96
|
%
|
2,969
|
2,558
|
16
|
%
|
|||||||||||||||||||||
|
Net interest income
|
1,033
|
1,043
|
1,095
|
(1
|
%)
|
(6
|
%)
|
4,222
|
4,277
|
(1
|
%)
|
|||||||||||||||||||||
|
Other
|
65
|
81
|
51
|
(20
|
%)
|
27
|
%
|
347
|
249
|
39
|
%
|
|||||||||||||||||||||
|
Net revenues
|
4,582
|
4,358
|
4,144
|
5
|
%
|
11
|
%
|
17,737
|
17,242
|
3
|
%
|
|||||||||||||||||||||
|
Compensation and benefits
|
2,590
|
2,340
|
2,286
|
11
|
%
|
13
|
%
|
9,774
|
9,507
|
3
|
%
|
|||||||||||||||||||||
|
Non-compensation expenses
|
829
|
780
|
848
|
6
|
%
|
(2
|
%)
|
3,131
|
3,214
|
(3
|
%)
|
|||||||||||||||||||||
|
Total non-interest expenses
|
3,419
|
3,120
|
3,134
|
10
|
%
|
9
|
%
|
12,905
|
12,721
|
1
|
%
|
|||||||||||||||||||||
|
Income (loss) before taxes
|
1,163
|
1,238
|
1,010
|
(6
|
%)
|
15
|
%
|
4,832
|
4,521
|
7
|
%
|
|||||||||||||||||||||
|
Net income (loss) applicable to Morgan Stanley (1)
|
$
|
889
|
$
|
962
|
$
|
769
|
(8
|
%)
|
16
|
%
|
$
|
3,728
|
$
|
3,472
|
7
|
%
|
||||||||||||||||
|
Pre-tax profit margin
|
25
|
%
|
28
|
%
|
24
|
%
|
27
|
%
|
26
|
%
|
||||||||||||||||||||||
|
Compensation and benefits as a % of net revenues
|
57
|
%
|
54
|
%
|
55
|
%
|
55
|
%
|
55
|
%
|
||||||||||||||||||||||
|
Non-compensation expenses as a % of net revenues
|
18
|
%
|
18
|
%
|
20
|
%
|
18
|
%
|
19
|
%
|
||||||||||||||||||||||
|
Return on Average Common Equity
|
19
|
%
|
21
|
%
|
17
|
%
|
20
|
%
|
20
|
%
|
||||||||||||||||||||||
|
Return on Average Tangible Common Equity (2)
|
34
|
%
|
37
|
%
|
32
|
%
|
36
|
%
|
37
|
%
|
||||||||||||||||||||||
|
Quarter Ended
|
Percentage Change From:
|
|||||||||||||||||||
|
Dec 31, 2019
|
Sep 30, 2019
|
Dec 31, 2018
|
Sep 30, 2019
|
Dec 31, 2018
|
||||||||||||||||
|
Wealth Management Metrics
|
||||||||||||||||||||
|
Wealth Management representatives
|
15,468
|
15,553
|
15,694
|
(1
|
%)
|
(1
|
%)
|
|||||||||||||
|
Annualized revenue per representative (000's)
|
$
|
1,182
|
$
|
1,118
|
$
|
1,058
|
6
|
%
|
12
|
%
|
||||||||||
|
Client assets (billions)
|
$
|
2,700
|
$
|
2,565
|
$
|
2,303
|
5
|
%
|
17
|
%
|
||||||||||
|
Client assets per representative (millions)
|
$
|
175
|
$
|
165
|
$
|
147
|
6
|
%
|
19
|
%
|
||||||||||
|
Client liabilities (billions)
|
$
|
90
|
$
|
86
|
$
|
83
|
5
|
%
|
8
|
%
|
||||||||||
|
Fee-based client assets (billions)
|
$
|
1,267
|
$
|
1,186
|
$
|
1,046
|
7
|
%
|
21
|
%
|
||||||||||
|
Fee-based asset flows (billions)
|
$
|
24.9
|
$
|
15.5
|
$
|
16.2
|
61
|
%
|
54
|
%
|
||||||||||
|
Fee-based assets as a % of client assets
|
47
|
%
|
46
|
%
|
45
|
%
|
||||||||||||||
|
Retail locations
|
592
|
590
|
591
|
--
|
--
|
|||||||||||||||
|
Quarter Ended
|
Percentage Change From:
|
Twelve Months Ended
|
Percentage
|
|||||||||||||||||||||||||||||
|
Dec 31, 2019
|
Sep 30, 2019
|
Dec 31, 2018
|
Sep 30, 2019
|
Dec 31, 2018
|
Dec 31, 2019
|
Dec 31, 2018
|
Change
|
|||||||||||||||||||||||||
|
Revenues:
|
||||||||||||||||||||||||||||||||
|
Asset management
|
$
|
736
|
$
|
664
|
$
|
628
|
11
|
%
|
17
|
%
|
$
|
2,629
|
$
|
2,468
|
7
|
%
|
||||||||||||||||
|
Investments (1)
|
670
|
105
|
82
|
*
|
*
|
1,213
|
254
|
*
|
||||||||||||||||||||||||
|
Other
|
(50
|
)
|
(5
|
)
|
(26
|
)
|
*
|
(92
|
%)
|
(79
|
)
|
24
|
*
|
|||||||||||||||||||
|
Net revenues
|
1,356
|
764
|
684
|
77
|
%
|
98
|
%
|
3,763
|
2,746
|
37
|
%
|
|||||||||||||||||||||
|
Compensation and benefits
|
581
|
319
|
322
|
82
|
%
|
80
|
%
|
1,630
|
1,167
|
40
|
%
|
|||||||||||||||||||||
|
Non-compensation expenses
|
328
|
280
|
288
|
17
|
%
|
14
|
%
|
1,148
|
1,115
|
3
|
%
|
|||||||||||||||||||||
|
Total non-interest expenses
|
909
|
599
|
610
|
52
|
%
|
49
|
%
|
2,778
|
2,282
|
22
|
%
|
|||||||||||||||||||||
|
Income (loss) before taxes
|
447
|
165
|
74
|
171
|
%
|
*
|
985
|
464
|
112
|
%
|
||||||||||||||||||||||
|
Net income (loss) applicable to Morgan Stanley (2)
|
$
|
317
|
$
|
138
|
$
|
65
|
130
|
%
|
*
|
$
|
719
|
$
|
376
|
91
|
%
|
|||||||||||||||||
|
Pre-tax profit margin
|
33
|
%
|
22
|
%
|
11
|
%
|
26
|
%
|
17
|
%
|
||||||||||||||||||||||
|
Compensation and benefits as a % of net revenues
|
43
|
%
|
42
|
%
|
47
|
%
|
43
|
%
|
42
|
%
|
||||||||||||||||||||||
|
Non-compensation expenses as a % of net revenues
|
24
|
%
|
37
|
%
|
42
|
%
|
31
|
%
|
41
|
%
|
||||||||||||||||||||||
|
Return on Average Common Equity
|
51
|
%
|
22
|
%
|
10
|
%
|
29
|
%
|
14
|
%
|
||||||||||||||||||||||
|
Return on Average Tangible Common Equity (3)
|
82
|
%
|
36
|
%
|
15
|
%
|
47
|
%
|
22
|
%
|
||||||||||||||||||||||
|
Quarter Ended
|
Percentage Change From:
|
Twelve Months Ended
|
Percentage
|
|||||||||||||||||||||||||||||
|
Dec 31, 2019
|
Sep 30, 2019
|
Dec 31, 2018
|
Sep 30, 2019
|
Dec 31, 2018
|
Dec 31, 2019
|
Dec 31, 2018
|
Change
|
|||||||||||||||||||||||||
|
Assets under management or supervision (AUM)
|
||||||||||||||||||||||||||||||||
|
Net flows by asset class (1)
|
||||||||||||||||||||||||||||||||
|
Equity
|
$
|
2.4
|
$
|
2.1
|
$
|
(0.9
|
)
|
14
|
%
|
*
|
$
|
7.3
|
$
|
6.0
|
22
|
%
|
||||||||||||||||
|
Fixed Income
|
3.4
|
2.3
|
(2.7
|
)
|
48
|
%
|
*
|
5.8
|
(2.6
|
)
|
*
|
|||||||||||||||||||||
|
Alternative / Other
|
0.9
|
(0.2
|
)
|
0.4
|
*
|
125
|
%
|
2.3
|
1.4
|
64
|
%
|
|||||||||||||||||||||
|
Long-Term Net Flows
|
6.7
|
4.2
|
(3.2
|
)
|
60
|
%
|
*
|
15.4
|
4.8
|
*
|
||||||||||||||||||||||
|
|
||||||||||||||||||||||||||||||||
|
Liquidity
|
22.4
|
9.1
|
13.9
|
146
|
%
|
61
|
%
|
28.7
|
(13.8
|
)
|
*
|
|||||||||||||||||||||
|
Total net flows
|
$
|
29.1
|
$
|
13.3
|
$
|
10.7
|
119
|
%
|
172
|
%
|
$
|
44.1
|
$
|
(9.0
|
)
|
*
|
||||||||||||||||
|
Assets under management or supervision by asset class (2)
|
||||||||||||||||||||||||||||||||
|
Equity
|
$
|
138
|
$
|
126
|
$
|
103
|
10
|
%
|
34
|
%
|
||||||||||||||||||||||
|
Fixed Income
|
79
|
74
|
68
|
7
|
%
|
16
|
%
|
|||||||||||||||||||||||||
|
Alternative / Other
|
139
|
135
|
128
|
3
|
%
|
9
|
%
|
|||||||||||||||||||||||||
|
Long‐Term Assets Under Management or Supervision
|
356
|
335
|
299
|
6
|
%
|
19
|
%
|
|||||||||||||||||||||||||
|
|
||||||||||||||||||||||||||||||||
|
Liquidity
|
196
|
172
|
164
|
14
|
%
|
20
|
%
|
|||||||||||||||||||||||||
|
Total Assets Under Management or Supervision
|
$
|
552
|
$
|
507
|
$
|
463
|
9
|
%
|
19
|
%
|
||||||||||||||||||||||
|
Share of minority stake assets
|
$
|
6
|
$
|
6
|
$
|
7
|
--
|
(14
|
%)
|
|||||||||||||||||||||||
|
Quarter Ended
|
Percentage Change From:
|
|||||||||||||||||||
|
Dec 31, 2019
|
Sep 30, 2019
|
Dec 31, 2018
|
Sep 30, 2019
|
Dec 31, 2018
|
||||||||||||||||
|
Institutional Securities
|
||||||||||||||||||||
|
Loans:
|
||||||||||||||||||||
|
Corporate (1)
|
$
|
11.5
|
$
|
13.3
|
$
|
13.3
|
(14
|
%)
|
(14
|
%)
|
||||||||||
|
Secured lending facilities
|
29.6
|
27.7
|
21.3
|
7
|
%
|
39
|
%
|
|||||||||||||
|
Commercial & residential real estate
|
13.1
|
10.5
|
11.4
|
25
|
%
|
15
|
%
|
|||||||||||||
|
Securities-based lending and other
|
7.4
|
7.4
|
8.3
|
--
|
(11
|
%)
|
||||||||||||||
|
Total Loans
|
61.6
|
58.9
|
54.3
|
5
|
%
|
13
|
%
|
|||||||||||||
|
Lending Commitments
|
106.9
|
108.6
|
95.0
|
(2
|
%)
|
13
|
%
|
|||||||||||||
|
Institutional Securities Loans and Lending Commitments (2)
|
$
|
168.5
|
$
|
167.5
|
$
|
149.3
|
1
|
%
|
13
|
%
|
||||||||||
|
Wealth Management
|
||||||||||||||||||||
|
Loans:
|
||||||||||||||||||||
|
Securities-based lending and other
|
$
|
49.9
|
$
|
47.4
|
$
|
44.7
|
5
|
%
|
12
|
%
|
||||||||||
|
Residential real estate
|
30.2
|
29.2
|
27.5
|
3
|
%
|
10
|
%
|
|||||||||||||
|
Total Loans
|
80.1
|
76.6
|
72.2
|
5
|
%
|
11
|
%
|
|||||||||||||
|
Lending Commitments
|
13.1
|
11.7
|
10.7
|
12
|
%
|
22
|
%
|
|||||||||||||
|
Wealth Management Loans and Lending Commitments (3)
|
$
|
93.2
|
$
|
88.3
|
$
|
82.9
|
6
|
%
|
12
|
%
|
||||||||||
|
Consolidated Loans and Lending Commitments (4)
|
$
|
261.7
|
$
|
255.8
|
$
|
232.2
|
2
|
%
|
13
|
%
|
||||||||||
|
Quarter Ended
|
Percentage Change From:
|
|||||||||||||||||||
|
Dec 31, 2019
|
Sep 30, 2019
|
Dec 31, 2018
|
Sep 30, 2019
|
Dec 31, 2018
|
||||||||||||||||
|
U.S. Bank assets
|
$
|
219.6
|
$
|
211.0
|
$
|
216.9
|
4
|
%
|
1
|
%
|
||||||||||
|
Institutional Securities U.S. Bank loans
|
||||||||||||||||||||
|
Corporate (1)
|
$
|
5.6
|
$
|
6.9
|
$
|
7.4
|
(19
|
%)
|
(24
|
%)
|
||||||||||
|
Secured lending facilities
|
26.8
|
25.0
|
17.5
|
7
|
%
|
53
|
%
|
|||||||||||||
|
Commercial & residential real estate
|
12.0
|
9.8
|
10.5
|
22
|
%
|
14
|
%
|
|||||||||||||
|
Securities-based lending and other
|
5.4
|
5.7
|
6.0
|
(5
|
%)
|
(10
|
%)
|
|||||||||||||
|
Total loans
|
$
|
49.8
|
$
|
47.4
|
$
|
41.4
|
5
|
%
|
20
|
%
|
||||||||||
|
Wealth Management U.S. Bank loans
|
||||||||||||||||||||
|
Securities-based lending and other
|
$
|
49.9
|
$
|
47.4
|
$
|
44.7
|
5
|
%
|
12
|
%
|
||||||||||
|
Residential real estate
|
30.2
|
29.2
|
27.5
|
3
|
%
|
10
|
%
|
|||||||||||||
|
Total loans
|
$
|
80.1
|
$
|
76.6
|
$
|
72.2
|
5
|
%
|
11
|
%
|
||||||||||
|
U.S. Bank loans
|
$
|
129.9
|
$
|
124.0
|
$
|
113.6
|
5
|
%
|
14
|
%
|
||||||||||
|
U.S. Bank investment securities portfolio (2)
|
$
|
68.5
|
$
|
70.7
|
$
|
69.2
|
(3
|
%)
|
(1
|
%)
|
||||||||||
|
U.S. Bank deposits
|
$
|
189.3
|
$
|
179.6
|
$
|
187.1
|
5
|
%
|
1
|
%
|
||||||||||
|
(a)
|
The Firm prepares its Consolidated Financial Statements using accounting principles generally accepted in the United States (U.S. GAAP). From time to
time, Morgan Stanley may disclose certain “non-GAAP financial measures” in the course of its earnings releases, earnings conference calls, financial presentations and otherwise. The Securities and Exchange Commission
defines a “non-GAAP financial measure” as a numerical measure of historical or future financial performance, financial positions, or cash flows that is subject to adjustments that effectively exclude, or include amounts from
the most directly comparable measure calculated and presented in accordance with U.S. GAAP. Non-GAAP financial measures disclosed by Morgan Stanley are provided as additional information to analysts, investors and other
stakeholders in order to provide them with greater transparency about, or an alternative method for assessing, our financial condition, operating results, or prospective regulatory capital requirements. These measures are
not in accordance with, or a substitute for U.S. GAAP, and may be different from or inconsistent with non-GAAP financial measures used by other companies. Whenever we refer to a non-GAAP financial measure, we will also
generally define it or present the most directly comparable financial measure calculated and presented in accordance with U.S. GAAP, along with a reconciliation of the differences between the non-GAAP financial measure we
reference and such comparable U.S. GAAP financial measure. In addition to the following notes, please also refer to the Firm's Quarterly Report on Form 10-Q for the quarter ended September 30, 2019.
|
|
|
(b)
|
The following are considered non-GAAP financial measures that the Firm considers useful for analysts, investors and other stakeholders
to allow better comparability of operating performance and capital adequacy. These measures are calculated as follows:
|
|
| - |
Earnings per diluted share, excluding intermittent net discrete tax provision / benefit represents net income (loss) applicable to Morgan Stanley, adjusted for the impact of the intermittent net discrete tax provision / benefit, less preferred dividends divided by the average number of diluted shares outstanding. | |
| - | The return on average common equity and return on average tangible common equity represents full year net income or annualized net income for the quarter applicable to Morgan Stanley less preferred dividends as a percentage of average common equity and average tangible common equity, respectively. | |
| - | The return on average common equity and the return on average tangible common equity excluding intermittent net discrete tax provision / benefit are adjusted in both the numerator and the denominator to exclude the intermittent net discrete tax provision / benefit. | |
| - |
Segment return on average common equity and return on average tangible common equity represents full year net income or annualized
net income for the quarter applicable to Morgan Stanley for each segment, less preferred dividend segment allocation, divided by average common equity and average tangible common equity for each respective segment. The
segment adjustments to common equity to derive segment average tangible common equity are generally set at the beginning of the year, and will remain fixed throughout the year until the next annual reset unless a significant
business change occurs (e.g., acquisition or disposition).
|
|
| - | Tangible common equity represents common equity less goodwill and intangible assets net of allowable mortgage servicing rights deduction. | |
| - | Tangible book value per common share represents tangible common equity divided by period end common shares outstanding. | |
| - | Pre-tax profit margin percentages represent income before income taxes as percentages of net revenues. | |
|
Page 1:
|
|
|
(a)
|
Net income (loss) applicable to Morgan Stanley represents net income, less net income applicable to nonredeemable noncontrolling interests.
|
|
(b)
|
Earnings (loss) applicable to Morgan Stanley common shareholders represents net income (loss) applicable to Morgan Stanley, less preferred dividends.
|
|
Page 2:
|
|
|
(a)
|
Book value per common share represents common equity divided by period end common shares outstanding.
|
|
(b)
|
The Firm expense efficiency ratio represents total non‐interest expenses as a percentage of net revenues.
|
|
Page 3:
|
|
|
(a)
|
Firmwide regional revenues reflect the Firm's consolidated net revenues on a managed basis. Further discussion regarding the geographic methodology
for net revenues is disclosed in Note 21 to the consolidated financial statements included in the Firm's Annual Report on Form 10-K for the year ended December 31, 2018 (2018 Form 10-K).
|
|
(b)
|
The global liquidity reserve, which is held within the bank and non-bank operating subsidiaries, is comprised of highly liquid and diversified cash
and cash equivalents and unencumbered securities. Eligible unencumbered securities include U.S. government securities, U.S. agency securities, U.S. agency mortgage-backed securities, non-U.S. government securities and
other highly liquid investment grade securities.
|
|
(c)
|
The Firm's goodwill and intangible balances utilized in the calculation of tangible common equity are net of allowable mortgage servicing rights
deduction.
|
|
Page 4:
|
|
|
(a)
|
The Firm's attribution of average common equity to the business segments is based on the Required Capital framework, an internal capital adequacy
measure. This framework is a risk-based and leverage use-of-capital measure, which is compared with the Firm's regulatory capital to ensure that the Firm maintains an amount of going concern capital after absorbing
potential losses from stress events, where applicable, at a point in time. The Required Capital framework is based on the Firm's regulatory capital requirements. The Firm defines the difference between its total average
common equity and the sum of the average common equity amounts allocated to its business segments as Parent common equity. The amount of capital allocated to the business segments is generally set at the beginning of the
year, and will remain fixed throughout the year until the next annual reset unless a significant business change occurs (e.g., acquisition or disposition). The Required Capital framework is expected to evolve over time in
response to changes in the business and regulatory environment, for example, to incorporate changes in stress testing or enhancements to modeling techniques. For further discussion of the framework, refer to Part II, Item
7 "Liquidity and Capital Resources—Regulatory Requirements" in the Firm's Annual Report on Form 10-K for the year ended December 31, 2018 and Part I, Item 2 "Liquidity and Capital Resources—Regulatory Requirements" in the
Firm's Quarterly Report on Form 10-Q for the quarter ended September 30, 2019.
|
|
(b)
|
The Firm's risk-based capital ratios for purposes of determining regulatory compliance are the lower of the capital ratios computed under the (i)
standardized approaches for calculating credit risk and market risk risk-weighted assets (RWAs) (the “Standardized Approach”); and (ii) applicable advanced approaches for calculating credit risk, market risk and
operational risk RWAs (the “Advanced Approach”). At December 31, 2019 and December 31, 2018, the Firm's ratios are based on the Standardized Approach. For information on the calculation of regulatory capital and ratios
for prior periods, please refer to Part II, Item 7 "Liquidity and Capital Resources—Regulatory Requirements" in the Firm's 2018 Form 10-K and Part I, Item 2 "Liquidity and Capital Resources—Regulatory Requirements" in the
Firm's 10-Q for the quarter ended September 30, 2019.
|
|
(c)
|
Supplementary leverage ratio represents Tier 1 capital divided by the total supplementary leverage exposure.
|
|
Page 5:
|
|
|
(a)
|
Institutional Securities Sales & Trading net revenues includes trading, net interest income (interest income less interest expense), asset
management, commissions and fees revenues.
|
|
(b)
|
VaR represents the loss amount that one would not expect to exceed, on average, more than five times every one hundred trading days in the Firm's
trading positions if the portfolio were held constant for a one-day period. Effective for the quarter ended September 30, 2019, the Firm changed its VaR model primarily in preparation for updates to regulatory rules and
we believe the resulting VaR continues to accurately measure our market risk. The previous model used four years of historical data with a volatility adjustment to reflect current market conditions, the new model uses one
year of unadjusted historical data. Prior periods VaR amounts have not been recast to reflect the new model. Further discussion of the calculation of VaR and the limitations of the Firm's VaR methodology, is disclosed in
Part II, Item 7A "Quantitative and Qualitative Disclosures about Risk" included in the Firm's 2018 Form 10-K.
|
|
Page 6:
|
|
|
(a)
|
Transactional revenues for the Wealth Management segment includes investment banking, trading, and commissions and fee revenues.
|
|
(b)
|
Net interest income represents interest income less interest expense.
|
|
(c)
|
Other revenues for the Wealth Management segment includes investments and other revenues.
|
|
Page 7:
|
|
|
(a)
|
The average annualized revenue per representative metric represents annualized net revenues divided by average representative headcount.
|
|
(b)
|
Client assets per representative represents total client assets divided by period end representative headcount.
|
|
(c)
|
Client liabilities reflect U.S. Bank lending and broker dealer margin activity.
|
|
(d)
|
Fee-based client assets represent the amount of assets in client accounts where the basis of payment for services is a fee calculated on those
assets.
|
|
(e)
|
Fee-based asset flows include net new fee-based assets, net account transfers, dividends, interest, and client fees and exclude institutional cash
management related activity.
|
|
Page 8:
|
|
|
(a)
|
Other revenues for the Investment Management segment includes investment banking, trading, net interest and other revenues.
|
|
Page 9:
|
|
|
(a)
|
Investment Management Alternative/Other asset class includes products in Fund of Funds, Real Estate, Private Equity and Credit strategies, as well as
Multi-Asset portfolios.
|
|
(b)
|
Investment Management net flows include new commitments, investments or reinvestments, net of client redemptions, returns of capital post-fund
investment period and dividends not reinvested and excludes the impact of the transition of funds from their commitment period to the invested capital period.
|
|
(c)
|
The share of minority stake assets represents Investment Management's proportional share of assets managed by entities in which it owns a minority
stake.
|
|
Page 10:
|
|
|
(a)
|
Corporate loans include relationship and event-driven loans and typically consist of revolving lines of credit, term loans and bridge loans.
|
|
(b)
|
Secured lending facilities include loans provided to clients to warehouse loans secured by underlying real estate or other assets.
|
|
(c)
|
The Institutional Securities business segment engages in securities-based and other lending activity, which includes corporate loans purchased in the
secondary market, financing extended to commodities customers, and loans to municipalities.
|
|
(d)
|
Institutional Securities Lending Commitments principally include Corporate lending activity.
|
|
Page 11:
|
|
|
(a)
|
U.S. Bank refers to the Firm's U.S. Bank operating subsidiaries Morgan Stanley Bank, N.A. and Morgan Stanley Private Bank, National Association and
excludes balances between Bank subsidiaries, as well as deposits from the Parent and affiliates.
|
|
(b)
|
Corporate loans include relationship and event-driven loans and typically consist of revolving lines of credit, term loans and bridge loans.
|
|
(c)
|
Secured lending facilities include loans provided to clients to warehouse loans secured by underlying real estate or other assets.
|
|
(d)
|
The Institutional Securities business segment engages in securities-based and other lending activity, which includes corporate loans purchased in the
secondary market, financing extended to commodities customers, and loans to municipalities.
|
|
Page 1:
|
|
|
(1)
|
The Firm non-interest expenses by category are as follows:
|
|
4Q19
|
3Q19
|
4Q18
|
4Q19 YTD
|
4Q18 YTD
|
||||||||||||||||
|
Compensation and benefits (a)
|
$
|
5,228
|
$
|
4,427
|
$
|
3,787
|
$
|
18,837
|
$
|
17,632
|
||||||||||
| Non-compensation expenses: | ||||||||||||||||||||
|
Occupancy and equipment
|
375
|
353
|
358
|
1,428
|
1,391
|
|||||||||||||||
|
Brokerage, clearing and exchange fees
|
633
|
637
|
598
|
2,493
|
2,393
|
|||||||||||||||
|
Information processing and communications
|
567
|
557
|
529
|
2,194
|
2,016
|
|||||||||||||||
|
Marketing and business development
|
200
|
157
|
220
|
660
|
691
|
|||||||||||||||
|
Professional services
|
555
|
531
|
605
|
2,137
|
2,265
|
|||||||||||||||
|
Other
|
566
|
660
|
594
|
2,369
|
2,482
|
|||||||||||||||
|
Total non-compensation expenses
|
2,896
|
2,895
|
2,904
|
11,281
|
11,238
|
|||||||||||||||
|
Total non-interest expenses
|
$
|
8,124
|
$
|
7,322
|
$
|
6,691
|
$
|
30,118
|
$
|
28,870
|
||||||||||
|
(a)
|
The Firm recorded severance costs of $172 million in the fourth quarter of 2019, associated with a business unit and
infrastructure December employee action, which were reported in the business segments’ results as follows: Institutional Securities $124 million, Wealth Management $37 million and Investment Management $11
million.
|
|
Page 2:
|
|
(1)
|
The fourth quarter and full year ended December 31, 2019 included intermittent net discrete tax benefits of $158 million
and $348 million, respectively, primarily associated with remeasurement of reserves as a result of new information pertaining to the resolution of multi-jurisdiction tax examinations and other tax matters. The
third quarter ended September 30, 2019 included intermittent net discrete tax benefits of $89 million primarily associated with the filing of the 2018 federal tax return and remeasurement of reserves as a result of
new information pertaining to multi-jurisdiction tax examinations. The fourth quarter and full year ended December 31, 2018 included intermittent net discrete tax benefits of $111 million and $203 million,
respectively, primarily associated with remeasurement of reserves as a result of new information pertaining to the resolution of multi-jurisdiction tax examinations.
|
|
The following sets forth the impact of the intermittent net discrete tax items to earnings per diluted share, return on
average common equity and return on average tangible common equity (which are excluded):
|
|
|
4Q19
|
3Q19
|
4Q18
|
4Q19 YTD
|
4Q18 YTD
|
|||||||||||||||
|
Earnings per diluted share impact
|
$
|
0.10
|
$
|
0.06
|
$
|
0.07
|
$
|
0.21
|
$
|
0.12
|
||||||||||
|
Return on average common equity impact
|
0.8
|
%
|
0.5
|
%
|
0.6
|
%
|
0.5
|
%
|
0.3
|
%
|
||||||||||
|
Return on average tangible common equity impact
|
1.0
|
%
|
0.6
|
%
|
0.7
|
%
|
0.5
|
%
|
0.3
|
%
|
||||||||||
|
(2)
|
The income tax consequences related to employee share-based payments, which are recurring-type tax items, are recognized in
Provision for income taxes in the consolidated income statement, and may be either a benefit or a provision. Conversion of employee share-based awards to Firm shares will primarily occur in the first quarter of each
year. The impacts of recognizing excess tax benefits upon conversion of awards, in the applicable quarter and year-to-date amounts, are as follows: 4Q18: $1 million, 4Q19 YTD: $127 million and 4Q18 YTD: $165
million. The impact of intermittent net discrete tax provisions and benefits reflected above do not include the recurring-type discrete tax benefits related to employee share‐based payments as we anticipate
conversion activity each year.
|
|
Page 5:
|
|
(1)
|
For the fourth quarter and full year ended December 31, 2019, the Institutional Securities segment net income applicable to
Morgan Stanley included intermittent net discrete tax benefits of $149 million and $317 million, respectively, primarily associated with remeasurement of reserves as a result of new information pertaining to the
resolution of multi-jurisdiction tax examinations and other tax matters. The third quarter ended September 30, 2019 included intermittent net discrete tax benefits of $67 million primarily associated with the filing
of the 2018 federal tax return and remeasurement of reserves as a result of new information pertaining to the resolution of multi‐jurisdiction tax examinations. The fourth quarter and full year ended December 31,
2018 included intermittent net discrete tax benefits of $94 million and $182 million, respectively, primarily associated with the remeasurement of reserves as result of new information pertaining to the resolution of
multi‐jurisdiction tax examinations and tax other matters.
|
|
(2)
|
Institutional Securities average tangible common equity represents average common equity adjusted to exclude goodwill and
intangible assets net of allowable mortgage servicing rights deduction. The adjustments are as follows: 4Q19: $536mm; 3Q19: $536mm; 4Q19 YTD: $536mm; 4Q18: $641mm; 4Q18 YTD: $641mm
|
|
(3)
|
Effective for the quarter ended September 30, 2019, the Firm changed its VaR model primarily in preparation for updates to
regulatory rules and we believe the resulting VaR continues to accurately measure our market risk. The previous model used four years of historical data with a volatility adjustment to reflect current market
conditions, the new model uses one year of unadjusted historical data. Prior periods VaR amounts have not been recast to reflect the new model. The difference in Trading VaR for 3Q19 between the new model ($42
million) and old model ($43 million) was not significant.
|
|
Page 6:
|
|
|
(1)
|
For the full year ended December 31, 2019, the Wealth Management segment net income applicable to Morgan Stanley included
intermittent net discrete tax benefits of $13 million. Additionally, the quarter ended September 30, 2019 included intermittent net discrete tax benefits of $13 million.
|
|
(2)
|
Wealth Management average tangible common equity represents average common equity adjusted to exclude goodwill and
intangible assets net of allowable mortgage servicing rights deduction. The adjustments are as follows: 4Q19: $8,088mm; 3Q19: $8,088mm; 4Q19 YTD: $8,088mm; 4Q18: $7,604mm; 4Q18 YTD: $7,604mm
|
|
Page 8:
|
|
|
(1)
|
Includes investment gains or losses for certain funds included in the Firm's consolidated financial statements for which the
limited partnership interests in these gains or losses were reported in net income (loss) applicable to nonredeemable noncontrolling interests.
|
|
(2)
|
For the fourth quarter and full year ended December 31, 2019, the Investment Management segment net income applicable to
Morgan Stanley included intermittent net discrete tax benefits of $9 million and $18 million, respectively. The fourth quarter and full year ended December 31, 2018 included intermittent discrete tax benefits of $20
million and $21 million, respectively.
|
|
(3)
|
Investment Management average tangible common equity represents average common equity adjusted to exclude goodwill and
intangible assets net of allowable mortgage servicing rights deduction. The adjustments are as follows: 4Q19: $940mm; 3Q19: $940mm; 4Q19 YTD: $940mm; 4Q18: $950mm; 4Q18 YTD: $950mm
|
|
Page 9:
|
|
|
(1)
|
Net Flows by region for the quarters ended December 31, 2019, September 30, 2019 and December 31, 2018 were:
|
|
North America: $19.4 billion, $6.4 billion and $3.1 billion
|
|
|
International: $9.7 billion, $6.9 billion and $7.6 billion
|
|
|
(2)
|
Assets under management or supervision by region for the quarters ended December 31, 2019, September 30, 2019 and December
31, 2018 were:
|
|
North America: $307 billion, $282 billion and $260 billion
|
|
|
International: $245 billion, $225 billion and $203 billion
|
|
|
Page 10:
|
|
|
(1)
|
Corporate loans in the Institutional Securities segment represents relationship and event lending.
|
|
(2)
|
For the quarters ended December 31, 2019, September 30, 2019 and December 31, 2018, Institutional Securities recorded a
provision for credit losses of $47 million, $31 million and $7 million, respectively, related to loans, and a provision for credit losses of $5 million, $18 million and $3 million, respectively, related to lending
commitments.
|
|
(3)
|
For the quarters ended December 31, 2019, September 30, 2019 and December 31, 2018, Wealth Management recorded a provision
for credit losses of $4 million, $3 million and $2 million, respectively, related to loans. For the quarters ended December 31, 2019, September 30, 2019 and December 31, 2018, there was no material provision
recorded by Wealth Management related to lending commitments.
|
|
(4)
|
For the quarters ended December 31, 2019, September 30, 2019 and December 31, 2018, Investment Management reflected loan
balances of $256 million, $43 million and $26 million, respectively, and lending commitments of $21 million for the quarter ended December 31, 2019, which are not included in the Consolidated Loans and Lending
Commitments balance.
|
|
Page 11:
|
|
|
(1)
|
Corporate loans in the Institutional Securities segment represents relationship and event lending.
|
|
(2)
|
For the quarters ended December 31, 2019, September 30, 2019 and December 31, 2018, the U.S. Bank investment securities portfolio included held
to maturity investment securities of $26.1 billion, $26.7 billion and $23.7 billion, respectively.
|