UNITED STATES
SECURITIES AND EXCHANGE COMMISSION
Washington, DC 20549
FORM
CURRENT REPORT
Pursuant to Section 13 or 15(d) of
The Securities Exchange Act of 1934
Date of Report (Date of earliest event reported):
(Exact name of registrant as specified in its charter)
| | |||
(State or other jurisdiction of | (Commission File Number) | (IRS Employer |
(Address of principal executive offices, including zip code)
(
(Registrant’s telephone number, including area code)
N/A
(Former name or former address, if changed since last report)
Check the appropriate box below if the Form 8-K filing is intended to simultaneously satisfy the filing obligation of the registrant under any of the following provisions:
Securities registered pursuant to Section 12(b) of the Act:
Title of each class | | Trading | | Name of each exchange |
Indicate by check mark whether the registrant is an emerging growth company as defined in Rule 405 of the Securities Act of 1933 (§230.405 of this chapter) or Rule 12b-2 of the Securities Exchange Act of 1934 (§240.12b-2 of this chapter).
Emerging growth company
If an emerging growth company, indicate by check mark if the registrant has elected not to use the extended transition period for complying with any new or revised financial account standards provided pursuant to Section 13(a) of the Exchange Act.
Item 2.02. Results of Operations and Financial Condition.
On August 12, 2026, MaxCyte, Inc. (the “Company”) issued a press release announcing its financial results for the quarter ended June 30, 2026. A copy of this press release is furnished as Exhibit 99.1 to this Current Report on Form 8-K and is incorporated herein by reference.
The information in this Current Report on Form 8-K, including Exhibit 99.1 hereto, is furnished and shall not be deemed “filed” for purposes of Section 18 of the Securities Exchange Act of 1934, as amended (the “Exchange Act”) or otherwise subject to the liabilities of that section. The information contained herein and in the accompanying exhibit is not incorporated by reference in any filing of the Company under the Securities Act of 1933, as amended, (the “Securities Act”) or the Exchange Act, whether made before or after the date hereof and irrespective of any general incorporation language in any filings, except as expressly set forth by specific reference in such a filing.
Item 7.01. Regulation FD Disclosure.
On August 12, 2026, the Company posted an updated corporate presentation, which the Company may use from time to time in communications or conferences, to its website at https://investors.maxcyte.com. A copy of the corporate presentation is furnished as Exhibit 99.2 to this Current Report on Form 8-K and is incorporated herein by reference.
The information in this Current Report on Form 8-K, including Exhibit 99.2 hereto, is furnished and shall not be deemed “filed” for purposes of Section 18 of the Exchange Act or otherwise subject to the liabilities of that section. The information contained herein and in the accompanying exhibit is not incorporated by reference in any filing of the Company under the Securities Act, or the Exchange Act, whether made before or after the date hereof and irrespective of any general incorporation language in any filings, except as expressly set forth by specific reference in such a filing.
Item 9.01. Financial Statements and Exhibits.
(d) Exhibits
Exhibit | | Exhibit Description |
99.1 | ||
99.2 | ||
104 | Cover Page Interactive Data (embedded within the Inline XBRL document) |
Exhibit 99.1
MaxCyte Reports Second Quarter 2026 Financial Results
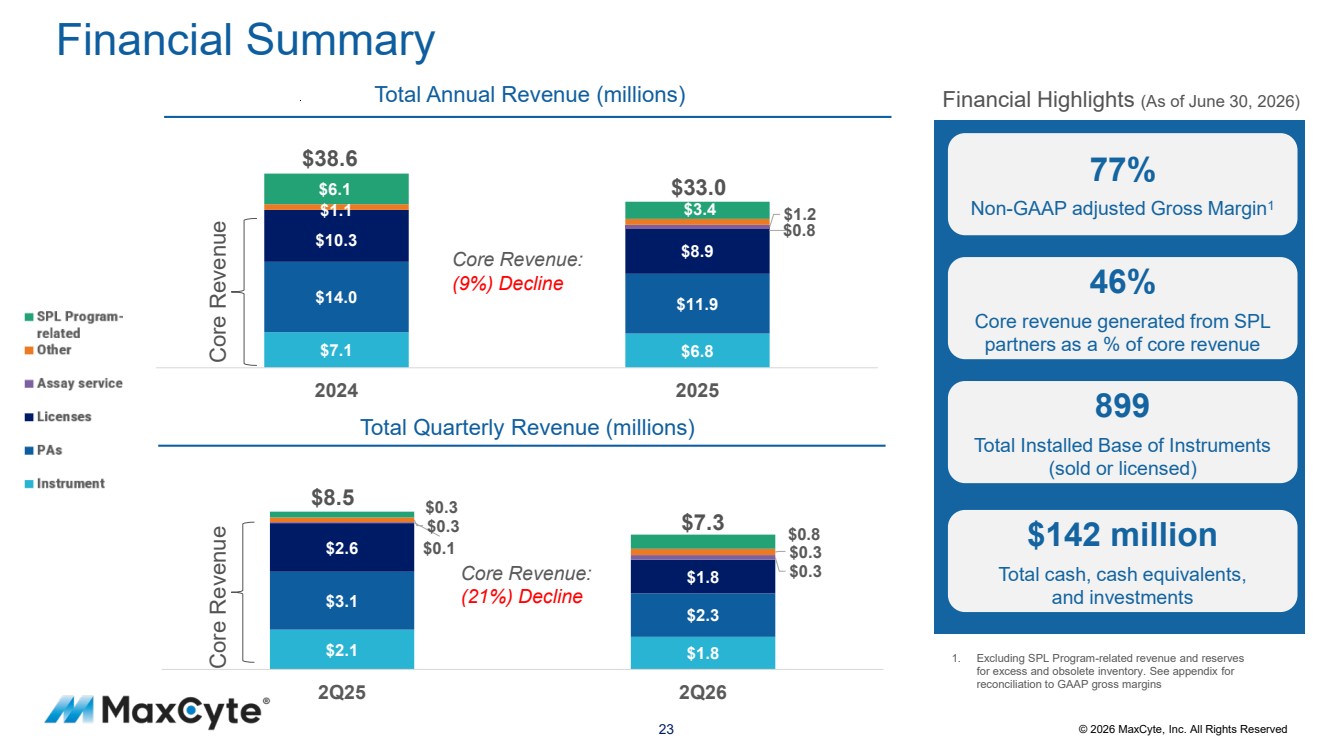
· | Reports total revenue of $7.3 million for the second quarter of 2026, including $6.5 million of core revenue and $0.8 million of SPL Program-related revenue |
· | Reiterates Full Year 2026 Guidance |
· | Repurchased approximately $5.5 million of common stock to date under the Company’s $10 million share repurchase program authorized by the Board |
· | Following end of quarter, announced strategic, multi-platform technology license partnership with Genentech in July |
ROCKVILLE, MD, August 12, 2026 — MaxCyte, Inc. (NASDAQ: MXCT), a leading, cell-engineering focused company providing enabling platform technologies to advance the discovery, development and commercialization of next-generation cell therapeutics, today announced its second quarter ended June 30, 2026 financial results and reiterated its 2026 guidance.
"We are pleased with our second quarter results, which were ahead of our expectations, driven by execution on instrument placements and stability in processing assembly sales," said Maher Masoud, President and CEO of MaxCyte. "A significant development for MaxCyte was the recent signing of our first multi-platform technology license partnership with large pharma, an enterprise-level agreement with Genentech that we believe will unlock meaningful new opportunities for MaxCyte. Separately, our SPL portfolio remains a key driver of long-term value as evident by growing commercial royalty revenue and the advancement of a significant number of SPL programs through the clinic. Lastly, our goal has been to return to revenue growth while reducing our net losses. In the first half of 2026, we delivered a meaningful reduction in net loss and expect to benefit further as we continue to execute against our plan and return to revenue growth.”
Second Quarter Financial Results
· | Total revenue of $7.3 million in the second quarter of 2026, a decrease of 15% over the second quarter of 2025. |
o | Core business revenue of $6.5 million in the second quarter of 2026, a decrease of 21% over the second quarter of 2025. |
o | Strategic Platform License (SPL) Program-related revenue was $0.8 million for the second quarter of 2026, compared to $0.3 million in the second quarter of 2025. |
· | Gross profit for the second quarter of 2026 was $5.6 million (77% gross margin), compared to $7.0 million (82% gross margin) in the second quarter of 2025. |
· | Non-GAAP adjusted gross margin was 77% when excluding SPL Program-related revenue and reserves for excess and obsolete inventory, compared to non-GAAP adjusted gross margin of 83% in the second quarter of 2025. |
· | Operating expenses for the second quarter of 2026 were $15.8 million, compared to operating expenses of $21.2 million in the second quarter of 2025. |
· | Second quarter 2026 net loss was $8.9 million compared to net loss of $12.4 million for the same period in 2025. |
1
· | EBITDA, a non-GAAP measure, was a loss of $9.3 million for the second quarter of 2026, compared to a loss of $13.1 million for the second quarter of 2025; stock-based compensation expense was $1.2 million in the second quarter of 2026 compared to $3.5 million in the second quarter of 2025. |
· | Total SPL agreements was 29 as of June 30, 2026, which includes 12 programs currently in the clinic (defined as programs with at least a cleared IND or equivalent) and one commercial program. |
· | Total cash, cash equivalents and investments were $141.9 million as of June 30, 2026. |
Full Year 2026 Guidance
· | Full year revenue expected to be $30 million to $32 million consisting of: |
o | Core revenue of $25 million to $27 million. |
o | SPL Program-related revenue of approximately $5 million for the year; SPL Program-related revenue guidance includes both revenue of approximately $3 million from milestone payments and approximately $2 million from commercial royalties. |
· | MaxCyte expects to end 2026 with at least $130.5 million in total cash, cash equivalents and investments, excluding any further capital deployed toward the share repurchase program. |
The following tables provide details regarding the sources of our revenue for the periods presented.
| | Three Months Ended | | | ||||
| | June 30 | | | ||||
| | 2026 | | 2025 | | % | ||
(in thousands, except percentages) | | | | | | | | |
Instruments | | $ | 1,761 | | $ | 2,141 | | (18%) |
PAs and Consumables | | | 2,337 | | | 3,128 | | (25%) |
Licenses | | | 1,822 | | | 2,619 | | (30%) |
Assay Service | | | 245 | | | 51 | | 380% |
Other | | | 338 | | | 259 | | 31% |
Total Core Revenue | | $ | 6,503 | | $ | 8,198 | | (21%) |
Milestones | | | 4 | | | 4 | | 0% |
Royalties | | | 764 | | | 305 | | 150% |
Total Revenue | | $ | 7,271 | | $ | 8,507 | | (15%) |
Webcast and Conference Call Details
MaxCyte will host a conference call today, August 12, 2026, at 4:30 p.m. Eastern Time. Investors interested in listening to the conference call are required to register online. A live and archived webcast of the event will be available on the "Events" section of the MaxCyte website at https://investors.maxcyte.com/.
2
About MaxCyte
At MaxCyte®, we are committed to building better cells together. As a leading cell-engineering company, we are driving the discovery, development and commercialization of next-generation cell therapies. Our best-in-class Flow Electroporation® technology and SeQure™ gene editing risk assessment services enable high-performance cell engineering and rigorous evaluation of editing outcomes, supporting confidence in therapeutic development. Supported by expert scientific, technical and regulatory guidance, our platform empowers researchers to engineer diverse cell types and payloads, accelerating the development of safe and effective treatments for human health. For more than 25 years, we've been advancing cell engineering, shaping the future of medicine.
Learn more at maxcyte.com and follow us on LinkedIn and Bluesky.
Non-GAAP Financial Measures
This press release contains EBITDA, which is a non-GAAP measure defined as earnings before interest income and expense, taxes, depreciation and amortization. MaxCyte believes that EBITDA provides useful information to management and investors relating to its results of operations. The Company's management uses these non-GAAP measures to compare the Company's performance to that of prior periods for trend analyses, and for budgeting and planning purposes. The Company believes that the use of EBITDA provides an additional tool for investors to use in evaluating ongoing operating results and trends and in comparing the Company's financial measures with other companies, many of which present similar non-GAAP financial measures to investors, and that it allows for greater transparency with respect to key metrics used by management in its financial and operational decision-making.
This press release also contains Non-GAAP Gross Margin, which we define as Gross Margin when excluding SPL program related revenue and reserves for excess and obsolete inventory. The Company believes that the use of Non-GAAP Gross Margin provides an additional tool to investors because it provides consistency and comparability with past financial performance, as Non-GAAP Gross Margin excludes non-core revenues and inventory reserves, which can vary significantly between periods and thus affect comparability.
Management does not consider these Non-GAAP financial measures in isolation or as an alternative to financial measures determined in accordance with GAAP. The principal limitation of these Non-GAAP financial measures is that they exclude significant revenues and expenses that are required by GAAP to be recorded in the Company's financial statements. In order to compensate for these limitations, management presents these Non-GAAP financial measures along with GAAP results. Non-GAAP measures should be considered in addition to results prepared in accordance with GAAP, but should not be considered a substitute for, or superior to, GAAP results. Reconciliation tables of net loss, the most comparable GAAP financial measure, to EBITDA, and Gross Margin, the most comparable GAAP financial measure, to Non-GAAP Gross Margin, are included at the end of this release. MaxCyte urges investors to review the reconciliation and not to rely on any single financial measure to evaluate the Company's business.
Forward-Looking Statements
This press release contains "forward-looking statements" within the meaning of the "safe harbor" provisions of the Private Securities Litigation Reform Act of 1995. These statements about us and our industry involve substantial known and unknown risks, uncertainties, and assumptions, including those
3
described in Item 1A under the heading "Risk Factors" and elsewhere in our report on Form 10-K, that may cause our actual results, performance or achievements to be materially different from any future results, performance or achievements expressed or implied by the forward-looking statements. All statements other than statements of historical facts contained in this press release, including statements regarding our future results of operations or financial condition, business strategy and plans, customer expectations and objectives of management for future operations, are forward-looking statements. Forward-looking statements include, but are not limited to, statements about possible or future results of operations or financial position. In some cases, you can identify forward-looking statements because they contain words such as "may," "might," "will," "could," "would," "should," "expect," "plan," "anticipate," "intend," "believe," "estimate," "seek," "predict," "future," "project," "potential," "continue," "contemplate," "target," the negative of these words and similar words or expressions. These statements are inherently uncertain, and investors are cautioned not to unduly rely on these statements. The forward-looking statements contained in this press release, include, without limitation, our full year 2026 revenue and cash guidance, statements concerning the following: our expected future growth and success of our business model; the size and growth potential of the markets for our products, and our ability to serve those markets, increase our market share, and achieve and maintain industry leadership; our ability to expand our customer base and enter into additional SPL partnerships; expectations regarding customer-level activities (including the expected advancement of our SPL partners' clinical programs, including Phase 3 trial initiations); the timing and amount of any share repurchases under our share repurchase program; our financial performance and capital requirements; the adequacy of our cash resources and availability of financing on commercially reasonable terms; our expectations regarding general market and economic conditions that may impact investor confidence in the biopharmaceutical industry and affect the amount of capital such investors provide to our current and potential partners; and our use of available capital resources.
These and other risks and uncertainties are described in greater detail in Item 1A , entitled "Risk Factors," in our Annual Report on Form 10-K for the year ended December 31, 2025, filed with the Securities and Exchange Commission, as well as in discussions of potential risks, uncertainties, and other important factors in the other filings that we make with the Securities and Exchange Commission from time to time. These documents are available through the Investor Menu, Financials section, under "SEC Filings" on the Investors page of our website at http://investors.maxcyte.com. Any forward-looking statements in this press release are based on our current beliefs and opinions on the relevant subject based on information available to us as of the date of such press release, and you should not rely on forward-looking statements as predictions of future events. We undertake no obligation to update any forward-looking statements made in this press release to reflect events or circumstances after the date of this press release or to reflect new information or the occurrence of unanticipated events, except as required by law.
MaxCyte Contacts:
US IR Adviser
Gilmartin Group
Erik Abdow
Media Contact
Oak Street Communications
Kristen White
[email protected]
415.608.6060
4
MaxCyte, Inc.
Unaudited Condensed Consolidated Balance Sheets
(in thousands, except share and per share amounts)
| | June 30, | | December 31, |
| ||
| | 2026 | | 2025 | | ||
Assets | | | | | | | |
Current assets: | | | | | | | |
Cash and cash equivalents | | $ | 15,042 | | $ | 20,065 | |
Short-term investments, at amortized cost | | | 90,648 | | | 82,979 | |
Accounts receivable, net | | | 3,922 | | | 3,503 | |
Inventory, net | | | 7,798 | | | 7,547 | |
Prepaid expenses and other current assets | | | 3,664 | | | 4,275 | |
Assets held for sale | | | 200 | | | — | |
Total current assets | | | 121,274 | | | 118,369 | |
| | | | | | | |
Investments, non-current, at amortized cost | | | 36,233 | | | 52,570 | |
Property and equipment, net | | | 14,897 | | | 17,531 | |
Right-of-use asset - operating leases | | | 10,472 | | | 10,920 | |
Intangible assets, net | | | 766 | | | 650 | |
Other assets | | | 1,030 | | | 2,467 | |
Total assets | | $ | 184,672 | | $ | 202,507 | |
| | | | | | | |
Liabilities and stockholders' equity | | | | | | | |
Current liabilities: | | | | | | | |
Accounts payable | | $ | 1,734 | | $ | 1,401 | |
Accrued expenses and other | | | 4,170 | | | 7,812 | |
Operating lease liability, current | | | 1,528 | | | 1,456 | |
Deferred revenue, current portion | | | 2,463 | | | 3,598 | |
Total current liabilities | | | 9,895 | | | 14,267 | |
| | | | | | | |
Operating lease liability, net of current portion | | | 15,723 | | | 16,487 | |
Other liabilities | | | 302 | | | 263 | |
Total liabilities | | | 25,920 | | | 31,017 | |
| | | | | | | |
Commitments and contingencies | | | | | | | |
Stockholders' equity: | | | | | | | |
Preferred stock, $0.01 par value; 5,000,000 shares authorized and no shares issued and outstanding at June 30, 2026 and December 31, 2025 | | | — | | | — | |
Common stock, $0.01 par value; 400,000,000 shares authorized, 107,447,077 and 106,789,618 shares issued, and 106,134,011 and 106,789,618 outstanding at June 30, 2026 and December 31, 2025, respectively | | | 1,074 | | | 1,068 | |
Additional paid-in capital | | | 434,263 | | | 431,905 | |
Treasury stock, 1,313,066 shares, at cost | | | (1,478) | | | — | |
Accumulated deficit | | | (275,107) | | | (261,483) | |
Total stockholders' equity | | | 158,752 | | | 171,490 | |
Total liabilities and stockholders' equity | | $ | 184,672 | | $ | 202,507 | |
5
MaxCyte, Inc.
Unaudited Condensed Consolidated Statements of Operations
(in thousands, except share and per share amounts)
| | Three Months Ended June 30, | | Six Months Ended June 30, | | ||||||||
| | 2026 | | 2025 | | 2026 | | 2025 | | ||||
Revenue | | $ | 7,271 | | $ | 8,507 | | $ | 16,922 | | $ | 18,897 |
|
Cost of goods sold | | | 1,675 | | | 1,519 | | | 3,244 | | | 3,016 | |
Gross profit | | | 5,596 | | | 6,988 | | | 13,678 | | | 15,881 | |
| | | | | | | | | | | | | |
Operating expenses: | | | | | | | | | | | | | |
Research and development | | | 4,253 | | | 6,269 | | | 8,110 | | | 12,172 | |
Sales and marketing | | | 3,364 | | | 5,786 | | | 6,792 | | | 11,484 | |
General and administrative | | | 7,258 | | | 8,080 | | | 13,224 | | | 16,606 | |
Depreciation and amortization | | | 953 | | | 1,080 | | | 1,969 | | | 2,141 | |
Total operating expenses | | | 15,828 | | | 21,215 | | | 30,095 | | | 42,403 | |
Operating loss | | | (10,232) | | | (14,227) | | | (16,417) | | | (26,522) | |
| | | | | | | | | | | | | |
Other income: | | | | | | | | | | | | | |
Interest income | | | 1,358 | | | 1,870 | | | 2,793 | | | 3,904 | |
Total other income | | | 1,358 | | | 1,870 | | | 2,793 | | | 3,904 | |
Net loss | | $ | (8,874) | | $ | (12,357) | | $ | (13,624) | | $ | (22,618) | |
Basic and diluted net loss per share | | $ | (0.08) | | $ | (0.12) | | $ | (0.13) | | $ | (0.21) | |
Weighted-average shares outstanding, basic and diluted | | | 106,822,633 | | | 106,403,540 | | | 106,848,715 | | | 106,178,262 | |
6
MaxCyte, Inc.
Unaudited Condensed Consolidated Statements of Cash Flows
(in thousands)
| | Six Months Ended June 30, | | ||||
| | 2026 | | 2025 | | ||
Cash flows from operating activities: | | | | | | |
|
Net loss | | $ | (13,624) | | $ | (22,618) | |
| | | | | | | |
Adjustments to reconcile net loss to net cash used in operating activities: | | | | | | | |
Depreciation and amortization | | | 2,025 | | | 2,196 | |
Impairment of fixed assets | | | 630 | | | — | |
Lease right-of-use asset amortization | | | 448 | | | 378 | |
Net book value of consigned equipment sold | | | 102 | | | 55 | |
Loss on disposal of property and equipment | | | 22 | | | 113 | |
Stock-based compensation | | | 2,301 | | | 6,553 | |
Credit loss expense | | | — | | | 10 | |
Provision for inventory reserve | | | 379 | | | 165 | |
Amortization of discounts on investments | | | (838) | | | (1,635) | |
| | | | | | | |
Changes in operating assets and liabilities, net of effects of acquisition: | | | | | | | |
Accounts receivable | | | (419) | | | (1,077) | |
Inventory | | | (852) | | | 754 | |
Prepaid expense and other current assets | | | 611 | | | 773 | |
Other assets | | | 1,449 | | | (1,140) | |
Accounts payable, accrued expenses and other | | | (3,276) | | | (5,340) | |
Operating lease liability | | | (692) | | | (593) | |
Deferred revenue | | | (1,135) | | | (2,831) | |
Other liabilities | | | 39 | | | (26) | |
Net cash used in operating activities | | | (12,830) | | | (24,263) | |
| | | | | | | |
Cash flows from investing activities: | | | | | | | |
Purchases of investments | | | (36,494) | | | (63,523) | |
Maturities of investments | | | 46,000 | | | 77,600 | |
Purchases of property and equipment | | | (134) | | | (1,237) | |
Acquisition of intangible assets | | | (150) | | | — | |
Acquisition of business, net of cash acquired of $541 | | | — | | | (1,773) | |
Net cash provided by investing activities | | | 9,222 | | | 11,067 | |
| | | | | | | |
Cash flows from financing activities: | | | | | | | |
Proceeds from exercise of stock options | | | 29 | | | 403 | |
Proceeds from issuance of common stock under employee stock purchase plan | | | 34 | | | 134 | |
Repurchases of common stock | | | (1,478) | | | — | |
Net cash (used in) provided by financing activities | | | (1,415) | | | 537 | |
Net decrease in cash and cash equivalents | | | (5,023) | | | (12,659) | |
Cash and cash equivalents, beginning of period | | | 20,065 | | | 27,884 | |
Cash and cash equivalents, end of period | | $ | 15,042 | | $ | 15,225 | |
7
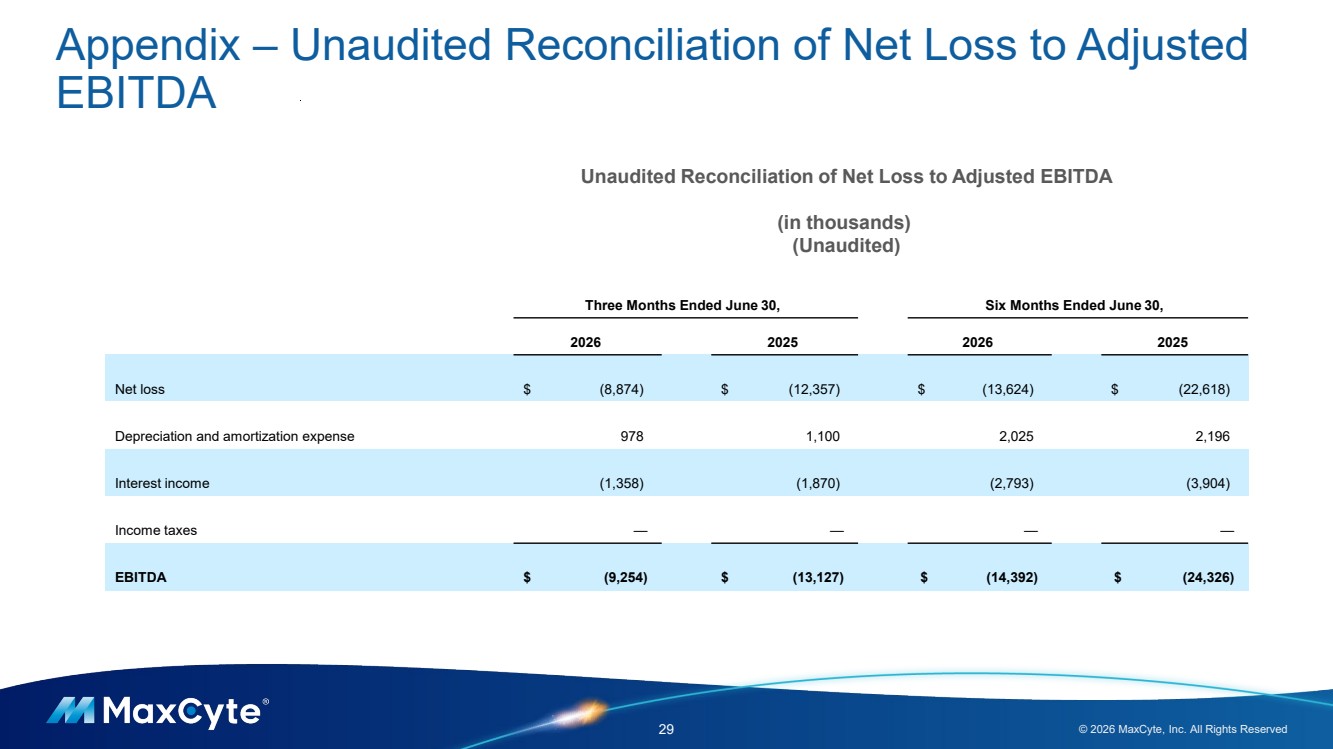
Unaudited Reconciliation of Net Loss to EBITDA
(in thousands)
(Unaudited)
| | Three Months Ended June 30, | | Six Months Ended June 30, | | ||||||||
| | 2026 | | 2025 | | 2026 | | 2025 | | ||||
Net loss | | $ | (8,874) | | $ | (12,357) | | $ | (13,624) | | $ | (22,618) |
|
Depreciation and amortization expense | | | 978 | | | 1,100 | | | 2,025 | | | 2,196 | |
Interest income | | | (1,358) | | | (1,870) | | | (2,793) | | | (3,904) | |
Income taxes | | | — | | | — | | | — | | | — | |
EBITDA | | $ | (9,254) | | $ | (13,127) | | $ | (14,392) | | $ | (24,326) | |
8
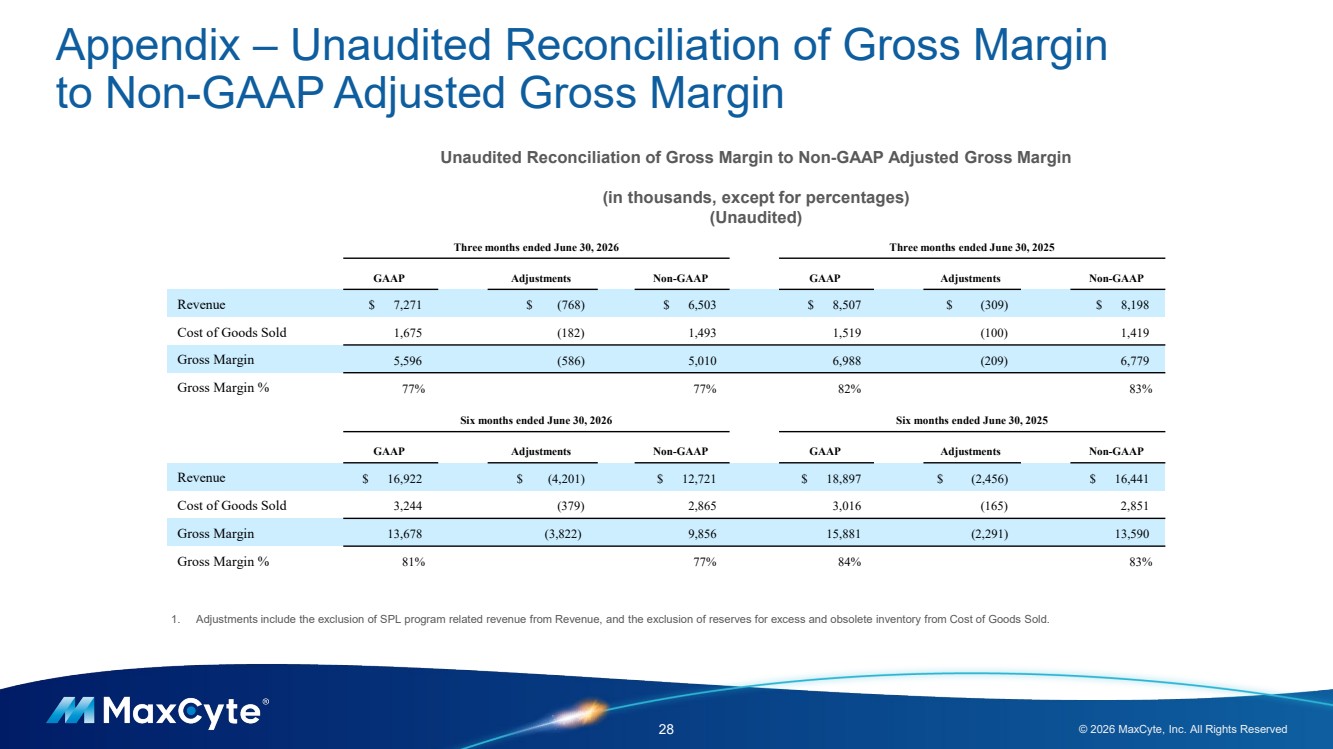
Unaudited Reconciliation of Gross Margin to Non-GAAP Adjusted Gross Margin
(in thousands, except for percentages)
(Unaudited)
| | Three months ended June 30, 2026 | | Three months ended June 30, 2025 | | ||||||||||||||
| | GAAP | | Adjustments | | Non-GAAP | | GAAP | | Adjustments | | Non-GAAP | | ||||||
Revenue | | $ | 7,271 | | $ | (768) | | $ | 6,503 | | $ | 8,507 | | $ | (309) | | $ | 8,198 |
|
Cost of Goods Sold | | | 1,675 | | | (182) | | | 1,493 | | | 1,519 | | | (100) | | | 1,419 | |
Gross Margin | | $ | 5,596 | | $ | (586) | | $ | 5,010 | | $ | 6,988 | | $ | (209) | | $ | 6,779 | |
Gross Margin % | | | 77 | % | | | | | 77 | % | | 82 | % | | | | | 83 | % |
| | Six months ended June 30, 2026 | | Six months ended June 30, 2025 | | ||||||||||||||
| | GAAP | | Adjustments | | Non-GAAP | | GAAP | | Adjustments | | Non-GAAP | | ||||||
Revenue | | $ | 16,922 | | $ | (4,201) | | $ | 12,721 | | $ | 18,897 | | $ | (2,456) | | $ | 16,441 |
|
Cost of Goods Sold | | | 3,244 | | | (379) | | | 2,865 | | | 3,016 | | | (165) | | | 2,851 | |
Gross Margin | | $ | 13,678 | | $ | (3,822) | | $ | 9,856 | | $ | 15,881 | | $ | (2,291) | | $ | 13,590 | |
Gross Margin % |
| | 81 | % | | | | | 77 | % | | 84 | % | | | | | 83 | % |
(1) | Adjustments include the exclusion of SPL program related revenue from Revenue, and the exclusion of reserves for excess and obsolete inventory from Cost of Goods Sold. |
9
Exhibit 99.2
| are trademarks of MaxCyte, Inc. in the U.S.A. Driving the Next Generation of Cell-Based Therapies MaxCyte Corporate Presentation NASDAQ: MXCT August 2026 © 2026 MaxCyte, Inc. All Rights Reserved |
| Forward Looking Statement Disclaimer 2 © 2026 MaxCyte, Inc. All Rights Reserved Certain statements in this document (this “Presentation”) are, or may be deemed to be, forward-looking statements within the meaning of the “safe harbor” provisions of the Private Securities Litigation Reform Act of 1995, including but not limited to statements regarding our expected potential future revenue. These statements about us and our industry involve substantial known and unknown risk, uncertainties and assumptions, that may cause our actual results, performance or achievements to be materially different from any future results, performance or achievements expressed or implied by the forward-looking statements. All statements other than statements of historical facts contained in this Presentation are forward-looking statements. The words "may," "might," "will," "could," "would," "should," "expect," "plan," "anticipate," "intend," "believe," "expect," "estimate," "seek," "predict," "future," "project," "potential," "continue," "target" and similar words or expressions are intended to identify forward-looking statements, although not all forward-looking statements contain these identifying words. Any forward-looking statements in this Presentation are based on management's current expectations and beliefs and are subject to a number of risks, uncertainties and important factors that may cause actual events or results to differ materially from those expressed or implied by any forward-looking statements contained in this Presentation, including, without limitation, statements regarding the Company's future growth, results of operations, performance, future capital and other expenditures (including the amount, nature and sources of funding thereof), competitive advantages, business prospects and opportunities. These and other risks and uncertainties are described in greater detail in the section entitled "Risk Factors" in our Annual Report on Form 10-K for the year ended December 31, 2025, as well as discussions of potential risks, uncertainties, and other important factors in the other filings that we make with the Securities and Exchange Commission from time to time. These documents are available, without charge, on the Securities and Exchange Commission website and through the Investor Menu, Financials section under "SEC filings" on the Investors page of our website at http://investors.maxcyte.com. No statement in this Presentation is intended to be, or intended to be construed as, a profit forecast or profit estimate or to be interpreted to mean that earnings per Company share for the current or future financial years will necessarily match or exceed the historical earnings per Company share. As a result, no undue reliance should be placed on such statements. Any forward-looking statements represent our views only as of the date of this Presentation and should not be relied upon as representing our views as of any subsequent date. We explicitly disclaim any obligation to update any forward-looking statements, whether as a result of new information, future events or otherwise, except as required by applicable law. No representations or warranties (expressed or implied) are made about the accuracy of any such forward-looking statements. This Presentation contains Adjusted EBITDA, which is a non-GAAP measure defined as earnings before interest, taxes, depreciation, amortization, goodwill impairment and one-time restructuring charges. MaxCyte believes that Adjusted EBITDA provides useful information to management and investors relating to its results of operations. The company’s management uses these non-GAAP measures to compare the company’s performance to that of prior periods for trend analyses, and for budgeting and planning purposes. The company believes that the use of Adjusted EBITDA provides an additional tool for investors to use in evaluating ongoing operating results and trends and in comparing the company’s financial measures with other companies, many of which present similar non-GAAP financial measures to investors, and that it allows for greater transparency with respect to key metrics used by management in its financial and operational decision-making. This Presentation also contains Non-GAAP Gross Margin, which we define as Gross Margin when excluding SPL program related revenue and reserves for excess and obsolete inventory. The Company believes that the use of Non-GAAP Gross Margin provides an additional tool to investors because it provides consistency and comparability with past financial performance, as Non-GAAP Gross Margin excludes non-core revenues and inventory reserves, which can vary significantly between periods and thus affect comparability. Management does not consider these Non-GAAP financial measures in isolation or as an alternative to financial measures determined in accordance with GAAP. The principal limitation of these Non-GAAP financial measures is that they exclude significant revenues and expenses that are required by GAAP to be recorded in the Company’s financial statements. Non-GAAP measures should be considered in addition to results prepared in accordance with GAAP, but should not be considered a substitute for, or superior to, GAAP results. A reconciliation table of Gross Margin, the most comparable GAAP financial measure to Non-GAAP Gross Margin, is included in the appendix of this Presentation. The Company urges investors to review the reconciliation and not to rely on any single financial measure to evaluate its business. |
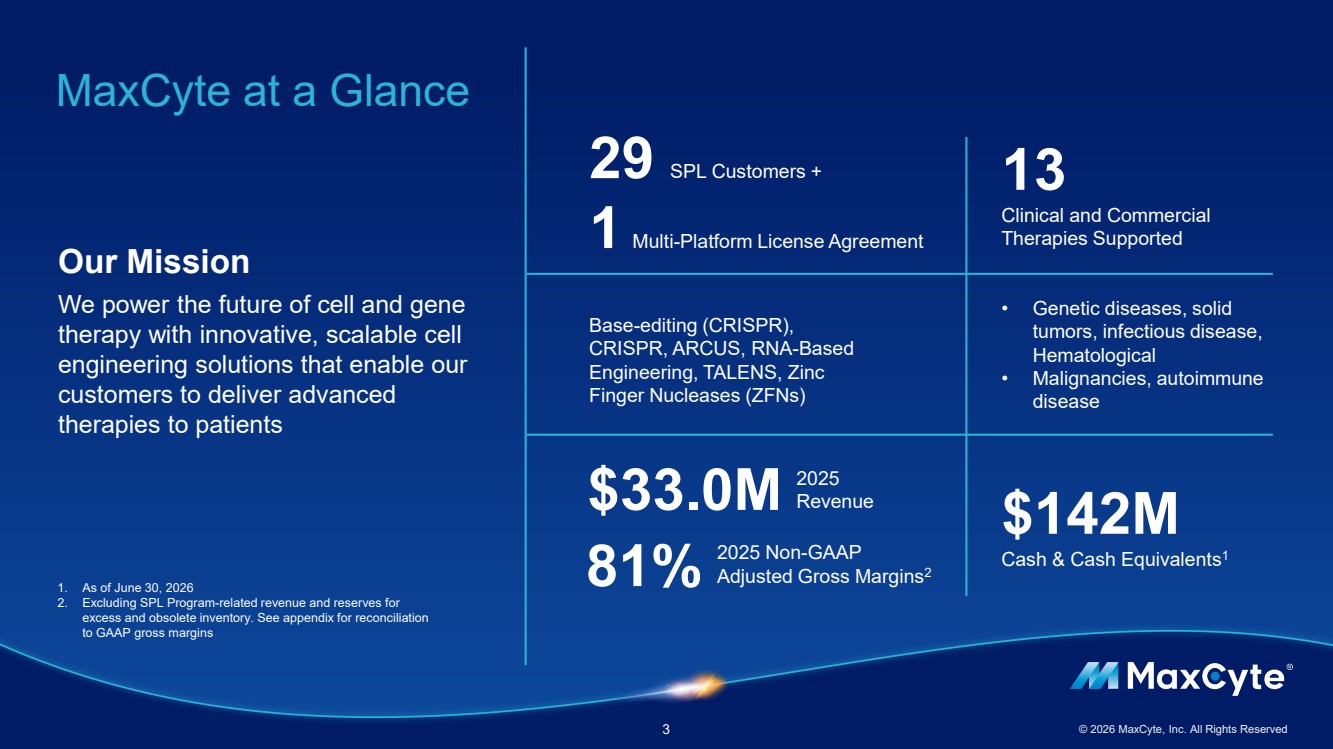
| MaxCyte at a Glance 3 © 2026 MaxCyte, Inc. All Rights Reserved Our Mission We power the future of cell and gene therapy with innovative, scalable cell engineering solutions that enable our customers to deliver advanced therapies to patients Base-editing (CRISPR), CRISPR, ARCUS, RNA-Based Engineering, TALENS, Zinc Finger Nucleases (ZFNs) 13 Clinical and Commercial Therapies Supported 2025 Revenue • Genetic diseases, solid tumors, infectious disease, Hematological • Malignancies, autoimmune disease 29 SPL Customers + 1 Multi-Platform License Agreement $142M Cash & Cash Equivalents1 $33.0M 2025 Non-GAAP Adjusted Gross Margins 81% 2 1. As of June 30, 2026 2. Excluding SPL Program-related revenue and reserves for excess and obsolete inventory. See appendix for reconciliation to GAAP gross margins |
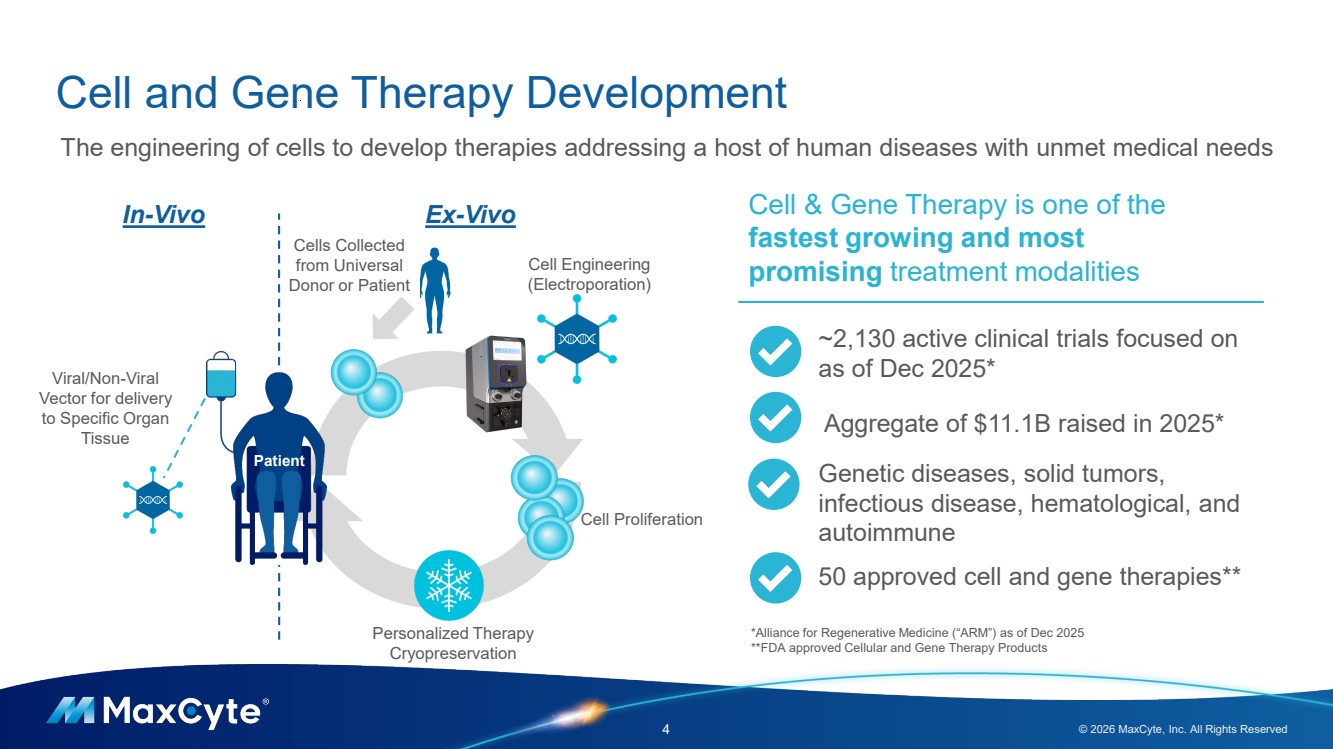
| Cell and Gene Therapy Development 4 © 2026 MaxCyte, Inc. All Rights Reserved Cell Engineering (Electroporation) Cell Proliferation In-Vivo Ex-Vivo Viral/Non-Viral Vector for delivery to Specific Organ Tissue The engineering of cells to develop therapies addressing a host of human diseases with unmet medical needs Cells Collected from Universal Donor or Patient Personalized Therapy Cryopreservation Patient Cell & Gene Therapy is one of the fastest growing and most promising treatment modalities ~2,130 active clinical trials focused on as of Dec 2025* Aggregate of $11.1B raised in 2025* Genetic diseases, solid tumors, infectious disease, hematological, and autoimmune 50 approved cell and gene therapies** *Alliance for Regenerative Medicine (“ARM”) as of Dec 2025 **FDA approved Cellular and Gene Therapy Products |
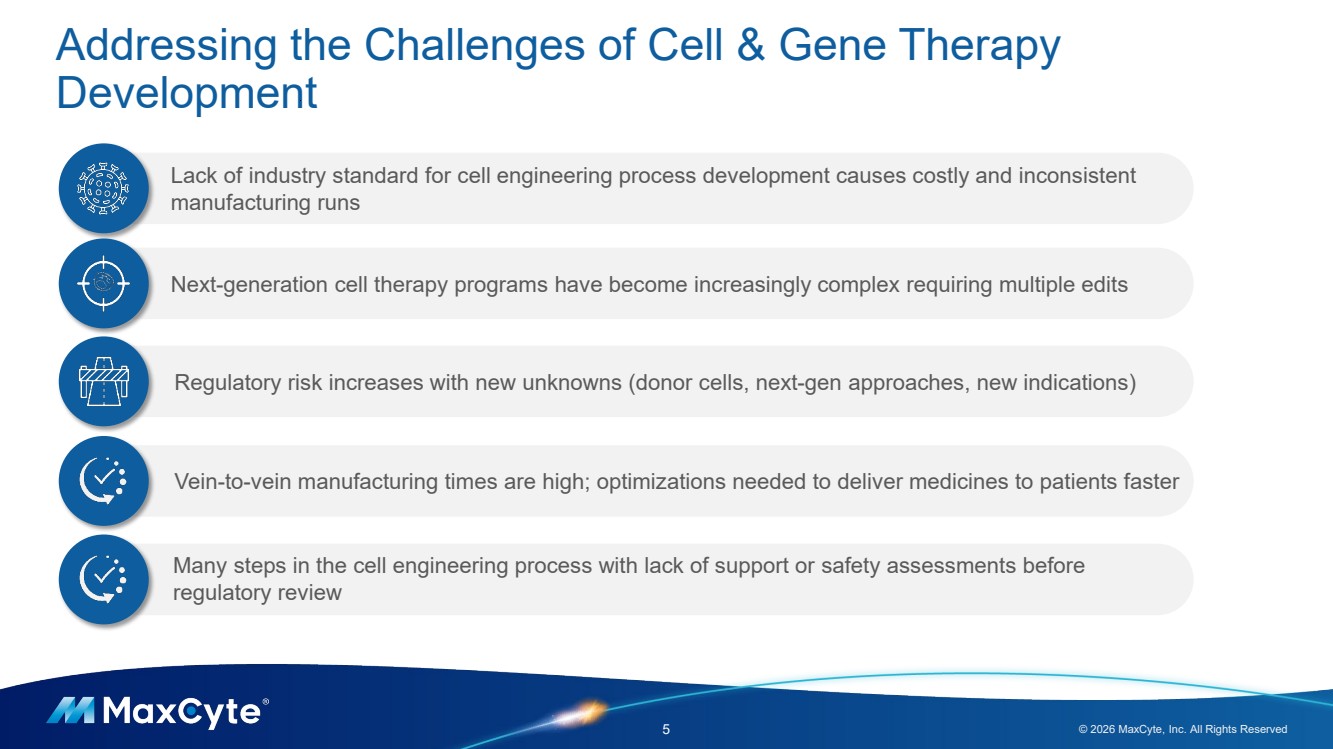
| Addressing the Challenges of Cell & Gene Therapy Development 5 © 2026 MaxCyte, Inc. All Rights Reserved Next-generation cell therapy programs have become increasingly complex requiring multiple edits Regulatory risk increases with new unknowns (donor cells, next-gen approaches, new indications) Vein-to-vein manufacturing times are high; optimizations needed to deliver medicines to patients faster Lack of industry standard for cell engineering process development causes costly and inconsistent manufacturing runs Many steps in the cell engineering process with lack of support or safety assessments before regulatory review |
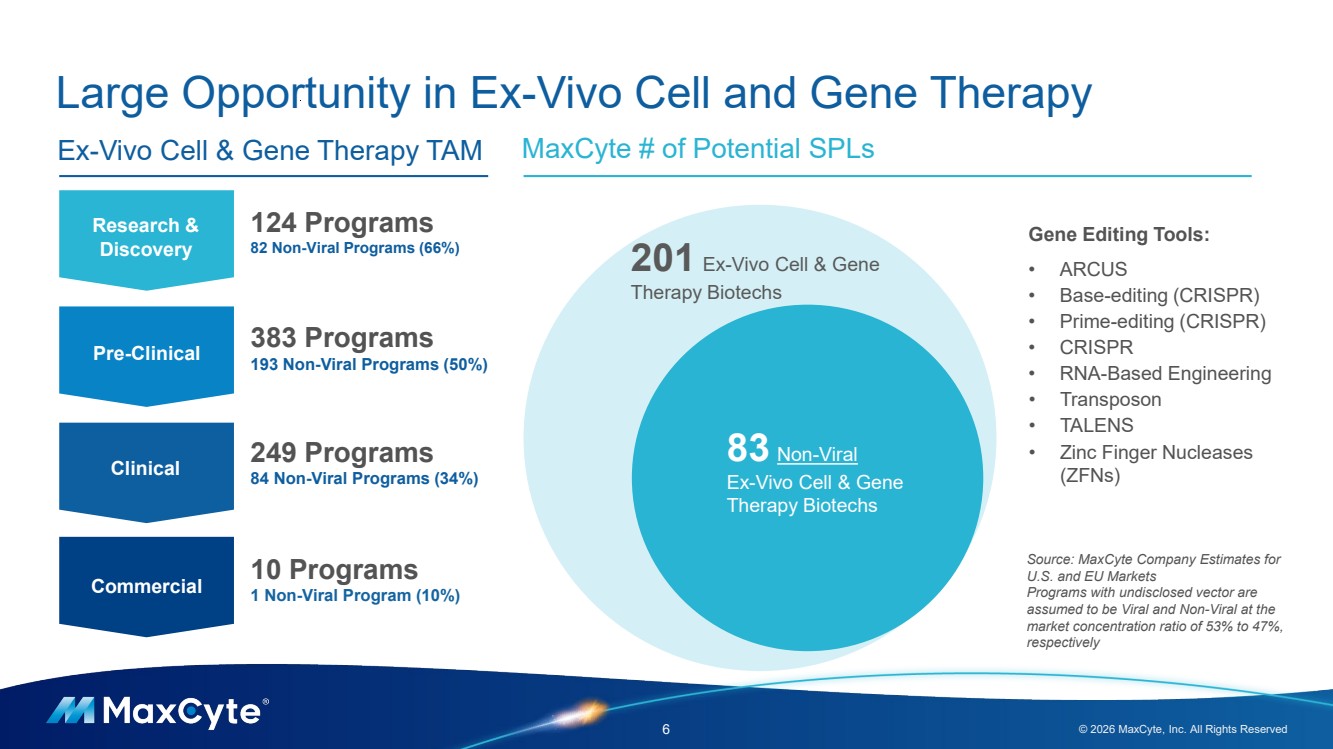
| Large Opportunity in Ex-Vivo Cell and Gene Therapy 6 © 2026 MaxCyte, Inc. All Rights Reserved MaxCyte # of Potential SPLs Research & Discovery Pre-Clinical Clinical Commercial 124 Programs 82 Non-Viral Programs (66%) 383 Programs 193 Non-Viral Programs (50%) 249 Programs 84 Non-Viral Programs (34%) 10 Programs 1 Non-Viral Program (10%) Ex-Vivo Cell & Gene Therapy TAM 201 Ex-Vivo Cell & Gene Therapy Biotechs 83 Non-Viral Ex-Vivo Cell & Gene Therapy Biotechs Gene Editing Tools: • ARCUS • Base-editing (CRISPR) • Prime-editing (CRISPR) • CRISPR • RNA-Based Engineering • Transposon • TALENS • Zinc Finger Nucleases (ZFNs) Source: MaxCyte Company Estimates for U.S. and EU Markets Programs with undisclosed vector are assumed to be Viral and Non-Viral at the market concentration ratio of 53% to 47%, respectively |
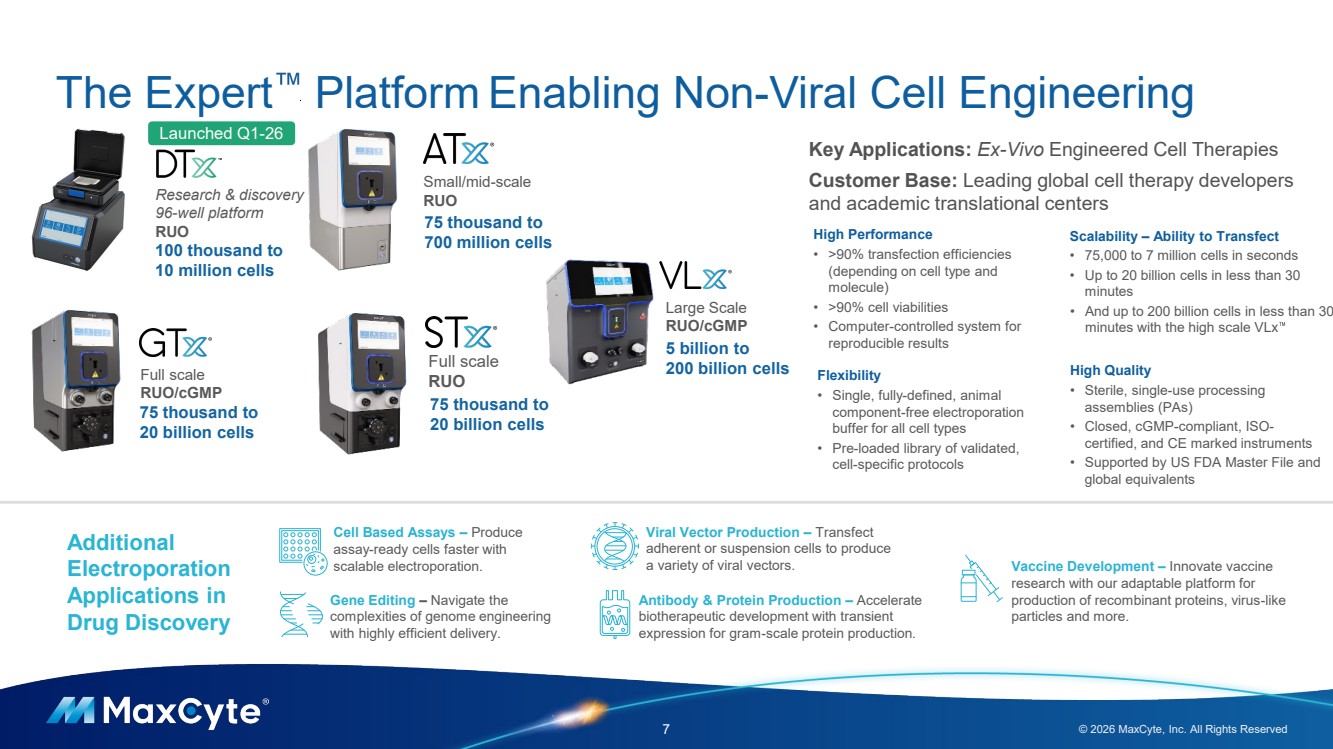
| The Expert Platform Enabling Non-Viral Cell Engineering 7 © 2026 MaxCyte, Inc. All Rights Reserved Full scale RUO Small/mid-scale RUO Large Scale RUO/cGMP Full scale RUO/cGMP 75 thousand to 700 million cells 75 thousand to 20 billion cells 5 billion to 200 billion cells 75 thousand to 20 billion cells High Performance • >90% transfection efficiencies (depending on cell type and molecule) • >90% cell viabilities • Computer-controlled system for reproducible results Flexibility • Single, fully-defined, animal component-free electroporation buffer for all cell types • Pre-loaded library of validated, cell-specific protocols Scalability – Ability to Transfect • 75,000 to 7 million cells in seconds • Up to 20 billion cells in less than 30 minutes • And up to 200 billion cells in less than 30 minutes with the high scale VLx High Quality • Sterile, single-use processing assemblies (PAs) • Closed, cGMP-compliant, ISO-certified, and CE marked instruments • Supported by US FDA Master File and global equivalents Key Applications: Ex-Vivo Engineered Cell Therapies Customer Base: Leading global cell therapy developers and academic translational centers Additional Electroporation Applications in Drug Discovery Viral Vector Production – Transfect adherent or suspension cells to produce a variety of viral vectors. Cell Based Assays – Produce assay-ready cells faster with scalable electroporation. Gene Editing – Navigate the complexities of genome engineering with highly efficient delivery. Antibody & Protein Production – Accelerate biotherapeutic development with transient expression for gram-scale protein production. Vaccine Development – Innovate vaccine research with our adaptable platform for production of recombinant proteins, virus-like particles and more. Research & discovery 96-well platform RUO 100 thousand to 10 million cells Launched Q1-26 |
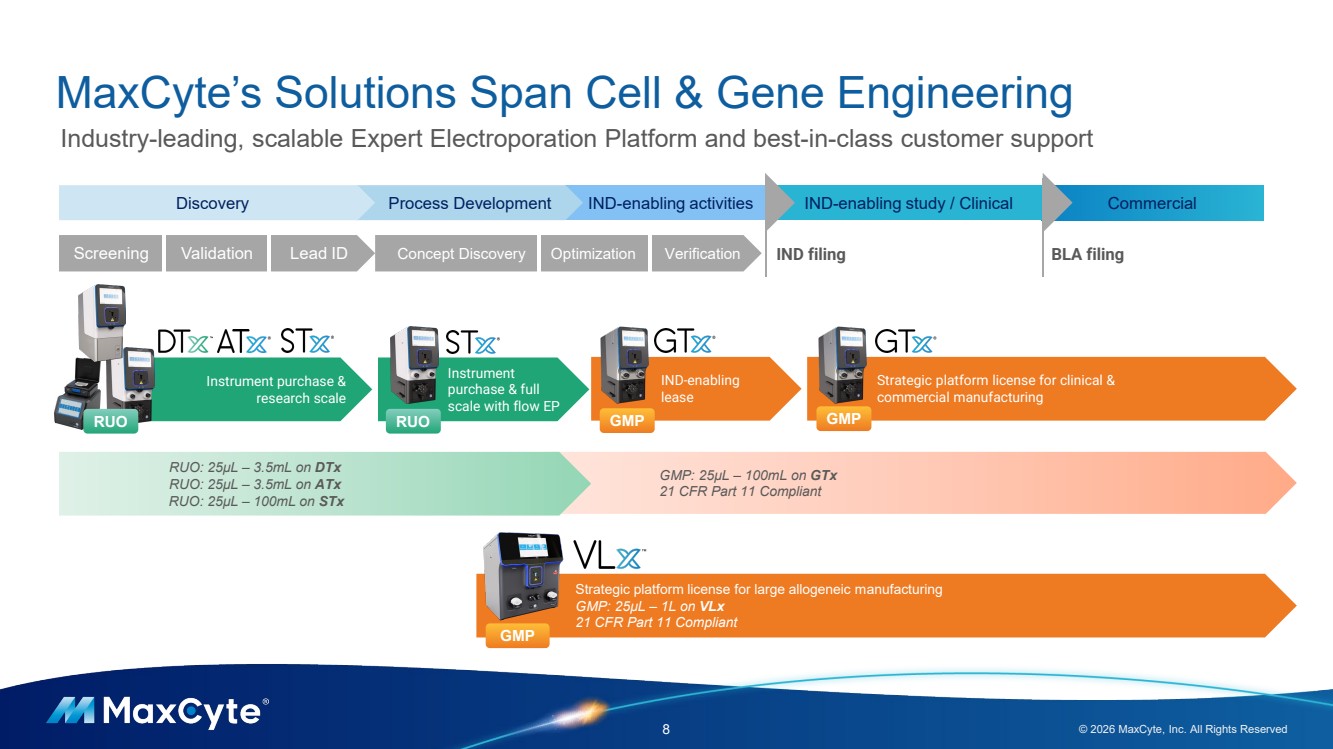
| Instrument purchase & research scale GMP: 25µL – 100mL on GTx 21 CFR Part 11 Compliant MaxCyte’s Solutions Span Cell & Gene Engineering 8 © 2026 MaxCyte, Inc. All Rights Reserved Industry-leading, scalable Expert Electroporation Platform and best-in-class customer support Commercial Strategic platform license for clinical & commercial manufacturing IND-enabling lease Discovery Process Development IND-enabling activities IND-enabling study / Clinical IND filing BLA filing Instrument purchase & full scale with flow EP RUO RUO GMP GMP Screening Validation Lead ID Concept Discovery Optimization Verification RUO: 25µL – 3.5mL on DTx RUO: 25µL – 3.5mL on ATx RUO: 25µL – 100mL on STx Strategic platform license for large allogeneic manufacturing GMP: 25µL – 1L on VLx 21 CFR Part 11 Compliant GMP |
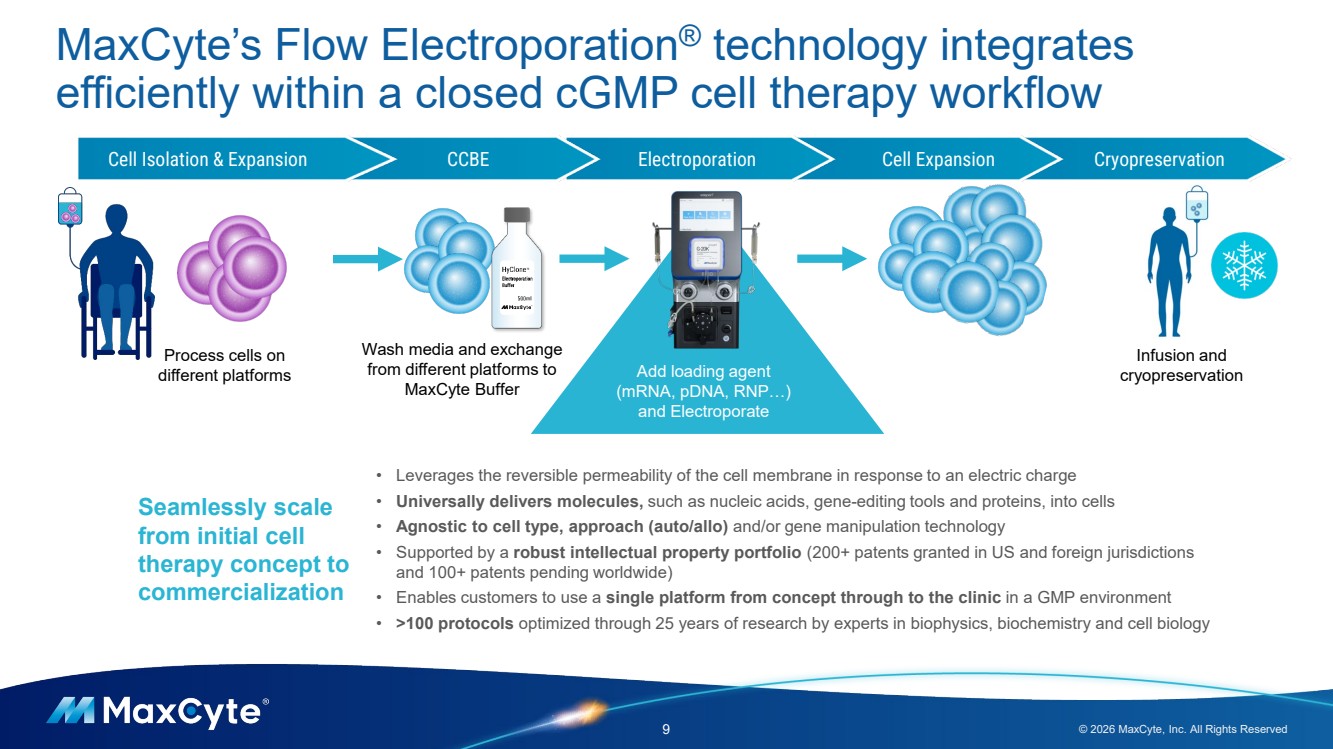
| MaxCyte’s Flow Electroporation® technology integrates efficiently within a closed cGMP cell therapy workflow 9 © 2026 MaxCyte, Inc. All Rights Reserved Cell Isolation & Expansion CCBE Electroporation Cell Expansion Cryopreservation Add loading agent (mRNA, pDNA, RNP…) and Electroporate Process cells on different platforms Wash media and exchange from different platforms to MaxCyte Buffer Infusion and cryopreservation Seamlessly scale from initial cell therapy concept to commercialization • Leverages the reversible permeability of the cell membrane in response to an electric charge • Universally delivers molecules, such as nucleic acids, gene-editing tools and proteins, into cells • Agnostic to cell type, approach (auto/allo) and/or gene manipulation technology • Supported by a robust intellectual property portfolio (200+ patents granted in US and foreign jurisdictions and 100+ patents pending worldwide) • Enables customers to use a single platform from concept through to the clinic in a GMP environment • >100 protocols optimized through 25 years of research by experts in biophysics, biochemistry and cell biology |
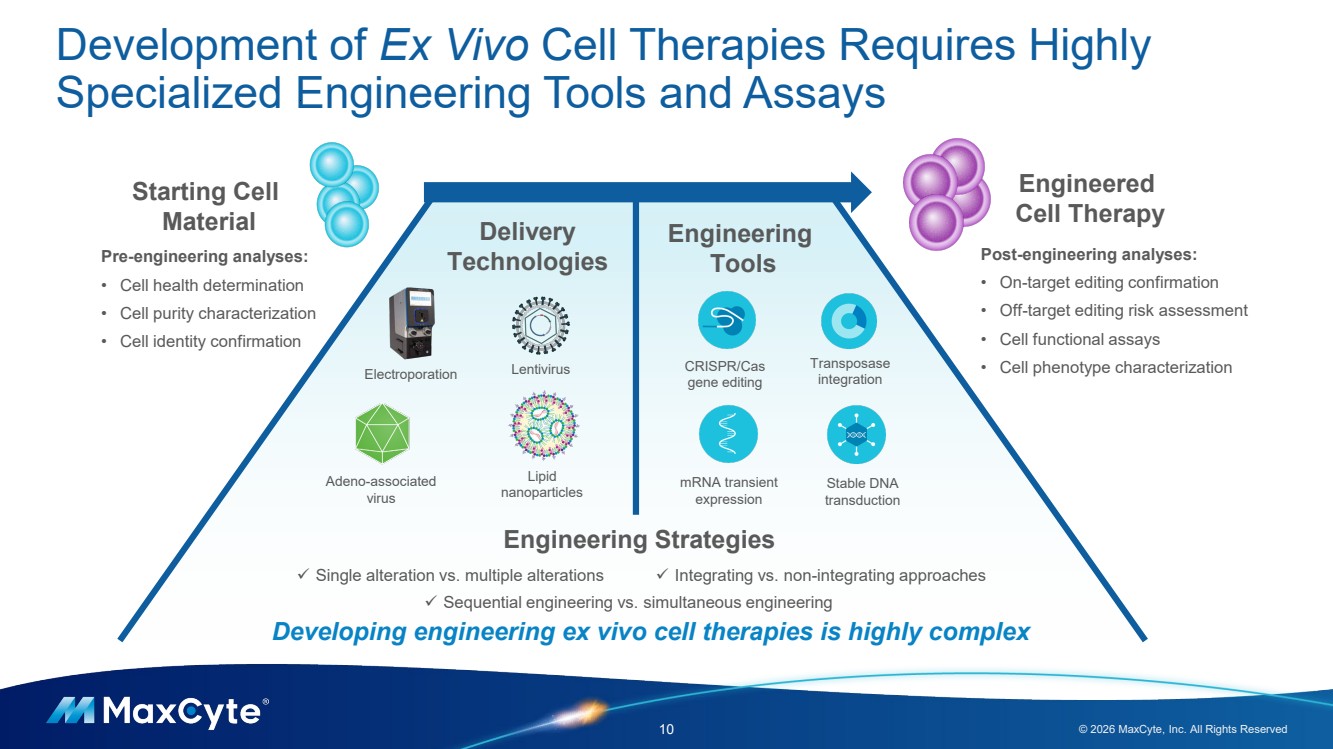
| Development of Ex Vivo Cell Therapies Requires Highly Specialized Engineering Tools and Assays 10 © 2026 MaxCyte, Inc. All Rights Reserved Lentivirus Adeno-associated virus Lipid nanoparticles Electroporation Engineering Tools Delivery Technologies CRISPR/Cas gene editing Transposase integration mRNA transient expression Stable DNA transduction Engineered Cell Therapy Starting Cell Material Post-engineering analyses: • On-target editing confirmation • Off-target editing risk assessment • Cell functional assays • Cell phenotype characterization Engineering Strategies Pre-engineering analyses: • Cell health determination • Cell purity characterization • Cell identity confirmation Single alteration vs. multiple alterations Sequential engineering vs. simultaneous engineering Integrating vs. non-integrating approaches Developing engineering ex vivo cell therapies is highly complex |
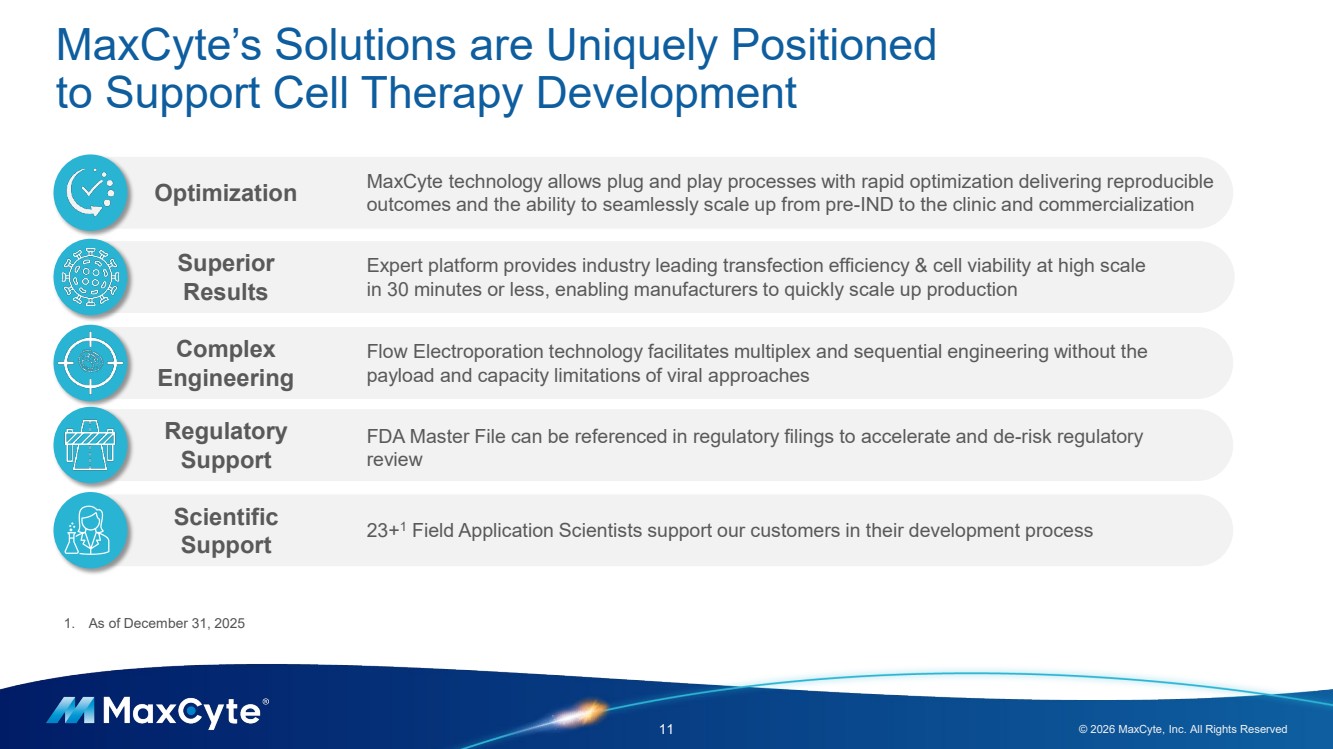
| MaxCyte’s Solutions are Uniquely Positioned to Support Cell Therapy Development 11 © 2026 MaxCyte, Inc. All Rights Reserved Flow Electroporation technology facilitates multiplex and sequential engineering without the payload and capacity limitations of viral approaches 23+1 Field Application Scientists support our customers in their development process Expert platform provides industry leading transfection efficiency & cell viability at high scale in 30 minutes or less, enabling manufacturers to quickly scale up production Regulatory Support Superior Results Complex Engineering Optimization Scientific Support FDA Master File can be referenced in regulatory filings to accelerate and de-risk regulatory review MaxCyte technology allows plug and play processes with rapid optimization delivering reproducible outcomes and the ability to seamlessly scale up from pre-IND to the clinic and commercialization 1. As of December 31, 2025 |
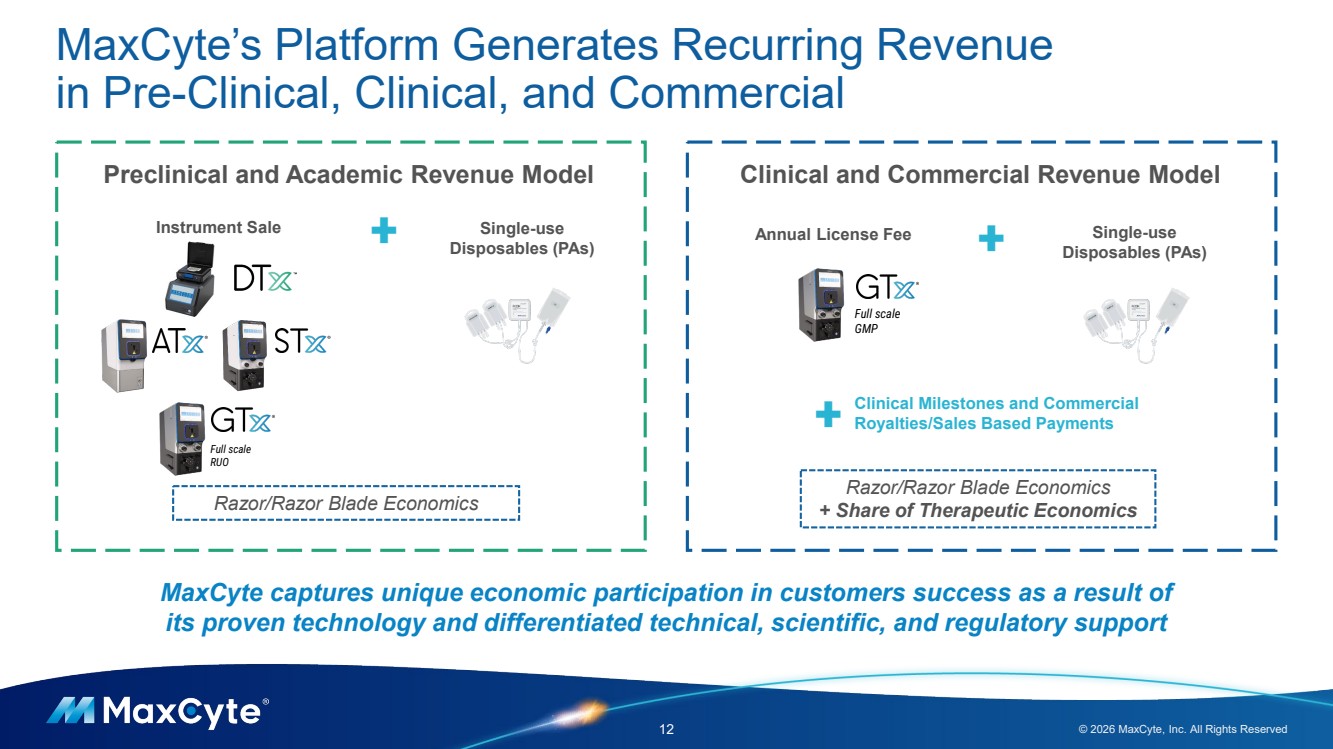
| MaxCyte’s Platform Generates Recurring Revenue in Pre-Clinical, Clinical, and Commercial 12 © 2026 MaxCyte, Inc. All Rights Reserved Razor/Razor Blade Economics Full scale RUO Preclinical and Academic Revenue Model Instrument Sale Clinical and Commercial Revenue Model Annual License Fee Razor/Razor Blade Economics + Share of Therapeutic Economics Clinical Milestones and Commercial Royalties/Sales Based Payments Single-use Disposables (PAs) Full scale GMP Single-use Disposables (PAs) + + + MaxCyte captures unique economic participation in customers success as a result of its proven technology and differentiated technical, scientific, and regulatory support |
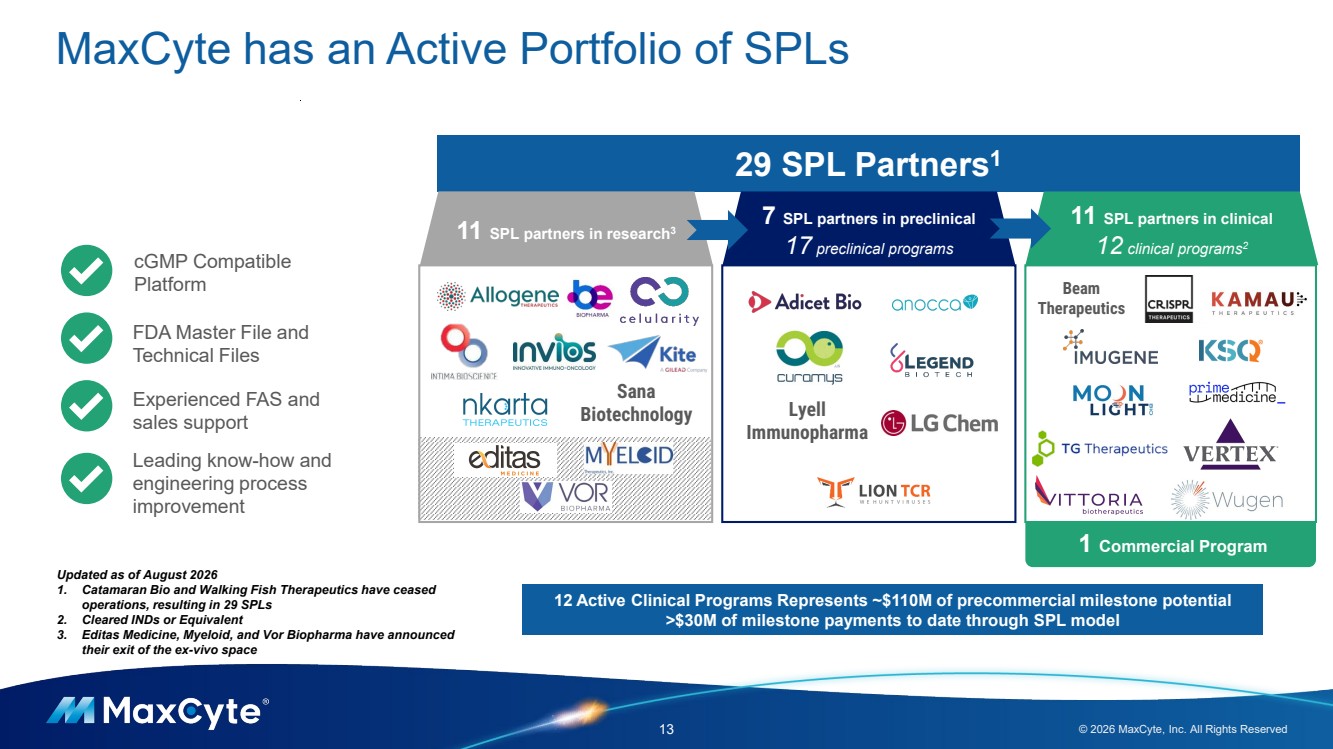
| Lyell Immunopharma MaxCyte has an Active Portfolio of SPLs 13 © 2026 MaxCyte, Inc. All Rights Reserved 29 SPL Partners1 Sana Biotechnology Beam Therapeutics cGMP Compatible Platform FDA Master File and Technical Files Experienced FAS and sales support Leading know-how and engineering process improvement 12 Active Clinical Programs Represents ~$110M of precommercial milestone potential >$30M of milestone payments to date through SPL model ` Updated as of August 2026 1. Catamaran Bio and Walking Fish Therapeutics have ceased operations, resulting in 29 SPLs 2. Cleared INDs or Equivalent 3. Editas Medicine, Myeloid, and Vor Biopharma have announced their exit of the ex-vivo space 7 SPL partners in preclinical 17 preclinical programs 11 SPL partners in clinical 12 clinical programs2 11 SPL partners in research3 1 Commercial Program |
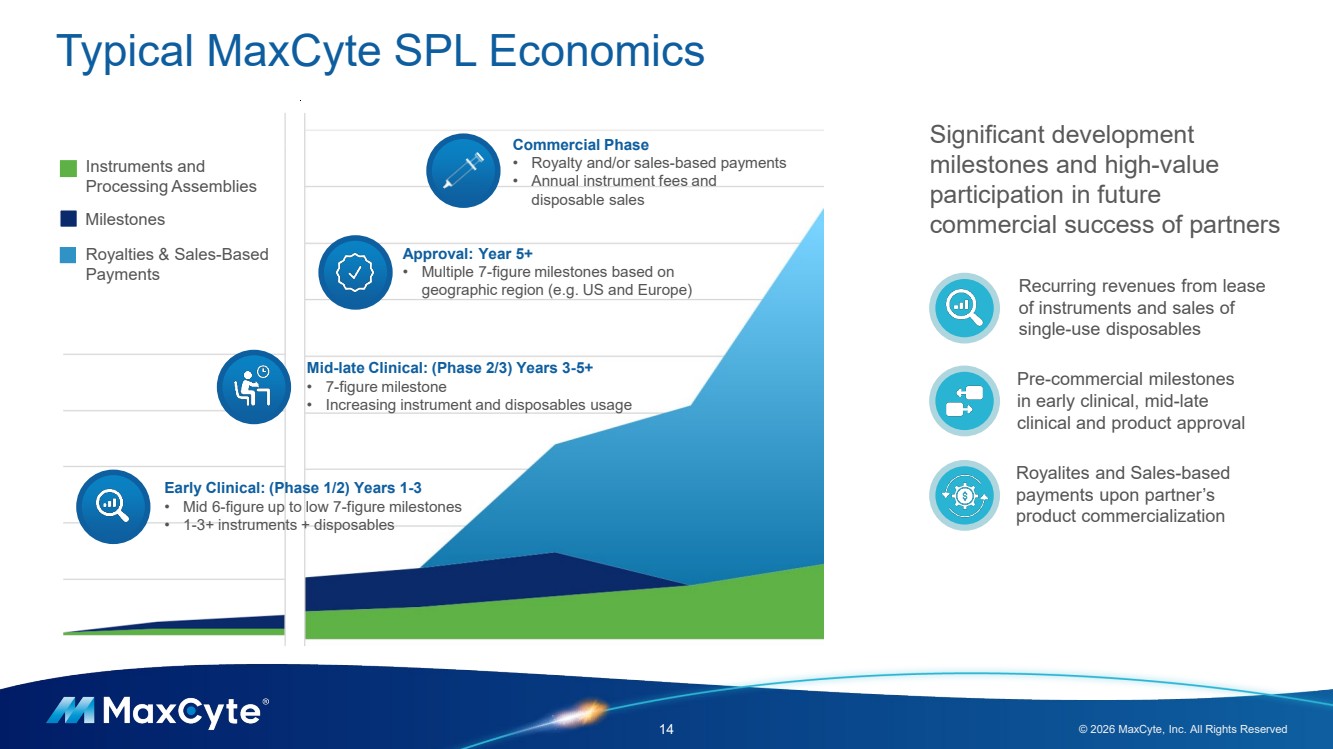
| Typical MaxCyte SPL Economics 14 © 2026 MaxCyte, Inc. All Rights Reserved Early Clinical: (Phase 1/2) Years 1-3 • Mid 6-figure up to low 7-figure milestones • 1-3+ instruments + disposables Mid-late Clinical: (Phase 2/3) Years 3-5+ • 7-figure milestone • Increasing instrument and disposables usage Approval: Year 5+ • Multiple 7-figure milestones based on geographic region (e.g. US and Europe) Commercial Phase • Royalty and/or sales-based payments • Annual instrument fees and disposable sales Instruments and Processing Assemblies Milestones Royalties & Sales-Based Payments Pre-commercial milestones in early clinical, mid-late clinical and product approval Significant development milestones and high-value participation in future commercial success of partners Recurring revenues from lease of instruments and sales of single-use disposables Royalites and Sales-based payments upon partner’s product commercialization |
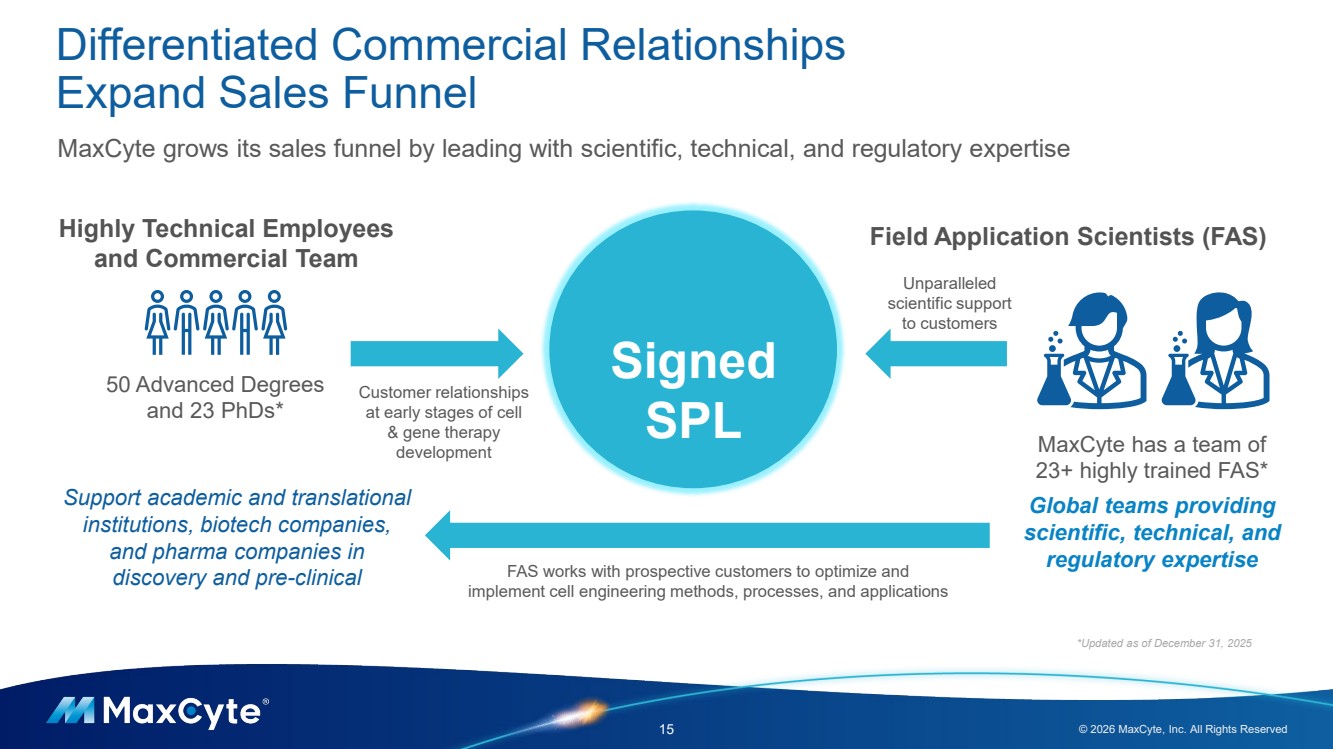
| Differentiated Commercial Relationships Expand Sales Funnel 15 © 2026 MaxCyte, Inc. All Rights Reserved Highly Technical Employees Field Application Scientists (FAS) and Commercial Team Unparalleled scientific support to customers Customer relationships at early stages of cell & gene therapy development Signed SPL *Updated as of December 31, 2025 MaxCyte has a team of 23+ highly trained FAS* Global teams providing scientific, technical, and regulatory expertise FAS works with prospective customers to optimize and implement cell engineering methods, processes, and applications MaxCyte grows its sales funnel by leading with scientific, technical, and regulatory expertise 50 Advanced Degrees and 23 PhDs* Support academic and translational institutions, biotech companies, and pharma companies in discovery and pre-clinical |
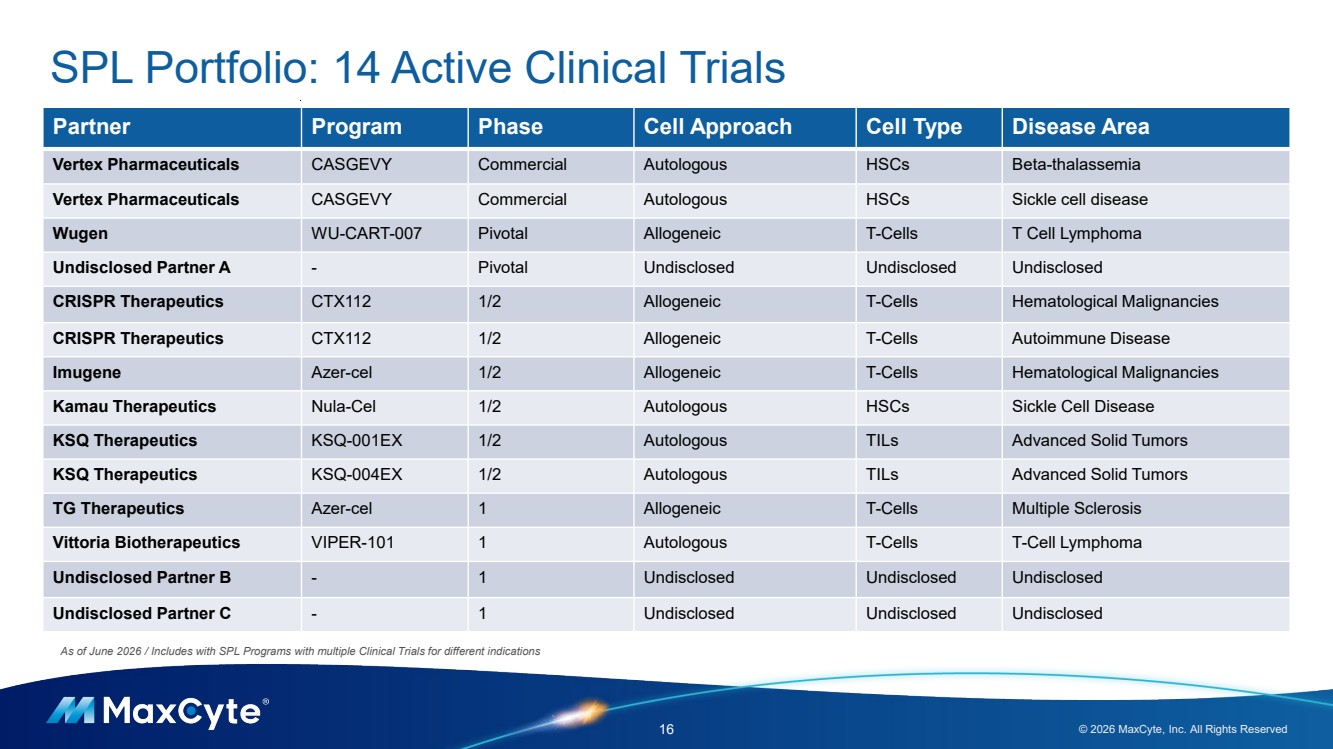
| 16 © 2026 MaxCyte, Inc. All Rights Reserved As of June 2026 / Includes with SPL Programs with multiple Clinical Trials for different indications SPL Portfolio: 14 Active Clinical Trials Partner Program Phase Cell Approach Cell Type Disease Area Vertex Pharmaceuticals CASGEVY Commercial Autologous HSCs Beta-thalassemia Vertex Pharmaceuticals CASGEVY Commercial Autologous HSCs Sickle cell disease Wugen WU-CART-007 Pivotal Allogeneic T-Cells T Cell Lymphoma Undisclosed Partner A - Pivotal Undisclosed Undisclosed Undisclosed CRISPR Therapeutics CTX112 1/2 Allogeneic T-Cells Hematological Malignancies CRISPR Therapeutics CTX112 1/2 Allogeneic T-Cells Autoimmune Disease Imugene Azer-cel 1/2 Allogeneic T-Cells Hematological Malignancies Kamau Therapeutics Nula-Cel 1/2 Autologous HSCs Sickle Cell Disease KSQ Therapeutics KSQ-001EX 1/2 Autologous TILs Advanced Solid Tumors KSQ Therapeutics KSQ-004EX 1/2 Autologous TILs Advanced Solid Tumors TG Therapeutics Azer-cel 1 Allogeneic T-Cells Multiple Sclerosis Vittoria Biotherapeutics VIPER-101 1 Autologous T-Cells T-Cell Lymphoma Undisclosed Partner B - 1 Undisclosed Undisclosed Undisclosed Undisclosed Partner C - 1 Undisclosed Undisclosed Undisclosed |
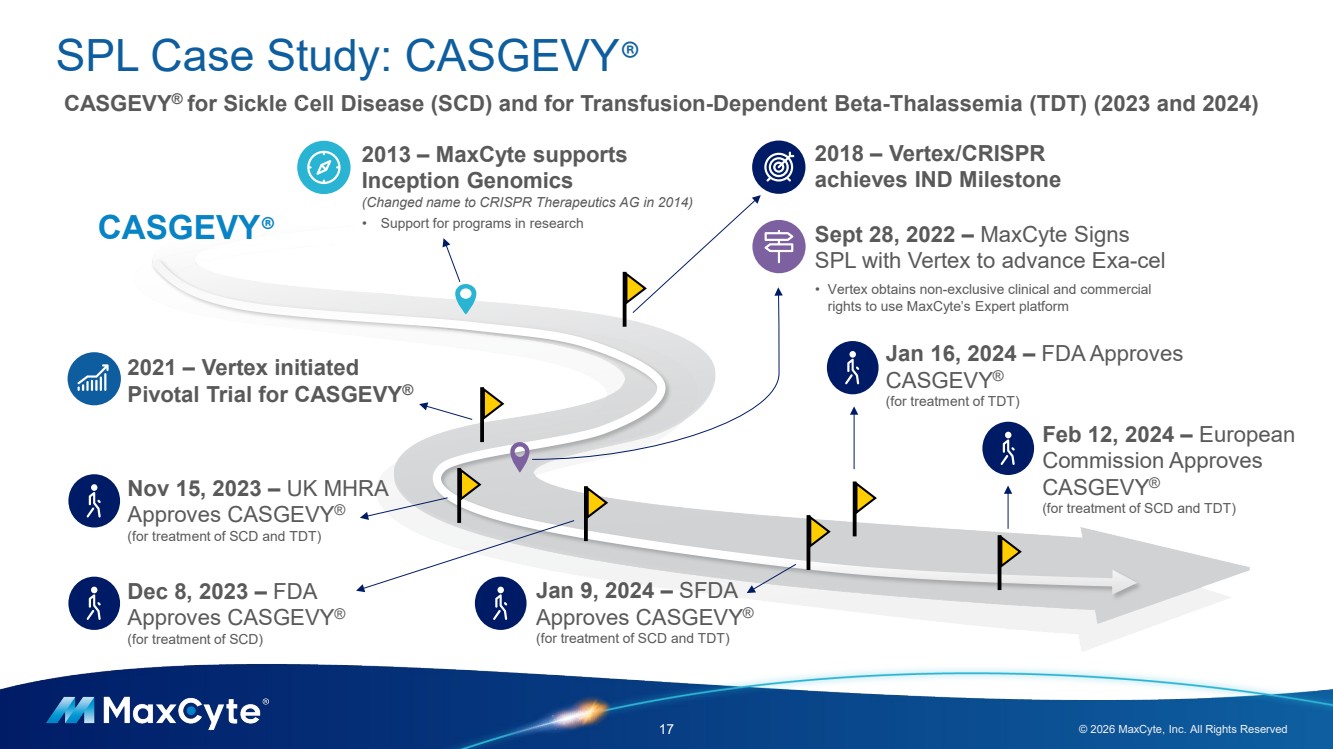
| SPL Case Study: CASGEVY® 17 © 2026 MaxCyte, Inc. All Rights Reserved CASGEVY® for Sickle Cell Disease (SCD) and for Transfusion-Dependent Beta-Thalassemia (TDT) (2023 and 2024) 2013 – MaxCyte supports Inception Genomics (Changed name to CRISPR Therapeutics AG in 2014) • Support for programs in research 2018 – Vertex/CRISPR achieves IND Milestone Sept 28, 2022 – MaxCyte Signs SPL with Vertex to advance Exa-cel • Vertex obtains non-exclusive clinical and commercial rights to use MaxCyte’s Expert platform Dec 8, 2023 – FDA Approves CASGEVY® (for treatment of SCD) 2021 – Vertex initiated Pivotal Trial for CASGEVY® Jan 16, 2024 – FDA Approves CASGEVY® (for treatment of TDT) Feb 12, 2024 – European Commission Approves CASGEVY® (for treatment of SCD and TDT) Nov 15, 2023 – UK MHRA Approves CASGEVY® (for treatment of SCD and TDT) CASGEVY® Jan 9, 2024 – SFDA Approves CASGEVY® (for treatment of SCD and TDT) |
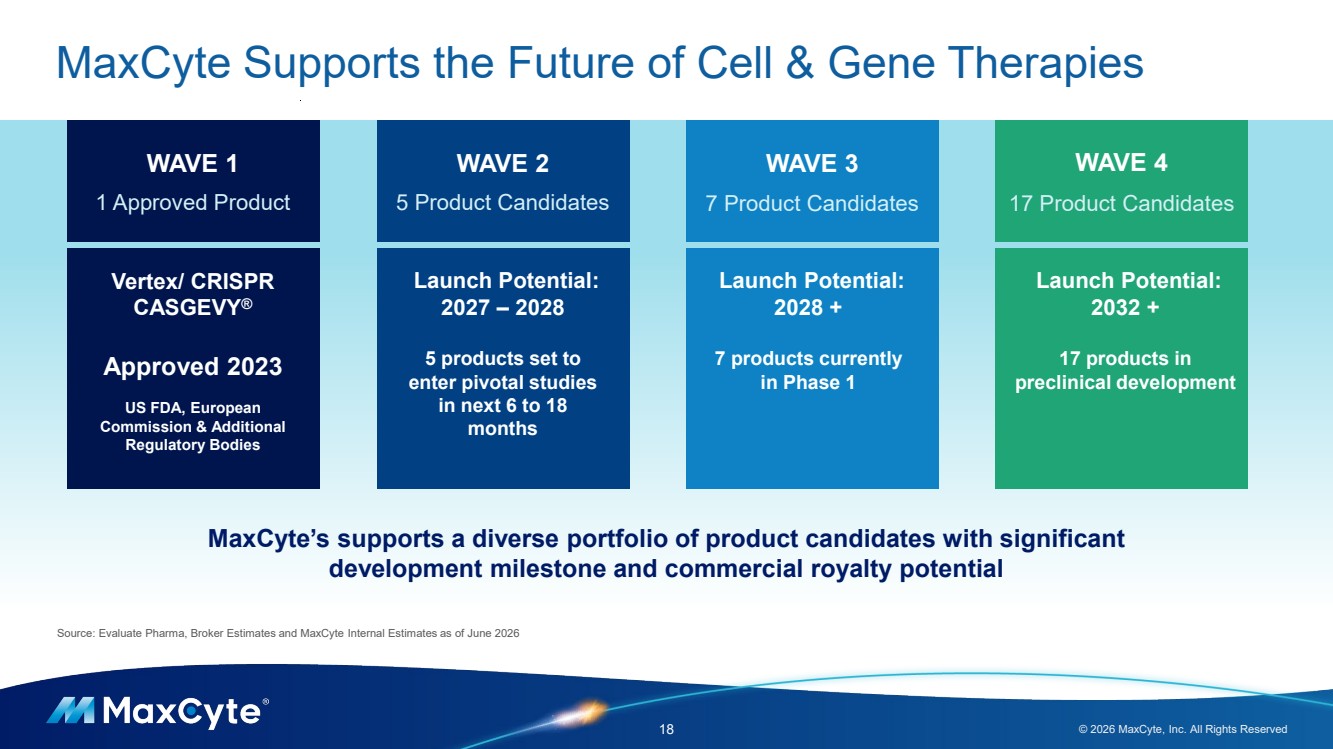
| MaxCyte Supports the Future of Cell & Gene Therapies 18 © 2026 MaxCyte, Inc. All Rights Reserved WAVE 1 1 Approved Product WAVE 2 5 Product Candidates WAVE 3 7 Product Candidates WAVE 4 17 Product Candidates Vertex/ CRISPR CASGEVY® Approved 2023 US FDA, European Commission & Additional Regulatory Bodies Launch Potential: 2027 – 2028 5 products set to enter pivotal studies in next 6 to 18 months Launch Potential: 2028 + 7 products currently in Phase 1 Launch Potential: 2032 + 17 products in preclinical development Source: Evaluate Pharma, Broker Estimates and MaxCyte Internal Estimates as of June 2026 MaxCyte’s supports a diverse portfolio of product candidates with significant development milestone and commercial royalty potential |
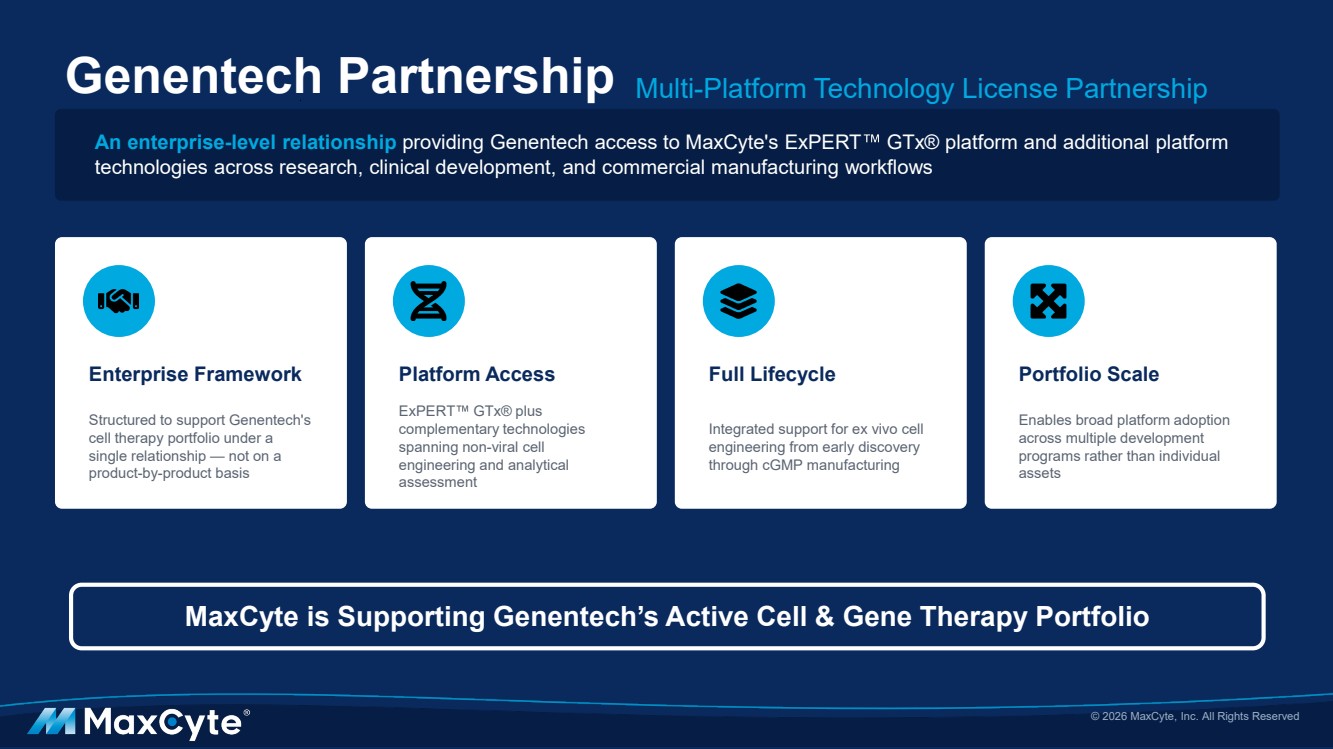
| Genentech Partnership Multi-Platform Technology License Partnership An enterprise-level relationship providing Genentech access to MaxCyte's ExPERT GTx® platform and additional platform technologies across research, clinical development, and commercial manufacturing workflows Enterprise Framework Structured to support Genentech's cell therapy portfolio under a single relationship — not on a product-by-product basis Platform Access ExPERT GTx® plus complementary technologies spanning non-viral cell engineering and analytical assessment Full Lifecycle Integrated support for ex vivo cell engineering from early discovery through cGMP manufacturing Portfolio Scale Enables broad platform adoption across multiple development programs rather than individual assets © 2026 MaxCyte, Inc. All Rights Reserved MaxCyte is Supporting Genentech’s Active Cell & Gene Therapy Portfolio |
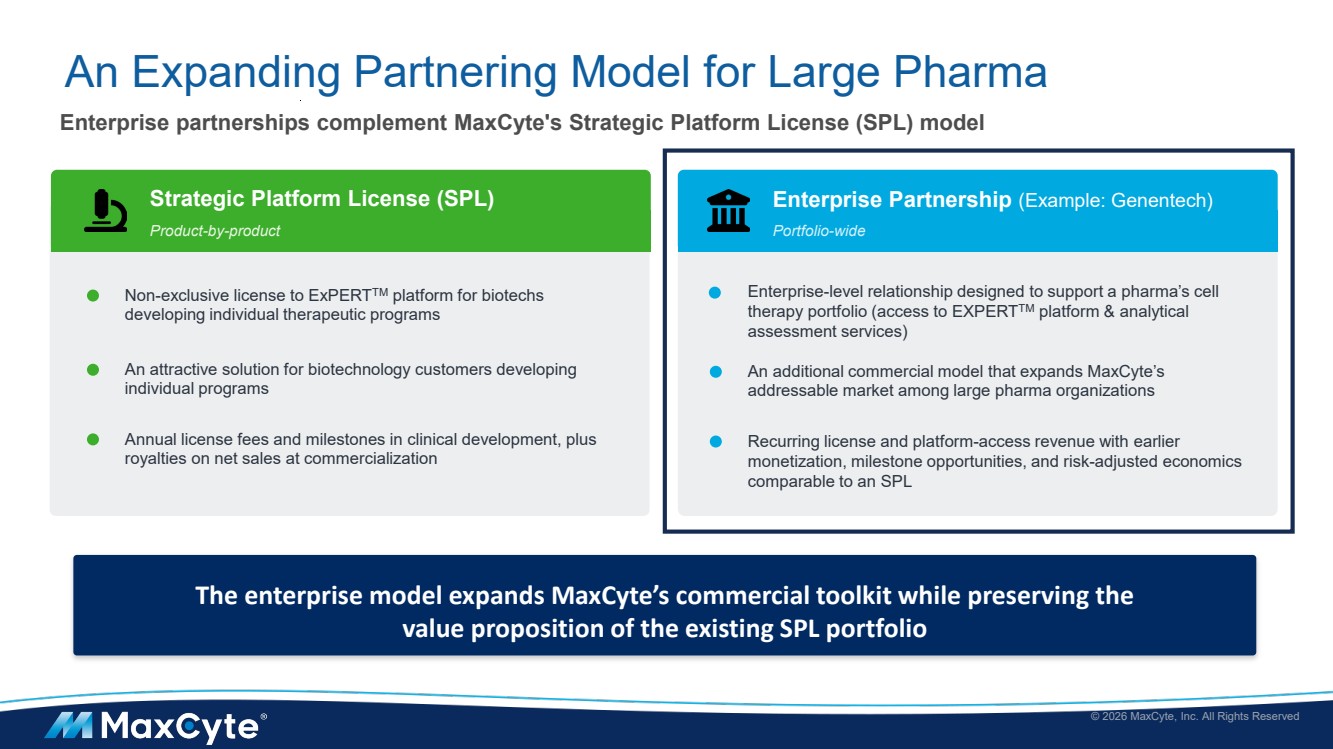
| An Expanding Partnering Model for Large Pharma Enterprise partnerships complement MaxCyte's Strategic Platform License (SPL) model Strategic Platform License (SPL) Product-by-product Non-exclusive license to ExPERTTM platform for biotechs developing individual therapeutic programs An attractive solution for biotechnology customers developing individual programs Annual license fees and milestones in clinical development, plus royalties on net sales at commercialization Enterprise Partnership (Example: Genentech) Portfolio-wide Enterprise-level relationship designed to support a pharma’s cell therapy portfolio (access to EXPERTTM platform & analytical assessment services) An additional commercial model that expands MaxCyte’s addressable market among large pharma organizations © 2026 MaxCyte, Inc. All Rights Reserved Recurring license and platform-access revenue with earlier monetization, milestone opportunities, and risk-adjusted economics comparable to an SPL The enterprise model expands MaxCyte’s commercial toolkit while preserving the value proposition of the existing SPL portfolio |
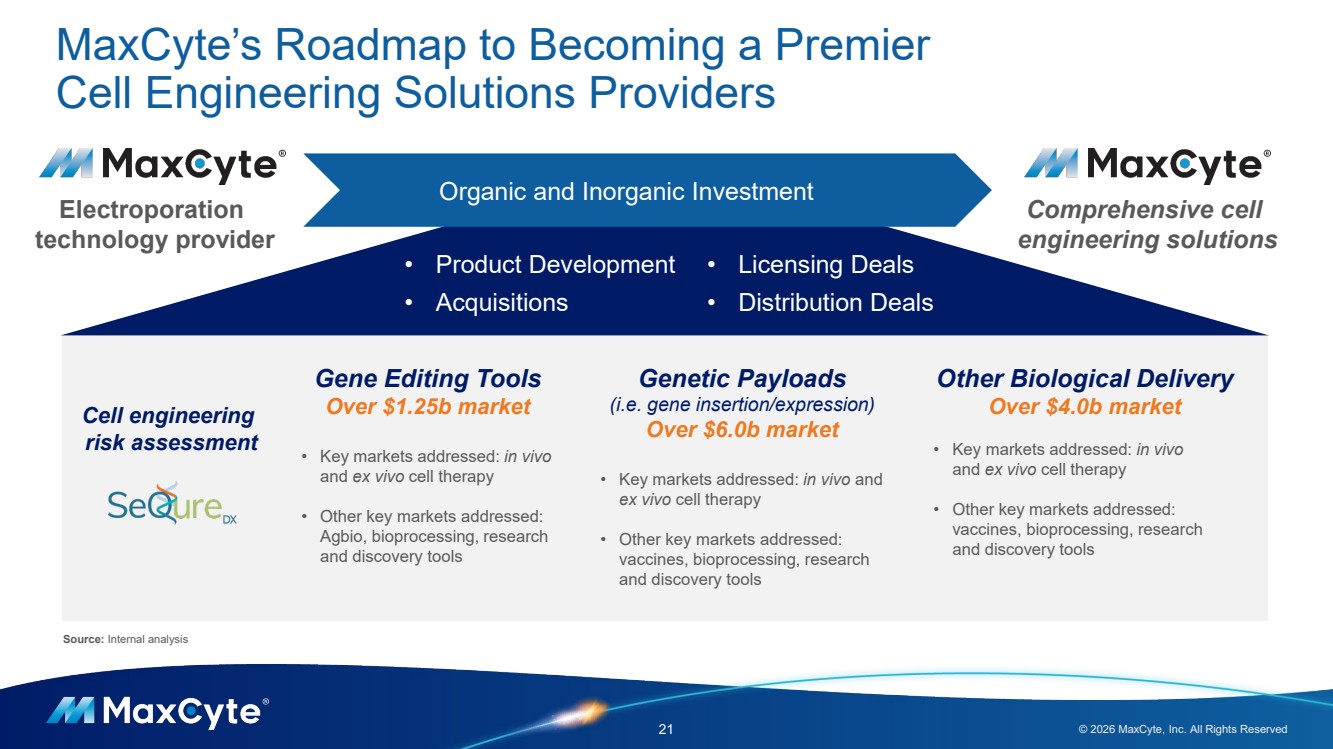
| MaxCyte’s Roadmap to Becoming a Premier Cell Engineering Solutions Providers 21 © 2026 MaxCyte, Inc. All Rights Reserved Electroporation technology provider Comprehensive cell engineering solutions Gene Editing Tools Over $1.25b market • Key markets addressed: in vivo and ex vivo cell therapy • Other key markets addressed: Agbio, bioprocessing, research and discovery tools Genetic Payloads (i.e. gene insertion/expression) Over $6.0b market • Key markets addressed: in vivo and ex vivo cell therapy • Other key markets addressed: vaccines, bioprocessing, research and discovery tools Other Biological Delivery Over $4.0b market • Key markets addressed: in vivo and ex vivo cell therapy • Other key markets addressed: vaccines, bioprocessing, research and discovery tools Cell engineering risk assessment Organic and Inorganic Investment • Product Development • Acquisitions • Licensing Deals • Distribution Deals Source: Internal analysis |
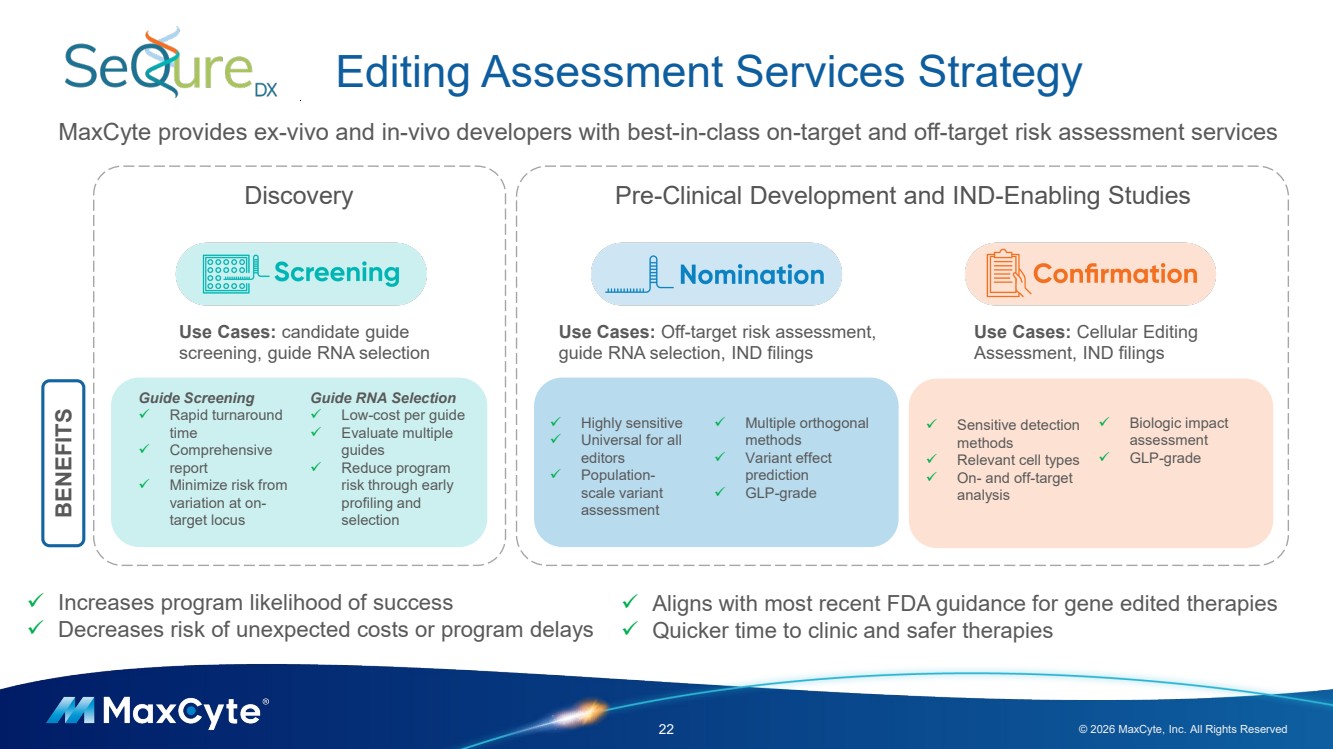
| Editing Assessment Services Strategy 22 © 2026 MaxCyte, Inc. All Rights Reserved MaxCyte provides ex-vivo and in-vivo developers with best-in-class on-target and off-target risk assessment services Use Cases: candidate guide screening, guide RNA selection Use Cases: Off-target risk assessment, guide RNA selection, IND filings Highly sensitive Universal for all editors Population-scale variant assessment Multiple orthogonal methods Variant effect prediction GLP-grade Guide Screening Rapid turnaround time Comprehensive report Minimize risk from variation at on-target locus Guide RNA Selection Low-cost per guide Evaluate multiple guides Reduce program risk through early profiling and selection Use Cases: Cellular Editing Assessment, IND filings Sensitive detection methods Relevant cell types On- and off-target analysis Biologic impact assessment GLP-grade Increases program likelihood of success Decreases risk of unexpected costs or program delays Aligns with most recent FDA guidance for gene edited therapies Quicker time to clinic and safer therapies Discovery Pre-Clinical Development and IND-Enabling Studies BENEFITS |
| 23 © 2026 MaxCyte, Inc. All Rights Reserved Financial Summary $2.1 $1.8 $3.1 $2.3 $2.6 $1.8 $0.1 $0.3 $0.3 $0.3 2Q25 2Q26 Core Revenue: (21%) Decline $7.1 $6.8 $14.0 $11.9 $10.3 $8.9 $1.1 $1.2 $6.1 $3.4 2024 2025 Core Revenue: (9%) Decline 1. Excluding SPL Program-related revenue and reserves for excess and obsolete inventory. See appendix for reconciliation to GAAP gross margins Financial Highlights (As of June 30, 2026) 77% Non-GAAP adjusted Gross Margin1 46% Core revenue generated from SPL partners as a % of core revenue 899 Total Installed Base of Instruments (sold or licensed) $142 million Total cash, cash equivalents, and investments Total Annual Revenue (millions) Core Revenue Total Quarterly Revenue (millions) Core Revenue $38.6 $33.0 $7.3 $8.5 $0.3 $0.8 $0.8 |
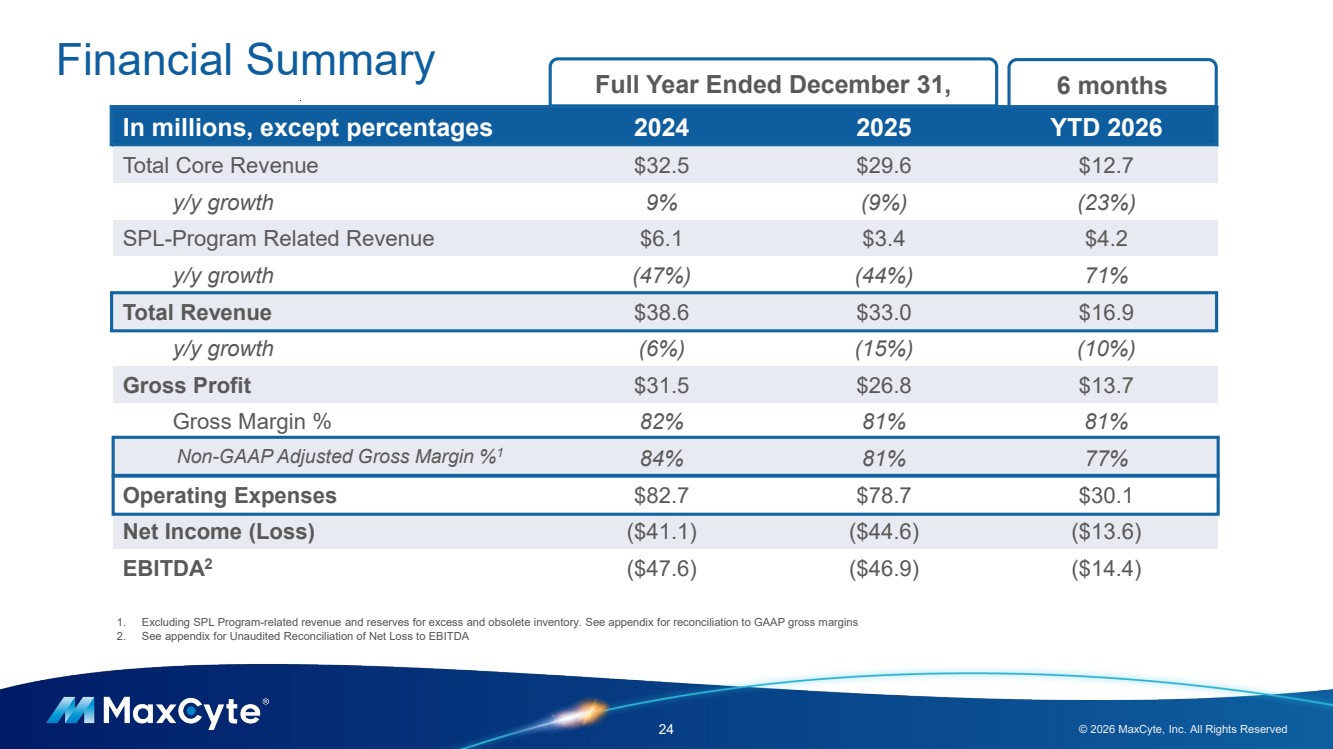
| Financial Summary 24 © 2026 MaxCyte, Inc. All Rights Reserved In millions, except percentages 2024 2025 YTD 2026 Total Core Revenue $32.5 $29.6 $12.7 y/y growth 9% (9%) (23%) SPL-Program Related Revenue $6.1 $3.4 $4.2 y/y growth (47%) (44%) 71% Total Revenue $38.6 $33.0 $16.9 y/y growth (6%) (15%) (10%) Gross Profit $31.5 $26.8 $13.7 Gross Margin % 82% 81% 81% Non-GAAP Adjusted Gross Margin %1 84% 81% 77% Operating Expenses $82.7 $78.7 $30.1 Net Income (Loss) ($41.1) ($44.6) ($13.6) EBITDA2 ($47.6) ($46.9) ($14.4) Full Year Ended December 31, 1. Excluding SPL Program-related revenue and reserves for excess and obsolete inventory. See appendix for reconciliation to GAAP gross margins 2. See appendix for Unaudited Reconciliation of Net Loss to EBITDA 6 months |
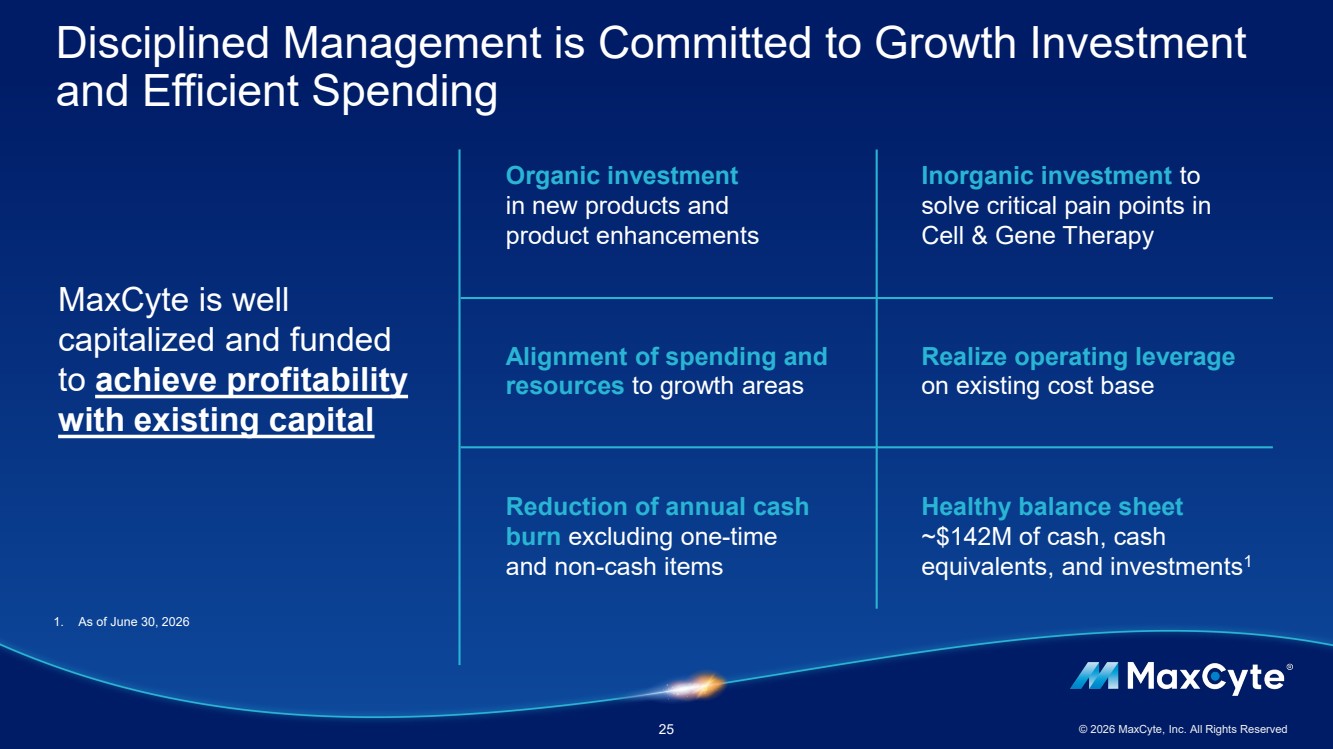
| Disciplined Management is Committed to Growth Investment and Efficient Spending 25 © 2026 MaxCyte, Inc. All Rights Reserved MaxCyte is well capitalized and funded to achieve profitability with existing capital Alignment of spending and resources to growth areas Organic investment in new products and product enhancements Reduction of annual cash burn excluding one-time and non-cash items Realize operating leverage on existing cost base Inorganic investment to solve critical pain points in Cell & Gene Therapy Healthy balance sheet ~$142M of cash, cash equivalents, and investments1 1. As of June 30, 2026 |
| All other trademarks are the property of their respective owners. ©2025 MaxCyte, Inc. All rights reserved. For a complete list of MaxCyte trademarks in the United States and other countries, please visit maxcyte.com/trademarks. Thank you! Any questions? [email protected] 26 © 2026 MaxCyte, Inc. All Rights Reserved |
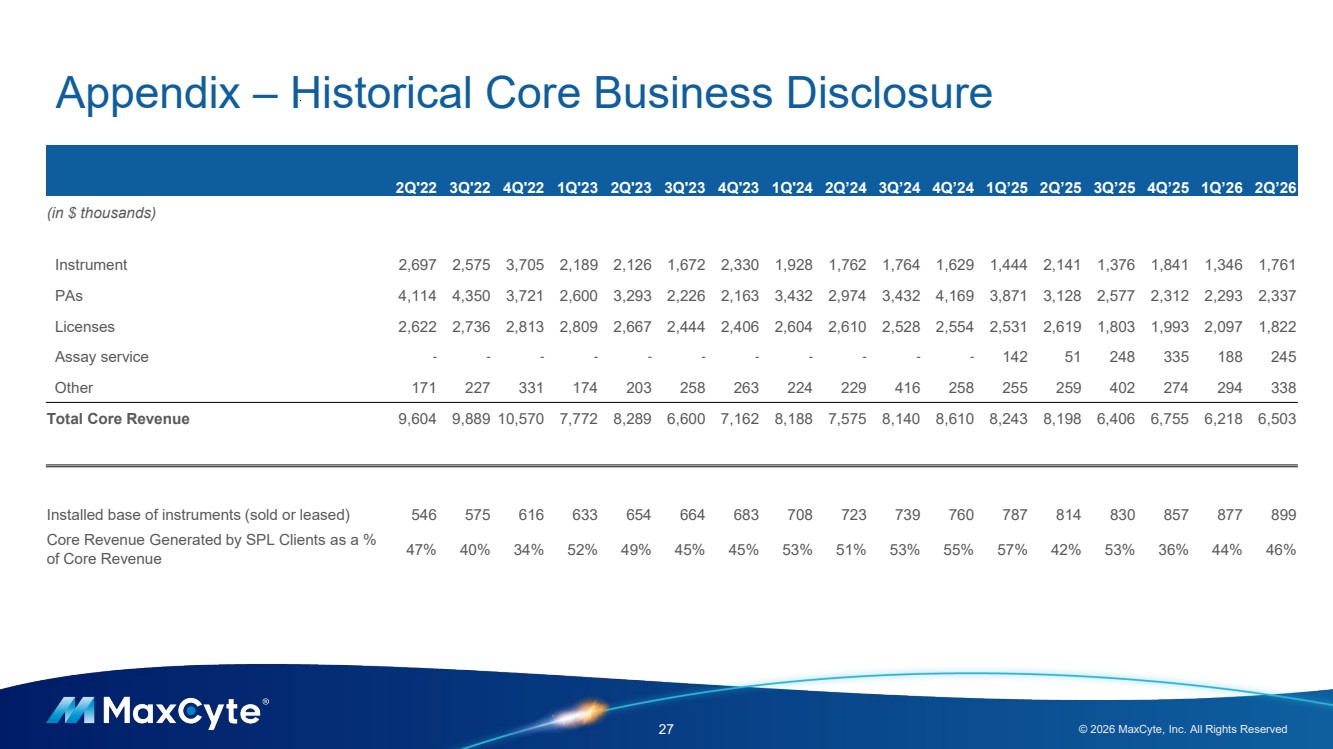
| Appendix – Historical Core Business Disclosure 27 © 2026 MaxCyte, Inc. All Rights Reserved 2Q'22 3Q'22 4Q'22 1Q'23 2Q'23 3Q'23 4Q'23 1Q'24 2Q’24 3Q’24 4Q’24 1Q’25 2Q’25 3Q’25 4Q’25 1Q’26 2Q’26 (in $ thousands) Instrument 2,697 2,575 3,705 2,189 2,126 1,672 2,330 1,928 1,762 1,764 1,629 1,444 2,141 1,376 1,841 1,346 1,761 PAs 4,114 4,350 3,721 2,600 3,293 2,226 2,163 3,432 2,974 3,432 4,169 3,871 3,128 2,577 2,312 2,293 2,337 Licenses 2,622 2,736 2,813 2,809 2,667 2,444 2,406 2,604 2,610 2,528 2,554 2,531 2,619 1,803 1,993 2,097 1,822 Assay service - - - - - - - - - - - 142 51 248 335 188 245 Other 171 227 331 174 203 258 263 224 229 416 258 255 259 402 274 294 338 Total Core Revenue 9,604 9,889 10,570 7,772 8,289 6,600 7,162 8,188 7,575 8,140 8,610 8,243 8,198 6,406 6,755 6,218 6,503 Installed base of instruments (sold or leased) 546 575 616 633 654 664 683 708 723 739 760 787 814 830 857 877 899 Core Revenue Generated by SPL Clients as a % of Core Revenue 47% 40% 34% 52% 49% 45% 45% 53% 51% 53% 55% 57% 42% 53% 36% 44% 46% |
| Appendix – Unaudited Reconciliation of Gross Margin to Non-GAAP Adjusted Gross Margin 28 © 2026 MaxCyte, Inc. All Rights Reserved 1. Adjustments include the exclusion of SPL program related revenue from Revenue, and the exclusion of reserves for excess and obsolete inventory from Cost of Goods Sold. Unaudited Reconciliation of Gross Margin to Non-GAAP Adjusted Gross Margin (in thousands, except for percentages) (Unaudited) Three months ended June 30, 2026 Three months ended June 30, 2025 GAAP Adjustments Non-GAAP GAAP Adjustments Non-GAAP Revenue $ 7,271 $ (768) $ 6,503 $ 8,507 $ (309) $ 8,198 Cost of Goods Sold 1,675 (182) 1,493 1,519 (100) 1,419 Gross Margin 5,596 (586) 5,010 6,988 (209) 6,779 Gross Margin % 77% 77% 82% 83% Six months ended June 30, 2026 Six months ended June 30, 2025 GAAP Adjustments Non-GAAP GAAP Adjustments Non-GAAP Revenue $ 16,922 $ (4,201) $ 12,721 $ 18,897 $ (2,456) $ 16,441 Cost of Goods Sold 3,244 (379) 2,865 3,016 (165) 2,851 Gross Margin 13,678 (3,822) 9,856 15,881 (2,291) 13,590 Gross Margin % 81% 77% 84% 83% |
| Appendix – Unaudited Reconciliation of Net Loss to Adjusted EBITDA 29 © 2026 MaxCyte, Inc. All Rights Reserved Unaudited Reconciliation of Net Loss to Adjusted EBITDA (in thousands) (Unaudited) Three Months Ended June 30, Six Months Ended June 30, 2026 2025 2026 2025 Net loss $ (8,874) $ (12,357) $ (13,624) $ (22,618) Depreciation and amortization expense 978 1,100 2,025 2,196 Interest income (1,358) (1,870) (2,793) (3,904) Income taxes — — — — EBITDA $ (9,254) $ (13,127) $ (14,392) $ (24,326) |