Exhibit 99.1

Myers Industries Reports 2020 Third Quarter Results
Increased demand and focused execution drive sales growth and margin expansion
GAAP EPS of $0.24; Adjusted EPS of $0.30
Company unveils strategic vision aimed at transforming Myers into a high-growth
innovator of engineered plastic solutions
October 29, 2020, Akron, Ohio - Myers Industries, Inc. (NYSE: MYE), a manufacturer of polymer products and distributor for the tire, wheel and under-vehicle service industry, today announced results for the third quarter ended September 30, 2020.
Third Quarter 2020 Financial Highlights
| • | GAAP income per diluted share from continuing operations was $0.24, compared with $0.15 for the third quarter of 2019 |
| • | Adjusted income per diluted share from continuing operations was $0.30, compared with $0.15 for the third quarter of 2019 |
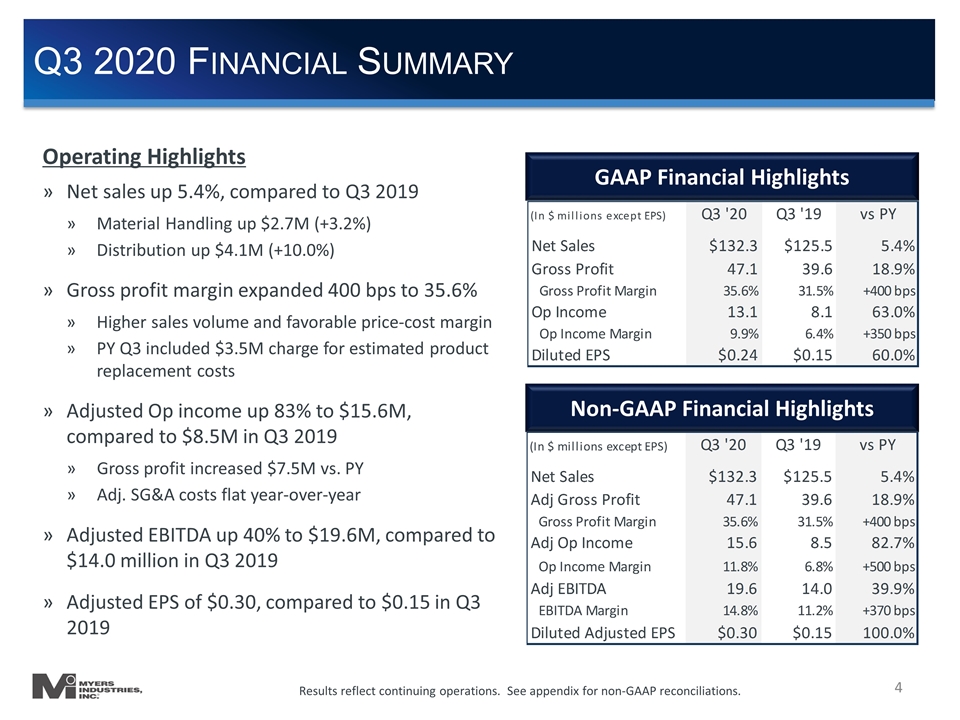
| • | Net sales were $132.3 million, up 5.4% compared with $125.5 million for the third quarter of 2019 |
| • | Gross margin increased to 35.6%, compared with 31.5% for the third quarter of 2019 |
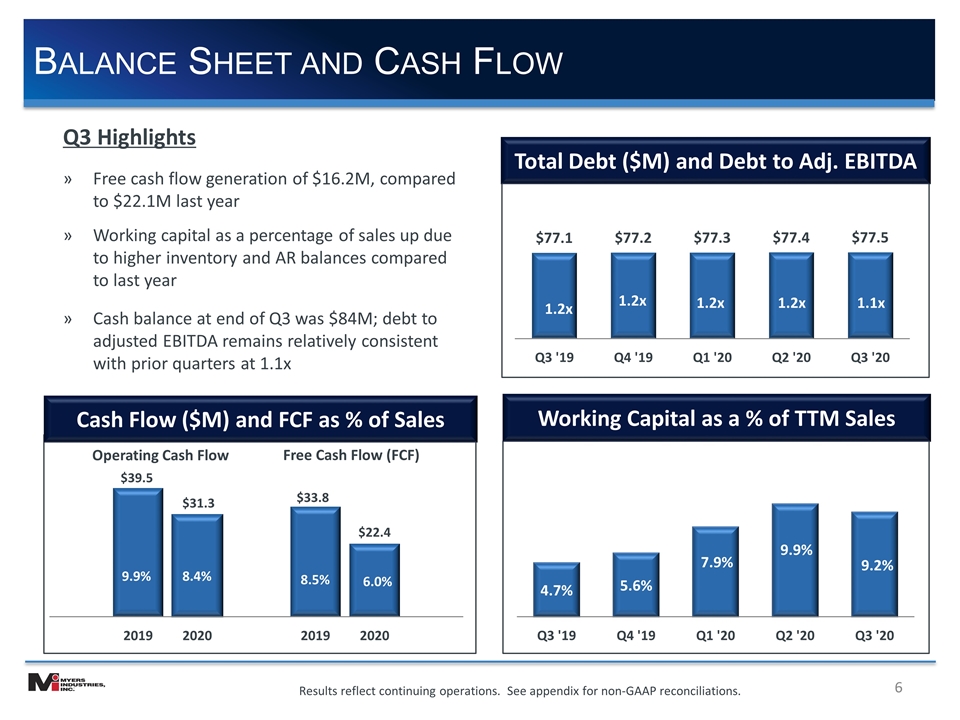
| • | Cash flow from continuing operations was $19.5 million and free cash flow was $16.2 million, compared with $23.3 million and $22.1 million, respectively, for the third quarter of 2019 |
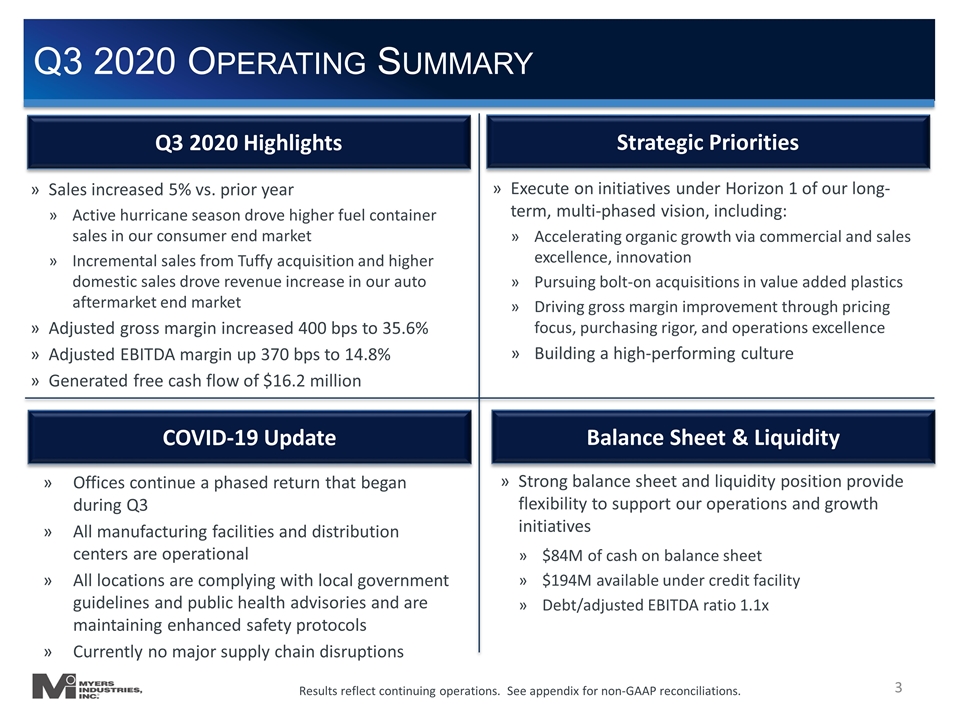
“We are very pleased with our performance for the third quarter, which exceeded our expectations and was an improvement over last year. We successfully capitalized on the strong demand in our consumer end market, which was driven in part by an active hurricane season,” said Mike McGaugh, President and Chief Executive Officer of Myers Industries. “Additionally, as a result of continued momentum in our auto aftermarket end market, our Distribution Segment increased sales by 10%, increased adjusted operating income by 41%, and delivered an adjusted EBITDA margin of 12.4%.”
Strategic Vision Unveiled
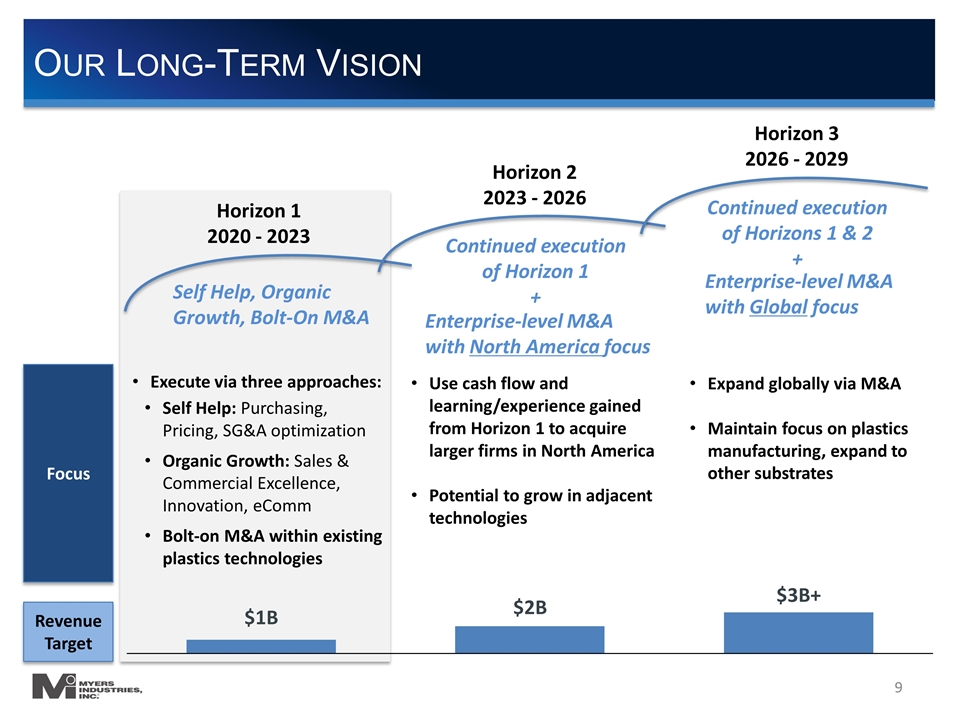
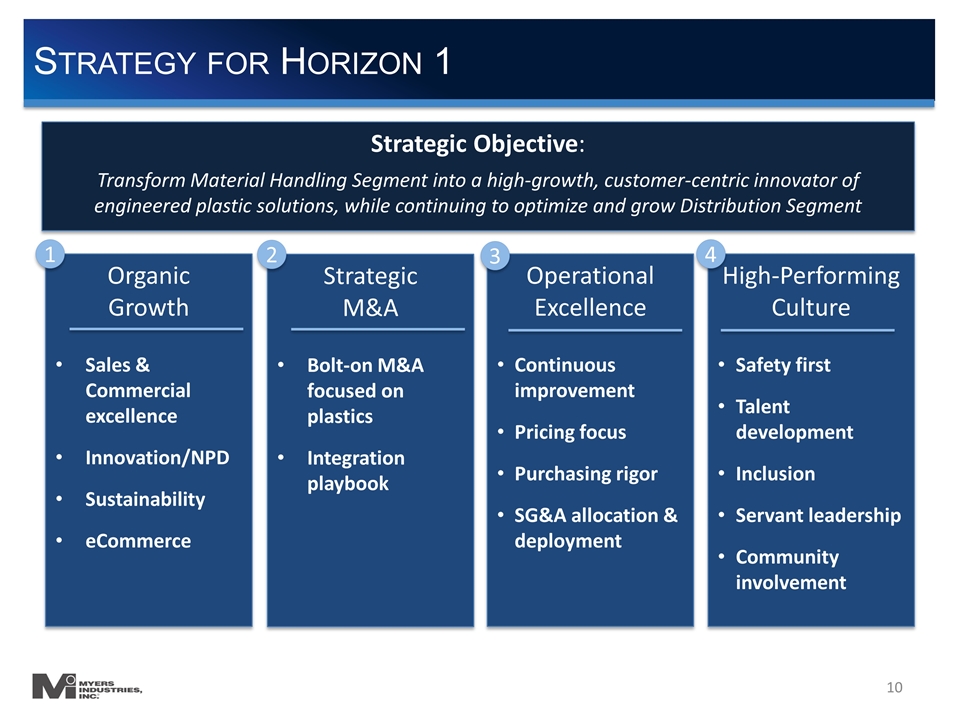
Myers also announced today the unveiling of a new, multi-phased strategic vision. The current phase, “Horizon 1,” runs through 2023 and is focused on strengthening the Company through organic growth initiatives, commercial and operational excellence, pursuing bolt-on acquisitions in value added plastics molding, and driving a high-performance culture. Executing on this new strategy will transform the Company’s Material Handling Segment into a high-growth, customer centric innovator of engineered plastic solutions, while continuing to optimize and grow its Distribution Segment.
McGaugh continued, “I joined Myers just over six months ago at a critical time when our markets were under pressure and the world was in the early stages of the pandemic. I’m pleased to report that we were able to develop and align on a path forward for the company. I am confident that this plan will advance our ability to accelerate growth, further improve our operations, and deliver continued financial strength and flexibility. Our vision is to transform Myers into a high-growth, customer-centric innovator of engineered plastic solutions. In addition, we are building a ”One Myers” culture and mindset that drive alignment, centralize key functions, and enable the successful execution of our long-term vision.”
Third Quarter 2020 Financial Summary
Net sales for the third quarter of 2020 were $132.3 million, an increase of $6.8 million, or 5.4%, compared with $125.5 million for the third quarter of 2019. The increase was the result of higher sales in both the Material Handling and Distribution Segments. Gross profit increased $7.5 million to $47.1 million, compared with $39.6 million for the third quarter of 2019. Gross profit margin increased to 35.6% compared with 31.5% last year. The increase was due primarily to higher sales volume and favorable price-cost margin. Additionally, third quarter 2019 gross profit included a $3.5 million charge for estimated product replacement costs. Selling, general
and administrative (SG&A) expenses increased to $33.9 million, compared with $31.5 million for the third quarter of 2019, due primarily to executive severance costs and higher incentive compensation costs, partially offset by lower depreciation and amortization expense. GAAP income per diluted share from continuing operations was $0.24, compared with $0.15 for the third quarter of 2019. Adjusted income per diluted share from continuing operations was $0.30, compared with $0.15 for the third quarter of 2019.
Segment Results
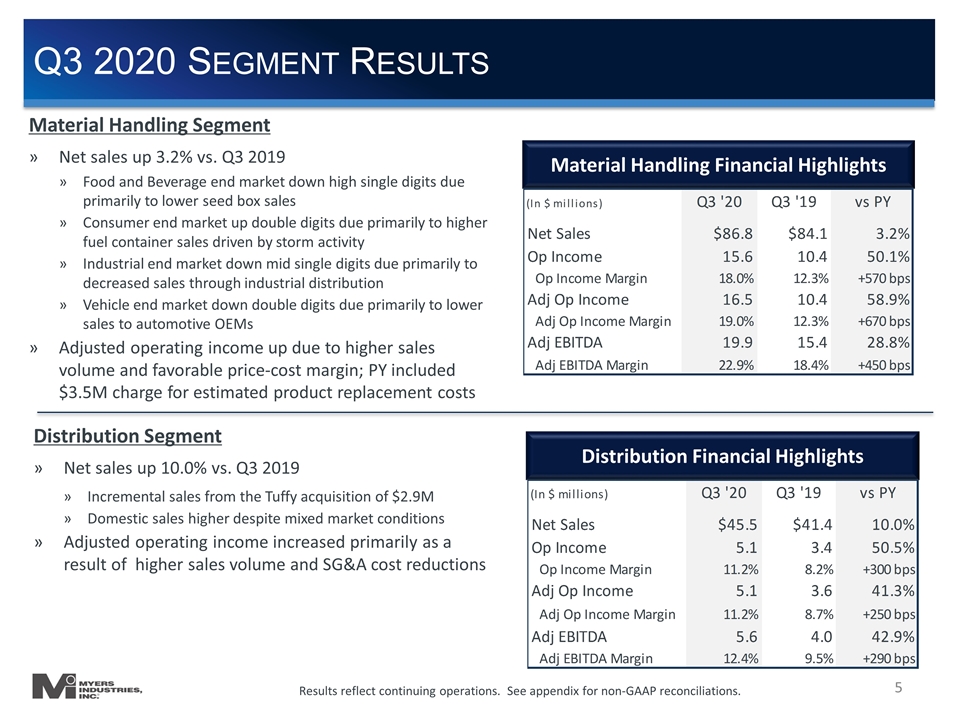
Net sales in the Material Handling Segment (consumer, food and beverage, industrial and vehicle end markets) for the third quarter of 2020 were $86.8 million, an increase of $2.7 million or 3.2%, compared with $84.1 million for the third quarter of 2019. The sales increase was due primarily to higher sales volumes in the Company’s consumer end market as a result of heightened storm activity. For the third quarter of 2020, operating income for this segment increased 50.1% to $15.6 million, compared with $10.4 million in 2019. Adjusted operating income increased 58.9% to $16.5 million, compared with $10.4 million in 2019. The increase was due primarily to higher sales volume and favorable price-cost margin. Additionally, third quarter 2019 operating income included a $3.5M charge for estimated product replacement costs. As a result, the Material Handling Segment’s adjusted operating income margin increased to 19.0%, compared with 12.3% for the third quarter of 2019.
Net sales in the Distribution Segment (auto aftermarket end market) for the third quarter of 2020 were $45.5 million, an increase of $4.1 million, or 10.0%, compared with $41.4 million for the third quarter of 2019. Incremental sales from the Tuffy acquisition completed in August 2019 contributed $2.9 million to the increase. Third quarter operating income for this segment increased 50.5% to $5.1 million, compared with $3.4 million in 2019. Adjusted operating income increased 41.3% to $5.1 million, compared with $3.6 million in 2019, primarily due to higher sales volume and cost reductions. The Distribution Segment’s adjusted operating income margin was 11.2%, compared with 8.7% for the third quarter of 2019.
2020 Outlook
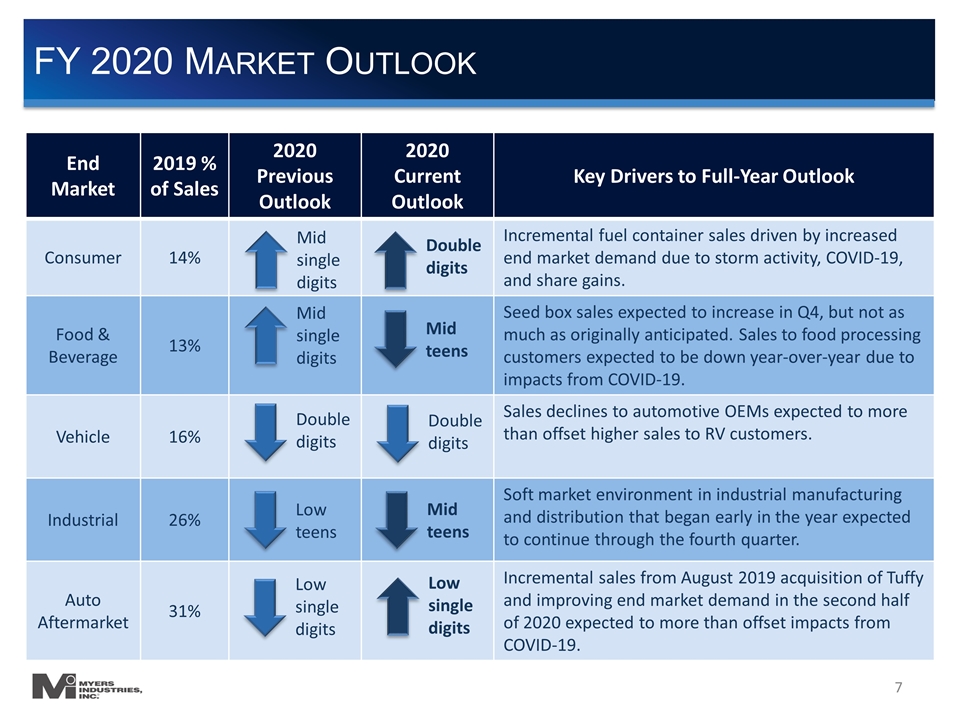
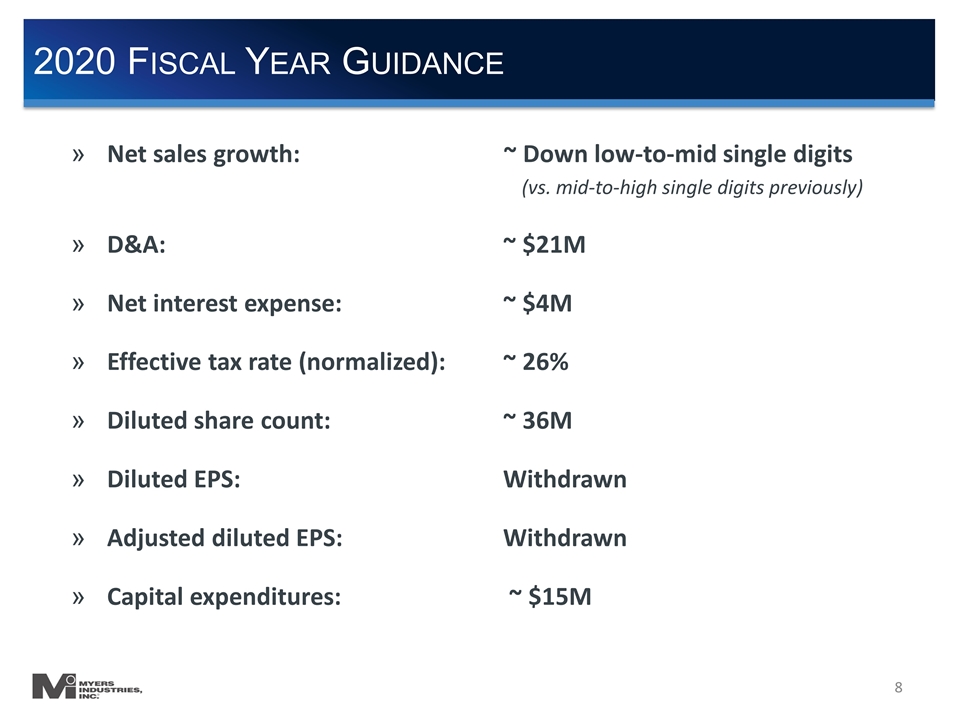
The Company has revised its outlook for 2020 revenue. The Company now expects full-year revenue to decline in the low-to-mid single digits, which is a slight improvement from its previous guidance of a decline in the mid-to-high single digit range. The Company does not expect the events that drove sales in the consumer end market to recur in the fourth quarter. The Company is maintaining its previous guidance that depreciation and amortization will be approximately $21 million, net interest expense will be approximately $4 million and capital expenditures will be approximately $15 million. The Company continues to estimate that the effective tax rate will be approximately 26%.
“As we look to the future, we remain committed to successfully managing through these challenging times, while building a company and “One Myers” team that will become stronger and more aligned than ever before,” added McGaugh.
Conference Call Details
The Company will host an earnings conference call and webcast for investors and analysts on Thursday, October 29, 2020, at 8:30 a.m. EDT. The call is anticipated to last less than one hour and may be accessed using the following online participation registration link: http://www.directeventreg.com/registration/event/3792583. Upon registering, each participant will be provided with call details and a registrant ID that will be used to track call attendance. Reminders will also be sent to registered participants via email. The live webcast of the conference call can be accessed from the Investor Relations section of the Company’s website at www.myersindustries.com. Click on the Investor Relations tab to access the webcast. Webcast attendees will be in a listen-only mode. An archived replay of the call will also be available on the site shortly after the event. To listen to the telephone replay, callers should dial: (US) 800-585-8367 or (Int’l) 416-621-4642. The Conference ID # is 3792583.
Use of Non-GAAP Financial Measures
The Company uses certain non-GAAP measures in this release. Operating income (loss) as adjusted, operating income margin as adjusted, earnings before interest, taxes, depreciation and amortization (EBITDA) as adjusted, EBITDA margin as adjusted, income before taxes as adjusted, income from continuing operations as adjusted, adjusted earnings per diluted share from continuing operations, and free cash flow are non-GAAP financial measures and are intended to serve as a supplement to results provided in accordance with accounting principles generally accepted in the United States. Myers Industries believes that such information provides an additional measurement and consistent historical comparison of the Company’s performance. A reconciliation of the non-GAAP financial measures to the most directly comparable GAAP measures is available in this news release.
About Myers Industries
Myers Industries, Inc. is a manufacturer of polymer products for industrial, agricultural, automotive, commercial, and consumer markets. The Company is also the largest distributor of tools, equipment and supplies for the tire, wheel and under-vehicle service industry in the United States. Visit www.myersindustries.com to learn more.
Caution on Forward-Looking Statements
Statements in this release include “forward-looking” statements within the meaning of the Private Securities Litigation Reform Act of 1995. Any statement that is not of historical fact may be deemed “forward-looking”. Words such as “will”, “expect”, “believe”, “project”, “plan”, “anticipate”, “intend”, “objective”, “outlook”, “target”, “goal”, “view” and similar expressions identify forward-looking statements. These statements are based on management’s current views and assumptions of future events and financial performance and involve a number of risks and uncertainties, many outside of the Company’s control that could cause actual results to materially differ from those expressed or implied. Risks and uncertainties include: impacts from the COVID-19 pandemic on our business, conditions, customers and capital position; the impact of COVID-19 on local, national and global economic conditions; the effects of various governmental responses to the COVID-19 pandemic, raw material availability, increases in raw material costs, or other production costs; risks associated with our strategic growth initiatives or the failure to achieve the anticipated benefits of such initiatives; unanticipated downturn in business relationships with customers or their purchases; competitive pressures on sales and pricing; changes in the markets for the Company’s business segments; changes in trends and demands in the markets in which the Company competes; operational problems at our manufacturing facilities, or unexpected failures at those facilities; future economic and financial conditions in the United States and around the world; inability of the Company to meet future capital requirements; claims, litigation and regulatory actions against the Company; changes in laws and regulations affecting the Company; impact of the upcoming U.S. elections impacts on the regulatory landscape, capital markets, and responses to and management of the COVID-19 pandemic including further economic stimulus from the federal government; and other important factors detailed previously and from time to time in the Company’s filings with the Securities and Exchange Commission, including the Company’s Annual Report on Form 10-K for the year ended December 31, 2019 and subsequent Quarterly Reports on Form 10-Q. Such reports are available on the Securities and Exchange Commission’s public reference facilities and its website at www.sec.gov and on the Company’s Investor Relations section of its website at www.myersindustries.com. Myers Industries undertakes no obligation to publicly update or revise any forward-looking statements contained herein. These statements speak only as of the date made.
Contact: Monica Vinay, Vice President, Investor Relations & Treasurer, (330) 761-6212
MYERS INDUSTRIES, INC.
CONDENSED CONSOLIDATED STATEMENTS OF OPERATIONS (UNAUDITED)
(Dollars in thousands, except share and per share data)
| Quarter Ended | Nine Months Ended | |||||||||||||||
| September 30, 2020 |
September 30, 2019 |
September 30, 2020 |
September 30, 2019 |
|||||||||||||
| Net sales |
$ | 132,258 | $ | 125,480 | $ | 372,902 | $ | 398,880 | ||||||||
| Cost of sales |
85,191 | 85,894 | 240,779 | 266,799 | ||||||||||||
|
|
|
|
|
|
|
|
|
|||||||||
| Gross profit |
47,067 | 39,586 | 132,123 | 132,081 | ||||||||||||
| Selling, general and administrative expenses |
33,927 | 31,515 | 95,360 | 102,792 | ||||||||||||
| (Gain) Loss on disposal of fixed assets |
— | 11 | (7 | ) | (87 | ) | ||||||||||
| Impairment charges |
— | — | — | 916 | ||||||||||||
| Gain on sale of notes receivable |
— | — | (11,924 | ) | — | |||||||||||
|
|
|
|
|
|
|
|
|
|||||||||
| Operating income (loss) |
13,140 | 8,060 | 48,694 | 28,460 | ||||||||||||
| Interest expense, net |
1,204 | 993 | 3,467 | 3,059 | ||||||||||||
|
|
|
|
|
|
|
|
|
|||||||||
| Income (loss) from continuing operations before income taxes |
11,936 | 7,067 | 45,227 | 25,401 | ||||||||||||
| Income tax expense (benefit) |
3,251 | 1,848 | 11,448 | 6,933 | ||||||||||||
|
|
|
|
|
|
|
|
|
|||||||||
| Income (loss) from continuing operations |
8,685 | 5,219 | 33,779 | 18,468 | ||||||||||||
| Income (loss) from discontinued operations, net of income tax |
— | — | — | 127 | ||||||||||||
|
|
|
|
|
|
|
|
|
|||||||||
| Net income (loss) |
$ | 8,685 | $ | 5,219 | $ | 33,779 | $ | 18,595 | ||||||||
|
|
|
|
|
|
|
|
|
|||||||||
| Income (loss) per common share from continuing operations: |
||||||||||||||||
| Basic |
$ | 0.24 | $ | 0.15 | $ | 0.94 | $ | 0.52 | ||||||||
| Diluted |
$ | 0.24 | $ | 0.15 | $ | 0.94 | $ | 0.52 | ||||||||
| Income (loss) per common share from discontinued operations: |
||||||||||||||||
| Basic |
$ | — | $ | — | $ | — | $ | — | ||||||||
| Diluted |
$ | — | $ | — | $ | — | $ | — | ||||||||
| Net income (loss) per common share: |
||||||||||||||||
| Basic |
$ | 0.24 | $ | 0.15 | $ | 0.94 | $ | 0.52 | ||||||||
| Diluted |
$ | 0.24 | $ | 0.15 | $ | 0.94 | $ | 0.52 | ||||||||
| Weighted average common shares outstanding: |
||||||||||||||||
| Basic |
35,796,247 | 35,495,157 | 35,764,822 | 35,451,980 | ||||||||||||
| Diluted |
35,943,129 | 35,759,032 | 35,938,186 | 35,823,231 | ||||||||||||
MYERS INDUSTRIES, INC.
SALES AND EARNINGS BY SEGMENT (UNAUDITED)
(Dollars in thousands)
| Quarter Ended September 30, | Nine Months Ended September 30, | |||||||||||||||||||||||
| 2020 | 2019 | % Change | 2020 | 2019 | % Change | |||||||||||||||||||
| Net sales |
||||||||||||||||||||||||
| Material Handling |
$ | 86,769 | $ | 84,110 | 3.2 | % | $ | 251,700 | $ | 282,963 | (11.0 | )% | ||||||||||||
| Distribution |
45,517 | 41,388 | 10.0 | % | 121,253 | 115,957 | 4.6 | % | ||||||||||||||||
| Inter-company Sales |
(28 | ) | (18 | ) | — | (51 | ) | (40 | ) | — | ||||||||||||||
|
|
|
|
|
|
|
|
|
|
|
|
|
|||||||||||||
| Total |
$ | 132,258 | $ | 125,480 | 5.4 | % | $ | 372,902 | $ | 398,880 | (6.5 | )% | ||||||||||||
|
|
|
|
|
|
|
|
|
|
|
|
|
|||||||||||||
| Operating income (loss) |
||||||||||||||||||||||||
| Material Handling |
$ | 15,593 | $ | 10,385 | 50.1 | % | $ | 46,556 | $ | 44,181 | 5.4 | % | ||||||||||||
| Distribution |
5,091 | 3,382 | 50.5 | % | 8,577 | 6,923 | 23.9 | % | ||||||||||||||||
| Corporate |
(7,544 | ) | (5,707 | ) | — | (6,439 | ) | (22,644 | ) | — | ||||||||||||||
|
|
|
|
|
|
|
|
|
|
|
|
|
|||||||||||||
| Total |
$ | 13,140 | $ | 8,060 | 63.0 | % | $ | 48,694 | $ | 28,460 | 71.1 | % | ||||||||||||
|
|
|
|
|
|
|
|
|
|
|
|
|
|||||||||||||
| Operating income (loss) as adjusted |
||||||||||||||||||||||||
| Material Handling |
$ | 16,498 | $ | 10,385 | 58.9 | % | $ | 47,461 | $ | 45,269 | 4.8 | % | ||||||||||||
| Distribution |
5,091 | 3,603 | 41.3 | % | 8,594 | 8,045 | 6.8 | % | ||||||||||||||||
| Corporate |
(6,032 | ) | (5,472 | ) | — | (16,567 | ) | (18,409 | ) | — | ||||||||||||||
|
|
|
|
|
|
|
|
|
|
|
|
|
|||||||||||||
| Total |
$ | 15,557 | $ | 8,516 | 82.7 | % | $ | 39,488 | $ | 34,905 | 13.1 | % | ||||||||||||
|
|
|
|
|
|
|
|
|
|
|
|
|
|||||||||||||
| Operating income margin as adjusted |
||||||||||||||||||||||||
| Material Handling |
19.0 | % | 12.3 | % | 18.9 | % | 16.0 | % | ||||||||||||||||
| Distribution |
11.2 | % | 8.7 | % | 7.1 | % | 6.9 | % | ||||||||||||||||
| Corporate |
n/a | n/a | n/a | n/a | ||||||||||||||||||||
|
|
|
|
|
|
|
|
|
|||||||||||||||||
| Total |
11.8 | % | 6.8 | % | 10.6 | % | 8.8 | % | ||||||||||||||||
|
|
|
|
|
|
|
|
|
|||||||||||||||||
| EBITDA as adjusted |
||||||||||||||||||||||||
| Material Handling |
$ | 19,888 | $ | 15,444 | 28.8 | % | $ | 61,011 | $ | 61,441 | (0.7 | )% | ||||||||||||
| Distribution |
5,647 | 3,952 | 42.9 | % | 10,354 | 8,919 | 16.1 | % | ||||||||||||||||
| Corporate |
(5,933 | ) | (5,385 | ) | — | (16,270 | ) | (18,100 | ) | — | ||||||||||||||
|
|
|
|
|
|
|
|
|
|
|
|
|
|||||||||||||
| Total |
$ | 19,602 | $ | 14,011 | 39.9 | % | $ | 55,095 | $ | 52,260 | 5.4 | % | ||||||||||||
|
|
|
|
|
|
|
|
|
|
|
|
|
|||||||||||||
| EBITDA margin as adjusted |
||||||||||||||||||||||||
| Material Handling |
22.9 | % | 18.4 | % | 24.2 | % | 21.7 | % | ||||||||||||||||
| Distribution |
12.4 | % | 9.5 | % | 8.5 | % | 7.7 | % | ||||||||||||||||
| Corporate |
n/a | n/a | n/a | n/a | ||||||||||||||||||||
|
|
|
|
|
|
|
|
|
|||||||||||||||||
| Total |
14.8 | % | 11.2 | % | 14.8 | % | 13.1 | % | ||||||||||||||||
|
|
|
|
|
|
|
|
|
|||||||||||||||||
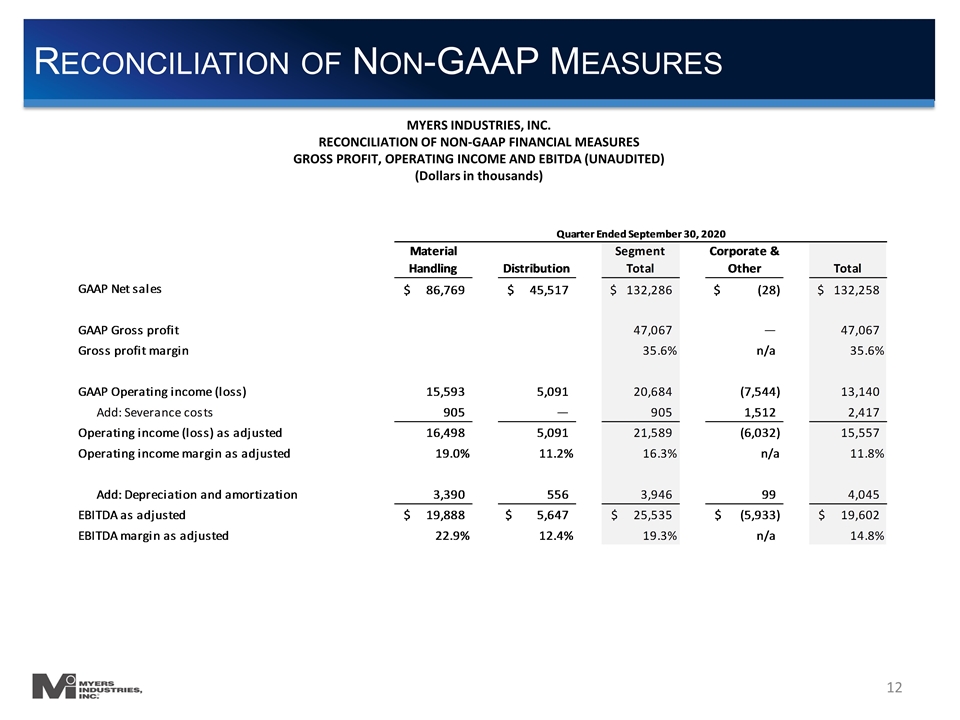
MYERS INDUSTRIES, INC.
RECONCILIATION OF NON-GAAP FINANCIAL MEASURES
GROSS PROFIT, OPERATING INCOME AND EBITDA (UNAUDITED)
(Dollars in thousands)
| Quarter Ended September 30, 2020 | ||||||||||||||||||||
| Material Handling |
Distribution | Segment Total |
Corporate & Other |
Total | ||||||||||||||||
| GAAP Net sales |
$ | 86,769 | $ | 45,517 | $ | 132,286 | $ | (28 | ) | $ | 132,258 | |||||||||
| GAAP Gross profit |
47,067 | — | 47,067 | |||||||||||||||||
| Gross profit margin |
35.6 | % | n/a | 35.6 | % | |||||||||||||||
| GAAP Operating income (loss) |
15,593 | 5,091 | 20,684 | (7,544 | ) | 13,140 | ||||||||||||||
| Add: Severance costs |
905 | — | 905 | 1,512 | 2,417 | |||||||||||||||
|
|
|
|
|
|
|
|
|
|
|
|||||||||||
| Operating income (loss) as adjusted |
16,498 | 5,091 | 21,589 | (6,032 | ) | 15,557 | ||||||||||||||
| Operating income margin as adjusted |
19.0 | % | 11.2 | % | 16.3 | % | n/a | 11.8 | % | |||||||||||
| Add: Depreciation and amortization |
3,390 | 556 | 3,946 | 99 | 4,045 | |||||||||||||||
|
|
|
|
|
|
|
|
|
|
|
|||||||||||
| EBITDA as adjusted |
$ | 19,888 | $ | 5,647 | $ | 25,535 | $ | (5,933 | ) | $ | 19,602 | |||||||||
| EBITDA margin as adjusted |
22.9 | % | 12.4 | % | 19.3 | % | n/a | 14.8 | % | |||||||||||
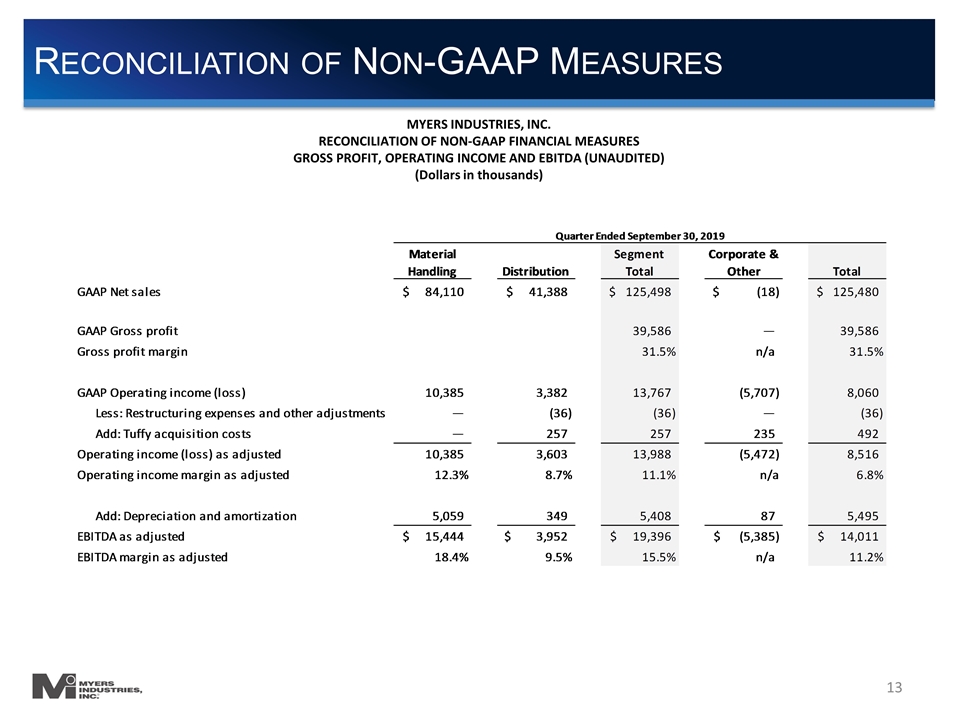
| Quarter Ended September 30, 2019 | ||||||||||||||||||||
| Material Handling |
Distribution | Segment Total |
Corporate & Other |
Total | ||||||||||||||||
| GAAP Net sales |
$ | 84,110 | $ | 41,388 | $ | 125,498 | $ | (18 | ) | $ | 125,480 | |||||||||
| GAAP Gross profit |
39,586 | — | 39,586 | |||||||||||||||||
| Gross profit margin |
31.5 | % | n/a | 31.5 | % | |||||||||||||||
| GAAP Operating income (loss) |
10,385 | 3,382 | 13,767 | (5,707 | ) | 8,060 | ||||||||||||||
| Less: Restructuring expenses and other adjustments |
— | (36 | ) | (36 | ) | — | (36 | ) | ||||||||||||
| Add: Tuffy acquisition costs |
— | 257 | 257 | 235 | 492 | |||||||||||||||
|
|
|
|
|
|
|
|
|
|
|
|||||||||||
| Operating income (loss) as adjusted |
10,385 | 3,603 | 13,988 | (5,472 | ) | 8,516 | ||||||||||||||
| Operating income margin as adjusted |
12.3 | % | 8.7 | % | 11.1 | % | n/a | 6.8 | % | |||||||||||
| Add: Depreciation and amortization |
5,059 | 349 | 5,408 | 87 | 5,495 | |||||||||||||||
|
|
|
|
|
|
|
|
|
|
|
|||||||||||
| EBITDA as adjusted |
$ | 15,444 | $ | 3,952 | $ | 19,396 | $ | (5,385 | ) | $ | 14,011 | |||||||||
| EBITDA margin as adjusted |
18.4 | % | 9.5 | % | 15.5 | % | n/a | 11.2 | % | |||||||||||
MYERS INDUSTRIES, INC.
RECONCILIATION OF NON-GAAP FINANCIAL MEASURES
GROSS PROFIT, OPERATING INCOME AND EBITDA (UNAUDITED)
(Dollars in thousands)
| Nine Months Ended September 30, 2020 | ||||||||||||||||||||
| Material Handling |
Distribution | Segment Total |
Corporate & Other |
Total | ||||||||||||||||
| GAAP Net sales |
$ | 251,700 | $ | 121,253 | $ | 372,953 | $ | (51 | ) | $ | 372,902 | |||||||||
| GAAP Gross profit |
132,123 | — | 132,123 | |||||||||||||||||
| Gross profit margin |
35.4 | % | n/a | 35.4 | % | |||||||||||||||
| GAAP Operating income (loss) |
46,556 | 8,577 | 55,133 | (6,439 | ) | 48,694 | ||||||||||||||
| Add: Severance costs |
905 | — | 905 | 1,512 | 2,417 | |||||||||||||||
| Add: Restructuring expenses and other adjustments |
— | — | — | 249 | 249 | |||||||||||||||
| Add: Tuffy acquisition costs |
— | 17 | 17 | 35 | 52 | |||||||||||||||
| Less: Lawn and Garden sale of note/release of lease guarantee liability |
— | — | — | (11,924 | ) | (11,924 | ) | |||||||||||||
|
|
|
|
|
|
|
|
|
|||||||||||||
| Operating income (loss) as adjusted |
47,461 | 8,594 | 56,055 | (16,567 | ) | 39,488 | ||||||||||||||
| Operating income margin as adjusted |
18.9 | % | 7.1 | % | 15.0 | % | n/a | 10.6 | % | |||||||||||
| Add: Depreciation and amortization |
13,550 | 1,760 | 15,310 | 297 | 15,607 | |||||||||||||||
|
|
|
|
|
|
|
|
|
|||||||||||||
| EBITDA as adjusted |
$ | 61,011 | $ | 10,354 | $ | 71,365 | $ | (16,270 | ) | $ | 55,095 | |||||||||
| EBITDA margin as adjusted |
24.2 | % | 8.5 | % | 19.1 | % | n/a | 14.8 | % | |||||||||||
| Nine Months Ended September 30, 2019 | ||||||||||||||||||||
| Material Handling |
Distribution | Segment Total |
Corporate & Other |
Total | ||||||||||||||||
| GAAP Net sales |
$ | 282,963 | $ | 115,957 | $ | 398,920 | $ | (40 | ) | $ | 398,880 | |||||||||
| GAAP Gross profit |
132,081 | — | 132,081 | |||||||||||||||||
| Add: Restructuring expenses and other adjustments |
172 | — | 172 | |||||||||||||||||
|
|
|
|
|
|||||||||||||||||
| Gross profit as adjusted |
132,253 | — | 132,253 | |||||||||||||||||
| Gross profit margin as adjusted |
33.2 | % | n/a | 33.2 | % | |||||||||||||||
| GAAP Operating income (loss) |
44,181 | 6,923 | 51,104 | (22,644 | ) | 28,460 | ||||||||||||||
| Add: Restructuring expenses and other adjustments(1) |
172 | 865 | 1,037 | — | 1,037 | |||||||||||||||
| Add: Tuffy acquisition costs |
— | 257 | 257 | 235 | 492 | |||||||||||||||
| Add: Asset impairment |
916 | — | 916 | — | 916 | |||||||||||||||
| Add: Environmental charges |
— | — | — | 4,000 | 4,000 | |||||||||||||||
|
|
|
|
|
|
|
|
|
|||||||||||||
| Operating income (loss) as adjusted |
45,269 | 8,045 | 53,314 | (18,409 | ) | 34,905 | ||||||||||||||
| Operating income margin as adjusted |
16.0 | % | 6.9 | % | 13.4 | % | n/a | 8.8 | % | |||||||||||
| Add: Depreciation and amortization |
16,216 | 874 | 17,090 | 309 | 17,399 | |||||||||||||||
| Less: Depreciation adjustments |
(44 | ) | — | (44 | ) | — | (44 | ) | ||||||||||||
|
|
|
|
|
|
|
|
|
|||||||||||||
| EBITDA as adjusted |
$ | 61,441 | $ | 8,919 | $ | 70,360 | $ | (18,100 | ) | $ | 52,260 | |||||||||
| EBITDA margin as adjusted |
21.7 | % | 7.7 | % | 17.6 | % | n/a | 13.1 | % | |||||||||||
| (1) | Includes gross profit adjustments of $172 and SG&A adjustments of $865 |
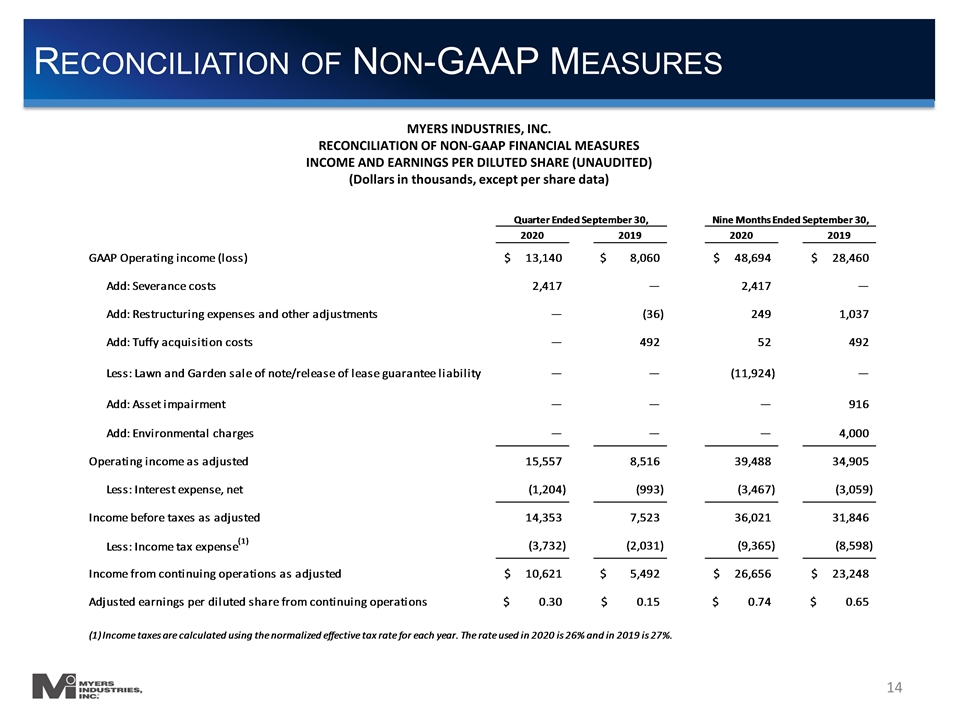
MYERS INDUSTRIES, INC.
RECONCILIATION OF NON-GAAP FINANCIAL MEASURES
INCOME AND EARNINGS PER DILUTED SHARE (UNAUDITED)
(Dollars in thousands, except per share data)
| Quarter Ended September 30, |
Nine Months Ended September 30, |
|||||||||||||||
| 2020 | 2019 | 2020 | 2019 | |||||||||||||
| GAAP Operating income (loss) |
$ | 13,140 | $ | 8,060 | $ | 48,694 | $ | 28,460 | ||||||||
| Add: Severance costs |
2,417 | — | 2,417 | — | ||||||||||||
| Add: Restructuring expenses and other adjustments |
— | (36 | ) | 249 | 1,037 | |||||||||||
| Add: Tuffy acquisition costs |
— | 492 | 52 | 492 | ||||||||||||
| Less: Lawn and Garden sale of note/release of lease guarantee liability |
— | — | (11,924 | ) | — | |||||||||||
| Add: Asset impairment |
— | — | — | 916 | ||||||||||||
| Add: Environmental charges |
— | — | — | 4,000 | ||||||||||||
|
|
|
|
|
|
|
|
|
|||||||||
| Operating income as adjusted |
15,557 | 8,516 | 39,488 | 34,905 | ||||||||||||
| Less: Interest expense, net |
(1,204 | ) | (993 | ) | (3,467 | ) | (3,059 | ) | ||||||||
|
|
|
|
|
|
|
|
|
|||||||||
| Income before taxes as adjusted |
14,353 | 7,523 | 36,021 | 31,846 | ||||||||||||
| Less: Income tax expense(1) |
(3,732 | ) | (2,031 | ) | (9,365 | ) | (8,598 | ) | ||||||||
|
|
|
|
|
|
|
|
|
|||||||||
| Income from continuing operations as adjusted |
$ | 10,621 | $ | 5,492 | $ | 26,656 | $ | 23,248 | ||||||||
| Adjusted earnings per diluted share from continuing operations |
$ | 0.30 | $ | 0.15 | $ | 0.74 | $ | 0.65 | ||||||||
| (1) | Income taxes are calculated using the normalized effective tax rate for each year. The rate used in 2020 is 26% and in 2019 is 27%. |
MYERS INDUSTRIES, INC.
CONDENSED CONSOLIDATED STATEMENTS OF FINANCIAL POSITION (UNAUDITED)
(Dollars in thousands)
| September 30, 2020 | December 31, 2019 | |||||||
| Assets |
||||||||
| Current Assets |
||||||||
| Cash |
$ | 83,746 | $ | 75,527 | ||||
| Accounts receivable, net |
75,539 | 62,279 | ||||||
| Income tax receivable |
— | 142 | ||||||
| Inventories, net |
48,137 | 44,260 | ||||||
| Prepaid expenses and other current assets |
4,553 | 2,834 | ||||||
|
|
|
|
|
|||||
| Total Current Assets |
211,975 | 185,042 | ||||||
| Property, plant, & equipment, net |
53,945 | 54,964 | ||||||
| Right of use asset - operating leases |
4,935 | 5,901 | ||||||
| Deferred income taxes |
178 | 5,807 | ||||||
| Other assets |
95,350 | 101,425 | ||||||
|
|
|
|
|
|||||
| Total Assets |
$ | 366,383 | $ | 353,139 | ||||
|
|
|
|
|
|||||
| Liabilities & Shareholders’ Equity |
||||||||
| Current Liabilities |
||||||||
| Accounts payable |
$ | 47,562 | $ | 46,867 | ||||
| Accrued expenses |
35,663 | 33,701 | ||||||
| Operating lease liability - short-term |
1,786 | 2,057 | ||||||
| Long-term debt - current portion |
39,975 | — | ||||||
|
|
|
|
|
|||||
| Total Current Liabilities |
124,986 | 82,625 | ||||||
| Long-term debt |
37,501 | 77,176 | ||||||
| Operating lease liability - long-term |
3,365 | 4,074 | ||||||
| Other liabilities |
12,933 | 22,582 | ||||||
| Total Shareholders’ Equity |
187,598 | 166,682 | ||||||
|
|
|
|
|
|||||
| Total Liabilities & Shareholders’ Equity |
$ | 366,383 | $ | 353,139 | ||||
|
|
|
|
|
|||||
MYERS INDUSTRIES, INC.
CONDENSED CONSOLIDATED STATEMENTS OF CASH FLOWS (UNAUDITED)
(Dollars in thousands)
| Nine Months Ended September 30, |
||||||||
| 2020 | 2019 | |||||||
| Cash Flows From Operating Activities |
||||||||
| Net income (loss) |
$ | 33,779 | $ | 18,595 | ||||
| Income (loss) from discontinued operations, net of income taxes |
— | 127 | ||||||
|
|
|
|
|
|||||
| Income (loss) from continuing operations |
33,779 | 18,468 | ||||||
| Adjustments to reconcile income (loss) from continuing operations to net cash provided by (used for) operating activities |
||||||||
| Depreciation |
10,400 | 11,505 | ||||||
| Amortization |
5,507 | 6,183 | ||||||
| Non-cash stock-based compensation expense |
2,763 | 3,348 | ||||||
| Gain on disposal of fixed assets |
(7 | ) | (87 | ) | ||||
| Gain on sale of notes receivable |
(11,924 | ) | — | |||||
| Impairment charges |
— | 916 | ||||||
| Other |
844 | 441 | ||||||
| Payments on long-term performance based compensation |
— | (413 | ) | |||||
| Other long-term liabilities |
1,538 | 3,388 | ||||||
| Cash flows provided by (used for) working capital |
||||||||
| Accounts receivable |
(14,266 | ) | 9,775 | |||||
| Inventories |
(3,939 | ) | 2,386 | |||||
| Prepaid expenses and other current assets |
(1,728 | ) | (877 | ) | ||||
| Accounts payable and accrued expenses |
8,367 | (15,541 | ) | |||||
|
|
|
|
|
|||||
| Net cash provided by (used for) operating activities - continuing operations |
31,334 | 39,492 | ||||||
| Net cash provided by (used for) operating activities - discontinued operations |
— | 7,297 | ||||||
|
|
|
|
|
|||||
| Net cash provided by (used for) operating activities |
31,334 | 46,789 | ||||||
|
|
|
|
|
|||||
| Cash Flows From Investing Activities |
||||||||
| Capital expenditures |
(8,955 | ) | (5,669 | ) | ||||
| Acquisition of business |
(716 | ) | (18,000 | ) | ||||
| Proceeds from sale of property, plant and equipment |
— | 7,514 | ||||||
| Proceeds from sale of notes receivable |
1,200 | — | ||||||
|
|
|
|
|
|||||
| Net cash provided by (used for) investing activities - continuing operations |
(8,471 | ) | (16,155 | ) | ||||
| Net cash provided by (used for) investing activities - discontinued operations |
— | — | ||||||
|
|
|
|
|
|||||
| Net cash provided by (used for) investing activities |
(8,471 | ) | (16,155 | ) | ||||
|
|
|
|
|
|||||
| Cash Flows From Financing Activities |
||||||||
| Cash dividends paid |
(14,570 | ) | (14,524 | ) | ||||
| Proceeds from issuance of common stock |
367 | 755 | ||||||
| Shares withheld for employee taxes on equity awards |
(416 | ) | (985 | ) | ||||
|
|
|
|
|
|||||
| Net cash provided by (used for) financing activities - continuing operations |
(14,619 | ) | (14,754 | ) | ||||
| Net cash provided by (used for) financing activities - discontinued operations |
— | — | ||||||
|
|
|
|
|
|||||
| Net cash provided by (used for) financing activities |
(14,619 | ) | (14,754 | ) | ||||
|
|
|
|
|
|||||
| Foreign exchange rate effect on cash |
(25 | ) | 40 | |||||
|
|
|
|
|
|||||
| Net increase in cash |
8,219 | 15,920 | ||||||
| Cash at January 1 |
75,527 | 58,894 | ||||||
|
|
|
|
|
|||||
| Cash at September 30 |
$ | 83,746 | $ | 74,814 | ||||
|
|
|
|
|
|||||
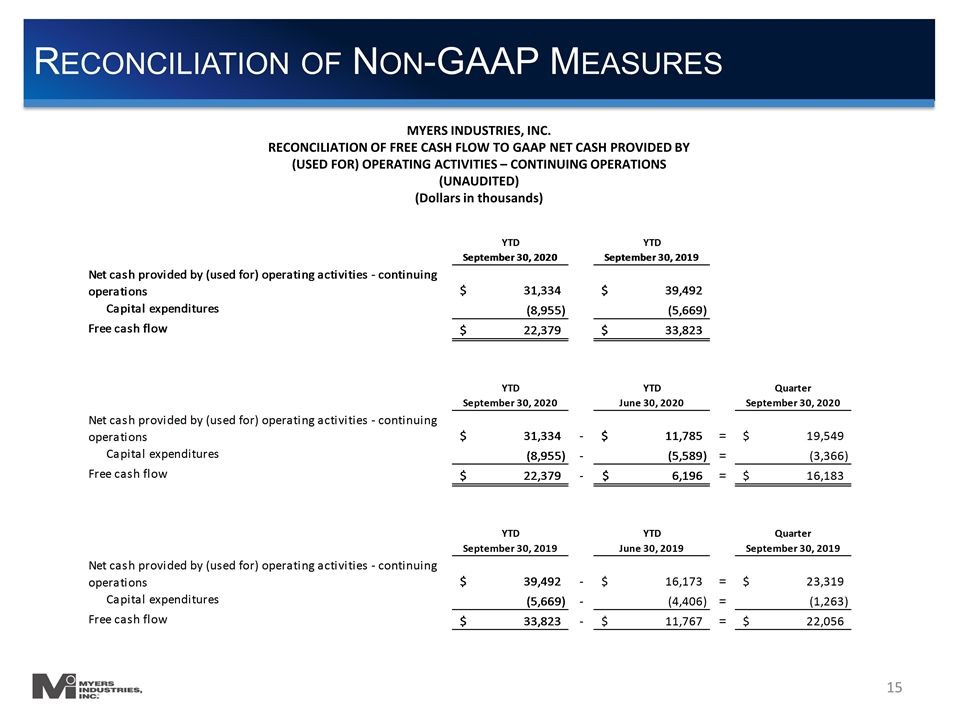
MYERS INDUSTRIES, INC.
RECONCILIATION OF FREE CASH FLOW TO GAAP NET CASH PROVIDED BY
(USED FOR) OPERATING ACTIVITIES – CONTINUING OPERATIONS
(UNAUDITED)
(Dollars in thousands)
| YTD | YTD | |||||||||||||||||||
| September 30, 2020 | September 30, 2019 | |||||||||||||||||||
| Net cash provided by (used for) operating activities - continuing operations |
$ | 31,334 | $ | 39,492 | ||||||||||||||||
| Capital expenditures |
(8,955 | ) | (5,669 | ) | ||||||||||||||||
|
|
|
|
|
|||||||||||||||||
| Free cash flow |
$ | 22,379 | $ | 33,823 | ||||||||||||||||
|
|
|
|
|
|||||||||||||||||
| YTD | YTD | Quarter | ||||||||||||||||||
| September 30, 2020 | June 30, 2020 | September 30, 2020 | ||||||||||||||||||
| Net cash provided by (used for) operating activities - continuing operations |
$ | 31,334 | - | $ | 11,785 | = | $ | 19,549 | ||||||||||||
| Capital expenditures |
(8,955 | ) | - | (5,589 | ) | = | (3,366 | ) | ||||||||||||
|
|
|
|
|
|
|
|||||||||||||||
| Free cash flow |
$ | 22,379 | - | $ | 6,196 | = | $ | 16,183 | ||||||||||||
|
|
|
|
|
|
|
|||||||||||||||
| YTD | YTD | Quarter | ||||||||||||||||||
| September 30, 2019 | June 30, 2019 | September 30, 2019 | ||||||||||||||||||
| Net cash provided by (used for) operating activities - continuing operations |
$ | 39,492 | - | $ | 16,173 | = | $ | 23,319 | ||||||||||||
| Capital expenditures |
(5,669 | ) | - | (4,406 | ) | = | (1,263 | ) | ||||||||||||
|
|
|
|
|
|
|
|||||||||||||||
| Free cash flow |
$ | 33,823 | - | $ | 11,767 | = | $ | 22,056 | ||||||||||||
|
|
|
|
|
|
|
|||||||||||||||