Exhibit 99.1

First Western Reports Fourth Quarter 2020 Financial Results
Fourth Quarter 2020 Summary
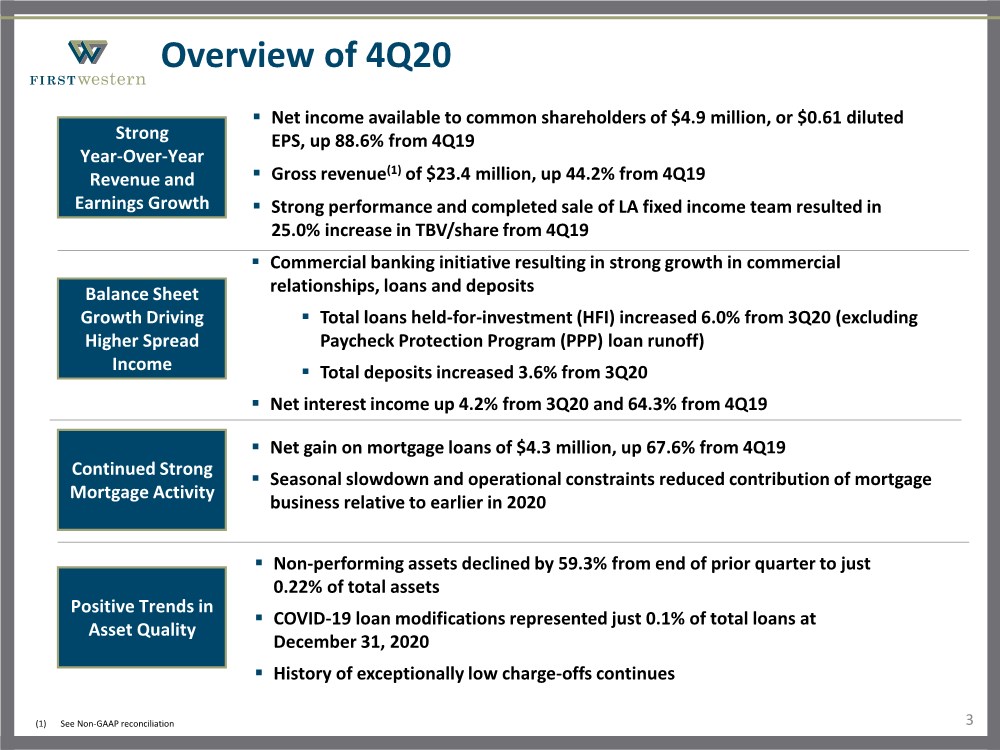
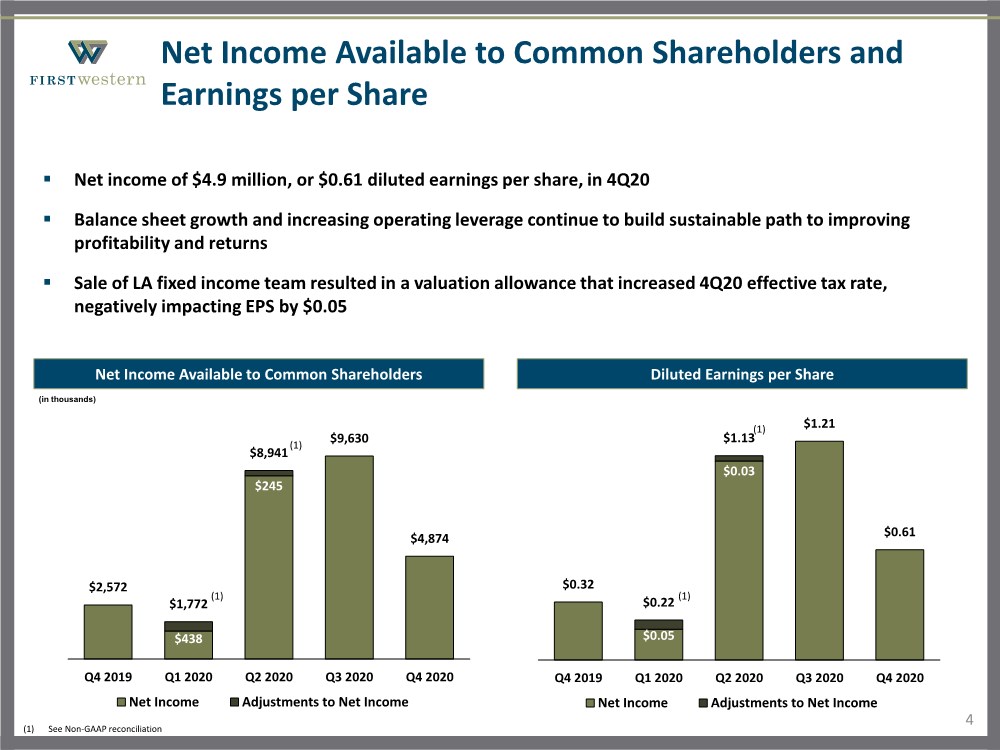
| ● | Net income available to common shareholders of $4.9 million in Q4 2020, compared to $9.6 million in Q3 2020 and $2.6 million in Q4 2019 |
| ● | Diluted EPS of $0.61 in Q4 2020, compared to $1.21 in Q3 2020 and $0.32 in Q4 2019 |
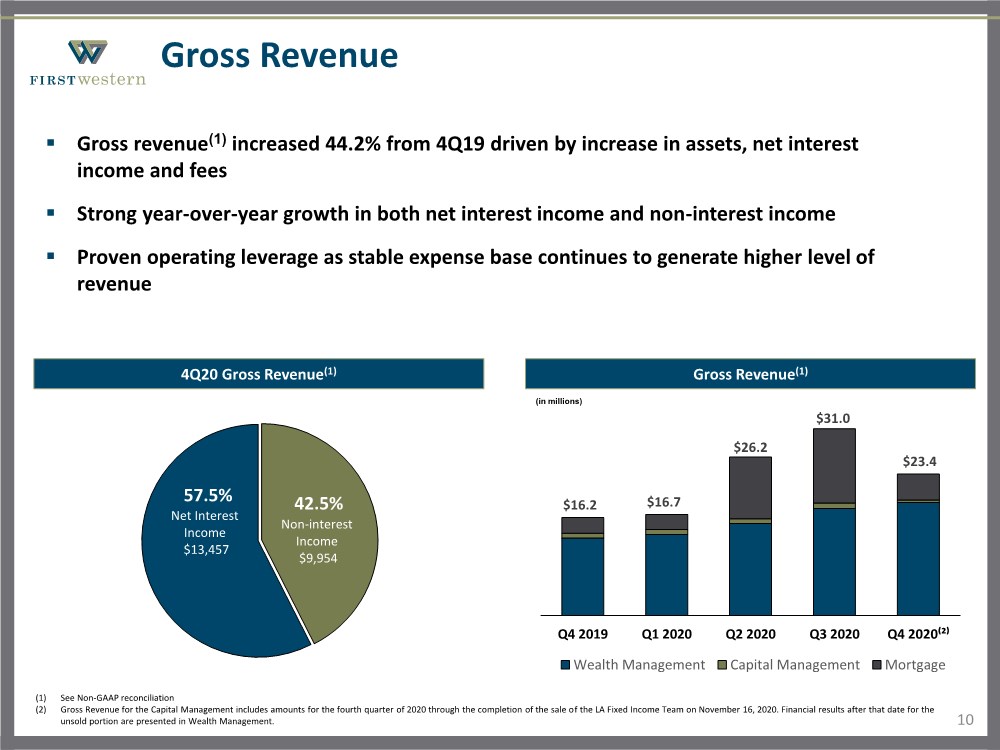
| ● | Gross revenue(1) of $23.4 million in Q4 2020, compared to $31.0 million in Q3 2020 and $16.2 million in Q4 2019 |
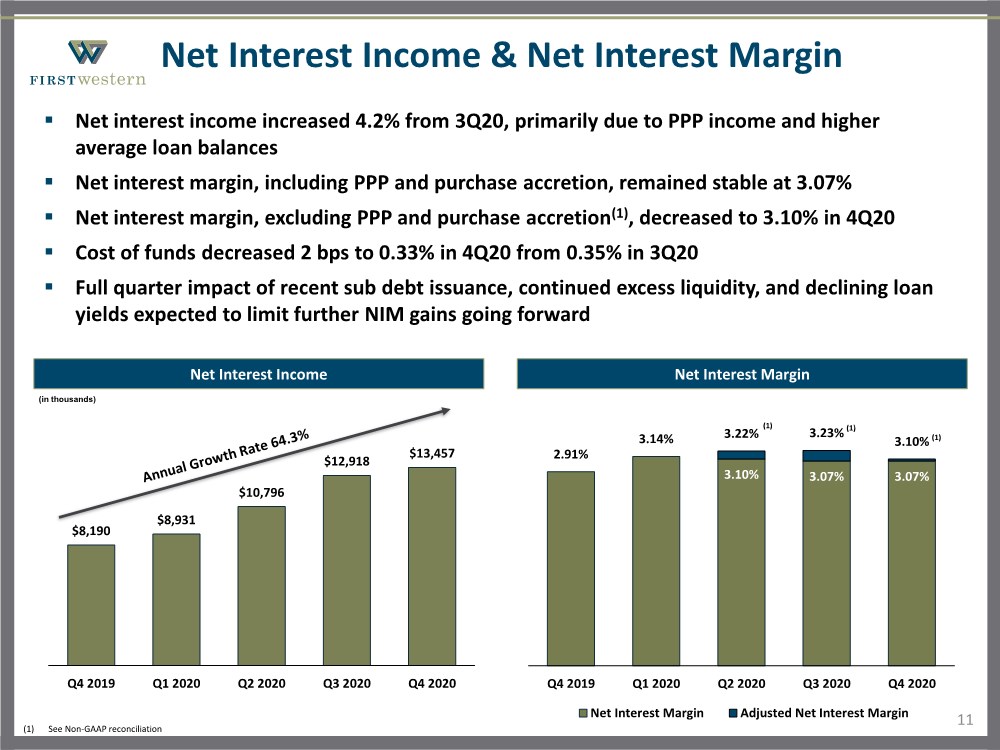
| ● | Net interest margin, including the impact of Paycheck Protection Program (“PPP”) loans, was consistent with Q3 2020 at 3.07% and an increase from 2.91% in Q4 2019 |
| ● | Total assets of $1.97 billion, remained relatively flat from Q3 2020 and up 57.7% from Q4 2019 |
| ● | Total deposits of $1.62 billion, up 3.6% from Q3 2020 and 49.1% from Q4 2019 |
| ● | Gross loans of $1.53 billion, up 1.8% from Q3 2020 and 53.6% from Q4 2019 |
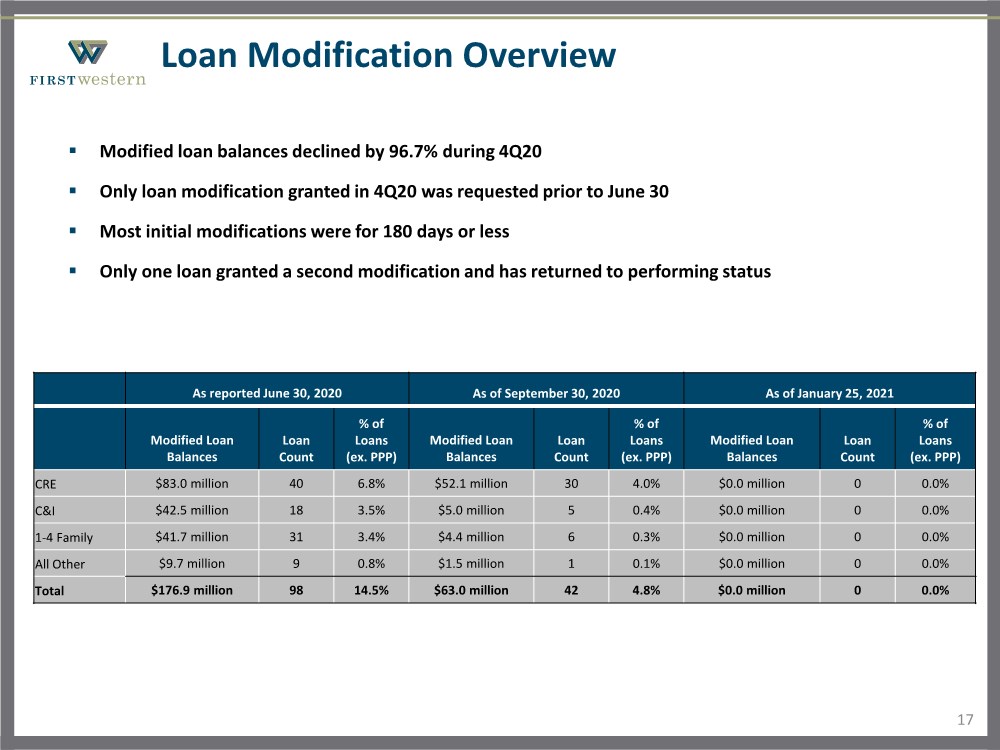
| ● | Loans under active COVID-19 loan modification agreements declined 96.7% from $63.0 million in Q3 2020, to $2.1 million in Q4 2020 |
| ● | Non-performing assets to total assets declined to 0.22% from 0.53% in Q3 2020 and 1.03% in Q4 2019 |
(1) Represents a Non-GAAP financial measure. See “Reconciliations of Non-GAAP Measures” for a reconciliation of our Non-GAAP measures to the most directly comparable GAAP financial measure.
Denver, Colo., January 28, 2021 – First Western Financial, Inc., (“First Western” or the “Company”) (NASDAQ: MYFW), today reported financial results for the fourth quarter ended December 31, 2020.
Net income available to common shareholders was $4.9 million, or $0.61 per diluted share, for the fourth quarter of 2020. This compares to $9.6 million, or $1.21 per diluted share, for the third quarter of 2020, and $2.6 million, or $0.32 per diluted share, for the fourth quarter of 2019.
Scott C. Wylie, CEO of First Western, commented, “Although we saw a seasonal decline in mortgage activity during the fourth quarter, we were still able to nearly double our earnings from the prior year due primarily to the strong balance sheet growth we generated in 2020, which resulted in a 64% year-over-year increase in our net interest income. We had another strong quarter of loan production and core deposit gathering, largely due to continued growth in commercial relationships.
“We also continued to see positive trends in asset quality, which reflects the strength of our borrowers and our conservative underwriting. Our total non-performing assets declined by approximately 60% from the end
of the prior quarter, while only a small number of loans remain on deferral. We continue to closely monitor our borrowers and have not seen any meaningful deterioration in credit quality resulting from the recent surge in COVID-19 cases.
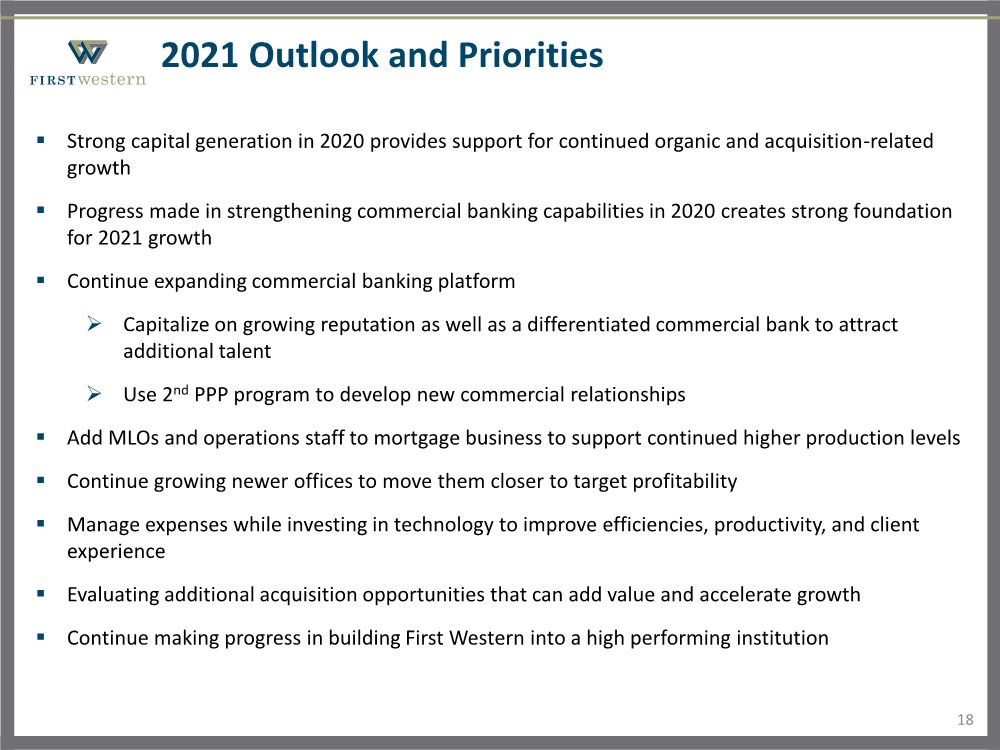
“We believe we are well positioned to generate another year of strong balance sheet growth in 2021, as our commercial banking initiative gains additional traction and we continue to have success competing against and taking business from larger banks. With the growth we have seen in our commercial client roster over the past year, we also believe that we have good opportunities to expand those relationships to include other products and services across the First Western banking and wealth management platform. As we continue to grow our balance sheet and expand client relationships, we expect to realize additional operating leverage, consistently deliver strong returns, and further enhance the value of the First Western franchise in the years to come,” said Mr. Wylie.
| | For the Three Months Ended |
| |||||||
| | December 31, | | September 30, | | December 31, |
| |||
(Dollars in thousands, except per share data) |
| 2020 |
| 2020 |
| 2019 |
| |||
Earnings Summary |
| |
|
| |
|
| |
| |
Net interest income | | $ | 13,457 | | $ | 12,918 | | $ | 8,190 | |
Less: provision for loan losses | |
| 695 | |
| 1,496 | |
| 447 | |
Total non-interest income | |
| 9,954 | |
| 18,032 | |
| 8,228 | |
Total non-interest expense | |
| 15,614 | |
| 16,632 | |
| 13,082 | |
Income before income taxes | |
| 7,102 | |
| 12,822 | |
| 2,889 | |
Income tax expense | |
| 2,228 | |
| 3,192 | |
| 317 | |
Net income available to common shareholders | | | 4,874 | | | 9,630 | | | 2,572 | |
Basic earnings per common share | | | 0.61 | | | 1.22 | | | 0.33 | |
Diluted earnings per common share | | | 0.61 | | | 1.21 | | | 0.32 | |
| | | | | | | | | | |
Return on average assets (annualized) | |
| 0.99 | % |
| 2.06 | % |
| 0.82 | % |
Return on average shareholders' equity (annualized) | |
| 12.62 | |
| 26.43 | |
| 8.06 | |
Return on tangible common equity (annualized)(1) | |
| 14.92 | |
| 31.49 | |
| 9.85 | |
Net interest margin | |
| 3.07 | |
| 3.07 | |
| 2.91 | |
Efficiency ratio(1) | |
| 66.62 | % |
| 53.40 | % |
| 80.54 | % |
(1) Represents a Non-GAAP financial measure. See “Reconciliations of Non-GAAP Measures” for a reconciliation of our Non-GAAP measures to the most directly comparable GAAP financial measure.
Operating Results for the Fourth Quarter 2020
Revenue
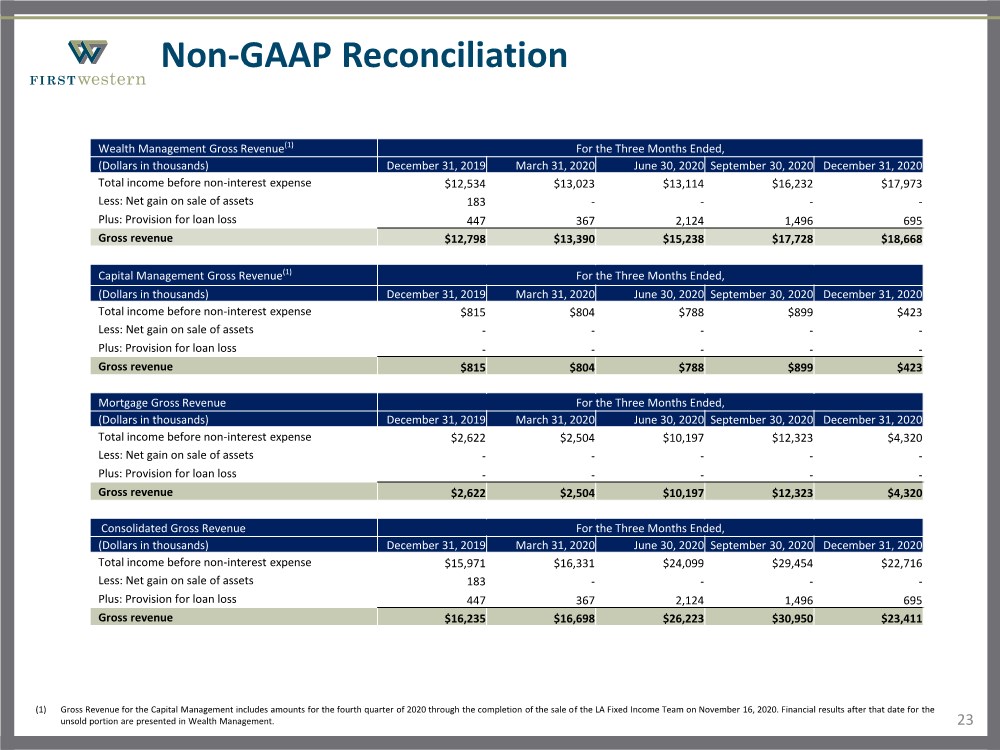
Gross revenue (1) was $23.4 million for the fourth quarter of 2020, compared to $31.0 million for the third quarter of 2020. The decrease in revenue was driven by an $8.1 million decrease in non-interest income, primarily due to a seasonal decline and processing constraints that impacted mortgage segment revenue.
Relative to the fourth quarter of 2019, gross revenue increased $7.2 million from $16.2 million, or 44.2%. The increase in revenue was primarily due to a $5.3 million increase in net interest income driven by improving net interest margin and growth in interest earning assets, as well as higher mortgage segment activity.
(1) Represents a Non-GAAP financial measure. See “Reconciliations of Non-GAAP Measures” for a reconciliation of our Non-GAAP measures to the most directly comparable GAAP financial measure.
Net Interest Income
2
Net interest income for the fourth quarter of 2020 was $13.5 million, an increase of 4.2% from $12.9 million in the third quarter of 2020. The increase in net interest income was primarily driven by a $60.1 million, or 4.1%, increase in average loan balances attributed to organic growth and $1.0 million from PPP income.
Relative to the fourth quarter of 2019, net interest income increased 64.3% from $8.2 million. The year-over-year increase in net interest income was due primarily to growth in average loans including organic growth, the impact of PPP loans, and the branch acquisition.
Net Interest Margin
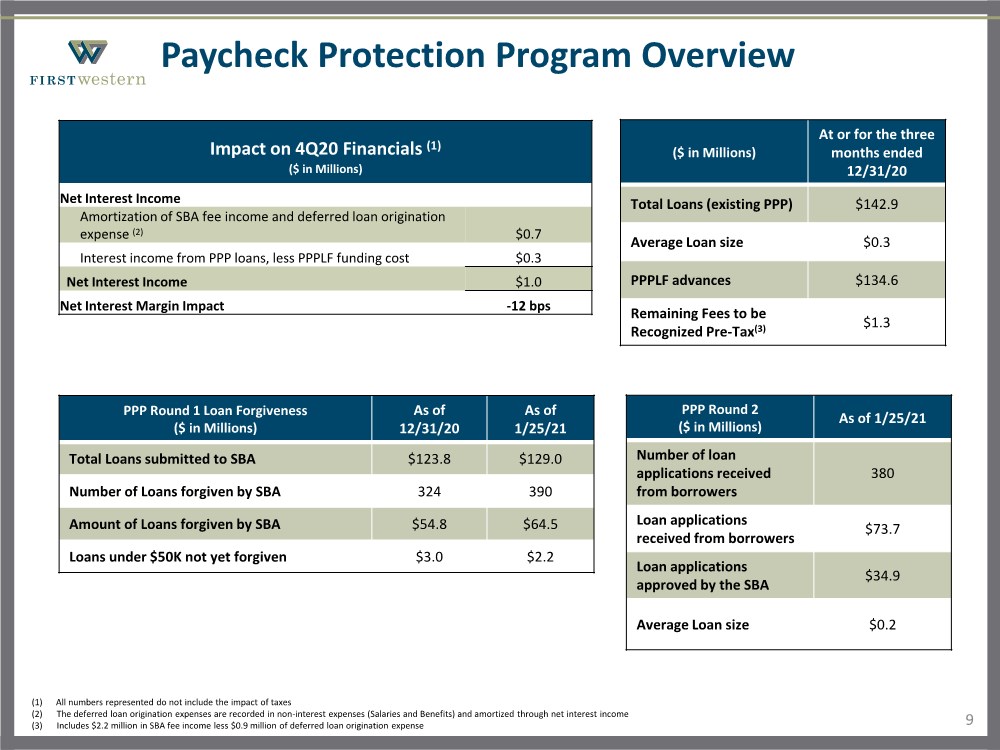
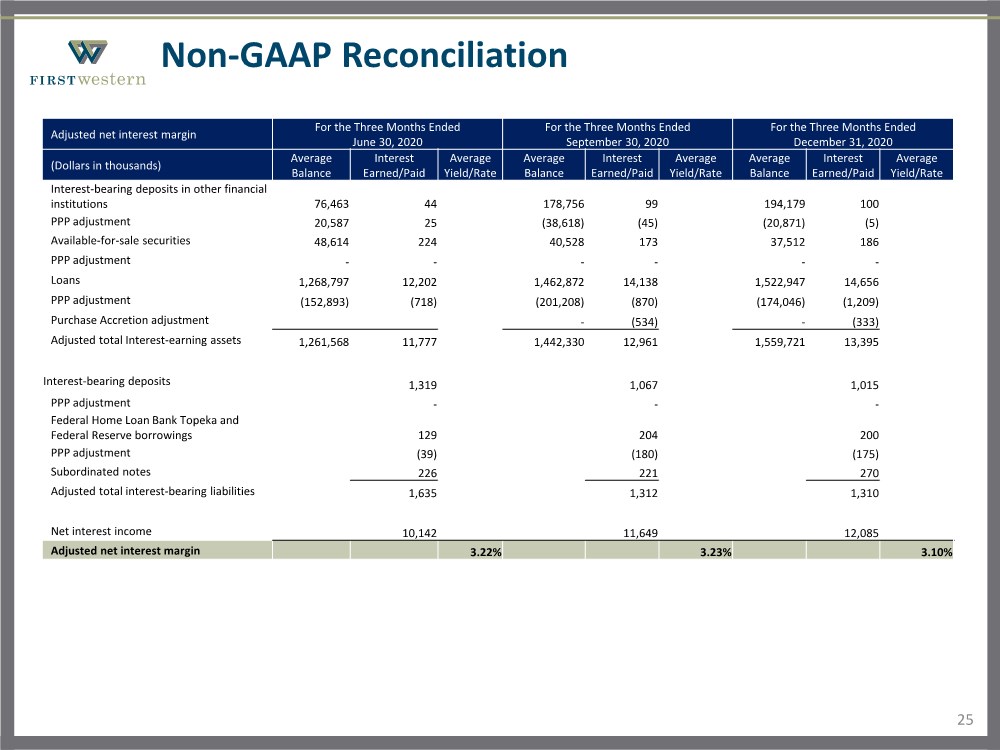
Net interest margin for the fourth quarter of 2020 remained flat from the third quarter of 2020, at 3.07%. On a net basis, the PPP program negatively impacted net interest margin by 12 basis points. This was primarily driven by amortization of SBA fee income and deferred loan origination expense of $0.7 million and interest income from PPP loans of $0.3 million. The negative impact was offset by an increase of 9 basis points relating to the impact of purchase accretion from the branch acquisition completed in the second quarter 2020. Net interest margin was also negatively impacted by excess liquidity during the period, although the excess liquidity was a contributor to growth in net interest income.
Relative to the fourth quarter of 2019, the net interest margin increased from 2.91%, primarily due to an 84 basis point decline in cost of deposits, partially offset by a 62 basis point reduction in average yields on interest earning assets.
Non-interest Income
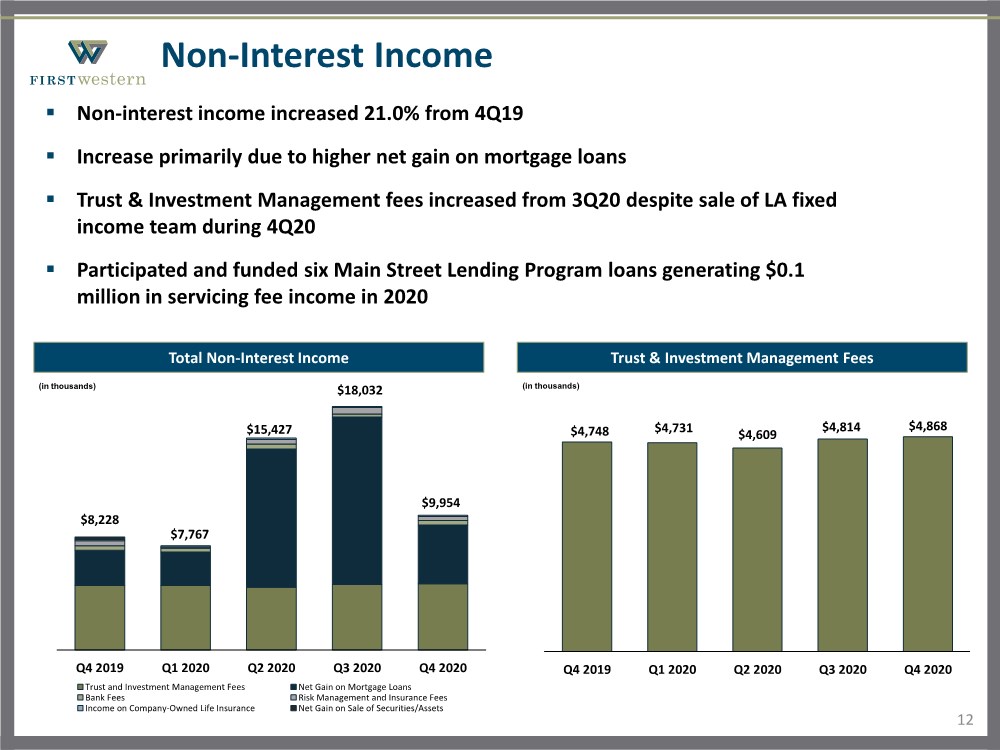
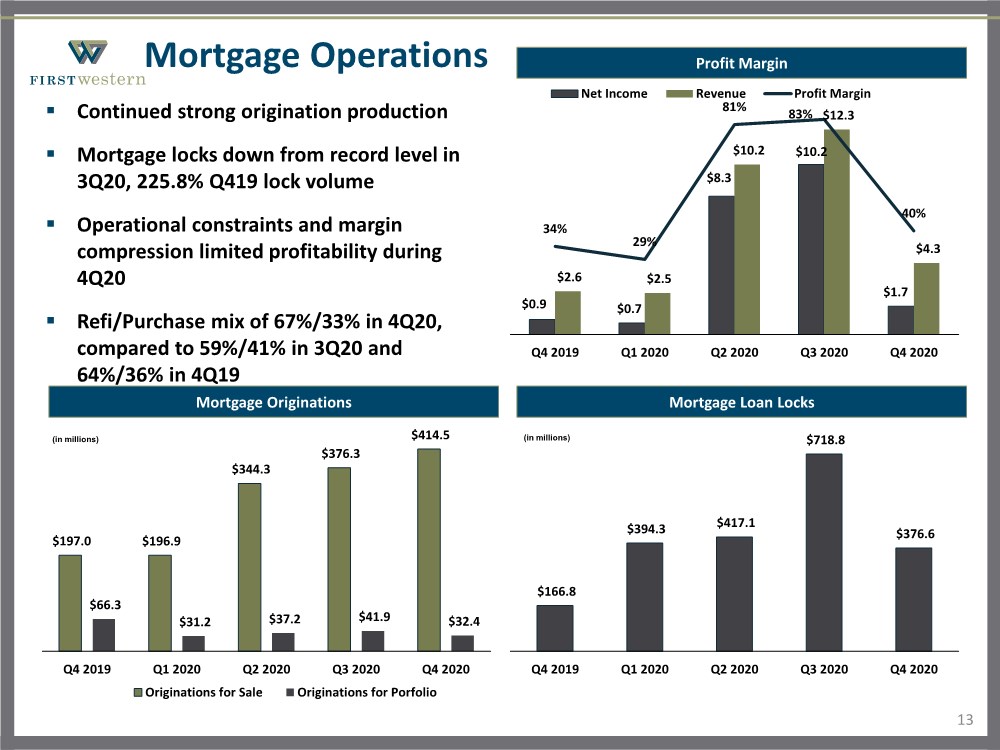
Non-interest income for the fourth quarter of 2020 was $10.0 million, a decrease of 44.8% from $18.0 million in the third quarter of 2020. The decrease was attributable to a seasonal decline in demand for mortgage loans in the secondary market, operational constraints that limited the number of mortgage loans that could be processed in the quarter, and lower margins due to investor pricing pressure driven by high volume of originations in the MBS market. While mortgage loan lock volume declined 47.6% from the third quarter of 2020, the Company originated $414.5 million of mortgage loans for sale during the fourth quarter of 2020, compared to $376.3 million the previous quarter, an increase of $38.2 million.
Relative to the fourth quarter of 2019, non-interest income increased 21.0% from $8.2 million. The increase was attributable to higher net gain on mortgage loans of 67.6%, primarily related to an increase in mortgage lock volume of 125.8% year-over-year.
Non-interest Expense
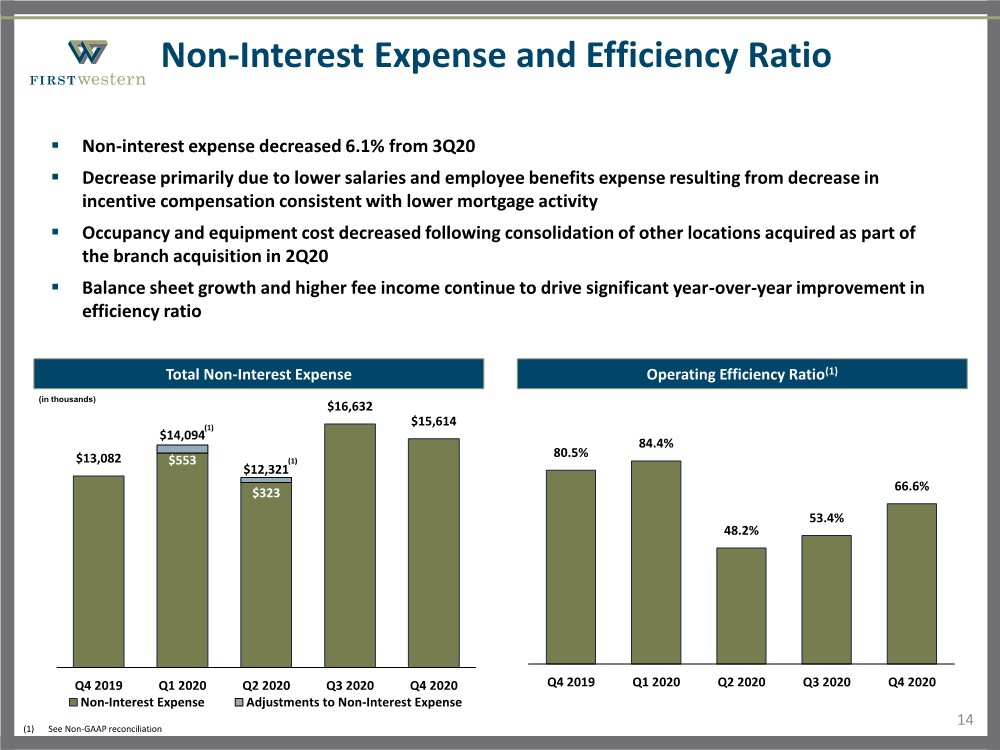
Non-interest expense for the fourth quarter of 2020 was $15.6 million, a decrease of 6.1% from $16.6 million for the third quarter of 2020. The decrease was attributable to lower incentive compensation accruals and lower occupancy costs related to the consolidation of other locations acquired as part of the branch acquisition in the second quarter of 2020. This was partially offset by higher professional fees related to the disposition of the Los Angeles fixed income portfolio management team (“LA fixed income team”) and higher FDIC insurance related to deposit growth.
Non-interest expense increased 19.4% from $13.1 million in the fourth quarter of 2019. The increase was primarily due to higher salaries and employee benefits expense, additional FDIC insurance, and additional data processing costs resulting from the personnel and assets added through the branch purchase and organic growth.
3
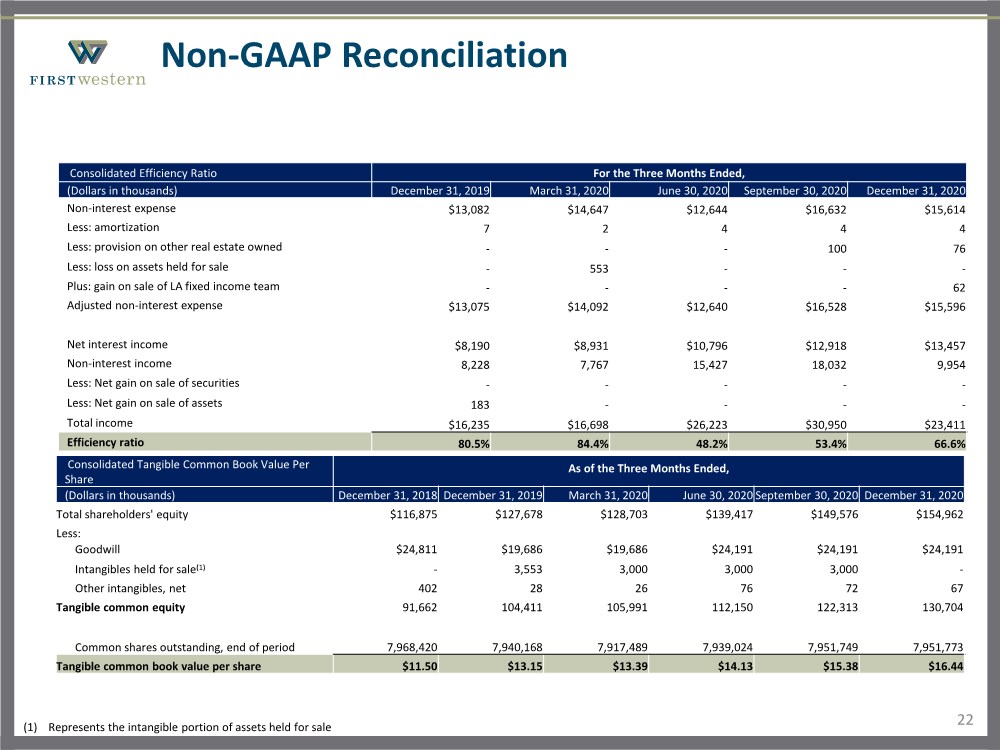
The Company’s efficiency ratio(1) was 66.6% in the fourth quarter of 2020, compared with 53.4% in the third quarter of 2020 and 80.5% in the fourth quarter of 2019.
(1) Represents a Non-GAAP financial measure. See “Reconciliations of Non-GAAP Measures” for a reconciliation of our Non-GAAP measures to the most directly comparable GAAP financial measure.
Income Taxes
The Company recorded income tax expense of $2.2 million for the fourth quarter of 2020, representing an effective tax rate of 31.4%, compared to 24.9% for the third quarter of 2020. The increase in effective tax rate in the fourth quarter of 2020 was primarily attributable to recording a valuation allowance of $0.4 million related to our net operating loss with the State of California following the sale of our LA fixed income team in the fourth quarter.
Loan Portfolio
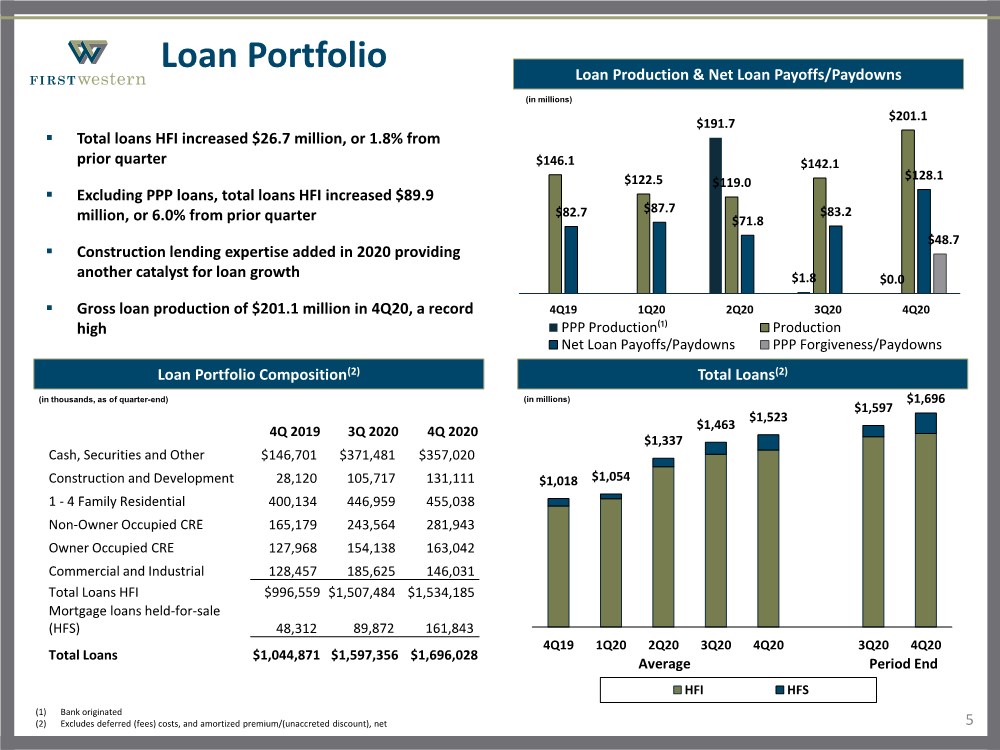
Total loans, including mortgage loans held for sale, were $1.70 billion at December 31, 2020, an increase of $98.7 million from the end of the prior quarter and an increase of $648.4 million from December 31, 2019.
Total loans held for investment, were $1.53 billion at December 31, 2020, an increase of 1.8% from $1.51 billion at September 30, 2020, and an increase of 53.9% from $996.6 million at December 31, 2019. The increase in total loans held for investment from September 30, 2020 was primarily due to growth in the commercial real estate, construction portfolio, and 1-4 family residential portfolios.
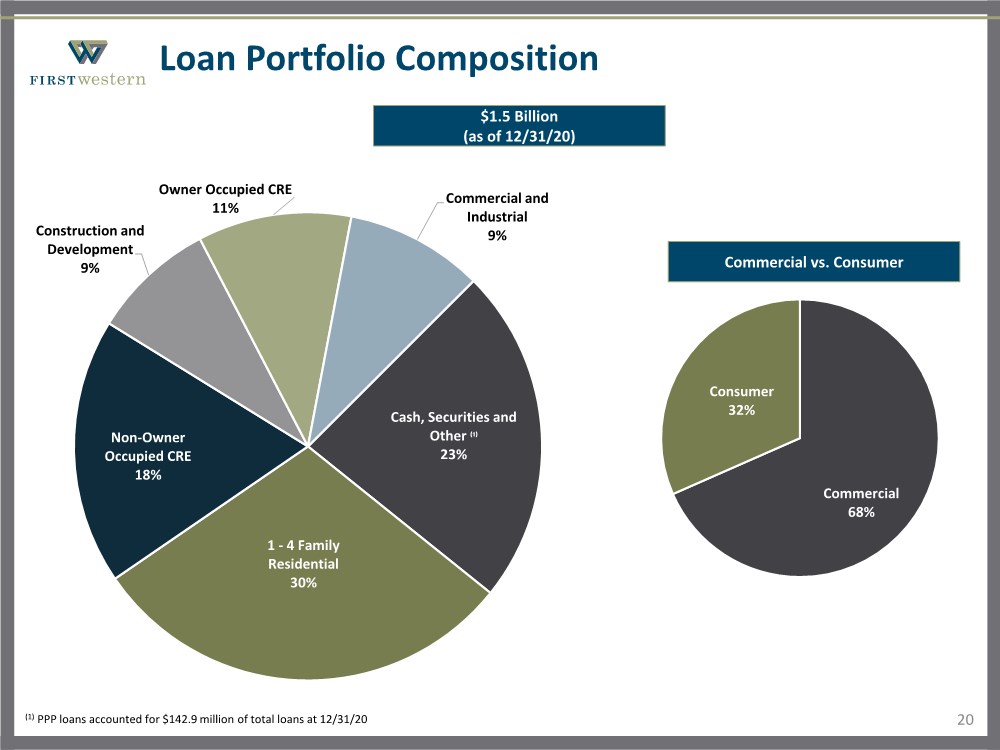
PPP loans were $142.9 million as of December 31, 2020, a decrease of 30.7% from $206.1 million as of September 30, 2020. As of December 31, 2020, the Company has submitted loan forgiveness applications to the Small Business Administration (“SBA”) on behalf of clients for $123.8 million and received forgiveness and funds remitted in the amount of $54.8 million from the SBA. As of December 31, 2020, there was $1.3 million remaining in net fees to be recognized upon forgiveness.
Deposits
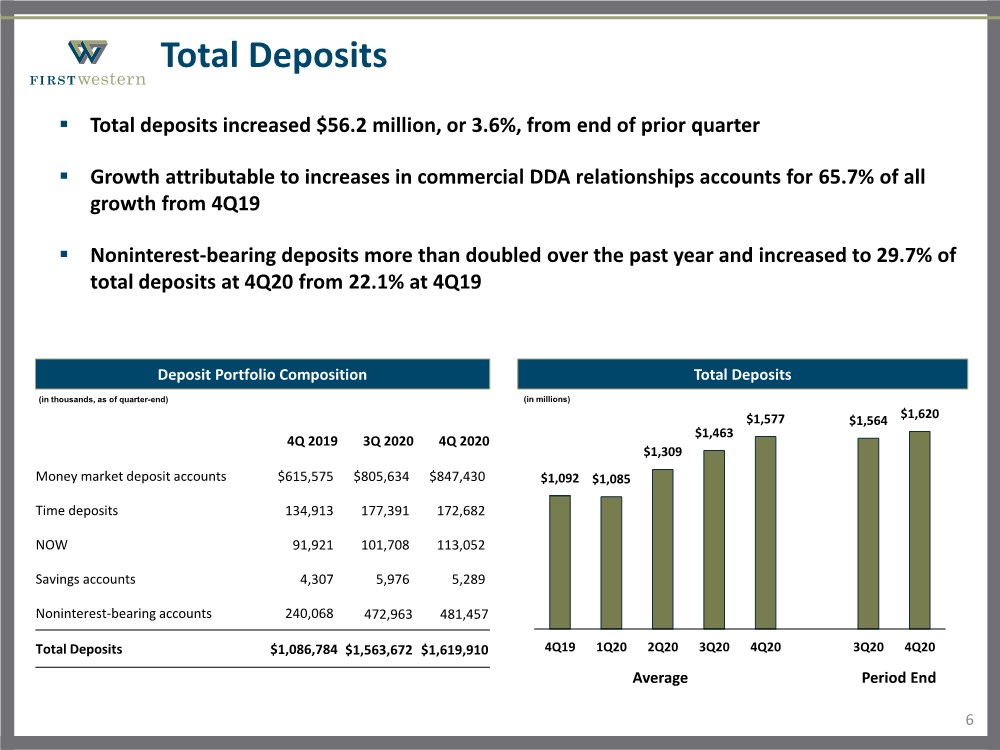
Total deposits were $1.62 billion at December 31, 2020, compared to $1.56 billion at September 30, 2020, and $1.09 billion at December 31, 2019. The increase in total deposits from September 30, 2020 was primarily attributable to an increase in money market deposits.
Average total deposits for the fourth quarter of 2020 increased $114.6 million, or 31.3% annualized, from the third quarter of 2020 and $485.0 million, or 44.4%, from the fourth quarter of 2019. The increase was primarily attributable to an increase in money market deposits.
Borrowings
Federal Home Loan Bank (“FHLB”) and Federal Reserve borrowings were $149.6 million as of December 31, 2020, compared to $222.1 million as of September 30, 2020, a decrease of $72.5 million from the end of the prior quarter, and an increase of $139.6 million from December 31, 2019. The decrease from September 30, 2020 is attributable to the payback of funds received from the Paycheck Protection Program Loan Facility (“PPPLF”) from the Federal Reserve as PPP loans are forgiven. The balances in PPPLF reduced by $69.5 million in the fourth quarter 2020 when compared to the third quarter 2020 due to the corresponding forgiveness of PPP loans. Borrowing from this facility is expected to match the balances of the PPP loans. The increase from December 30, 2019 is attributable to participation in the PPPLF.
4
Assets Under Management
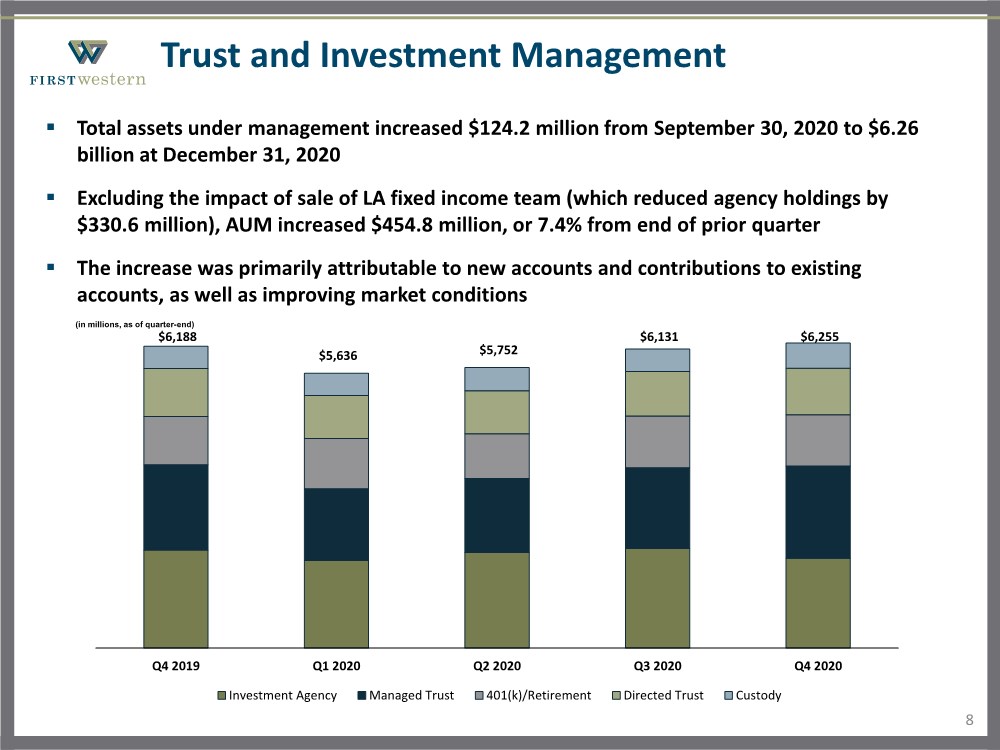
Total assets under management (“AUM”) increased by $124.2 million during the fourth quarter to $6.26 billion as of December 31, 2020, compared to $6.13 billion as of September 30, 2020, and $6.19 billion as of December 31, 2019. The increase was primarily attributable to new accounts and contributions to existing accounts, as well as improving market conditions causing an increase in assets under management balances. The increase in the fourth quarter AUM was partially offset by the sale of the LA fixed income team, resulting in a decline in investment agency balances of $330.6 million.
Credit Quality
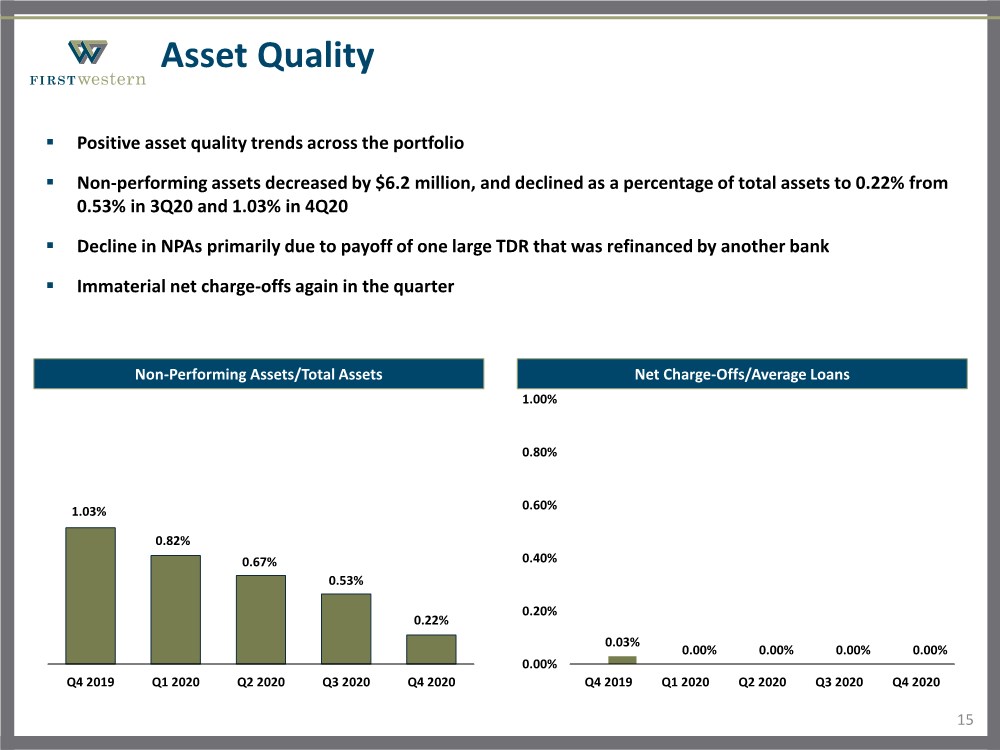
Non-performing assets totaled $4.3 million, or 0.22% of total assets, as of December 31, 2020, compared with $10.4 million, or 0.53% of total assets, as of September 30, 2020 and $12.9 million, or 1.03% of total assets, as of December 31, 2019. The decline in non-performing assets from prior quarter was primarily due to the payoff of one large non-performing loan.
As a result of the COVID-19 pandemic, a loan modification program was designed and implemented to assist our clients experiencing financial stress resulting from the economic impacts caused by the global pandemic. The Company offered loan extensions, temporary payment moratoriums, and financial covenant waivers for commercial and consumer borrowers impacted by the pandemic who had a pass risk rating and had not been delinquent over 30 days on payments in the last two years. As of January 25, 2021, all borrowers were out of their deferral period and all are performing.
As of December 31, 2020, the Company has active loan modification agreements on two loans across multiple industries in the amount of $2.1 million, representing a decline of 96.7% from $63.0 million, as of September 30, 2020. COVID-19 loan modification agreements represented 0.1% of total loans, as of December 31, 2020, compared with 4.2% of total loans, as of September 30, 2020. Most of the temporary payment moratoriums were for a period of 180 days or less and the Company is recognizing interest income on these loans.
The Company continues to meet regularly with clients who could be more highly impacted by the COVID-19 pandemic. The Company receives and reviews current financial data and cash flow forecasts from borrowers with loan modification agreements. As of December 31, 2020, loans which were granted modifications and the modification term has ended have returned to performing status.
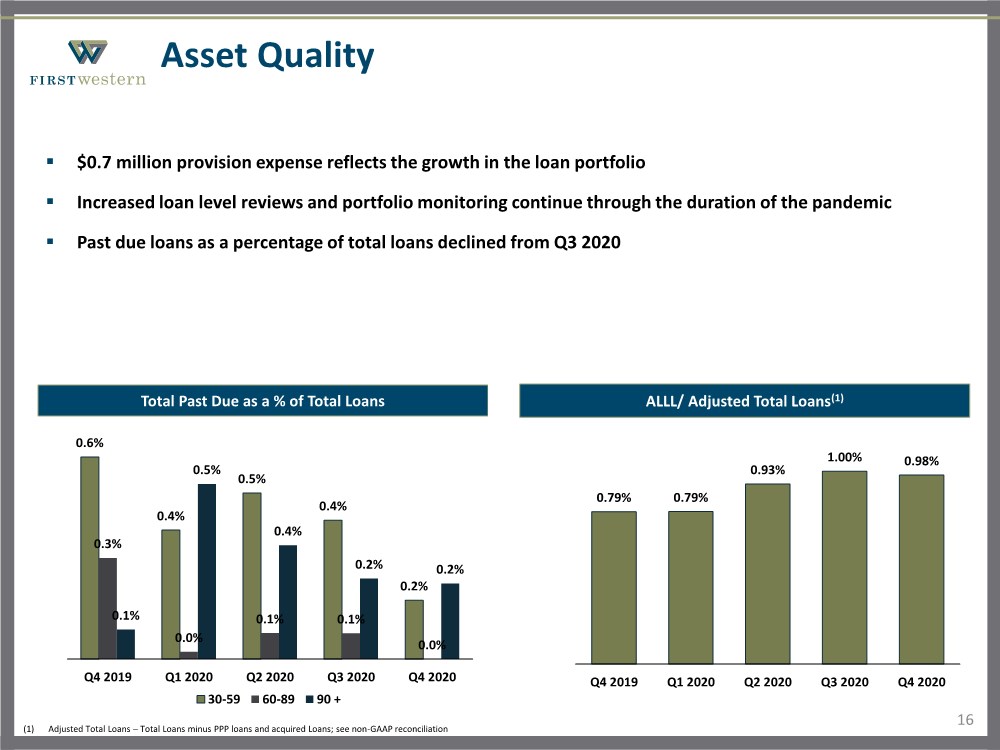
The Company recorded a provision for loan losses of $0.7 million in the fourth quarter of 2020, compared with $0.4 million in the fourth quarter of 2019. The higher provision was primarily due to the growth in the loan portfolio. The Company has increased loan level reviews and portfolio monitoring to thoroughly assess how its clients are being impacted by the current environment.
5
Capital
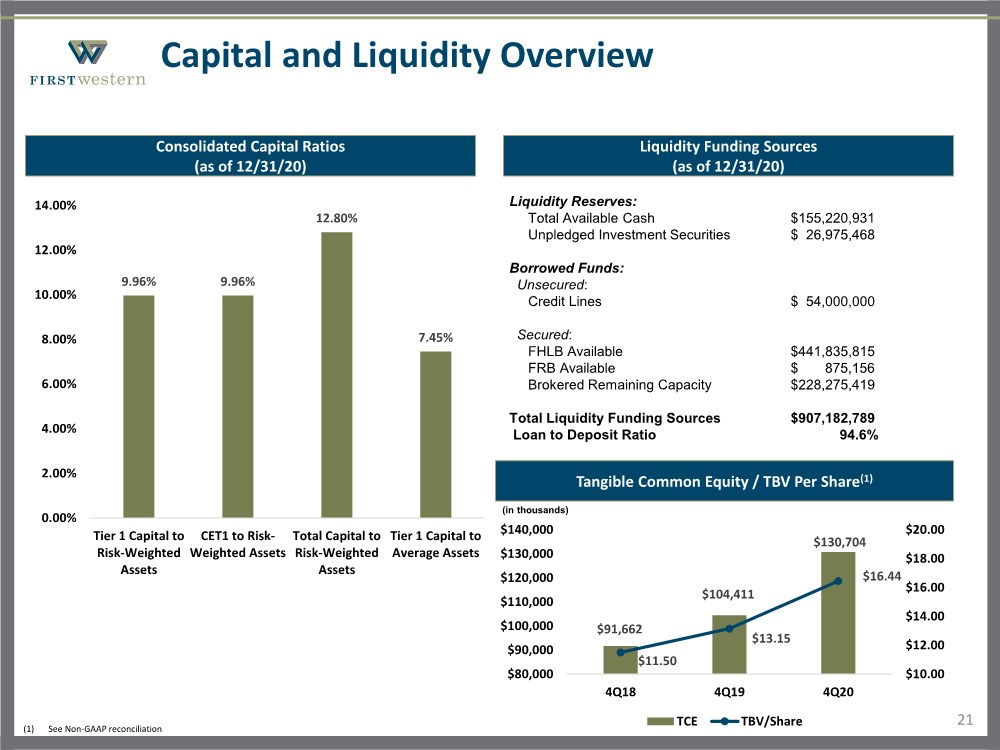
As of December 31, 2020, First Western (“Consolidated”) and First Western Trust Bank (“Bank”) exceeded the minimum capital levels required by their respective regulators. As of December 31, 2020, the Bank was classified as “well capitalized,” as summarized in the following table:
|
| December 31, |
|
| | 2020 |
|
Consolidated Capital |
|
| |
Tier 1 capital to risk-weighted assets |
| 9.96 | % |
Common Equity Tier 1 (CET1) to risk-weighted assets |
| 9.96 | |
Total capital to risk-weighted assets |
| 12.80 | |
Tier 1 capital to average assets |
| 7.45 | |
| | | |
Bank Capital |
| | |
Tier 1 capital to risk-weighted assets |
| 10.22 | |
Common Equity Tier 1 (CET1) to risk-weighted assets |
| 10.22 | |
Total capital to risk-weighted assets |
| 11.20 | |
Tier 1 capital to average assets |
| 7.62 | % |
Book value per common share increased 21.2% from $16.08 as of December 31, 2019 to $19.49 as of December 31, 2020, and was up 3.6% from $18.81 as of September 30, 2020.
Tangible book value per common share (1) increased 25.0% from $13.15 as of December 31, 2019 to $16.44 as of December 31, 2020, and was up 6.9% from $15.38 as of September 30, 2020.
During the fourth quarter of 2020, the Company repurchased 426 shares of its common stock at an average price of $17.30 under its stock repurchase program, which authorized the repurchase of up to 400,000 shares of its common stock. As of December 31, 2020, the Company had up to 399,574 shares remaining under the current stock repurchase authorization.
During the fourth quarter of 2020, the Company completed a subordinated debt offering, raising $10.0 million from five investors with an initial interest rate of 4.25%.
(1) Represents a Non-GAAP financial measure. See “Reconciliations of Non-GAAP Measures” for a reconciliation of our Non-GAAP measures to the most directly comparable GAAP financial measure.
Conference Call, Webcast and Slide Presentation
The Company will host a conference call and webcast at 10:00 a.m. MT/ 12:00 p.m. ET on Friday, January 29, 2021. The call can be accessed via telephone at 877-405-1628. A recorded replay will be accessible through February 5, 2021 by dialing 855-859-2056; passcode 3477399.
A slide presentation relating to the fourth quarter 2020 results will be accessible prior to the scheduled conference call. The slide presentation and webcast of the conference call can be accessed on the Events and Presentations page of the Company’s investor relations website at https://myfw.gcs-web.com.
About First Western
First Western is a financial services holding company headquartered in Denver, Colorado, with operations in Colorado, Arizona, Wyoming and California. First Western and its subsidiaries provide a fully integrated suite of wealth management services on a private trust bank platform, which includes a comprehensive selection of deposit, loan, trust, wealth planning and investment management products and services. First
6
Western’s common stock is traded on the Nasdaq Global Select Market under the symbol “MYFW.” For more information, please visit www.myfw.com.
Non-GAAP Financial Measures
Some of the financial measures included in this press release are not measures of financial performance recognized in accordance with generally accepted accounting principles in the United States (“GAAP”). These non-GAAP financial measures include “Tangible Common Equity,” “Tangible Common Book Value per Share,” “Return on Tangible Common Equity,” “Efficiency Ratio,” “Gross Revenue,” and “Allowance to Bank Originated Loans Excluding PPP”. The Company believes these non-GAAP financial measures provide both management and investors a more complete understanding of the Company’s financial position and performance. These non-GAAP financial measures are supplemental and are not a substitute for any analysis based on GAAP financial measures. Not all companies use the same calculation of these measures; therefore, this presentation may not be comparable to other similarly titled measures as presented by other companies. Reconciliation of non-GAAP financial measures, to GAAP financial measures are provided at the end of this press release.
Forward-Looking Statements
Statements in this news release regarding our expectations and beliefs about our future financial performance and financial condition, as well as trends in our business and markets are “forward-looking statements” as defined in the Private Securities Litigation Reform Act of 1995. Forward-looking statements often include words such as “believe,” “expect,” “anticipate,” “intend,” “plan,” “estimate,” “project,” “outlook,” or words of similar meaning, or future or conditional verbs such as “will,” “would,” “should,” “opportunity,” “could,” or “may.” The forward-looking statements in this news release are based on current information and on assumptions that we make about future events and circumstances that are subject to a number of risks and uncertainties that are often difficult to predict and beyond our control. As a result of those risks and uncertainties, our actual financial results in the future could differ, possibly materially, from those expressed in or implied by the forward-looking statements contained in this news release and could cause us to make changes to our future plans. Those risks and uncertainties include, without limitation, the COVID-19 pandemic and its effects; integration risks in connection with acquisitions; the risk of geographic concentration in Colorado, Arizona, Wyoming and California; the risk of changes in the economy affecting real estate values and liquidity; the risk in our ability to continue to originate residential real estate loans and sell such loans; risks specific to commercial loans and borrowers; the risk of claims and litigation pertaining to our fiduciary responsibilities; the risk of competition for investment managers and professionals; the risk of fluctuation in the value of our investment securities; the risk of changes in interest rates; and the risk of the adequacy of our allowance for loan losses and the risk in our ability to maintain a strong core deposit base or other low-cost funding sources. Additional information regarding these and other risks and uncertainties to which our business and future financial performance are subject is contained in our Annual Report on Form 10-K filed with the U.S. Securities and Exchange Commission (“SEC”) on March 12, 2020 (“Form 10-K”), and other documents we file with the SEC from time to time. We urge readers of this news release to review the “Risk Factors” section our Form 10-K and any updates to those risk factors set forth in our subsequent Quarterly Reports on Form 10-Q, Current Reports on Form 8-K, and our other filings with the SEC. Also, our actual financial results in the future may differ from those currently expected due to additional risks and uncertainties of which we are not currently aware or which we do not currently view as, but in the future may become, material to our business or operating results. Due to these and other possible uncertainties and risks, readers are cautioned not to place undue reliance on the forward-looking statements contained in this news release, which speak only as of today’s date, or to make predictions based solely on historical financial performance. Any forward-looking statement speaks only as of the date on which it is made, and we do not
7
undertake any obligation to update or review any forward-looking statement, whether as a result of new information, future developments or otherwise, except as required by law.
Contacts:
Financial Profiles, Inc.
Tony Rossi
310-622-8221
8
First Western Financial, Inc.
Consolidated Financial Summary (unaudited)
| | Three Months Ended | |||||||
| | December 31, | | September 30, | | December 31, | |||
(Dollars in thousands, except per share amounts) |
| 2020 | | 2020 | | 2019 | |||
Interest and dividend income: |
| |
|
| |
|
| |
|
Loans, including fees | | $ | 14,656 | | $ | 14,138 | | $ | 10,554 |
Investment securities | |
| 186 | |
| 173 | |
| 321 |
Federal funds sold and other | |
| 100 | |
| 99 | |
| 478 |
Total interest and dividend income | |
| 14,942 | |
| 14,410 | |
| 11,353 |
| | | | | | | | | |
Interest expense: | |
|
| |
|
| | | |
Deposits | |
| 1,015 | |
| 1,067 | |
| 2,995 |
Other borrowed funds | |
| 470 | |
| 425 | |
| 168 |
Total interest expense | |
| 1,485 | |
| 1,492 | |
| 3,163 |
Net interest income | |
| 13,457 | |
| 12,918 | |
| 8,190 |
Less: provision for loan losses | |
| 695 | |
| 1,496 | |
| 447 |
Net interest income, after provision for loan losses | |
| 12,762 | |
| 11,422 | |
| 7,743 |
| | | | | | | | | |
Non-interest income: | |
|
| |
|
| | | |
Trust and investment management fees | |
| 4,868 | |
| 4,814 | |
| 4,748 |
Net gain on mortgage loans | |
| 4,318 | |
| 12,304 | |
| 2,577 |
Bank fees | |
| 391 | |
| 340 | |
| 261 |
Risk management and insurance fees | |
| 287 | |
| 483 | |
| 367 |
Net gain on sale of assets | | | — | | | — | | | 183 |
Income on company-owned life insurance | |
| 90 | |
| 91 | |
| 92 |
Total non-interest income | |
| 9,954 | |
| 18,032 | |
| 8,228 |
Total income before non-interest expense | |
| 22,716 | |
| 29,454 | |
| 15,971 |
| | | | | | | | | |
Non-interest expense: | |
|
| |
|
| | | |
Salaries and employee benefits | |
| 9,401 | |
| 10,212 | |
| 7,990 |
Occupancy and equipment | |
| 1,435 | |
| 1,619 | |
| 1,369 |
Professional services | |
| 1,493 | |
| 1,288 | |
| 962 |
Technology and information systems | |
| 1,041 | |
| 1,032 | |
| 928 |
Data processing | |
| 1,078 | |
| 1,038 | |
| 783 |
Marketing | |
| 415 | |
| 395 | |
| 300 |
Amortization of other intangible assets | |
| 4 | |
| 4 | |
| 7 |
Provision on other real estate owned | | | 76 | | | 100 | | | — |
Other(1) | |
| 671 | |
| 944 | |
| 743 |
Total non-interest expense | |
| 15,614 | |
| 16,632 | |
| 13,082 |
Income before income taxes | |
| 7,102 | |
| 12,822 | |
| 2,889 |
Income tax expense | |
| 2,228 | |
| 3,192 | |
| 317 |
Net income available to common shareholders | | $ | 4,874 | | $ | 9,630 | | $ | 2,572 |
Earnings per common share: | |
| | |
| | | | |
Basic | | $ | 0.61 | | $ | 1.22 | | $ | 0.33 |
Diluted | | $ | 0.61 | | $ | 1.21 | | $ | 0.32 |
(1) Includes a $62 thousand gain on sale of the LA fixed income team.
9
First Western Financial, Inc.
Consolidated Financial Summary (unaudited)
| | December 31, | | September 30, | | December 31, | |||
(Dollars in thousands) | | 2020 | | 2020 | | 2019 | |||
ASSETS |
| |
|
| |
|
| |
|
Cash and cash equivalents: |
| |
|
| |
|
| |
|
Cash and due from banks | | $ | 2,405 | | $ | 2,867 | | $ | 4,180 |
Interest-bearing deposits in other financial institutions | |
| 153,584 | |
| 247,491 | |
| 74,458 |
Total cash and cash equivalents | |
| 155,989 | |
| 250,358 | |
| 78,638 |
| | | | | | | | | |
Available-for-sale securities, at fair value | |
| 36,666 | |
| 40,654 | |
| 58,903 |
Correspondent bank stock, at cost | |
| 2,552 | |
| 1,295 | |
| 585 |
Mortgage loans held for sale | |
| 161,843 | |
| 89,872 | |
| 48,312 |
Loans, net of allowance of $12,539, $11,845 and $7,875 | |
| 1,520,294 | |
| 1,494,231 | |
| 990,132 |
Premises and equipment, net | |
| 5,320 | |
| 5,116 | |
| 5,218 |
Accrued interest receivable | |
| 6,618 | |
| 6,730 | |
| 3,048 |
Accounts receivable | |
| 4,865 | |
| 4,821 | |
| 5,238 |
Other receivables | |
| 1,422 | |
| 1,497 | |
| 1,006 |
Other real estate owned, net | |
| 194 | |
| 558 | |
| 658 |
Goodwill | |
| 24,191 | |
| 24,191 | |
| 19,686 |
Other intangible assets, net | |
| 67 | |
| 72 | |
| 28 |
Deferred tax assets, net | |
| 6,056 | |
| 6,405 | |
| 5,047 |
Company-owned life insurance | |
| 15,449 | |
| 15,359 | |
| 15,086 |
Other assets | |
| 32,129 | |
| 28,738 | |
| 16,544 |
Assets held for sale | |
| — | |
| 3,000 | |
| 3,553 |
Total assets | | $ | 1,973,655 | | $ | 1,972,897 | | $ | 1,251,682 |
| | | | | | | | | |
LIABILITIES | |
| | | | | |
| |
Deposits: | |
|
| |
|
| |
| |
Noninterest-bearing | | $ | 481,457 | | $ | 472,963 | | $ | 240,068 |
Interest-bearing | |
| 1,138,453 | |
| 1,090,709 | |
| 846,716 |
Total deposits | |
| 1,619,910 | |
| 1,563,672 | |
| 1,086,784 |
Borrowings: | |
|
| |
|
| |
| |
Federal Home Loan Bank Topeka and Federal Reserve borrowings | |
| 149,563 | |
| 222,075 | |
| 10,000 |
Subordinated notes | |
| 24,291 | |
| 14,447 | |
| 6,560 |
Accrued interest payable | |
| 453 | |
| 347 | |
| 299 |
Other liabilities | | | 24,476 | | | 22,639 | | | 20,244 |
Liabilities held for sale | |
| — | |
| 141 | |
| 117 |
Total liabilities | |
| 1,818,693 | |
| 1,823,321 | |
| 1,124,004 |
| | | | | | | | | |
SHAREHOLDERS’ EQUITY | |
|
| |
|
| |
|
|
Total shareholders’ equity | |
| 154,962 | |
| 149,576 | |
| 127,678 |
Total liabilities and shareholders’ equity | | $ | 1,973,655 | | $ | 1,972,897 | | $ | 1,251,682 |
10
First Western Financial, Inc.
Consolidated Financial Summary (unaudited)
| | December 31, | | September 30, | | December 31, | |||
(Dollars in thousands) |
| 2020 | | 2020 | | 2019 | |||
Loan Portfolio |
| |
|
| |
|
| |
|
Cash, Securities and Other(1) | | $ | 357,020 | | $ | 371,481 | | $ | 146,701 |
Construction and Development | |
| 131,111 | |
| 105,717 | |
| 28,120 |
1-4 Family Residential | |
| 455,038 | |
| 446,959 | |
| 400,134 |
Non-Owner Occupied CRE | |
| 281,943 | |
| 243,564 | |
| 165,179 |
Owner Occupied CRE | |
| 163,042 | |
| 154,138 | |
| 127,968 |
Commercial and Industrial | |
| 146,031 | |
| 185,625 | |
| 128,457 |
Total loans held for investment | | | 1,534,185 | | | 1,507,484 | | | 996,559 |
Deferred (fees) costs and unamortized premiums/(unaccreted discounts), net | |
| (1,352) | |
| (1,408) | |
| 1,448 |
Gross loans | | $ | 1,532,833 | | $ | 1,506,076 | | $ | 998,007 |
Total mortgage loans held for sale | | $ | 161,843 | | $ | 89,872 | | $ | 48,312 |
| | | | | | | | | |
Deposit Portfolio | | | | | | | | | |
Money market deposit accounts | | $ | 847,430 | | $ | 805,634 | | $ | 615,575 |
Time deposits | |
| 172,682 | |
| 177,391 | |
| 134,913 |
Negotiable order of withdrawal accounts | |
| 113,052 | |
| 101,708 | |
| 91,921 |
Savings accounts | |
| 5,289 | |
| 5,976 | |
| 4,307 |
Total interest-bearing deposits | | | 1,138,453 | | | 1,090,709 | | | 846,716 |
Noninterest-bearing accounts | | | 481,457 | | | 472,963 | | | 240,068 |
Total deposits | | $ | 1,619,910 | | $ | 1,563,672 | | $ | 1,086,784 |
(1) Includes PPP loans.
11
First Western Financial, Inc.
Consolidated Financial Summary (unaudited) (continued)
| | As of and for the Three Months Ended |
| |||||||
| | December 31, | | September 30, | | December 31, |
| |||
(Dollars in thousands) |
| 2020 | | 2020 | | 2019 |
| |||
Average Balance Sheets |
| |
|
| |
|
| |
| |
Assets |
| |
|
| |
|
| |
| |
Interest-earning assets: |
| |
|
| |
|
| |
| |
Interest-bearing deposits in other financial institutions | | $ | 194,179 | | $ | 178,756 | | $ | 108,245 | |
Available-for-sale securities | |
| 37,512 | |
| 40,528 | |
| 58,745 | |
Loans | |
| 1,522,947 | |
| 1,462,872 | |
| 958,497 | |
Interest-earning assets | |
| 1,754,638 | |
| 1,682,156 | |
| 1,125,487 | |
Mortgage loans held for sale | |
| 120,554 | |
| 94,714 | |
| 59,813 | |
Total interest-earning assets, plus mortgage loans held for sale | |
| 1,875,192 | |
| 1,776,870 | |
| 1,185,300 | |
Allowance for loan losses | |
| (12,077) | |
| (10,965) | |
| (7,756) | |
Noninterest-earning assets | |
| 103,961 | |
| 101,874 | |
| 78,934 | |
Total assets | | $ | 1,967,076 | | $ | 1,867,779 | | $ | 1,256,478 | |
| | | | | | | | | | |
Liabilities and Shareholders’ Equity | |
|
| |
|
| |
|
| |
Interest-bearing liabilities: | |
|
| |
|
| |
|
| |
Interest-bearing deposits | | $ | 1,094,317 | | $ | 1,045,321 | | $ | 865,489 | |
Federal Home Loan Bank Topeka and Federal Reserve borrowings | |
| 192,448 | |
| 222,225 | |
| 10,000 | |
Subordinated notes | |
| 18,443 | |
| 14,445 | |
| 6,560 | |
Total interest-bearing liabilities | | | 1,305,208 | | | 1,281,991 | | | 882,049 | |
Noninterest-bearing liabilities: | |
|
| |
|
| |
|
| |
Noninterest-bearing deposits | |
| 483,115 | |
| 417,502 | |
| 226,948 | |
Other liabilities | |
| 24,311 | |
| 22,564 | |
| 19,912 | |
Total noninterest-bearing liabilities | | | 507,426 | | | 440,066 | | | 246,860 | |
Total shareholders’ equity | | | 154,442 | | | 145,722 | | | 127,569 | |
Total liabilities and shareholders’ equity | | $ | 1,967,076 | | $ | 1,867,779 | | $ | 1,256,478 | |
| | | | | | | | | | |
Yields (annualized) | |
|
| |
|
| |
|
| |
Interest-bearing deposits in other financial institutions | |
| 0.21 | % |
| 0.22 | % |
| 1.77 | % |
Available-for-sale securities | |
| 1.98 | |
| 1.71 | |
| 2.19 | |
Loans | |
| 3.85 | |
| 3.87 | |
| 4.40 | |
Interest-earning assets | |
| 3.41 | |
| 3.43 | |
| 4.03 | |
Mortgage loans held for sale | |
| 2.88 | |
| 2.72 | |
| 3.63 | |
Total interest-earning assets, plus mortgage loans held for sale | |
| 3.37 | |
| 3.39 | |
| 4.01 | |
Interest-bearing deposits | |
| 0.37 | |
| 0.41 | |
| 1.38 | |
Federal Home Loan Bank Topeka and Federal Reserve borrowings | |
| 0.42 | |
| 0.37 | |
| 1.96 | |
Subordinated notes | |
| 5.86 | |
| 6.12 | |
| 7.26 | |
Total interest-bearing liabilities | |
| 0.46 | |
| 0.47 | |
| 1.43 | |
Net interest margin | |
| 3.07 | |
| 3.07 | |
| 2.91 | |
Net interest rate spread | |
| 2.95 | % |
| 2.96 | % |
| 2.60 | % |
12
First Western Financial, Inc.
Consolidated Financial Summary (unaudited) (continued)
| | As of and for the Three Months Ended |
| |||||||
| | December 31, | | September 30, | | December 31, |
| |||
(Dollars in thousands, except share and per share amounts) |
| 2020 | | 2020 | | 2019 |
| |||
Asset Quality |
| |
|
| |
|
| |
| |
Non-performing loans | | $ | 4,058 | | $ | 9,881 | | $ | 12,270 | |
Non-performing assets | |
| 4,252 | |
| 10,439 | |
| 12,928 | |
Net charge-offs | | $ | 1 |
| $ | 5 | | $ | 248 | |
Non-performing loans to total loans | |
| 0.26 | % |
| 0.66 | % |
| 1.23 | % |
Non-performing assets to total assets | |
| 0.22 | |
| 0.53 | |
| 1.03 | |
Allowance for loan losses to non-performing loans | |
| 308.99 | |
| 119.88 | |
| 64.18 | |
Allowance for loan losses to total loans | |
| 0.82 | |
| 0.79 | |
| 0.79 | |
Allowance for loan losses to bank originated loans excluding PPP(1) | | | 0.98 | | | 1.00 | | | 0.79 | |
Net charge-offs to average loans | |
| 0.00 | % (2) |
| 0.00 | % (2) |
| 0.03 | % |
| | | | | | | | | | |
Assets Under Management | | $ | 6,255,336 | | $ | 6,131,179 | | $ | 6,187,707 | |
| | | | | | | | | | |
Market Data | | | | | | | | | | |
Book value per share at period end | | $ | 19.49 | | $ | 18.81 | | $ | 16.08 | |
Tangible book value per common share(1) | | $ | 16.44 | | $ | 15.38 | | $ | 13.15 | |
Weighted average outstanding shares, basic | | | 7,930,854 | | | 7,911,871 | | | 7,906,516 | |
Weighted average outstanding shares, diluted | | | 8,015,780 | | | 7,963,736 | | | 7,950,279 | |
Shares outstanding at period end | |
| 7,951,773 | |
| 7,951,749 | |
| 7,940,168 | |
| | | | | | | | | | |
Consolidated Capital | | | | | | | | | | |
Tier 1 capital to risk-weighted assets | |
| 9.96 | % |
| 9.88 | % | | 11.31 | % |
Common Equity Tier 1 (CET1) to risk-weighted assets | |
| 9.96 | |
| 9.88 | | | 11.31 | |
Total capital to risk-weighted assets | |
| 12.80 | |
| 12.03 | | | 12.87 | |
Tier 1 capital to average assets | |
| 7.45 | |
| 7.52 | | | 8.58 | |
| | | | | | | | | | |
Bank Capital | | | | | | | | | | |
Tier 1 capital to risk-weighted assets | |
| 10.22 | |
| 10.28 | | | 10.67 | |
Common Equity Tier 1 (CET1) to risk-weighted assets | |
| 10.22 | |
| 10.28 | | | 10.67 | |
Total capital to risk-weighted assets | |
| 11.20 | |
| 11.26 | | | 11.53 | |
Tier 1 capital to average assets | |
| 7.62 | % |
| 7.81 | % | | 8.09 | % |
(1) Represents a Non-GAAP financial measure. See “Reconciliation of Non-GAAP Measures” for a reconciliation of our Non-GAAP measures to the most directly comparable GAAP financial measure.
(2) Value results in an immaterial amount.
13
First Western Financial, Inc.
Consolidated Financial Summary (unaudited) (continued)
Reconciliations of Non-GAAP Financial Measures
|
| As of and for the Three Months Ended |
| |||||||
| | December 31, | | September 30, | | December 31, |
| |||
(Dollars in thousands, except share and per share amounts) | | 2020 | | 2020 | | 2019 |
| |||
Tangible Common |
| |
|
| |
|
| |
| |
Total shareholders' equity | | $ | 154,962 | | $ | 149,576 | | $ | 127,678 | |
Less: goodwill | |
| 24,191 | |
| 24,191 | |
| 19,686 | |
Less: intangibles held for sale(1) | |
| — | |
| 3,000 | |
| 3,553 | |
Less: other intangibles, net | |
| 67 | |
| 72 | |
| 28 | |
Tangible common equity | | $ | 130,704 | | $ | 122,313 | | $ | 104,411 | |
| | | | | | | | | | |
Common shares outstanding, end of period | |
| 7,951,773 | |
| 7,951,749 | |
| 7,940,168 | |
Tangible common book value per share | | $ | 16.44 | | $ | 15.38 | | $ | 13.15 | |
| | | | | | | | | | |
Net income available to common shareholders | | $ | 4,874 | | $ | 9,630 | | $ | 2,572 | |
Return on tangible common equity (annualized) | |
| 14.92 | % |
| 31.49 | % |
| 9.85 | % |
| | | | | | | | | | |
Efficiency | |
|
| |
|
| |
|
| |
Non-interest expense | | $ | 15,614 | | $ | 16,632 | | $ | 13,082 | |
Less: amortization | |
| 4 | |
| 4 | |
| 7 | |
Less: provision on other real estate owned | |
| 76 | |
| 100 | |
| — | |
Plus: Gain on sale of LA fixed income team | |
| (62) | |
| — | |
| — | |
Adjusted non-interest expense | | $ | 15,596 | | $ | 16,528 | | $ | 13,075 | |
| | | | | | | | | | |
Net interest income | | $ | 13,457 | | $ | 12,918 | | $ | 8,190 | |
Non-interest income | |
| 9,954 | |
| 18,032 | |
| 8,228 | |
Less: net gain on sale of securities | | | — | | | — | | | — | |
Less: net gain on sale of assets | | | — | | | — | | | 183 | |
Total income | | $ | 23,411 | | $ | 30,950 | | $ | 16,235 | |
Efficiency ratio | |
| 66.62 | % |
| 53.40 | % |
| 80.54 | % |
| | | | | | | | | | |
Gross Revenue | | | | | | | | | | |
Total income before non-interest expense | | $ | 22,716 | | $ | 29,454 | | $ | 15,971 | |
Less: net gain on sale of assets | | | — | | | — | | | 183 | |
Plus: provision for loan losses | |
| 695 | |
| 1,496 | |
| 447 | |
Gross revenue | | $ | 23,411 | | $ | 30,950 | | $ | 16,235 | |
| | | | | | | | | | |
Allowance to Bank Originated Loans Excluding PPP | | | | | | | | | | |
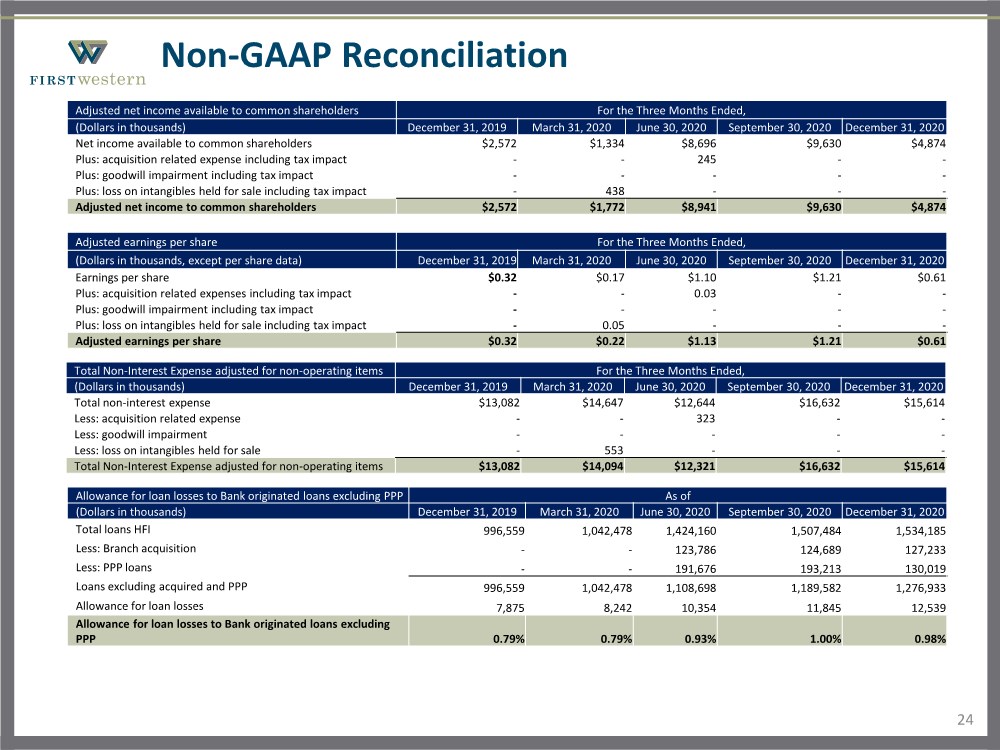
Total loans | | $ | 1,534,185 | | $ | 1,507,484 | | $ | 996,559 | |
Less: loans acquired | | | 127,233 | | | 124,689 | | | — | |
Less: bank originated PPP loans | |
| 130,019 | |
| 193,213 | |
| — | |
Bank originated loans excluding PPP | | $ | 1,276,933 | | $ | 1,189,582 | | $ | 996,559 | |
| | | | | | | | | | |
Allowance for loan losses | | $ | 12,539 | | $ | 11,845 | | $ | 7,875 | |
Allowance for loan losses to bank originated loans excluding PPP | | | 0.98 | % | | 1.00 | % | | 0.79 | % |
(1) Represents only the intangible portion of assets held for sale
14