cdxc-20221102
0001386570FALSE00013865702022-11-022022-11-02
UNITED STATES
SECURITIES AND EXCHANGE COMMISSION
WASHINGTON, D.C. 20549
FORM 8-K

CURRENT REPORT

Pursuant to Section 13 OR 15(d) of The Securities Exchange Act of 1934

Date of Report (Date of earliest event reported): November 2, 2022

CHROMADEX CORPORATION
(Exact name of registrant as specified in its charter)

Delaware001-3775226-2940963
(State or other jurisdiction of incorporation)(Commission File Number)(IRS Employer Identification No.)

10900 Wilshire Blvd. Suite 600, Los Angeles, California 90024
(Address of principal executive offices, including zip code)

(310) 388-6706
(Registrant's telephone number, including area code)

Check the appropriate box below if the Form 8-K filing is intended to simultaneously satisfy the filing obligation of the registrant under any of the following provisions:

Written communications pursuant to Rule 425 under the Securities Act (17 CFR 230.425)
Soliciting material pursuant to Rule 14a-12 under the Exchange Act (17 CFR 240.14a-12)
Pre-commencement communications pursuant to Rule 14d-2(b) under the Exchange Act (17 CFR 240.14d-2(b))
Pre-commencement communications pursuant to Rule 13e-4(c) under the Exchange Act (17 CFR 240.13e-4(c))

Securities registered pursuant to Section 12(b) of the Act:

Title of each class
Trading Symbol(s)
Name of each exchange on which registered
Common Stock, par value $0.001 per share
CDXC
The Nasdaq Capital Market

Indicate by check mark whether the registrant is an emerging growth company as defined in Rule 405 of the Securities Act of 1933 (§230.405 of this chapter) or Rule 12b-2 of the Securities Exchange Act of 1934 (§240.12b-2 of this chapter).

Emerging growth company

If an emerging growth company, indicate by check mark if the registrant has elected not to use the extended transition period for complying with any new or revised financial accounting standards provided pursuant to Section 13(a) of the Exchange Act. ☐


Item 2.02. Results of Operations and Financial Condition.

On November 2, 2022, ChromaDex Corporation (the “Company”) issued a press release announcing its earnings for the quarter ended September 30, 2022. A copy of the press release is attached hereto as Exhibit 99.1.

The information in this Item 2.02 and the exhibit hereto are being furnished and shall not be deemed to be “filed” for purposes of Section 18 of the Securities Exchange Act of 1934, as amended (the “Exchange Act”), or otherwise subject to the liability of that section, nor shall they be deemed incorporated by reference in any filing under the Securities Act of 1933, as amended, (the “Securities Act”) or the Exchange Act, except as expressly set forth by specific reference in such filing.

Item 7.01. Regulation FD Disclosure.

On November 2, 2022, the Company released a corporate presentation which it made available on its website. A copy of the corporate presentation is attached hereto as Exhibit 99.2.

The information in this Item 7.01 and the exhibit hereto are being furnished and shall not be deemed to be “filed” for purposes of Section 18 of the Exchange Act, or otherwise subject to the liability of that section, nor shall they be deemed incorporated by reference in any filing under the Securities Act or the Exchange Act, except as expressly set forth by specific reference in such filing.

Item 9.01 Financial Statements and Exhibits.

(d) Exhibits.

Exhibit
Number
Description
Press Release dated November 2, 2022
104Cover Page Interactive Data File (embedded within the Inline XBRL document)


SIGNATURES

Pursuant to the requirements of the Securities Exchange Act of 1934, the registrant has duly caused this report to be signed on its behalf by the undersigned hereunto duly authorized.

CHROMADEX CORPORATION
Dated: November 2, 2022
By:/s/ BRIANNA L. GERBER
Brianna L. Gerber
SVP, Finance / Interim Chief Financial Officer
(principal financial officer and duly authorized on behalf of the registrant)


cdx_logoxhorizontal-lrga.jpg
ChromaDex Corporation Reports Third Quarter 2022 Financial Results
Total net sales of $17.1 million, with gross margin of 59.8%, lower operating expenses, and a net loss and Adjusted EBITDA loss of only $1.0 million and $1.2 million, respectively, for the three months ended September 30, 2022.
 
LOS ANGELES, CA - November 2, 2022 - ChromaDex Corp. (NASDAQ:CDXC) today announced financial results for the third quarter of 2022.
     
Third Quarter 2022 and Recent Highlights
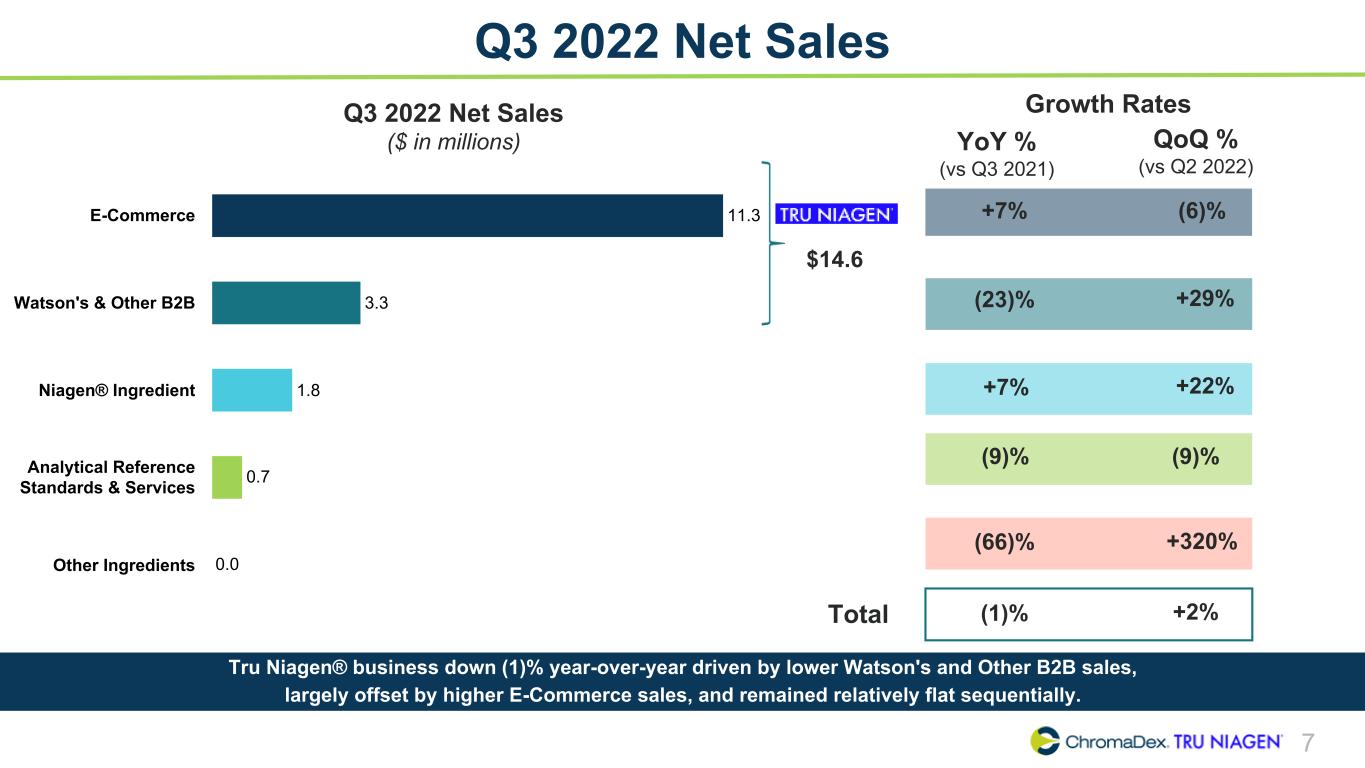
Total net sales were $17.1 million, with $14.6 million from Tru Niagen®, down (1)% each from the prior year quarter.
Strong gross margin of 59.8% in the face of inflationary pressures in global supply chains.
Selling and marketing expense as a percentage of net sales improved 730 basis points from the prior year quarter.
General and administrative expense decreased $5.0 million from the prior year quarter driven by lower legal expense.
Net loss was $1.0 million or $(0.01) per share, an improvement of $0.12 per share from the prior year quarter.
Net loss, excluding the one-time Employee Retention Tax Credit recognition of $2.1 million ($0.03 per share), was $3.1 million, or $(0.04) per share, an improvement of $0.09 per share from the prior year quarter.
Adjusted EBITDA including total legal expense, a non-GAAP measure, was a loss of $1.2 million, a $5.1 million improvement from the prior year quarter and approaching break-even.
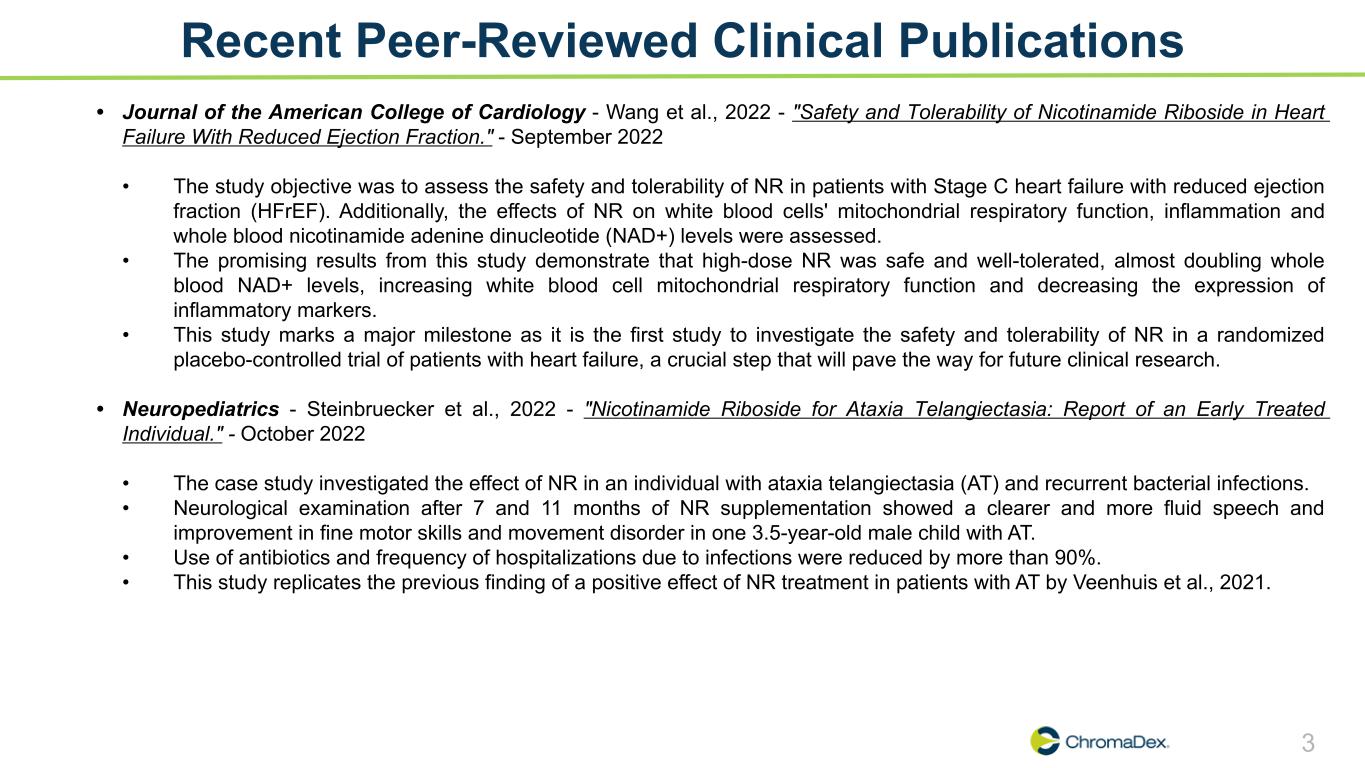
Clinical study published in October 2022 in the JACC(1) finds Niagen® safe and well-tolerated in patients with heart failure, marking a milestone for future clinical research. The study further found that Niagen® almost doubled whole blood NAD+ levels, increasing white blood cell mitochondrial respiratory function and decreasing the expression of inflammatory markers.
Signed JV to pursue Blue Hat approval for Tru Niagen® in Mainland China, and Sinopharm Xingsha debuted Tru Niagen® at China International Natural Health & Nutrition Expo (NHNE), a major trade show.
Signed long-term supply agreement with Nestlé Health Science, extending non-exclusive rights to sell Niagen® in multi-ingredient dietary supplements. Includes initial purchase commitment of approximately $2.0 million in 2022.
In October, raised $7.7 million, net of offering costs, with Nestlé Health Science and existing strategic investors.

“We approached cash flow break even in the third quarter and remain on track to achieve this important objective next quarter,” said ChromaDex CEO, Rob Fried. “We finalized key strategic partnerships in China and signed a long-term supply agreement with Nestlé Health Science. Our position as the world's leading NAD+ company is solid, supported by our strong and growing patent portfolio, our globally trusted consumer brand, Tru Niagen®, and our pipeline of future innovations.”


(1) Journal of the American College of Cardiology: Basic to Translational Science

cdx_logoxsymbolonlya.jpg    


Results of operations for the three months ended September 30, 2022 compared to the prior year quarter
For the three months ended September 30, 2022 (“Q3 2022”), ChromaDex reported net sales of $17.1 million, a decrease of $0.2 million or (1)% compared to the third quarter of 2021 (“Q3 2021”). The slight decline in Q3 2022 revenues compared to Q3 2021 was primarily attributable to lower business-to-business sales of Tru Niagen® as distributor partners continue to experience COVID-19 headwinds and other macroeconomic factors paired with lower demand for research and development services. Declines in net sales were partially offset by steady growth in e-commerce sales of Tru Niagen®.
Gross margin percentage declined to 59.8% in Q3 2022 compared to 61.1% in Q3 2021 primarily due to increases in supply chain headcount, including higher wages, and other inflationary pressures, partially offset by business mix.
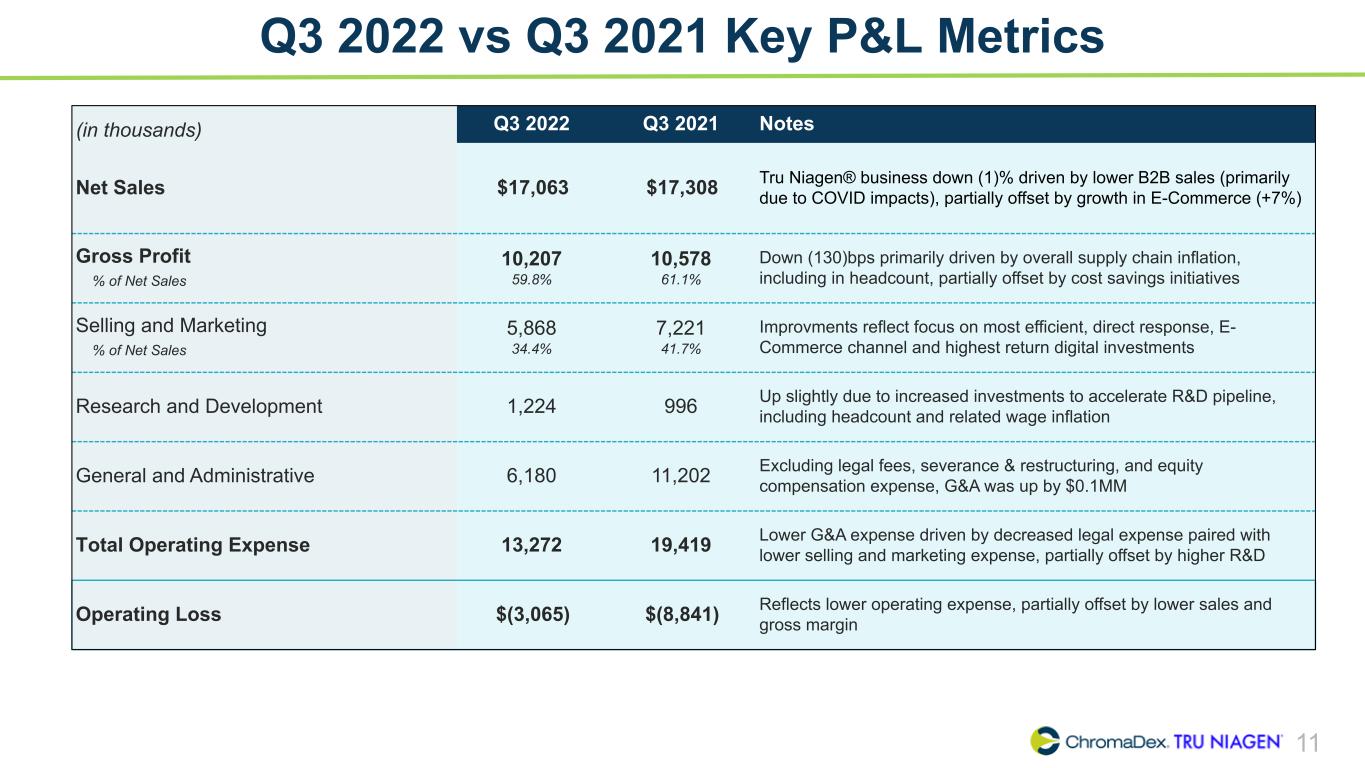
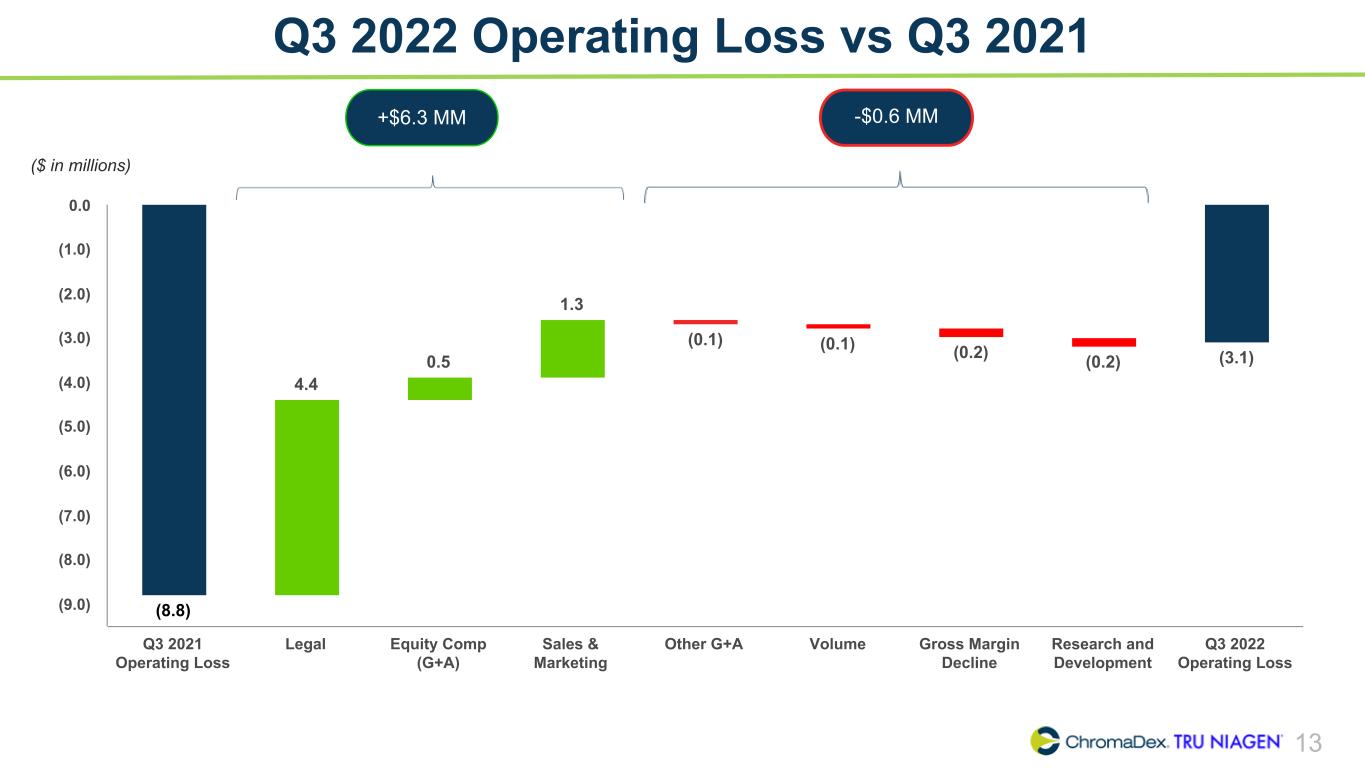
Operating expense decreased $6.1 million to $13.3 million in Q3 2022, compared to $19.4 million in Q3 2021. The decline in operating expense was largely attributable to a $5.0 million decrease in general and administrative expense paired with a $1.4 million decrease in selling and marketing expense. During Q3 2022, selling and marketing expense was scaled back to focus on the most efficient channels and investments, which drove a 730 basis point improvement in selling and marketing expense as a percentage of net sales, compared to Q3 2021. The decline in general and administrative expense was primarily driven by a $4.4 million decrease in legal expense.
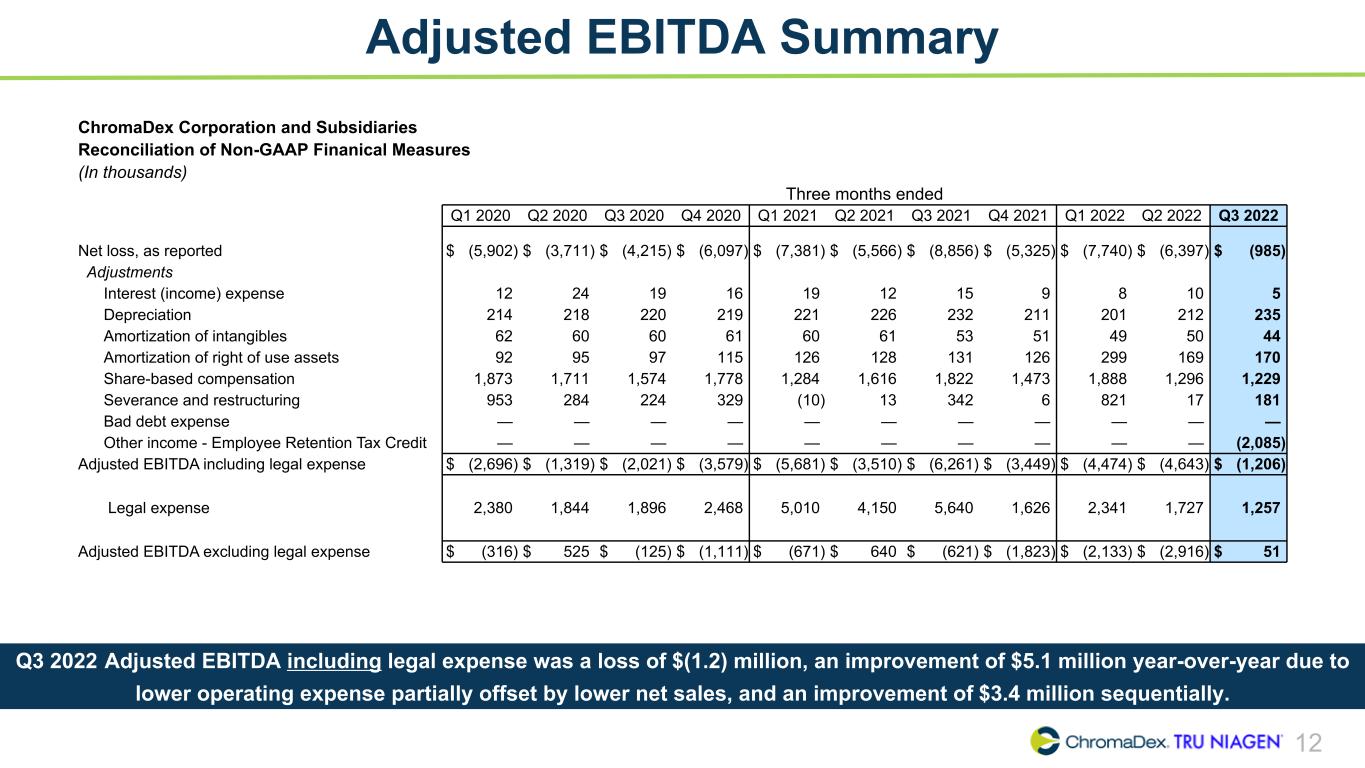
The net loss for Q3 2022 was $1.0 million or $(0.01) per share compared to a net loss of $8.8 million or $(0.13) per share for Q3 2021. Adjusted EBITDA including legal expense, a non-GAAP measure, was a loss of $1.2 million for Q3 2022, a $5.1 million improvement from Q3 2021. Adjusted EBITDA excluding legal expense, a non-GAAP measure, was a profit of $0.1 million for Q3 2022. See “Reconciliation of Non-GAAP Financial Measures” for a reconciliation of non-GAAP measures to net loss, the most directly comparable GAAP measure.
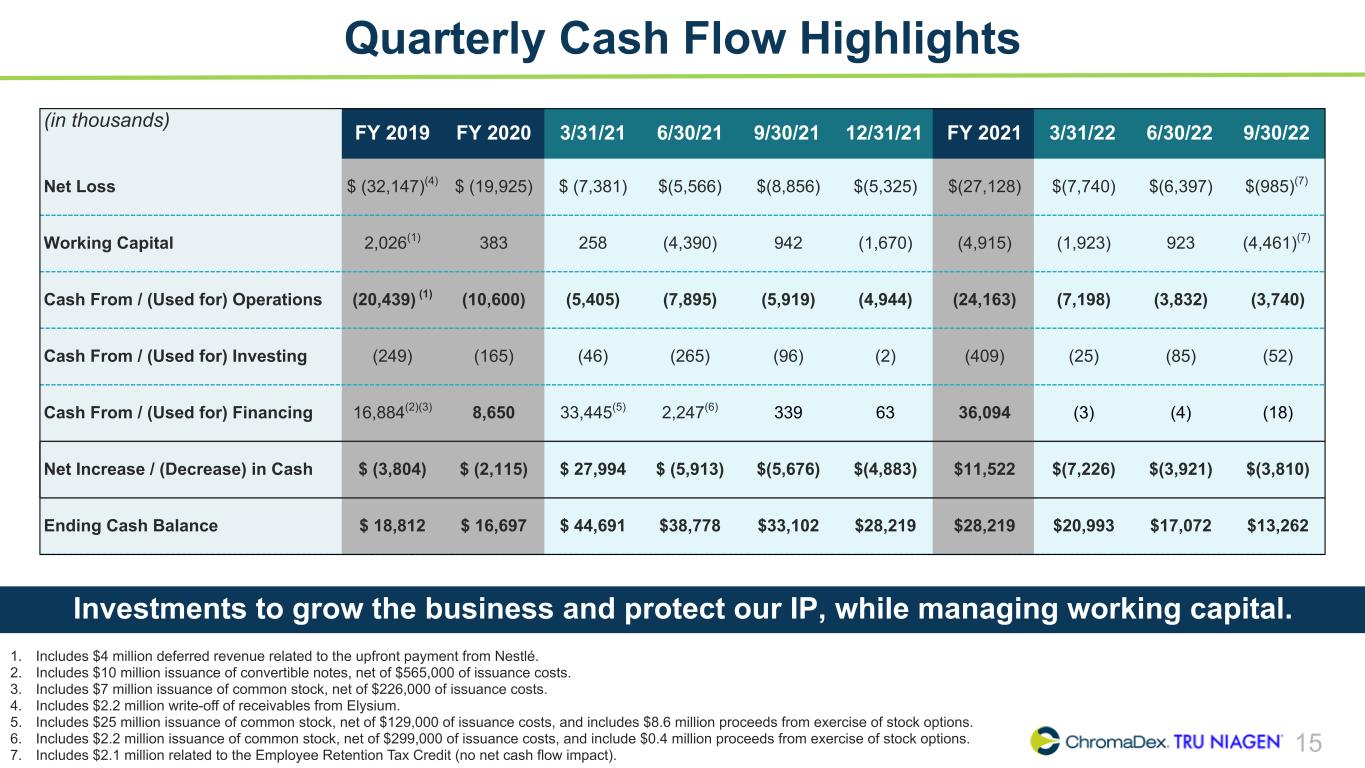
For Q3 2022, net cash outflow from operating activities was $3.7 million, compared to $5.9 million in Q3 2021 largely due to improvements in net loss of $4.6 million excluding other income from the Employee Retention Tax Credit which was partially offset by changes in working capital.

2022 Full Year Outlook
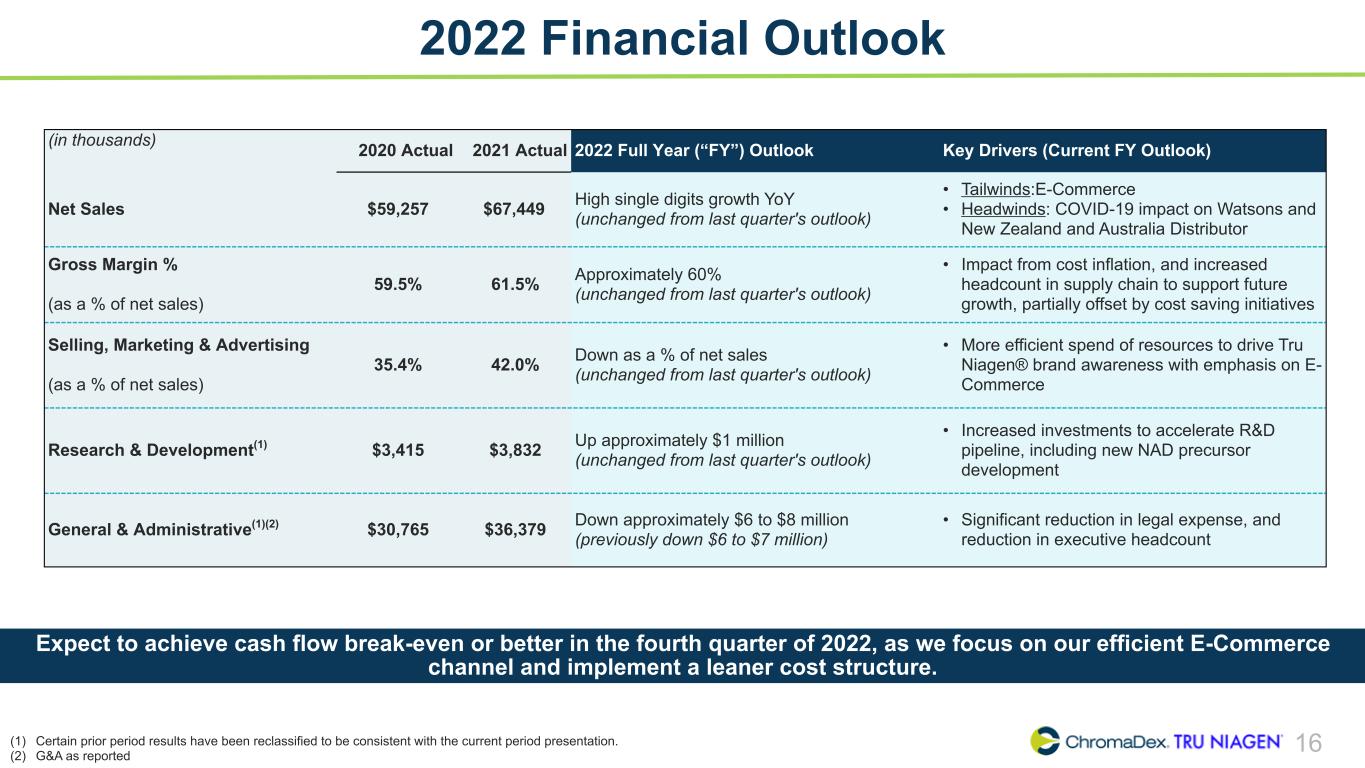
Looking forward, for the full year, the Company expects high single digit revenue growth, driven by its global e-commerce business and growth with partners. For the full year, the Company expects approximately 60% gross margin, lower selling and marketing expense as a percentage of net sales, approximately $1 million increase in R&D, and approximately $6 to $8 million decrease in general and administrative expense, as reported, driven by lower legal expense. The Company expects to be cash flow break-even or better in the fourth quarter of 2022. The Company considers Adjusted EBITDA including legal expense, a non-GAAP metric, to be a proxy for cash flow before working capital investments, and is targeting cash flow break-even on that basis.
Investor Conference Call
A live webcast will be held Wednesday, November 2, 2022 at 4:30 p.m. Eastern time (1:30 p.m. Pacific time) to discuss ChromaDex’s third-quarter financial results and provide a general business update.
To listen to the webcast, or to view the earnings press release and its accompanying financial exhibits, please visit the Investors Relations section of ChromaDex’s website at http://chromadex.com. The toll-free dial-in information for this call is 1-888-330-2446 with Conference ID: 4126168.
The webcast will be recorded, and will be available for replay via the website from 7:30 p.m. Eastern time on November 2, 2022 through 11:59 p.m. Eastern time on November 9, 2022. The replay of the call can also be accessed by dialing 800-770-2030, using the Replay ID: 4126168.


cdx_logoxsymbolonlya.jpg    


Important Note on Forward Looking Statements:
This release contains forward-looking statements within the meaning of Section 27A of the Securities Act of 1933, and Section 21E of the Securities Exchange Act of 1934. Statements that are not a description of historical facts constitute forward-looking statements and may often, but not always, be identified by the use of such words as “expects,” “anticipates,” “intends” “estimates,” “plans,” “potential,” “possible,” “probable,” “believes” “seeks,” “may,” “will,” “should,” “could,” “predicts,” “projects,” “continue,” “would” or the negative of such terms or other similar expressions. Forward-looking statements include statements regarding our intentions, beliefs, projections, outlook, analyses or current expectations concerning, among other things: the quotation from ChromaDex’s Chief Executive Officer, and statements related to the Company’s 2022 financial outlook including but not limited to revenue growth, gross margin, expenses, and investment plans. Risks that contribute to the uncertain nature of the forward-looking statements include: the impact of the COVID-19 pandemic on our business and the global economy; inflationary conditions and adverse economic conditions; our history of operating losses and need to obtain additional financing; the growth and profitability of our product sales; our ability to maintain sales, marketing and distribution capabilities; changing consumer perceptions of our products; our reliance on a single or limited number of third-party suppliers; risks of conducting business in China; and the risks and uncertainties associated with our business and financial condition in general, described in our filings with the Securities and Exchange Commission (SEC), including, without limitation, our most recent Annual Report on Form 10-K and Quarterly Report on Form 10-Q as filed with the SEC. Readers are cautioned not to place undue reliance on these forward-looking statements, which speak only as of the date hereof, and actual results may differ materially from those suggested by these forward-looking statements. All forward-looking statements are qualified in their entirety by this cautionary statement and ChromaDex undertakes no obligation to revise or update this release to reflect events or circumstances after the date hereof.
About ChromaDex:

ChromaDex Corporation is a global bioscience company dedicated to healthy aging. The ChromaDex team, which includes world-renowned scientists, is pioneering research on nicotinamide adenine dinucleotide (NAD+), an essential coenzyme that is a key regulator of cellular metabolism and is found in every cell of the human body. NAD+ levels in humans have been shown to decline with age, among other factors, and may be increased through supplementation with NAD+ precursors. ChromaDex is the innovator behind the NAD+ precursor nicotinamide riboside (NR), commercialized as the flagship ingredient Niagen®. Nicotinamide riboside and other NAD+ precursors are protected by ChromaDex’s patent portfolio.

The Company delivers Niagen® as the sole active ingredient in its consumer product Tru Niagen® available at www.truniagen.com and through partnerships with global retailers and distributors. The Company also develops and commercializes proprietary-based ingredient technologies and supplies these ingredients as raw materials to the manufacturers of consumer products. The Company further offers natural product fine chemicals, known as phytochemicals, and related research and development services. Follow us on Twitter @ChromaDex and Instagram @TruNiagen and subscribe to our latest news via our website accessible at www.chromadex.com to which ChromaDex regularly posts copies of its press releases as well as additional updates and financial information about the Company.
 
Contacts:
Investor RelationsMedia Relations
Thomas Shumaker Kendall Knysch
LifeSci Advisors, Managing Director
Director of Media Relations
1-917-929-7600310-388-6706 ext. 689
[email protected]


cdx_logoxsymbolonlya.jpg    


ChromaDex Corporation and Subsidiaries
Unaudited Condensed Consolidated Statements of Operations
(In thousands, except per share data)

 Three Months Ended September 30,Nine Months Ended September 30,
2022202120222021
Sales, net$17,063 $17,308 $51,054 $49,690 
Cost of sales6,8566,73020,27319,068
Gross profit10,20710,57830,78130,622
Operating expenses:        
Sales and marketing5,8687,22122,12619,711
Research and development1,2249963,5472,787
General and administrative6,18011,20222,29229,881
Total operating expenses13,27219,41947,96552,379
Operating loss(3,065)(8,841)(17,184)(21,757)
Other income, net - Employee Retention Tax Credit 2,0852,085
Interest expense, net(5)(15)(23)(46)
Net loss$(985)$(8,856)$(15,122)$(21,803)
Basic and diluted loss per share attributable to common stockholders: $(0.01)$(0.13)$(0.22)$(0.33)
Basic and diluted weighted average common shares outstanding68,34568,23668,33166,811


cdx_logoxsymbolonlya.jpg    


ChromaDex Corporation and Subsidiaries
Unaudited Condensed Consolidated Balance Sheets
(In thousands except par values, unless otherwise indicated)
 Sep 30, 2022Dec 31, 2021
Assets
Current assets:
Cash and cash equivalents, including restricted cash of $0.2 million as of both dates$13,262 $28,219 
Trade receivables, net of allowances of $51 and $65, respectively; Including receivables from Related Party of: $2.4 million and $2.1 million, respectively4,7445,226
Inventories15,63613,601
Prepaid expenses and other assets4,2591,859
Total current assets37,90148,905
Leasehold improvements and equipment, net2,7913,003
Intangible assets, net714857
Right-of-use assets3,7144,352
Other long-term assets545723
Total assets$45,665 $57,840 
Liabilities and Stockholders' Equity        
Current liabilities:        
Accounts payable$9,119 $10,423 
Accrued expenses6,7566,481
Current maturities of operating lease obligations684528
Current maturities of finance lease obligations1020
Customer deposits158161
Total current liabilities16,72717,613
Deferred revenue4,2284,346
Operating lease obligations, less current maturities3,6874,154
Total liabilities24,64226,113
Commitments and Contingencies        
Equity         
ChromaDex Corporation and subsidiaries stockholders' equity:
Common stock, $0.001 par value; authorized 150,000 shares; 68,169 shares and 68,126 shares issued and outstanding at September 30, 2022 and December 31, 2021, respectively6868
Additional paid-in capital205,027200,614
Accumulated deficit(184,075)(168,953)
Cumulative translation adjustments3(2)
Total stockholders’ equity
21,02331,727
Total liabilities and stockholders’ equity
$45,665 $57,840 


cdx_logoxsymbolonlya.jpg    


ChromaDex Corporation and Subsidiaries
Unaudited Reconciliation of Non-GAAP Financial Measures
(In thousands)
Reconciliation of Net Loss to Adjusted EBITDA including legal expense and Adjusted EBITDA excluding legal expense
Q3 2022Q2 2022Q1 2022Q4 2021Q3 2021
    
Net loss, as reported$(985)$(6,397)$(7,740)$(5,325)$(8,856)
Adjustments:
Interest expense, net5108915
Depreciation235212201211232
Amortization of intangibles4450495153
Amortization of right of use assets170169299126131
Share-based compensation1,2291,2961,8881,4731,822
Severance and restructuring181178216342
Other income - Employee Retention Tax Credit (2,085)— — — — 
Adjusted EBITDA including legal expense$(1,206)$(4,643)$(4,474)$(3,449)$(6,261)
Legal expense1,2571,7272,3411,6265,640
Adjusted EBITDA excluding legal expense$51 $(2,916)$(2,133)$(1,823)$(621)

Non-GAAP Financial Information:
To supplement ChromaDex’s unaudited financial data presented in accordance with generally accepted accounting principles (GAAP), the Company has presented Adjusted EBITDA including legal expense and Adjusted EBITDA excluding legal expense, both non-GAAP financial measures. ChromaDex believes the presentation of these non-GAAP financial measures provides important supplemental information to management and investors and enhances the overall understanding of the Company’s historical and current financial operating performance. The Company believes disclosure of non-GAAP financial measures has substance because the excluded expenses are infrequent in nature, are variable in nature or do not represent current cash expenditures. Further, these non-GAAP financial measures are among the indicators the Company uses as a basis for evaluating the Company’s financial performance as well as for planning and forecasting purposes. Accordingly, disclosure of these non-GAAP financial measures provides investors with the same information that management uses to understand the Company’s economic performance year-over-year.
Adjusted EBITDA including legal expense and Adjusted EBITDA excluding legal expense are defined as net income before (a) interest, (b) depreciation, (c) amortization, (d) non-cash share-based compensation costs, (e) severance and restructuring expense (f) Other income from the Employee Retention Tax Credit and (g) legal expense (in the case of Adjusted EBITDA excluding legal expenses only). While ChromaDex believes that these non-GAAP financial measures provide useful supplemental information to investors, there are limitations associated with the use of these measures. These measures are not prepared in accordance with GAAP and may not be directly comparable to similarly titled measures of other companies due to potential differences in the method of calculation. Management compensates for these limitations by relying primarily on the Company’s GAAP results and by using Adjusted EBITDA including legal expense and Adjusted EBITDA excluding expense only supplementally and by reviewing the reconciliation of the non-GAAP financial measure to its most comparable GAAP financial measure.
Non-GAAP financial measures are not in accordance with, or an alternative for, generally accepted accounting principles in the United States. The Company’s non-GAAP financial measures are not meant to be considered in isolation or as a substitute for comparable GAAP financial measures and should be read only in conjunction with the company’s consolidated financial statements prepared in accordance with GAAP.

cdx_logoxsymbolonlya.jpg    
ChromaDex Earnings Conference Call Third Quarter 2022 Rob Fried Chief Executive Officer Brianna Gerber SVP, Finance / Interim Chief Financial Officer Nasdaq: CDXC | November 2022


SAFE HARBOR STATEMENT This presentation and other written or oral statements made from time to time by representatives of ChromaDex contain “forward-looking statements” within the meaning of Section 27A of the Securities Act of 1933, as amended, and Section 21E of the Securities Exchange Act of 1934, as amended. Forward- looking statements reflect the current view about future events. Statements that are not historical in nature, such as 2022 financial outlook, and which may be identified by the use of words like “expects,” “anticipates,” “intends,” “estimates,” “plans,” “potential,” “possible,” “probable,” “believes,” “seeks,” “may,” “will,” “should,” “could,” “predicts,” “projects,” “continue,” “would” or the negative of these terms and other words of similar meaning, are forward-looking statements. Such statements include, but are not limited to, statements contained in this presentation relating to our expected sales, cash flows (including achieving cash flow break-even), planned investments, and financial performance, business, business strategy, expansion, growth, key drivers (including cost savings and increased investments), products and services we recently offered and their impact on our performance or products and services we may offer in the future and the timing of their development, sales and marketing strategy and capital outlook. Forward-looking statements are based on management’s current expectations and assumptions regarding our business, the economy and other future conditions and are subject to inherent risks, uncertainties and changes of circumstances that are difficult to predict and may cause actual results to differ materially from those contemplated or expressed. We caution you therefore against relying on any of these forward-looking statements. These risks and uncertainties include those risk factors discussed in Part I, “Item 1A. Risk Factors” of our Annual Report on Form 10-K for the year ended December 31, 2021, filed with the Securities Exchange Commission (the “Commission”), and in subsequent filings with the Commission. Any forward-looking statements are qualified in their entirety by reference to the factors discussed in these filings with the Commission. Should one or more of these risks or uncertainties materialize, or should the underlying assumptions prove incorrect, actual results may differ significantly from those anticipated, believed, estimated, expected, intended or planned. Important factors that could cause actual results to differ materially from those in the forward looking statements include but are not limited to: the impact of the COVID-19 pandemic on our business and operations, as well as the business or operations of our suppliers, customers, manufacturers, research partners and other third parties with whom we conduct business; our relationships with major customers; our ability to maintain our sales, marketing, and distribution capabilities; inflationary conditions and adverse economic conditions nationally and internationally; the market and size of the vitamin mineral and dietary supplement market; decreased demand for our products and services; market acceptance of our products; the ability to protect our intellectual property rights; impact of any litigation or infringement actions brought against us; competition from other providers and products; risks of conducting business in China; risks in product development; our reliance on of a limited number of third-party party suppliers for certain raw materials; inability to raise capital to fund continuing operations; changes in government regulation; the ability to complete customer transactions and capital raising transactions, and other factors relating to our industry, our operations and results of operations. Factors or events that could cause our actual results to differ may emerge from time to time, and it is not possible for us to predict all of them. We cannot guarantee future results, levels of activity, performance or achievements. Except as required by applicable law, including the securities laws of the United States, we do not intend to update any of the forward-looking statements to conform these statements to actual results. About Non-GAAP Financial Measures ChromaDex’s non-GAAP financial measures, Adjusted EBITDA including legal expense and Adjusted EBITDA excluding legal expense, are defined as net income before interest, depreciation, amortization, non-cash share-based compensation costs, severance and restructuring expense, other income from the Employee Retention Tax Credit and legal expense (in the case of Adjusted EBITDA excluding legal expenses only). ChromaDex used these non-GAAP measures when evaluating its financial results as well as for internal resource management, planning and forecasting purposes. These non-GAAP measures should not be viewed in isolation from or as a substitute for ChromaDex’s financial results in accordance with GAAP. Reconciliation of these non-GAAP measures to the most directly comparable GAAP measures are attached to this presentation. FDA Disclaimer Statements made in this presentation have not been evaluated by the Food and Drug Administration. ChromaDex products are not intended to diagnose, treat, cure, or prevent any disease. The statements in this presentation are for investor relations and educational purposes only and not intended for consumers or vendors. SAFE HARBOR STATEMENT 2

 
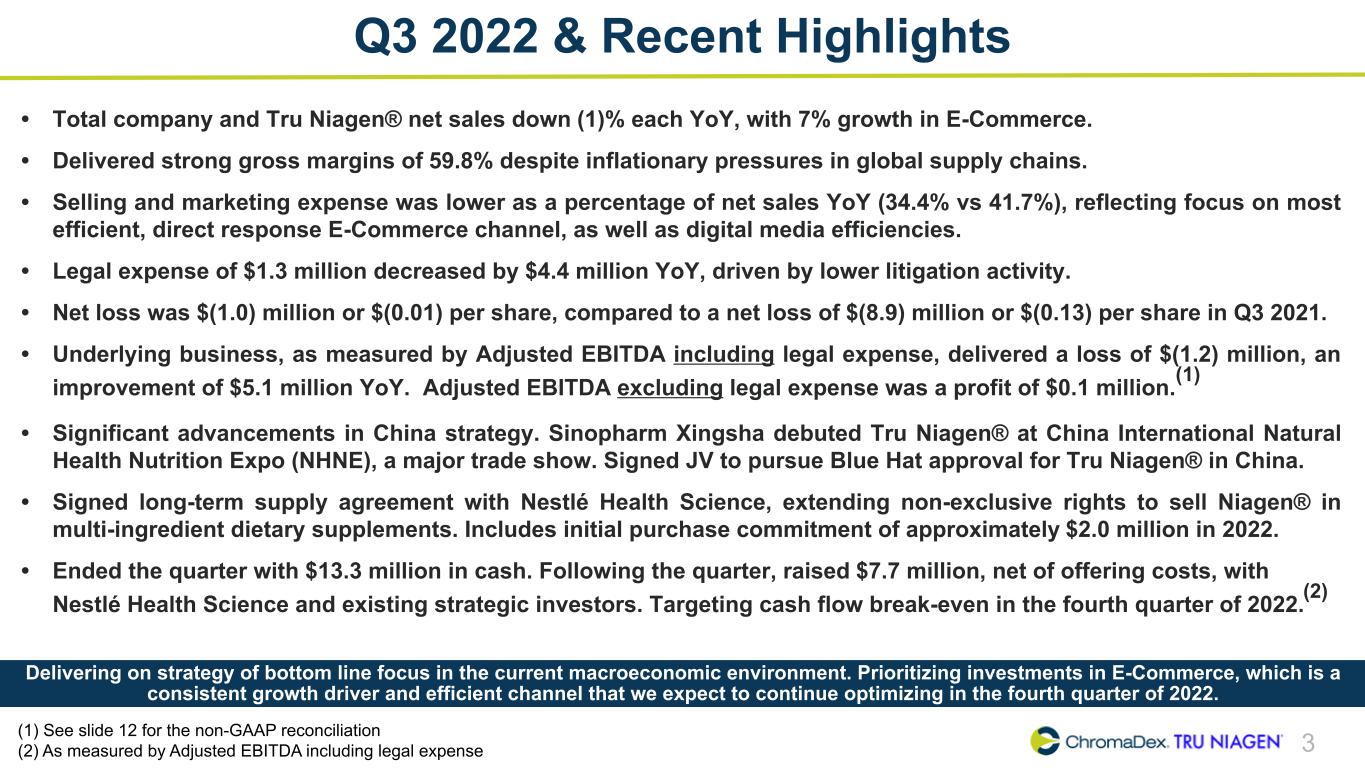
3 Q3 2022 & Recent Highlights • Total company and Tru Niagen® net sales down (1)% each YoY, with 7% growth in E-Commerce. • Delivered strong gross margins of 59.8% despite inflationary pressures in global supply chains. • Selling and marketing expense was lower as a percentage of net sales YoY (34.4% vs 41.7%), reflecting focus on most efficient, direct response E-Commerce channel, as well as digital media efficiencies. • Legal expense of $1.3 million decreased by $4.4 million YoY, driven by lower litigation activity. • Net loss was $(1.0) million or $(0.01) per share, compared to a net loss of $(8.9) million or $(0.13) per share in Q3 2021. • Underlying business, as measured by Adjusted EBITDA including legal expense, delivered a loss of $(1.2) million, an improvement of $5.1 million YoY. Adjusted EBITDA excluding legal expense was a profit of $0.1 million.(1) • Significant advancements in China strategy. Sinopharm Xingsha debuted Tru Niagen® at China International Natural Health Nutrition Expo (NHNE), a major trade show. Signed JV to pursue Blue Hat approval for Tru Niagen® in China. • Signed long-term supply agreement with Nestlé Health Science, extending non-exclusive rights to sell Niagen® in multi-ingredient dietary supplements. Includes initial purchase commitment of approximately $2.0 million in 2022. • Ended the quarter with $13.3 million in cash. Following the quarter, raised $7.7 million, net of offering costs, with Nestlé Health Science and existing strategic investors. Targeting cash flow break-even in the fourth quarter of 2022.(2) Delivering on strategy of bottom line focus in the current macroeconomic environment. Prioritizing investments in E-Commerce, which is a consistent growth driver and efficient channel that we expect to continue optimizing in the fourth quarter of 2022. (1) See slide 12 for the non-GAAP reconciliation (2) As measured by Adjusted EBITDA including legal expense


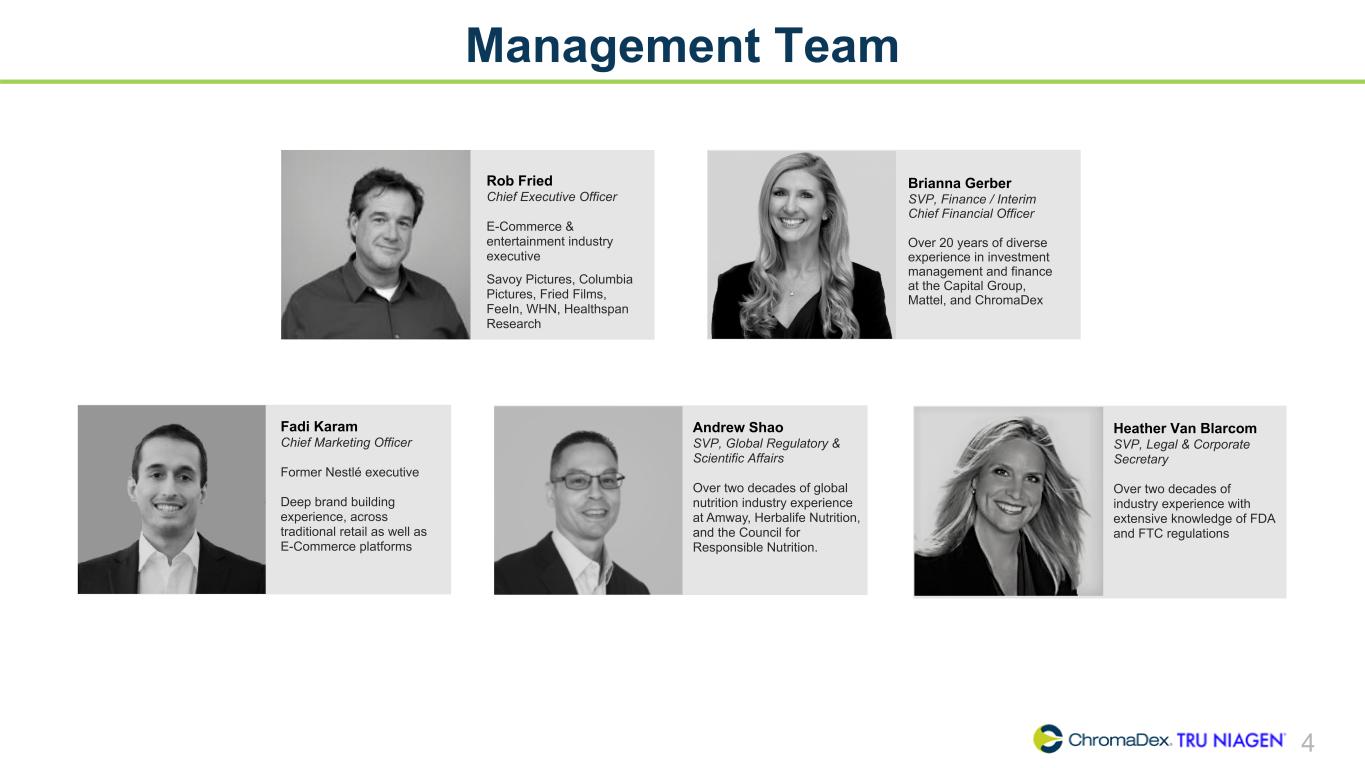
Management Team Rob Fried Chief Executive Officer E-Commerce & entertainment industry executive Savoy Pictures, Columbia Pictures, Fried Films, FeeIn, WHN, Healthspan Research Fadi Karam Chief Marketing Officer Former Nestlé executive Deep brand building experience, across traditional retail as well as E-Commerce platforms 4 Brianna Gerber SVP, Finance / Interim Chief Financial Officer Over 20 years of diverse experience in investment management and finance at the Capital Group, Mattel, and ChromaDex Heather Van Blarcom SVP, Legal & Corporate Secretary Over two decades of industry experience with extensive knowledge of FDA and FTC regulations Andrew Shao SVP, Global Regulatory & Scientific Affairs Over two decades of global nutrition industry experience at Amway, Herbalife Nutrition, and the Council for Responsible Nutrition.


The information contained in this documents is confidential, privileged and only for the information of the intended recipient and may not be used, published or redistributed without the prior written consent (2019) 5 Financial Highlights


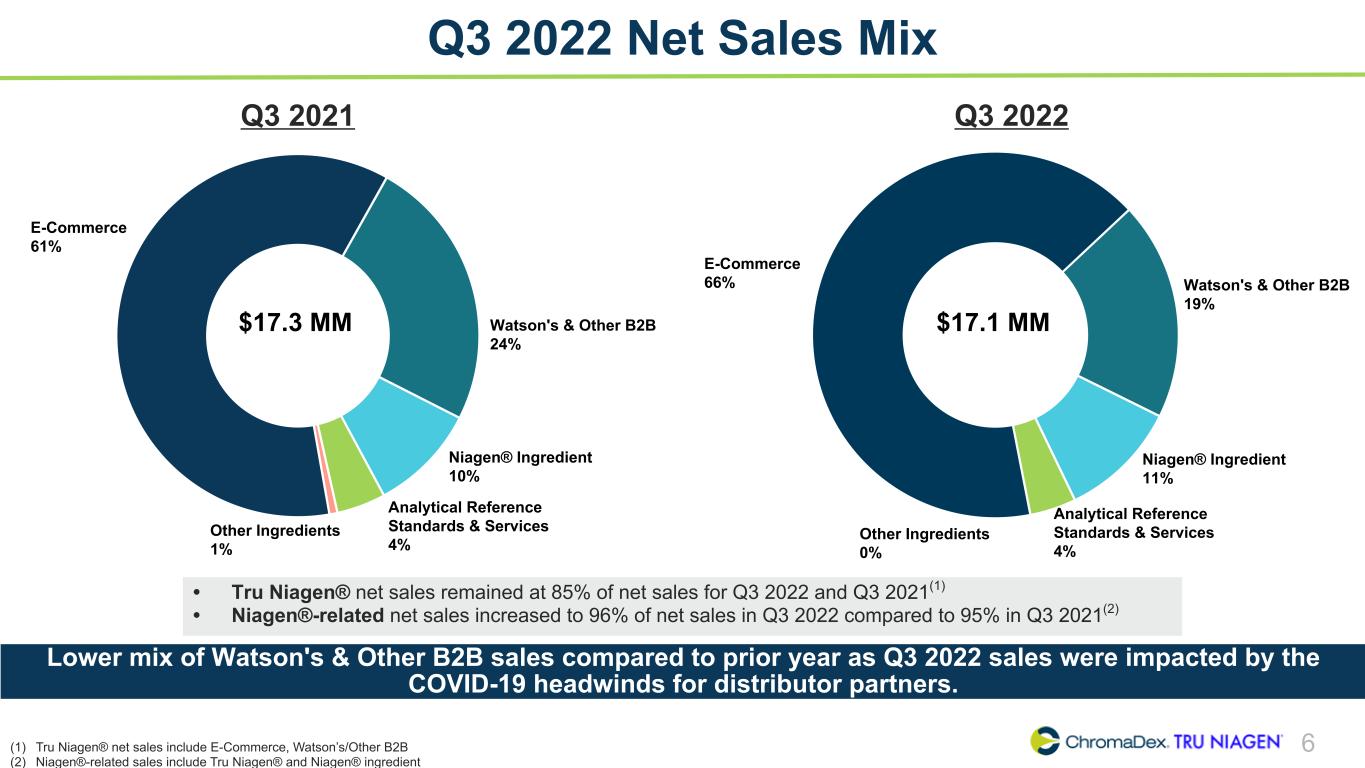
6 Q3 2022 Net Sales Mix E-Commerce 61% Watson's & Other B2B 24% Niagen® Ingredient 10% Analytical Reference Standards & Services 4% Other Ingredients 1% Q3 2021 $17.3 MM E-Commerce 66% Watson's & Other B2B 19% Niagen® Ingredient 11% Analytical Reference Standards & Services 4% Other Ingredients 0% $17.1 MM Q3 2022 • Tru Niagen® net sales remained at 85% of net sales for Q3 2022 and Q3 2021(1) • Niagen®-related net sales increased to 96% of net sales in Q3 2022 compared to 95% in Q3 2021(2) Lower mix of Watson's & Other B2B sales compared to prior year as Q3 2022 sales were impacted by the COVID-19 headwinds for distributor partners. (1) Tru Niagen® net sales include E-Commerce, Watson’s/Other B2B (2) Niagen®-related sales include Tru Niagen® and Niagen® ingredient


7 Q3 2022 Net Sales Q3 2022 Net Sales ($ in millions) 11.3 3.3 1.8 0.7 0.0 E-Commerce Watson's & Other B2B Niagen® Ingredient Analytical Reference Standards & Services Other Ingredients $14.6 Growth Rates YoY % (vs Q3 2021) QoQ % (vs Q2 2022) +7% (6)% (23)% +29% +7% +22% (9)% (9)% (66)% +320% (1)% +2% Tru Niagen® business down (1)% year-over-year driven by lower Watson's and Other B2B sales, largely offset by higher E-Commerce sales, and remained relatively flat sequentially. Total


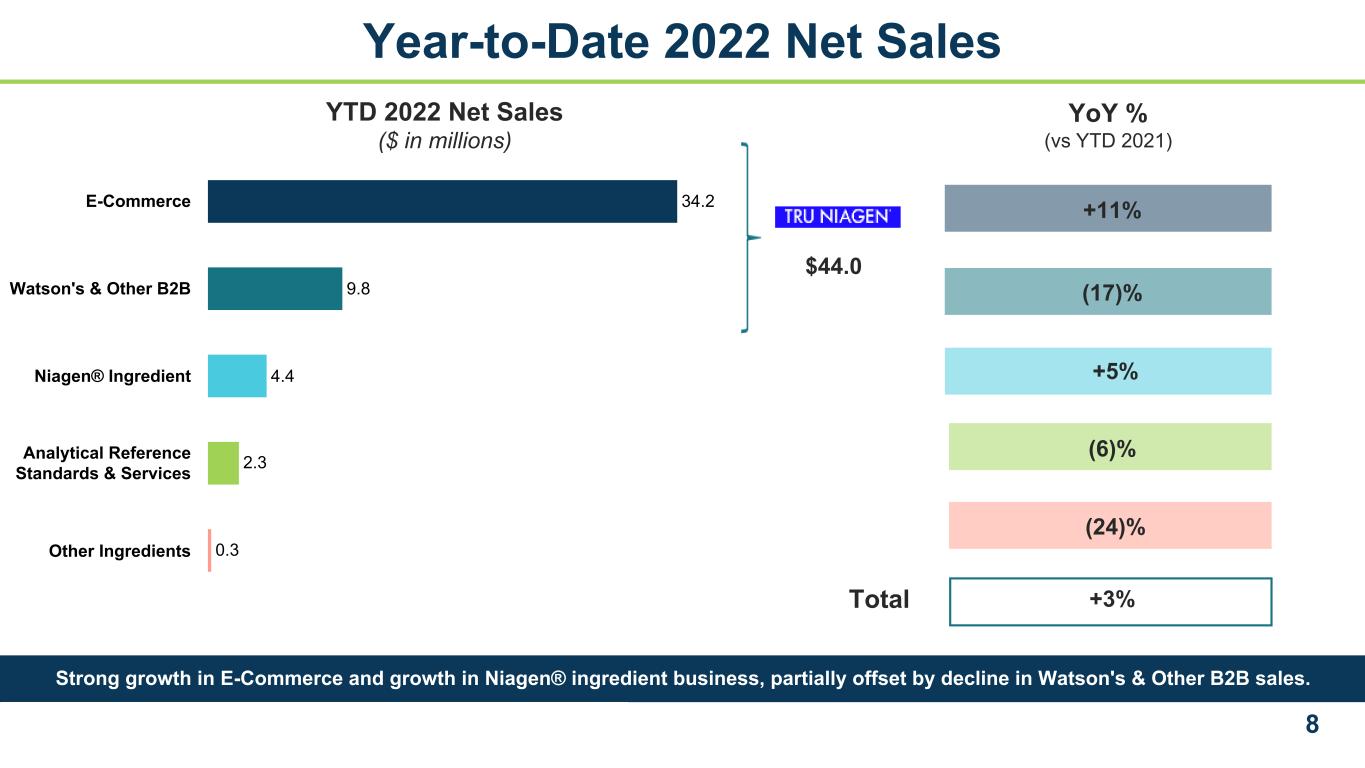
8 YTD 2022 Net Sales ($ in millions) Total Strong growth in E-Commerce and growth in Niagen® ingredient business, partially offset by decline in Watson's & Other B2B sales. Year-to-Date 2022 Net Sales +3% +11% (17)% +5% (6)% (24)% YoY % (vs YTD 2021) $44.0 34.2 9.8 4.4 2.3 0.3 E-Commerce Watson's & Other B2B Niagen® Ingredient Analytical Reference Standards & Services Other Ingredients


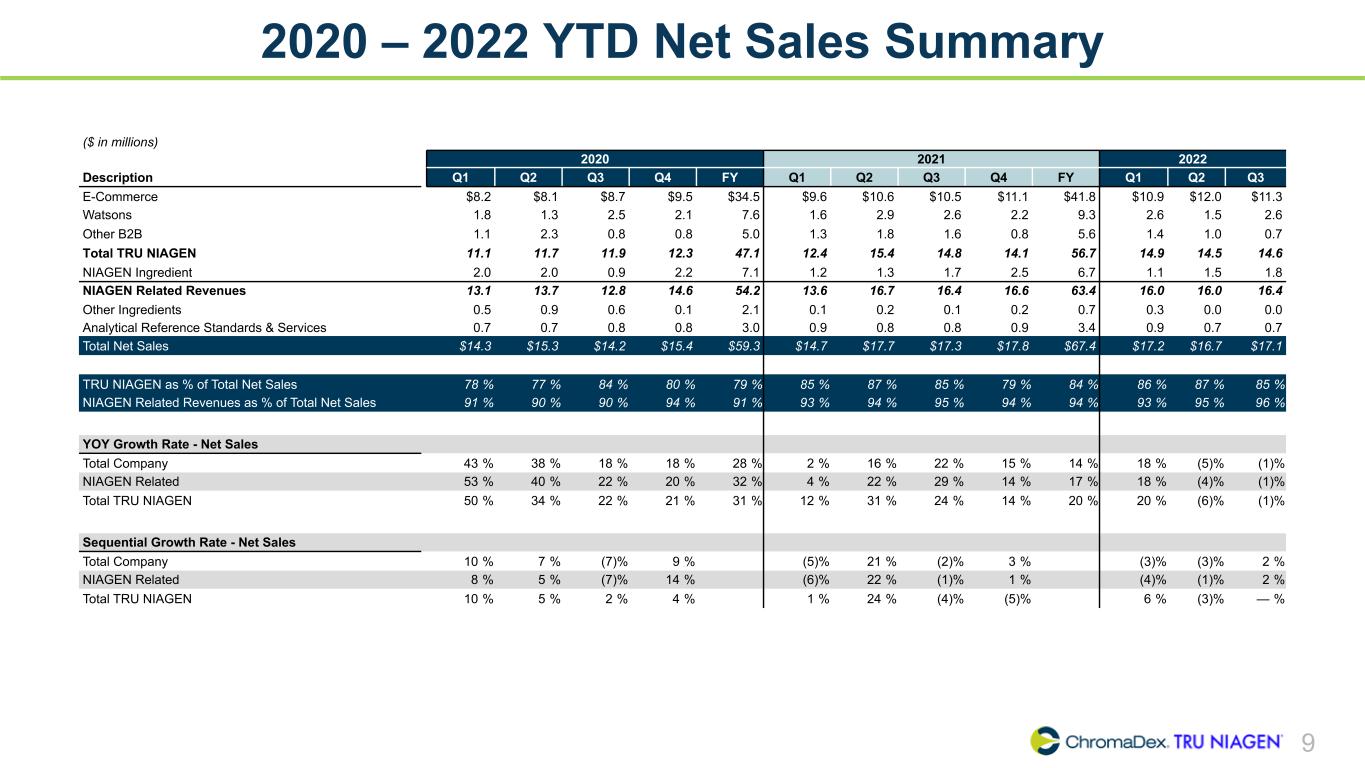
9 2020 – 2022 YTD Net Sales Summary ($ in millions) 2020 2021 2022 Description Q1 Q2 Q3 Q4 FY Q1 Q2 Q3 Q4 FY Q1 Q2 Q3 E-Commerce $8.2 $8.1 $8.7 $9.5 $34.5 $9.6 $10.6 $10.5 $11.1 $41.8 $10.9 $12.0 $11.3 Watsons 1.8 1.3 2.5 2.1 7.6 1.6 2.9 2.6 2.2 9.3 2.6 1.5 2.6 Other B2B 1.1 2.3 0.8 0.8 5.0 1.3 1.8 1.6 0.8 5.6 1.4 1.0 0.7 Total TRU NIAGEN 11.1 11.7 11.9 12.3 47.1 12.4 15.4 14.8 14.1 56.7 14.9 14.5 14.6 NIAGEN Ingredient 2.0 2.0 0.9 2.2 7.1 1.2 1.3 1.7 2.5 6.7 1.1 1.5 1.8 NIAGEN Related Revenues 13.1 13.7 12.8 14.6 54.2 13.6 16.7 16.4 16.6 63.4 16.0 16.0 16.4 Other Ingredients 0.5 0.9 0.6 0.1 2.1 0.1 0.2 0.1 0.2 0.7 0.3 0.0 0.0 Analytical Reference Standards & Services 0.7 0.7 0.8 0.8 3.0 0.9 0.8 0.8 0.9 3.4 0.9 0.7 0.7 Total Net Sales $14.3 $15.3 $14.2 $15.4 $59.3 $14.7 $17.7 $17.3 $17.8 $67.4 $17.2 $16.7 $17.1 TRU NIAGEN as % of Total Net Sales 78 % 77 % 84 % 80 % 79 % 85 % 87 % 85 % 79 % 84 % 86 % 87 % 85 % NIAGEN Related Revenues as % of Total Net Sales 91 % 90 % 90 % 94 % 91 % 93 % 94 % 95 % 94 % 94 % 93 % 95 % 96 % YOY Growth Rate - Net Sales Total Company 43 % 38 % 18 % 18 % 28 % 2 % 16 % 22 % 15 % 14 % 18 % (5) % (1) % NIAGEN Related 53 % 40 % 22 % 20 % 32 % 4 % 22 % 29 % 14 % 17 % 18 % (4) % (1) % Total TRU NIAGEN 50 % 34 % 22 % 21 % 31 % 12 % 31 % 24 % 14 % 20 % 20 % (6) % (1) % Sequential Growth Rate - Net Sales Total Company 10 % 7 % (7) % 9 % (5) % 21 % (2) % 3 % (3) % (3) % 2 % NIAGEN Related 8 % 5 % (7) % 14 % (6) % 22 % (1) % 1 % (4) % (1) % 2 % Total TRU NIAGEN 10 % 5 % 2 % 4 % 1 % 24 % (4) % (5) % 6 % (3) % — %


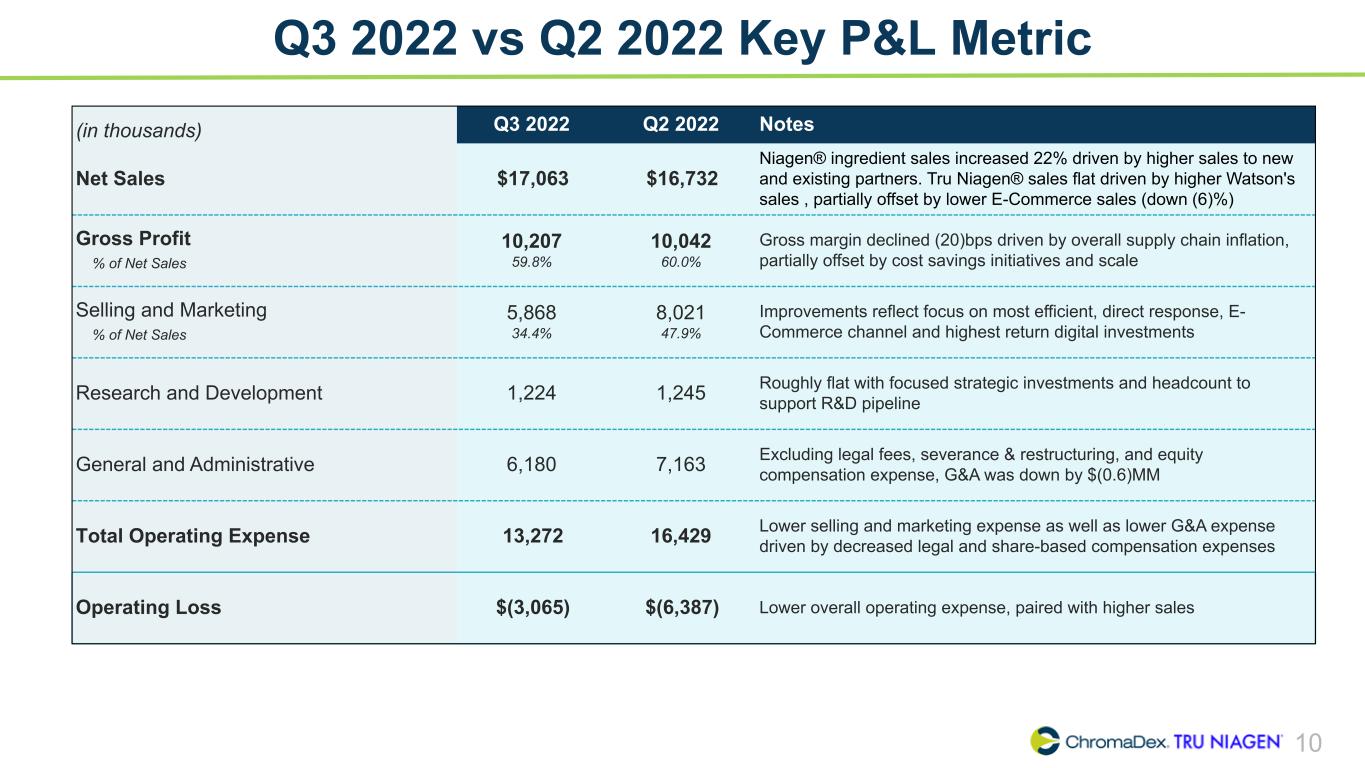
10 Q3 2022 vs Q2 2022 Key P&L Metric (in thousands) Q3 2022 Q2 2022 Notes Net Sales $17,063 $16,732 Niagen® ingredient sales increased 22% driven by higher sales to new and existing partners. Tru Niagen® sales flat driven by higher Watson's sales , partially offset by lower E-Commerce sales (down (6)%) Gross Profit % of Net Sales 10,207 59.8% 10,042 60.0% Gross margin declined (20)bps driven by overall supply chain inflation, partially offset by cost savings initiatives and scale Selling and Marketing % of Net Sales 5,868 34.4% 8,021 47.9% Improvements reflect focus on most efficient, direct response, E- Commerce channel and highest return digital investments Research and Development 1,224 1,245 Roughly flat with focused strategic investments and headcount to support R&D pipeline General and Administrative 6,180 7,163 Excluding legal fees, severance & restructuring, and equity compensation expense, G&A was down by $(0.6)MM Total Operating Expense 13,272 16,429 Lower selling and marketing expense as well as lower G&A expense driven by decreased legal and share-based compensation expenses Operating Loss $(3,065) $(6,387) Lower overall operating expense, paired with higher sales


11 Q3 2022 vs Q3 2021 Key P&L Metrics (in thousands) Q3 2022 Q3 2021 Notes Net Sales $17,063 $17,308 Tru Niagen® business down (1)% driven by lower B2B sales (primarily due to COVID impacts), partially offset by growth in E-Commerce (+7%) Gross Profit % of Net Sales 10,207 59.8% 10,578 61.1% Down (130)bps primarily driven by overall supply chain inflation, including in headcount, partially offset by cost savings initiatives Selling and Marketing % of Net Sales 5,868 34.4% 7,221 41.7% Improvments reflect focus on most efficient, direct response, E- Commerce channel and highest return digital investments Research and Development 1,224 996 Up slightly due to increased investments to accelerate R&D pipeline, including headcount and related wage inflation General and Administrative 6,180 11,202 Excluding legal fees, severance & restructuring, and equity compensation expense, G&A was up by $0.1MM Total Operating Expense 13,272 19,419 Lower G&A expense driven by decreased legal expense paired with lower selling and marketing expense, partially offset by higher R&D Operating Loss $(3,065) $(8,841) Reflects lower operating expense, partially offset by lower sales and gross margin


12 Adjusted EBITDA Summary ChromaDex Corporation and Subsidiaries Reconciliation of Non-GAAP Finanical Measures (In thousands) Three months ended Q1 2020 Q2 2020 Q3 2020 Q4 2020 Q1 2021 Q2 2021 Q3 2021 Q4 2021 Q1 2022 Q2 2022 Q3 2022 Net loss, as reported $ (5,902) $ (3,711) $ (4,215) $ (6,097) $ (7,381) $ (5,566) $ (8,856) $ (5,325) $ (7,740) $ (6,397) $ (985) Adjustments Interest (income) expense 12 24 19 16 19 12 15 9 8 10 5 Depreciation 214 218 220 219 221 226 232 211 201 212 235 Amortization of intangibles 62 60 60 61 60 61 53 51 49 50 44 Amortization of right of use assets 92 95 97 115 126 128 131 126 299 169 170 Share-based compensation 1,873 1,711 1,574 1,778 1,284 1,616 1,822 1,473 1,888 1,296 1,229 Severance and restructuring 953 284 224 329 (10) 13 342 6 821 17 181 Bad debt expense — — — — — — — — — — — Other income - Employee Retention Tax Credit — — — — — — — — — — (2,085) Adjusted EBITDA including legal expense $ (2,696) $ (1,319) $ (2,021) $ (3,579) $ (5,681) $ (3,510) $ (6,261) $ (3,449) $ (4,474) $ (4,643) $ (1,206) Legal expense 2,380 1,844 1,896 2,468 5,010 4,150 5,640 1,626 2,341 1,727 1,257 Adjusted EBITDA excluding legal expense $ (316) $ 525 $ (125) $ (1,111) $ (671) $ 640 $ (621) $ (1,823) $ (2,133) $ (2,916) $ 51 Q3 2022 Adjusted EBITDA including legal expense was a loss of $(1.2) million, an improvement of $5.1 million year-over-year due to lower operating expense partially offset by lower net sales, and an improvement of $3.4 million sequentially.


13 Q3 2022 Operating Loss vs Q3 2021 (8.8) 4.4 0.5 1.3 (0.1) (0.1) (0.2) (0.2) (3.1) Q3 2021 Operating Loss Legal Equity Comp (G+A) Sales & Marketing Other G+A Volume Gross Margin Decline Research and Development Q3 2022 Operating Loss (9.0) (8.0) (7.0) (6.0) (5.0) (4.0) (3.0) (2.0) (1.0) 0.0 -$0.6 MM+$6.3 MM ($ in millions)


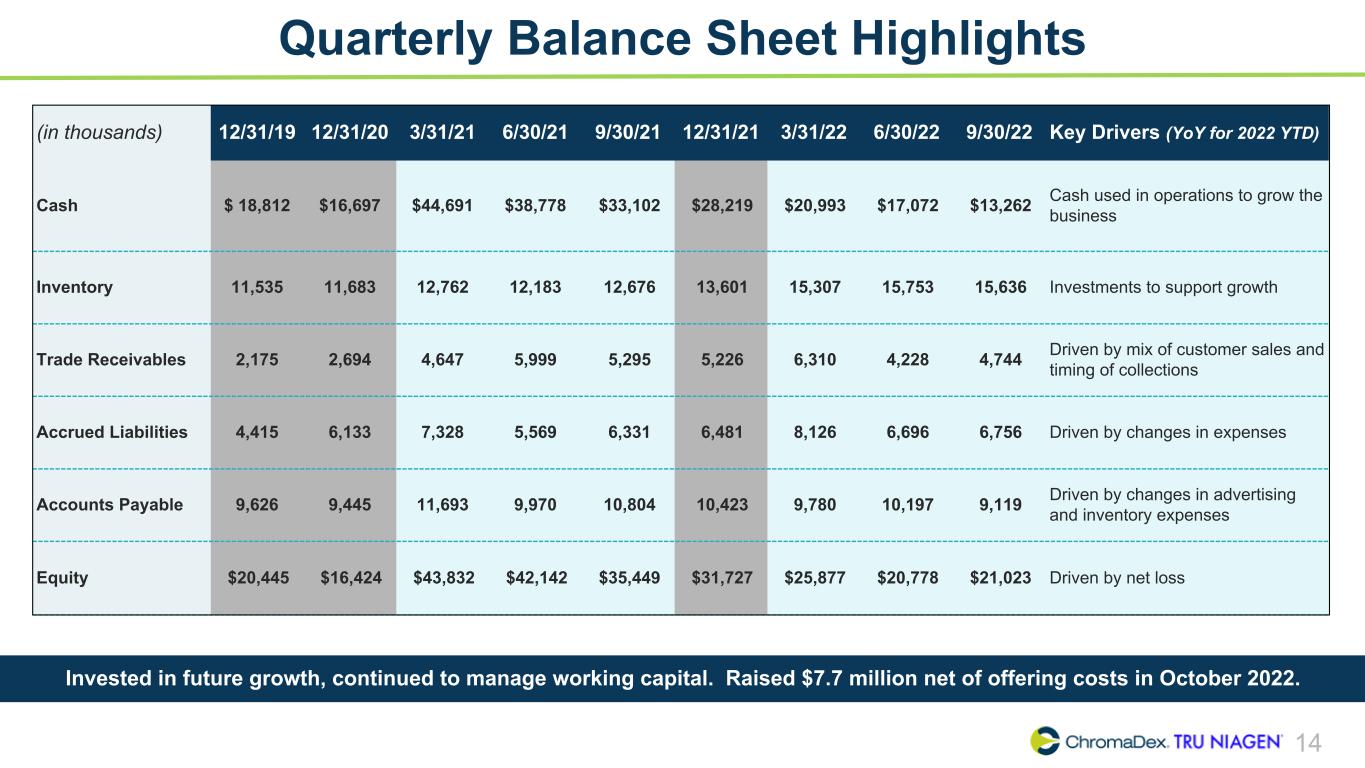
14 Quarterly Balance Sheet Highlights (in thousands) 12/31/19 12/31/20 3/31/21 6/30/21 9/30/21 12/31/21 3/31/22 6/30/22 9/30/22 Key Drivers (YoY for 2022 YTD) Cash $ 18,812 $16,697 $44,691 $38,778 $33,102 $28,219 $20,993 $17,072 $13,262 Cash used in operations to grow the business Inventory 11,535 11,683 12,762 12,183 12,676 13,601 15,307 15,753 15,636 Investments to support growth Trade Receivables 2,175 2,694 4,647 5,999 5,295 5,226 6,310 4,228 4,744 Driven by mix of customer sales and timing of collections Accrued Liabilities 4,415 6,133 7,328 5,569 6,331 6,481 8,126 6,696 6,756 Driven by changes in expenses Accounts Payable 9,626 9,445 11,693 9,970 10,804 10,423 9,780 10,197 9,119 Driven by changes in advertising and inventory expenses Equity $20,445 $16,424 $43,832 $42,142 $35,449 $31,727 $25,877 $20,778 $21,023 Driven by net loss Invested in future growth, continued to manage working capital. Raised $7.7 million net of offering costs in October 2022.


15 Quarterly Cash Flow Highlights (in thousands) FY 2019 FY 2020 3/31/21 6/30/21 9/30/21 12/31/21 FY 2021 3/31/22 6/30/22 9/30/22 Net Loss $ (32,147)(4) $ (19,925) $ (7,381) $(5,566) $(8,856) $(5,325) $(27,128) $(7,740) $(6,397) $(985)(7) Working Capital 2,026(1) 383 258 (4,390) 942 (1,670) (4,915) (1,923) 923 (4,461)(7) Cash From / (Used for) Operations (20,439) (1) (10,600) (5,405) (7,895) (5,919) (4,944) (24,163) (7,198) (3,832) (3,740) Cash From / (Used for) Investing (249) (165) (46) (265) (96) (2) (409) (25) (85) (52) Cash From / (Used for) Financing 16,884(2)(3) 8,650 33,445(5) 2,247(6) 339 63 36,094 (3) (4) (18) Net Increase / (Decrease) in Cash $ (3,804) $ (2,115) $ 27,994 $ (5,913) $(5,676) $(4,883) $11,522 $(7,226) $(3,921) $(3,810) Ending Cash Balance $ 18,812 $ 16,697 $ 44,691 $38,778 $33,102 $28,219 $28,219 $20,993 $17,072 $13,262 Investments to grow the business and protect our IP, while managing working capital. 1. Includes $4 million deferred revenue related to the upfront payment from Nestlé. 2. Includes $10 million issuance of convertible notes, net of $565,000 of issuance costs. 3. Includes $7 million issuance of common stock, net of $226,000 of issuance costs. 4. Includes $2.2 million write-off of receivables from Elysium. 5. Includes $25 million issuance of common stock, net of $129,000 of issuance costs, and includes $8.6 million proceeds from exercise of stock options. 6. Includes $2.2 million issuance of common stock, net of $299,000 of issuance costs, and include $0.4 million proceeds from exercise of stock options. 7. Includes $2.1 million related to the Employee Retention Tax Credit (no net cash flow impact).


16 2022 Financial Outlook (in thousands) 2020 Actual 2021 Actual 2022 Full Year (“FY”) Outlook Key Drivers (Current FY Outlook) Net Sales $59,257 $67,449 High single digits growth YoY (unchanged from last quarter's outlook) • Tailwinds:E-Commerce • Headwinds: COVID-19 impact on Watsons and New Zealand and Australia Distributor Gross Margin % (as a % of net sales) 59.5% 61.5% Approximately 60% (unchanged from last quarter's outlook) • Impact from cost inflation, and increased headcount in supply chain to support future growth, partially offset by cost saving initiatives Selling, Marketing & Advertising (as a % of net sales) 35.4% 42.0% Down as a % of net sales (unchanged from last quarter's outlook) • More efficient spend of resources to drive Tru Niagen® brand awareness with emphasis on E- Commerce Research & Development(1) $3,415 $3,832 Up approximately $1 million (unchanged from last quarter's outlook) • Increased investments to accelerate R&D pipeline, including new NAD precursor development General & Administrative(1)(2) $30,765 $36,379 Down approximately $6 to $8 million (previously down $6 to $7 million) • Significant reduction in legal expense, and reduction in executive headcount Expect to achieve cash flow break-even or better in the fourth quarter of 2022, as we focus on our efficient E-Commerce channel and implement a leaner cost structure. (1) Certain prior period results have been reclassified to be consistent with the current period presentation. (2) G&A as reported


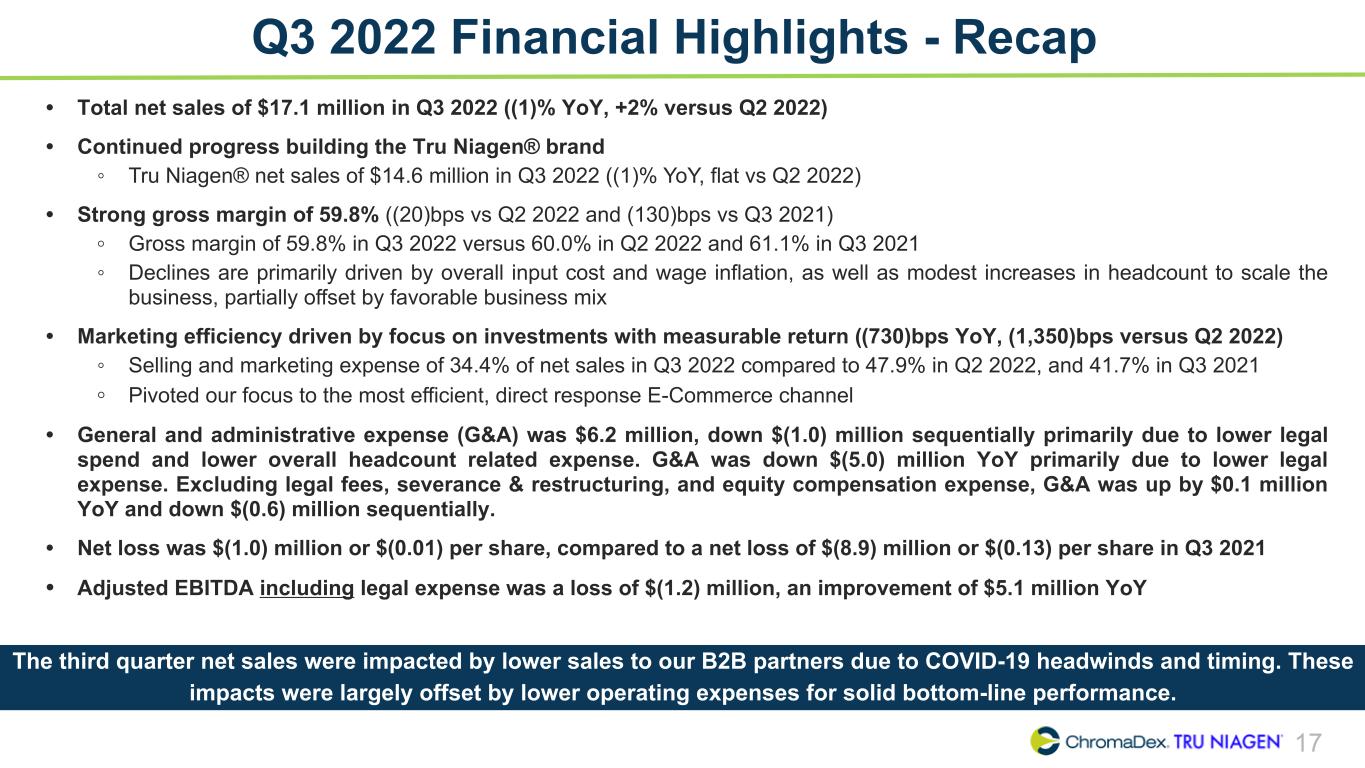
17 Q3 2022 Financial Highlights - Recap • Total net sales of $17.1 million in Q3 2022 ((1)% YoY, +2% versus Q2 2022) • Continued progress building the Tru Niagen® brand ◦ Tru Niagen® net sales of $14.6 million in Q3 2022 ((1)% YoY, flat vs Q2 2022) • Strong gross margin of 59.8% ((20)bps vs Q2 2022 and (130)bps vs Q3 2021) ◦ Gross margin of 59.8% in Q3 2022 versus 60.0% in Q2 2022 and 61.1% in Q3 2021 ◦ Declines are primarily driven by overall input cost and wage inflation, as well as modest increases in headcount to scale the business, partially offset by favorable business mix • Marketing efficiency driven by focus on investments with measurable return ((730)bps YoY, (1,350)bps versus Q2 2022) ◦ Selling and marketing expense of 34.4% of net sales in Q3 2022 compared to 47.9% in Q2 2022, and 41.7% in Q3 2021 ◦ Pivoted our focus to the most efficient, direct response E-Commerce channel • General and administrative expense (G&A) was $6.2 million, down $(1.0) million sequentially primarily due to lower legal spend and lower overall headcount related expense. G&A was down $(5.0) million YoY primarily due to lower legal expense. Excluding legal fees, severance & restructuring, and equity compensation expense, G&A was up by $0.1 million YoY and down $(0.6) million sequentially. • Net loss was $(1.0) million or $(0.01) per share, compared to a net loss of $(8.9) million or $(0.13) per share in Q3 2021 • Adjusted EBITDA including legal expense was a loss of $(1.2) million, an improvement of $5.1 million YoY The third quarter net sales were impacted by lower sales to our B2B partners due to COVID-19 headwinds and timing. These impacts were largely offset by lower operating expenses for solid bottom-line performance.


The information contained in this documents is confidential, privileged and only for the information of the intended recipient and may not be used, published or redistributed without the prior written consent (2019) The Science 18


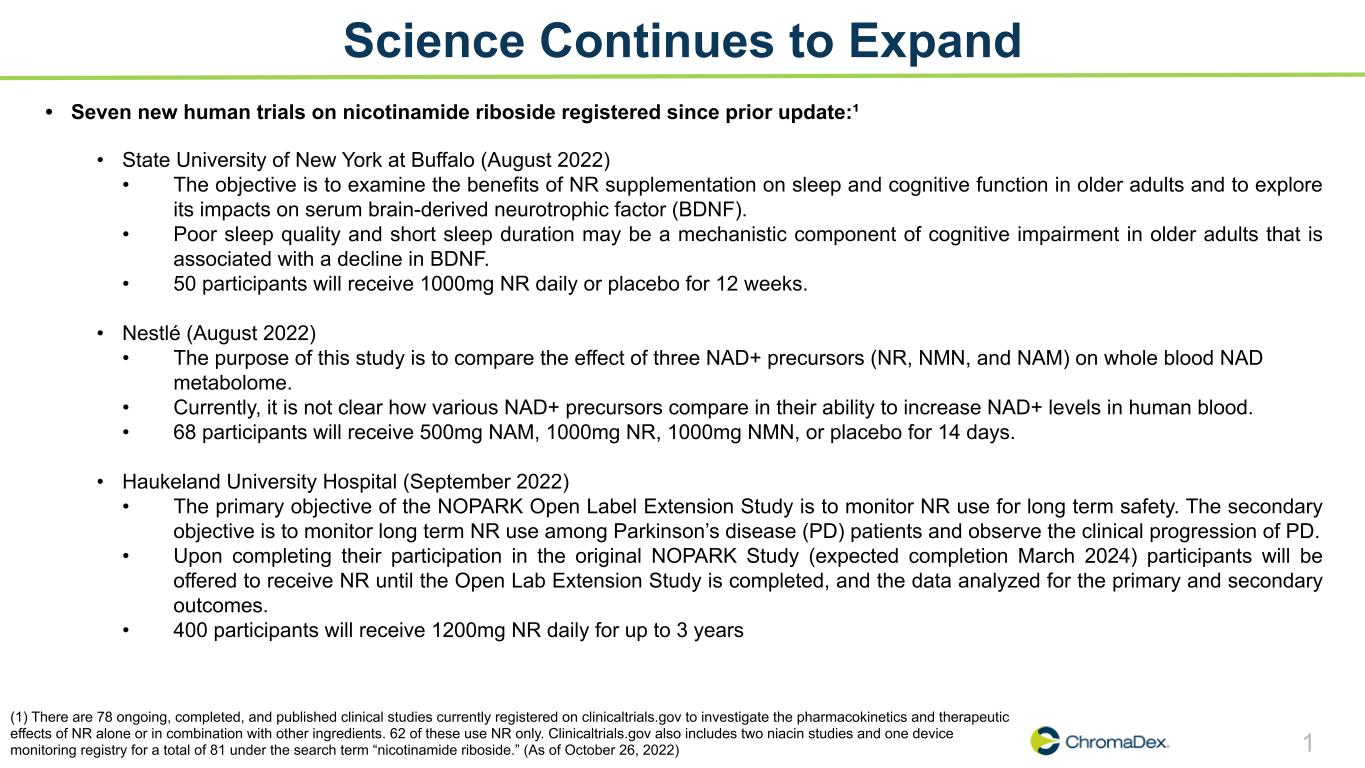
1 Science Continues to Expand • Seven new human trials on nicotinamide riboside registered since prior update:¹ • State University of New York at Buffalo (August 2022) • The objective is to examine the benefits of NR supplementation on sleep and cognitive function in older adults and to explore its impacts on serum brain-derived neurotrophic factor (BDNF). • Poor sleep quality and short sleep duration may be a mechanistic component of cognitive impairment in older adults that is associated with a decline in BDNF. • 50 participants will receive 1000mg NR daily or placebo for 12 weeks. • Nestlé (August 2022) • The purpose of this study is to compare the effect of three NAD+ precursors (NR, NMN, and NAM) on whole blood NAD metabolome. • Currently, it is not clear how various NAD+ precursors compare in their ability to increase NAD+ levels in human blood. • 68 participants will receive 500mg NAM, 1000mg NR, 1000mg NMN, or placebo for 14 days. • Haukeland University Hospital (September 2022) • The primary objective of the NOPARK Open Label Extension Study is to monitor NR use for long term safety. The secondary objective is to monitor long term NR use among Parkinson’s disease (PD) patients and observe the clinical progression of PD. • Upon completing their participation in the original NOPARK Study (expected completion March 2024) participants will be offered to receive NR until the Open Lab Extension Study is completed, and the data analyzed for the primary and secondary outcomes. • 400 participants will receive 1200mg NR daily for up to 3 years (1) There are 78 ongoing, completed, and published clinical studies currently registered on clinicaltrials.gov to investigate the pharmacokinetics and therapeutic effects of NR alone or in combination with other ingredients. 62 of these use NR only. Clinicaltrials.gov also includes two niacin studies and one device monitoring registry for a total of 81 under the search term “nicotinamide riboside.” (As of October 26, 2022)


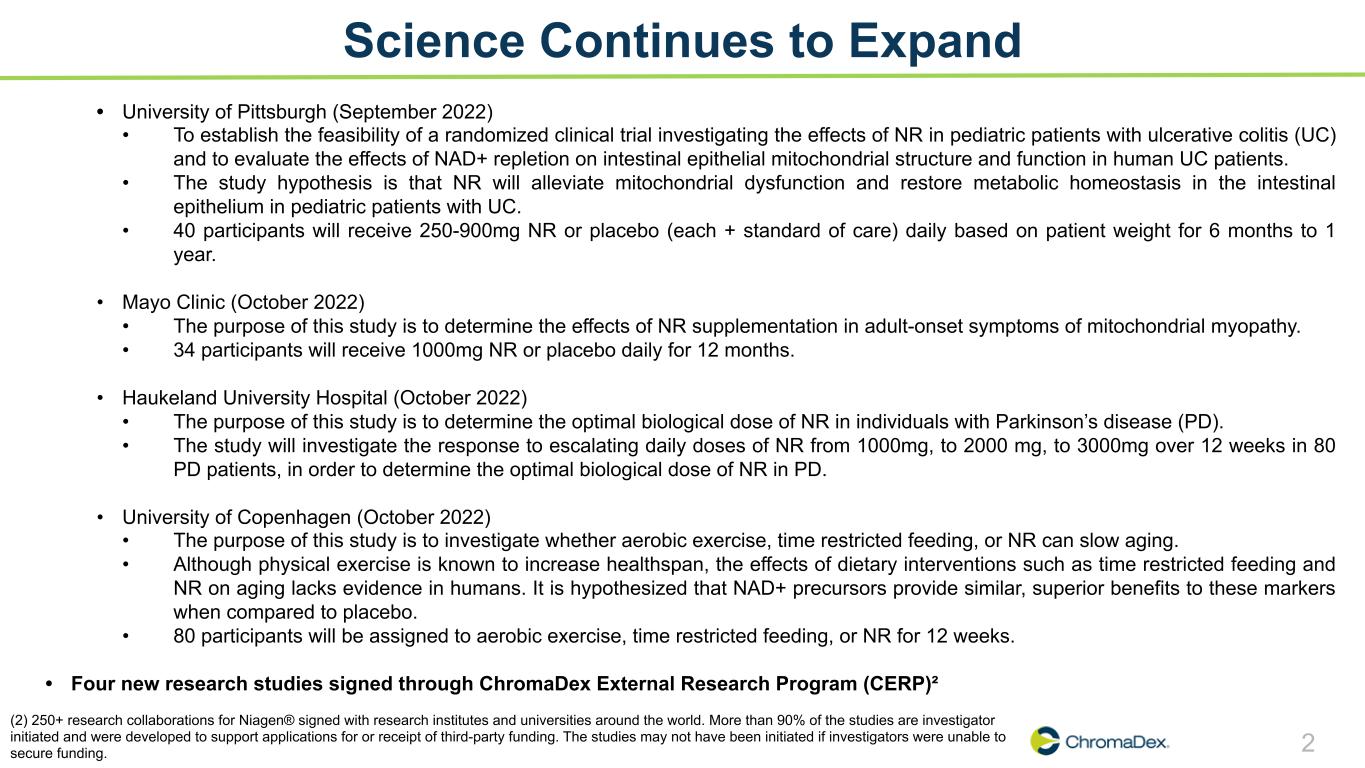
2 Science Continues to Expand • University of Pittsburgh (September 2022) • To establish the feasibility of a randomized clinical trial investigating the effects of NR in pediatric patients with ulcerative colitis (UC) and to evaluate the effects of NAD+ repletion on intestinal epithelial mitochondrial structure and function in human UC patients. • The study hypothesis is that NR will alleviate mitochondrial dysfunction and restore metabolic homeostasis in the intestinal epithelium in pediatric patients with UC. • 40 participants will receive 250-900mg NR or placebo (each + standard of care) daily based on patient weight for 6 months to 1 year. • Mayo Clinic (October 2022) • The purpose of this study is to determine the effects of NR supplementation in adult-onset symptoms of mitochondrial myopathy. • 34 participants will receive 1000mg NR or placebo daily for 12 months. • Haukeland University Hospital (October 2022) • The purpose of this study is to determine the optimal biological dose of NR in individuals with Parkinson’s disease (PD). • The study will investigate the response to escalating daily doses of NR from 1000mg, to 2000 mg, to 3000mg over 12 weeks in 80 PD patients, in order to determine the optimal biological dose of NR in PD. • University of Copenhagen (October 2022) • The purpose of this study is to investigate whether aerobic exercise, time restricted feeding, or NR can slow aging. • Although physical exercise is known to increase healthspan, the effects of dietary interventions such as time restricted feeding and NR on aging lacks evidence in humans. It is hypothesized that NAD+ precursors provide similar, superior benefits to these markers when compared to placebo. • 80 participants will be assigned to aerobic exercise, time restricted feeding, or NR for 12 weeks. • Four new research studies signed through ChromaDex External Research Program (CERP)² (2) 250+ research collaborations for Niagen® signed with research institutes and universities around the world. More than 90% of the studies are investigator initiated and were developed to support applications for or receipt of third-party funding. The studies may not have been initiated if investigators were unable to secure funding.


3 Recent Peer-Reviewed Clinical Publications • Journal of the American College of Cardiology - Wang et al., 2022 - "Safety and Tolerability of Nicotinamide Riboside in Heart Failure With Reduced Ejection Fraction." - September 2022 • The study objective was to assess the safety and tolerability of NR in patients with Stage C heart failure with reduced ejection fraction (HFrEF). Additionally, the effects of NR on white blood cells' mitochondrial respiratory function, inflammation and whole blood nicotinamide adenine dinucleotide (NAD+) levels were assessed. • The promising results from this study demonstrate that high-dose NR was safe and well-tolerated, almost doubling whole blood NAD+ levels, increasing white blood cell mitochondrial respiratory function and decreasing the expression of inflammatory markers. • This study marks a major milestone as it is the first study to investigate the safety and tolerability of NR in a randomized placebo-controlled trial of patients with heart failure, a crucial step that will pave the way for future clinical research. • Neuropediatrics - Steinbruecker et al., 2022 - "Nicotinamide Riboside for Ataxia Telangiectasia: Report of an Early Treated Individual." - October 2022 • The case study investigated the effect of NR in an individual with ataxia telangiectasia (AT) and recurrent bacterial infections. • Neurological examination after 7 and 11 months of NR supplementation showed a clearer and more fluid speech and improvement in fine motor skills and movement disorder in one 3.5-year-old male child with AT. • Use of antibiotics and frequency of hospitalizations due to infections were reduced by more than 90%. • This study replicates the previous finding of a positive effect of NR treatment in patients with AT by Veenhuis et al., 2021.


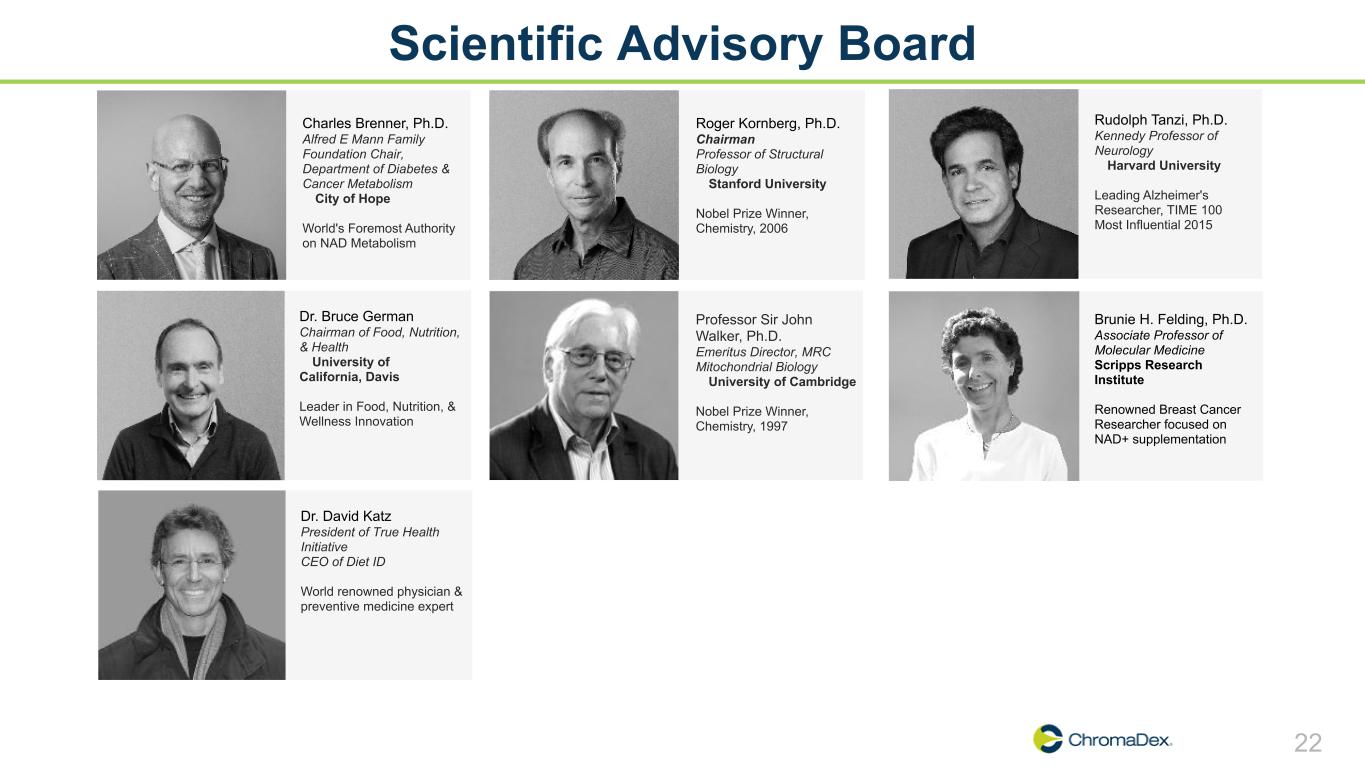
Scientific Advisory Board Charles Brenner, Ph.D. Alfred E Mann Family Foundation Chair, Department of Diabetes & Cancer Metabolism City of Hope World's Foremost Authority on NAD Metabolism Roger Kornberg, Ph.D. Chairman Professor of Structural Biology Stanford University Nobel Prize Winner, Chemistry, 2006 Rudolph Tanzi, Ph.D. Kennedy Professor of Neurology Harvard University Leading Alzheimer's Researcher, TIME 100 Most Influential 2015 Dr. Bruce German Chairman of Food, Nutrition, & Health University of California, Davis Leader in Food, Nutrition, & Wellness Innovation Professor Sir John Walker, Ph.D. Emeritus Director, MRC Mitochondrial Biology University of Cambridge Nobel Prize Winner, Chemistry, 1997 Brunie H. Felding, Ph.D. Associate Professor of Molecular Medicine Scripps Research Institute Renowned Breast Cancer Researcher focused on NAD+ supplementation Dr. David Katz President of True Health Initiative CEO of Diet ID World renowned physician & preventive medicine expert 22


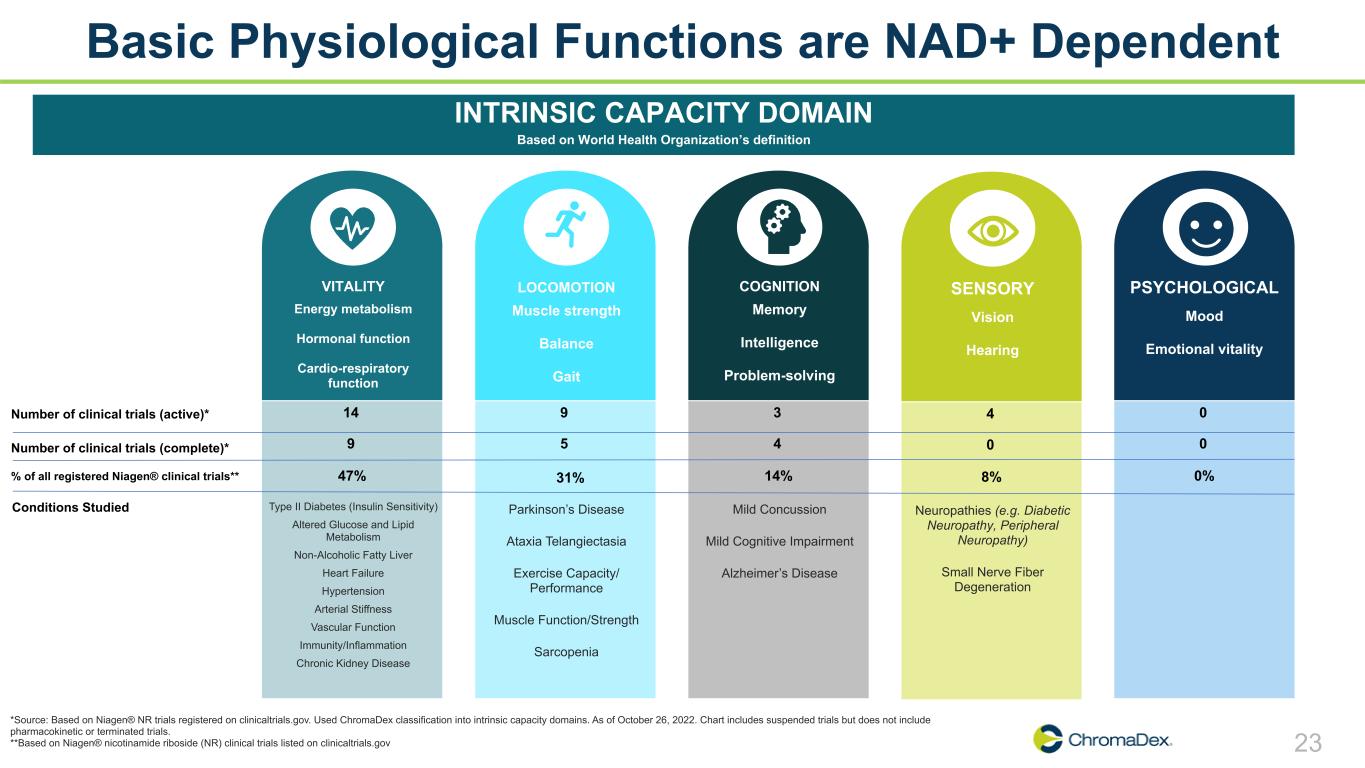
Basic Physiological Functions are NAD+ Dependent INTRINSIC CAPACITY DOMAIN Based on World Health Organization’s definition VITALITY Energy metabolism Hormonal function Cardio-respiratory function Number of clinical trials (active)* 14 Number of clinical trials (complete)* 9 % of all registered Niagen® clinical trials** 47% Type II Diabetes (Insulin Sensitivity) Altered Glucose and Lipid Metabolism Non-Alcoholic Fatty Liver Heart Failure Hypertension Arterial Stiffness Vascular Function Immunity/Inflammation Chronic Kidney Disease Conditions Studied LOCOMOTION Muscle strength Balance Gait 9 5 Parkinson’s Disease Ataxia Telangiectasia Exercise Capacity/ Performance Muscle Function/Strength Sarcopenia COGNITION Memory Intelligence Problem-solving 3 4 14% Mild Concussion Mild Cognitive Impairment Alzheimer’s Disease SENSORY Vision Hearing 4 0 8% Neuropathies (e.g. Diabetic Neuropathy, Peripheral Neuropathy) Small Nerve Fiber Degeneration PSYCHOLOGICAL Mood Emotional vitality 0 0 0% *Source: Based on Niagen® NR trials registered on clinicaltrials.gov. Used ChromaDex classification into intrinsic capacity domains. As of October 26, 2022. Chart includes suspended trials but does not include pharmacokinetic or terminated trials. **Based on Niagen® nicotinamide riboside (NR) clinical trials listed on clinicaltrials.gov 31% 23


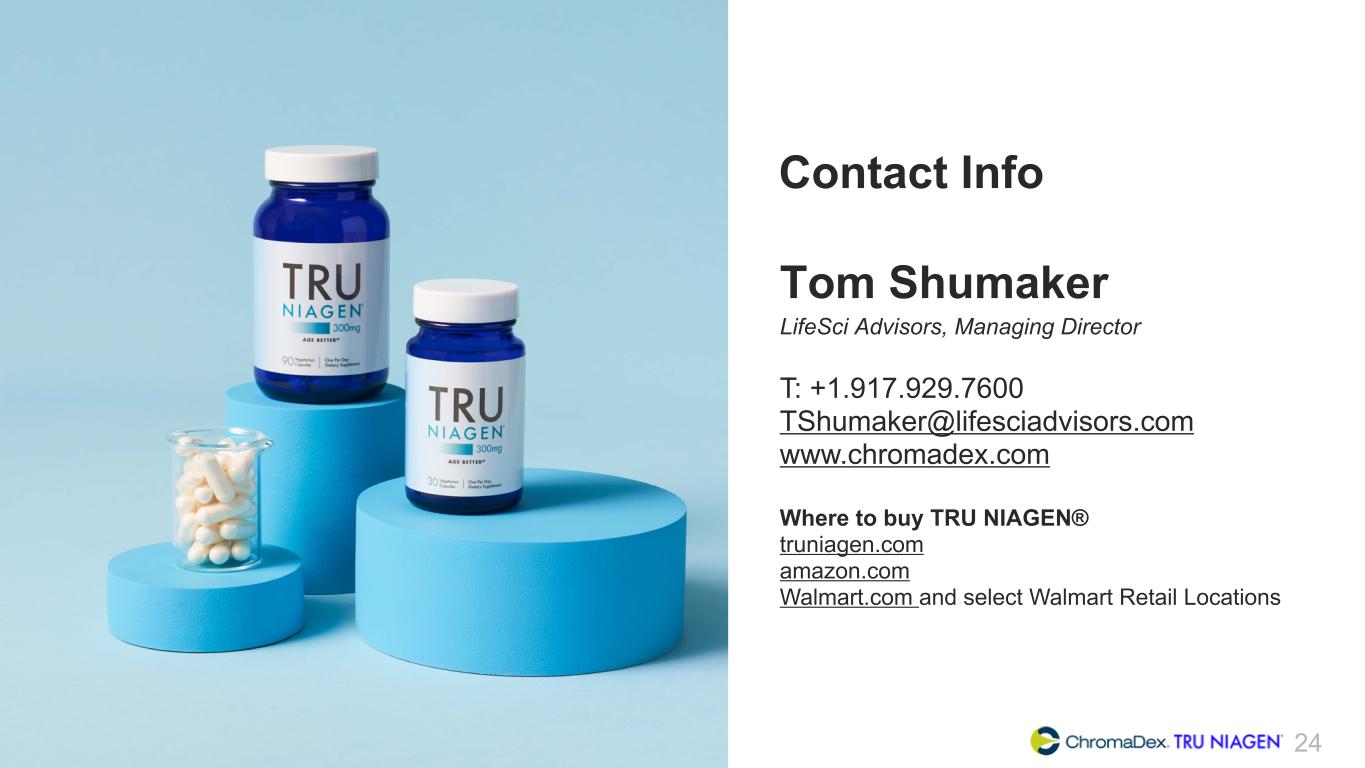
The information contained in this documents is confidential, privileged and only for the information of the intended recipient and may not be used, published or redistributed without the prior written consent (2019) Contact Info Tom Shumaker LifeSci Advisors, Managing Director T: +1.917.929.7600 [email protected] www.chromadex.com Where to buy TRU NIAGEN® truniagen.com amazon.com Walmart.com and select Walmart Retail Locations 24