Niagen Bioscience, Inc. Reports Second Quarter 2025 Financial Results and Increases Full Year Outlook
Net sales increased 37% to $31.1 million
Gross margin increased 480 basis points to 65.0%
Net income of $3.6 million versus breakeven in prior year period
Adjusted EBITDA increased by 221% to $5.0 million
Raising full year 2025 revenue outlook to 22% to 27% year-over-year growth
LOS ANGELES, CA - August 6, 2025 - Niagen Bioscience, Inc. (NASDAQ:NAGE) today announced financial results for the second quarter of 2025.
Second Quarter 2025 Financial Highlights Compared to Prior Year Period
•Total net sales increased 37% to $31.1 million, with Tru Niagen® sales reaching $22.7 million, growing 22%.
•Niagen® ingredient sales increased 135% to $7.4 million including food-grade and pharmaceutical-grade.
•Gross margin increased 480 basis points to 65.0%.
•Sales and marketing expense as a percentage of net sales was 26.4%, an improvement of 420 basis points.
•Net income of $3.6 million or $0.05 earnings per share, up from breakeven in prior year quarter.
•Adjusted EBITDA, a non-GAAP measure, increased 221% to $5.0 million.
•Total cash provided by operations of $9.1 million during the six months ended June 30, 2025, ending the quarter with $60.5 million in cash.
•Increased full year 2025 outlook: Net sales growth expected between 22%–27% (previously between 20%–25%), reflecting continued execution and leadership in the expanding NAD+ market.
Recent Operational Highlights
•On June 9, 2025, the Company announced the publication of the first peer-reviewed clinical study of Niagen® in individuals with Werner syndrome, a rare premature aging disorder in Aging Cell. The 52-week randomized trial showed Niagen® significantly increased NAD+ levels and improved clinical markers of cardiovascular and skin health, supporting further investigation in rare, age-related diseases.
•On July 8, 2025, the Company entered into a worldwide exclusive license agreement with Haukeland University Hospital in Bergen, Norway, securing proprietary rights to develop and commercialize its patented nicotinamide riboside (Niagen®) as a potential pharmaceutical therapy for Parkinson’s disease (PD). This agreement includes access to extensive clinical data, including from the Phase III NOPARK trial, and supports the Company’s broader efforts to advance regulated therapeutic applications for neurodegenerative conditions.
•During June 2025, patient dosing the Phase III NOPARK trial was completed, the largest and most comprehensive clinical study of NAD+ augmentation in persons with early PD to date. NOPARK is a randomized, double-blind, placebo-controlled phase III clinical trial featuring 400 individuals with early-stage PD across 12 sites in Norway. Randomized to receive either 500 mg of nicotinamide riboside (Niagen) twice daily or placebo for 52 weeks, participants had follow-up assessments at five time points in a one-year period. The primary endpoint is the MDS-UPDRS total score, a gold standard measure of PD progression. Data analysis is underway and the data from this phase 3 trial is expected to be published in 2026.
•On July 14, 2025, the Company announced the launch of Tru Niagen® as an exclusive in-room amenity, and introduced Niagen IV at The Spa by Equinox Hotel New York through NutriDrip, marking Niagen Bioscience’s entry into luxury hospitality. While featured at a single location, Equinox’s sole hotel property, the launch aligns with a premium, health-conscious demographic and serves as a potential model for broader hospitality partnerships.
•As of August 2025, Niagen Plus products, including Niagen IV and injectables, are available in over 800 leading wellness clinics in the U.S., up from more than 475 clinics in December 2024. This growth reflects accelerating adoption by clinics and rising demand for clinically administered NAD+ solutions. Niagen Plus products are compounded and distributed through U.S. FDA-registered 503B outsourcing facilities and offered exclusively by prescription through participating wellness clinics.
“We delivered an excellent second quarter, with $31.1 million in net sales, up 37% year-over-year, and $3.6 million in net income,” said Niagen Bioscience CEO Rob Fried. “As the pioneers of this blossoming NAD+ market, we continue to invest in the future while maintaining our focus on profitable growth."
Results of operations for the three months ended June 30, 2025 compared to the prior year quarter
Net Sales for Niagen Bioscience increased 37%, or $8.4 million, to $31.1 million. The growth in net sales was driven by combined growth in Tru Niagen® sales and Niagen® ingredient sales, including strong e-commerce channel performance, stronger demand for food-grade Niagen® and the ramp-up of pharmaceutical-grade Niagen® sales, which were not sold in the prior year quarter.
Gross Margin improved 480 basis points to 65.0% primarily due to changes in product mix, business mix, the use of lower-cost inventory purchases, and improvements in labor and overhead utilization rates with higher sales. These gross margin improvements may not be indicative of future performance and certain drivers, such as lower-cost inventory purchases, are likely to be temporary in nature. Gross margins are expected to normalize in future periods.
Operating Expense increased 22%, or $3.1 million, to $17.0 million reflecting investments for business growth and brand awareness.
•Selling and marketing expense increased $1.2 million, and improved 420 basis points as a percentage of net sales to 26.4% of net sales, reflecting improved sales efficiency and disciplined investment. The increase in expenses primarily reflects higher investments to support brand growth in our consumer products segment.
•General and administrative expense increased $1.6 million, or 28%, primarily driven by higher employee-related expenses, share-based compensation, and professional and consulting fees.
•Research and development expenses increased $0.3 million due to higher professional and consulting fees, as well as higher employee-related expenses.
Net Income was $3.6 million, or $0.05 per share, compared to approximately break-even net loss and loss per share for the second quarter of 2024.
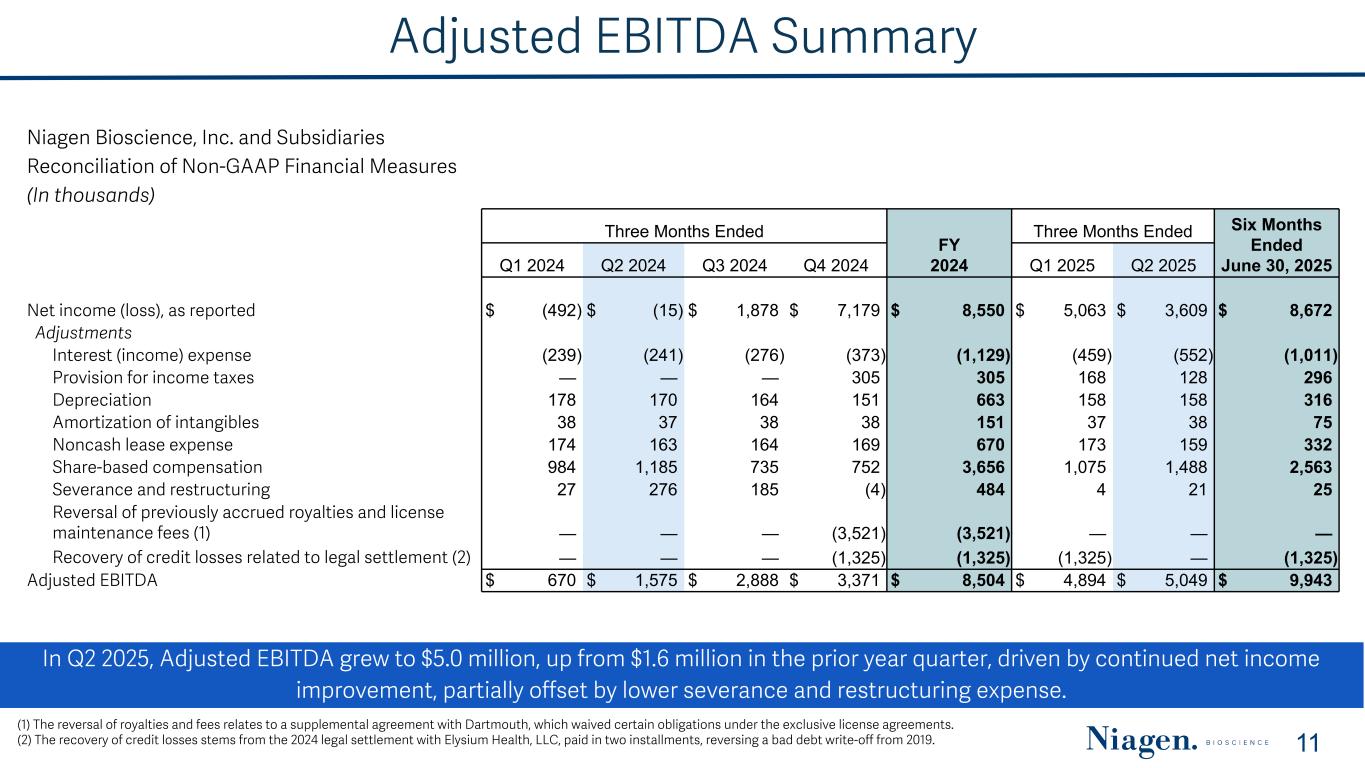
Adjusted EBITDA, a non-GAAP measure, was $5.0 million, up from $1.6 million for the second quarter of 2024. See “Reconciliation of Non-GAAP Financial Measures” for a reconciliation of non-GAAP Adjusted EBITDA to net income (loss), the most directly comparable GAAP measure.
Cash Flows from Operating Activities had a net cash inflow of $9.1 million for the six months ended June 30, 2025 compared to approximately break-even cash flows in the prior year. The approximately $9.1 million increase in cash provided by operating activities was primarily driven by improvements in net income (loss), relatively higher collections on trade receivables, and a relative increase in accounts payable. These increases were partially offset by a decrease in credit loss expense due to a recovery of previously written-off amounts and higher inventory purchases associated with scaling our inventory reserves.
2025 Full Year Outlook
Looking forward, for the full year, the Company is revising its revenue growth expectation from 20% to 25% year-over-year to 22% to 27%. This outlook reflects anticipated continued expansion of the Company’s e-commerce business as well as growth through new and established partnerships. Gross margin is expected to improve slightly year-over-year compared to 61.8% in 2024, driven by ongoing supply chain optimization efforts, cost savings initiatives, and overall business scale. The Company is also updating its outlook for sales and marketing expenses. These costs are now expected to increase in absolute dollars compared to $29.5 million in 2024, but decrease as a percentage of net sales compared to 29.6% of net sales in 2024. This compares to the prior guidance of an increase in absolute dollars with a stable percentage of net sales year over year. The updated projection reflects the Company’s continued strategic investments to enhance and strengthen brand awareness and support its various business channels while enhancing efficiencies. The Company remains committed to maintaining steady investments in research and development throughout 2025, with spending expected to align closely with fiscal year 2024 levels ($6.0 million), to continue driving future innovation. General and administrative expenses are expected to increase by approximately $7.0 to $8.0 million, primarily due to share-based compensation and investments in business growth and the absence of a $3.5 million royalty expense reversal that occurred in 2024.
Investor Conference Call
A live webcast will be held Wednesday, August 6, 2025 at 4:30 p.m. Eastern time (1:30 p.m. Pacific time) to discuss Niagen Bioscience’s second-quarter financial results and provide a general business update.
To listen to the webcast, or to view the earnings press release and its accompanying financial exhibits, please visit the Investors Relations section of Niagen Bioscience’s website at https://investors.niagenbioscience.com. The toll-free dial-in information for this call is 1-888-596-4144 with Conference ID: 8584242.
The webcast will be recorded, and will be available for replay via the website from 7:30 p.m. Eastern time on August 6, 2025 through 11:59 p.m. Eastern time on August 13, 2025. The replay of the call can also be accessed by dialing 1-800-770-2030, using the Replay ID: 8584242.
Important Note on Forward Looking Statements:
This release contains forward-looking statements within the meaning of Section 27A of the Securities Act of 1933, and Section 21E of the Securities Exchange Act of 1934. Statements that are not a description of historical facts constitute forward-looking statements and may often, but not always, be identified by the use of such words as “expects,” “anticipates,” “intends” “estimates,” “plans,” “potential,” “possible,” “probable,” “believes” “seeks,” “may,” “will,” “should,” “could,” “predicts,” “projects,” “continue,” “would” or the negative of such terms or other similar expressions. Forward-looking statements include statements regarding our intentions, beliefs, projections, outlook, analyses or current expectations concerning, among other things: the quotation from Niagen Bioscience’s Chief Executive Officer, statements related to the Company’s 2025 financial outlook including but not limited to revenue growth, gross margin, expenses, investment plans, and the statements regarding Niagen Plus.
Risks that contribute to the uncertain nature of the forward-looking statements include: inflationary conditions and adverse economic conditions; our history of operating losses; the growth and profitability of our product sales; our ability to maintain and grow sales, marketing and distribution capabilities; changing consumer perceptions of our products; our reliance on a single or limited number of third-party suppliers; risks of conducting business in China; including unanticipated developments in and risks related to the Company’s ability to secure adequate quantities of pharmaceutical-grade Niagen in a timely manner; the Company’s ability to obtain appropriate contracts and arrangements with U.S. FDA-registered 503B outsourcing facilities required to compound and distribute pharmaceutical-grade Niagen to clinics; the Company’s ability to remain on the U.S. FDA Bulk Drug Substances Nominated for Use in Compounding Under Section 503B of the Federal Food, Drug, and Cosmetic Act Category 1 list; the Company’s ability to maintain and enforce the Company’s existing intellectual property and obtain new patents; whether the potential benefits of NRC can be further supported; further research and development and the results of clinical trials possibly being unsuccessful or insufficient to meet applicable regulatory standards or warrant continued development; the ability to enroll sufficient numbers of subjects in clinical trials; determinations made by the FDA and other governmental authorities; economic and market instability, including as a result of tariffs or trade conflicts; and the risks and uncertainties associated with our business and financial condition in general, described in our filings with the Securities and Exchange Commission (SEC), including, without limitation, our most recent Annual Report on Form 10-K and Quarterly Report on Form 10-Q as filed with the SEC. Readers are cautioned not to place undue reliance on these forward-looking statements, which speak only as of the date hereof, and actual results may differ materially from those suggested by these forward-looking statements. All forward-looking statements are qualified in their entirety by this cautionary statement and Niagen Bioscience undertakes no obligation to revise or update this release to reflect events or circumstances after the date hereof.
About Niagen Bioscience, Inc.:
Niagen Bioscience is a global bioscience company dedicated to healthy aging. The Niagen Bioscience team, which includes world-renowned scientists, is pioneering research on nicotinamide adenine dinucleotide (NAD+), an essential coenzyme that is a key regulator of cellular metabolism and is found in every cell of the human body. NAD+ levels in humans have been shown to decline with age, among other factors, and may be increased through supplementation with NAD+ precursors. Niagen Bioscience is the innovator behind the NAD+ precursor nicotinamide riboside chloride (“NRC” commonly referred to as “NR”), commercialized as the flagship ingredient Niagen®, available in both food and pharmaceutical grades. Nicotinamide riboside chloride and other NAD+ precursors are protected by Niagen Bioscience’s patent portfolio.
The Company delivers Niagen® as the sole or principal dietary ingredient in its consumer product line Tru Niagen® available at www.TruNiagen.com and through partnerships with global retailers and distributors. The Company also develops and commercializes proprietary-based ingredient technologies, including food-grade Niagen® and pharmaceutical-grade Niagen®, and supplies these ingredients as raw materials to the manufacturers of consumer products and U.S. FDA-registered 503B outsourcing facilities, respectively. The Company further offers natural product fine chemicals, known as phytochemicals, and related research and development services. Follow us on X (formerly Twitter) @NiagenBio and Instagram @TruNiagen and @NiagenPlus and subscribe to our latest news via our website accessible at www.NiagenBioscience.com to which Niagen Bioscience regularly posts copies of its press releases as well as additional updates and financial information about the Company.
Contacts:
| | | | | |
| Investor Relations | |
| ICR, LLC | |
| Reed Anderson | |
| 1 (626) 277-1260 | |
| Stephanie Carrington | |
| 1 (626) 277-1282 | |
| [email protected] | |
| |
| Media Relations | |
| Kendall Knysch | |
| Senior Director of Communications, Public Relations, & Partnerships |
| +1 (310) 388-6706 Ext. 689 | |
| [email protected] | |
Niagen Bioscience, Inc. and Subsidiaries
Unaudited Condensed Consolidated Statements of Operations
| | | | | | | | | | | | | | | | | | | | | | | |
| | Three Months Ended June 30, | | Six Months Ended June 30, |
| 2025 | | 2024 | | 2025 | | 2024 |
(In thousands, except per share data) | | | | | | | |
| Sales, net | $ | 31,117 | | | $ | 22,739 | | | $ | 61,598 | | | $ | 44,892 | |
| Cost of sales | 10,891 | | 9,046 | | 22,041 | | 17,743 |
| Gross profit | 20,226 | | 13,693 | | 39,557 | | 27,149 |
| Operating expenses: | | | | | | | |
| Sales and marketing | 8,207 | | 6,969 | | 16,324 | | 13,709 |
| Research and development | 1,567 | | 1,316 | | 2,825 | | 3,411 |
| General and administrative | 7,267 | | 5,664 | | 12,451 | | 11,016 |
| Total operating expenses | 17,041 | | 13,949 | | 31,600 | | 28,136 |
| Operating income (loss) | 3,185 | | (256) | | 7,957 | | (987) |
| | | | | | | |
| Nonoperating income: | | | | | | | |
| | | | | | | |
| Interest income, net | 552 | | 241 | | 1,011 | | 480 |
| | | | | | | |
| Income (loss) before provision for income taxes | 3,737 | | | (15) | | | 8,968 | | | (507) | |
| Provision for income taxes | 128 | | | — | | | 296 | | | — | |
| Net income (loss) | $ | 3,609 | | | $ | (15) | | | $ | 8,672 | | | $ | (507) | |
| | | | | | | |
| | | | | | | |
| | | | | | | |
| | | | | | | |
| Net income (loss) per share attributable to common stockholders: | | | | | | | |
| Basic | $ | 0.05 | | | $ | — | | | $ | 0.11 | | | $ | (0.01) | |
| Diluted | $ | 0.04 | | | $ | — | | | $ | 0.10 | | | $ | (0.01) | |
| | | | | | | |
| Weighted average common shares outstanding: | | | | | | | |
| Basic | 79,249 | | | 75,559 | | | 78,534 | | | 75,394 | |
| Diluted | 86,241 | | | 75,559 | | | 84,877 | | | 75,394 | |
Niagen Bioscience, Inc. and Subsidiaries
Unaudited Condensed Consolidated Balance Sheets
| | | | | | | | | | | |
(In thousands except par values, unless otherwise indicated) | June 30, 2025 | | December 31, 2024 |
| Assets | | | |
| Current assets: | | | |
| Cash and cash equivalents, including restricted cash of $152 for both periods presented | $ | 60,474 | | | $ | 44,660 | |
| Trade receivables, net of allowances of $199 and $95, respectively | 9,656 | | 7,768 |
| Inventories | 14,406 | | 9,192 |
| Prepaid expenses and other assets | 2,143 | | 2,482 |
| Total current assets | 86,679 | | 64,102 |
| | | |
| Leasehold improvements and equipment, net | 1,632 | | 1,719 |
| Intangible assets, net | 284 | | 359 |
| Right-of-use assets | 2,525 | | 1,730 |
| Other long-term assets | 405 | | 368 |
| Total assets | $ | 91,525 | | | $ | 68,278 | |
| | | |
| Liabilities and Stockholders' Equity | | | |
| Current liabilities: | | | |
| Accounts payable | $ | 13,680 | | | $ | 8,526 | |
| Accrued expenses | 7,381 | | 7,817 |
| Current maturities of operating lease obligations | 957 | | 982 |
| Current maturities of finance lease obligations | 6 | | 12 |
| Customer deposits | 303 | | 611 |
| Total current liabilities | 22,327 | | 17,948 |
| Deferred revenue | 2,674 | | 2,579 |
| Operating lease obligations, less current maturities | 2,329 | | 1,657 |
| | | |
| | | |
| | | |
| | | |
| | | |
| | | |
| | | |
| | | |
| | | |
| | | |
| | | |
Total stockholders’ equity | 64,195 | | 46,094 |
Total liabilities and stockholders’ equity | $ | 91,525 | | | $ | 68,278 | |
Niagen Bioscience, Inc. and Subsidiaries
Unaudited Condensed Consolidated Statements of Cash Flows
| | | | | | | | | | | |
| Six Months Ended June 30, |
| (In thousands) | 2025 | | 2024 |
| Net cash provided by / (used in): | | | |
| Operating activities | $ | 9,133 | | | $ | 31 | |
| Investing activities | (167) | | | (53) | |
| Financing activities | 6,848 | | | 582 | |
| Net increase in cash and cash equivalents | 15,814 | | | 560 | |
| Cash and cash equivalents beginning of period | 44,660 | | | 27,325 | |
| Cash and cash equivalents at end of period | $ | 60,474 | | | $ | 27,885 | |
Niagen Bioscience, Inc. and Subsidiaries
Unaudited Reconciliation of Non-GAAP Financial Measures
| | | | | | | | | | | | | | | | | | | | | | | | | | | | | |
| Reconciliation of Net Income (Loss) to Adjusted EBITDA |
(In thousands) | Q2 2025 | | Q1 2025 | | Q4 2024 | | Q3 2024 | | Q2 2024 |
| | | | | | | | | |
| Net income (loss), as reported | $ | 3,609 | | | $ | 5,063 | | | $ | 7,179 | | | $ | 1,878 | | | $ | (15) | |
| Adjustments: | | | | | | | | | |
| Interest income, net | (552) | | (459) | | (373) | | (276) | | (241) |
| Provision for income taxes | 128 | | 168 | | 305 | | — | | — |
| Depreciation | 158 | | 158 | | 151 | | 164 | | 170 |
| Amortization of intangibles | 38 | | 37 | | 38 | | 38 | | 37 |
| Noncash lease expense | 159 | | 173 | | 169 | | 164 | | 163 |
| Share-based compensation | 1,488 | | 1,075 | | 752 | | 735 | | 1,185 |
| Severance and restructuring | 21 | | 4 | | (4) | | 185 | | 276 |
| Reversal of previously accrued royalties and license maintenance fees (1) | — | | | — | | | (3,521) | | | — | | | — | |
| Recovery of credit losses related to legal settlement (2) | — | | | (1,325) | | | (1,325) | | | — | | | — | |
| Adjusted EBITDA | $ | 5,049 | | | $ | 4,894 | | | $ | 3,371 | | | $ | 2,888 | | | $ | 1,575 | |
| | | | | | | | | |
| | | | | | | | | |
| | | | | | | | | |
| | | | | | | | | |
(1) The reversal of previously accrued royalties and license maintenance fees related to a supplemental agreement with Dartmouth, which waived certain obligations under the exclusive license agreements.
(2) The recovery of credit losses relates to the 2024 legal settlement with Elysium Health, LLC, paid in two installments, reversing a bad debt write-off from 2019.
Non-GAAP Financial Information:
To supplement Niagen Bioscience’s unaudited financial data presented in accordance with generally accepted accounting principles (GAAP), the Company has presented Adjusted EBITDA, a non-GAAP financial measure. Niagen Bioscience believes the presentation of this non-GAAP financial measure provides important supplemental information to management and investors and enhances the overall understanding of the Company’s historical and current financial operating performance. The Company believes disclosure of the non-GAAP financial measure has substance because the excluded expenses are infrequent in nature, are variable in nature or do not represent current cash expenditures. Further, such non-GAAP financial measure is among the indicators the Company uses as a basis for evaluating the Company’s financial performance as well as for planning and forecasting purposes. Accordingly, disclosure of this non-GAAP financial measure provides investors with the same information that management uses to understand the Company’s economic performance year-over-year.
Adjusted EBITDA is defined as net income (loss) before (a) interest, (b) provision for income taxes, (c) depreciation, (d) amortization, (e) non-cash share-based compensation costs, (f) severance and restructuring expense and (g) other infrequent items, including the reversal of previously accrued royalties and license maintenance fees, and the recovery of previously recognized credit losses from a legal settlement. While Niagen Bioscience believes that this non-GAAP financial measure provides useful supplemental information to investors, there are limitations associated with the use of such measure. This measure is not prepared in accordance with GAAP and may not be directly comparable to similarly titled measures of other companies due to potential differences in the method of calculation. Management compensates for these limitations by relying primarily on the Company’s GAAP results and by using Adjusted EBITDA only supplementally and by reviewing the reconciliation of the non-GAAP financial measure to its most comparable GAAP financial measure.
Non-GAAP financial measures are not prepared in accordance with, or an alternative for, generally accepted accounting principles in the United States. The Company’s non-GAAP financial measure is not meant to be considered in isolation or as a substitute for comparable GAAP financial measures and should be read only in conjunction with the Company’s consolidated financial statements prepared in accordance with GAAP.