1 ChromaDex Earnings Conference Call Third Quarter 2021 Rob Fried Chief Executive Officer Frank Jaksch Co-Founder / Executive Chairman Kevin Farr Chief Financial Officer Fadi Karam Chief Marketing Officer Nasdaq: CDXC | November 3, 2021
2SAFE HARBOR STATEMENT This presentation and other written or oral statements made from time to time by representatives of ChromaDex contain “forward-looking statements” within the meaning of Section 27A of the Securities Act of 1933, as amended, and Section 21E of the Securities Exchange Act of 1934. Forward-looking statements reflect the current view about future events. Statements that are not historical in nature, such as 2021 financial outlook, and which may be identified by the use of words like “expects," "anticipates," "intends," "estimates," "plans," "potential," "possible," "probable," "believes," "seeks," "may,“ "will," "should," "could“ or the negative of these terms and other words of similar meaning, are forward-looking statements. Such statements include, but are not limited to, statements contained in this presentation relating to our expected sales, cash flows and financial performance, business, business strategy, expansion, growth, products and services we may offer in the future and the timing of their development, sales and marketing strategy and capital outlook, and the timing and results of pre-clinical and clinical trials. Forward-looking statements are based on management’s current expectations and assumptions regarding our business, the economy and other future conditions and are subject to inherent risks, uncertainties and changes of circumstances that are difficult to predict and may cause actual results to differ materially from those contemplated or expressed. We caution you therefore against relying on any of these forward-looking statements. These risks and uncertainties include those risk factors discussed in Part I, “Item 1A. Risk Factors” of our Annual Report on Form 10-K for the year ended December 31, 2020, filed with the Securities Exchange Commission (the “Commission”), and in our other periodic filings with the Commission. Any forward-looking statements are qualified in their entirety by reference to the factors discussed in these filings with the Commission. Should one or more of these risks or uncertainties materialize, or should the underlying assumptions prove incorrect, actual results may differ significantly from those anticipated, believed, estimated, expected, intended or planned. Important factors that could cause actual results to differ materially from those in the forward looking statements include: the effect of the COVID-19 pandemic on our business, results of operations, financial condition and cash flows; a decline in general economic conditions nationally and internationally; decreased demand for our products and services; market acceptance of our products; the ability to protect our intellectual property rights; impact of any litigation or infringement actions brought against us; competition from other providers and products; risks in product development; inability to raise capital to fund continuing operations; changes in government regulation; and the ability to complete customer transactions and capital raising transactions. Factors or events that could cause our actual results to differ may emerge from time to time, and it is not possible for us to predict all of them. We cannot guarantee future results, levels of activity, performance or achievements. Except as required by applicable law, including the securities laws of the United States, we do not intend to update any of the forward-looking statements to conform these statements to actual results. About Non-GAAP Financial Measures ChromaDex’s non-GAAP financial measures exclude interest, depreciation, amortization, non-cash share-based compensation costs, severance and restructuring expense, bad debt expense related to Elysium Health and total legal expense. ChromaDex used these non-GAAP measures when evaluating its financial results as well as for internal resource management, planning and forecasting purposes. These non-GAAP measures should not be viewed in isolation from or as a substitute for ChromaDex’s financial results in accordance with GAAP. Reconciliation of these non-GAAP measures to the most comparable GAAP measures are attached to this presentation. FDA Disclaimer Statements made in this presentation have not been evaluated by the Food and Drug Administration. ChromaDex products are not intended to diagnose, treat, cure, or prevent any disease. The statements in this presentation are for investor relations and educational purposes only and not intended for consumers or vendors. SAFE HARBOR STATEMENT
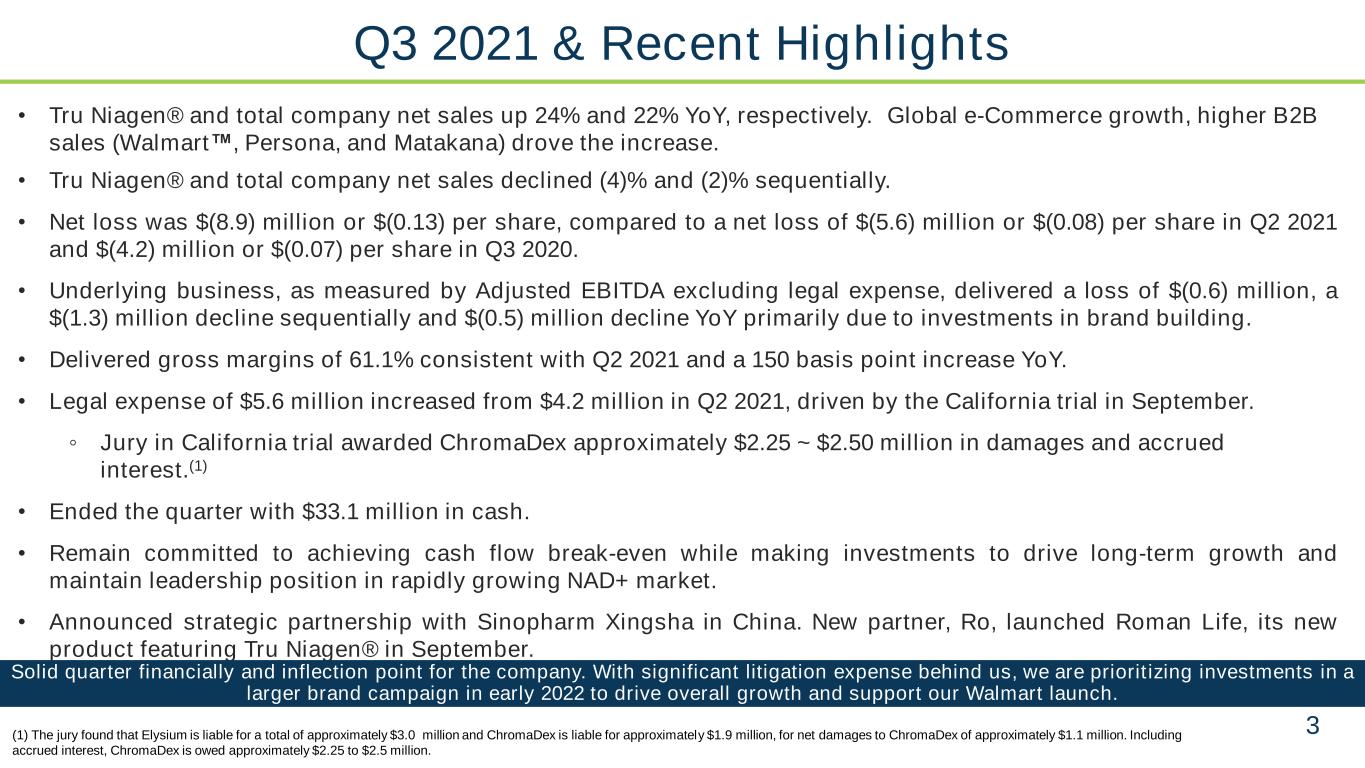
3 Q3 2021 & Recent Highlights (1) The jury found that Elysium is liable for a total of approximately $3.0 million and ChromaDex is liable for approximately $1.9 million, for net damages to ChromaDex of approximately $1.1 million. Including accrued interest, ChromaDex is owed approximately $2.25 to $2.5 million. • Tru Niagen® and total company net sales up 24% and 22% YoY, respectively. Global e-Commerce growth, higher B2B sales (Walmart™, Persona, and Matakana) drove the increase. • Tru Niagen® and total company net sales declined (4)% and (2)% sequentially. • Net loss was $(8.9) million or $(0.13) per share, compared to a net loss of $(5.6) million or $(0.08) per share in Q2 2021 and $(4.2) million or $(0.07) per share in Q3 2020. • Underlying business, as measured by Adjusted EBITDA excluding legal expense, delivered a loss of $(0.6) million, a $(1.3) million decline sequentially and $(0.5) million decline YoY primarily due to investments in brand building. • Delivered gross margins of 61.1% consistent with Q2 2021 and a 150 basis point increase YoY. • Legal expense of $5.6 million increased from $4.2 million in Q2 2021, driven by the California trial in September. ◦ Jury in California trial awarded ChromaDex approximately $2.25 ~ $2.50 million in damages and accrued interest.(1) • Ended the quarter with $33.1 million in cash. • Remain committed to achieving cash flow break-even while making investments to drive long-term growth and maintain leadership position in rapidly growing NAD+ market. • Announced strategic partnership with Sinopharm Xingsha in China. New partner, Ro, launched Roman Life, its new product featuring Tru Niagen® in September. Solid quarter financially and inflection point for the company. With significant litigation expense behind us, we are prioritizing investments in a larger brand campaign in early 2022 to drive overall growth and support our Walmart launch.
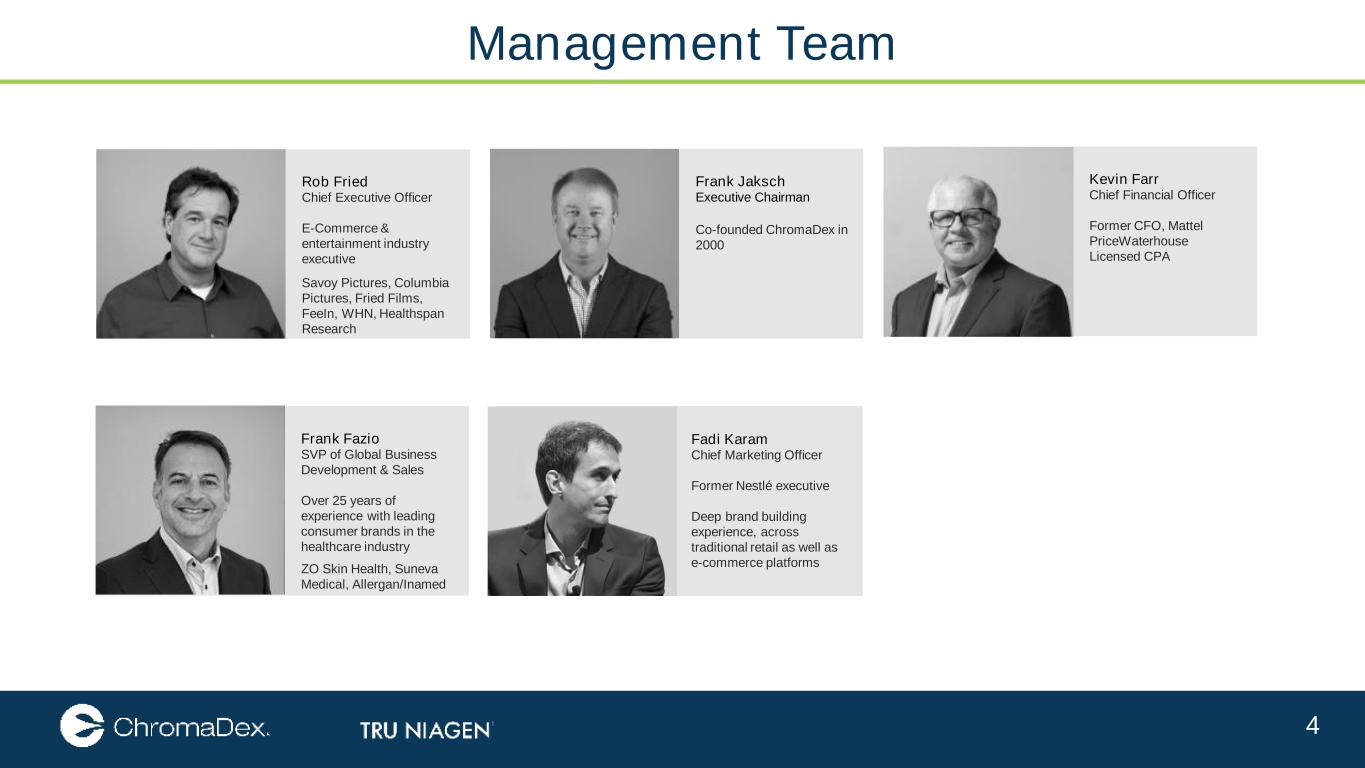
4 Management Team Rob Fried Chief Executive Officer E-Commerce & entertainment industry executive Savoy Pictures, Columbia Pictures, Fried Films, FeeIn, WHN, Healthspan Research Frank Jaksch Executive Chairman Co-founded ChromaDex in 2000 Kevin Farr Chief Financial Officer Former CFO, Mattel PriceWaterhouse Licensed CPA Frank Fazio SVP of Global Business Development & Sales Over 25 years of experience with leading consumer brands in the healthcare industry ZO Skin Health, Suneva Medical, Allergan/Inamed Fadi Karam Chief Marketing Officer Former Nestlé executive Deep brand building experience, across traditional retail as well as e-commerce platforms

The information contained in this documents is confidential, privileged and only for the information of the intended recipient and may not be used, published or redistributed without the prior written consent (2019) Scientific Update
6 Science Continues to Expand • Two new human studies on nicotinamide riboside registered since prior update:(1) • City of Hope Medical Center (August 2021) • The objective is to study the effect of exercise and nicotinamide riboside on muscle health and insulin resistance in adult survivors of childhood cancer with prediabetes • This study may help the future development of regimens to improve metabolic outcomes such as muscle health and insulin resistance in childhood cancer survivors • 20 participants will receive home exercise sessions over 30 minutes each, three days per week with and without NR for six weeks • Vitality in Aging Research Group, Inc. (August 2021) • The objective is to assess the safety and efficacy of study drugs and supplements on clinical signs of aging (structural and functional) and to explore/identify other possible biological measures of aging • Subjects will receive a combination of study drugs (metformin, dasatinib, rapamycin) and nutritional supplements (bio- quercetin, bio-fisetin, glucosamine, nicotinamide riboside, trans-resveratrol) in a four-part stepwise system • 50 participants will be given the study drugs and nutritional supplements for 12 months (after step four is reached) • Two new research studies signed through ChromaDex External Research Program (CERP)(2) (1) There are 66 ongoing, completed, and published clinical studies currently registered on clinicaltrials.gov to investigate the pharmacokinetics and therapeutic effects of NR alone or in combination with other ingredients. 51 of these use NR only. Clinicaltrials.gov also includes two niacin studies for a total of 68 under the search term “nicotinamide riboside.” (As of October 29, 2021) (2) 225+ research collaborations for Niagen® signed with research institutes and universities around the world. More than 90% of the studies are investigator initiated and were developed to support applications for or receipt of third-party funding. The studies may not have been initiated if investigators were unable to secure funding.
7 Recent Peer-Reviewed Clinical Publications • Movement Disorders – Willemsen et al., 2021 – “Nicotinamide Riboside Improves Ataxia Scores and Immunoglobulin Levels in Ataxia Telangiecstasia.” – September 2021 • First-of-its kind clinical study on NR in children, highlighting improvements for prematurely aging patients with Ataxia- Telangiectasia, or AT. • The study included 24 AT patients with 17 of them under the age of 18. • The effects of NR on ataxia (a group of disorders that affect coordination, balance and speech), dysarthria (a motor speech disorder), quality of life, and laboratory parameters were analyzed. • NR improved ataxia scores in patients and increased serum immunoglobulin G, or antibodies, which are important for protection against pathogens. Patients with AT are known to be immunodeficient with decreased serum immunoglobulins concentrations. • Molecular Systems Biology – Zeybel et al., 2021 – “Combined Metabolic Activators Therapy Ameliorates Liver Fat in Nonalcoholic Fatty Liver Disease Patients.” – October 2021 • Phase 2 clinical study of patients with nonalcoholic fatty liver disease (NAFLD) • Results found a 10% reduction in liver fat and improved liver function and inflammation in participants who received a nutritional protocol of four ingredients including NR • One of several human studies exploring the benefits of this nutritional protocol through ChromaDex’s research collaborator, ScandiBio Therapeutics
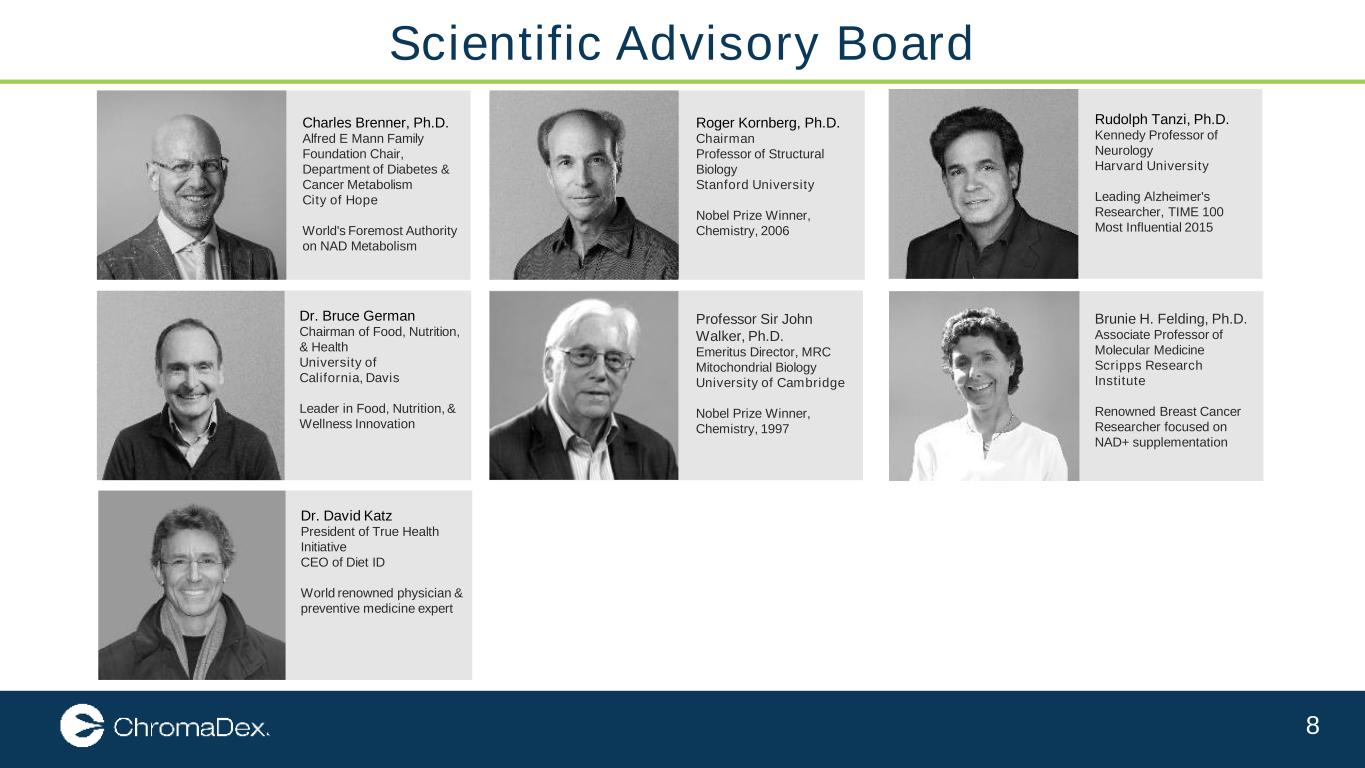
8 Scientific Advisory Board Charles Brenner, Ph.D. Alfred E Mann Family Foundation Chair, Department of Diabetes & Cancer Metabolism City of Hope World's Foremost Authority on NAD Metabolism Roger Kornberg, Ph.D. Chairman Professor of Structural Biology Stanford University Nobel Prize Winner, Chemistry, 2006 Rudolph Tanzi, Ph.D. Kennedy Professor of Neurology Harvard University Leading Alzheimer's Researcher, TIME 100 Most Influential 2015 Dr. Bruce German Chairman of Food, Nutrition, & Health University of California, Davis Leader in Food, Nutrition, & Wellness Innovation Professor Sir John Walker, Ph.D. Emeritus Director, MRC Mitochondrial Biology University of Cambridge Nobel Prize Winner, Chemistry, 1997 Brunie H. Felding, Ph.D. Associate Professor of Molecular Medicine Scripps Research Institute Renowned Breast Cancer Researcher focused on NAD+ supplementation Dr. David Katz President of True Health Initiative CEO of Diet ID World renowned physician & preventive medicine expert
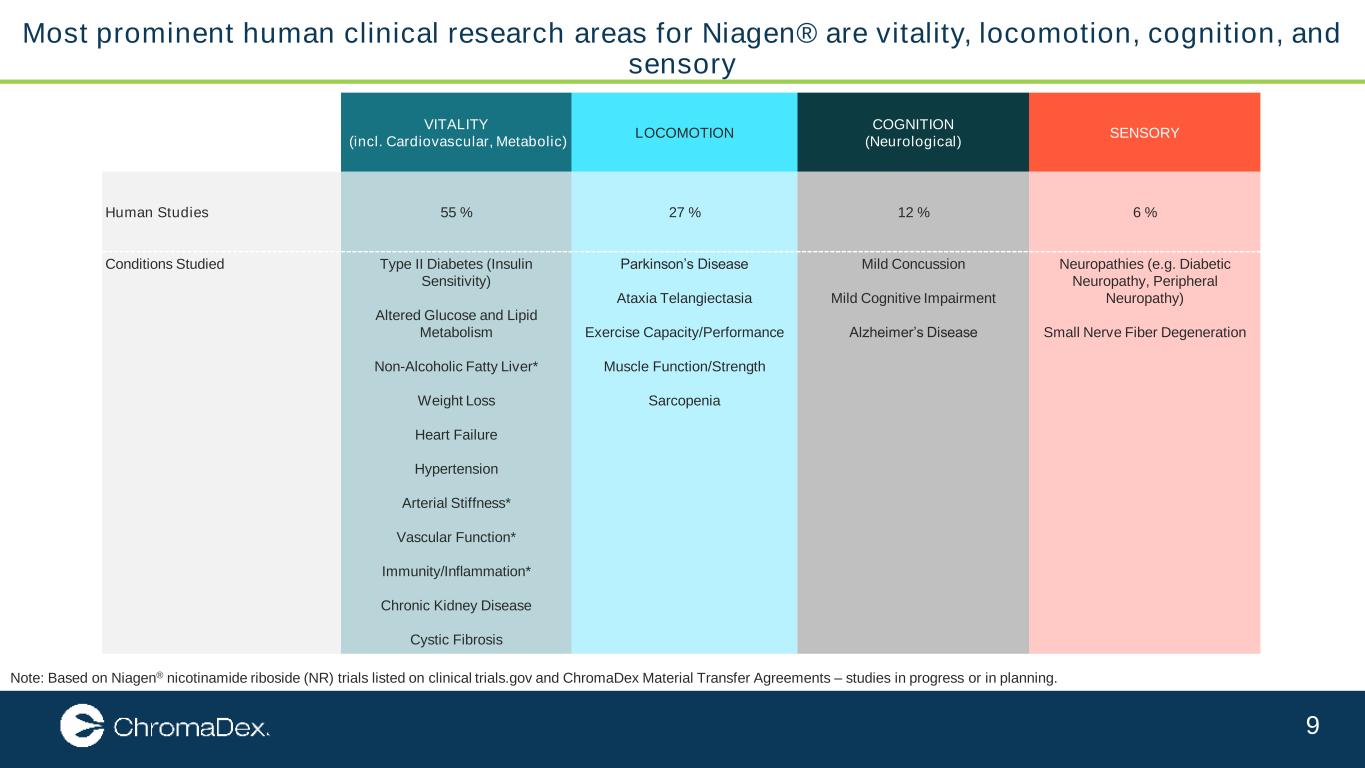
9 Note: Based on Niagen® nicotinamide riboside (NR) trials listed on clinical trials.gov and ChromaDex Material Transfer Agreements – studies in progress or in planning. Most prominent human clinical research areas for Niagen® are vitality, locomotion, cognition, and sensory VITALITY (incl. Cardiovascular, Metabolic) LOCOMOTION COGNITION (Neurological) SENSORY Human Studies 55 % 27 % 12 % 6 % Conditions Studied Type II Diabetes (Insulin Sensitivity) Altered Glucose and Lipid Metabolism Non-Alcoholic Fatty Liver* Weight Loss Heart Failure Hypertension Arterial Stiffness* Vascular Function* Immunity/Inflammation* Chronic Kidney Disease Cystic Fibrosis Parkinson’s Disease Ataxia Telangiectasia Exercise Capacity/Performance Muscle Function/Strength Sarcopenia Mild Concussion Mild Cognitive Impairment Alzheimer’s Disease Neuropathies (e.g. Diabetic Neuropathy, Peripheral Neuropathy) Small Nerve Fiber Degeneration
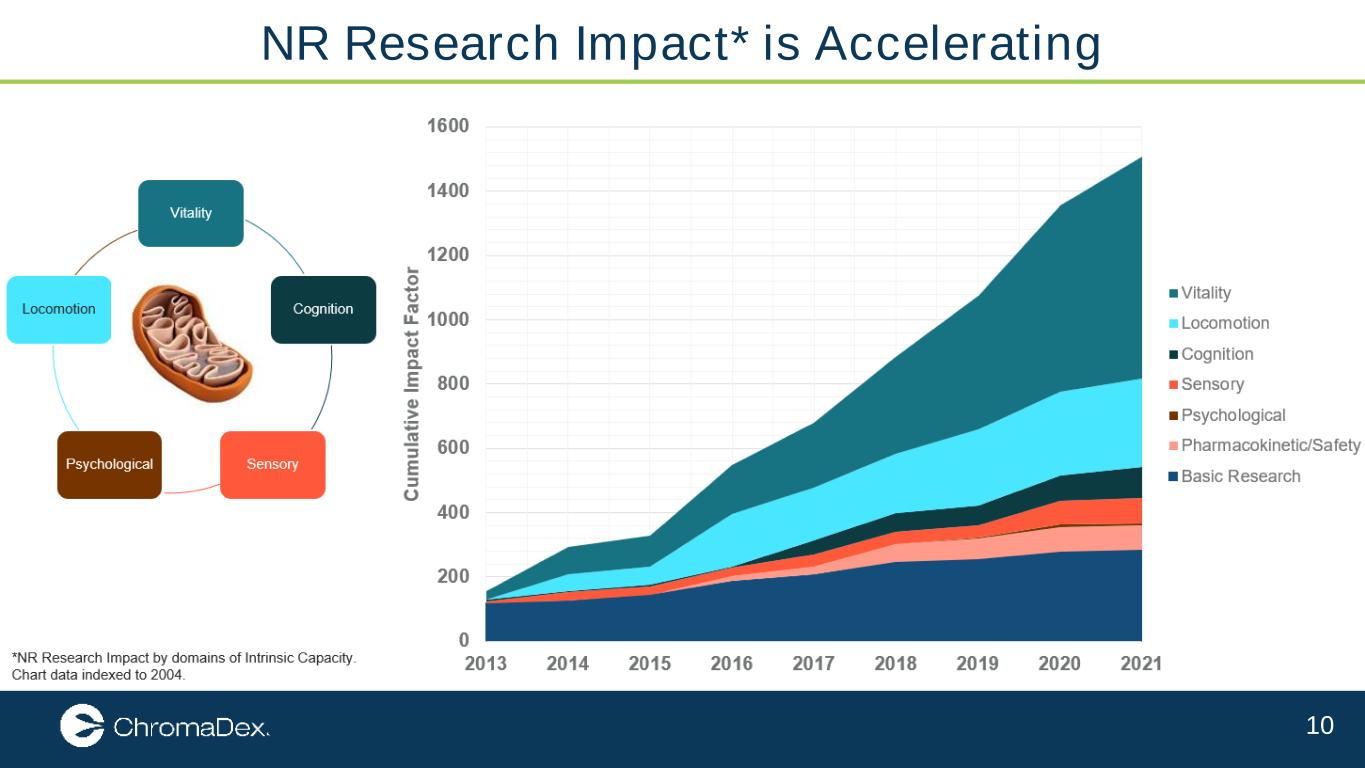
10 NR Research Impact* is Accelerating

Financial Highlights
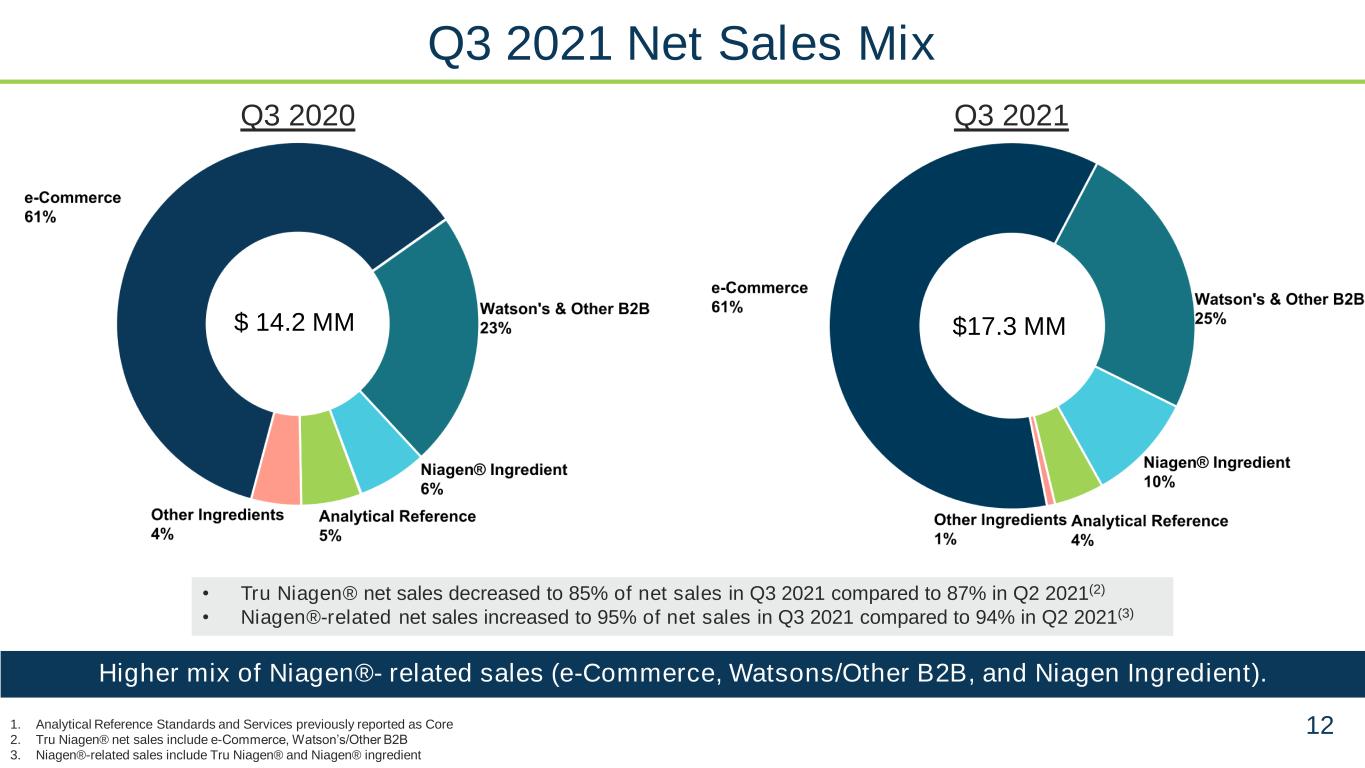
12 Q3 2021Q3 2020 • Tru Niagen® net sales decreased to 85% of net sales in Q3 2021 compared to 87% in Q2 2021(2) • Niagen®-related net sales increased to 95% of net sales in Q3 2021 compared to 94% in Q2 2021(3) 1. Analytical Reference Standards and Services previously reported as Core 2. Tru Niagen® net sales include e-Commerce, Watson’s/Other B2B 3. Niagen®-related sales include Tru Niagen® and Niagen® ingredient Higher mix of Niagen®- related sales (e-Commerce, Watsons/Other B2B, and Niagen Ingredient). Q3 2021 Net Sales Mix $ 14.2 MM $17.3 MM
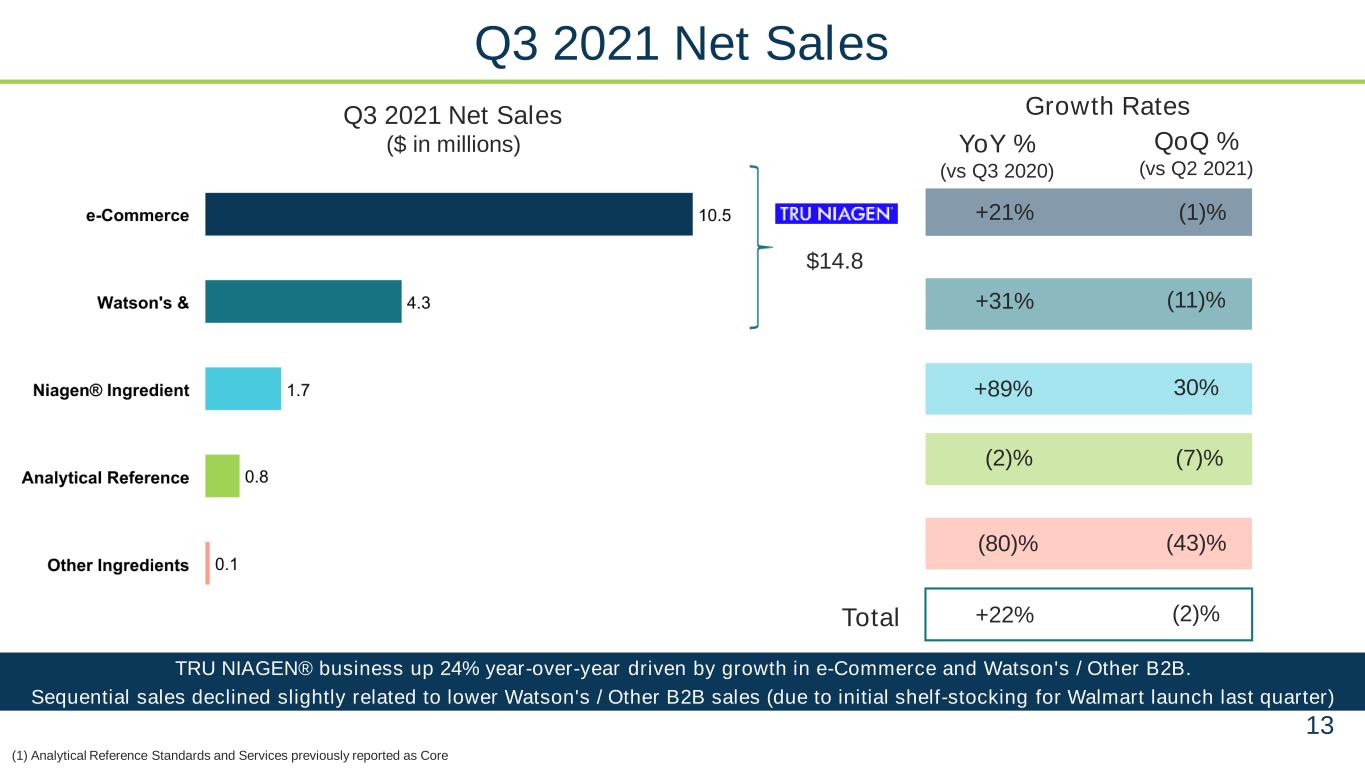
13 Growth Rates YoY % (vs Q3 2020) Q3 2021 Net Sales ($ in millions) QoQ % (vs Q2 2021) $14.8 +21% (1)% +31% (11)% +89% 30% (2)% (7)% (80)% (43)% +22% (2)%Total (1) Analytical Reference Standards and Services previously reported as Core Q3 2021 Net Sales TRU NIAGEN® business up 24% year-over-year driven by growth in e-Commerce and Watson's / Other B2B. Sequential sales declined slightly related to lower Watson's / Other B2B sales (due to initial shelf-stocking for Walmart launch last quarter)
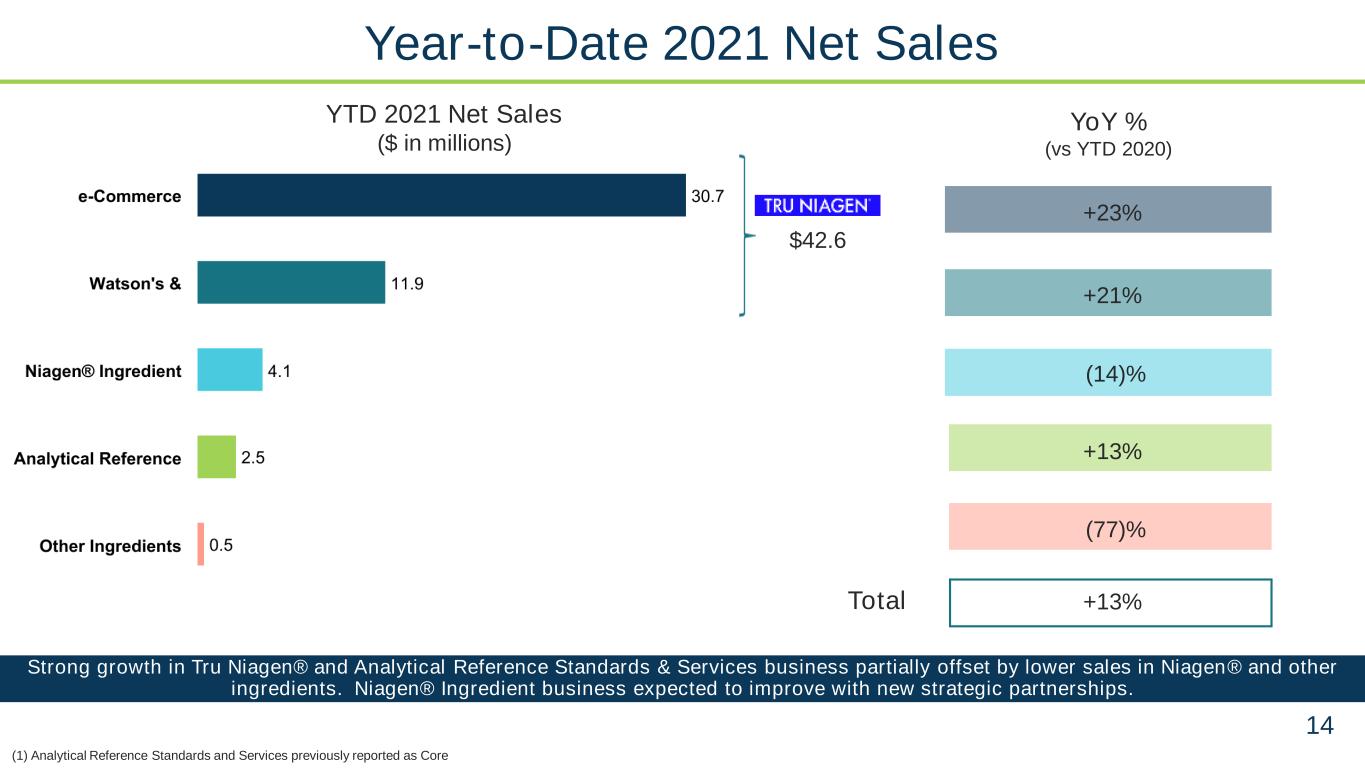
14 YTD 2021 Net Sales ($ in millions) Total Strong growth in Tru Niagen® and Analytical Reference Standards & Services business partially offset by lower sales in Niagen® and other ingredients. Niagen® Ingredient business expected to improve with new strategic partnerships. (1) Analytical Reference Standards and Services previously reported as Core Year-to-Date 2021 Net Sales +13% +23% +21% (14)% +13% (77)% YoY % (vs YTD 2020) $42.6
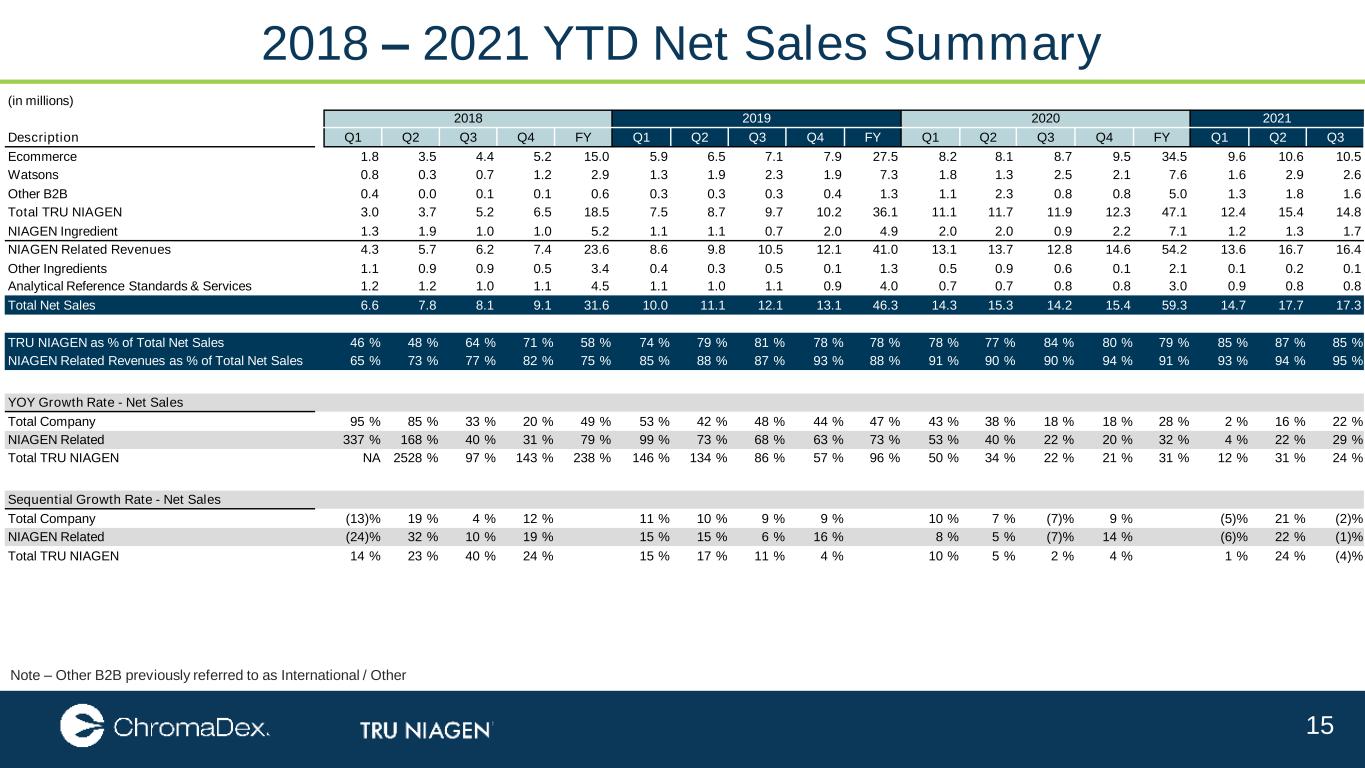
15 2018 – 2021 YTD Net Sales Summary Note – Other B2B previously referred to as International / Other (in millions) 2018 2019 2020 2021 Description Q1 Q2 Q3 Q4 FY Q1 Q2 Q3 Q4 FY Q1 Q2 Q3 Q4 FY Q1 Q2 Q3 Ecommerce 1.8 3.5 4.4 5.2 15.0 5.9 6.5 7.1 7.9 27.5 8.2 8.1 8.7 9.5 34.5 9.6 10.6 10.5 Watsons 0.8 0.3 0.7 1.2 2.9 1.3 1.9 2.3 1.9 7.3 1.8 1.3 2.5 2.1 7.6 1.6 2.9 2.6 Other B2B 0.4 0.0 0.1 0.1 0.6 0.3 0.3 0.3 0.4 1.3 1.1 2.3 0.8 0.8 5.0 1.3 1.8 1.6 Total TRU NIAGEN 3.0 3.7 5.2 6.5 18.5 7.5 8.7 9.7 10.2 36.1 11.1 11.7 11.9 12.3 47.1 12.4 15.4 14.8 NIAGEN Ingredient 1.3 1.9 1.0 1.0 5.2 1.1 1.1 0.7 2.0 4.9 2.0 2.0 0.9 2.2 7.1 1.2 1.3 1.7 NIAGEN Related Revenues 4.3 5.7 6.2 7.4 23.6 8.6 9.8 10.5 12.1 41.0 13.1 13.7 12.8 14.6 54.2 13.6 16.7 16.4 Other Ingredients 1.1 0.9 0.9 0.5 3.4 0.4 0.3 0.5 0.1 1.3 0.5 0.9 0.6 0.1 2.1 0.1 0.2 0.1 Analytical Reference Standards & Services 1.2 1.2 1.0 1.1 4.5 1.1 1.0 1.1 0.9 4.0 0.7 0.7 0.8 0.8 3.0 0.9 0.8 0.8 Total Net Sales 6.6 7.8 8.1 9.1 31.6 10.0 11.1 12.1 13.1 46.3 14.3 15.3 14.2 15.4 59.3 14.7 17.7 17.3 TRU NIAGEN as % of Total Net Sales 46 % 48 % 64 % 71 % 58 % 74 % 79 % 81 % 78 % 78 % 78 % 77 % 84 % 80 % 79 % 85 % 87 % 85 % NIAGEN Related Revenues as % of Total Net Sales 65 % 73 % 77 % 82 % 75 % 85 % 88 % 87 % 93 % 88 % 91 % 90 % 90 % 94 % 91 % 93 % 94 % 95 % YOY Growth Rate - Net Sales Total Company 95 % 85 % 33 % 20 % 49 % 53 % 42 % 48 % 44 % 47 % 43 % 38 % 18 % 18 % 28 % 2 % 16 % 22 % NIAGEN Related 337 % 168 % 40 % 31 % 79 % 99 % 73 % 68 % 63 % 73 % 53 % 40 % 22 % 20 % 32 % 4 % 22 % 29 % Total TRU NIAGEN NA 2528 % 97 % 143 % 238 % 146 % 134 % 86 % 57 % 96 % 50 % 34 % 22 % 21 % 31 % 12 % 31 % 24 % Sequential Growth Rate - Net Sales Total Company (13)% 19 % 4 % 12 % 11 % 10 % 9 % 9 % 10 % 7 % (7)% 9 % (5)% 21 % (2)% NIAGEN Related (24)% 32 % 10 % 19 % 15 % 15 % 6 % 16 % 8 % 5 % (7)% 14 % (6)% 22 % (1)% Total TRU NIAGEN 14 % 23 % 40 % 24 % 15 % 17 % 11 % 4 % 10 % 5 % 2 % 4 % 1 % 24 % (4)%
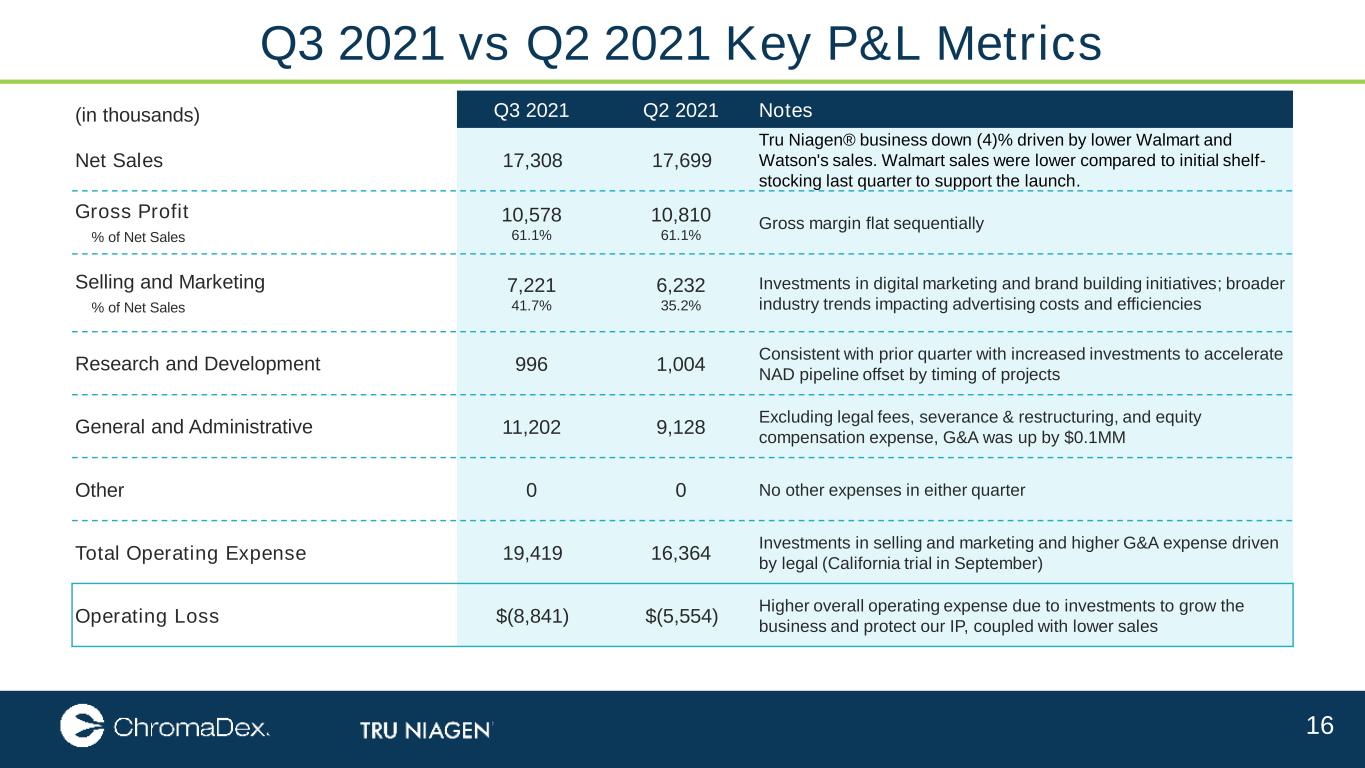
16 (in thousands) Q3 2021 Q2 2021 Notes Net Sales 17,308 17,699 Tru Niagen® business down (4)% driven by lower Walmart and Watson's sales. Walmart sales were lower compared to initial shelf- stocking last quarter to support the launch. Gross Profit % of Net Sales 10,578 61.1% 10,810 61.1% Gross margin flat sequentially Selling and Marketing % of Net Sales 7,221 41.7% 6,232 35.2% Investments in digital marketing and brand building initiatives; broader industry trends impacting advertising costs and efficiencies Research and Development 996 1,004 Consistent with prior quarter with increased investments to accelerate NAD pipeline offset by timing of projects General and Administrative 11,202 9,128 Excluding legal fees, severance & restructuring, and equity compensation expense, G&A was up by $0.1MM Other 0 0 No other expenses in either quarter Total Operating Expense 19,419 16,364 Investments in selling and marketing and higher G&A expense driven by legal (California trial in September) Operating Loss $(8,841) $(5,554) Higher overall operating expense due to investments to grow the business and protect our IP, coupled with lower sales Q3 2021 vs Q2 2021 Key P&L Metrics
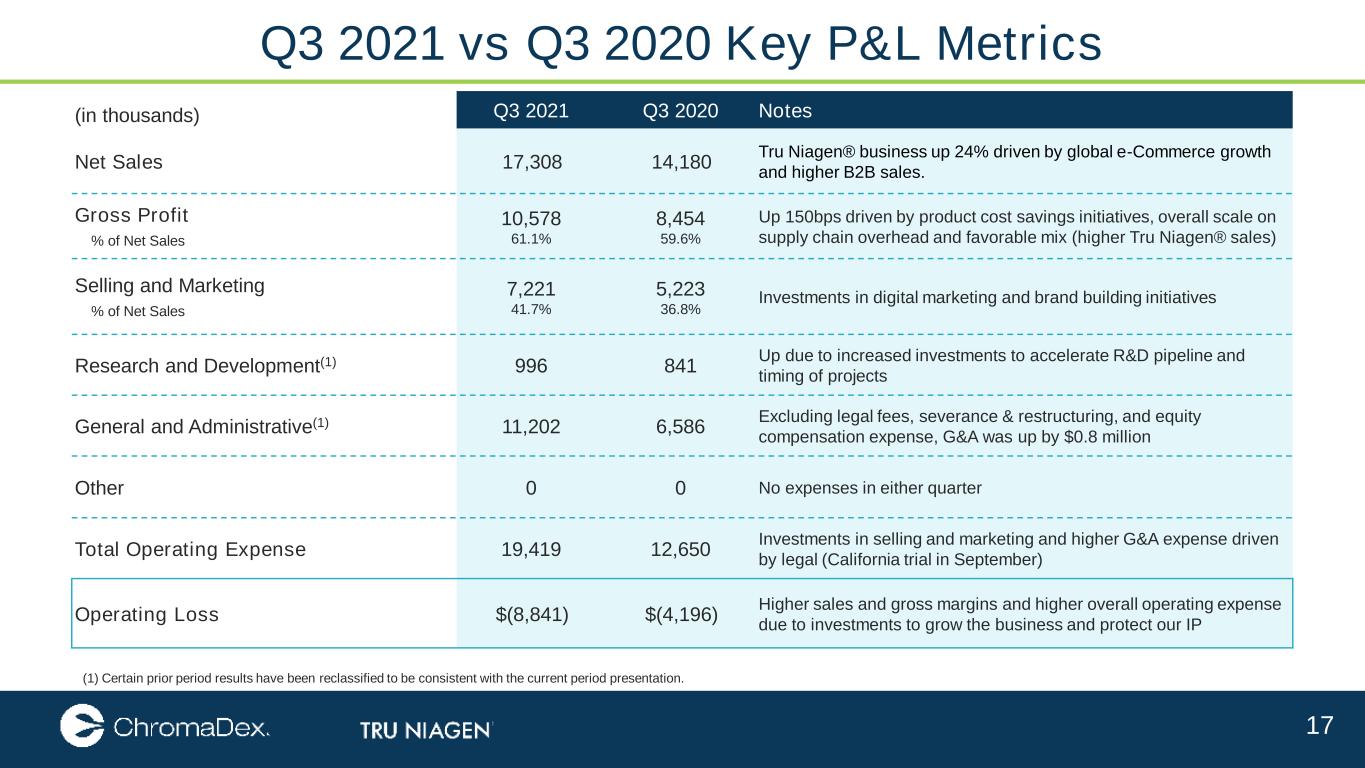
17 (in thousands) Q3 2021 Q3 2020 Notes Net Sales 17,308 14,180 Tru Niagen® business up 24% driven by global e-Commerce growth and higher B2B sales. Gross Profit % of Net Sales 10,578 61.1% 8,454 59.6% Up 150bps driven by product cost savings initiatives, overall scale on supply chain overhead and favorable mix (higher Tru Niagen® sales) Selling and Marketing % of Net Sales 7,221 41.7% 5,223 36.8% Investments in digital marketing and brand building initiatives Research and Development(1) 996 841 Up due to increased investments to accelerate R&D pipeline and timing of projects General and Administrative(1) 11,202 6,586 Excluding legal fees, severance & restructuring, and equity compensation expense, G&A was up by $0.8 million Other 0 0 No expenses in either quarter Total Operating Expense 19,419 12,650 Investments in selling and marketing and higher G&A expense driven by legal (California trial in September) Operating Loss $(8,841) $(4,196) Higher sales and gross margins and higher overall operating expense due to investments to grow the business and protect our IP Q3 2021 vs Q3 2020 Key P&L Metrics (1) Certain prior period results have been reclassified to be consistent with the current period presentation.
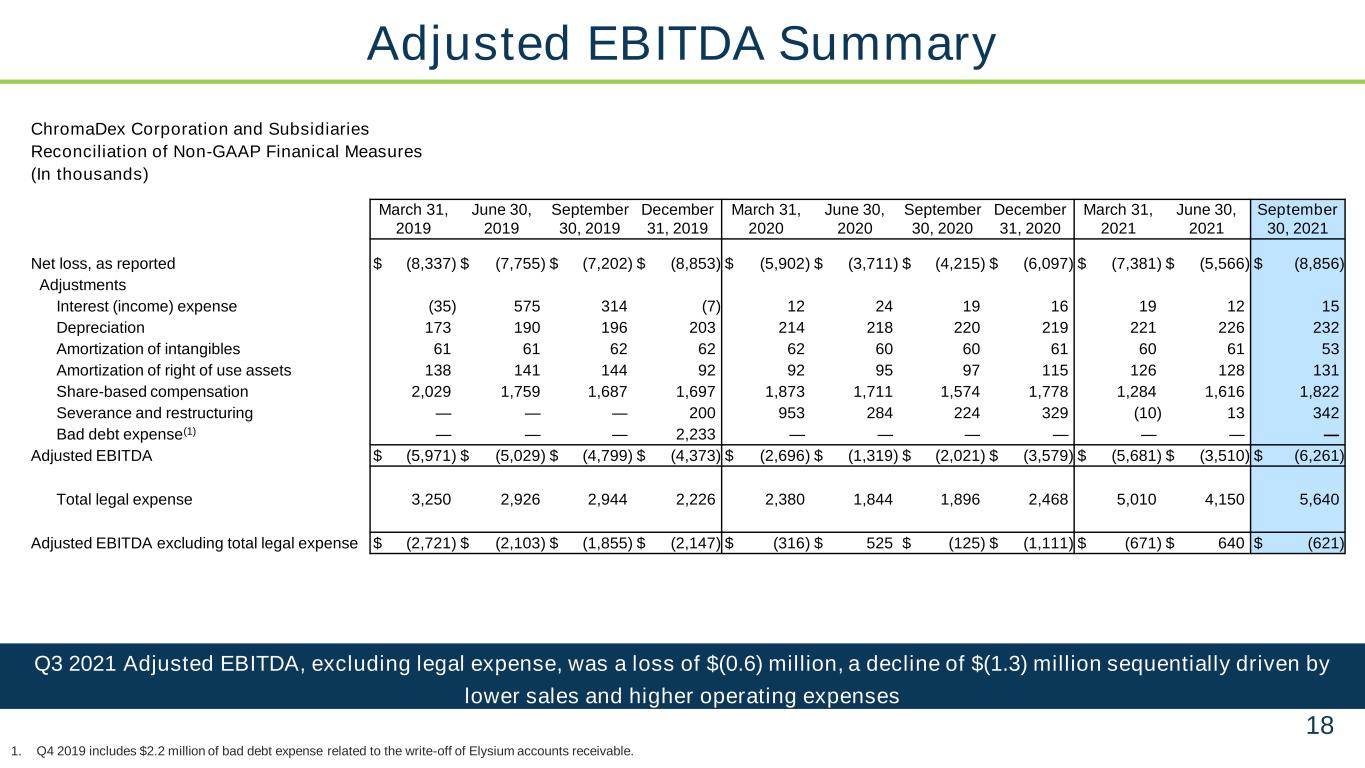
18 Q3 2021 Adjusted EBITDA, excluding legal expense, was a loss of $(0.6) million, a decline of $(1.3) million sequentially driven by lower sales and higher operating expenses Adjusted EBITDA Summary 1. Q4 2019 includes $2.2 million of bad debt expense related to the write-off of Elysium accounts receivable. ChromaDex Corporation and Subsidiaries Reconciliation of Non-GAAP Finanical Measures (In thousands) March 31, 2019 June 30, 2019 September 30, 2019 December 31, 2019 March 31, 2020 June 30, 2020 September 30, 2020 December 31, 2020 March 31, 2021 June 30, 2021 September 30, 2021 Net loss, as reported $ (8,337) $ (7,755) $ (7,202) $ (8,853) $ (5,902) $ (3,711) $ (4,215) $ (6,097) $ (7,381) $ (5,566) $ (8,856) Adjustments Interest (income) expense (35) 575 314 (7) 12 24 19 16 19 12 15 Depreciation 173 190 196 203 214 218 220 219 221 226 232 Amortization of intangibles 61 61 62 62 62 60 60 61 60 61 53 Amortization of right of use assets 138 141 144 92 92 95 97 115 126 128 131 Share-based compensation 2,029 1,759 1,687 1,697 1,873 1,711 1,574 1,778 1,284 1,616 1,822 Severance and restructuring — — — 200 953 284 224 329 (10) 13 342 Bad debt expense(1) — — — 2,233 — — — — — — — Adjusted EBITDA $ (5,971) $ (5,029) $ (4,799) $ (4,373) $ (2,696) $ (1,319) $ (2,021) $ (3,579) $ (5,681) $ (3,510) $ (6,261) Total legal expense 3,250 2,926 2,944 2,226 2,380 1,844 1,896 2,468 5,010 4,150 5,640 Adjusted EBITDA excluding total legal expense $ (2,721) $ (2,103) $ (1,855) $ (2,147) $ (316) $ 525 $ (125) $ (1,111) $ (671) $ 640 $ (621)
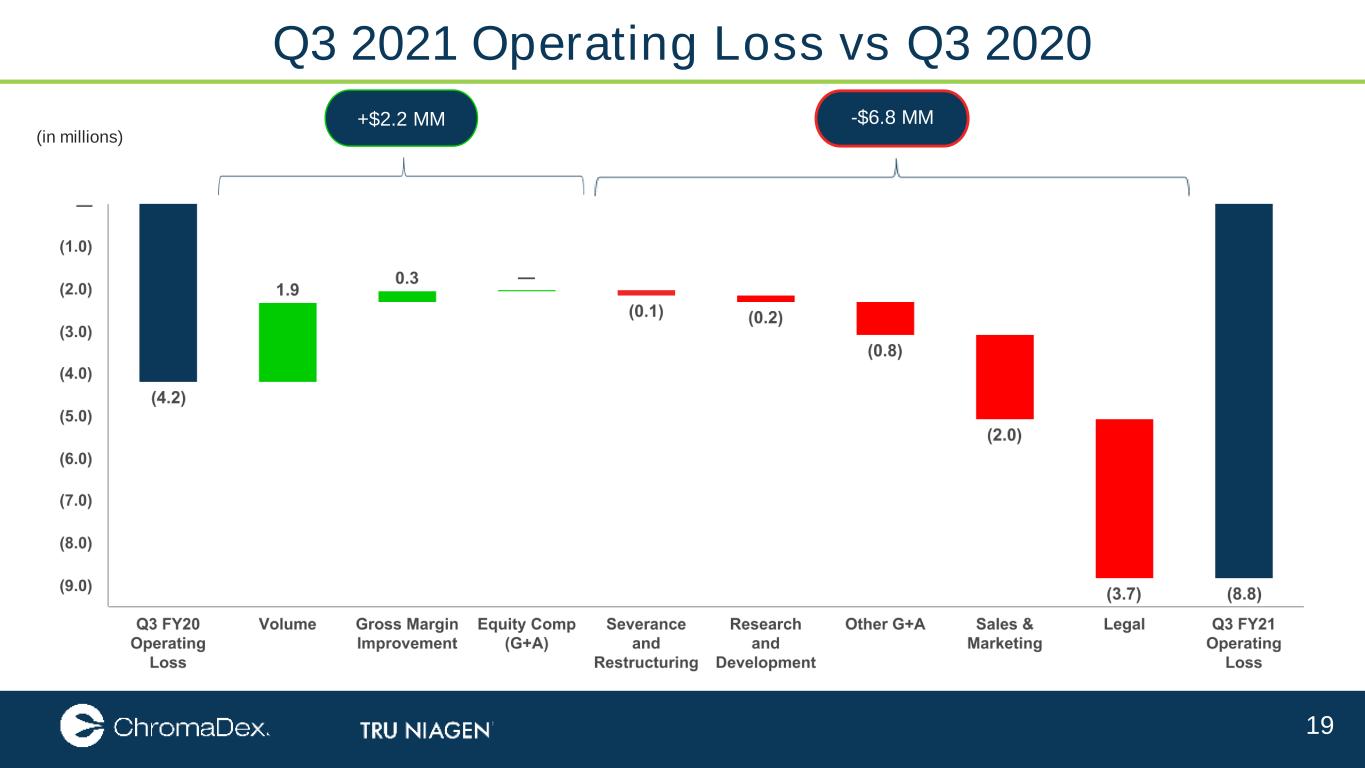
19 Q3 2021 Operating Loss vs Q3 2020 (in millions) +$2.2 MM -$6.8 MM
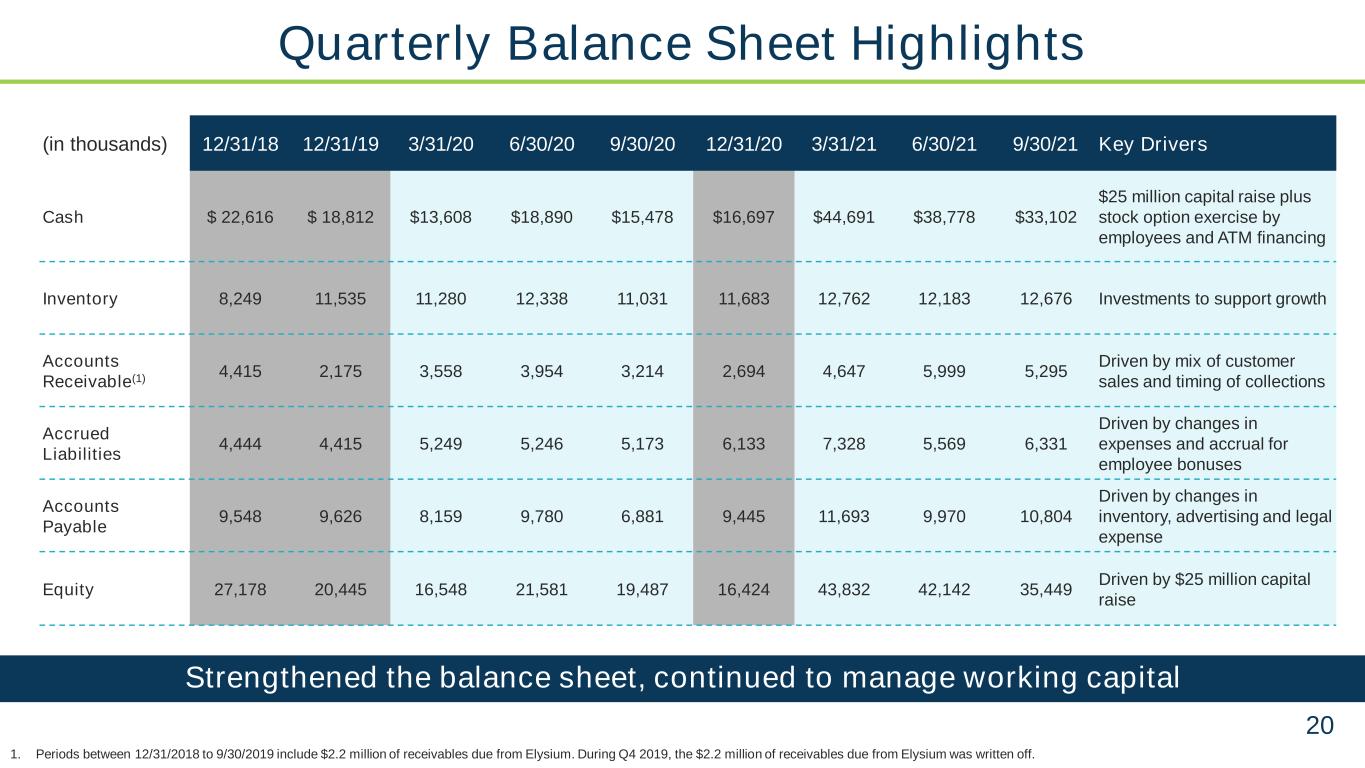
20 Strengthened the balance sheet, continued to manage working capital (in thousands) 12/31/18 12/31/19 3/31/20 6/30/20 9/30/20 12/31/20 3/31/21 6/30/21 9/30/21 Key Drivers Cash $ 22,616 $ 18,812 $13,608 $18,890 $15,478 $16,697 $44,691 $38,778 $33,102 $25 million capital raise plus stock option exercise by employees and ATM financing Inventory 8,249 11,535 11,280 12,338 11,031 11,683 12,762 12,183 12,676 Investments to support growth Accounts Receivable(1) 4,415 2,175 3,558 3,954 3,214 2,694 4,647 5,999 5,295 Driven by mix of customer sales and timing of collections Accrued Liabilities 4,444 4,415 5,249 5,246 5,173 6,133 7,328 5,569 6,331 Driven by changes in expenses and accrual for employee bonuses Accounts Payable 9,548 9,626 8,159 9,780 6,881 9,445 11,693 9,970 10,804 Driven by changes in inventory, advertising and legal expense Equity 27,178 20,445 16,548 21,581 19,487 16,424 43,832 42,142 35,449 Driven by $25 million capital raise 1. Periods between 12/31/2018 to 9/30/2019 include $2.2 million of receivables due from Elysium. During Q4 2019, the $2.2 million of receivables due from Elysium was written off. Quarterly Balance Sheet Highlights
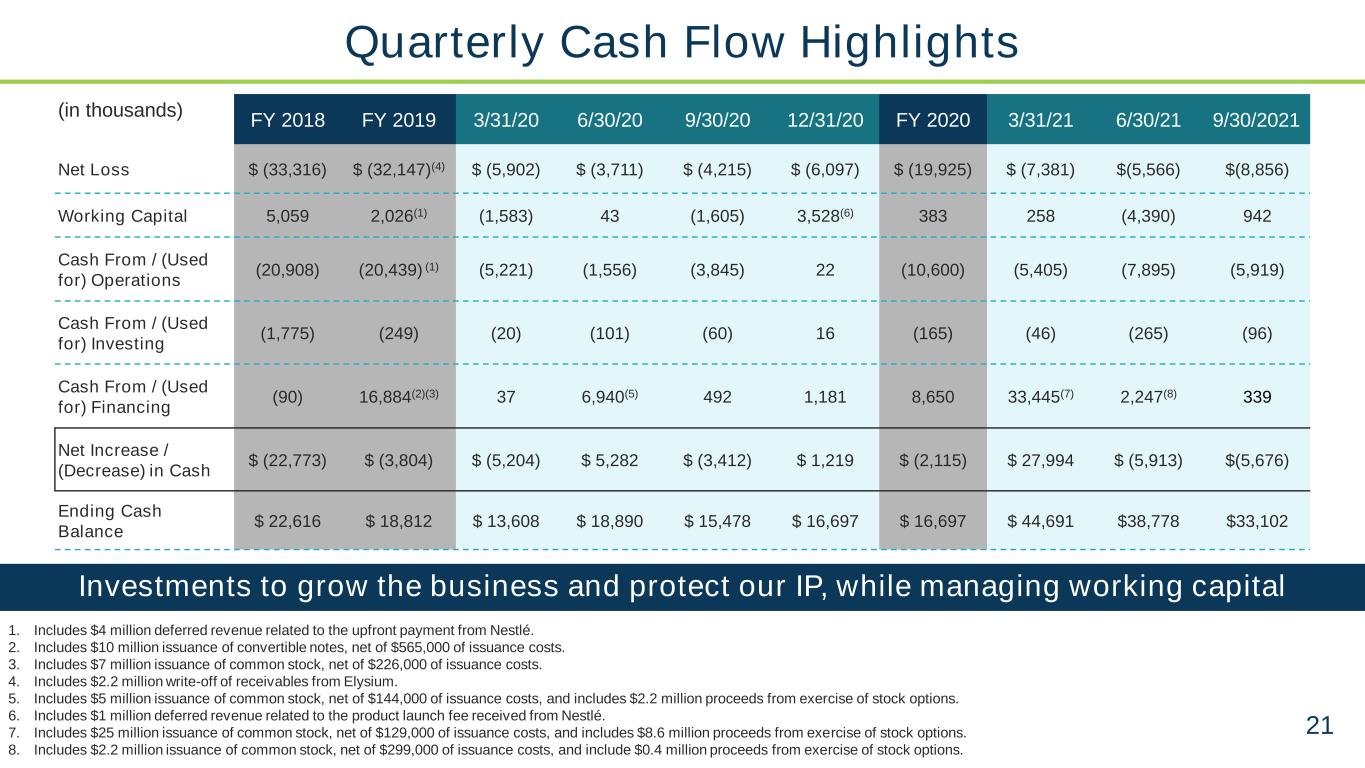
21 1. Includes $4 million deferred revenue related to the upfront payment from Nestlé. 2. Includes $10 million issuance of convertible notes, net of $565,000 of issuance costs. 3. Includes $7 million issuance of common stock, net of $226,000 of issuance costs. 4. Includes $2.2 million write-off of receivables from Elysium. 5. Includes $5 million issuance of common stock, net of $144,000 of issuance costs, and includes $2.2 million proceeds from exercise of stock options. 6. Includes $1 million deferred revenue related to the product launch fee received from Nestlé. 7. Includes $25 million issuance of common stock, net of $129,000 of issuance costs, and includes $8.6 million proceeds from exercise of stock options. 8. Includes $2.2 million issuance of common stock, net of $299,000 of issuance costs, and include $0.4 million proceeds from exercise of stock options. Quarterly Cash Flow Highlights Investments to grow the business and protect our IP, while managing working capital (in thousands) FY 2018 FY 2019 3/31/20 6/30/20 9/30/20 12/31/20 FY 2020 3/31/21 6/30/21 9/30/2021 Net Loss $ (33,316) $ (32,147)(4) $ (5,902) $ (3,711) $ (4,215) $ (6,097) $ (19,925) $ (7,381) $(5,566) $(8,856) Working Capital 5,059 2,026(1) (1,583) 43 (1,605) 3,528(6) 383 258 (4,390) 942 Cash From / (Used for) Operations (20,908) (20,439) (1) (5,221) (1,556) (3,845) 22 (10,600) (5,405) (7,895) (5,919) Cash From / (Used for) Investing (1,775) (249) (20) (101) (60) 16 (165) (46) (265) (96) Cash From / (Used for) Financing (90) 16,884(2)(3) 37 6,940(5) 492 1,181 8,650 33,445(7) 2,247(8) 339 Net Increase / (Decrease) in Cash $ (22,773) $ (3,804) $ (5,204) $ 5,282 $ (3,412) $ 1,219 $ (2,115) $ 27,994 $ (5,913) $(5,676) Ending Cash Balance $ 22,616 $ 18,812 $ 13,608 $ 18,890 $ 15,478 $ 16,697 $ 16,697 $ 44,691 $38,778 $33,102
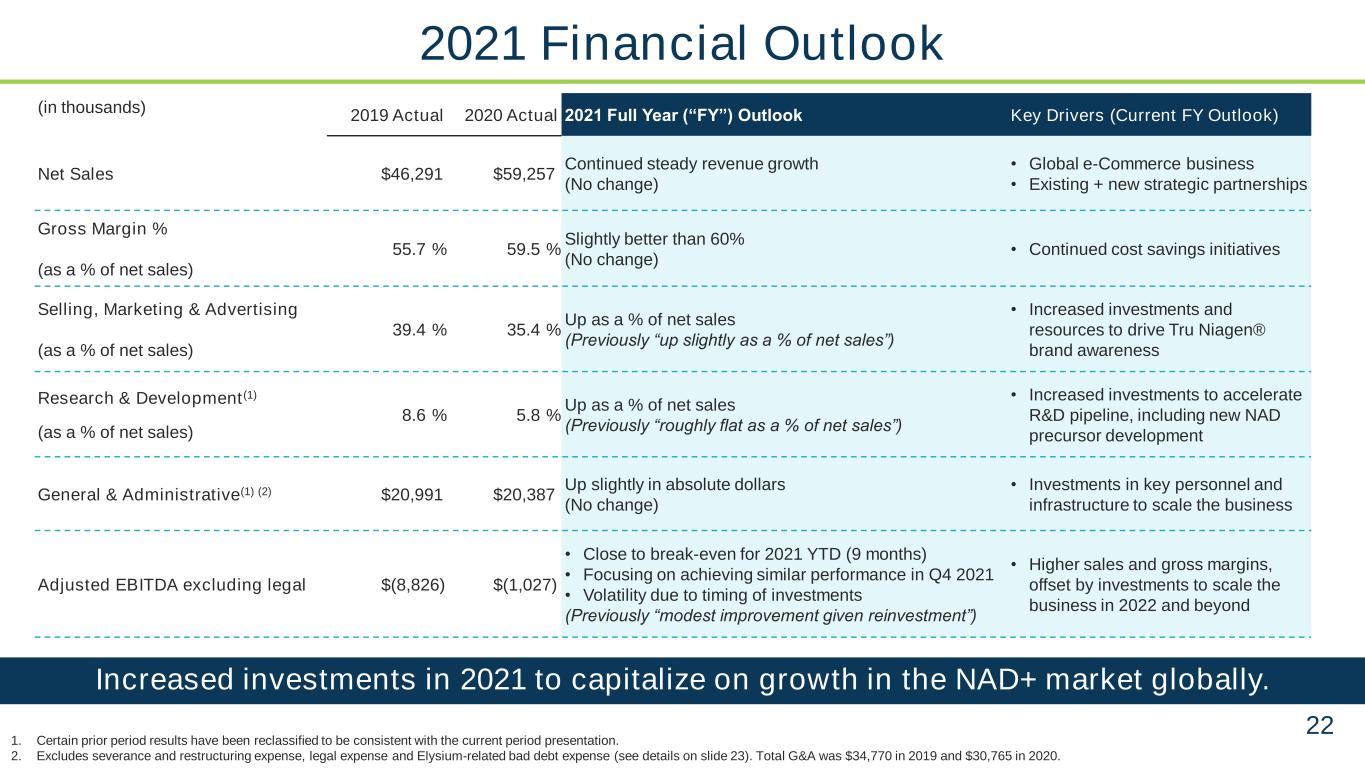
22 2021 Financial Outlook (in thousands) 2019 Actual 2020 Actual 2021 Full Year (“FY”) Outlook Key Drivers (Current FY Outlook) Net Sales $46,291 $59,257 Continued steady revenue growth (No change) • Global e-Commerce business • Existing + new strategic partnerships Gross Margin % (as a % of net sales) 55.7 % 59.5 % Slightly better than 60% (No change) • Continued cost savings initiatives Selling, Marketing & Advertising (as a % of net sales) 39.4 % 35.4 % Up as a % of net sales (Previously “up slightly as a % of net sales”) • Increased investments and resources to drive Tru Niagen® brand awareness Research & Development(1) (as a % of net sales) 8.6 % 5.8 % Up as a % of net sales (Previously “roughly flat as a % of net sales”) • Increased investments to accelerate R&D pipeline, including new NAD precursor development General & Administrative(1) (2) $20,991 $20,387 Up slightly in absolute dollars (No change) • Investments in key personnel and infrastructure to scale the business Adjusted EBITDA excluding legal $(8,826) $(1,027) • Close to break-even for 2021 YTD (9 months) • Focusing on achieving similar performance in Q4 2021 • Volatility due to timing of investments (Previously “modest improvement given reinvestment”) • Higher sales and gross margins, offset by investments to scale the business in 2022 and beyond Increased investments in 2021 to capitalize on growth in the NAD+ market globally. 1. Certain prior period results have been reclassified to be consistent with the current period presentation. 2. Excludes severance and restructuring expense, legal expense and Elysium-related bad debt expense (see details on slide 23). Total G&A was $34,770 in 2019 and $30,765 in 2020.
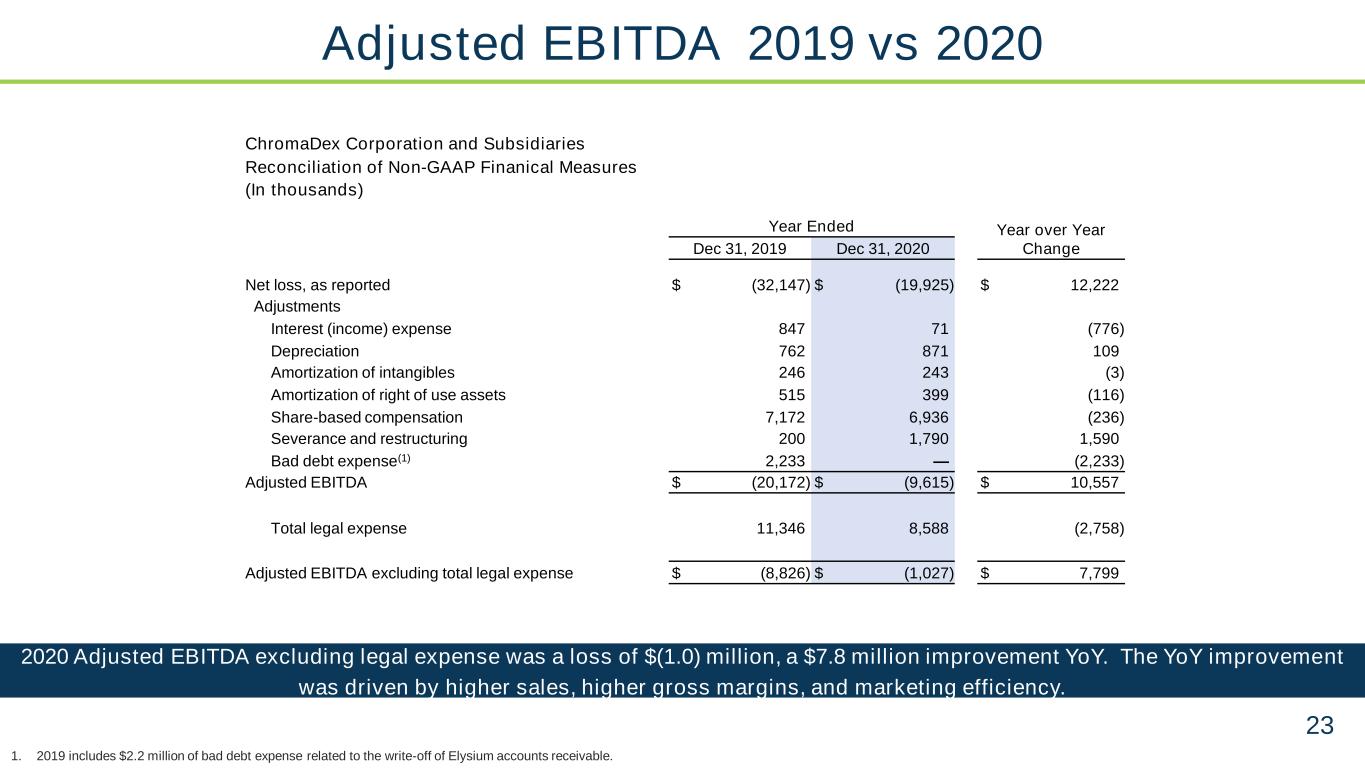
23 2020 Adjusted EBITDA excluding legal expense was a loss of $(1.0) million, a $7.8 million improvement YoY. The YoY improvement was driven by higher sales, higher gross margins, and marketing efficiency. Adjusted EBITDA 2019 vs 2020 1. 2019 includes $2.2 million of bad debt expense related to the write-off of Elysium accounts receivable. ChromaDex Corporation and Subsidiaries Reconciliation of Non-GAAP Finanical Measures (In thousands) Year Ended Year over Year ChangeDec 31, 2019 Dec 31, 2020 Net loss, as reported $ (32,147) $ (19,925) $ 12,222 Adjustments Interest (income) expense 847 71 (776) Depreciation 762 871 109 Amortization of intangibles 246 243 (3) Amortization of right of use assets 515 399 (116) Share-based compensation 7,172 6,936 (236) Severance and restructuring 200 1,790 1,590 Bad debt expense(1) 2,233 — (2,233) Adjusted EBITDA $ (20,172) $ (9,615) $ 10,557 Total legal expense 11,346 8,588 (2,758) Adjusted EBITDA excluding total legal expense $ (8,826) $ (1,027) $ 7,799
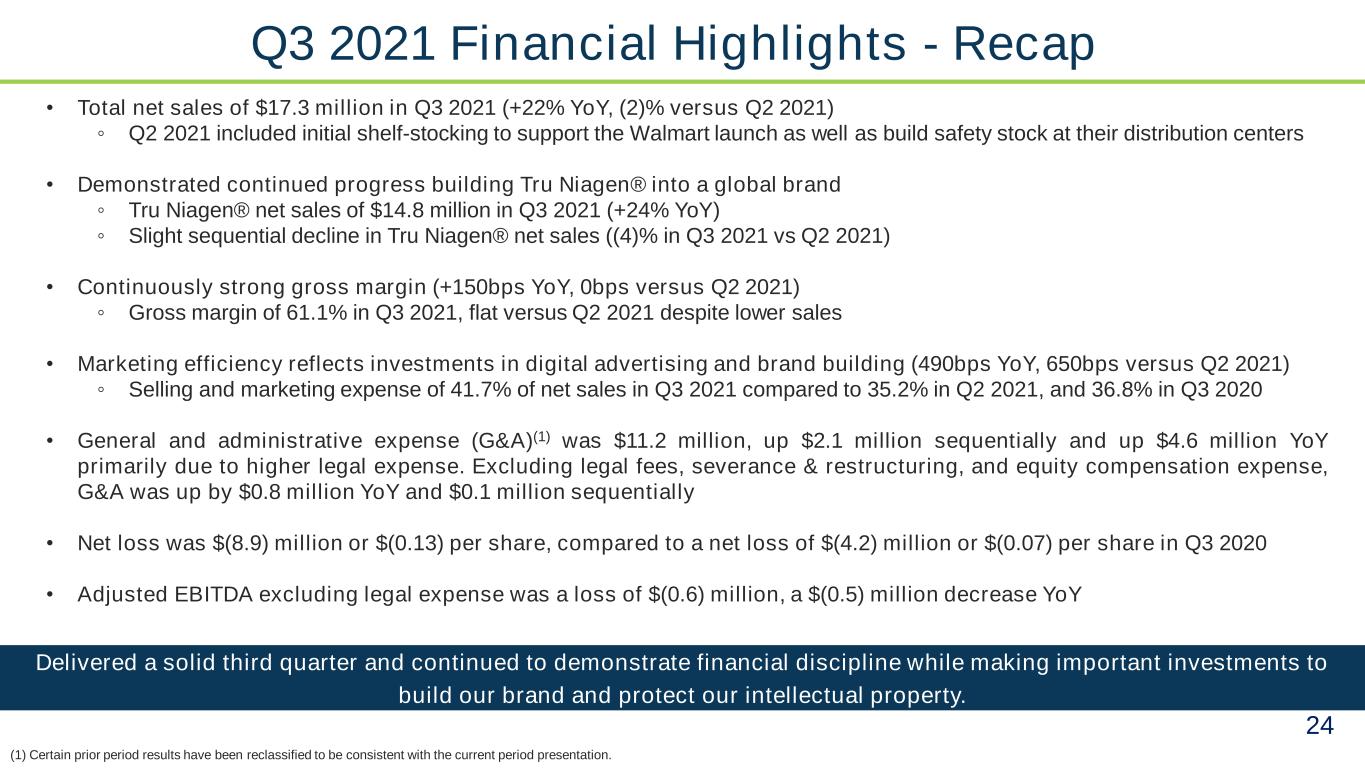
24 Delivered a solid third quarter and continued to demonstrate financial discipline while making important investments to build our brand and protect our intellectual property. • Total net sales of $17.3 million in Q3 2021 (+22% YoY, (2)% versus Q2 2021) ◦ Q2 2021 included initial shelf-stocking to support the Walmart launch as well as build safety stock at their distribution centers • Demonstrated continued progress building Tru Niagen® into a global brand ◦ Tru Niagen® net sales of $14.8 million in Q3 2021 (+24% YoY) ◦ Slight sequential decline in Tru Niagen® net sales ((4)% in Q3 2021 vs Q2 2021) • Continuously strong gross margin (+150bps YoY, 0bps versus Q2 2021) ◦ Gross margin of 61.1% in Q3 2021, flat versus Q2 2021 despite lower sales • Marketing efficiency reflects investments in digital advertising and brand building (490bps YoY, 650bps versus Q2 2021) ◦ Selling and marketing expense of 41.7% of net sales in Q3 2021 compared to 35.2% in Q2 2021, and 36.8% in Q3 2020 • General and administrative expense (G&A)(1) was $11.2 million, up $2.1 million sequentially and up $4.6 million YoY primarily due to higher legal expense. Excluding legal fees, severance & restructuring, and equity compensation expense, G&A was up by $0.8 million YoY and $0.1 million sequentially • Net loss was $(8.9) million or $(0.13) per share, compared to a net loss of $(4.2) million or $(0.07) per share in Q3 2020 • Adjusted EBITDA excluding legal expense was a loss of $(0.6) million, a $(0.5) million decrease YoY Q3 2021 Financial Highlights - Recap (1) Certain prior period results have been reclassified to be consistent with the current period presentation.
25 Contact Info Brianna Gerber Vice President of Finance and Investor Relations T: +1.949.419.0288 ext. 127 [email protected] www.chromadex.com Where to buy TRU NIAGEN® truniagen.com amazon.com Walmart.com and select Walmart Retail Locations