Exhibit 99.1
 |
NEWS RELEASE |
Nabors Announces Fourth Quarter 2024 Results
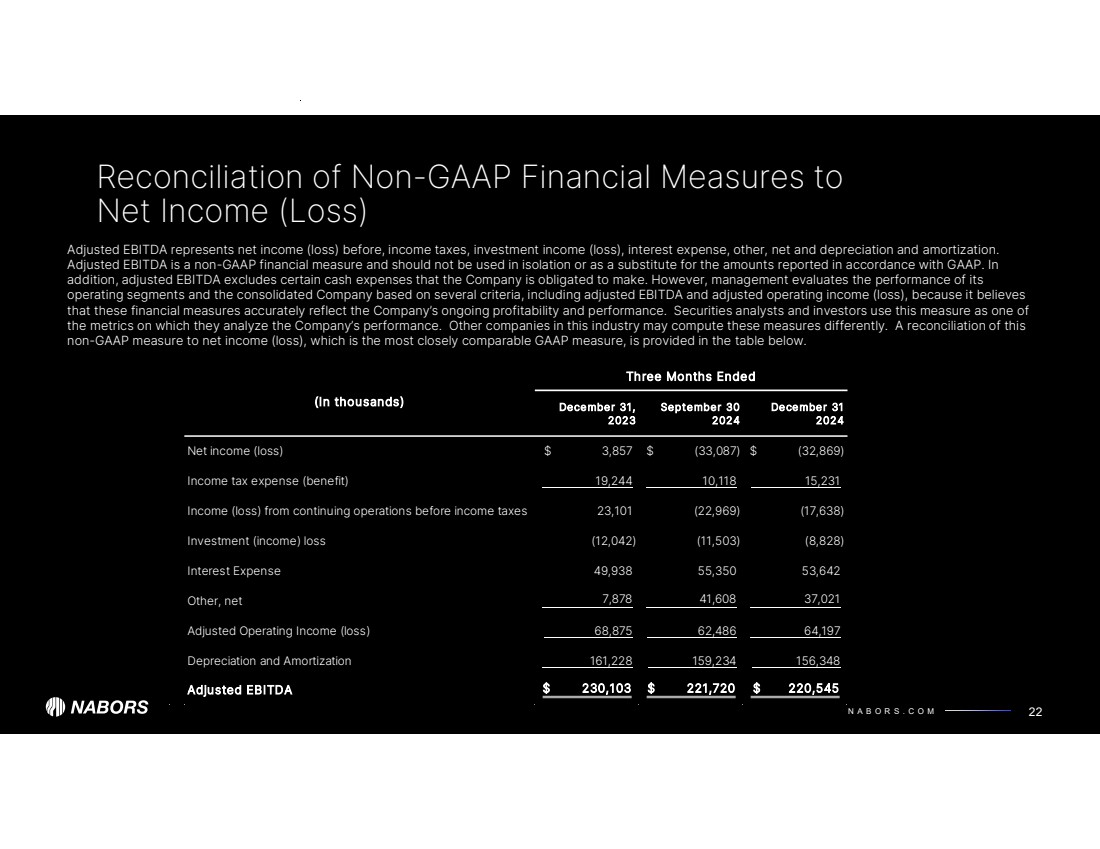
HAMILTON, Bermuda, February 12, 2025 /PRNewswire/ - Nabors Industries Ltd. (“Nabors” or the “Company”) (NYSE: NBR) today reported fourth quarter 2024 operating revenues of $730 million, compared to operating revenues of $732 million in the third quarter. The net loss attributable to Nabors shareholders for the quarter was $54 million, compared to a net loss of $56 million in the third quarter. This equates to a loss of $6.67 per diluted share, compared to a loss per diluted share of $6.86 in the third quarter. Fourth quarter adjusted EBITDA was $221 million, compared to $222 million in the previous quarter.
Highlights
| o | Nabors shareholders approved the issuance of shares to Parker Wellbore (“Parker”) stockholders in connection with the merger between Parker and Nabors. Parker shareholders also approved the merger. Pending certain international regulatory approvals, the merger is expected to close during the first quarter of 2025. |
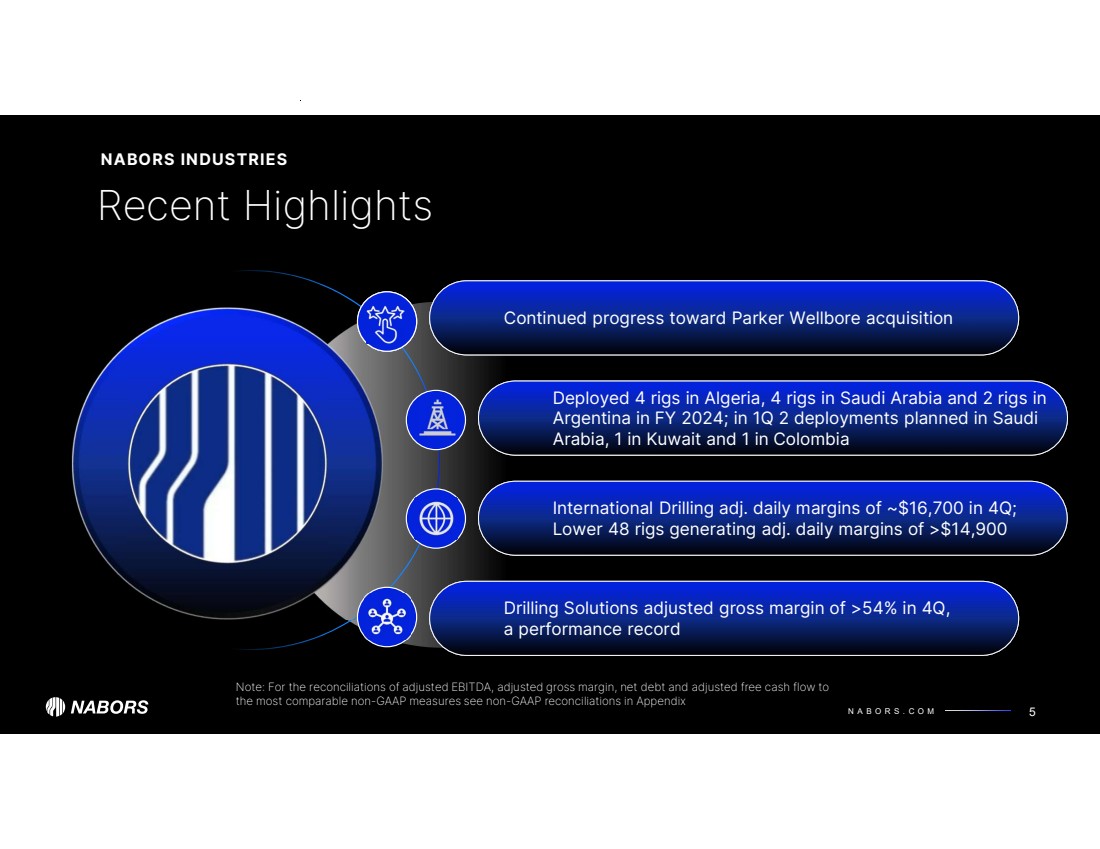
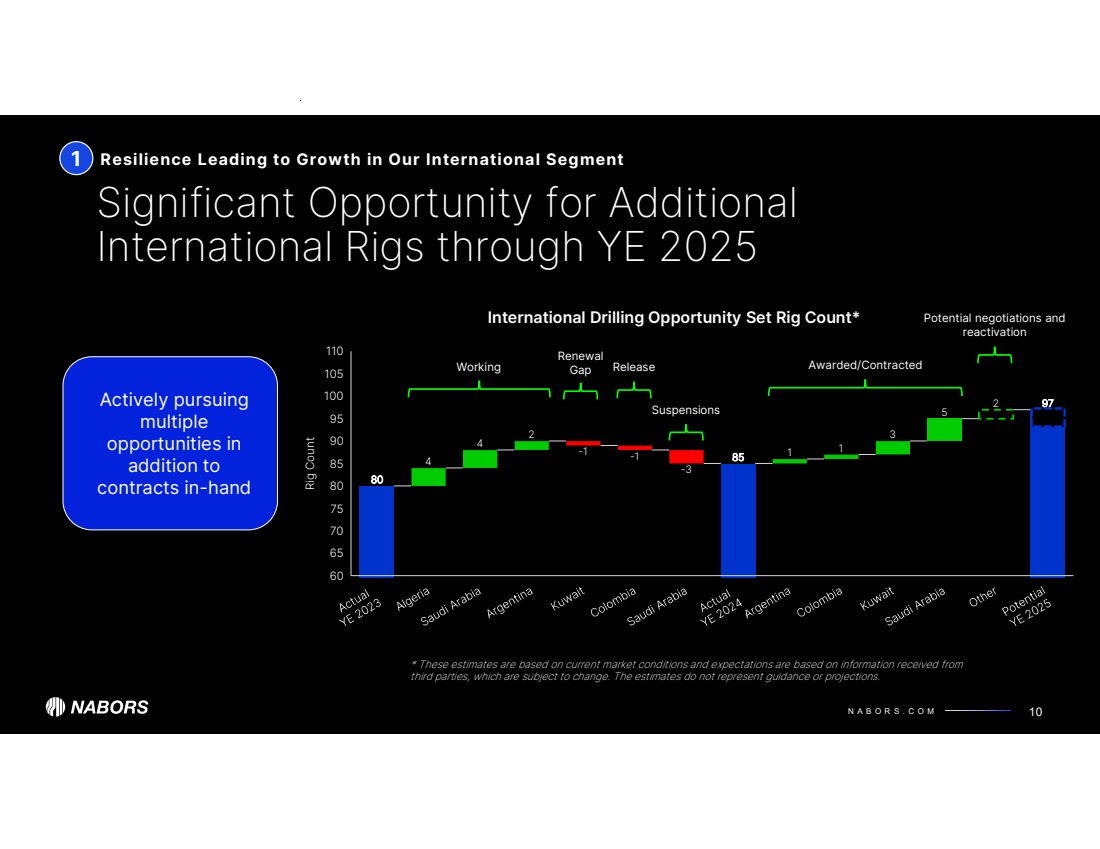
| o | Nabors received awards for three rigs in Argentina, two of which will be transferred from the U.S. on five-year contracts. The third rig is currently working in country and is scheduled to start its new contract before the end of the year. In addition, the Company received another award for an idle rig in Colombia. These reactivations are capital efficient opportunities to support growth, while improving Nabors’ asset utilization. |
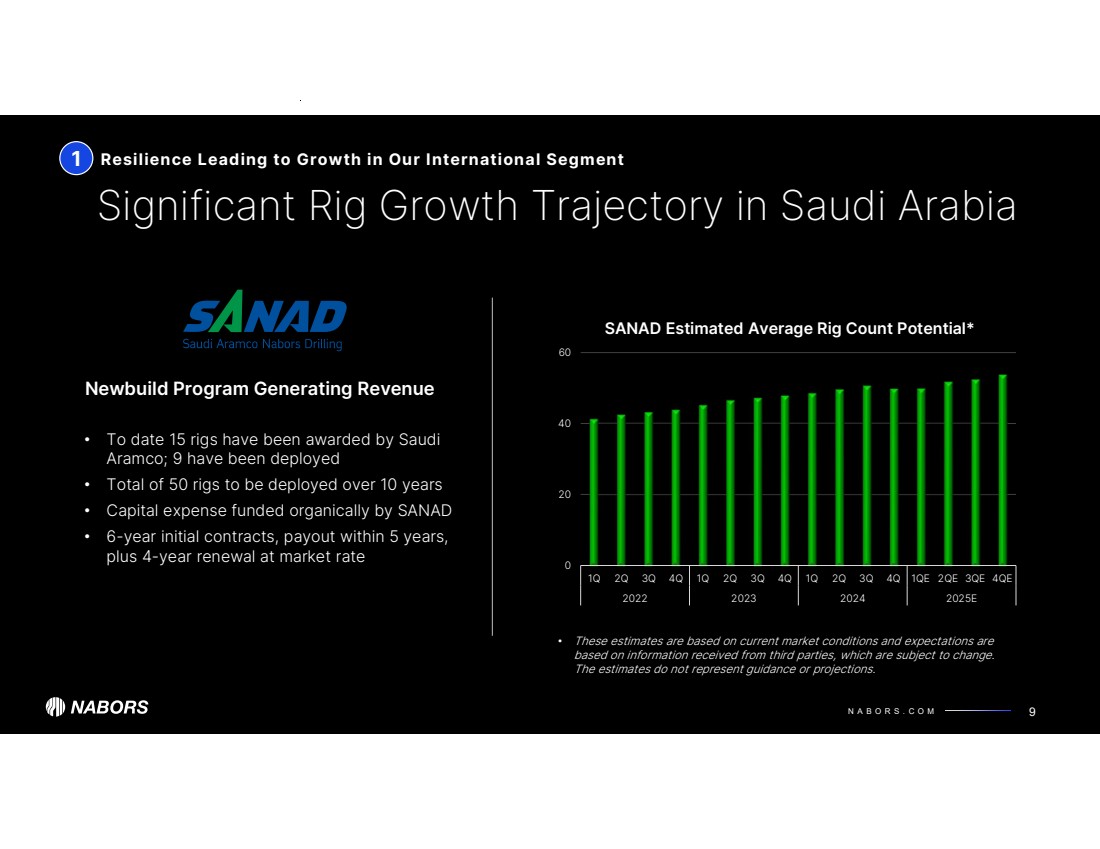
| o | In the fourth quarter, SANAD deployed its ninth newbuild rig and is expected to start up two more in the first quarter of 2025. As Saudi Aramco continues to grow its natural gas activity, Nabors continues to participate in its customer’s expansion plans with commitments to add rigs built in the Kingdom over the coming years and its leading portfolio of drilling-related services. |
| o | In Rig Technologies, Canrig was awarded a comprehensive rig upgrade package by a third-party drilling contractor in the U.S. Canrig is currently pursuing a number of upgrade opportunities, both domestically and internationally. These projects demonstrate Canrig’s advanced technology suite, which enables contractors to remain competitive as the drilling market becomes increasingly demanding. |
Anthony G. Petrello, Nabors Chairman, CEO and President, commented, “We are looking forward to adding Parker to the Nabors portfolio. Our integration planning reinforces the Parker attributes that we identified earlier. We are confident that this acquisition will advance our strategic objectives while creating value for our stakeholders.
“The market environment in the fourth quarter provided us with some challenges in the U.S., as operators continued to modulate their activity levels in oil basins, mainly driven by recent mergers. Leading edge pricing in this market remained steady, supporting our daily margins at relatively high levels. For 2025, we are planning for stable market activity through the early part of the year. Given this activity level, we are responding with actions to improve efficiency and align our cost structure.
|
NEWS RELEASE |
“Our international businesses continued to expand in multiple markets, including Saudi Arabia and Argentina. Although our international success places pressure on our capital expenditures, these are attractive growth opportunities for multiyear contracts with high returns. In 2025, we have startups planned in the Kingdom, Argentina, Colombia, and Kuwait. We project these deployments will drive this segment’s margins higher through the year.
“SANAD, our 50/50 joint venture with Saudi Aramco, is progressively adding 50 rigs over approximately 10 years. Through 2024, SANAD has deployed nine of these units. The rigs work under six-year initial contracts that are structured to recover the invested capital over five years. This term is followed by a four-year renewal mechanism, providing at least 10 years of utilization.
“In 2025, SANAD’s working newbuild fleet should approximately double its contribution in adjusted EBITDA over 2024. SANAD’s expansion remains one of our most exciting investment opportunities. We believe that in the next several years our joint venture will start generating cash flow in excess of the annual investment required for the newbuild rigs, meaningfully increasing value for Nabors as a whole.”
Segment Results
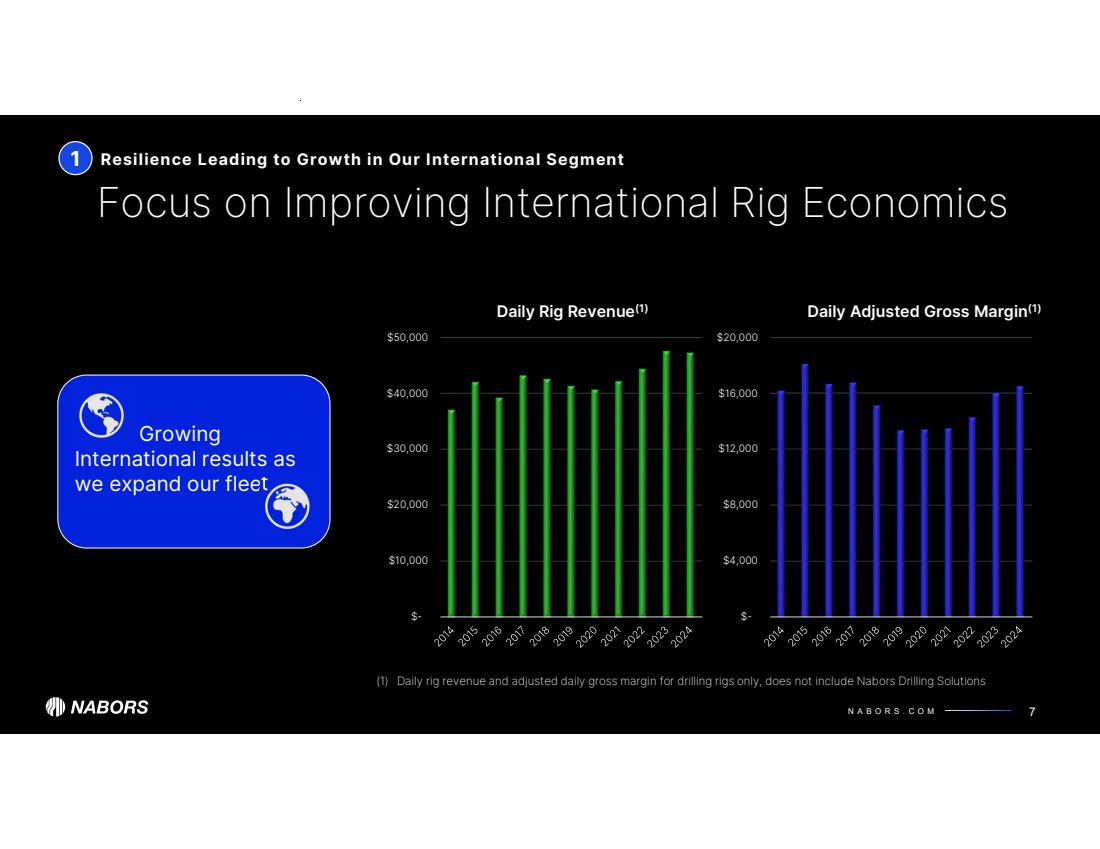
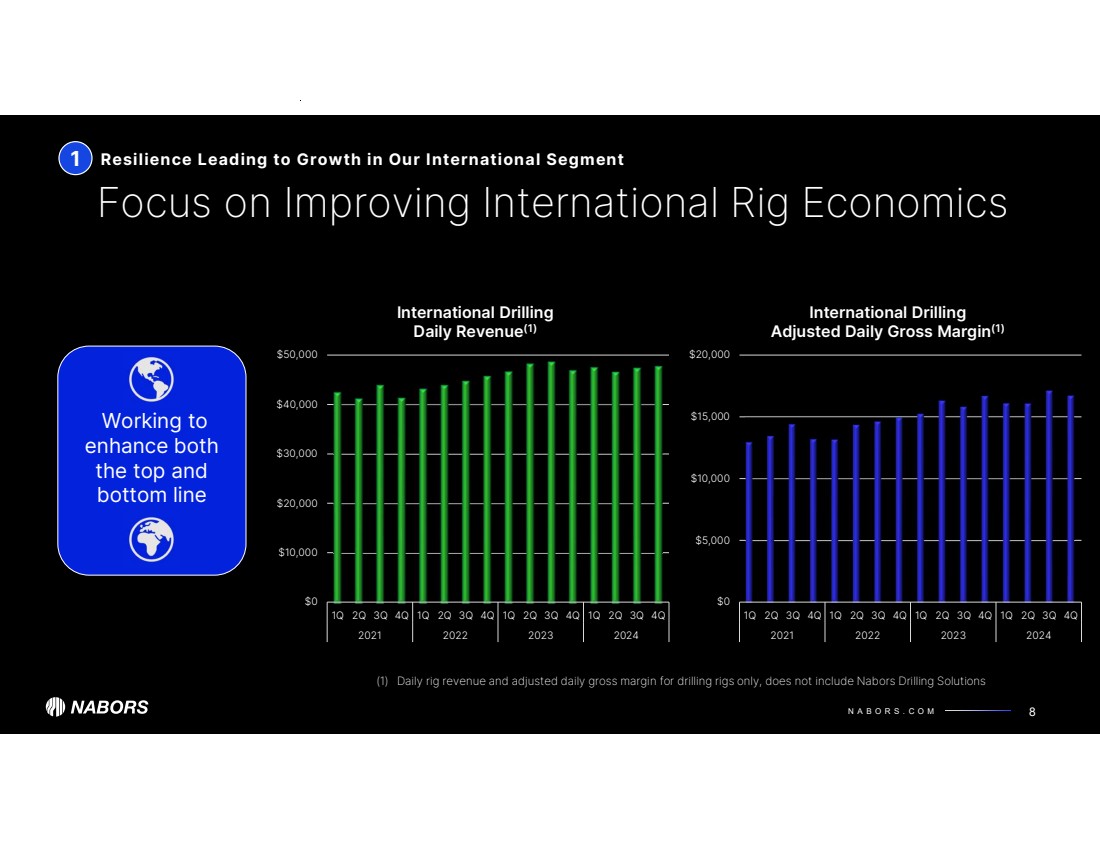
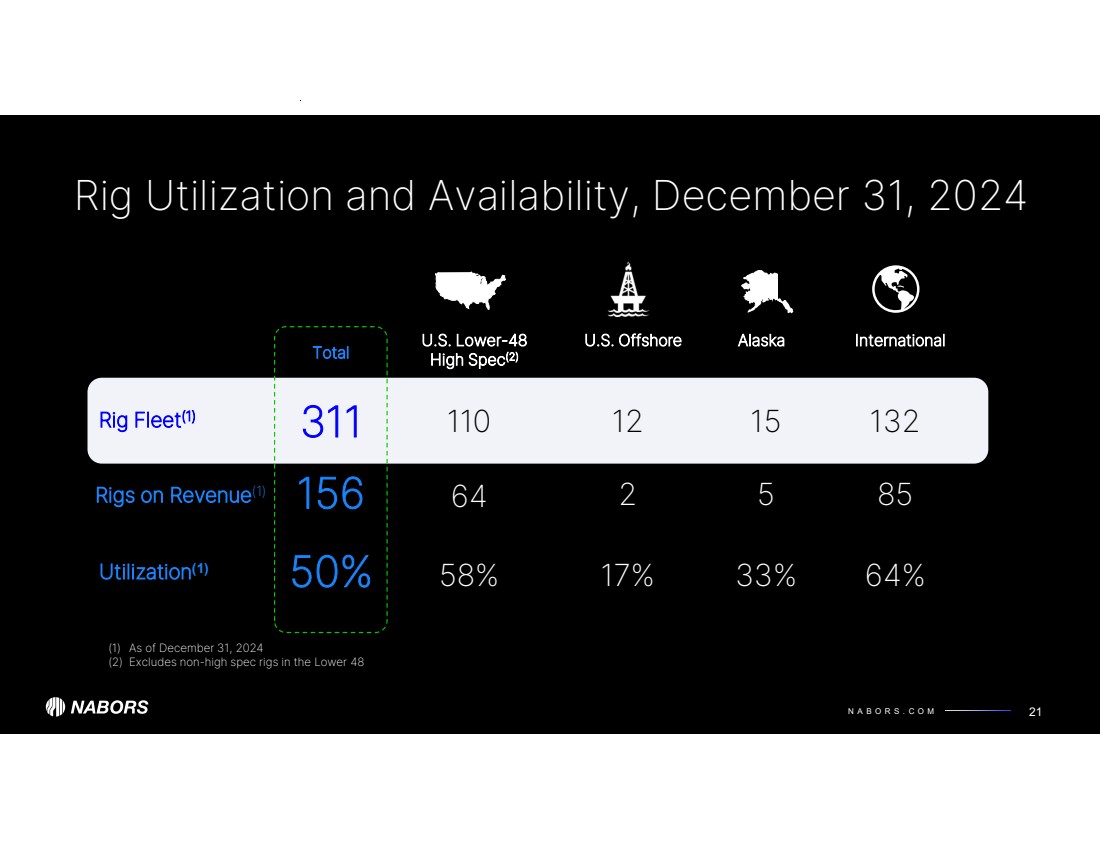
International Drilling adjusted EBITDA totaled $112.0 million, compared to $116.0 million in the third quarter. Average rig count met activity expectations as it increased slightly to 85 driven by rig additions in Argentina and Saudi Arabia, mostly offset by rig suspensions in the Kingdom. Daily adjusted gross margin for the fourth quarter averaged $16,687 reflecting incremental costs associated with these rig start-ups and suspensions.
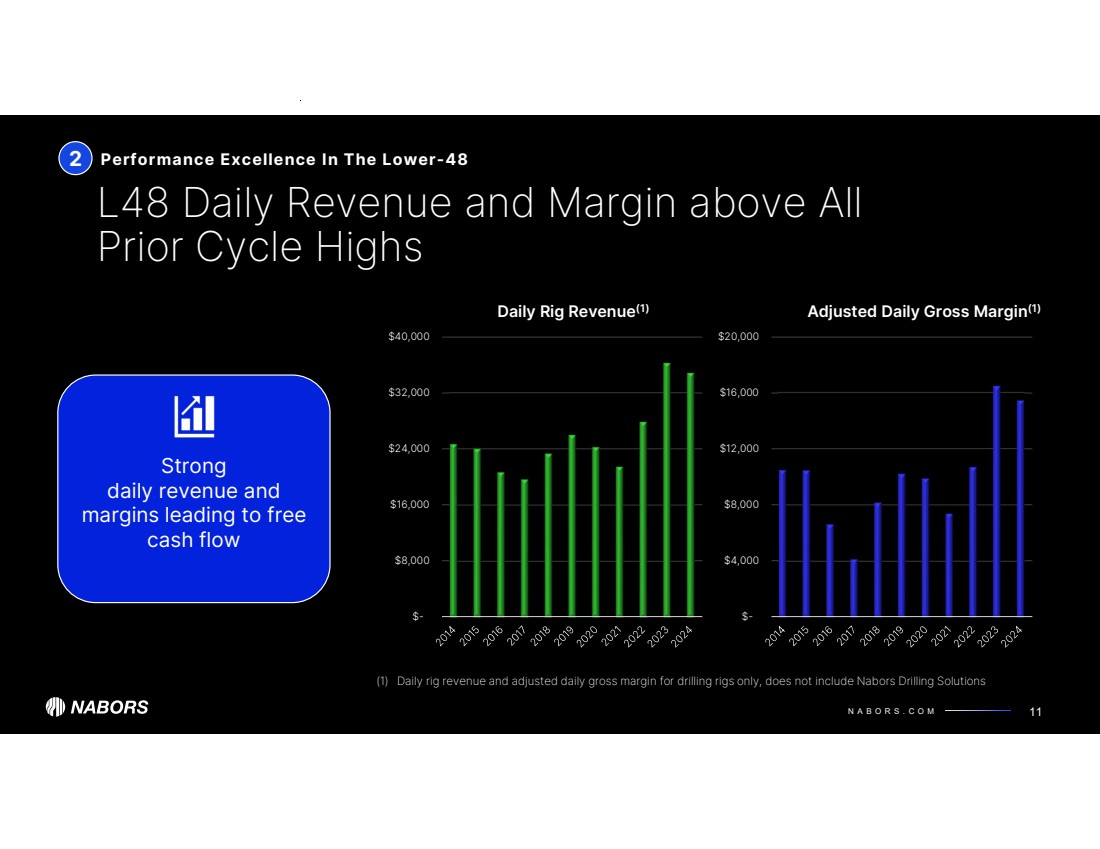
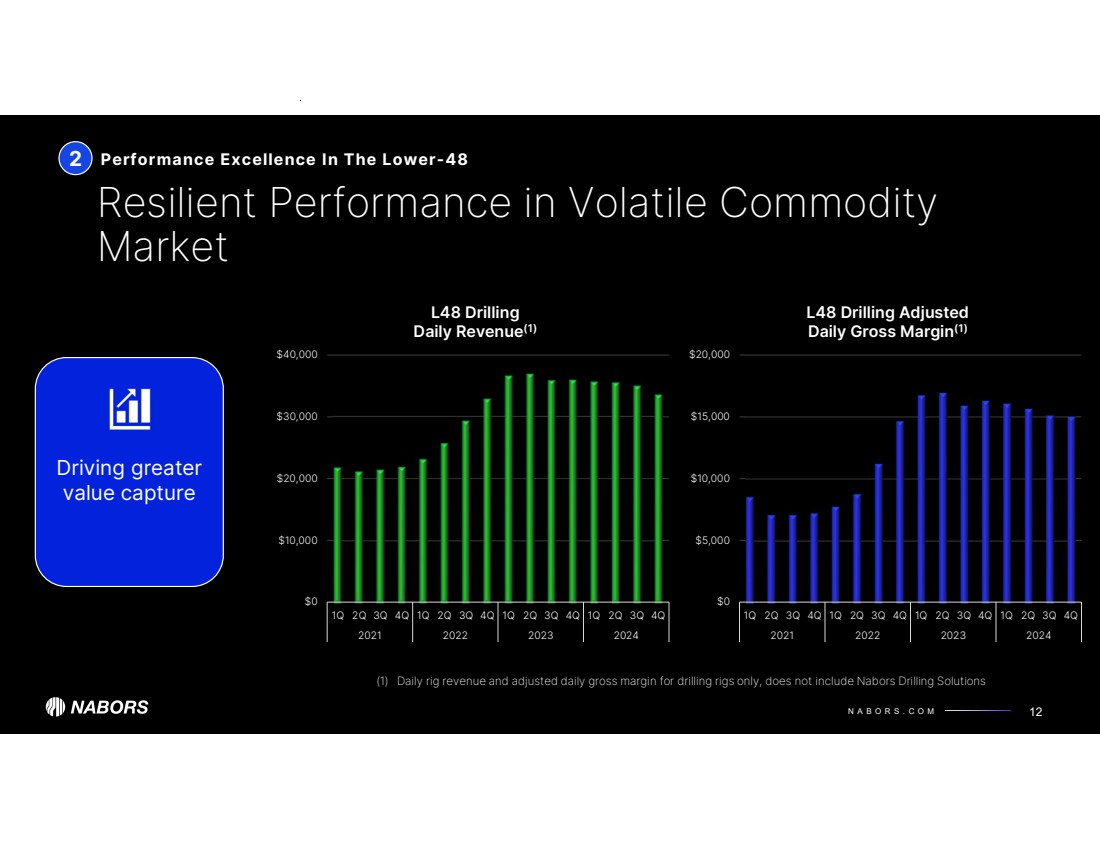
The U.S. Drilling segment reported fourth quarter adjusted EBITDA of $105.8 million, compared to $108.7 million in the third quarter. Nabors’ fourth quarter Lower 48 average rig count totaled 66, versus 68 in the third quarter. In the Lower 48, daily margins held up well in the fourth quarter. Daily adjusted gross margin averaged $14,940, versus $15,051 in the prior quarter. Leading edge pricing remained stable as average day rates reflected contracts rolling to the latest prices. The change in average pricing was mostly offset by reductions in operating expenses.
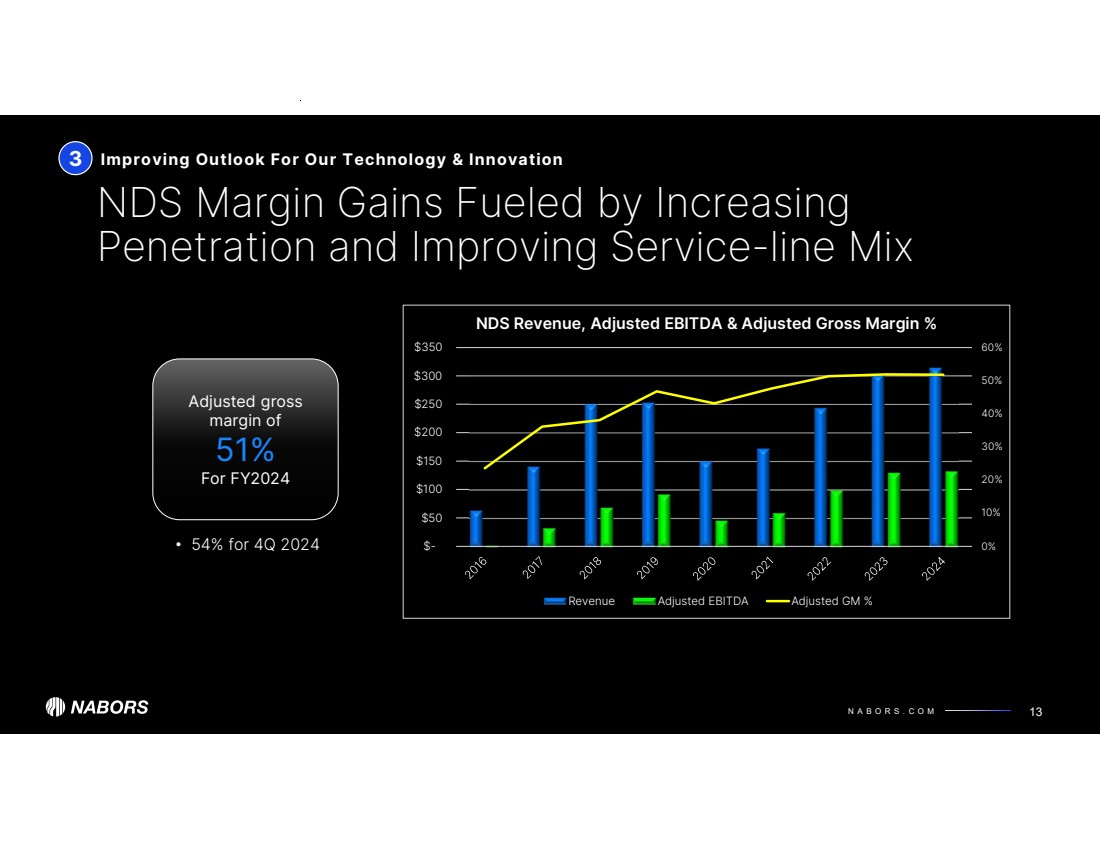
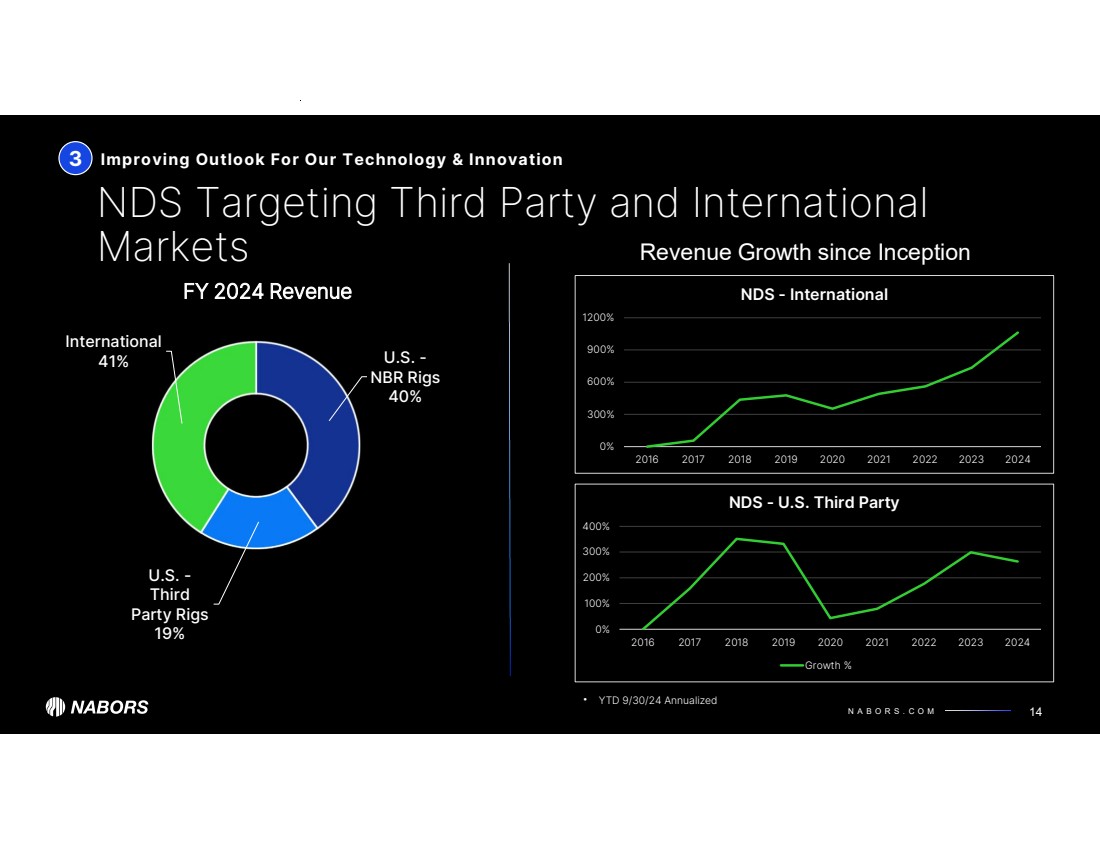
Drilling Solutions adjusted EBITDA was $33.8 million. The segment’s performance was impacted by Nabors’ rig count in the Lower 48. Internationally, NDS activity remained strong. Drilling Solutions gross margin expanded, topping 54%.
Rig Technologies adjusted EBITDA reached $9.2 million, a 51% increase compared to the third quarter. The increase was mainly due to higher shipments of capital equipment in the Middle East.
Adjusted Free Cash Flow
In the fourth quarter, EBITDA was in line with the prior quarter. A strong improvement in Rig Technologies compensated for the decline in U.S. drilling activity. Consolidated adjusted free cash flow in the fourth quarter was a use of $53 million, resulting in part from a temporary halt in payments by a client in Mexico and by higher capital expenditures.
William Restrepo, Nabors CFO, stated, “Two main factors impacted adjusted free cash flow. First, in Mexico, the collections shortfall totaled approximately $50 million in the fourth quarter. Second, our capital expenses were $241 million, $10 million above our target. Although our capex outside SANAD was $30 million below our target, the JV’s newbuild spending of $143 million exceeded our forecast by $40 million as its rig supplier continued to accelerate completion of construction milestones.
|
NEWS RELEASE |
“SANAD consumed $90 million in cash during the fourth quarter. Before SANAD’s growth capital spending, its cash increased by $53 million. For the full year 2024, SANAD’s cash declined by $52 million after funding the investment of $271 million in its newbuild program. This demonstrates that SANAD’s cash increased by more than $200 million, highlighting the extraordinary strength of the existing fleet.
“For the full year, we forecast capital spending of $710 to $720 million. Approximately $360 million of that total will be directed to SANAD newbuild construction.
“We are projecting 2025 consolidated adjusted free cash flow at just over breakeven. The expected use of cash in SANAD is approximately $150 million. This implies that Nabors outside SANAD would generate positive adjusted free cash flow of at least $150 million in 2025. This would give us the ability to reduce Nabors gross debt by a significant amount.
“None of these forecasts include the impact of Parker Wellbore. We believe the acquired business will provide incremental free cash flow to the combined company, even before the expected synergies of $35 million.”
Outlook
Nabors expects the following metrics for the first quarter of 2025 (these expectations exclude the impact of Parker Wellbore):
U.S. Drilling
| o | Lower 48 average rig count of approximately 61 rigs |
| o | Lower 48 daily adjusted gross margin of approximately $14,800 |
| o | Alaska and Gulf of Mexico combined adjusted EBITDA approximately in line with the fourth quarter of 2024 |
International
| o | Average rig count of 85-86 rigs |
| o | Daily adjusted gross margin of approximately $17,000 |
Drilling Solutions
| o | Adjusted EBITDA of approximately $33 million |
Rig Technologies
| o | Adjusted EBITDA of approximately $5 million |
Capital Expenditures
| o | Capital expenditures of $195 - $205 million, with $80 - $85 million for the newbuilds in Saudi Arabia |
| o | Full-year capital expenditures of approximately $710 - $720 million, with $360 million for the SANAD newbuilds |
|
NEWS RELEASE |
Adjusted Free Cash Flow
| o | Adjusted free cash flow for 2025 of approximately breakeven, with SANAD consuming approximately $150 million, while the remaining operations should generate around $150 million |
Mr. Petrello concluded, “Nabors commitment to advanced technology is helping us navigate this current environment. The addition of the Parker business will strengthen our position, especially in our Drilling Solutions segment.
“Our investments today support our current operations as well as large scale growth, specifically in Saudi Arabia. Our opportunity in the Kingdom is unique in the drilling industry. It has potential for substantial cash generation as well as for transformational value creation for our shareholders.”
|
NEWS RELEASE |
About Nabors Industries
Nabors Industries (NYSE: NBR) is a leading provider of advanced technology for the energy industry. With presence in more than 20 countries, Nabors has established a global network of people, technology and equipment to deploy solutions that deliver safe, efficient and responsible energy production. By leveraging its core competencies, particularly in drilling, engineering, automation, data science and manufacturing, Nabors aims to innovate the future of energy and enable the transition to a lower-carbon world. Learn more about Nabors and its energy technology leadership: www.nabors.com.
Forward-looking Statements
The information included in this press release includes forward-looking statements within the meaning of the Securities Act of 1933 and the Securities Exchange Act of 1934. Such forward-looking statements are subject to a number of risks and uncertainties, as disclosed by Nabors from time to time in its filings with the Securities and Exchange Commission. As a result of these factors, Nabors' actual results may differ materially from those indicated or implied by such forward-looking statements. The forward-looking statements contained in this press release reflect management's estimates and beliefs as of the date of this press release. Nabors does not undertake to update these forward-looking statements.
Non-GAAP Disclaimer
This press release presents certain “non-GAAP” financial measures. The components of these non-GAAP measures are computed by using amounts that are determined in accordance with accounting principles generally accepted in the United States of America (“GAAP”). Adjusted operating income (loss) represents income (loss) from continuing operations before income taxes, interest expense, investment income (loss), and other, net. Adjusted EBITDA is computed similarly, but also excludes depreciation and amortization expenses. In addition, adjusted EBITDA and adjusted operating income (loss) exclude certain cash expenses that the Company is obligated to make. Net debt is calculated as total debt minus the sum of cash, cash equivalents and short-term investments.
Adjusted free cash flow represents net cash provided by operating activities less cash used for capital expenditures, net of proceeds from sales of assets. Management believes that adjusted free cash flow is an important liquidity measure for the company and that it is useful to investors and management as a measure of the company’s ability to generate cash flow, after reinvesting in the company for future growth, that could be available for paying down debt or other financing cash flows, such as dividends to shareholders. Management believes that this non-GAAP measure is useful information to investors when comparing our cash flows with the cash flows of other companies.
|
NEWS RELEASE |
Each of these non-GAAP measures has limitations and therefore should not be used in isolation or as a substitute for the amounts reported in accordance with GAAP. However, management evaluates the performance of its operating segments and the consolidated Company based on several criteria, including Adjusted EBITDA, adjusted operating income (loss), net debt, and adjusted free cash flow, because it believes that these financial measures accurately reflect the Company’s ongoing profitability, performance and liquidity. Securities analysts and investors also use these measures as some of the metrics on which they analyze the Company’s performance. Other companies in this industry may compute these measures differently. Reconciliations of consolidated adjusted EBITDA and adjusted operating income (loss) to income (loss) from continuing operations before income taxes, net debt to total debt, and adjusted free cash flow to net cash provided by operations, which are their nearest comparable GAAP financial measures, are included in the tables at the end of this press release. We do not provide a forward-looking reconciliation of our outlook for Segment Adjusted EBITDA, Segment Gross Margin or Adjusted Free Cash Flow, as the amount and significance of items required to develop meaningful comparable GAAP financial measures cannot be estimated at this time without unreasonable efforts. These special items could be meaningful.
Investor Contacts: William C. Conroy, CFA, Vice President of Corporate Development & Investor Relations, +1 281-775-2423 or via e-mail [email protected], or Kara Peak, Director of Corporate Development & Investor Relations, +1 281-775-4954 or via email [email protected]. To request investor materials, contact Nabors' corporate headquarters in Hamilton, Bermuda at +441-292-1510 or via e-mail [email protected]
No Offer or Solicitation
This communication is not intended to and shall not constitute an offer to sell or the solicitation of an offer to sell or the solicitation of an offer to buy any securities or a solicitation of any vote of approval, nor shall there be any sale of securities in any jurisdiction in which such offer, solicitation or sale would be unlawful prior to registration or qualification under the securities laws of any such jurisdiction. No offering of securities shall be made except by means of a prospectus meeting the requirements of Section 10 of the Securities Act of 1933, as amended.
Important Additional Information and Where to Find It
In connection with the proposed transaction with Parker, Nabors filed a Registration Statement with the SEC on Form S-4 to register the shares of Nabors capital stock to be issued in connection with the proposed transaction. The Registration Statement included a joint proxy statement/prospectus of Nabors and Parker. The definitive joint proxy statement/prospectus was sent to the shareholders of each of Nabors and Parker to seek their approval of the proposed transaction and other related matters.
WE URGE INVESTORS AND SECURITY HOLDERS TO READ THE REGISTRATION STATEMENT ON FORM S-4 AND THE JOINT PROXY STATEMENT/PROSPECTUS INCLUDED WITHIN THE REGISTRATION STATEMENT ON FORM S-4 AND ANY OTHER RELEVANT DOCUMENTS, BECAUSE THEY CONTAIN IMPORTANT INFORMATION ABOUT PARKER, NABORS AND THE PROPOSED TRANSACTION. Investors and security holders are able to obtain these materials and other documents filed with the SEC by Nabors or Parker free of charge at the SEC’s website, www.sec.gov, or from Nabors at its website, www.nabors.com, or from Parker at its website, www.parkerwellbore.com.
|
NEWS RELEASE |
Participants in the Solicitation
Nabors and certain of its directors, executive officers and other employees, and Parker and certain of its directors, executive officers and other employees may be deemed to be participants in the solicitation of proxies for security holder approvals to be obtained for the proposed transaction. A description of participants’ direct or indirect interests, by security holdings or otherwise, is included in the joint proxy statement/prospectus relating to the proposed transaction filed with the SEC. Information regarding Nabors’ directors and executive officers is available in its proxy statement filed with the SEC on April 25, 2024 in connection with its 2024 annual meeting of shareholders (the “Annual Meeting Proxy Statement”) under “Proposal 1—Election of Directors— Director Nominees,” “Proposal 1—Election of Directors—Other Executive Officers,” “Compensation Discussion and Analysis” and “Share Ownership of Directors and Executive Officers.” To the extent holdings of securities by potential Nabors participants (or the identity of such participants) have changed since the information printed in the Annual Meeting Proxy Statement, such information has been or will be reflected on Nabors’ Statements of Change in Ownership on Forms 3 and 4 filed with the SEC. You may obtain free copies of these documents using the sources indicated above. Information regarding Parker’s directors and executive officers is available on Parker’s website as indicated above.
NABORS INDUSTRIES LTD. AND SUBSIDIARIES
CONDENSED CONSOLIDATED STATEMENTS OF INCOME (LOSS)
(Unaudited)
| Three Months Ended | Year Ended | |||||||||||||||||||
| December 31, | September 30, | December 31, | ||||||||||||||||||
| (In thousands, except per share amounts) | 2024 | 2023 | 2024 | 2024 | 2023 | |||||||||||||||
| Revenues and other income: | ||||||||||||||||||||
| Operating revenues | $ | 729,819 | $ | 725,801 | $ | 731,805 | $ | 2,930,126 | $ | 3,005,981 | ||||||||||
| Investment income (loss) | 8,828 | 12,042 | 11,503 | 38,713 | 43,820 | |||||||||||||||
| Total revenues and other income | 738,647 | 737,843 | 743,308 | 2,968,839 | 3,049,801 | |||||||||||||||
| Costs and other deductions: | ||||||||||||||||||||
| Direct costs | 433,404 | 424,769 | 431,705 | 1,742,411 | 1,790,380 | |||||||||||||||
| General and administrative expenses | 61,436 | 57,003 | 63,976 | 249,317 | 244,147 | |||||||||||||||
| Research and engineering | 14,434 | 13,926 | 14,404 | 57,063 | 56,297 | |||||||||||||||
| Depreciation and amortization | 156,348 | 161,228 | 159,234 | 633,408 | 645,294 | |||||||||||||||
| Interest expense | 53,642 | 49,938 | 55,350 | 210,864 | 185,285 | |||||||||||||||
| Other, net | 37,021 | 7,878 | 41,608 | 106,816 | (726 | ) | ||||||||||||||
| Total costs and other deductions | 756,285 | 714,742 | 766,277 | 2,999,879 | 2,920,677 | |||||||||||||||
| Income (loss) before income taxes | (17,638 | ) | 23,101 | (22,969 | ) | (31,040 | ) | 129,124 | ||||||||||||
| Income tax expense (benefit) | 15,231 | 19,244 | 10,118 | 56,947 | 79,220 | |||||||||||||||
| Net income (loss) | (32,869 | ) | 3,857 | (33,087 | ) | (87,987 | ) | 49,904 | ||||||||||||
| Less: Net (income) loss attributable to noncontrolling interest | (20,802 | ) | (20,560 | ) | (22,738 | ) | (88,097 | ) | (61,688 | ) | ||||||||||
| Net income (loss) attributable to Nabors | $ | (53,671 | ) | $ | (16,703 | ) | $ | (55,825 | ) | $ | (176,084 | ) | $ | (11,784 | ) | |||||
| Earnings (losses) per share: | ||||||||||||||||||||
| Basic | $ | (6.67 | ) | $ | (2.70 | ) | $ | (6.86 | ) | $ | (22.37 | ) | $ | (5.49 | ) | |||||
| Diluted | $ | (6.67 | ) | $ | (2.70 | ) | $ | (6.86 | ) | $ | (22.37 | ) | $ | (5.49 | ) | |||||
| Weighted-average number of common shares outstanding: | ||||||||||||||||||||
| Basic | 9,213 | 9,133 | 9,213 | 9,202 | 9,159 | |||||||||||||||
| Diluted | 9,213 | 9,133 | 9,213 | 9,202 | 9,159 | |||||||||||||||
| Adjusted EBITDA | $ | 220,545 | $ | 230,103 | $ | 221,720 | $ | 881,335 | $ | 915,157 | ||||||||||
| Adjusted operating income (loss) | $ | 64,197 | $ | 68,875 | $ | 62,486 | $ | 247,927 | $ | 269,863 | ||||||||||
| NABORS INDUSTRIES LTD. AND SUBSIDIARIES | ||||||||||||
| CONDENSED CONSOLIDATED BALANCE SHEETS | ||||||||||||
| (Unaudited) | ||||||||||||
| December 31, | September 30, | December 31, | ||||||||||
| (In thousands) | 2024 | 2024 | 2023 | |||||||||
| ASSETS | ||||||||||||
| Current assets: | ||||||||||||
| Cash and short-term investments | $ | 397,299 | $ | 459,302 | $ | 1,070,178 | ||||||
| Accounts receivable, net | 387,970 | 384,723 | 347,837 | |||||||||
| Other current assets | 214,268 | 228,300 | 227,663 | |||||||||
| Total current assets | 999,537 | 1,072,325 | 1,645,678 | |||||||||
| Property, plant and equipment, net | 2,830,957 | 2,766,411 | 2,898,728 | |||||||||
| Other long-term assets | 673,807 | 714,900 | 733,559 | |||||||||
| Total assets | $ | 4,504,301 | $ | 4,553,636 | $ | 5,277,965 | ||||||
| LIABILITIES AND EQUITY | ||||||||||||
| Current liabilities: | ||||||||||||
| Current debt | $ | - | $ | - | $ | 629,621 | ||||||
| Trade accounts payable | 321,030 | 316,694 | 294,442 | |||||||||
| Other current liabilities | 250,887 | 254,884 | 289,918 | |||||||||
| Total current liabilities | 571,917 | 571,578 | 1,213,981 | |||||||||
| Long-term debt | 2,505,217 | 2,503,270 | 2,511,519 | |||||||||
| Other long-term liabilities | 220,829 | 244,679 | 271,380 | |||||||||
| Total liabilities | 3,297,963 | 3,319,527 | 3,996,880 | |||||||||
| Redeemable noncontrolling interest in subsidiary | 785,091 | 773,525 | 739,075 | |||||||||
| Equity: | ||||||||||||
| Shareholders' equity | 134,996 | 191,363 | 326,614 | |||||||||
| Noncontrolling interest | 286,251 | 269,221 | 215,396 | |||||||||
| Total equity | 421,247 | 460,584 | 542,010 | |||||||||
| Total liabilities and equity | $ | 4,504,301 | $ | 4,553,636 | $ | 5,277,965 | ||||||
NABORS INDUSTRIES LTD. AND SUBSIDIARIES
SEGMENT REPORTING
(Unaudited)
The following tables set forth certain information with respect to our reportable segments and rig activity:
| Three Months Ended | Year Ended | |||||||||||||||||||
| December 31, | September 30, | December 31, | ||||||||||||||||||
| (In thousands, except rig activity) | 2024 | 2023 | 2024 | 2024 | 2023 | |||||||||||||||
| Operating revenues: | ||||||||||||||||||||
| U.S. Drilling | $ | 241,637 | $ | 265,762 | $ | 254,773 | $ | 1,028,122 | $ | 1,207,629 | ||||||||||
| International Drilling | 371,406 | 342,771 | 368,594 | 1,446,092 | 1,345,249 | |||||||||||||||
| Drilling Solutions | 75,992 | 77,028 | 79,544 | 314,071 | 301,757 | |||||||||||||||
| Rig Technologies (1) | 56,166 | 59,287 | 45,809 | 201,677 | 242,768 | |||||||||||||||
| Other reconciling items (2) | (15,382 | ) | (19,047 | ) | (16,915 | ) | (59,836 | ) | (91,422 | ) | ||||||||||
| Total operating revenues | $ | 729,819 | $ | 725,801 | $ | 731,805 | $ | 2,930,126 | $ | 3,005,981 | ||||||||||
| Adjusted EBITDA: (3) | ||||||||||||||||||||
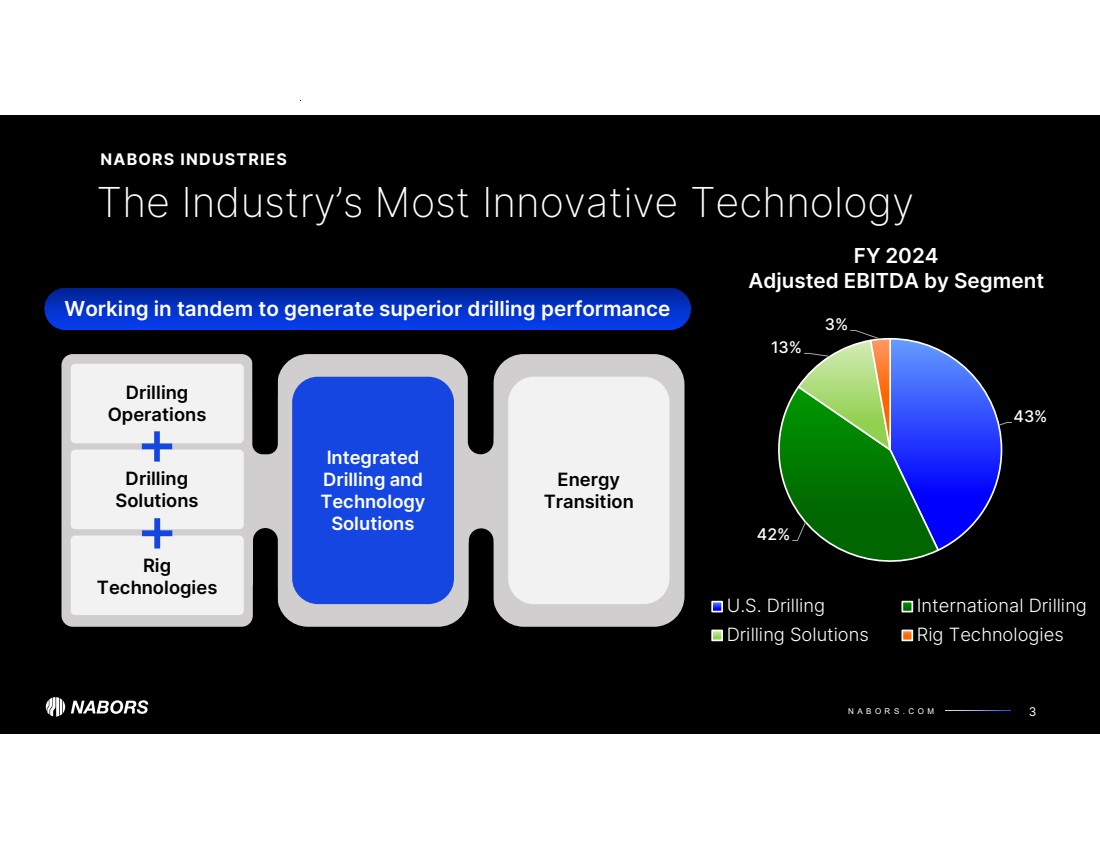
| U.S. Drilling | $ | 105,757 | $ | 118,371 | $ | 108,660 | $ | 448,840 | $ | 533,663 | ||||||||||
| International Drilling | 111,962 | 105,540 | 115,951 | 436,782 | 388,654 | |||||||||||||||
| Drilling Solutions | 33,809 | 34,502 | 34,311 | 132,375 | 129,591 | |||||||||||||||
| Rig Technologies (1) | 9,208 | 8,811 | 6,104 | 29,443 | 27,394 | |||||||||||||||
| Other reconciling items (4) | (40,191 | ) | (37,121 | ) | (43,306 | ) | (166,105 | ) | (164,145 | ) | ||||||||||
| Total adjusted EBITDA | $ | 220,545 | $ | 230,103 | $ | 221,720 | $ | 881,335 | $ | 915,157 | ||||||||||
| Adjusted operating income (loss): (5) | ||||||||||||||||||||
| U.S. Drilling | $ | 38,973 | $ | 51,494 | $ | 41,694 | $ | 176,281 | $ | 262,353 | ||||||||||
| International Drilling | 29,528 | 18,642 | 32,182 | 107,858 | 40,868 | |||||||||||||||
| Drilling Solutions | 28,944 | 30,127 | 29,231 | 112,387 | 110,957 | |||||||||||||||
| Rig Technologies (1) | 8,413 | 5,788 | 2,761 | 20,243 | 19,529 | |||||||||||||||
| Other reconciling items (4) | (41,661 | ) | (37,176 | ) | (43,382 | ) | (168,842 | ) | (163,844 | ) | ||||||||||
| Total adjusted operating income (loss) | $ | 64,197 | $ | 68,875 | $ | 62,486 | $ | 247,927 | $ | 269,863 | ||||||||||
| Rig activity: | ||||||||||||||||||||
| Average Rigs Working: (7) | ||||||||||||||||||||
| Lower 48 | 65.9 | 70.3 | 67.8 | 68.6 | 79.6 | |||||||||||||||
| Other US | 6.8 | 6.0 | 6.2 | 6.5 | 6.7 | |||||||||||||||
| U.S. Drilling | 72.7 | 76.3 | 74.0 | 75.1 | 86.3 | |||||||||||||||
| International Drilling | 84.8 | 79.6 | 84.7 | 83.7 | 77.6 | |||||||||||||||
| Total average rigs working | 157.5 | 155.9 | 158.7 | 158.8 | 163.9 | |||||||||||||||
| Daily Rig Revenue: (6),(8) | ||||||||||||||||||||
| Lower 48 | $ | 33,396 | $ | 35,776 | $ | 34,812 | $ | 34,771 | $ | 36,202 | ||||||||||
| Other US | 62,624 | 62,346 | 66,352 | 65,264 | 63,866 | |||||||||||||||
| U.S. Drilling (10) | 36,137 | 37,865 | 37,441 | 37,419 | 38,338 | |||||||||||||||
| International Drilling | 47,620 | 46,782 | 47,281 | 47,189 | 47,484 | |||||||||||||||
| Daily Adjusted Gross Margin: (6),(9) | ||||||||||||||||||||
| Lower 48 | $ | 14,940 | $ | 16,240 | $ | 15,051 | $ | 15,411 | $ | 16,446 | ||||||||||
| Other US | 34,707 | 34,641 | 37,363 | 36,440 | 33,850 | |||||||||||||||
| U.S. Drilling (10) | 16,793 | 17,687 | 16,911 | 17,237 | 17,790 | |||||||||||||||
| International Drilling | 16,687 | 16,651 | 17,085 | 16,478 | 15,992 | |||||||||||||||
| (1) | Includes our oilfield equipment manufacturing activities. |
| (2) | Represents the elimination of inter-segment transactions related to our Rig Technologies operating segment. |
| (3) | Adjusted EBITDA represents net income (loss) before income tax expense (benefit), investment income (loss), interest expense, other, net and depreciation and amortization. Adjusted EBITDA is a non-GAAP financial measure and should not be used in isolation or as a substitute for the amounts reported in accordance with GAAP. In addition, adjusted EBITDA excludes certain cash expenses that the Company is obligated to make. However, management evaluates the performance of its operating segments and the consolidated Company based on several criteria, including adjusted EBITDA and adjusted operating income (loss), because it believes that these financial measures accurately reflect the Company’s ongoing profitability and performance. Securities analysts and investors use this measure as one of the metrics on which they analyze the Company’s performance. Other companies in this industry may compute these measures differently. A reconciliation of this non-GAAP measure to net income (loss), which is the most closely comparable GAAP measure, is provided in the table set forth immediately following the heading "Reconciliation of Non-GAAP Financial Measures to Net Income (Loss)". |
| (4) | Represents the elimination of inter-segment transactions and unallocated corporate expenses. |
| (5) | Adjusted operating income (loss) represents net income (loss) before income tax expense (benefit), investment income (loss), interest expense and other, net. Adjusted operating income (loss) is a non-GAAP financial measure and should not be used in isolation or as a substitute for the amounts reported in accordance with GAAP. In addition, adjusted operating income (loss) excludes certain cash expenses that the Company is obligated to make. However, management evaluates the performance of its operating segments and the consolidated Company based on several criteria, including adjusted EBITDA and adjusted operating income (loss), because it believes that these financial measures accurately reflect the Company’s ongoing profitability and performance. Securities analysts and investors use this measure as one of the metrics on which they analyze the Company’s performance. Other companies in this industry may compute these measures differently. A reconciliation of this non-GAAP measure to net income (loss), which is the most closely comparable GAAP measure, is provided in the table set forth immediately following the heading "Reconciliation of Non-GAAP Financial Measures to Net Income (Loss)". |
| (6) | Rig revenue days represents the number of days the Company's rigs are contracted and performing under a contract during the period. These would typically include days in which operating, standby and move revenue is earned. |
| (7) | Average rigs working represents a measure of the average number of rigs operating during a given period. For example, one rig operating 45 days during a quarter represents approximately 0.5 average rigs working for the quarter. On an annual period, one rig operating 182.5 days represents approximately 0.5 average rigs working for the year. Average rigs working can also be calculated as rig revenue days during the period divided by the number of calendar days in the period. |
| (8) | Daily rig revenue represents operating revenue, divided by the total number of revenue days during the quarter. |
| (9) | Daily adjusted gross margin represents operating revenue less direct costs, divided by the total number of rig revenue days during the quarter. |
| (10) | The U.S. Drilling segment includes the Lower 48, Alaska, and Gulf of Mexico operating areas. |
NABORS INDUSTRIES LTD. AND SUBSIDIARIES
Reconciliation of Earnings per Share
(Unaudited)
| Three Months Ended | Year Ended | |||||||||||||||||||
| December 31, | September 30, | December 31, | ||||||||||||||||||
| (in thousands, except per share amounts) | 2024 | 2023 | 2024 | 2024 | 2023 | |||||||||||||||
| BASIC EPS: | ||||||||||||||||||||
| Net income (loss) (numerator): | ||||||||||||||||||||
| Income (loss), net of tax | $ | (32,869 | ) | $ | 3,857 | $ | (33,087 | ) | $ | (87,987 | ) | $ | 49,904 | |||||||
| Less: net (income) loss attributable to noncontrolling interest | (20,802 | ) | (20,560 | ) | (22,738 | ) | (88,097 | ) | (61,688 | ) | ||||||||||
| Less: deemed dividends to SPAC public shareholders | — | (458 | ) | — | — | (8,638 | ) | |||||||||||||
| Less: accrued distribution on redeemable noncontrolling interest in subsidiary | (7,794 | ) | (7,517 | ) | (7,363 | ) | (29,723 | ) | (29,824 | ) | ||||||||||
| Numerator for basic earnings per share: | ||||||||||||||||||||
| Adjusted income (loss), net of tax - basic | $ | (61,465 | ) | $ | (24,678 | ) | $ | (63,188 | ) | $ | (205,807 | ) | $ | (50,246 | ) | |||||
| Weighted-average number of shares outstanding - basic | 9,213 | 9,133 | 9,213 | 9,202 | 9,159 | |||||||||||||||
| Earnings (losses) per share: | ||||||||||||||||||||
| Total Basic | $ | (6.67 | ) | $ | (2.70 | ) | $ | (6.86 | ) | $ | (22.37 | ) | $ | (5.49 | ) | |||||
| DILUTED EPS: | ||||||||||||||||||||
| Adjusted income (loss), net of tax - diluted | $ | (61,465 | ) | $ | (24,678 | ) | $ | (63,188 | ) | $ | (205,807 | ) | $ | (50,246 | ) | |||||
| Weighted-average number of shares outstanding - diluted | 9,213 | 9,133 | 9,213 | 9,202 | 9,159 | |||||||||||||||
| Earnings (losses) per share: | ||||||||||||||||||||
| Total Diluted | $ | (6.67 | ) | $ | (2.70 | ) | $ | (6.86 | ) | $ | (22.37 | ) | $ | (5.49 | ) | |||||
NABORS INDUSTRIES LTD. AND SUBSIDIARIES
NON-GAAP FINANCIAL MEASURES
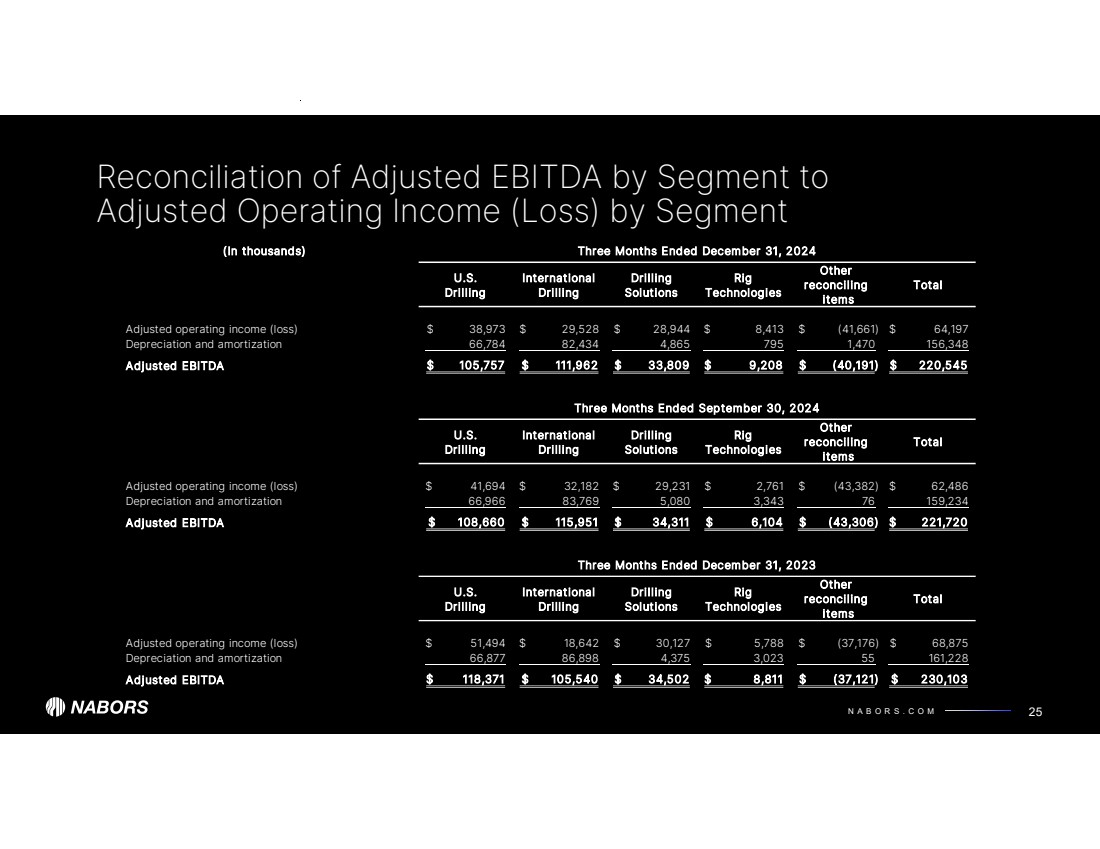
RECONCILIATION OF ADJUSTED EBITDA BY SEGMENT TO ADJUSTED OPERATING INCOME (LOSS) BY SEGMENT
(Unaudited)
(In thousands)
| Three Months Ended December 31, 2024 | ||||||||||||||||||||||||
| U.S. Drilling | International Drilling | Drilling Solutions | Rig Technologies | Other reconciling items | Total | |||||||||||||||||||
| Adjusted operating income (loss) | $ | 38,973 | $ | 29,528 | $ | 28,944 | $ | 8,413 | $ | (41,661 | ) | $ | 64,197 | |||||||||||
| Depreciation and amortization | 66,784 | 82,434 | 4,865 | 795 | 1,470 | 156,348 | ||||||||||||||||||
| Adjusted EBITDA | $ | 105,757 | $ | 111,962 | $ | 33,809 | $ | 9,208 | $ | (40,191 | ) | $ | 220,545 | |||||||||||
| Three Months Ended December 31, 2023 | ||||||||||||||||||||||||
| U.S. Drilling | International Drilling | Drilling Solutions | Rig Technologies | Other reconciling items | Total | |||||||||||||||||||
| Adjusted operating income (loss) | $ | 51,494 | $ | 18,642 | $ | 30,127 | $ | 5,788 | $ | (37,176 | ) | $ | 68,875 | |||||||||||
| Depreciation and amortization | 66,877 | 86,898 | 4,375 | 3,023 | 55 | 161,228 | ||||||||||||||||||
| Adjusted EBITDA | $ | 118,371 | $ | 105,540 | $ | 34,502 | $ | 8,811 | $ | (37,121 | ) | $ | 230,103 | |||||||||||
| Three Months Ended September 30, 2024 | ||||||||||||||||||||||||
| U.S. Drilling | International Drilling | Drilling Solutions | Rig Technologies | Other reconciling items | Total | |||||||||||||||||||
| Adjusted operating income (loss) | $ | 41,694 | $ | 32,182 | $ | 29,231 | $ | 2,761 | $ | (43,382 | ) | $ | 62,486 | |||||||||||
| Depreciation and amortization | 66,966 | 83,769 | 5,080 | 3,343 | 76 | 159,234 | ||||||||||||||||||
| Adjusted EBITDA | $ | 108,660 | $ | 115,951 | $ | 34,311 | $ | 6,104 | $ | (43,306 | ) | $ | 221,720 | |||||||||||
| Year Ended December 31, 2024 | ||||||||||||||||||||||||
| U.S. Drilling | International Drilling | Drilling Solutions | Rig Technologies | Other reconciling items | Total | |||||||||||||||||||
| Adjusted operating income (loss) | $ | 176,281 | $ | 107,858 | $ | 112,387 | $ | 20,243 | $ | (168,842 | ) | $ | 247,927 | |||||||||||
| Depreciation and amortization | 272,559 | 328,924 | 19,988 | 9,200 | 2,737 | 633,408 | ||||||||||||||||||
| Adjusted EBITDA | $ | 448,840 | $ | 436,782 | $ | 132,375 | $ | 29,443 | $ | (166,105 | ) | $ | 881,335 | |||||||||||
| Year Ended December 31, 2023 | ||||||||||||||||||||||||
| U.S. Drilling | International Drilling | Drilling Solutions | Rig Technologies | Other reconciling items | Total | |||||||||||||||||||
| Adjusted operating income (loss) | $ | 262,353 | $ | 40,868 | $ | 110,957 | $ | 19,529 | $ | (163,844 | ) | $ | 269,863 | |||||||||||
| Depreciation and amortization | 271,310 | 347,786 | 18,634 | 7,865 | (301 | ) | 645,294 | |||||||||||||||||
| Adjusted EBITDA | $ | 533,663 | $ | 388,654 | $ | 129,591 | $ | 27,394 | $ | (164,145 | ) | $ | 915,157 | |||||||||||
NABORS INDUSTRIES LTD. AND SUBSIDIARIES
NON-GAAP FINANCIAL MEASURES
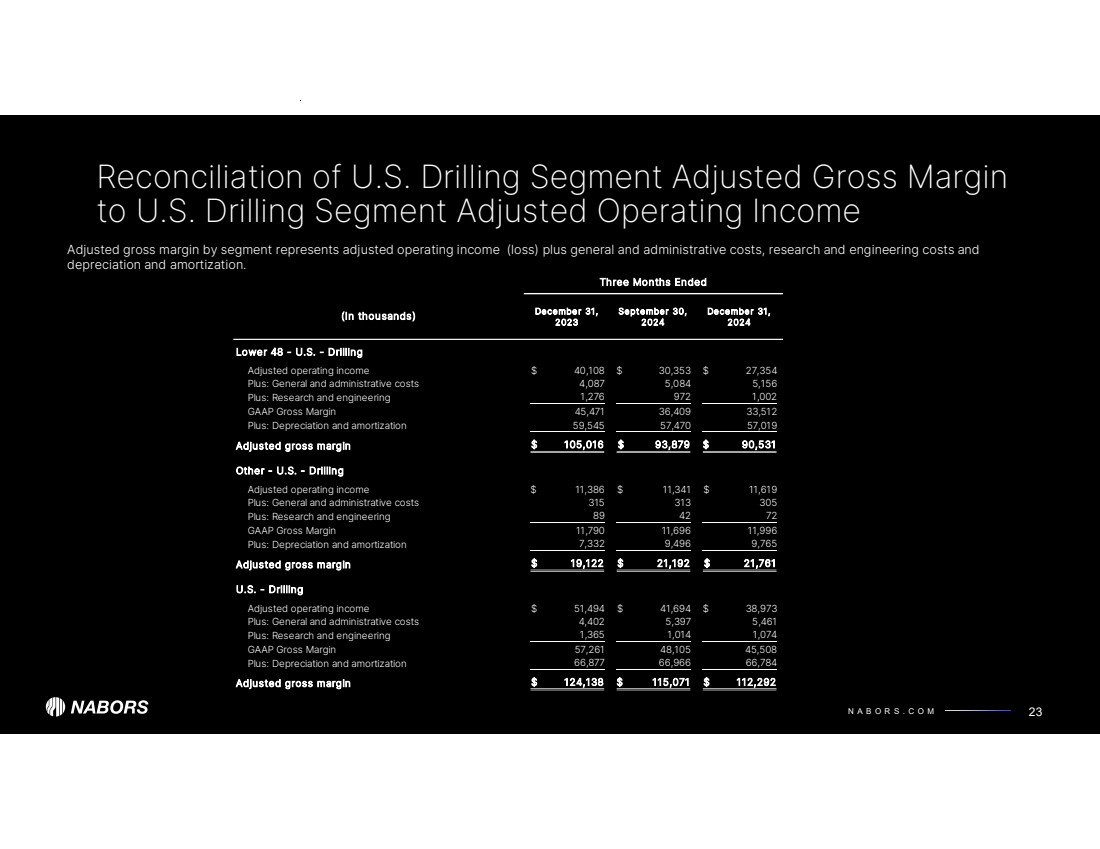
RECONCILIATION OF ADJUSTED GROSS MARGIN BY SEGMENT TO ADJUSTED OPERATING INCOME (LOSS) BY SEGMENT
(Unaudited)
| Three Months Ended | Year Ended | |||||||||||||||||||
| December 31, | September 30, | December 31, | ||||||||||||||||||
| (In thousands) | 2024 | 2023 | 2024 | 2024 | 2023 | |||||||||||||||
| Lower 48 - U.S. Drilling | ||||||||||||||||||||
| Adjusted operating income (loss) | $ | 27,354 | $ | 40,108 | $ | 30,353 | $ | 129,812 | $ | 215,041 | ||||||||||
| Plus: General and administrative costs | 5,156 | 4,087 | 5,084 | 19,452 | 19,590 | |||||||||||||||
| Plus: Research and engineering | 1,002 | 1,276 | 972 | 3,847 | 5,373 | |||||||||||||||
| GAAP Gross Margin | 33,512 | 45,471 | 36,409 | 153,111 | 240,004 | |||||||||||||||
| Plus: Depreciation and amortization | 57,019 | 59,545 | 57,470 | 233,555 | 238,033 | |||||||||||||||
| Adjusted gross margin | $ | 90,531 | $ | 105,016 | $ | 93,879 | $ | 386,666 | $ | 478,037 | ||||||||||
| Other - U.S. Drilling | ||||||||||||||||||||
| Adjusted operating income (loss) | $ | 11,619 | $ | 11,386 | $ | 11,341 | $ | 46,469 | $ | 47,312 | ||||||||||
| Plus: General and administrative costs | 305 | 315 | 313 | 1,250 | 1,314 | |||||||||||||||
| Plus: Research and engineering | 72 | 89 | 42 | 206 | 438 | |||||||||||||||
| GAAP Gross Margin | 11,996 | 11,790 | 11,696 | 47,925 | 49,064 | |||||||||||||||
| Plus: Depreciation and amortization | 9,765 | 7,332 | 9,496 | 39,004 | 33,277 | |||||||||||||||
| Adjusted gross margin | $ | 21,761 | $ | 19,122 | $ | 21,192 | $ | 86,929 | $ | 82,341 | ||||||||||
| U.S. Drilling | ||||||||||||||||||||
| Adjusted operating income (loss) | $ | 38,973 | $ | 51,494 | $ | 41,694 | $ | 176,281 | $ | 262,353 | ||||||||||
| Plus: General and administrative costs | 5,461 | 4,402 | 5,397 | 20,702 | 20,904 | |||||||||||||||
| Plus: Research and engineering | 1,074 | 1,365 | 1,014 | 4,053 | 5,811 | |||||||||||||||
| GAAP Gross Margin | 45,508 | 57,261 | 48,105 | 201,036 | 289,068 | |||||||||||||||
| Plus: Depreciation and amortization | 66,784 | 66,877 | 66,966 | 272,559 | 271,310 | |||||||||||||||
| Adjusted gross margin | $ | 112,292 | $ | 124,138 | $ | 115,071 | $ | 473,595 | $ | 560,378 | ||||||||||
| International Drilling | ||||||||||||||||||||
| Adjusted operating income (loss) | $ | 29,528 | $ | 18,642 | $ | 32,182 | $ | 107,858 | $ | 40,868 | ||||||||||
| Plus: General and administrative costs | 16,758 | 14,900 | 15,698 | 62,306 | 57,624 | |||||||||||||||
| Plus: Research and engineering | 1,431 | 1,560 | 1,543 | 5,886 | 6,789 | |||||||||||||||
| GAAP Gross Margin | 47,717 | 35,102 | 49,423 | 176,050 | 105,281 | |||||||||||||||
| Plus: Depreciation and amortization | 82,434 | 86,898 | 83,769 | 328,924 | 347,786 | |||||||||||||||
| Adjusted gross margin | $ | 130,151 | $ | 122,000 | $ | 133,192 | $ | 504,974 | $ | 453,067 | ||||||||||
Adjusted gross margin by segment represents adjusted operating income (loss) plus general and administrative costs, research and engineering costs and depreciation and amortization.
NABORS INDUSTRIES LTD. AND SUBSIDIARIES
RECONCILIATION OF NON-GAAP FINANCIAL MEASURES TO NET INCOME (LOSS)
(Unaudited)
| Three Months Ended | Year Ended | |||||||||||||||||||
| December 31, | September 30, | December 31, | ||||||||||||||||||
| (In thousands) | 2024 | 2023 | 2024 | 2024 | 2023 | |||||||||||||||
| Net income (loss) | $ | (32,869 | ) | $ | 3,857 | $ | (33,087 | ) | $ | (87,987 | ) | $ | 49,904 | |||||||
| Income tax expense (benefit) | 15,231 | 19,244 | 10,118 | 56,947 | 79,220 | |||||||||||||||
| Income (loss) from continuing operations before income taxes | (17,638 | ) | 23,101 | (22,969 | ) | (31,040 | ) | 129,124 | ||||||||||||
| Investment (income) loss | (8,828 | ) | (12,042 | ) | (11,503 | ) | (38,713 | ) | (43,820 | ) | ||||||||||
| Interest expense | 53,642 | 49,938 | 55,350 | 210,864 | 185,285 | |||||||||||||||
| Other, net | 37,021 | 7,878 | 41,608 | 106,816 | (726 | ) | ||||||||||||||
| Adjusted operating income (loss) (1) | 64,197 | 68,875 | 62,486 | 247,927 | 269,863 | |||||||||||||||
| Depreciation and amortization | 156,348 | 161,228 | 159,234 | 633,408 | 645,294 | |||||||||||||||
| Adjusted EBITDA (2) | $ | 220,545 | $ | 230,103 | $ | 221,720 | $ | 881,335 | $ | 915,157 | ||||||||||
| (1) Adjusted operating income (loss) represents net income (loss) before income tax expense (benefit), investment income (loss), interest expense, and other, net. Adjusted operating income (loss) is a non-GAAP financial measure and should not be used in isolation or as a substitute for the amounts reported in accordance with GAAP. In addition, adjusted operating income (loss) excludes certain cash expenses that the Company is obligated to make. However, management evaluates the performance of its operating segments and the consolidated Company based on several criteria, including adjusted EBITDA and adjusted operating income (loss), because it believes that these financial measures accurately reflect the Company’s ongoing profitability and performance. Securities analysts and investors use this measure as one of the metrics on which they analyze the Company’s performance. Other companies in this industry may compute these measures differently. |
| (2) Adjusted EBITDA represents net income (loss) before income tax expense (benefit), investment income (loss), interest expense, other, net and depreciation and amortization. Adjusted EBITDA is a non-GAAP financial measure and should not be used in isolation or as a substitute for the amounts reported in accordance with GAAP. In addition, adjusted EBITDA excludes certain cash expenses that the Company is obligated to make. However, management evaluates the performance of its operating segments and the consolidated Company based on several criteria, including adjusted EBITDA and adjusted operating income (loss), because it believes that these financial measures accurately reflect the Company’s ongoing profitability and performance. Securities analysts and investors use this measure as one of the metrics on which they analyze the Company’s performance. Other companies in this industry may compute these measures differently. |
NABORS INDUSTRIES LTD. AND SUBSIDIARIES
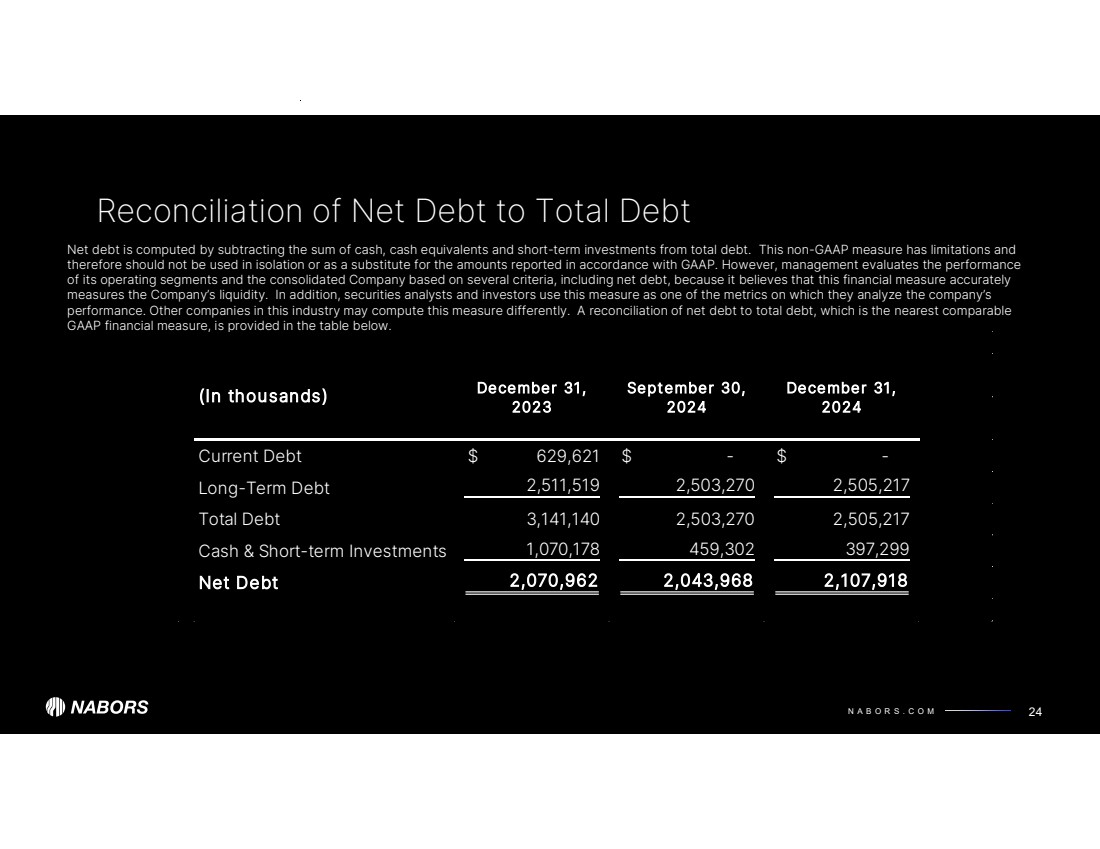
RECONCILIATION OF NET DEBT TO TOTAL DEBT
(Unaudited)
| December 31, | September 30, | December 31, | ||||||||||
| (In thousands) | 2024 | 2024 | 2023 | |||||||||
| Current debt | $ | - | $ | - | $ | 629,621 | ||||||
| Long-term debt | 2,505,217 | 2,503,270 | 2,511,519 | |||||||||
| Total Debt | 2,505,217 | 2,503,270 | 3,141,140 | |||||||||
| Less: Cash and short-term investments | 397,299 | 459,302 | 1,070,178 | |||||||||
| Net Debt | $ | 2,107,918 | $ | 2,043,968 | $ | 2,070,962 | ||||||
NABORS INDUSTRIES LTD. AND SUBSIDIARIES
RECONCILIATION
OF ADJUSTED FREE CASH FLOW TO
NET
CASH PROVIDED BY OPERATING ACTIVITIES
(Unaudited)
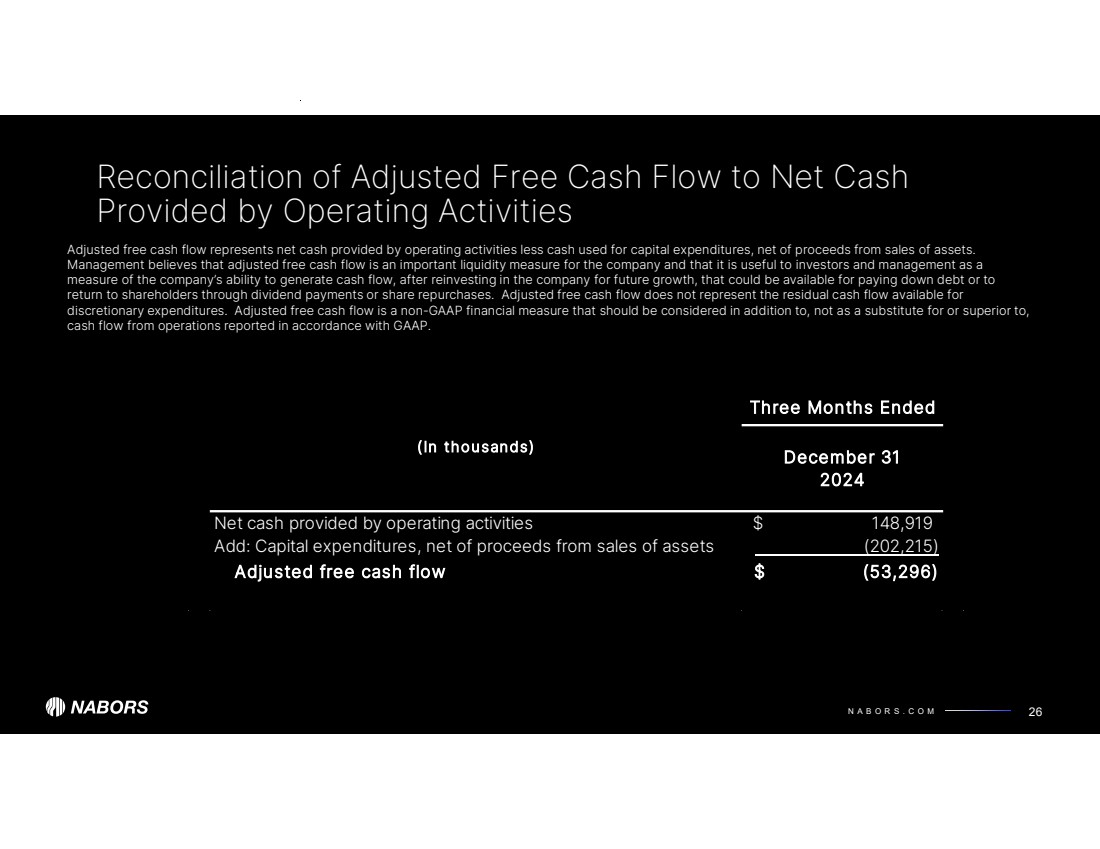
| Three Months Ended | Year Ended | |||||||||||
| December 31, | September 30, | December 31, | ||||||||||
| (In thousands) | 2024 | 2024 | 2024 | |||||||||
| Net cash provided by operating activities | $ | 148,919 | $ | 143,615 | $ | 581,432 | ||||||
| Add: Capital expenditures, net of proceeds from sales of assets | (202,215 | ) | (126,071 | ) | (552,421 | ) | ||||||
| Adjusted free cash flow | $ | (53,296 | ) | $ | 17,544 | $ | 29,011 | |||||
Adjusted free cash flow represents net cash provided by operating activities less cash used for capital expenditures, net of proceeds from sales of assets. Management believes that adjusted free cash flow is an important liquidity measure for the company and that it is useful to investors and management as a measure of the company’s ability to generate cash flow, after reinvesting in the company for future growth, that could be available for paying down debt or other financing cash flows, such as dividends to shareholders. Adjusted free cash flow does not represent the residual cash flow available for discretionary expenditures. Adjusted free cash flow is a non-GAAP financial measure that should be considered in addition to, not as a substitute for or superior to, cash flow from operations reported in accordance with GAAP.