Exhibit 99.1
 |
 |
Nabors Announces Preliminary Second Quarter 2020 Results
HAMILTON, Bermuda, July 28, 2020 /PRNewswire/ -- Nabors Industries Ltd. (“Nabors” or the “Company”) (NYSE: NBR) today reported second quarter 2020 operating revenues of $534 million compared to operating revenues of $718 million in the first quarter of 2020. The net loss from continuing operations attributable to Nabors common shareholders for the quarter is expected to be $152 million, or $22.13 per share, compared to a loss of $395 million, or $56.72 per share in the prior quarter. After-tax charges in the second quarter are expected to be $54 million, or $7.68 per share, primarily related to asset impairments and severance costs. After-tax charges in the first quarter totaled $260 million, or $36.86 per share.
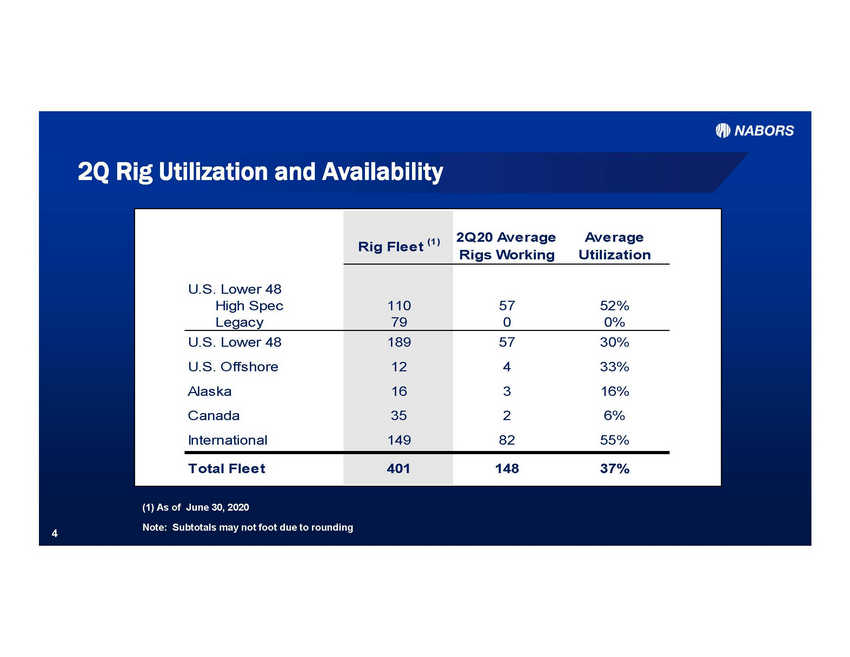
For the second quarter, adjusted EBITDA was $154 million compared to $188 million in the prior quarter. In the U.S., a 50% decline in Lower 48 rig count for the industry drove a 36% reduction in Nabors’ drilling rigs, as well as a sharp decline in Nabors Drilling Solutions. International activity, especially in Latin America, was impacted by COVID-related disruptions, which resulted in significantly lower dayrates for our temporarily idled rigs. In addition, several contracts were not renewed or were terminated before their expiration. The Rig Technologies segment recorded its highest quarterly adjusted EBITDA level in five years, due to stronger sales in international markets and stringent expense control. Total overhead was reduced by $30 million, a 25% sequential decrease. Second-quarter results also benefitted from one-time net gains to adjusted EBITDA of approximately $8 million, primarily revenue from early terminations on drilling contracts for the International segment.
Anthony G. Petrello, Nabors Chairman, CEO and President, commented, “As we adjusted to the steep activity decline, Nabors delivered strong results in the second quarter, driven by increased market share and strong margins in the Lower 48, resilience in our International business and improved results in our Rig Technologies segment. In addition, we slashed our overhead expenses and capital spending, while making notable progress on our priorities to generate free cash flow and reduce net debt. At the same time, our global team remains focused on minimizing the impact of the pandemic on our employees and on our operations.
“The second quarter operating performance reflected significant activity declines in North America, as operators completed the bulk of their plans to reduce drilling. In the U.S. Lower 48, we lowered our costs swiftly in response to customer actions. Our daily rig margins remained at high levels despite some weakening in our average dayrates for the fleet.
“In our International Drilling segment, rig count declined by 4.3 rigs, a 5% reduction. In addition to the situation in Venezuela, where our main customer exited the market, various customers responded to the global drop in demand by adjusting their drilling plans. As well, strict COVID lockdowns in Latin America resulted in reduced dayrates during the lockdown periods. Nonetheless, adjusted EBITDA held up well, as we benefitted from significant early termination revenue.
| |
|
“Although activity in the Lower 48 seems close to a bottom, the full impact of pricing reductions on average fleet margins still lies ahead. In addition, as is usually the case, activity trends in most international markets lag the U.S. We expect international rig count and pricing to continue falling over the remainder of the year, though not as steeply as the industry has experienced in the Lower 48.
“In this environment, we will remain focused on cost and capital discipline. We will ensure our direct and overhead costs, as well as our capital expenditures, are as aligned as much as possible to our activity levels.”
Consolidated and Segment Results
The U.S. Drilling segment reported $77.7 million in adjusted EBITDA for the second quarter of 2020, a $24.1 million, or 24%, reduction from the prior quarter, primarily due to the decline in activity in the Lower 48 market. During the quarter, Nabors’ Lower 48 rig count decreased by 31.8 rigs or 36%. Average daily margins in the Lower 48 widened to $10,449 as favorable cost performance offset the erosion to average fleet dayrates. The U.S. segment’s rig count currently stands at 55, with 49 rigs in the Lower 48. Based on the Company’s current outlook, the third quarter average Lower 48 rig count should fall by two to three rigs from the second quarter exit rate of 49, while drilling margins should fall to between $9,000 and $9,500, reflecting more normal costs and the continued impact of lower pricing.
International Drilling adjusted EBITDA increased sequentially by $2.0 million, to $93.5 million. Activity declines across several markets and disruptions related to the COVID-19 virus impacted results. The second quarter included one-time net gains totaling approximately $8 million, primarily early termination revenue. The quarterly average rig count, at 82, declined by 5% from the prior quarter. Average margin per day increased to $14,091, including a net benefit of approximately $1,070 from the unusual items. The international rig count currently stands at 74. The Company’s outlook includes a further reduction in average rig count in the third quarter, and a decline in adjusted EBITDA.
Canada Drilling reported an adjusted EBITDA loss of $0.6 million, as rig activity in that market reached its seasonal low point. Average daily gross margin and the average working rig count decreased significantly during the quarter. The second quarter rig count was two rigs, down from 17 in the prior quarter. The usual seasonal downturn was exacerbated by the current market environment. For the third quarter of 2020, the Company expects an improvement in this segment’s adjusted EBITDA as seasonal activity picks up. The Company anticipates rig count to improve by four rigs in the third quarter.
In Drilling Solutions, adjusted EBITDA of $9.4 million declined sharply compared to the first quarter, due to reduced activity across service lines and heightened price competition. The industry rig count, which dropped significantly more than the Nabors rig count, hurt this segment’s U.S. revenue as compared to the reduction in the Company’s U.S. drilling rig activity.
In the Rig Technologies segment, second quarter adjusted EBITDA was $3.2 million, reversing the prior quarter adjusted EBITDA loss of $3.2 million. Higher international sales and strict cost control contributed to the improved results.
| |
|
Cost Reductions and Capital Discipline
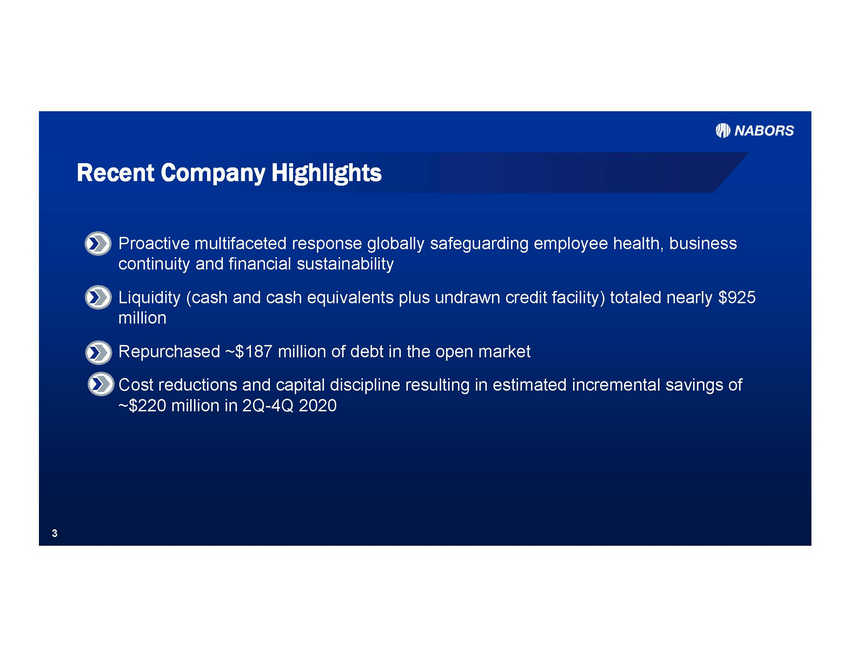
The second quarter results reflect several actions taken by the Company to improve its fixed cost structure. Primarily, these measures include a streamlined corporate organization, reduced compensation, and a field-support infrastructure optimized for the lower level of activity. Combined, the Company estimates that these actions should generate savings of $96 million beginning in the second quarter through the end of 2020. This reduction represents an additional $11 million in savings as compared to the amount communicated at the end of the first quarter.
Capital expenditures were $49 million in the second quarter, and totaled $109 million for the first half of 2020. As previously disclosed, the Company expects capital expenditures of approximately $240 million for the full year.
Free cash flow, defined as net cash provided by operating activities less net cash used by investing activities, as presented in our cash flow statement, reached $101 million in the second quarter. Total debt declined by $112 million and net debt, defined for financial reporting purposes as total debt less cash, cash equivalents and short-term investments, declined to $2.78 billion, a $117 million reduction. The improvement in free cash flow as compared to the first quarter was driven by the absence of semiannual interest payments on senior notes during the second quarter and lower capital expenditures. Working capital provided a headwind to the Company’s cash flow. In Latin America, collections were affected by the COVID lockdowns and by negotiations on the dayrates for the lockdown periods. Collections globally were well below Nabors’ expectations.
William Restrepo, Nabors CFO, stated, “Nabors’ adjusted EBITDA and cash generation, despite the adverse environment, demonstrated the Company’s resilience. Looking ahead, we expect further deterioration in the domestic and international markets. As such, we have increased our efforts to continue delivering our goals. We remain committed to meaningfully reduce our net debt in 2020.
“Our overhead costs were cut significantly below the first-quarter levels, exceeding our initial targets. G&A, R&E and field support expenses totaled $89.1 million in the second quarter as compared to $118.9 million in the prior quarter, a 25% reduction. We expect those costs to fall just below $80 million in the third quarter and remain at those levels in the fourth, a 33% reduction as compared to the first quarter. The full year 2020 should be $145 million dollars below the prior year, a 28% year-on-year reduction.
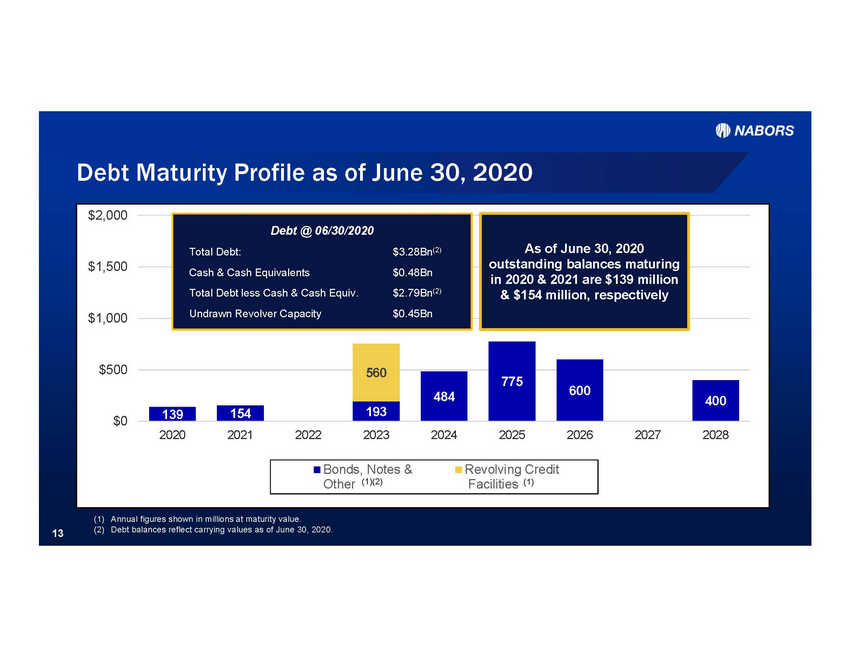
“During the second quarter, we purchased approximately $187 million of our shorter-term notes in the open market at a discount to par. The remaining balances of our 2020 and 2021 senior notes now stand at $139 million and $154 million, respectively. At June 30, our balances of cash and cash equivalents plus our undrawn credit facility totaled nearly $925 million.”
Mr. Petrello concluded, “Our commitment to generate free cash flow and reduce net debt this year is unwavering. We continue to evaluate all aspects of the Company with the goal of streamlining our operating processes.
| |
|
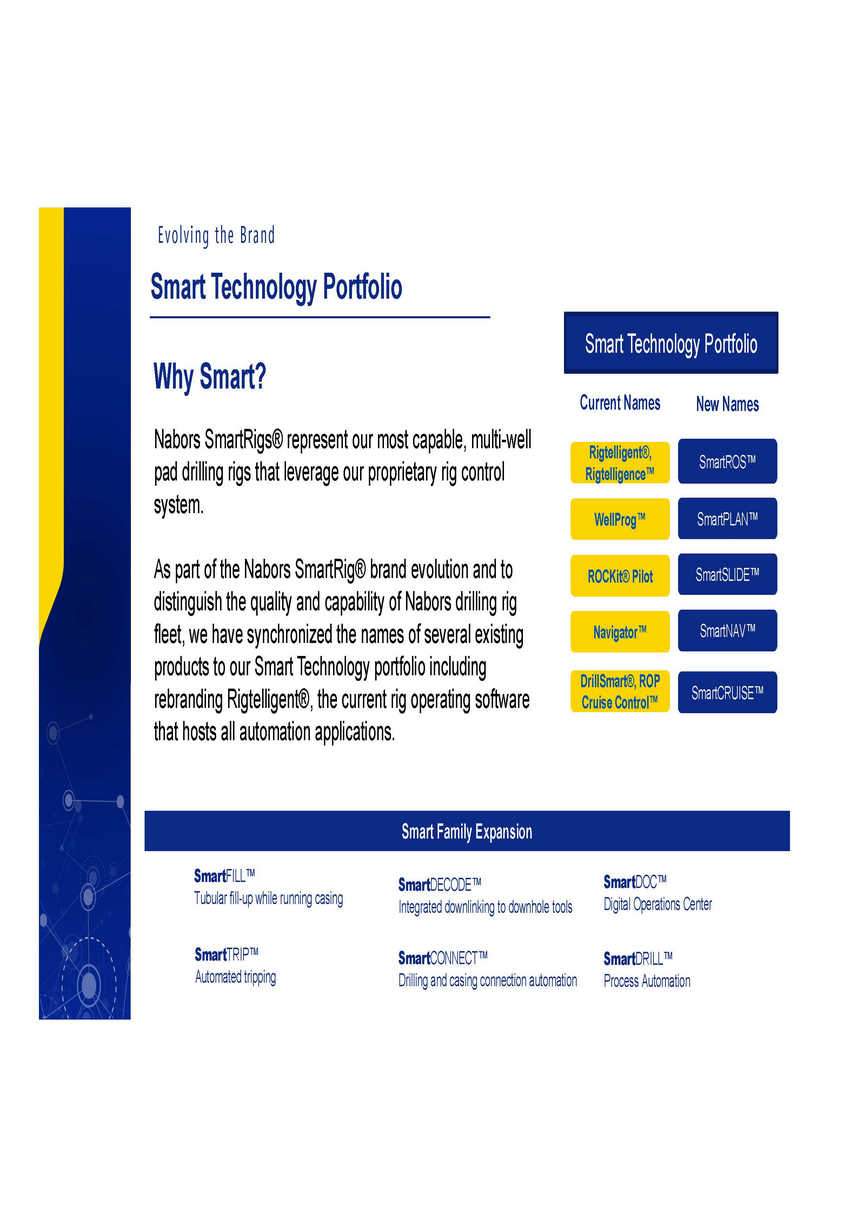
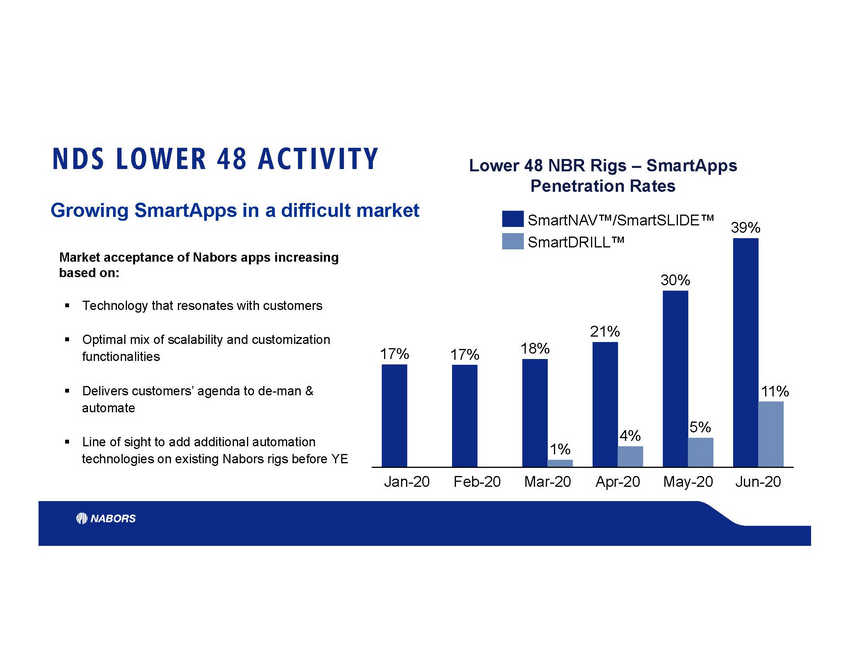
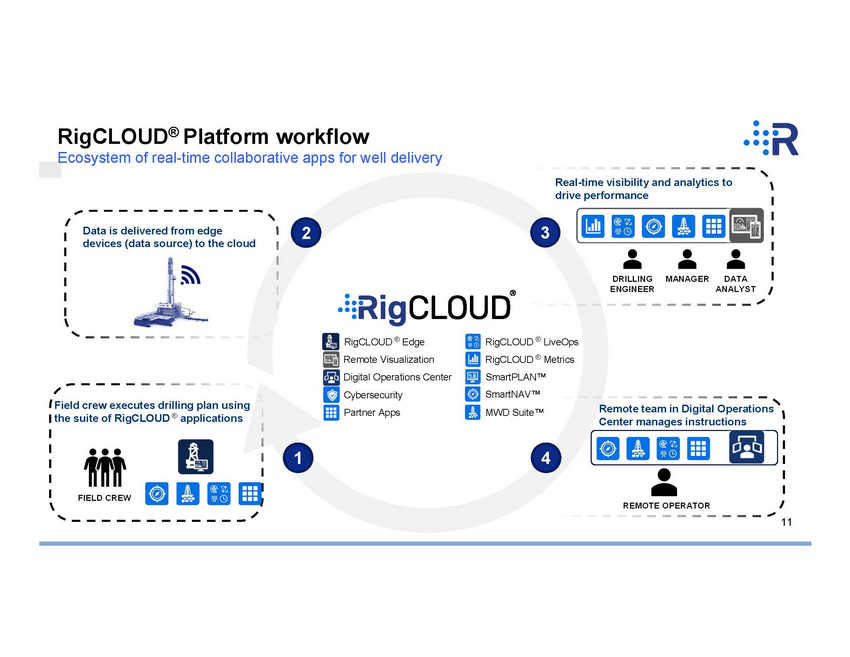
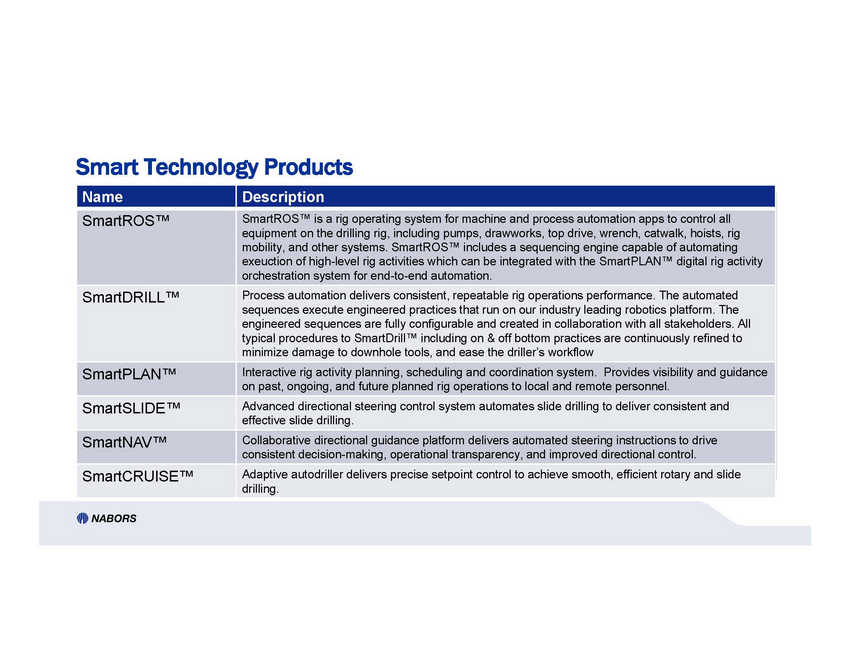
“We will continue to drive technology and performance in the drilling sector. We firmly believe that the future of our industry and the Company’s success will be determined by our ability to continue automating the drilling process and integrating the relevant services onto our leading-edge rig platform. At the same time, we are positioning the Company to capitalize on several far-reaching transformations which are currently underway in our industry. The recent launch of our RigCloud® digital platform, for streaming analytics and improving rig and operational performance, is a key element of our digitalization strategy. These initiatives will allow us to further improve performance, enhance placement and quality of the wellbore, reduce well cost and enable remote operations with fewer people at risk on the well site.
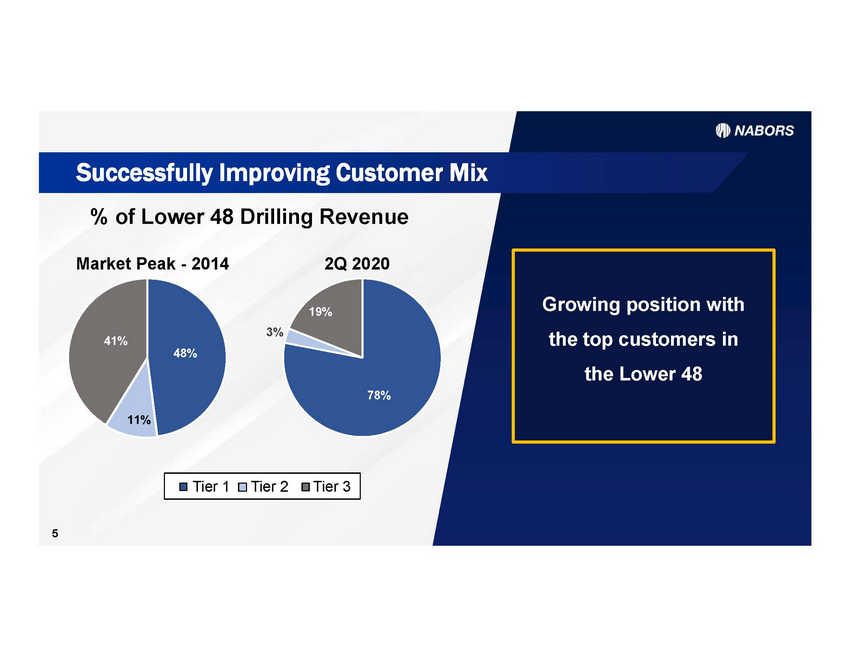
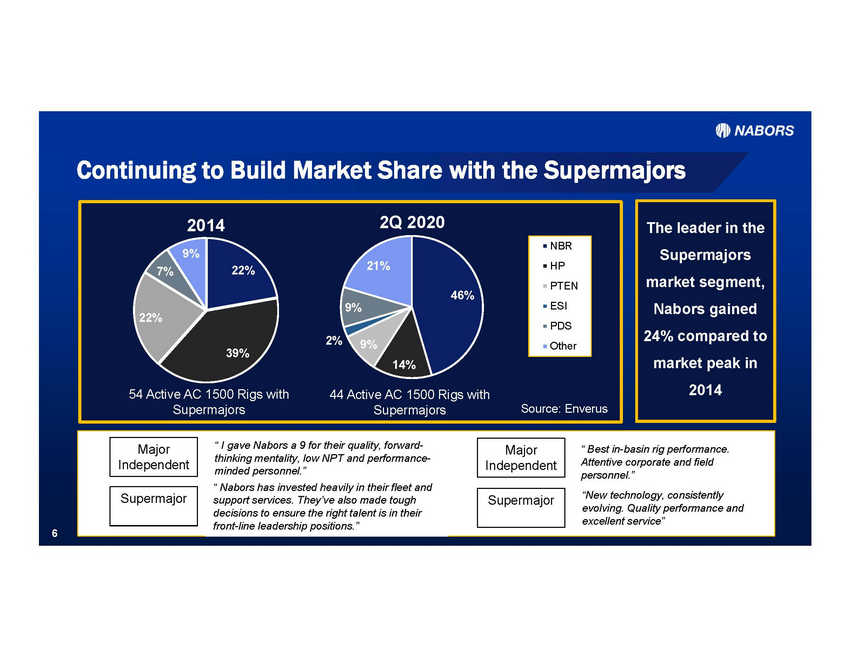
“We spent the last several years focusing our value proposition on the group of operators we thought most capable of sustaining scale in their markets. These operators demand industry-leading rig capabilities, performance, and advanced technology. Our track record across these dynamics has established Nabors as the leading provider of drilling services to these customers. This strong position will serve us well as we emerge from this downturn.
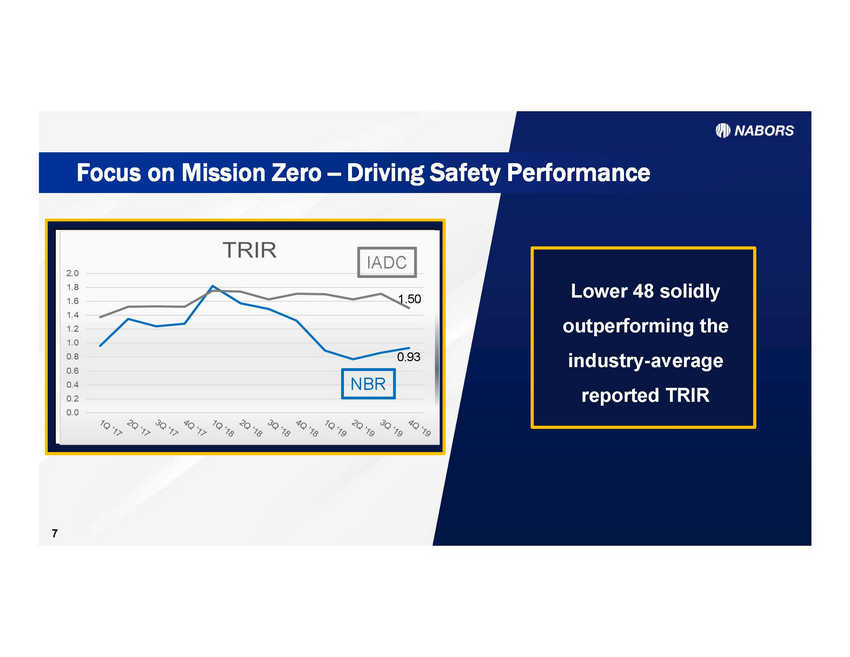
“I would again like to thank our employees for their hard work in this trying environment. I remain confident that their commitment and perseverance will be rewarded in the recovery.”
About Nabors
Nabors (NYSE: NBR) owns and operates one of the world's largest land-based drilling rig fleets and provides offshore platform rigs in the United States and several international markets. Nabors also provides directional drilling services, tubular services, performance software, and innovative technologies for its own rig fleet and those of third parties. Leveraging advanced drilling automation capabilities, Nabors highly skilled workforce continues to set new standards for operational excellence and transform the industry.
Forward-looking Statements
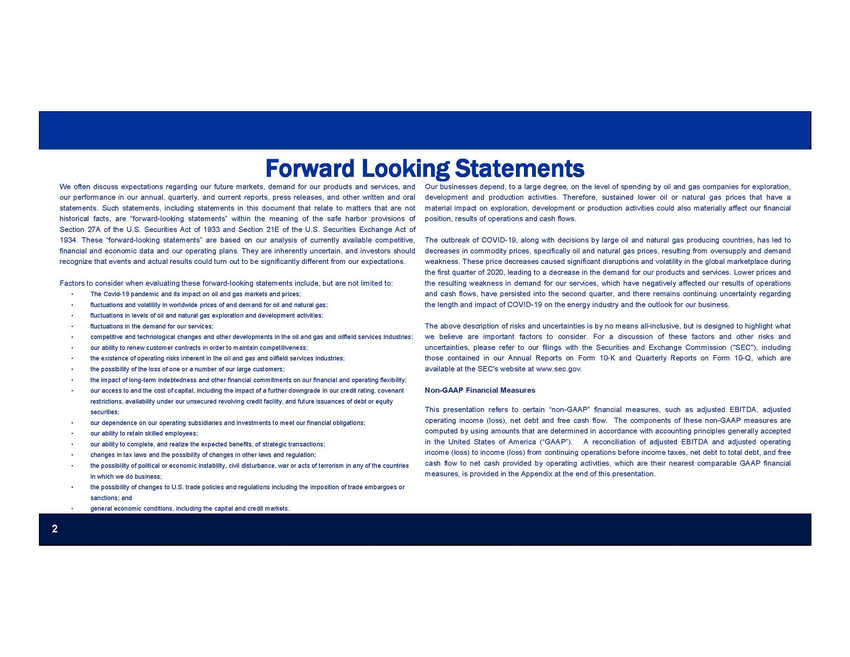
The information included in this press release includes forward-looking statements within the meaning of the Securities Act of 1933 and the Securities Exchange Act of 1934. Such forward-looking statements are subject to a number of risks and uncertainties, as disclosed by Nabors from time to time in its filings with the Securities and Exchange Commission. The results included in this press release are preliminary and unaudited and are subject to change and finalization based on the completion of the Company's normal quarter-end procedures, particularly as it relates to impairments and valuations or reserves around the carrying value of various assets on our balance sheet. As a result, these preliminary results may be materially different than the actual results reflected on the Company's Form 10-Q, when it is filed. We do not expect there to be any differences in revenues, adjusted EBITDA, adjusted operating income (loss), free cash flow or net debt, or any of the rig activity or daily rig financial information, but there could be material differences to net loss from continuing operations attributable to Nabors common shareholders and earning per share.
The preliminary results and forward-looking statements contained in this press release reflect management's estimates and beliefs as of the date of this press release. Nabors does not undertake to update these forward-looking statements.
| |
|
Non-GAAP Disclaimer
This press release may present certain “non-GAAP” financial measures. The components of these non-GAAP measures are computed by using amounts that are determined in accordance with accounting principles generally accepted in the United States of America (“GAAP”). Adjusted operating income (loss) represents income (loss) from continuing operations before income taxes, interest expense, earnings (losses) from unconsolidated affiliates, investment income (loss), impairments and other charges and other, net. Adjusted EBITDA is computed similarly, but also excludes depreciation and amortization expenses. In addition, adjusted EBITDA and adjusted operating income (loss) exclude certain cash expenses that the Company is obligated to make. Net debt is calculated as total debt minus the sum of cash, cash equivalents and short-term investments. Free cash flow represents net cash provided by operating activities less cash used for investing activities. Free cash flow is an indicator of our ability to generate cash flow after required spending to maintain or expand our asset base. Management believes that this non-GAAP measure is useful information to investors when comparing our cash flows with the cash flows of other companies. Each of these non-GAAP measures has limitations and therefore should not be used in isolation or as a substitute for the amounts reported in accordance with GAAP. However, management evaluates the performance of its operating segments and the consolidated Company based on several criteria, including adjusted EBITDA, adjusted operating income (loss), net debt, and free cash flow, because it believes that these financial measures accurately reflect the Company’s ongoing profitability and performance. Securities analysts and investors also use these measures as some of the metrics on which they analyze the Company’s performance. Other companies in this industry may compute these measures differently. Reconciliations of consolidated adjusted EBITDA and adjusted operating income (loss) to income (loss) from continuing operations before income taxes, net debt to total debt, and free cash flow to cash flow provided by operations, which are their nearest comparable GAAP financial measures, are included in the tables at the end of this press release.
Media Contact: William C. Conroy, Vice President of Corporate Development & Investor Relations, +1 281-775-2423, or Kara Peak, Director of Corporate Development & Investor Relations, +1 281-775-4954. To request investor materials, contact Nabors' corporate headquarters in Hamilton, Bermuda at +441-292-1510 or via e-mail [email protected]
NABORS INDUSTRIES LTD. AND SUBSIDIARIES
PRELIMINARY CONDENSED CONSOLIDATED STATEMENTS OF INCOME (LOSS)
(Unaudited)
| Three Months Ended | Six Months Ended | |||||||||||||||||||
| June 30, | March 31, | June 30, | ||||||||||||||||||
| (In thousands, except per share amounts) | 2020 | 2019 | 2020 | 2020 | 2019 | |||||||||||||||
| Revenues and other income: | ||||||||||||||||||||
| Operating revenues | $ | 533,931 | $ | 771,406 | $ | 718,364 | $ | 1,252,295 | $ | 1,571,046 | ||||||||||
| Earnings (losses) from unconsolidated affiliates | - | - | - | - | (5 | ) | ||||||||||||||
| Investment income (loss) | 2,036 | 469 | (3,198 | ) | (1,162 | ) | 10,146 | |||||||||||||
| Total revenues and other income | 535,967 | 771,875 | 715,166 | 1,251,133 | 1,581,187 | |||||||||||||||
| Costs and other deductions: | ||||||||||||||||||||
| Direct costs | 326,557 | 496,664 | 461,840 | 788,397 | 1,017,621 | |||||||||||||||
| General and administrative expenses | 46,244 | 64,415 | 57,384 | 103,628 | 132,582 | |||||||||||||||
| Research and engineering | 7,305 | 11,920 | 11,409 | 18,714 | 25,440 | |||||||||||||||
| Depreciation and amortization | 211,120 | 218,319 | 227,063 | 438,183 | 428,710 | |||||||||||||||
| Interest expense | 51,206 | 51,491 | 54,722 | 105,928 | 103,843 | |||||||||||||||
| Impairments and other charges | 57,852 | 102,570 | 276,434 | 334,286 | 99,903 | |||||||||||||||
| Other, net | (30,795 | ) | 7,899 | (17,110 | ) | (47,905 | ) | 28,068 | ||||||||||||
| Total costs and other deductions | 669,489 | 953,278 | 1,071,742 | 1,741,231 | 1,836,167 | |||||||||||||||
| Income (loss) from continuing operations before income taxes | (133,522 | ) | (181,403 | ) | (356,576 | ) | (490,098 | ) | (254,980 | ) | ||||||||||
| Income tax expense (benefit) | 4,446 | 11,398 | 17,693 | 22,139 | 41,197 | |||||||||||||||
| Income (loss) from continuing operations, net of tax | (137,968 | ) | (192,801 | ) | (374,269 | ) | (512,237 | ) | (296,177 | ) | ||||||||||
| Income (loss) from discontinued operations, net of tax | 23 | (34 | ) | (93 | ) | (70 | ) | (191 | ) | |||||||||||
| Net income (loss) | (137,945 | ) | (192,835 | ) | (374,362 | ) | (512,307 | ) | (296,368 | ) | ||||||||||
| Less: Net (income) loss attributable to noncontrolling interest | (10,167 | ) | (10,729 | ) | (17,465 | ) | (27,632 | ) | (24,905 | ) | ||||||||||
| Net income (loss) attributable to Nabors | $ | (148,112 | ) | $ | (203,564 | ) | $ | (391,827 | ) | $ | (539,939 | ) | $ | (321,273 | ) | |||||
| Less: Preferred stock dividend | $ | (3,653 | ) | $ | (4,312 | ) | $ | (3,652 | ) | $ | (7,305 | ) | $ | (8,625 | ) | |||||
| Net income (loss) attributable to Nabors common shareholders | $ | (151,765 | ) | $ | (207,876 | ) | $ | (395,479 | ) | $ | (547,244 | ) | $ | (329,898 | ) | |||||
| Amounts attributable to Nabors common shareholders: | ||||||||||||||||||||
| Net income (loss) from continuing operations | $ | (151,788 | ) | $ | (207,842 | ) | $ | (395,386 | ) | $ | (547,174 | ) | $ | (329,707 | ) | |||||
| Net income (loss) from discontinued operations | 23 | (34 | ) | (93 | ) | (70 | ) | (191 | ) | |||||||||||
| Net income (loss) attributable to Nabors common shareholders | $ | (151,765 | ) | $ | (207,876 | ) | $ | (395,479 | ) | $ | (547,244 | ) | $ | (329,898 | ) | |||||
| Earnings (losses) per share: | ||||||||||||||||||||
| Basic from continuing operations | $ | (22.13 | ) | $ | (30.31 | ) | $ | (56.72 | ) | $ | (78.85 | ) | $ | (48.43 | ) | |||||
| Basic from discontinued operations | - | - | (0.01 | ) | (0.01 | ) | (0.03 | ) | ||||||||||||
| Total Basic | $ | (22.13 | ) | $ | (30.31 | ) | $ | (56.73 | ) | $ | (78.86 | ) | $ | (48.46 | ) | |||||
| Diluted from continuing operations | $ | (22.13 | ) | $ | (30.31 | ) | $ | (56.72 | ) | $ | (78.85 | ) | $ | (48.43 | ) | |||||
| Diluted from discontinued operations | - | - | (0.01 | ) | (0.01 | ) | (0.03 | ) | ||||||||||||
| Total Diluted | $ | (22.13 | ) | $ | (30.31 | ) | $ | (56.73 | ) | $ | (78.86 | ) | $ | (48.46 | ) | |||||
| Weighted-average number of common shares outstanding: | ||||||||||||||||||||
| Basic | 7,052 | 7,031 | 7,051 | 7,052 | 7,023 | |||||||||||||||
| Diluted | 7,052 | 7,031 | 7,051 | 7,052 | 7,023 | |||||||||||||||
| Adjusted EBITDA | $ | 153,825 | $ | 198,407 | $ | 187,731 | $ | 341,556 | $ | 395,403 | ||||||||||
| Adjusted operating income (loss) | $ | (57,295 | ) | $ | (19,912 | ) | $ | (39,332 | ) | $ | (96,627 | ) | $ | (33,307 | ) | |||||
| 1-1 |
NABORS INDUSTRIES LTD. AND SUBSIDIARIES
PRELIMINARY CONDENSED CONSOLIDATED BALANCE SHEETS
| June 30, | March 31, | December 31, | ||||||||||
| (In thousands) | 2020 | 2020 | 2019 | |||||||||
| (Unaudited) | ||||||||||||
| ASSETS | ||||||||||||
| Current assets: | ||||||||||||
| Cash and short-term investments | $ | 494,278 | $ | 489,658 | $ | 452,496 | ||||||
| Accounts receivable, net | 349,005 | 454,718 | 453,042 | |||||||||
| Assets held for sale | 562 | 1,936 | 2,530 | |||||||||
| Other current assets | 309,077 | 324,524 | 340,598 | |||||||||
| Total current assets | 1,152,922 | 1,270,836 | 1,248,666 | |||||||||
| Property, plant and equipment, net | 4,395,725 | 4,597,308 | 4,930,549 | |||||||||
| Goodwill | - | - | 28,380 | |||||||||
| Other long-term assets | 433,768 | 440,404 | 553,063 | |||||||||
| Total assets | $ | 5,982,415 | $ | 6,308,548 | $ | 6,760,658 | ||||||
| LIABILITIES AND EQUITY | ||||||||||||
| Current liabilities: | ||||||||||||
| Current portion of debt | $ | - | $ | - | $ | - | ||||||
| Other current liabilities | 523,690 | 584,870 | 656,548 | |||||||||
| Total current liabilities | 523,690 | 584,870 | 656,548 | |||||||||
| Long-term debt | 3,276,103 | 3,388,014 | 3,333,220 | |||||||||
| Other long-term liabilities | 241,005 | 264,742 | 295,333 | |||||||||
| Total liabilities | 4,040,798 | 4,237,626 | 4,285,101 | |||||||||
| Redeemable noncontrolling interest in subsidiary | 434,131 | 429,824 | 425,392 | |||||||||
| Equity: | ||||||||||||
| Shareholders' equity | 1,413,147 | 1,555,921 | 1,982,811 | |||||||||
| Noncontrolling interest | 94,339 | 85,177 | 67,354 | |||||||||
| Total equity | 1,507,486 | 1,641,098 | 2,050,165 | |||||||||
| Total liabilities and equity | $ | 5,982,415 | $ | 6,308,548 | $ | 6,760,658 | ||||||
| 1-2 |
NABORS INDUSTRIES LTD. AND SUBSIDIARIES
SEGMENT REPORTING
(Unaudited)
The following tables set forth certain information with respect to our reportable segments and rig activity:
| Three Months Ended | Six Months Ended | |||||||||||||||||||
| June 30, | March 31, | June 30, | ||||||||||||||||||
| (In thousands, except rig activity) | 2020 | 2019 | 2020 | 2020 | 2019 | |||||||||||||||
| Operating revenues: | ||||||||||||||||||||
| U.S. Drilling | $ | 173,784 | $ | 323,402 | $ | 274,901 | $ | 448,685 | $ | 643,611 | ||||||||||
| Canada Drilling | 3,564 | 11,389 | 25,591 | 29,155 | 36,704 | |||||||||||||||
| International Drilling | 301,078 | 326,905 | 337,110 | 638,188 | 664,161 | |||||||||||||||
| Drilling Solutions | 33,129 | 64,583 | 55,384 | 88,513 | 130,005 | |||||||||||||||
| Rig Technologies (1) | 33,582 | 72,751 | 42,150 | 75,732 | 144,504 | |||||||||||||||
| Other reconciling items (2) | (11,206 | ) | (27,624 | ) | (16,772 | ) | (27,978 | ) | (47,939 | ) | ||||||||||
| Total operating revenues | $ | 533,931 | $ | 771,406 | $ | 718,364 | $ | 1,252,295 | $ | 1,571,046 | ||||||||||
| Adjusted EBITDA: (3) | ||||||||||||||||||||
| U.S. Drilling | $ | 77,659 | $ | 124,924 | $ | 101,809 | $ | 179,468 | $ | 249,929 | ||||||||||
| Canada Drilling | (564 | ) | 1,069 | 7,931 | 7,367 | 8,515 | ||||||||||||||
| International Drilling | 93,510 | 86,767 | 91,509 | 185,019 | 172,611 | |||||||||||||||
| Drilling Solutions | 9,411 | 22,461 | 19,439 | 28,850 | 43,507 | |||||||||||||||
| Rig Technologies (1) | 3,176 | 3,160 | (3,178 | ) | (2 | ) | 864 | |||||||||||||
| Other reconciling items (4) | (29,367 | ) | (39,974 | ) | (29,779 | ) | (59,146 | ) | (80,023 | ) | ||||||||||
| Total adjusted EBITDA | $ | 153,825 | $ | 198,407 | $ | 187,731 | $ | 341,556 | $ | 395,403 | ||||||||||
| Adjusted operating income (loss): (5) | ||||||||||||||||||||
| U.S. Drilling | $ | (23,395 | ) | $ | 20,392 | $ | (7,404 | ) | $ | (30,799 | ) | $ | 45,075 | |||||||
| Canada Drilling | (5,795 | ) | (5,537 | ) | 37 | (5,758 | ) | (5,596 | ) | |||||||||||
| International Drilling | 276 | (6,884 | ) | (4,147 | ) | (3,871 | ) | (12,521 | ) | |||||||||||
| Drilling Solutions | 1,733 | 13,793 | 10,549 | 12,282 | 26,648 | |||||||||||||||
| Rig Technologies (1) | (1,492 | ) | 496 | (8,151 | ) | (9,643 | ) | (4,652 | ) | |||||||||||
| Other reconciling items (4) | (28,622 | ) | (42,172 | ) | (30,216 | ) | (58,838 | ) | (82,261 | ) | ||||||||||
| Total adjusted operating income (loss) | $ | (57,295 | ) | $ | (19,912 | ) | $ | (39,332 | ) | $ | (96,627 | ) | $ | (33,307 | ) | |||||
| Rig activity: | ||||||||||||||||||||
| Average Rigs Working: (6) | ||||||||||||||||||||
| Lower 48 | 57.2 | 114.6 | 89.0 | 73.1 | 113.0 | |||||||||||||||
| Other US | 6.6 | 7.6 | 7.4 | 7.0 | 8.5 | |||||||||||||||
| U.S. Drilling | 63.8 | 122.2 | 96.4 | 80.1 | 121.5 | |||||||||||||||
| Canada Drilling | 2.2 | 7.4 | 16.8 | 9.5 | 11.8 | |||||||||||||||
| International Drilling | 82.4 | 88.6 | 86.7 | 84.6 | 89.1 | |||||||||||||||
| Total average rigs working | 148.4 | 218.2 | 199.9 | 174.2 | 222.4 | |||||||||||||||
| Daily Rig Revenue: | ||||||||||||||||||||
| Lower 48 | 24,744 | 25,783 | 27,199 | 26,238 | 25,794 | |||||||||||||||
| Other US | 74,825 | 78,922 | 80,996 | 78,089 | 75,588 | |||||||||||||||
| U.S. Drilling (8) | 29,927 | 29,091 | 31,339 | 30,776 | 29,267 | |||||||||||||||
| Canada Drilling | 18,105 | 17,024 | 16,767 | 16,920 | 17,184 | |||||||||||||||
| International Drilling | 40,129 | 40,529 | 42,717 | 41,456 | 41,160 | |||||||||||||||
| Daily Rig Margin: (7) | ||||||||||||||||||||
| Lower 48 | 10,449 | 10,222 | 9,891 | 10,110 | 10,197 | |||||||||||||||
| Other US | 46,032 | 39,760 | 43,756 | 44,828 | 38,965 | |||||||||||||||
| U.S. Drilling (8) | 14,132 | 12,061 | 12,497 | 13,148 | 12,204 | |||||||||||||||
| Canada Drilling | 899 | 3,764 | 5,694 | 5,146 | 5,338 | |||||||||||||||
| International Drilling | 14,091 | 12,610 | 13,471 | 13,773 | 12,616 | |||||||||||||||
| (1) | Includes our oilfield equipment manufacturing, automated systems, and downhole tools. |
| 1-3 |
| (2) | Represents the elimination of inter-segment transactions related to our Rig Technologies operating segment. |
| (3) | Adjusted EBITDA represents income (loss) from continuing operations before income taxes, interest expense, depreciation and amortization, earnings (losses) from unconsolidated affiliates, investment income (loss), impairments and other charges and other, net. Adjusted EBITDA is a non-GAAP financial measure and should not be used in isolation or as a substitute for the amounts reported in accordance with GAAP. In addition, adjusted EBITDA excludes certain cash expenses that the Company is obligated to make. However, management evaluates the performance of its operating segments and the consolidated Company based on several criteria, including adjusted EBITDA and adjusted operating income (loss), because it believes that these financial measures accurately reflect the Company’s ongoing profitability and performance. Securities analysts and investors use this measure as one of the metrics on which they analyze the Company’s performance. Other companies in this industry may compute these measures differently. A reconciliation of this non-GAAP measure to income (loss) from continuing operations before income taxes, which is the most closely comparable GAAP measure, is provided in the table set forth immediately following the heading "Reconciliation of Non-GAAP Financial Measures to Income (loss) from Continuing Operations before Income Taxes". |
| (4) | Represents the elimination of inter-segment transactions and unallocated corporate expenses. |
| (5) | Adjusted operating income (loss) represents income (loss) from continuing operations before income taxes, interest expense, earnings (losses) from unconsolidated affiliates, investment income (loss), impairments and other charges and other, net. Adjusted operating income (loss) is a non-GAAP financial measure and should not be used in isolation or as a substitute for the amounts reported in accordance with GAAP. In addition, adjusted operating income (loss) excludes certain cash expenses that the Company is obligated to make. However, management evaluates the performance of its operating segments and the consolidated Company based on several criteria, including adjusted EBITDA and adjusted operating income (loss), because it believes that these financial measures accurately reflect the Company’s ongoing profitability and performance. Securities analysts and investors use this measure as one of the metrics on which they analyze the Company’s performance. Other companies in this industry may compute these measures differently. A reconciliation of this non-GAAP measure to income (loss) from continuing operations before income taxes, which is the most closely comparable GAAP measure, is provided in the table set forth immediately following the heading "Reconciliation of Non-GAAP Financial Measures to Income (loss) from Continuing Operations before Income Taxes". |
| (6) | Represents a measure of the average number of rigs operating during a given period. For example, one rig operating 45 days during a quarter represents approximately 0.5 average rigs working for the quarter. On an annual period, one rig operating 182.5 days represents approximately 0.5 average rigs working for the year. |
| (7) | Daily rig margin represents operating revenue less operating expenses, divided by the total number of revenue days during the quarter. |
| (8) | The U.S. Drilling segment includes the Lower 48, Alaska, and Gulf of Mexico operating areas. |
| 1-4 |
NABORS INDUSTRIES LTD. AND SUBSIDIARIES
RECONCILIATION OF NON-GAAP FINANCIAL MEASURES TO
PRELIMINARY INCOME (LOSS) FROM CONTINUING OPERATIONS BEFORE INCOME TAXES
(Unaudited)
| Three Months Ended | Six Months Ended | |||||||||||||||||||
| June 30, | March 31, | June 30, | ||||||||||||||||||
| (In thousands) | 2020 | 2019 | 2020 | 2020 | 2019 | |||||||||||||||
| Adjusted EBITDA | $ | 153,825 | $ | 198,407 | $ | 187,731 | $ | 341,556 | $ | 395,403 | ||||||||||
| Depreciation and amortization | (211,120 | ) | (218,319 | ) | (227,063 | ) | (438,183 | ) | (428,710 | ) | ||||||||||
| Adjusted operating income (loss) | (57,295 | ) | (19,912 | ) | (39,332 | ) | (96,627 | ) | (33,307 | ) | ||||||||||
| Earnings (losses) from unconsolidated affiliates | - | - | - | - | (5 | ) | ||||||||||||||
| Investment income (loss) | 2,036 | 469 | (3,198 | ) | (1,162 | ) | 10,146 | |||||||||||||
| Interest expense | (51,206 | ) | (51,491 | ) | (54,722 | ) | (105,928 | ) | (103,843 | ) | ||||||||||
| Impairments and other charges | (57,852 | ) | (102,570 | ) | (276,434 | ) | (334,286 | ) | (99,903 | ) | ||||||||||
| Other, net | 30,795 | (7,899 | ) | 17,110 | 47,905 | (28,068 | ) | |||||||||||||
| Preliminary income (loss) from continuing operations before income taxes | $ | (133,522 | ) | $ | (181,403 | ) | $ | (356,576 | ) | $ | (490,098 | ) | $ | (254,980 | ) | |||||
| 1-5 |
NABORS INDUSTRIES LTD. AND SUBSIDIARIES
RECONCILIATION OF NET DEBT TO TOTAL DEBT
| June 30, | March 31, | December 31, | ||||||||||
| (In thousands) | 2020 | 2020 | 2019 | |||||||||
| (Unaudited) | ||||||||||||
| Current portion of debt | $ | - | $ | - | $ | - | ||||||
| Long-term debt | 3,276,103 | 3,388,014 | 3,333,220 | |||||||||
| Total Debt | 3,276,103 | 3,388,014 | 3,333,220 | |||||||||
| Less: Cash and short-term investments | 494,278 | 489,658 | 452,496 | |||||||||
| Net Debt | $ | 2,781,825 | $ | 2,898,356 | $ | 2,880,724 | ||||||
| 1-6 |
NABORS INDUSTRIES LTD. AND SUBSIDIARIES
RECONCILIATION OF FREE CASH FLOW TO
NET CASH PROVIDED BY OPERATING ACTIVITIES
(Unaudited)
| Three Months Ended | Six Months Ended | |||||||||||
| June 30, | March 31, | June 30, | ||||||||||
| (In thousands) | 2020 | 2020 | 2020 | |||||||||
| Net cash provided by operating activities | $ | 142,610 | $ | 59,162 | $ | 201,772 | ||||||
| Less: Net cash used for investing activities | (41,376 | ) | (50,773 | ) | (92,149 | ) | ||||||
| Free cash flow | $ | 101,234 | $ | 8,389 | $ | 109,623 | ||||||
Free cash flow represents net cash provided by operating activities less cash used for investing activities. Free cash flow is an indicator of our ability to generate cash flow after required spending to maintain or expand our asset base. Management believes that this non-GAAP measure is useful information to investors when comparing our cash flows with the cash flows of other companies. This non-GAAP measure has limitations and therefore should not be used in isolation or as a substitute for the amounts reported in accordance with GAAP. However, management evaluates the performance of the consolidated Company based on several criteria, including free cash flow, because it believes that these financial measures accurately reflect the Company's ongoing profitability and performance.
| 1-7 |