UNITED STATES SECURITIES AND EXCHANGE COMMISSION
Washington, D.C. 20549
_______________________________
FORM 10-Q
QUARTERLY REPORT PURSUANT TO SECTION 13 OR 15(d) OF THE SECURITIES EXCHANGE ACT OF 1934 | ||
For the quarterly period ended | ||
OR | ||
TRANSITION REPORT PURSUANT TO SECTION 13 OR 15(d) OF THE SECURITIES EXCHANGE ACT OF 1934 | ||
For the transition period | from ________ to ________ | |
Commission file number: 001-38855
___________________________________
(Exact name of registrant as specified in its charter)
(State or Other Jurisdiction of Incorporation or Organization) | (I.R.S. Employer Identification No.) | ||
(Address of Principal Executive Offices) | (Zip Code) | ||
Registrant’s telephone number, including area code: +1 212 401 8700
Securities registered pursuant to Section 12(b) of the Act:
Title of each class | Trading Symbol(s) | Name of each exchange on which registered | ||
Nasdaq Texas, LLC | ||||
Indicate by check mark whether the registrant (1) has filed all reports required to be filed by Section 13 or 15(d) of the Securities
Exchange Act of 1934 during the preceding 12 months (or for such shorter period that the registrant was required to file such reports), and (2) has
been subject to such filing requirements for the past 90 days. Yes ☒ No ☐
Indicate by check mark whether the registrant has submitted electronically every Interactive Data File required to be submitted pursuant to
Rule 405 of Regulation S-T (§232.405 of this chapter) during the preceding 12 months (or for such shorter period that the registrant was required to
submit such files). Yes ☒ No ☐
Indicate by check mark whether the registrant is a large accelerated filer, an accelerated filer, a non-accelerated filer, a smaller reporting
company, or an emerging growth company. See the definitions of “large accelerated filer,” “accelerated filer,” “smaller reporting company” and
“emerging growth company” in Rule 12b-2 of the Exchange Act.
☒ | Accelerated filer | ☐ | |
Non-accelerated filer | ☐ | Smaller reporting company | |
Emerging growth company |
If an emerging growth company, indicate by check mark if the registrant has elected not to use the extended transition period for
complying with any new or revised financial accounting standards provided pursuant to Section 13(a) of the Exchange Act. ☐
Indicate by check mark whether the registrant is a shell company (as defined in Rule 12b-2 of the Exchange Act). Yes ☐ No ☒
Indicate the number of shares outstanding of each of the registrant's classes of common stock, as of the latest practicable date.
Class | Outstanding at July 16, 2026 | ||
Common Stock, $0.01 par value per share | shares | ||
i
Nasdaq, Inc.
TABLE OF CONTENTS | |||
PART I | |||
Item 1. | |||
Item 2. | |||
Item 3. | |||
Item 4. | |||
PART II | |||
Item 1. | |||
Item 1A. | |||
Item 2. | |||
Item 5. | |||
Item 6. | |||
ii
About this Form 10-Q
Throughout this Form 10-Q, unless otherwise specified:
•“Nasdaq,” “we,” “us” and “our” refer to Nasdaq, Inc.
•“Nasdaq Baltic” refers to collectively, Nasdaq Tallinn
AS, Nasdaq Riga, AS, and AB Nasdaq Vilnius.
•“Nasdaq Texas” refers to the cash equity exchange
operated by Nasdaq Texas, LLC, formerly Nasdaq BX.
•“NTX Options” refers to the options exchange operated
by Nasdaq Texas, LLC, formerly Nasdaq BX Options.
•“Nasdaq Clearing” refers to the clearing operations
conducted by Nasdaq Clearing AB.
•“Nasdaq CXC” and “Nasdaq CX2” refer to the Canadian
cash equity trading books operated by Nasdaq CXC
Limited.
•“Nasdaq First North” refers to our alternative
marketplaces for smaller companies and growth
companies in the Nordic and Baltic regions.
•“Nasdaq GEMX” refers to the options exchange
operated by Nasdaq GEMX, LLC.
•“Nasdaq ISE” refers to the options exchange operated by
Nasdaq ISE, LLC.
•“Nasdaq MRX” refers to the options exchange operated
by Nasdaq MRX, LLC.
•“Nasdaq Nordic” refers to collectively, Nasdaq Clearing
AB, Nasdaq Stockholm AB, Nasdaq Copenhagen A/S,
Nasdaq Helsinki Ltd, and Nasdaq Iceland hf.
•“Nasdaq PHLX” refers to the options exchange operated
by Nasdaq PHLX LLC.
•“Nasdaq PSX” refers to the cash equity exchange
operated by Nasdaq PHLX LLC.
•“The Nasdaq Options Market” refers to the options
exchange operated by The Nasdaq Stock Market LLC.
•“The Nasdaq Stock Market” refers to the cash equity
exchange and listing venue operated by The Nasdaq
Stock Market LLC.
Nasdaq also provides the following list of abbreviations and
acronyms used throughout this Quarterly Report on Form 10-
Q as a tool for the reader.
2026 Revolving Credit Facility: $1.50 billion senior
unsecured revolving credit facility, which matures on June
30, 2031
2026 Notes: $500 million aggregate principal amount issued
of 3.850% senior unsecured notes paid at maturity on June
30, 2026
2028 Notes: $1 billion aggregate principal amount issued of
5.350% senior unsecured notes due June 28, 2028
2029 Notes: €600 million aggregate principal amount issued
of 1.75% senior unsecured notes due March 28, 2029
2030 Notes: €600 million aggregate principal amount issued
of 0.875% senior unsecured notes due February 13, 2030
2031 Notes: $650 million aggregate principal amount issued
of 1.650% senior unsecured notes due January 15, 2031
2032 Notes: €750 million aggregate principal amount issued
of 4.500% senior unsecured notes due February 15, 2032
2033 Notes: €615 million aggregate principal amount issued
of 0.900% senior unsecured notes due July 30, 2033
2034 Notes: $1.25 billion aggregate principal amount issued
of 5.550% senior unsecured notes due February 15, 2034
2040 Notes: $650 million aggregate principal amount issued
of 2.500% senior unsecured notes due December 21, 2040
2050 Notes: $500 million aggregate principal amount issued
of 3.250% senior unsecured notes due April 28, 2050
2052 Notes: $550 million aggregate principal amount issued
of 3.950% senior unsecured notes due March 7, 2052
2053 Notes: $750 million aggregate principal amount issued
of 5.950% senior unsecured notes due August 15, 2053
2063 Notes: $750 million aggregate principal amount issued
of 6.100% senior unsecured notes due June 28, 2063
Adenza: Adenza Holdings, Inc.
AI: Artificial Intelligence
ARR: Annualized Recurring Revenue
ASR: Accelerated Share Repurchase
AUM: Assets Under Management
CCP: Central Counterparty
CAT: A market-wide consolidated audit trail established
under an SEC approved plan by Nasdaq and other
exchanges
EMIR: European Market Infrastructure Regulation
Equity Plan: Nasdaq Equity Incentive Plan
ESPP: Nasdaq Employee Stock Purchase Plan
ETP: Exchange Traded Product
Euro Notes: The 2029, 2030, 2032 and 2033 Notes
Exchange Act: Securities Exchange Act of 1934, as amended
FINRA: Financial Industry Regulatory Authority
GICS: Global Industry Classification Standard
IPO: Initial Public Offering
NSCC: National Securities Clearing Corporation
OCC: The Options Clearing Corporation
OTC: Over-the-Counter
PSU: Performance Share Unit
SaaS: Software as a Service
SEC: U.S. Securities and Exchange Commission
iii
SERP: Supplemental Executive Retirement Plan
SFSA: Swedish Financial Supervisory Authority
SOFR: Secured Overnight Financing Rate
SPAC: Special Purpose Acquisition Company
S&P: Standard & Poor's
S&P 500: S&P 500 Stock Index
TSR: Total Shareholder Return
U.S. GAAP: U.S. Generally Accepted Accounting Principles
U.S. Tape plans: U.S. cash equity and U.S. options industry
data
NASDAQ, the NASDAQ logos, and other brand, service or
product names or marks referred to in this report are
trademarks or service marks, registered or otherwise, of
Nasdaq, Inc. and/or its subsidiaries. FINRA and Trade
Reporting Facility are registered trademarks of FINRA.
This Quarterly Report on Form 10-Q includes market share
and industry data that we obtained from industry publications
and surveys, reports of governmental agencies and internal
company surveys. Industry publications and surveys
generally state that the information they contain has been
obtained from sources believed to be reliable, but we cannot
assure you that this information is accurate or complete. We
have not independently verified any of the data from third-
party sources nor have we ascertained the underlying
economic assumptions relied upon therein. Statements as to
our market position are based on the most currently available
market data. For market comparison purposes, The Nasdaq
Stock Market data in this Quarterly Report on Form 10-Q for
IPOs and new listings of equity securities (including issuers
that switched from other listings venues, closed-end funds
and ETPs) is based on data generated internally by us;
therefore, the data may not be comparable to other publicly
available IPO data. Data in this Quarterly Report on Form
10-Q for IPOs and new listings of equity securities on the
Nasdaq Nordic and Nasdaq Baltic exchanges and Nasdaq
First North also is based on data generated internally by us.
The data regarding Nasdaq's combined market capitalization
in the U.S. is obtained from Bloomberg. IPOs and new
listings data is presented as of period end. While we are not
aware of any misstatements regarding industry data presented
herein, our estimates involve risks and uncertainties and are
subject to change based on various factors. We refer you to
the “Risk Factors” section in our Form 10-K for the fiscal
year ended December 31, 2025 that was filed with the SEC
on February 12, 2026.
Nasdaq intends to use its website, ir.nasdaq.com, as a means
for disclosing material non-public information and for
complying with SEC Regulation FD and other disclosure
obligations.
iv
Forward-Looking Statements
The SEC encourages companies to disclose forward-looking
information so that investors can better understand a
company’s future prospects and make informed investment
decisions. This Quarterly Report on Form 10-Q contains
these types of statements. Words such as “can,” “may,”
“will,” “could,” “should,” “anticipate,” “estimates,”
“expects,” “projects,” “intends,” “plans,” “believes” and
words or terms of similar substance used in connection with
any discussion of future expectations as to industry and
regulatory developments or business initiatives and
strategies, future operating results or financial performance,
and other future developments are intended to identify
forward-looking statements. These include, among others,
statements relating to:
•our strategic direction;
•the integration of acquired businesses, including
accounting decisions relating thereto;
•the scope, nature or impact of acquisitions, divestitures,
investments or other transactional activities;
•the effective dates for, and expected benefits of, ongoing
initiatives, including transactional activities and other
strategic, restructuring, technology, de-leveraging and
capital return initiatives;
•our products and services;
•the impact of pricing changes;
•tax matters;
•the cost and availability of liquidity and capital; and
•any litigation, or any regulatory or government
investigation or action, to which we are or could become a
party or which may affect us and any potential settlements
of litigation, regulatory or governmental investigations or
actions.
Forward-looking statements involve risks and uncertainties.
Factors that could cause actual results to differ materially
from those contemplated by the forward-looking statements
include, among others, the following:
•our operating results may be lower than expected;
•our ability to successfully integrate acquired businesses or
divest sold businesses or assets, including the fact that any
integration or transition may be more difficult, time
consuming or costly than expected, and we may be unable
to realize synergies from business combinations,
acquisitions, divestitures or other transactional activities;
•loss of significant trading and clearing volumes or values,
fees, market share, listed companies, market data
customers or other customers;
•our ability to develop and grow our non-trading
businesses;
•our ability to keep up with rapid technological advances,
including our ability to effectively manage the development
and use of AI in certain of our products and offerings, and
adequately address cybersecurity risks;
•economic, political, regulatory and market conditions and
fluctuations, including inflation, tariffs, interest rate and
foreign currency risk inherent in U.S. and international
operations, and geopolitical instability;
•the performance and reliability of our technology and
technology of third parties on which we rely;
•any significant systems failures or errors in our
operational processes;
•our ability to continue to generate cash and manage our
indebtedness; and
•adverse changes that may occur in the litigation or
regulatory areas, or in the securities markets generally, or
increased regulatory oversight domestically or
internationally.
Most of these factors are difficult to predict accurately and
are generally beyond our control. You should consider the
uncertainty and any risk related to forward-looking
statements that we make. These risk factors are more fully
described in the “Risk Factors” section in our Form 10-K
filed with the SEC on February 12, 2026. You are cautioned
not to place undue reliance on these forward-looking
statements, which speak only as of the date of this report. You
should carefully read this entire Quarterly Report on Form
10-Q, including “Part I. Item 2. Management’s Discussion
and Analysis of Financial Condition and Results of
Operations” and the condensed consolidated financial
statements and the related notes. Except as required by the
federal securities laws, we undertake no obligation to update
any forward-looking statement, release publicly any revisions
to any forward-looking statements or report the occurrence
of unanticipated events. For any forward-looking statements
contained in any document, we claim the protection of the
safe harbor for forward-looking statements contained in the
Private Securities Litigation Reform Act of 1995.
1
PART I - FINANCIAL INFORMATION
Item 1. Financial Statements
Nasdaq, Inc.
Condensed Consolidated Balance Sheets
(in millions, except share and par value amounts)
June 30, 2026 | December 31, 2025 | ||
(unaudited) | |||
Assets | |||
Current assets: | |||
Cash and cash equivalents | $ | $ | |
Restricted cash and cash equivalents | |||
Default funds and margin deposits (including restricted cash and cash equivalents of $ | |||
Financial investments | |||
Receivables, net | |||
Other current assets | |||
Total current assets | |||
Property and equipment, net | |||
Goodwill | |||
Intangible assets, net | |||
Operating lease assets | |||
Other non-current assets | |||
Total assets | $ | $ | |
Liabilities | |||
Current liabilities: | |||
Accounts payable and accrued expenses | $ | $ | |
Section 31 fees payable to SEC | |||
Accrued personnel costs | |||
Deferred revenue | |||
Other current liabilities | |||
Default funds and margin deposits | |||
Short-term debt | |||
Total current liabilities | |||
Long-term debt | |||
Deferred tax liabilities, net | |||
Operating lease liabilities | |||
Other non-current liabilities | |||
Total liabilities | |||
Commitments and contingencies | |||
Equity | |||
Nasdaq stockholders’ equity: | |||
Common stock, $ outstanding: | |||
Additional paid-in capital | |||
Common stock in treasury, at cost: shares at December 31, 2025 | ( | ( | |
Accumulated other comprehensive loss | ( | ( | |
Retained earnings | |||
Total Nasdaq stockholders’ equity | |||
Noncontrolling interests | |||
Total equity | |||
Total liabilities and equity | $ | $ |
See accompanying notes to condensed consolidated financial statements.
2
Nasdaq, Inc.
Condensed Consolidated Statements of Income
(unaudited)
(in millions, except per share amounts)
Three Months Ended June 30, | Six Months Ended June 30, | ||||||
2026 | 2025 | 2026 | 2025 | ||||
Revenues: | |||||||
Capital Access Platforms | $ | $ | $ | $ | |||
Financial Technology | |||||||
Market Services | |||||||
Other revenues | |||||||
Total revenues | |||||||
Transaction-based expenses: | |||||||
Transaction rebates | ( | ( | ( | ( | |||
Brokerage, clearance and exchange fees | ( | ( | ( | ( | |||
Revenues less transaction-based expenses | |||||||
Operating expenses: | |||||||
Compensation and benefits | |||||||
Professional and contract services | |||||||
Technology and communication infrastructure | |||||||
Occupancy | |||||||
General, administrative and other | |||||||
Marketing and advertising | |||||||
Depreciation and amortization | |||||||
Regulatory | |||||||
Merger and strategic initiatives | |||||||
Restructuring charges | |||||||
Total operating expenses | |||||||
Operating income | |||||||
Interest income | |||||||
Interest expense | ( | ( | ( | ( | |||
Net gain on divestitures | |||||||
Other income (losses) | ( | ( | |||||
Net income from unconsolidated investees | |||||||
Income before income taxes | |||||||
Income tax provision | |||||||
Net income | $ | $ | $ | $ | |||
Net loss attributable to noncontrolling interests | |||||||
Net income attributable to Nasdaq | $ | $ | $ | $ | |||
Per share information: | |||||||
Basic earnings per share | $ | $ | $ | $ | |||
Diluted earnings per share | $ | $ | $ | $ | |||
Cash dividends declared per common share | $ | $ | $ | $ | |||
See accompanying notes to condensed consolidated financial statements.
3
Nasdaq, Inc.
Condensed Consolidated Statements of Comprehensive Income
(unaudited)
(in millions)
Three Months Ended June 30, | Six Months Ended June 30, | ||||||
2026 | 2025 | 2026 | 2025 | ||||
Net income | $ | $ | $ | $ | |||
Other comprehensive income (loss): | |||||||
Foreign currency translation gains (losses) | ( | ( | ( | ||||
Income tax benefit (expense)(1) | ( | ( | |||||
Foreign currency translation, net | ( | ( | |||||
Unrealized gain (loss) on derivatives instruments, net | ( | ||||||
Total other comprehensive income (loss), net of tax | ( | ( | |||||
Comprehensive income | $ | $ | $ | $ | |||
Comprehensive loss attributable to noncontrolling interests | |||||||
Comprehensive income attributable to Nasdaq | $ | $ | $ | $ | |||
____________
(1)Primarily relates to the tax effect of unrealized gains and losses on our Euro Notes.
See accompanying notes to condensed consolidated financial statements.
4
Nasdaq, Inc.
Condensed Consolidated Statements of Changes in Stockholders’ Equity
(unaudited)
(in millions)
Three Months Ended June 30, | Six Months Ended June 30, | ||||||||||||||
2026 | 2025 | 2026 | 2025 | ||||||||||||
Shares | $ | Shares | $ | Shares | $ | Shares | $ | ||||||||
Common stock | |||||||||||||||
Additional paid-in capital | |||||||||||||||
Beginning balance | |||||||||||||||
Share repurchase program | ( | ( | ( | ( | ( | ( | ( | ( | |||||||
Share-based compensation | |||||||||||||||
Issuance of stock under employee stock plans | |||||||||||||||
Other issuances of common stock, net | |||||||||||||||
Ending balance | |||||||||||||||
Common stock in treasury, at cost | |||||||||||||||
Beginning balance | ( | ( | ( | ( | |||||||||||
Employee shares withheld | ( | ( | ( | ( | ( | ||||||||||
Ending balance | ( | ( | ( | ( | |||||||||||
Accumulated other comprehensive loss | |||||||||||||||
Beginning balance | ( | ( | ( | ( | |||||||||||
Other comprehensive income (loss) | ( | ( | |||||||||||||
Ending balance | ( | ( | ( | ( | |||||||||||
Retained earnings | |||||||||||||||
Beginning balance | |||||||||||||||
Net income attributable to Nasdaq | |||||||||||||||
Cash dividends declared and paid | ( | ( | ( | ( | |||||||||||
Ending balance | |||||||||||||||
Total Nasdaq stockholders’ equity | |||||||||||||||
Noncontrolling interests | |||||||||||||||
Beginning balance | |||||||||||||||
Net activity related to noncontrolling interests | ( | ( | |||||||||||||
Ending balance | |||||||||||||||
Total Equity | $ | $ | $ | $ | |||||||||||
See accompanying notes to condensed consolidated financial statements.
5
Nasdaq, Inc.
Condensed Consolidated Statements of Cash Flows
(unaudited)
(in millions)
Six Months Ended June 30, | |||
2026 | 2025 | ||
Cash flows from operating activities: | |||
Net income | $ | $ | |
Adjustments to reconcile net income to net cash provided by operating activities: | |||
Depreciation and amortization | |||
Share-based compensation | |||
Deferred income tax expense | |||
Net gain on divestitures | ( | ( | |
Net income from unconsolidated investees | ( | ( | |
Other reconciling items included in net income | ( | ||
Net change in operating assets and liabilities, excluding the effects of divestitures: | |||
Receivables, net | ( | ||
Other assets | |||
Accounts payable and accrued expenses | ( | ( | |
Section 31 fees payable to SEC | |||
Accrued personnel costs | ( | ( | |
Deferred revenue | |||
Other liabilities | ( | ( | |
Net cash provided by operating activities | |||
Cash flows from investing activities: | |||
Purchases of securities | ( | ( | |
Proceeds from sales and redemptions of securities | |||
Proceeds from divestitures, net of cash divested | |||
Purchases of property and equipment | ( | ( | |
Investments related to default funds and margin deposits, net(1) | ( | ||
Other investing activities | ( | ( | |
Net cash provided by (used in) investing activities | ( | ||
Cash flows from financing activities: | |||
Issuance of commercial paper, net | |||
Repayments of debt and credit commitment | ( | ( | |
Repurchases of common stock | ( | ( | |
Dividends paid | ( | ( | |
Proceeds from issuance of stock under employee stock plans | |||
Payments related to employee shares withheld for taxes | ( | ( | |
Default funds and margin deposits | ( | ( | |
Other financing activities | ( | ||
Net cash used in financing activities | ( | ( | |
Effect of exchange rate changes on cash and cash equivalents and restricted cash and cash equivalents | ( | ||
Net decrease in cash and cash equivalents and restricted cash and cash equivalents | ( | ( | |
Cash and cash equivalents, restricted cash and cash equivalents at beginning of period | |||
Cash and cash equivalents, restricted cash and cash equivalents at end of period | $ | $ | |
Reconciliation of Cash, Cash Equivalents and Restricted Cash and Cash Equivalents | |||
Cash and cash equivalents | $ | $ | |
Restricted cash and cash equivalents | |||
Restricted cash and cash equivalents (default funds and margin deposits) | |||
Total | $ | $ | |
Supplemental Disclosure - Cash Flow Information | |||
Cash paid for: | |||
Interest paid | $ | $ | |
Income taxes paid, net of refunds | $ | $ | |
__________________________
(1) See "Default Fund Contributions and Margin Deposits," of Note 14, "Clearing Operations," for further details.
See accompanying notes to condensed consolidated financial statements.
6
Nasdaq, Inc.
Notes to Condensed Consolidated Financial Statements
(Unaudited)
1. ORGANIZATION AND NATURE OF OPERATIONS
Nasdaq is a leading technology platform that powers the
world’s economies. We architect the infrastructure of the
world’s most modern markets, power the innovation
economy, and build trust in the financial system. We
empower economic opportunity by designing and deploying
advanced technology, data, and intelligence solutions that
enable our clients to capture opportunities, navigate risk, and
strengthen resilience.
Our organizational structure aligns our businesses with the
foundational shifts that are driving the evolution of the global
financial system. We manage, operate and provide our
products and services in three business segments: Capital
Access Platforms, Financial Technology and Market
Services.
Capital Access Platforms
The Capital Access Platforms segment comprises our Data &
Listing Services, Index and Workflow & Insights businesses.
Our Data business distributes historical and real-time market
data to sell-side customers, the institutional investing
community, retail online brokers, proprietary trading firms
and other venues, as well as various client portals and data
distributors. Our data products can enhance the transparency
of market activity within our exchanges and provide critical
information to professional and non-professional investors
globally.
Our Listing Services business operates listing platforms in
the U.S. and Europe and provides multiple global capital
raising solutions for public companies. Our main listing
markets are The Nasdaq Stock Market and the Nasdaq
Nordic and Nasdaq Baltic exchanges. Through Nasdaq First
North, our Nordic and Baltic operations also offer alternative
marketplaces for smaller companies and growth companies.
As of June 30, 2026, a total of 5,768 companies listed
securities on our U.S., Nasdaq Nordic, Nasdaq Baltic and
Nasdaq First North exchanges. As of June 30, 2026, there
were 4,659 total listings on The Nasdaq Stock Market,
including 1,243 ETPs. The Nasdaq combined market
capitalization in the U.S. was approximately $45.7 trillion. In
Europe, the Nasdaq Nordic and Nasdaq Baltic exchanges,
together with Nasdaq First North, were home to 1,109 listed
companies with a combined market capitalization of
approximately $2.4 trillion.
Our Index business develops and licenses Nasdaq-branded
indices and financial products. We also license cash-settled
futures, options and options on futures on our indices. As of
June 30, 2026, 481 ETPs listed on 28 exchanges in over 20
countries tracked a Nasdaq index and accounted for $1.1
trillion in AUM.
Workflow & Insights includes our analytics and corporate
solutions businesses. Our analytics business provides hedge
funds, asset managers, investment consultants and
institutional asset owners with information and analytics to
make data-driven investment decisions, deploy their
resources more productively, and provide liquidity solutions
for private funds. Through our eVestment solution, we
provide a suite of cloud-based solutions that help institutional
investors and consultants conduct pre-investment due
diligence, and monitor their portfolios post-investment. The
eVestment platform also enables asset managers to efficiently
distribute information about their firms and funds to asset
owners and consultants worldwide. In October 2025, we sold
our Solovis business, a financial technology platform
offering portfolio monitoring and analytics tools. Revenues
from this business are reflected in Other revenues in the
Condensed Consolidated Statements of Income for prior
periods presented, and in our Corporate segment for our
segment disclosures.
The Nasdaq Fund Network and Nasdaq Data Link are
additional platforms in our suite of investment data analytics
offerings and data management tools.
Our corporate solutions business serves both public and
private companies and organizations through our Investor
Relations Intelligence, Sustainability Solutions and
Governance Solutions products. Our public company clients
can be companies listed on our exchanges or other U.S. and
global exchanges. Our private company clients include a
diverse group of organizations ranging from family-owned
companies, government organizations, law firms, privately
held entities, and various non-profit organizations to
hospitals and healthcare systems. We help organizations
enhance their ability to understand and expand their global
shareholder base, improve corporate governance, and
navigate the evolving sustainability landscape through our
suite of advanced technology, analytics, reporting and
consulting services.
In July 2026, we announced that we have entered into a
definitive agreement to acquire Dasseti, Inc., an AI-powered
due diligence platform used by institutional asset allocators
and managers across public and private markets. This
business will be integrated into our eVestment solution. We
also announced, in July 2026, an agreement to sell Nasdaq
Fund Secondaries to Nasdaq Private Market, and we continue
to hold a minority interest in Nasdaq Private Market. These
transactions, individually, and in aggregate, will not have a
material impact to our results.
7
Financial Technology
The Financial Technology segment comprises our Financial
Crime Management Technology, Regulatory Technology and
Capital Markets Technology businesses.
Financial Crime Management Technology includes our
Nasdaq Verafin solution, a cloud-based platform leveraging
consortium data and AI to help more than 2,800 financial
institutions detect, investigate, and report money laundering
and financial fraud.
Regulatory Technology comprises our AxiomSL and
surveillance solutions. AxiomSL is a global leader in risk
data management and regulatory reporting solutions for the
financial industry, including banks, broker dealers and asset
managers. Its unique enterprise data management platform
delivers data lineage, risk aggregation, analytics, workflow
automation, reconciliation, validation and audit functionality,
as well as disclosures. AxiomSL’s platform supports
compliance across a wide range of global and local
regulations. Our surveillance solutions are designed for
banks, brokers and other market participants to assist them in
complying with market abuse and integrity rules and
regulations. In addition, we provide regulators and exchanges
with a platform for surveillance.
Capital Markets Technology includes our market technology,
trade management services and Calypso solutions. Our
market technology business is a leading global technology
solutions provider and partner to exchanges, clearing
organizations, central securities depositories, regulators,
banks, brokers, buy-side firms and corporate businesses. Our
market technology solutions are utilized by leading markets
in North America, Europe and Asia as well as emerging
markets in the Middle East, Latin America, and Africa. Our
trade management services provide market participants with
a wide variety of alternatives for connecting to and accessing
our markets for a fee. Our marketplaces may be accessed
through different protocols used for quoting, order entry,
trade reporting and connectivity to various data feeds. We
also provide colocation services to market participants,
whereby we offer firms cabinet space and power to house
their own equipment and servers within our data centers.
Additionally, we offer a number of wireless connectivity
offerings between select data centers using millimeter wave
and microwave technology. Calypso is a leading platform
providing cross-asset, front-to-back trading, treasury, risk and
collateral management solutions. The Calypso solution
provides customers with a single platform designed from the
outset to enable consolidation, innovation and growth.
Market Services
Our Market Services segment includes revenues from equity
derivatives trading, cash equity trading, Nordic fixed income
trading & clearing and U.S. Tape plans data. We operate 18
exchanges across several asset classes, including derivatives,
cash equity, debt, structured products and ETPs. In addition,
in certain countries where we operate exchanges, we also
provide clearing, settlement and central depository services.
In the first quarter of 2026, we completed the transfer of
existing open positions in our Nordic power futures business
to a European exchange. See Note 4, “Divestitures,” for
further discussion. Revenues from this business are reflected
in Other revenues in the Condensed Consolidated Statements
of Income for all periods presented, and in our Corporate
segment for our segment disclosures.
Our transaction-based platforms provide market participants
with the ability to access, process, display and integrate
orders and quotes. The platforms allow the routing and
execution of buy and sell orders as well as the reporting of
transactions, providing fee-based revenues.
2. BASIS OF PRESENTATION AND PRINCIPLES OF
CONSOLIDATION
in accordance with U.S. GAAP and include the accounts of
Nasdaq, its wholly-owned subsidiaries and other entities in
which Nasdaq has a controlling financial interest. When we
do not have a controlling interest in an entity, but exercise
significant influence over the entity’s operating and financial
policies, such investment is accounted for under the equity
method of accounting. We primarily recognize our share of
earnings or losses of an equity method investee based on our
ownership percentage. See “Equity Method Investments,” of
Note 6, “Investments,” for further discussion of our equity
method investments.
statements reflect all adjustments which are, in the opinion of
management, necessary for a fair statement of the results.
These adjustments are of a normal recurring nature. All
significant intercompany accounts and transactions have been
eliminated in consolidation.
As permitted under U.S. GAAP, certain footnotes or other
financial information can be condensed or omitted in the
interim condensed consolidated financial statements. The
information included in this Quarterly Report on Form 10-Q
should be read in conjunction with the consolidated financial
statements and accompanying notes included in Nasdaq’s
Form 10-K. The year-end balance sheet data was derived
from the audited financial statements, but does not include all
disclosures required by U.S. GAAP.
to the current year presentation.
Certain percentages and per share amounts herein may not
sum or recalculate due to rounding.
In preparing our condensed consolidated financial statements,
we make assumptions, judgments and estimates that can have
a significant impact on our revenues, operating income and
net income, as well as on the value of certain assets and
liabilities in our Condensed Consolidated Balance Sheets. At
least quarterly, we evaluate our assumptions, judgments and
estimates, and make changes as deemed necessary.
8
We have evaluated subsequent events through the issuance
•In November 2024, the FASB issued ASU 2024-03,
“Income Statement—Reporting Comprehensive Income—
Expense Disaggregation Disclosures (Subtopic 220-40):
Disaggregation of Income Statement Expenses.” This
guidance will require disclosures about specific types of
expenses included in the expense captions presented on the
face of the income statement. The update is effective for
annual periods beginning after December 15, 2026, and
interim periods beginning after December 15, 2027, with
early adoption permitted. Prospective application is
required and retrospective application is permitted. We are
currently evaluating the impact of adopting this ASU on
our income statement disaggregation disclosures. We do
not believe this update will have a material impact on our
consolidated financial statement disclosures.
•In September 2025, the FASB issued ASU 2025-06,
“Intangibles – Goodwill and Other – Internal-Use Software
(Subtopic 350-40): Targeted Improvements to the
Accounting for Internal-Use Software.” The new guidance
removes references to various stages of a software
development project to align better with current software
development methods, such as agile programming. Under
the new standard, entities will start capitalizing eligible
costs when (1) management has authorized and committed
to funding the software project, and (2) it is probable that
the project will be completed and the software will be used
to perform the function intended. The update is effective
for interim and annual periods beginning after December
15, 2027, with early adoption permitted. The guidance can
be applied on a prospective basis, a modified basis for in-
process projects, or a retrospective basis. We are
evaluating the impact this amended guidance may have on
our consolidated financial statements.
3. REVENUE FROM CONTRACTS WITH
CUSTOMERS
Disaggregation of Revenue
revenue by major product and service and by segment for the
three and six months ended June 30, 2026 and 2025:
Three Months Ended June 30, | |||
2026 | 2025 | ||
(in millions) | |||
Capital Access Platforms: | |||
Data & Listing Services | $ | $ | |
Index | |||
Workflow & Insights | |||
Financial Technology: | |||
Financial Crime Management Technology | |||
Regulatory Technology | |||
Capital Markets Technology | |||
Market Services, net | |||
Other revenues | |||
Revenues less transaction-based expenses | $ | $ | |
Six Months Ended June 30, | |||
2026 | 2025 | ||
(in millions) | |||
Capital Access Platforms | |||
Data & Listing Services | $ | $ | |
Index | |||
Workflow & Insights | |||
Financial Technology | |||
Financial Crime Management Technology | |||
Regulatory Technology | |||
Capital Markets Technology | |||
Market Services, net | |||
Other revenues | |||
Revenues less transaction-based expenses | $ | $ | |
Substantially all revenues from the Capital Access Platforms
and Financial Technology segments were recognized over
time for the three and six months ended June 30, 2026 and
2025. Substantially all revenues from our Market Services
segment were recognized at a point in time for the same
periods.
9
Contract Balances
Substantially all of our revenues are considered to be
revenues from contracts with customers. The related accounts
receivable balances are recorded in the Condensed
Consolidated Balance Sheets as receivables, which are net of
allowance for doubtful accounts of $13 million as of June 30,
2026 and $11 million as of December 31, 2025. Changes to
the allowance for doubtful accounts during the six months
ended June 30, 2026 were not material to our condensed
consolidated financial statements. We do not have obligations
for warranties, returns or refunds to customers.
Deferred revenue represents consideration received that is yet
to be recognized as revenue for unsatisfied performance
obligations and is the only significant contract asset or
liability as of June 30, 2026. See Note 7, “Deferred
Revenue,” for our discussion on deferred revenue balances,
activity, and expected timing of recognition.
We do not provide disclosures about the transaction price
allocated to unsatisfied performance obligations if contract
durations are less than one year. For our initial listings, the
transaction price allocated to remaining performance
obligations is included in deferred revenue, and therefore not
included below. For our Financial Crime Management
Technology, Regulatory Technology, Capital Markets
Technology and Workflow & Insights contracts, the portion
of transaction price allocated to unsatisfied performance
obligations is presented in the table below. The timing in the
table below is based on our best estimates as, for certain
contracts, the recognition is primarily dependent upon the
completion of customization and any significant
modifications made pursuant to existing contracts. To the
extent consideration has been received, unsatisfied
performance obligations would be included in the table below
as well as deferred revenue.
transaction price allocated to performance obligations that are
unsatisfied, for contract durations greater than one year, as of
June 30, 2026:
Financial Crime Management Technology | Regulatory Technology | Capital Markets Technology | Workflow & Insights | Total | |||||
(in millions) | |||||||||
Remainder of 2026 | $ | $ | $ | $ | $ | ||||
2027 | |||||||||
2028 | |||||||||
2029 | |||||||||
2030 | |||||||||
2031+ | |||||||||
Total | $ | $ | $ | $ | $ | ||||
4. Divestitures
In January 2025, we entered into an agreement to transfer
existing open positions in our Nordic power futures business
to a European exchange. In June 2025, this transaction was
completed and partial consideration was received. Migration
of open positions was completed during the first quarter of
2026, resulting in an incremental gain of $88 million, net of
costs to sell. This additional consideration was received in
April 2026. We no longer provide commodities clearing and
trading services as of June 2026, and will continue to wind
down business operations through the remainder of 2026. In
connection with the successful migration of open positions,
Nasdaq may receive additional consideration in 2027, and is
expected to release regulatory capital in the medium term.
In April 2025, Nasdaq completed the sale of our Nasdaq Risk
Modelling for Catastrophes business previously included in
Capital Markets Technology within our Financial
Technology segment.
In October 2025, Nasdaq completed the sale of our Solovis
business which was previously included in Workflow &
Insights within our Capital Access Platforms segment.
The impact of the transactions described above is net of cost
to sell and is included in net gain on divestitures in the
5. GOODWILL AND ACQUIRED INTANGIBLE
ASSETS
Goodwill
business segment during the six months ended June 30, 2026:
(in millions) | |
Capital Access Platforms | |
Balance at December 31, 2025 | $ |
Foreign currency translation adjustments | ( |
Balance at June 30, 2026 | $ |
Financial Technology | |
Balance at December 31, 2025 | $ |
Foreign currency translation adjustments | ( |
Balance at June 30, 2026 | $ |
Market Services | |
Balance at December 31, 2025 | $ |
Foreign currency translation adjustments | ( |
Balance at June 30, 2026 | $ |
Total | |
Balance at December 31, 2025 | $ |
Foreign currency translation adjustments | ( |
Balance at June 30, 2026 | $ |
10
Goodwill represents the excess of purchase price over the
value assigned to the net assets, including identifiable
intangible assets, of a business acquired. Goodwill is
allocated to our reporting units based on the assignment of
the fair values of each reporting unit of the acquired
company. We test goodwill for impairment at the reporting
unit level annually, or in interim periods if certain events
occur indicating that the carrying amount may be impaired,
such as changes in the business climate, poor indicators of
operating performance or the sale or disposition of a
significant portion of a reporting unit.
There was no
intangibles for the three and six months ended June 30, 2026
and 2025; however, events such as prolonged economic
weakness or unexpected significant declines in operating
results of any of our reporting units or businesses may result
in goodwill impairment charges in the future.
Acquired Intangible Assets
intangible assets, both finite- and indefinite-lived:
June 30, 2026 | December 31, 2025 | ||
Finite-Lived Intangible Assets | (in millions) | ||
Gross Amount: | |||
Technology | $ | $ | |
Customer relationships | |||
Trade names and other | |||
Foreign currency translation adjustment | ( | ( | |
Total gross amount | $ | $ | |
Accumulated Amortization: | |||
Technology | $( | $( | |
Customer relationships | ( | ( | |
Trade names and other | ( | ( | |
Foreign currency translation adjustment | |||
Total accumulated amortization | $( | $( | |
Net Amount: | |||
Technology | $ | $ | |
Customer relationships | |||
Trade names and other | |||
Foreign currency translation adjustment | ( | ( | |
Total finite-lived intangible assets | $ | $ | |
Indefinite-Lived Intangible Assets | |||
Exchange and clearing registrations | $ | $ | |
Trade names | |||
Licenses | |||
Foreign currency translation adjustment | ( | ( | |
Total indefinite-lived intangible assets | $ | $ | |
Total intangible assets, net | $ | $ | |
In connection with the wind-down of our Nordic power
futures business during the second quarter of 2026, we
recognized a $20 million impairment primarily related to
customer relationships and licenses. There was no other
material impairment of intangible assets for the three and six
months ended June 30, 2026 and 2025.
acquired finite-lived intangible assets:
Three Months Ended June 30, | |||
2026 | 2025 | ||
(in millions) | |||
Amortization expense | $ | $ | |
Six Months Ended June 30, | |||
2026 | 2025 | ||
(in millions) | |||
Amortization expense | $ | $ | |
expense (excluding the impact of foreign currency translation
adjustments of $46 million as of June 30, 2026) of acquired
finite-lived intangible assets as of June 30, 2026:
(in millions) | |
Remainder of 2026 | $ |
2027 | |
2028 | |
2029 | |
2030 | |
2031+ | |
Total | $ |
6. INVESTMENTS
June 30, 2026 | December 31, 2025 | ||
(in millions) | |||
Financial investments | $ | $ | |
Equity method investments | |||
Equity securities | |||
Financial Investments
Financial investments are comprised of trading securities,
primarily highly rated European government debt securities,
of which $163 million as of June 30, 2026 and $18 million as
of December 31, 2025, are assets primarily utilized to meet
regulatory capital requirements, mainly for our clearing
operations at Nasdaq Clearing. Capital held for regulatory
purposes is invested to optimize returns while staying within
approved risk tolerances. This active portfolio management
can result in assets held as shorter term investments which
meet the criteria to be classified as cash equivalents, and
would then be included in restricted cash and cash
equivalents or longer term investments, which would be
classified as financial investments in the Condensed
Consolidated Balance Sheets.
11
Equity Method Investments
We record our estimated pro-rata share of earnings or losses
each reporting period and record any dividends as a reduction
in the investment balance. As of June 30, 2026 and 2025, our
equity method investments primarily included our 40.0
equity interest in OCC.
The carrying amounts of our equity method investments are
included in other non-current assets in the Condensed
Consolidated Balance Sheets. No
for the three and six months ended June 30, 2026 and 2025.
Net income recognized from our equity interest in the
earnings and losses of these equity method investments was
$21 million and $23 million for the three months ended June
30, 2026 and 2025, respectively, and $47 million and $50
million for the six months ended June 30, 2026 and 2025,
respectively.
Equity Securities
The carrying amounts of our equity securities are included in
other non-current assets in the Condensed Consolidated
Balance Sheets, with gains and losses recognized in other
income (losses) in the Condensed Consolidated Statements of
Income. The majority of our equity securities as of June 30,
2026 do not have a readily determinable fair value and
therefore we have elected the measurement alternative. We
recognized a net gain from the change in the carrying value
of these equity securities of $17
months ended June 30, 2026, primarily related to an upward
adjustment due to the identification of an observable price
change for a similar investment of an investee. No
adjustments were made to the carrying value of these equity
securities for the three and six months ended June 30, 2025.
We mark-to-market equity securities that have a readily
determinable fair value. Gains and losses from the change in
the fair value of these securities were immaterial
months ended June 30, 2026 and the three and six months
ended June 30, 2025. Net loss from the change in the fair
value of these securities was $15 million for the six months
ended June 30, 2026.
As of June 30, 2026 and December 31, 2025, our equity
securities primarily represent various strategic minority
investments made through our corporate venture program.
Purchases and sales of equity securities are included in other
investing activities in the Condensed Consolidated
Statements of Cash Flows.
7. DEFERRED REVENUE
Deferred revenue represents consideration received that is yet
to be recognized as revenue. The changes in our deferred
revenue during the six months ended June 30, 2026 are
reflected in the following table:
Balance at December 31, 2025 | Additions | Revenue Recognized | Foreign Currency Translation | Balance at June 30, 2026 | |
Capital Access Platforms: | (in millions) | ||||
Initial Listings | $ | $ | $( | $( | $ |
Annual Listings | ( | ( | |||
Workflow & Insights | ( | ||||
Other | ( | ( | |||
Financial Technology: | |||||
Financial Crime Management Technology | ( | ||||
Regulatory Technology | ( | ||||
Capital Markets Technology | ( | ( | |||
Total | $ | $ | $( | $( | $ |
In the above table:
•Additions include deferred revenue billed in the current
period, net of recognition.
•Revenue recognized includes revenue recognized during
the current period that was included in the beginning
balance.
•Other, within our Capital Access Platforms segment,
primarily includes deferred revenue from our non-U.S.
will be recognized in the following years:
Fiscal year ended: | 2026 | 2027 | 2028 | 2029 | 2030 | 2031+ | Total |
Capital Access Platforms: | (in millions) | ||||||
Initial Listings | $ | $ | $ | $ | $ | $ | $ |
Annual Listings | |||||||
Workflow & Insights | |||||||
Other | |||||||
Financial Technology: | |||||||
Financial Crime Management Technology | |||||||
Regulatory Technology | |||||||
Capital Markets Technology | |||||||
Total | $ | $ | $ | $ | $ | $ | $ |
12
In the preceding table, 2026 represents the remaining six
months of 2026.
Deferred revenue that will be recognized beyond June 30,
2027 is included in other non-current liabilities in the
Condensed Consolidated Balance Sheets. The timing of
recognition of deferred revenue related to certain contracts
represents our best estimates as the recognition is primarily
dependent upon the completion of customization and any
8. DEBT OBLIGATIONS
amounts of our debt obligations during the six months ended
June 30, 2026:
December 31, 2025 | Additions | Payments, Foreign Currency Translation and Accretion | June 30, 2026 | ||||
Short-term debt: | (in millions) | ||||||
Commercial paper | $ | $ | $( | $ | |||
2026 Notes | ( | ||||||
Total short-term debt | $ | $ | $( | $ | |||
Long-term debt - senior unsecured notes: | |||||||
2028 Notes | |||||||
2029 Notes | ( | ||||||
2030 Notes | ( | ||||||
2031 Notes | |||||||
2032 Notes | ( | ||||||
2033 Notes | ( | ||||||
2034 Notes | |||||||
2040 Notes | |||||||
2050 Notes | |||||||
2052 Notes | |||||||
2053 Notes | |||||||
2063 Notes | |||||||
2026 Revolving Credit Facility | ( | ( | ( | ||||
Total long-term debt | $ | $( | $( | $ | |||
Total debt obligations | $ | $ | $( | $ | |||
Senior Unsecured Notes
Our 2040 Notes were issued at par. All of our other
outstanding senior unsecured notes were issued at a discount.
As a result of the discount, the proceeds received from each
issuance were less than the aggregate principal amount. As of
June 30, 2026, the amounts in the table above reflect the
aggregate principal amount, which is net of discount and debt
issuance costs, which are being accreted and amortized
through interest expense over the life of the applicable notes.
The accretion of the discount and amortization of the debt
issuance costs was $5 million for the six months ended June
30, 2026. Our Euro Notes are adjusted for the impact of
foreign currency translation. Our senior unsecured notes are
general unsecured obligations which rank equally with all of
our existing and future unsubordinated obligations and are
not guaranteed by any of our subsidiaries. The senior
unsecured notes were issued under indentures that, among
other things, limit our ability to consolidate, merge or sell all
or substantially all of our assets, create liens, and enter into
sale and leaseback transactions. The senior unsecured notes
may be redeemed by Nasdaq at any time, subject to a make-
whole amount.
Upon a change of control triggering event (as defined in the
various supplemental indentures governing the applicable
notes), the terms require us to repurchase all or part of each
holder’s notes for cash equal to 101 % of the aggregate
principal amount purchased plus accrued and unpaid interest,
if any.
The Euro Notes pay interest annually. All other notes pay
interest semi-annually. The U.S. dollar senior unsecured
notes coupon rates may vary with Nasdaq’s debt rating, to the
extent Nasdaq is downgraded below investment grade, up to
an upward rate adjustment not to exceed 2 %.
Net Investment Hedge
Our Euro Notes have been designated as a hedge of our net
investment in certain foreign subsidiaries to mitigate the
foreign exchange risk associated with certain investments in
these subsidiaries. Accordingly, the remeasurement of these
notes is recorded in foreign currency translation gains
(losses) within accumulated other comprehensive loss in the
Condensed Consolidated Balance Sheets. For the six months
ended June 30, 2026, the impact of translation decreased the
U.S. dollar value of our Euro Notes by $83 million.
Credit Facilities
2026 Revolving Credit Facility
In June 2026, Nasdaq amended and restated our existing
$1.25 billion five-year revolving credit facility, with a new
maturity date of June 30, 2031, and increased the borrowing
capacity to $1.50 billion. Nasdaq intends to use funds
available under the 2026 Revolving Credit Facility for
general corporate purposes and to provide liquidity to support
our commercial paper program. Nasdaq is permitted to repay
borrowings under our 2026 Revolving Credit Facility at any
time in whole or in part, without penalty.
As of June 30, 2026, no amounts were outstanding on the
2026 Revolving Credit Facility. The $(4 ) million balance
represents unamortized debt issuance costs which are being
amortized through interest expense over the life of the credit
facility.
13
Borrowings under the revolving credit facility and swingline
borrowings bear interest on the principal amount outstanding
at a variable interest rate based on either the SOFR (or a
successor rate to SOFR), the base rate (as defined in the 2026
Revolving Credit Facility agreement), or other applicable rate
with respect to non-dollar borrowings, plus an applicable
margin that varies with our debt rating. We are charged
commitment fees of 0.080 % to 0.150 %, depending on our
credit rating, on undrawn amounts. These commitment fees
are included in interest expense and were not material for the
three and six months ended June 30, 2026 and 2025.
The 2026 Revolving Credit Facility contains financial and
operating covenants. Financial covenants include a maximum
leverage ratio. Operating covenants include, among other
things, limitations on Nasdaq’s ability to incur additional
indebtedness, grant liens on assets, dispose of assets and
make certain restricted payments. The facility also contains
customary affirmative covenants, including access to
financial statements, notice of defaults and certain other
material events, maintenance of properties and insurance, and
customary events of default, including cross-defaults to our
material indebtedness.
The 2026 Revolving Credit Facility includes an option for
Nasdaq to increase the available aggregate amount by up to
$1.0 billion, subject to the consent of the lenders funding the
increase and certain other conditions.
We maintain a U.S. dollar commercial paper program, which
we may utilize at various times to support liquidity needs.
This program is supported by our 2026 Revolving Credit
Facility. The effective interest rate of commercial paper
issuances fluctuates as short-term interest rates and demand
fluctuate. These fluctuations may impact our interest
expense. As of June 30, 2026, we had $269 million
outstanding under our commercial paper program and no
outstanding balance as of December 31, 2025.
Other Credit Facilities
Certain of our European subsidiaries have several other credit
facilities, which are available in multiple currencies,
primarily to support our Nasdaq Clearing operations in
Europe, as well as to provide a cash pool credit line. These
credit facilities, in aggregate, totaled $198 million as of June
30, 2026 and $208 million as of December 31, 2025 in
available liquidity, none
these facilities each have a one-year term, and renew
automatically. The amounts borrowed under these various
credit facilities bear interest on the principal amount
outstanding at a variable interest rate based on a base rate (as
defined in the applicable credit agreement), plus an
applicable margin. We are charged commitment fees (as
defined in the applicable credit agreement), whether or not
amounts have been borrowed. These commitment fees are
included in interest expense and were not material for the
three and six months ended June 30, 2026 and 2025.
These facilities include customary affirmative and negative
operating covenants and events of default.
Debt Covenants
As of June 30, 2026, we were in compliance with the
covenants of all of our debt obligations.
9. RETIREMENT PLANS
Defined Contribution Savings Plan
We sponsor a 401(k) plan, which is a voluntary defined
contribution savings plan, for U.S. employees. Employees are
immediately eligible to make contributions to the plan and
are also eligible for an employer contribution match at an
amount equal to 100.0 % of the first 6.0 % of eligible
employee contributions. The following table presents the
savings plan expense for the three and six months ended June
30, 2026 and 2025, which is included in compensation and
benefits expense in the Condensed Consolidated Statements
of Income:
Three Months Ended June 30, | Six Months Ended June 30, | ||||||
2026 | 2025 | 2026 | 2025 | ||||
(in millions) | |||||||
Savings Plan expense | $ | $ | $ | $ | |||
Pension, SERP and Other Post-Retirement Benefit Plans
We maintain nonqualified SERPs for certain senior
executives and other post-retirement benefit plans for eligible
employees in the U.S. Most employees outside the U.S. are
covered by local retirement plans or by applicable social
laws. Benefits under social laws are generally expensed in the
periods in which the costs are incurred.
and benefits expense in the Condensed Consolidated
Statements of Income:
Three Months Ended June 30, | Six Months Ended June 30, | ||||||
2026 | 2025 | 2026 | 2025 | ||||
(in millions) | |||||||
Retirement Plans expense | $ | $ | $ | $ | |||
Nonqualified Deferred Compensation Plan
We sponsor a nonqualified deferred compensation plan, the
Nasdaq, Inc. Deferred Compensation Plan. This plan
provides certain eligible employees with the opportunity to
defer a portion of their annual salary and bonus up to certain
approval limits. The deferred plan assets and corresponding
liabilities are measured at fair value and included within
other non-current assets and liabilities in the Condensed
Consolidated Balance Sheets. All deferrals and associated
earnings are our general unsecured obligations and were
immaterial for the three and six months ended June 30, 2026
14
10. SHARE-BASED COMPENSATION
We have a share-based compensation program for employees
and non-employee directors. Share-based awards granted
under this program include restricted stock (consisting of
restricted stock units), PSUs and stock options. For
accounting purposes, we consider PSUs to be a form of
restricted stock. Annual employee awards are generally
granted on or about April 1st of each year.
Summary of Share-Based Compensation Expense
compensation expense resulting from equity awards and the
ended June 30, 2026 and 2025, which is primarily included in
compensation and benefits expense in the Condensed
Consolidated Statements of Income:
Three Months Ended June 30, | Six Months Ended June 30, | ||||||
2026 | 2025 | 2026 | 2025 | ||||
(in millions) | |||||||
Share-based compensation expense before income taxes | $ | $ | $ | $ | |||
Common Shares Available Under Our Equity Plan
As of June 30, 2026, we had approximately 20.1 million
shares of common stock authorized for future issuance under
our Equity Plan.
Restricted Stock
We grant restricted stock to most employees. The grant date
fair value of restricted stock units awarded are based on the
closing stock price at the date of grant less the present value
of future cash dividends. Restricted stock unit awards granted
to employees below the manager level generally vest 33 % on
the first anniversary of the grant date, 33 % on the second
anniversary of the grant date, and the remainder on the third
anniversary of the grant date. Restricted stock unit awards
granted to employees at or above the manager level generally
vest 33 % on the second anniversary of the grant date, 33 % on
the third anniversary of the grant date, and the remainder on
the fourth anniversary of the grant date.
for the six months ended June 30, 2026:
Restricted Stock | |||
Number of Awards | Weighted-Average Grant Date Fair Value | ||
Unvested at December 31, 2025 | $ | ||
Granted | |||
Vested | ( | ||
Forfeited | ( | ||
Unvested at June 30, 2026 | $ | ||
As of June 30, 2026, $189 million of total unrecognized
compensation cost related to restricted stock is expected to be
recognized over a weighted-average period of 2.6 years.
PSUs
We grant three-year PSUs to certain eligible employees.
PSUs are based on performance measures that impact the
amount of shares that each PSU eligible individual receives,
subject to the satisfaction of applicable market performance
conditions, with a three-year cumulative performance period
that vest at the end of the performance period and which
settle in shares of our common stock. Compensation cost is
recognized over the three-year performance period, taking
into account an estimated forfeiture rate, regardless of
whether the market condition is satisfied, provided that the
requisite service period has been completed. Performance
will be determined by comparing Nasdaq’s TSR to two peer
groups, each weighted 50.0 %. The first peer group consists
of the S&P 500 GICS 4020 Index, which is a blend of
exchanges, as well as data, financial technology and banking
companies, and the second peer group consists of all
companies in the S&P 500. Nasdaq’s relative performance
ranking against each of these groups will determine the final
number of shares delivered to each individual under the
program. The award issuance under this program will be
between 0.0 % and 200.0 % of the number of PSUs granted
and will be determined by Nasdaq’s overall performance
against both peer groups. However, if Nasdaq’s TSR is
negative for the three-year performance period, regardless of
TSR ranking, the award issuance will not exceed 100.0 % of
the number of PSUs granted. We estimate the fair value of
PSUs granted under the three-year PSU program using the
Monte Carlo simulation model, as these awards contain a
market condition.
Grants of PSUs that were issued in 2023 with a three-year
performance period exceeded the applicable performance
metrics. As a result, an additional 121,475 shares above the
original target amount were granted in the first quarter of
2026 and were fully vested upon issuance.
15
In 2024, we also granted PSUs with a two-year performance
period to certain eligible executives at the senior vice
president level and above. These PSUs were based on
performance measures relating to the implementation of
certain integration actions in connection with the Adenza
acquisition. Achievement of the targets impacted the amount
of shares that each PSU eligible individual was entitled to
receive. The PSUs had a two-year performance period and
will vest one year after the end of the performance period,
and settled in shares of our common stock. The grantees of
the PSUs under this program were eligible to receive between
performance period for these PSUs has ended and exceeded
the applicable performance metrics, and resulted in the
issuance of an additional 87,460 shares for overachievement.
These shares were granted in the first quarter of 2026 and
will vest in January 2027.
determine the weighted-average fair values of the outstanding
PSU awards granted under the three-year
during the six months ended June 30, 2026 and 2025:
Year of grant date | 2026 | 2025 | |
Weighted-average risk-free interest rate | |||
Expected volatility | |||
Weighted-average grant date share price | $ | $ | |
Weighted-average fair value at grant date | $ | $ |
months ended June 30, 2026:
PSUs | ||||
Number of Awards | Weighted- Average Grant Date Fair Value | |||
Unvested at December 31, 2025 | $ | |||
Granted | ||||
Vested | ( | |||
Forfeited | ( | |||
Unvested at June 30, 2026 | $ | |||
As of June 30, 2026, the total unrecognized compensation
cost related to the outstanding PSU awards is $124 million
and is expected to be recognized over a weighted-average
period of 1.4 years.
Stock Options
There were no stock option awards granted for the six
months ended June 30, 2026. We received net cash proceeds
of $3 million from the exercise of 113,611 stock options for
the three months ended June 30, 2026. We received net cash
proceeds of $18 million from the exercise of 806,451 stock
options for the six months ended June 30, 2026.
There were no stock option awards granted and no stock
options exercised for the three and six months ended June 30,
2025.
is as follows:
Number of Stock Options | Weighted- Average Exercise Price | Weighted- Average Remaining Contractual Term (in years) | Aggregate Intrinsic Value (in millions) | |
Outstanding at December 31, 2025 | $ | |||
Exercised | ( | |||
Outstanding at June 30, 2026 | $ | $ |
As of June 30, 2026, the aggregate pre-tax intrinsic value
represents the difference between our closing stock price on
June 30, 2026 of $78.82 and the exercise price, times the
number of shares that would have been received by the
option holder had the option holder exercised the stock
options on that date. This amount can change based on the
fair market value of our common stock. As of June 30, 2026,
no outstanding stock options were exercisable.
ESPP
We have an ESPP under which approximately 9.6 million
shares of our common stock were available for future
issuance as of June 30, 2026. Under our ESPP, employees
may purchase shares having a value not exceeding 10.0 % of
their annual compensation, subject to applicable annual
Internal Revenue Service limitations. We record
compensation expense related to the 15.0 % discount that is
11. NASDAQ STOCKHOLDERS’ EQUITY
Common Stock
As of June 30, 2026, 900,000,000 shares of our common
stock were authorized, 587,518,685 shares were issued and
2025, 900,000,000 shares of our common stock were
authorized, 594,620,320 shares were issued and 569,894,024
shares were outstanding. The holders of common stock are
entitled to one vote per share, except that our certificate of
incorporation limits the ability of any shareholder to vote in
excess of 5.0 % of the then-outstanding shares of Nasdaq
common stock.
16
Common Stock in Treasury, at Cost
We account for the purchase of treasury stock under the cost
method with the shares of stock repurchased reflected as a
reduction to Nasdaq stockholders’ equity and included in
common stock in treasury, at cost in the Condensed
Consolidated Balance Sheets. Shares repurchased under our
share repurchase program are currently retired and canceled
and are therefore not included in the common stock in
treasury balance. If treasury shares are reissued, they are
recorded at the average cost of the treasury shares acquired.
We held 25,528,300 shares of common stock in treasury as of
June 30, 2026 and 24,726,296 shares as of December 31,
2025, most of which are related to shares of our common
stock withheld for the settlement of employee tax
withholding obligations arising from the vesting of restricted
stock and PSUs.
Share Repurchase Program
In February 2026, our board of directors authorized an
increase to our share repurchase program, bringing the
aggregate authorized amount to $3.0 billion. As of June 30,
2026, the remaining aggregate authorized amount under the
existing share repurchase program was $2.5 billion.
As part of this program, repurchases may be made from time
to time at prevailing market prices in open market purchases,
privately-negotiated transactions, block purchase techniques,
an accelerated share repurchase program or otherwise, as
determined by our management. The repurchases are
primarily funded from existing cash balances. The share
repurchase program may be suspended, modified or
discontinued at any time, and has no defined expiration date.
reported based on settlement date, for the six months ended
June 30, 2026:
Six Months Ended June 30, 2026 | |
Number of shares of common stock repurchased | |
Average price paid per share | $ |
Total purchase price (in millions) | $ |
The table above excludes an aggregate of 802,004 shares
withheld to satisfy tax obligations of the grantee upon the
vesting of restricted stock and PSUs.
In January 2026, we entered into a $300 million variable
notional ASR agreement and, upon final settlement in
February 2026, we received a total of 3,142,730 shares plus
$15 million cash reflecting the difference between the
prepayment and final notional amount. These shares are
included in the number of shares of common stock
repurchased in the table above.
In July 2026, we entered into a variable notional ASR
agreement, for which we paid $250 million to a third-party
financial institution in exchange for an initial delivery of
shares of common stock. The final notional amount is subject
to a minimum and maximum and will depend on the price of
our shares of common stock during the term of the ASR. The
final settlement of the ASR agreement is expected to be
completed in the third quarter of 2026.
Under ASR agreements, we make payments to our
counterparties and receive an initial delivery of shares of
common stock. The final number of shares to be repurchased
is based on the volume-weighted average price of Nasdaq's
common stock during the term of the ASR agreement, less a
discount and subject to adjustments pursuant to the terms of
the ASR agreement. At settlement, our counterparty may be
required to deliver additional shares of common stock to us
or, under certain circumstances, we may be required to
deliver shares of our common stock or may elect to make a
cash payment to our counterparty. Receiving our shares of
common stock, during initial delivery and the final receipt of
shares upon settlement of the ASR agreements, results in an
immediate reduction of the outstanding shares used to
calculate the weighted-average common shares outstanding
for basic and diluted earnings per share.
Preferred Stock
Our certificate of incorporation authorizes the issuance of
share, issuable from time to time in one or more series. As of
June 30, 2026 and December 31, 2025, no
stock were issued or outstanding.
Cash Dividends on Common Stock
directors declared and paid the following cash dividends:
Declaration Date | Dividend Per Common Share | Record Date | Total Amount Paid | Payment Date | ||||
(in millions) | ||||||||
January 28, 2026 | $ | March 16, 2026 | $ | March 30, 2026 | ||||
April 23, 2026 | June 12, 2026 | June 26, 2026 | ||||||
$ | ||||||||
The total amount paid of $327 million was recorded in
retained earnings in the Condensed Consolidated Balance
Sheets at June 30, 2026.
In July 2026, the board of directors approved a regular
quarterly cash dividend of $0.31 per share on our outstanding
common stock. The dividend is payable on September 25,
2026 to shareholders of record at the close of business on
September 11, 2026. The estimated aggregate payment of this
dividend is $174 million. Future declarations of quarterly
dividends and the establishment of future record and payment
dates are subject to approval by the board of directors.
17
The board of directors maintains a dividend policy with the
intention to provide shareholders with regular and increasing
dividends as earnings and cash flows increase.
12. EARNINGS PER SHARE
diluted earnings per share:
Three Months Ended June 30, | |||
2026 | 2025 | ||
Numerator: | (in millions, except share and per share amounts) | ||
Net income attributable to common shareholders | $ | $ | |
Denominator: | |||
Weighted-average common shares outstanding for basic earnings per share | |||
Weighted-average effect of dilutive securities - Employee equity awards | |||
Weighted-average common shares outstanding for diluted earnings per share | |||
Basic and diluted earnings per share: | |||
Basic earnings per share | $ | $ | |
Diluted earnings per share | $ | $ | |
Six Months Ended June 30, | |||
2026 | 2025 | ||
Numerator: | (in millions, except share and per share amounts) | ||
Net income attributable to common shareholders | $ | $ | |
Denominator: | |||
Weighted-average common shares outstanding for basic earnings per share | |||
Weighted-average effect of dilutive securities - Employee equity awards | |||
Weighted-average common shares outstanding for diluted earnings per share | |||
Basic and diluted earnings per share: | |||
Basic earnings per share | $ | $ | |
Diluted earnings per share | $ | $ | |
In the tables above, employee equity awards from our PSU
program, which are considered contingently issuable, are
included in the computation of dilutive earnings per share on
a weighted average basis when management determines that
the applicable performance criteria would have been met if
the performance period ended as of the date of the relevant
computation.
Securities that were not
diluted earnings per share because their effect was
antidilutive were immaterial for the three and six months
ended June 30, 2026 and 2025.
13. FAIR VALUE OF FINANCIAL INSTRUMENTS
assets that were measured at fair value on a recurring basis as
of June 30, 2026 and December 31, 2025.
June 30, 2026 | |||||||
Total | Level 1 | Level 2 | Level 3 | ||||
(in millions) | |||||||
European government debt securities | $ | $ | $ | $ | |||
Total financial investments | $ | $ | $ | $ | |||
Equity securities | |||||||
Total assets at fair value | $ | $ | $ | $ | |||
December 31, 2025 | |||||||
Total | Level 1 | Level 2 | Level 3 | ||||
(in millions) | |||||||
European government debt securities | $ | $ | $ | $ | |||
Total financial investments | $ | $ | $ | $ | |||
Equity securities | |||||||
Total assets at fair value | $ | $ | $ | $ | |||
Derivative Instruments
We utilize foreign exchange forward contracts primarily to
reduce the volatility of earnings and cash flows associated
with changes in foreign exchange rates. We have utilized
these foreign exchange forward contracts as net investment
hedges of certain foreign subsidiaries, with changes in fair
value recorded in accumulated other comprehensive income
in the Condensed Consolidated Balance Sheets, and as cash
flow hedges of certain foreign currency-denominated
revenues and expenses, with fair value changes initially
recorded in accumulated other comprehensive income. For
our cash flow hedges, when the forecasted transaction affects
earnings, or in the event the underlying forecasted transaction
does not occur, or it becomes probable that it will not occur,
we reclassify the related gain or loss to revenue or operating
expenses, as applicable.
We have also utilized foreign exchange forward contracts as
economic hedges of foreign currency-denominated assets and
liabilities that are not designated as hedging instruments. The
fair value changes of these contracts are recorded in general,
administrative and other expenses in the Condensed
Consolidated Statements of Income, together with the re-
measurement gain or loss from the hedged balance sheet
position.
18
All derivative contracts are measured at fair value using
Level 2 inputs based on observable foreign currency
exchange rates and interest rates, and recorded under other
current and other non-current assets and other current and
other non-current liabilities in the Condensed Consolidated
Balance Sheets. As of June 30, 2026 and December 31, 2025,
the fair value of these contracts was not material and
therefore not included in the tables above. We do not use
derivative instruments for trading or speculative purposes.
Financial Instruments Not Measured at Fair Value on a
Recurring Basis
Some of our financial instruments are not measured at fair
value on a recurring basis but are recorded at amounts that
approximate fair value due to their liquid or short-term
nature. Such financial assets and financial liabilities include:
cash and cash equivalents, restricted cash and cash
equivalents, receivables, net, certain other current assets,
accounts payable and accrued expenses, Section 31 fees
payable to SEC, accrued personnel costs and certain other
current liabilities.
We have certain investments, primarily our investment in
OCC, which are accounted for under the equity method of
accounting. We have elected the measurement alternative for
all of our equity securities that do not have a readily
determinable fair value, which primarily represent various
strategic investments made through our corporate venture
program. See “Equity Method Investments,” and “Equity
Securities,” of Note 6, “Investments,” for further discussion.
We also consider our debt obligations to be financial
instruments. As of June 30, 2026, the majority of our
outstanding debt obligations were fixed-rate obligations. We
are exposed to changes in interest rates on amounts
outstanding from the sale of commercial paper under our
commercial paper program. We may also be exposed to
changes in interest rates as a result of borrowings under our
2026 Revolving Credit Facility, as the interest rates on this
facility have a variable rate depending on the maturity of the
borrowing and the implied underlying reference rate. The fair
value of our remaining debt obligations utilizing prevailing
market rates for our fixed rate debt was $8.2 billion as of
June 30, 2026 and $8.6 billion as of December 31, 2025. The
discounted cash flow analyses are based on borrowing rates
currently available to us for debt with similar terms and
maturities. Our commercial paper and our fixed rate and
floating rate debt are categorized as Level 2 in the fair value
hierarchy.
For further discussion of our debt obligations, see Note 8,
“Debt Obligations.”
Non-Financial Assets Measured at Fair Value on a Non-
Recurring Basis
Our non-financial assets, which include goodwill, intangible
assets, and other long-lived assets, are not required to be
carried at fair value on a recurring basis. Fair value measures
of non-financial assets are primarily used in the impairment
analysis of these assets. Any resulting asset impairment
would require that the non-financial asset be recorded at its
fair value. Nasdaq uses Level 3 inputs to measure the fair
value of the above assets on a non-recurring basis. As of June
30, 2026 and December 31, 2025, there were no
financial assets measured at fair value on a non-recurring
basis.
14. CLEARING OPERATIONS
Nasdaq Clearing
Nasdaq Clearing is authorized and supervised under EMIR as
a multi-asset clearinghouse by the SFSA. Such authorization
is effective for all member states of the European Union and
certain other non-member states that are part of the European
Economic Area, including Norway. The clearinghouse acts as
the CCP for exchange and OTC trades in equity derivatives
and fixed income derivatives. Historically, we also acted as
the CCP for power derivatives and emissions allowance
derivatives. All open interest relating to these products was
transferred to another exchange in March 2026. See Note 4,
“Divestitures,” for further discussion of this transaction.
Through our clearing operations in the financial markets,
which includes the resale and repurchase market, Nasdaq
Clearing is the legal counterparty for, and guarantees the
fulfillment of, each contract cleared. These contracts are not
used by Nasdaq Clearing for the purpose of trading on its
own behalf. As the legal counterparty of each transaction,
Nasdaq Clearing bears the counterparty risk between the
purchaser and seller in the contract. In its guarantor role,
Nasdaq Clearing has precisely equal and offsetting claims to
and from clearing members on opposite sides of each
contract, standing as the CCP on every contract cleared. In
accordance with the rules and regulations of Nasdaq
Clearing, default fund and margin collateral requirements are
calculated for each clearing member’s positions in accounts
with the CCP. See “Default Fund Contributions and Margin
Deposits” below for further discussion of Nasdaq Clearing’s
default fund and margin requirements.
Nasdaq Clearing maintains a member sponsored default fund
related to financial markets. Under this structure, Nasdaq
Clearing and its clearing members must contribute to the total
regulatory capital related to the clearing operations of Nasdaq
Clearing. See “Default Fund Contributions” below for further
discussion of Nasdaq Clearing’s default fund. A power of
assessment and a liability waterfall have also been
implemented to further align risk between Nasdaq Clearing
and its clearing members. See “Power of Assessment” and
“Liability Waterfall” below for further discussion.
19
Default Fund Contributions and Margin Deposits
contributions and margin deposits were as follows:
June 30, 2026 | |||||
Cash Contributions | Non-Cash Contributions | Total Contributions | |||
(in millions) | |||||
Default fund contributions | $ | $ | $ | ||
Margin deposits | |||||
Total | $ | $ | $ | ||
Our clearinghouse holds material amounts of clearing
member cash deposits which are held or invested primarily to
provide security of capital while minimizing credit, market
and liquidity risks. While we seek to achieve a reasonable
rate of return, we are primarily concerned with preservation
of capital and managing the risks associated with these
deposits.
Clearing member cash contributions are maintained in
demand deposits held at central banks and large, highly rated
financial institutions or secured through direct investments,
primarily central bank certificates and highly rated European
government debt securities with original maturities primarily
one year or less, reverse repurchase agreements and
multilateral development bank debt securities. Investments in
reverse repurchase agreements range in maturity from 1 to 8
days and are secured with highly rated government securities
and multilateral development banks. The carrying value of
these securities approximates their fair value due to the short-
term nature of the instruments and reverse repurchase
agreements.
$2,323 million as of June 30, 2026 and $5,842 million as of
December 31, 2025, in accordance with its investment policy
as follows:
June 30, 2026 | December 31, 2025 | ||
(in millions) | |||
Demand deposits | $ | $ | |
Central bank certificates | |||
Restricted cash and cash equivalents | $ | $ | |
European government debt securities | |||
Reverse repurchase agreements | |||
Multilateral development bank debt securities | |||
Investments | $ | $ | |
Total | $ | $ | |
In the table above, the decrease from December 31, 2025 to
June 30, 2026 is primarily due to the sale of our Nordic
power futures business and includes an unfavorable impact
from currency translation adjustments of $59 million for
restricted cash and cash equivalents and $113 million for
investments.
For the six months ended June 30, 2026 and 2025,
investments related to default funds and margin deposits, net
includes purchases of investment securities of $71,751
million and $45,490 million, respectively, and proceeds from
sales and redemptions of investment securities of $72,291
million and $45,115 million, respectively.
In the investment activity related to default fund and margin
contributions, we are exposed to counterparty risk related to
reverse repurchase agreement transactions, which reflect the
risk that the counterparty might become insolvent and, thus,
fail to meet its obligations to Nasdaq Clearing. We mitigate
this risk by only engaging in transactions with high credit
quality reverse repurchase agreement counterparties and by
limiting the acceptable collateral under the reverse
repurchase agreement to high quality issuers, primarily
government securities and other securities explicitly
guaranteed by a government. The value of the underlying
security is monitored during the lifetime of the contract, and
in the event the market value of the underlying security falls
below the reverse repurchase amount, our clearinghouse may
require additional collateral or a reset of the contract.
Default Fund Contributions
Required contributions to the default fund are proportional to
the exposures of each clearing member. Clearing members’
eligible contributions may include cash and non-cash
contributions. Cash contributions received are maintained in
demand deposits held at central banks and large, highly rated
financial institutions or invested by Nasdaq Clearing, in
accordance with its investment policy, either in central bank
certificates, highly rated government debt securities, reverse
repurchase agreements with highly rated government debt
securities as collateral, or multilateral development bank debt
securities. Nasdaq Clearing maintains and manages all cash
deposits related to margin collateral. All risks and rewards of
collateral ownership, including interest, belong to Nasdaq
Clearing. Clearing members’ cash contributions are included
in default funds and margin deposits in the Condensed
Consolidated Balance Sheets as both a current asset and a
current liability. Non-cash contributions include highly rated
government debt securities that must meet specific criteria
approved by Nasdaq Clearing. Non-cash contributions are
pledged assets that are not recorded in the Condensed
Consolidated Balance Sheets as Nasdaq Clearing does not
take legal ownership of these assets and the risks and rewards
remain with the clearing members. These balances may
fluctuate over time due to changes in the amount of deposits
required and whether members choose to provide cash or
non-cash contributions.
20
In addition to clearing members’ required contributions to the
liability waterfall, Nasdaq Clearing is also required to
contribute capital to the liability waterfall and overall
regulatory capital as specified under its clearinghouse rules.
As of June 30, 2026, Nasdaq Clearing committed capital
totaling $131 million to the liability waterfall and overall
regulatory capital, in the form of government debt securities,
which are recorded as financial investments in the Condensed
Consolidated Balance Sheets. The combined regulatory
capital of the clearing members and Nasdaq Clearing is
intended to secure the obligations of a clearing member
exceeding such member’s own margin and default fund
deposits and may be used to cover losses sustained by a
clearing member in the event of a default.
Margin Deposits
Nasdaq Clearing requires all clearing members to provide
collateral, which may consist of cash and non-cash
contributions, to guarantee performance on the clearing
members’ open positions, or initial margin. In addition,
clearing members must also provide collateral to cover the
daily margin call if needed. See “Default Fund
Contributions” above for further discussion of cash and non-
cash contributions.
Similar to default fund contributions, Nasdaq Clearing
maintains and manages all cash deposits related to margin
collateral. All risks and rewards of collateral ownership,
including interest, belong to Nasdaq Clearing and are
recorded in revenues. These cash deposits are recorded in
default funds and margin deposits in the Condensed
Consolidated Balance Sheets as both a current asset and a
current liability. Pledged margin collateral is not recorded in
the Consolidated Balance Sheets as all risks and rewards of
collateral ownership, including interest, belong to the
counterparty.
Nasdaq Clearing marks to market all outstanding contracts
and requires payment from clearing members whose
positions have lost value. The mark-to-market process
performed multiple times on a daily basis helps to identify
any clearing members that may not be able to satisfy their
financial obligations in a timely manner allowing Nasdaq
Clearing the ability to mitigate the risk of a clearing member
defaulting due to exceptionally large losses. In the event of a
default, Nasdaq Clearing can access the defaulting member’s
margin and default fund deposits to cover the defaulting
member’s losses.
Regulatory Capital and Risk Management Calculations
Nasdaq Clearing manages risk through a comprehensive
counterparty risk management framework, which comprises
policies, procedures, standards and financial resources. The
level of regulatory capital is determined in accordance with
Nasdaq Clearing’s regulatory capital and default fund policy,
as approved by the SFSA. Regulatory capital calculations are
continuously updated through a proprietary capital-at-risk
calculation model that establishes the appropriate level of
capital.
As mentioned above, Nasdaq Clearing is the legal
counterparty for each contract cleared and thereby guarantees
the fulfillment of each contract. Nasdaq Clearing accounts for
this guarantee as a performance guarantee. We determine the
fair value of the performance guarantee by considering daily
settlement of contracts and other margining and default fund
requirements, the risk management program, historical
evidence of default payments, and the estimated probability
of potential default payouts. The calculation is determined
using proprietary risk management software that simulates
gains and losses based on historical market prices, extreme
but plausible market scenarios, volatility and other factors
present at that point in time for those particular unsettled
contracts. Based on this analysis the estimated liability was
nominal and no liability was recorded as of June 30, 2026.
Power of Assessment
To further strengthen the contingent financial resources of the
clearinghouse, Nasdaq Clearing has power of assessment that
provides the ability to collect additional funds from its
clearing members to cover a defaulting member’s remaining
obligations up to the limits established under the terms of the
clearinghouse rules. The power of assessment corresponds to
financial default fund.
Liability Waterfall
The liability waterfall is the priority order in which the
capital resources would be utilized in the event of a default
where the defaulting clearing member’s collateral and default
fund contribution would not be sufficient to cover the cost to
settle its portfolio. If a default occurs and the defaulting
clearing member’s collateral, including cash deposits and
pledged assets, is depleted, then capital is utilized in the
following amount and order:
•junior capital contributed by Nasdaq Clearing, which
totaled $20 million as of June 30, 2026;
•a loss-sharing pool related only to the financial market that
is contributed to by clearing members and only applies if
the defaulting member’s portfolio includes interest rate
swap products;
•the default fund which includes capital contributions of the
clearing members on a pro-rata basis; and
•senior capital contributed by Nasdaq Clearing, calculated
in accordance with clearinghouse rules, which totaled $24
million as of June 30, 2026.
If additional funds are needed after utilization of the liability
waterfall, or if part of the waterfall has been utilized and
needs to be replenished, then Nasdaq Clearing will utilize its
power of assessment and additional capital contributions will
be required by non-defaulting members up to the limits
established under the terms of the clearinghouse rules.
21
In addition to the capital held to withstand counterparty
defaults described above, Nasdaq Clearing also has
committed capital of $87 million to ensure that it can handle
an orderly wind-down of its operation, and that it is
adequately protected against investment, operational, legal,
and business risks.
Market Value of Derivative Contracts Outstanding
contracts outstanding prior to netting:
June 30, 2026 | |
(in millions) | |
Fixed-income swaps and forwards | $ |
Stock options and forwards | |
Index options and forwards | |
Total | $ |
In the table above:
•We determined the fair value of our option contracts using
standard valuation models that were based on market-based
observable inputs including implied volatility, interest rates
and the spot price of the underlying instrument.
•We determined the fair value of our forward contracts
using standard valuation models that were based on
market-based observable inputs including benchmark rates
and the spot price of the underlying instrument.
Derivative Contracts Cleared
contracts cleared through Nasdaq Clearing for the six months
ended June 30, 2026 and 2025:
Six Months Ended June 30, | |||
2026 | 2025 | ||
Commodity futures and forwards | |||
Fixed-income swaps, futures and forwards | |||
Stock options, futures and forwards | |||
Index options, futures and forwards | |||
Total | |||
In the table above, the total volume in cleared power related
to commodity contracts was 117 Terawatt hours (TWh) and
respectively.
Resale and Repurchase Agreements Contracts
Outstanding and Cleared
The outstanding contract value of resale and repurchase
agreements was $1.2 billion and $800 million as of June 30,
2026 and 2025, respectively. The total number of resale and
repurchase agreements contracts cleared was 1,271,156 and
respectively.
15. LEASES
We have operating leases, which are primarily real estate
leases, predominantly for our U.S. and European
headquarters, data centers and for general office space. The
following table provides supplemental balance sheet
information related to Nasdaq’s operating leases:
Balance Sheet Classification | June 30, 2026 | December 31, 2025 | ||||
Assets: | (in millions) | |||||
Operating lease assets | Operating lease assets | $ | $ | |||
Liabilities: | ||||||
Current lease liabilities | Other current liabilities | $ | $ | |||
Non- current lease liabilities | Operating lease liabilities | |||||
Total lease liabilities | $ | $ | ||||
Three Months Ended June 30, | Six Months Ended June 30, | ||||||
2026 | 2025 | 2026 | 2025 | ||||
(in millions) | |||||||
Operating lease cost | $ | $ | $ | $ | |||
Variable lease cost | |||||||
Sublease income | ( | ( | ( | ( | |||
Total lease cost | $ | $ | $ | $ | |||
In the table above, operating lease costs include short-term
lease costs, which were immaterial.
for the following years and total of the remaining years to the
operating lease liabilities recorded in the Condensed
Consolidated Balance Sheets.
June 30, 2026 | ||
(in millions) | ||
Remainder of 2026 | $ | |
2027 | ||
2028 | ||
2029 | ||
2030 | ||
2031+ | ||
Total lease payments | $ | |
Less: interest | ( | |
Present value of lease liabilities | $ |
In the table above, interest is calculated using an incremental
borrowing rate for each lease. Present value of lease
liabilities includes the current portion of $74 million.
22
Lease payments in the table above exclude $32 million of
legally binding minimum lease payments for leases signed
but not yet commenced primarily related to data center
expansion.
lease term and discount rate:
June 30, 2026 | ||
Weighted-average remaining lease term (in years) | ||
Weighted-average discount rate |
information related to Nasdaq’s operating leases:
Six Months Ended June 30, | |||
2026 | 2025 | ||
(in millions) | |||
Cash paid for amounts included in the measurement of operating lease liabilities | $ | $ | |
Lease assets obtained in exchange for operating lease liabilities | $ | $ | |
Lease assets obtained in exchange for operating lease
liabilities primarily relate to expansion and renewals of data
center leases for the six months ended June 30, 2026 and
2025. For the six months ended June 30, 2025, it also related
16. INCOME TAXES
Income Tax Provision
effective tax rate:
Three Months Ended June 30, | |||
2026 | 2025 | ||
(in millions) | |||
Income tax provision | $ | $ | |
Effective tax rate | |||
Six Months Ended June 30, | |||
2026 | 2025 | ||
(in millions) | |||
Income tax provision | $ | $ | |
Effective tax rate | |||
The higher effective tax rate for the three and six months
ended June 30, 2026, as compared to the prior year periods,
was primarily due to a tax benefit related to payments made
to former Adenza employees in June 2025. The higher
effective tax rate for the six months ended June 30, 2026 also
includes the impact of a favorable audit settlement in the
prior period.
The effective tax rate may vary from period to period
depending on, among other factors, the geographic and
business mix of earnings and losses. These and other factors,
including history of pre-tax earnings and losses, are taken
into account in assessing the ability to realize deferred tax
assets.
Tax Audits
Nasdaq and its eligible subsidiaries file a consolidated U.S.
federal income tax return, applicable state and local income
tax returns and non-U.S. income tax returns. We are subject
to examination by federal, state and local, and foreign tax
authorities. Our federal income tax return is subject to
examination by the Internal Revenue Service for the years
2022 through 2025. Several state tax returns are currently
under examination by the respective tax authorities for the
years 2014 through 2024. Non-U.S. tax returns are subject to
examination by the respective tax authorities for the years
2020 through 2025.
We regularly assess the likelihood of additional assessments
by each jurisdiction and have established tax reserves that we
believe are adequate in relation to the potential for additional
assessments. Examination outcomes and the timing of
examination settlements are subject to uncertainty. Although
the results of such examinations may have an impact on our
unrecognized tax benefits, we do not anticipate that such
impact will be material to our condensed consolidated
financial position or results of operations, but may be
material to our operating results for a particular period and
the effective tax rate for that period.
17. COMMITMENTS, CONTINGENCIES AND
GUARANTEES
Guarantees Issued and Credit Facilities Available
In addition to the default fund contributions and margin
collateral pledged by clearing members discussed in Note 14,
“Clearing Operations,” we have obtained financial guarantees
and credit facilities, which are guaranteed by us through
counter indemnities, to provide further liquidity related to our
clearing businesses. Financial guarantees issued to us totaled
$4
discussed in “Other Credit Facilities,” of Note 8, “Debt
Obligations,” we also have credit facilities primarily related
to our Nasdaq Clearing operations, which are available in
multiple currencies.
Other Guarantees
Through our clearing operations in the financial markets,
Nasdaq Clearing is the legal counterparty for, and guarantees
the performance of, its clearing members. See Note 14,
“Clearing Operations,” for further discussion of Nasdaq
Clearing performance guarantees.
We believe that the potential for us to be required to make
payments under these arrangements is unlikely. Accordingly,
no contingent liability is recorded in the Condensed
Consolidated Balance Sheets for the above guarantees.
23
Routing Brokerage Activities
One of our broker-dealer subsidiaries, Nasdaq Execution
Services, provides a guarantee to securities clearinghouses
and exchanges under its standard membership agreements,
which require members to guarantee the performance of other
members. If a member becomes unable to satisfy its
obligations to a clearinghouse or exchange, other members
would be required to meet its shortfalls. To mitigate these
performance risks, the exchanges and clearinghouses often
require members to post collateral, as well as meet certain
minimum financial standards. Nasdaq Execution Services’
maximum potential liability under these arrangements cannot
be quantified. However, we believe that the potential for
Nasdaq Execution Services to be required to make payments
under these arrangements is unlikely. Accordingly, no
contingent liability is recorded in the Condensed
Consolidated Balance Sheets for these arrangements.
Legal and Regulatory Matters
European Commission Matter
In September 2024, the European Commission, or the EC,
conducted an inspection at the Nasdaq Stockholm offices.
The inspection related to a potential competition law concern
regarding the trading of Nordic financial derivatives. We
understand that the EC's focus is a cooperative arrangement
with Eurex that was announced by Eurex and the Helsinki
Stock Exchange in 1999. The Helsinki Stock Exchange was
acquired by Nasdaq as part of our acquisition of OMX AB in
2008. The cooperative arrangement with Eurex fully ended
before Nasdaq learned of the EC's investigation.
In November 2025, the EC opened a formal antitrust
investigation to assess whether Nasdaq and Deutsche Börse
had breached European Union competition rules by
coordinating their conduct in the sector for listing, trading
and clearing of financial derivatives in the European
Economic Area.
We have been cooperating with the EC but are uncertain
about the duration or ultimate outcome of its review, or to the
extent there is any finding against us, the amount of any fines
or other remedies.
Other Matters
Except as disclosed above and in our prior reports filed under
the Exchange Act, we are not currently a party to any
litigation or proceeding that we believe could have a material
adverse effect on our business, consolidated financial
condition, or operating results. However, from time to time,
we have been threatened with, or named as a defendant in,
lawsuits or involved in regulatory proceedings.
In the normal course of business, Nasdaq discusses matters
with its regulators raised during regulatory examinations or
otherwise subject to their inquiries. Management believes
that censures, fines, penalties or other sanctions that could
result from any ongoing examinations or inquiries will not
have a material impact on our consolidated financial position
or results of operations. However, we are unable to predict
the outcome or the timing of the ultimate resolution of these
matters, or the potential fines, penalties or injunctive or other
equitable relief, if any, that may result from these matters.
Tax Audits
We are engaged in ongoing discussions and audits with
taxing authorities on various tax matters, the resolutions of
which are uncertain. Currently, there are matters that may
lead to assessments, some of which may not be resolved for
several years. Based on currently available information, we
believe we have adequately provided for any assessments that
could result from those proceedings where it is more likely
than not that we will be assessed. We review our positions on
these matters as they progress. See “Tax Audits,” of Note 16,
“Income Taxes,” for further discussion.
18. BUSINESS SEGMENTS
We manage, operate and provide our products and services in
Technology and Market Services. See Note 1, “Organization
and Nature of Operations,” for further discussion of our
reportable segments.
Our management allocates resources, assesses performance
and manages these businesses as three separate segments. We
evaluate the performance of our segments based on several
factors, of which the primary financial measure is operating
income. Our chief operating decision maker, or CODM, who
is our Chair and Chief Executive Officer, does not review
total assets or statements of income below operating income
by segments as key performance metrics; therefore, such
information is not presented below.
24
our business segments for the three months ended June 30,
2026 and 2025:
Capital Access Platforms | Financial Technology | Market Services | Corporate | Total | |
June 30, 2026 | (in millions) | ||||
Total revenues | $ | $ | $ | $ | $ |
Transaction- based expenses | — | — | ( | — | ( |
Revenues less transaction- based expenses | |||||
Directly consumed expenses | — | ||||
Other expenses | |||||
Operating income | $ | $ | $ | $( | $ |
Depreciation and amortization | |||||
Purchases of property and equipment | — | ||||
Capital Access Platforms | Financial Technology | Market Services | Corporate | Total | |
June 30, 2025 | |||||
Total revenues | $ | $ | $ | $ | $ |
Transaction- based expenses | — | — | ( | — | ( |
Revenues less transaction- based expenses | |||||
Directly consumed expenses | — | ||||
Other expenses | |||||
Operating income | $ | $ | $ | $( | $ |
Depreciation and amortization | |||||
Purchases of property and equipment | — | ||||
The following tables present certain information regarding
our business segments for the six months ended June 30,
2026 and 2025:
Capital Access Platforms | Financial Technology | Market Services | Corporate | Total | |
June 30, 2026 | (in millions) | ||||
Total revenues | $ | $ | $ | $ | $ |
Transaction- based expenses | — | — | ( | — | ( |
Revenues less transaction- based expenses | |||||
Directly consumed expenses | — | ||||
Other expenses | |||||
Operating income | $ | $ | $ | $( | $ |
Depreciation and amortization | |||||
Purchases of property and equipment | — | ||||
Capital Access Platforms | Financial Technology | Market Services | Corporate | Total | |
June 30, 2025 | |||||
Total revenues | $ | $ | $ | $ | $ |
Transaction- based expenses | — | — | ( | — | ( |
Revenues less transaction- based expenses | |||||
Directly consumed expenses | — | ||||
Other expenses | |||||
Operating income | $ | $ | $ | $( | $ |
Depreciation and amortization | |||||
Purchases of property and equipment | — | ||||
25
Directly consumed expenses in the table above include both
direct costs and costs of shared resources consumed by the
segment for revenue-generating activities. Other expenses
include indirect overhead costs allocated to our segments.
Other expenses also include expenses allocated to our
Corporate segment. The following tables summarize
revenues and expenses allocated to our Corporate segment:
Three Months Ended June 30, | |||
2026 | 2025 | ||
Revenues: | (in millions) | ||
Divestitures of businesses | $ | $ | |
Expenses: | |||
Amortization expense of acquired intangible assets | |||
Merger and strategic initiatives expense | |||
Restructuring charges | |||
Legal and regulatory matters | |||
Expenses - divestitures | |||
Other | |||
Total expenses | $ | $ | |
Operating loss | $( | $( | |
Six Months Ended June 30, | |||
2026 | 2025 | ||
Revenues: | (in millions) | ||
Divestitures of businesses | $ | $ | |
Expenses: | |||
Amortization expense of acquired intangible assets | |||
Merger and strategic initiatives expense | |||
Restructuring charges | |||
Legal and regulatory matters | |||
Gain on extinguishment of debt | ( | ||
Expenses - divestitures | |||
Other | |||
Total expenses | $ | $ | |
Operating loss | $( | $( | |
For further discussion of our segments’ results, see “Segment
Operating Results,” of “Part I, Item 2. Management’s
Discussion and Analysis of Financial Condition and Results
of Operations.”
The items in the preceding table are not included in the
measurement of segment profitability reviewed by our
CODM, as we believe they do not contribute to a meaningful
evaluation of a particular segment’s ongoing operating
performance. Management does not consider these items for
the purpose of evaluating the performance of our segments or
their managers or when making decisions to allocate
resources. Therefore, we believe performance measures
excluding the below items provide management with a useful
representation of our segments’ ongoing activity in each
period. These items, which are presented in the table above,
include the following:
•Revenues and expenses - divestitures: These amounts
reflect the revenues and expenses associated with our
Nordic power futures business, where we entered into an
agreement to transfer open interest in January 2025 and
completed this transfer in March 2026, and the sale of our
Solovis business in October 2025. See Note 4,
“Divestitures,” for further discussion of this transaction.
•Amortization expense of acquired intangible assets: We
amortize intangible assets acquired in connection with
various acquisitions. Intangible asset amortization expense
can vary from period to period due to episodic acquisitions
completed, rather than from our ongoing business
operations. As such, if intangible asset amortization is
included in performance measures, it is more difficult to
assess the day-to-day operating performance of the
segments, and the relative operating performance of the
segments between periods.
•Merger and strategic initiatives expense: We have pursued
various strategic initiatives and completed acquisitions and
divestitures in recent years that have resulted in expenses
which would not have otherwise been incurred. These
expenses generally include integration costs, as well as
legal, due diligence and other third-party transaction costs.
The frequency and the amount of such expenses vary
significantly based on the size, timing and complexity of
the transactions.
◦For the three and six months ended June 30, 2026, these
costs included amounts associated with various strategic
initiative costs. For the three and six months ended June
30, 2025, these costs primarily included amounts
associated with the transfer of open positions in our
Nordic power futures business, Adenza integration costs
and other strategic initiative costs.
•Restructuring charges: See Note 19, “Restructuring
Charges,” for further discussion of the restructuring
program.
•Legal and regulatory matters: For the three and six months
ended June 30, 2026 and 2025, this includes accruals
relating to certain legal matters, which are recorded in
professional and contract services in the Condensed
Consolidated Statements of Income.
•Gain on extinguishment of debt: This gain is recorded in
general, administrative and other expense in the Condensed
Consolidated Statements of Income.
26
geographic area for the three and six months ended June 30,
2026 and 2025. Revenues are classified based upon the
location of the customer.
Three Months Ended June 30, | |||
(in millions) | 2026 | 2025 | |
United States | $ | $ | |
All other countries | |||
Total | $ | $ | |
Six Months Ended June 30, | |||
(in millions) | 2026 | 2025 | |
United States | $ | $ | |
All other countries | |||
Total | $ | $ | |
No single customer accounted for 10.0% or more of our
revenues for the three and six months ended June 30, 2026
and 2025.
geographic area as of June 30, 2026 and December 31, 2025.
Property and equipment information is based on the physical
location of the assets.
(in millions) | June 30, 2026 | December 31, 2025 | |
United States | $ | $ | |
All other countries | |||
Total | $ | $ |
Property and equipment, net for all other countries primarily
19. RESTRUCTURING CHARGES
In the fourth quarter of 2023, following the closing of the
Adenza acquisition, our management approved, committed to
and initiated a restructuring program, “Adenza
Restructuring” to optimize our efficiencies as a combined
organization. We initiated the program upon the acquisition
of Adenza and further expanded the program in the fourth
quarter of 2024 following the achievement of our initial
targets. We have incurred costs principally related to
employee-related costs, contract terminations, asset
impairments and other related costs and expect to incur
additional costs in these areas in an effort to accelerate
efficiencies through location strategy and enhanced AI
capabilities. Actions taken as part of this program were
completed as of December 31, 2025, and all costs have been
incurred as of June 30, 2026. Total costs incurred since the
inception of the program were $139 million. We have
achieved benefits primarily in the form of expense synergies
with over $160 million net expense synergies actioned
through June 30, 2026.
Costs related to this program are recorded as restructuring
charges in the Condensed Consolidated Statements of
Income.
restructuring program charges for the three and six months
ended June 30, 2026 and 2025:
Three Months Ended June 30, | Six Months Ended June 30, | ||||||
2026 | 2025 | 2026 | 2025 | ||||
(in millions) | |||||||
Consulting services | $ | $ | $ | $ | |||
Employee-related costs | |||||||
Other | |||||||
Total restructuring charges | $ | $ | $ | $ | |||
27
Item 2. Management’s Discussion and Analysis of
Financial Condition and Results of Operations
The following discussion and analysis of the financial
condition and results of operations of Nasdaq should be read
in conjunction with our condensed consolidated financial
statements and related notes included in this Form 10-Q.
Certain percentages and per share amounts herein may not
sum or recalculate due to rounding.
EXECUTIVE OVERVIEW
Nasdaq is a leading technology platform that powers the
world’s economies. We architect the infrastructure of the
world’s most modern markets, power the innovation
economy, and build trust in the financial system. We
empower economic opportunity by designing and deploying
the technology, data, and advanced analytics that enable our
clients to capture opportunities, navigate risk, and strengthen
resilience.
We manage, operate and provide our products and services in
three business segments: Capital Access Platforms, Financial
Technology and Market Services.
Second Quarter 2026 Highlights and Recent
Developments
•Nasdaq welcomed seven of the 10 largest operating
company IPOs on the U.S. exchanges, including SpaceX,
the largest IPO in history with $86 billion in offering
proceeds. Nasdaq set a quarterly record for total proceeds
raised, with 26 operating company IPOs joining the U.S.
listings franchise, raising over $105 billion in offering
proceeds. Nasdaq achieved a 74% win rate across eligible
U.S. operating companies, direct listings, and SPAC
business combinations.
•Our Index business generated net inflows of $109 billion
over the last twelve months, including $51 billion in the
second quarter. Our end-of-period and average ETP AUM
reached new milestones, both exceeding $1.0 trillion for
the first time ever. During the quarter, Nasdaq launched 34
new products, including 11 in the institutional annuity
space and 17 international products.
•Financial Technology delivered double-digit revenue
growth in each subdivision for the second consecutive
quarter. Financial Technology delivered 16% revenue
growth and 16% ARR growth. During the second quarter
of 2026, Nasdaq signed 58 new clients, 7 cross-sells, and
107 upsells.
•Market Services delivered record quarterly net revenues
partially driven by record U.S. equity options volumes,
supported by record industry volumes. Nasdaq’s Closing
Cross achieved new records in notional value traded across
both the June Triple Witch and Russell reconstitution.
Macroeconomic environment
Our business performance can be positively or negatively
impacted by a number of factors, including general economic
conditions, the accelerated pace of technological change, the
geopolitical environment, current or expected inflation,
interest rate fluctuations, the threat or imposition of broad-
based tariffs, market volatility, changes in investment
patterns and priorities, regulatory changes, pandemics and
other factors that are generally beyond our control. For
example, higher overall U.S. trading volumes for the six
months ended June 30, 2026 compared with the same period
in 2025 led to an increase in our U.S. equities options and
U.S. cash equities revenues. Market factors also contributed
to higher valuations in Nasdaq Indices, higher overall
volumes in Index derivatives and a strengthening IPO
environment. To the extent that global or national economic
conditions weaken and result in slower growth or recessions,
our business may be negatively impacted.
Nasdaq’s Operating Results
The following tables summarize our financial performance
for the three and six months ended June 30, 2026 compared
to the same periods in 2025. For a detailed discussion of our
results of operations, see “Segment Operating Results”
below.
Three Months Ended June 30, | Percentage Change | ||||
2026 | 2025 | ||||
(in millions, except per share amounts) | |||||
Revenues less transaction-based expenses | $1,500 | $1,306 | 14.9% | ||
Operating expenses | 788 | 738 | 6.9% | ||
Operating income | $712 | $568 | 25.2% | ||
Net income attributable to Nasdaq | $507 | $452 | 12.2% | ||
Diluted earnings per share | $0.89 | $0.78 | 14.5% | ||
Cash dividends declared per common share | $0.31 | $0.27 | 14.8% | ||
Six Months Ended June 30, | Percentage Change | ||||
2026 | 2025 | ||||
(in millions, except per share amounts) | |||||
Revenues less transaction-based expenses | $2,908 | $2,543 | 14.4% | ||
Operating expenses | 1,539 | 1,428 | 7.8% | ||
Operating income | $1,369 | $1,115 | 22.7% | ||
Net income attributable to Nasdaq | $1,026 | $847 | 21.2% | ||
Diluted earnings per share | $1.80 | $1.46 | 23.3% | ||
Cash dividends declared per common share | $0.58 | $0.51 | 13.7% | ||
28
In countries with currencies other than the U.S. dollar,
revenues and expenses are translated using monthly average
exchange rates. Impacts on our revenues less transaction-
based expenses and operating income associated with
fluctuations in foreign currency are discussed in more detail
under “Item 3. Quantitative and Qualitative Disclosures
About Market Risk.”
The following chart summarizes our ARR (in millions):
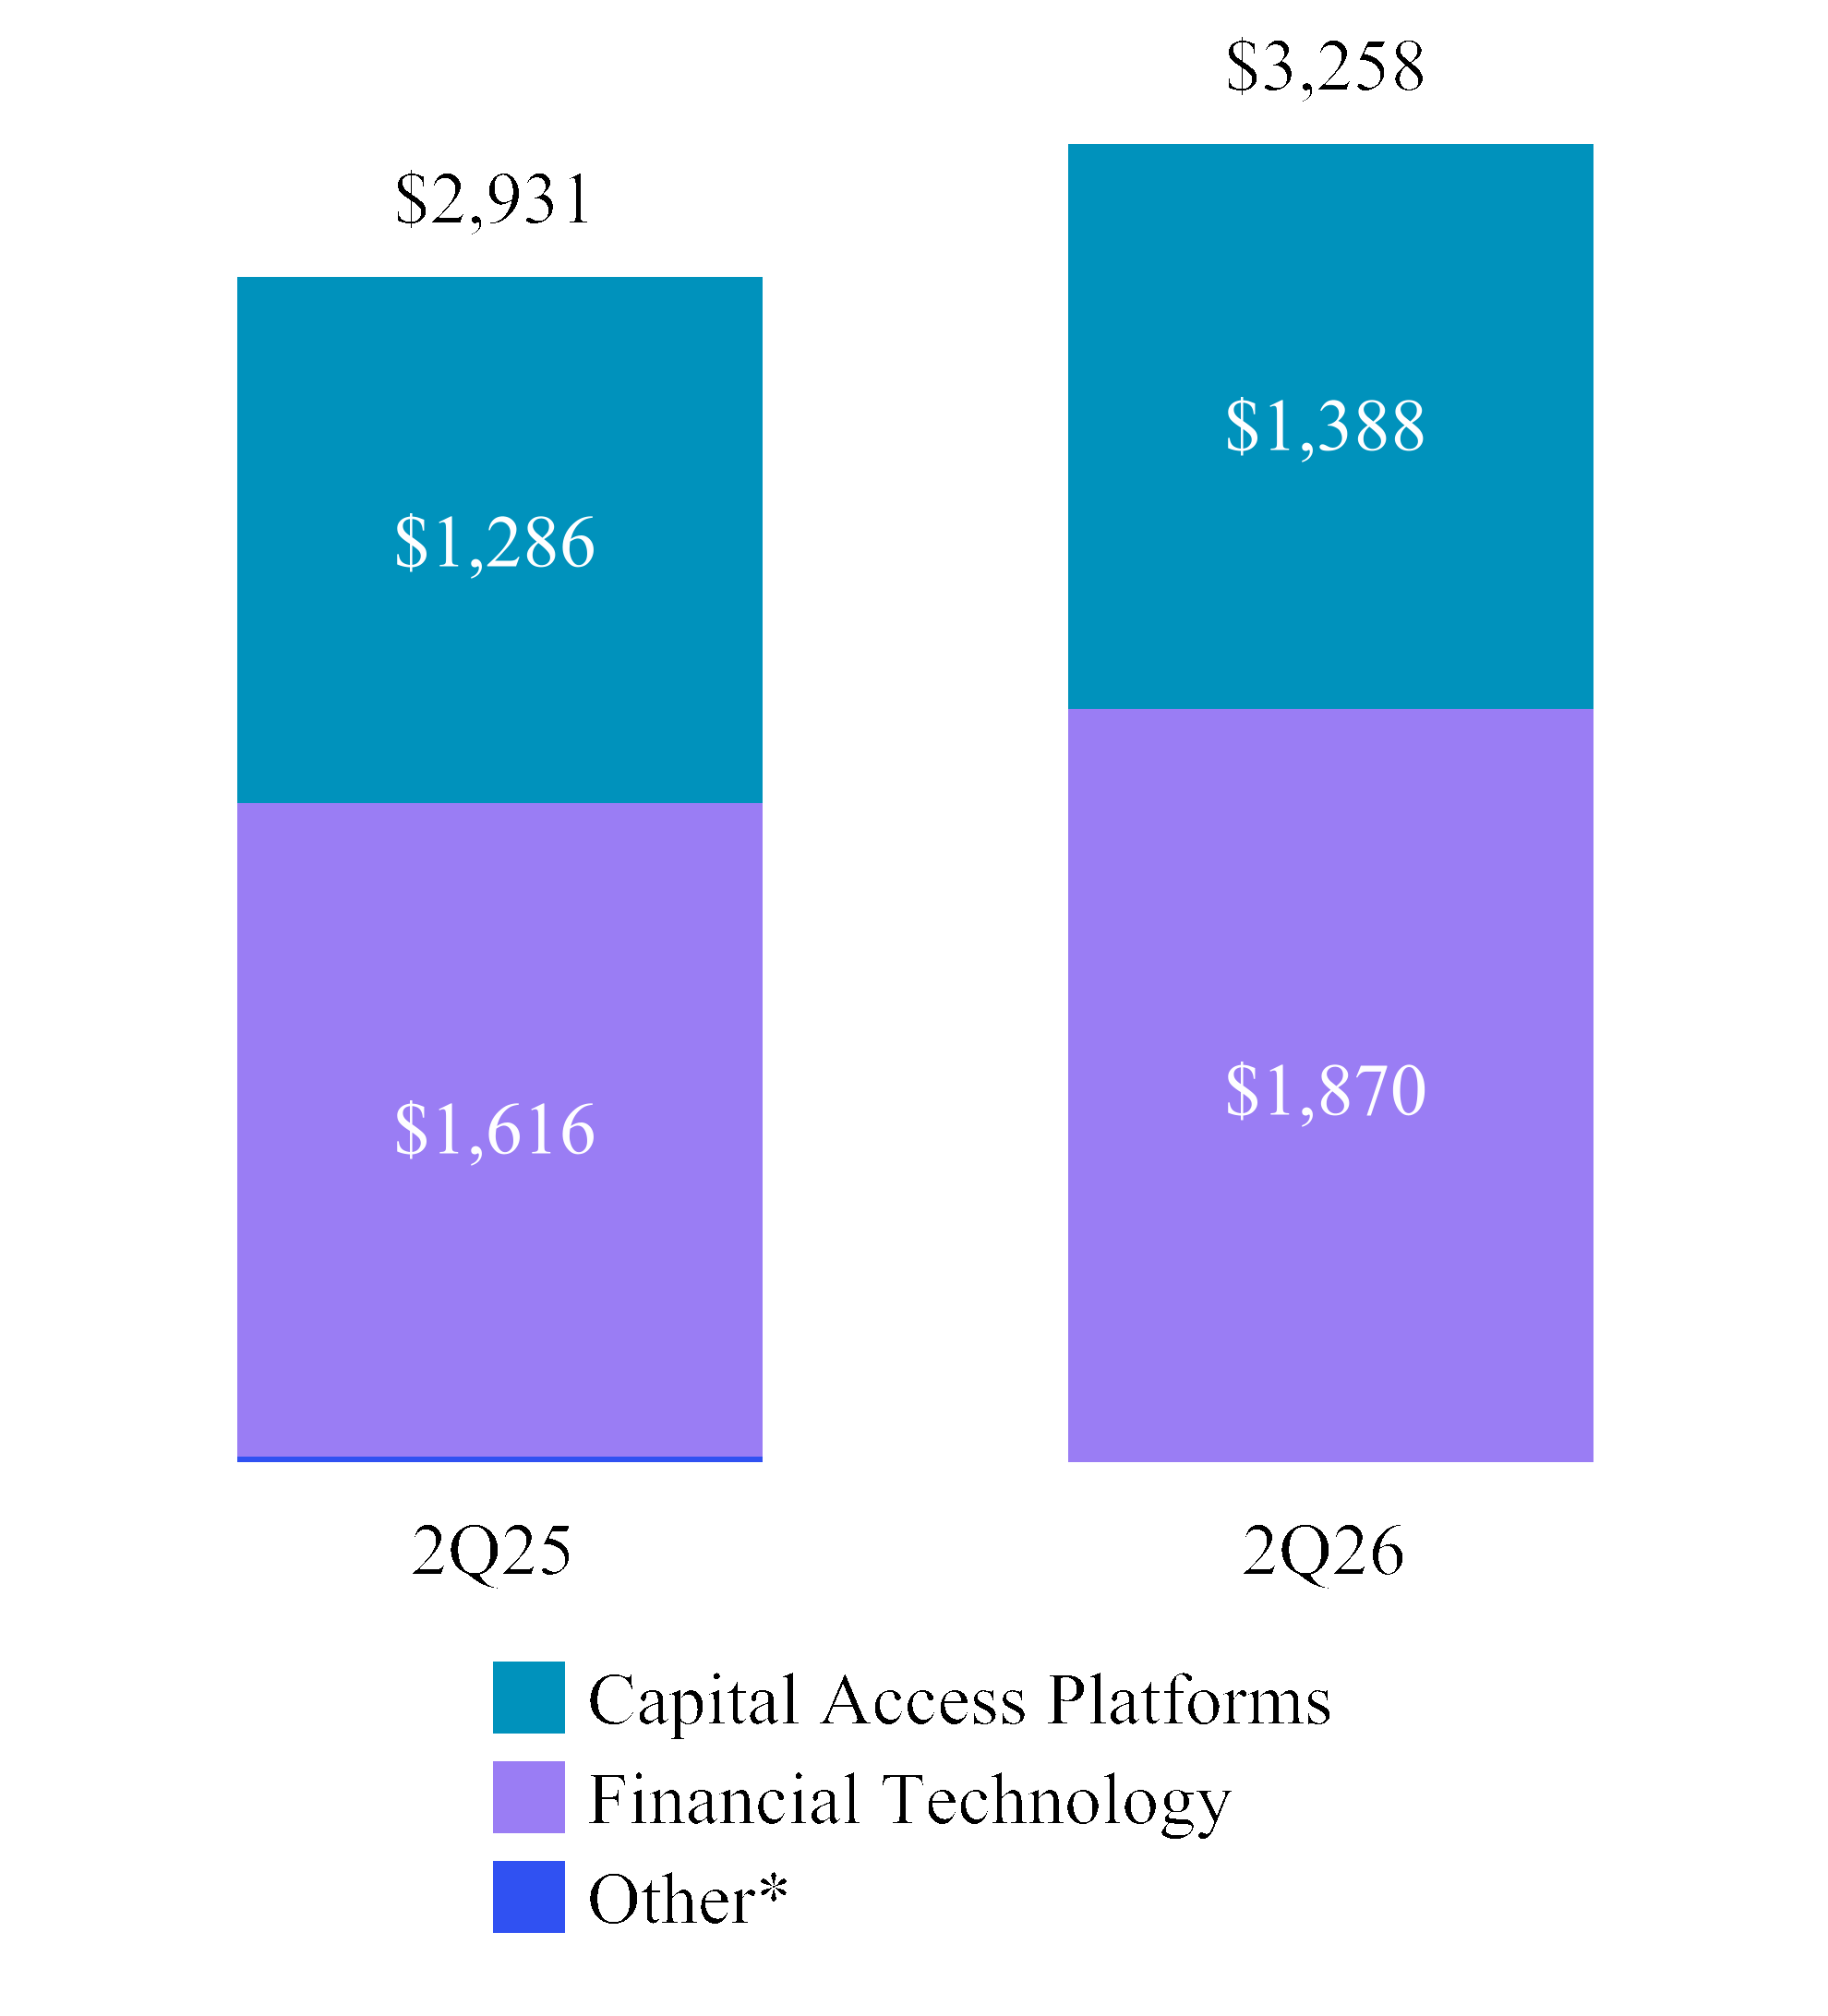
* In the chart above, Other 2Q25 includes $29 million.
ARR for a given period is the current annualized value
derived from subscription contracts with a defined contract
value. This excludes contracts that are not recurring, are one-
time in nature, or where the contract value fluctuates based
on defined metrics. ARR is currently one of our key
performance metrics to assess the health and trajectory of our
recurring business. ARR does not have any standardized
definition and is therefore unlikely to be comparable to
similarly titled measures presented by other companies. ARR
should be viewed independently of revenue and deferred
revenue and is not intended to be combined with or to replace
either of those items. For AxiomSL and Calypso recurring
revenue contracts, the amount included in ARR is consistent
with the amount that we invoice the customer during the
current period. Additionally, for AxiomSL and Calypso
recurring revenue contracts that include annual values that
increase over time, we include in ARR only the annualized
value of components of the contract that are considered
active as of the date of the ARR calculation. We do not
include the future committed increases in the contract value
as of the date of the ARR calculation. ARR is not a forecast
and the active contracts at the end of a reporting period used
in calculating ARR may or may not be extended or renewed
by our customers.
The ARR chart includes:
▪ | Capital Access Platforms | |
◦ | Proprietary market data subscriptions and annual listing fees within our Data & Listing Services business. | |
◦ | Index data subscriptions and guaranteed minimum on futures contracts within our Index business. | |
◦ | Subscription contracts under our Workflow & Insights business. | |
▪ | Financial Technology | |
◦ | Subscription contracts excluding non-recurring professional services. | |
▪ | Other, for 2Q25, includes ARR related to our Solovis business divested in October 2025. | |
The following chart summarizes our quarterly annualized
SaaS revenues for June 30, 2026 and 2025 (in millions):
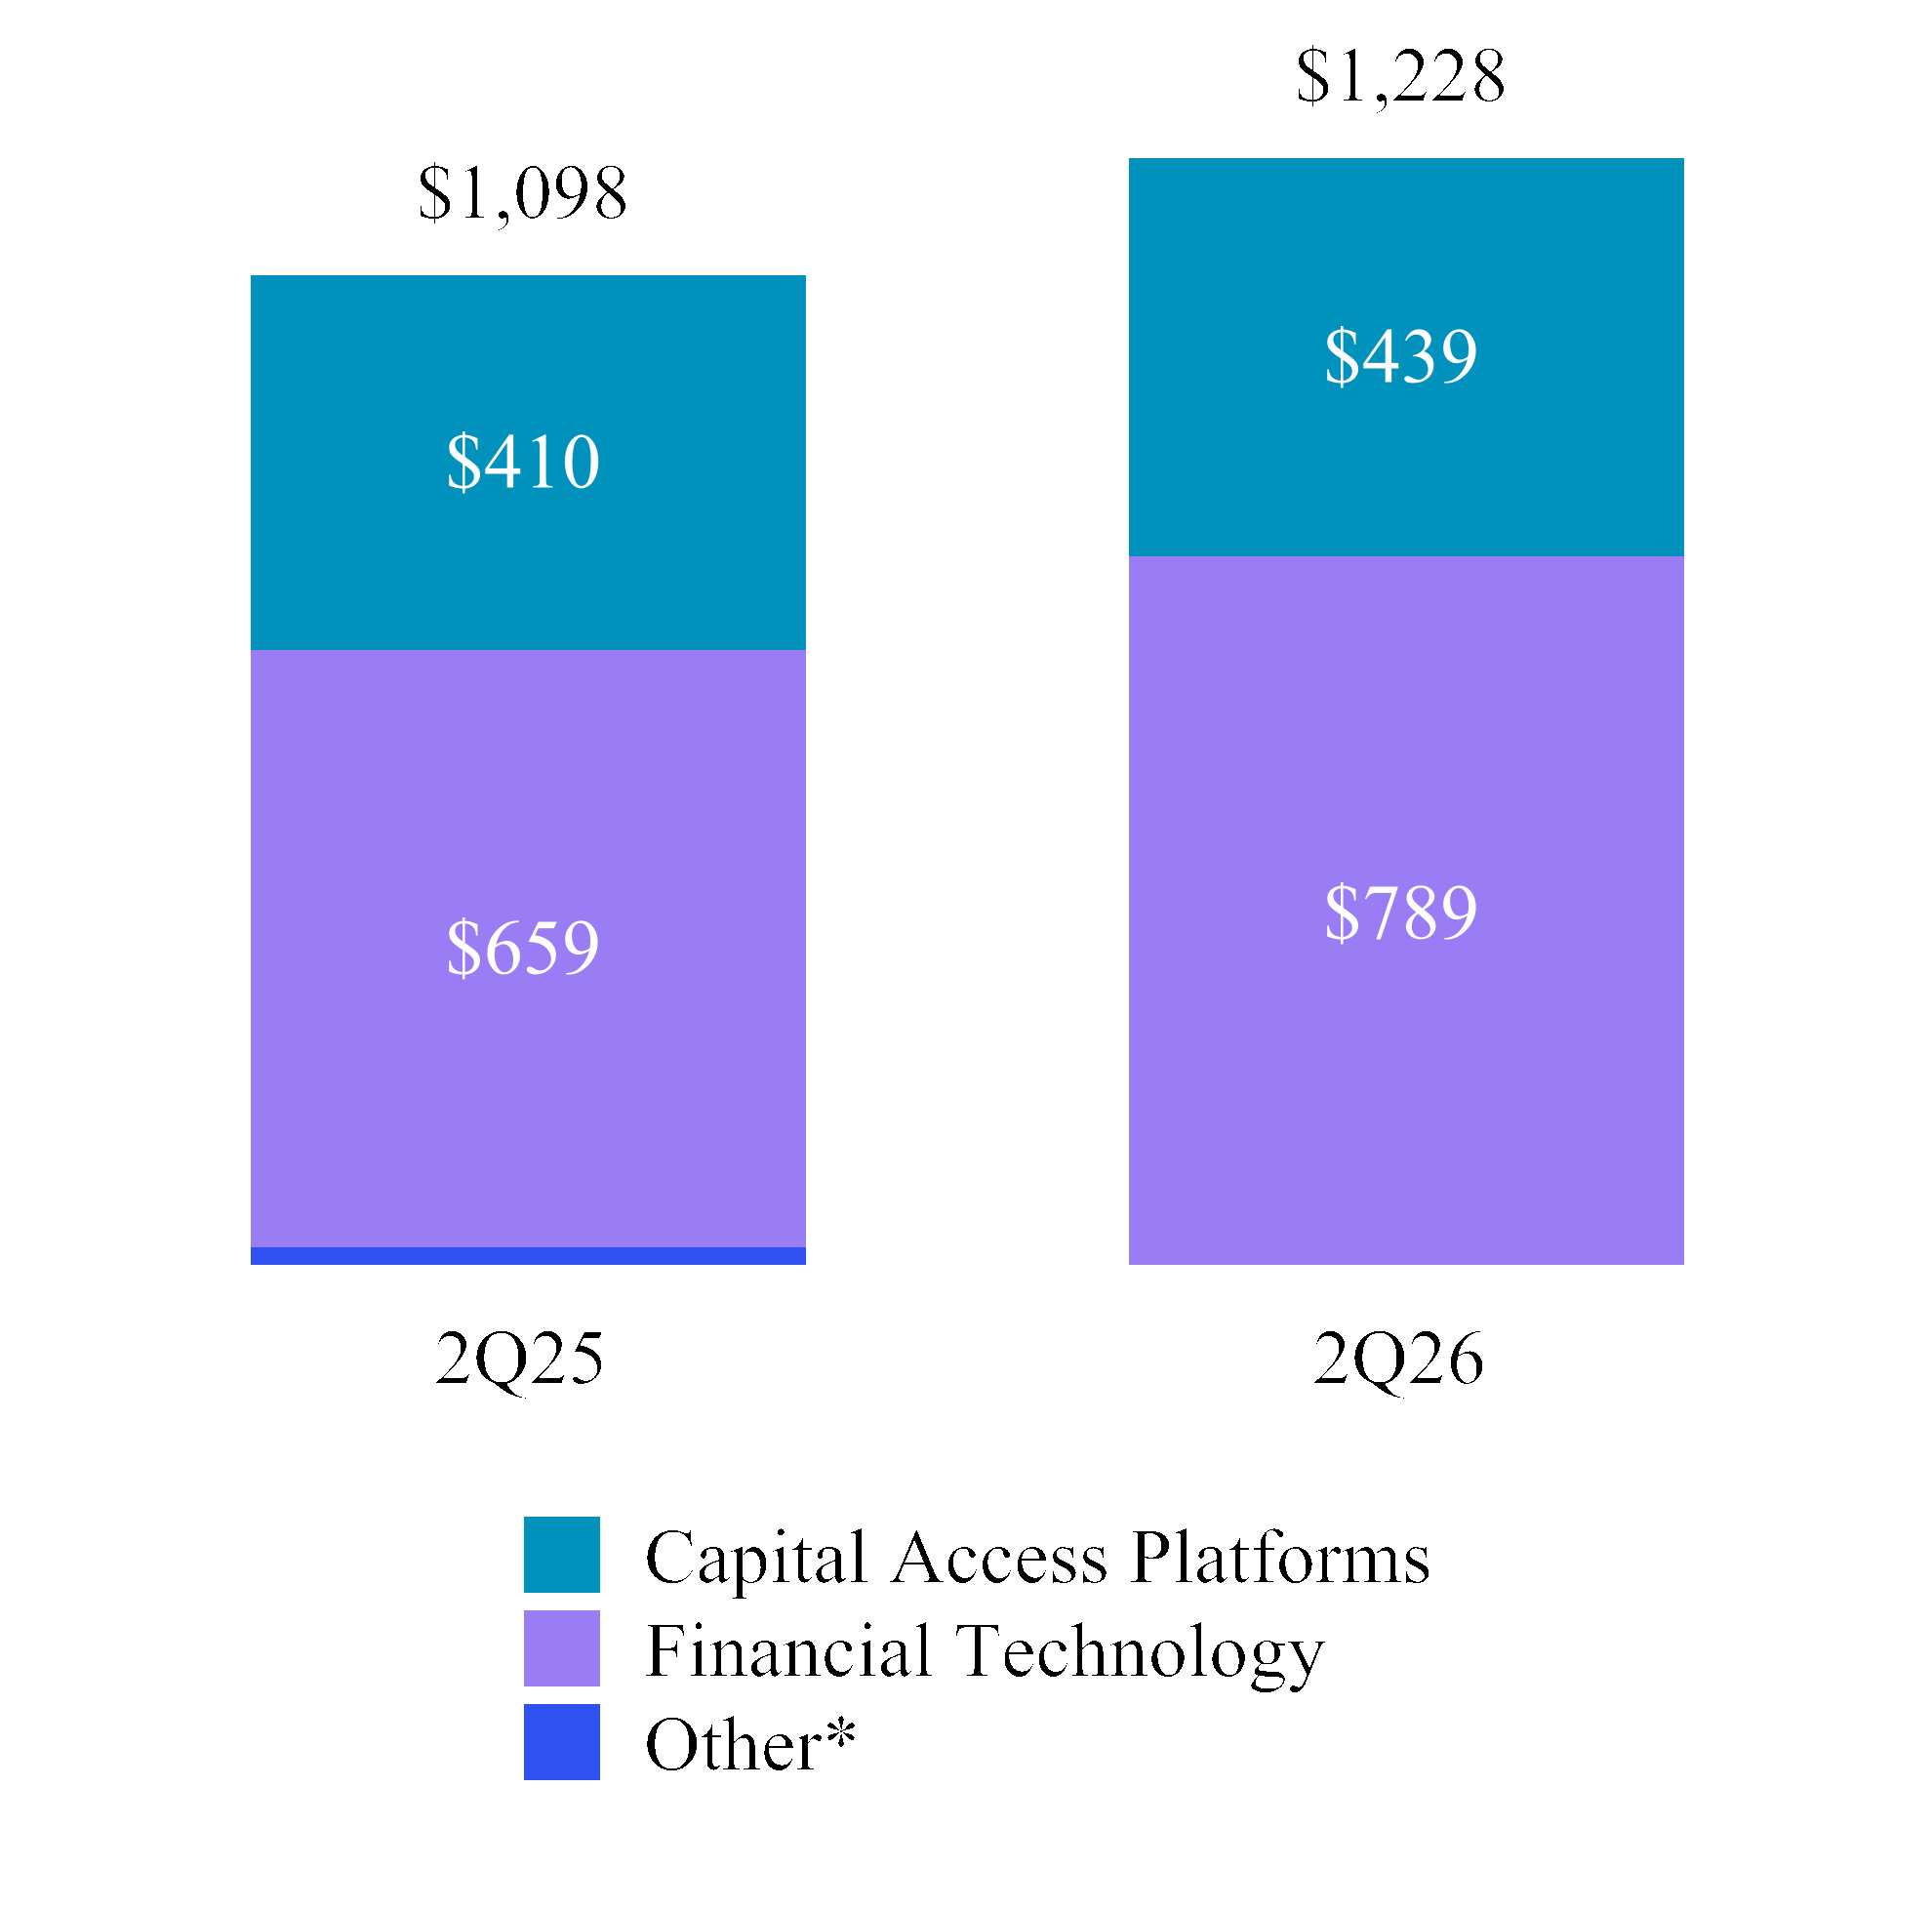
* In the chart above, Other 2Q25 includes $29 million.
29
SEGMENT OPERATING RESULTS
The following tables present our revenues by segment:
Three Months Ended June 30, | Percentage Change | ||||
2026 | 2025 | ||||
(in millions) | |||||
Capital Access Platforms | $621 | $520 | 19.4% | ||
Financial Technology | 539 | 464 | 16.3% | ||
Market Services | 1,372 | 1,101 | 24.6% | ||
Other revenues | — | 16 | (100.0)% | ||
Total revenues | $2,532 | $2,101 | 20.6% | ||
Transaction rebates | (712) | (640) | 11.2% | ||
Brokerage, clearance and exchange fees | (320) | (155) | 106.6% | ||
Total revenues less transaction-based expenses | $1,500 | $1,306 | 14.9% | ||
Six Months Ended June 30, | Percentage Change | ||||
2026 | 2025 | ||||
(in millions) | |||||
Capital Access Platforms | $1,186 | $1,028 | 15.5% | ||
Financial Technology | 1,057 | 896 | 17.9% | ||
Market Services | 2,419 | 2,240 | 8.0% | ||
Other revenues | 8 | 32 | (75.6)% | ||
Total revenues | $4,670 | $4,196 | 11.3% | ||
Transaction rebates | (1,436) | (1,224) | 17.2% | ||
Brokerage, clearance and exchange fees | (326) | (429) | (23.9)% | ||
Total revenues less transaction-based expenses | $2,908 | $2,543 | 14.4% | ||
The following charts present our Capital Access Platforms,
Financial Technology and Market Services segments as a
percentage of our total revenues, less transaction-based
expenses.
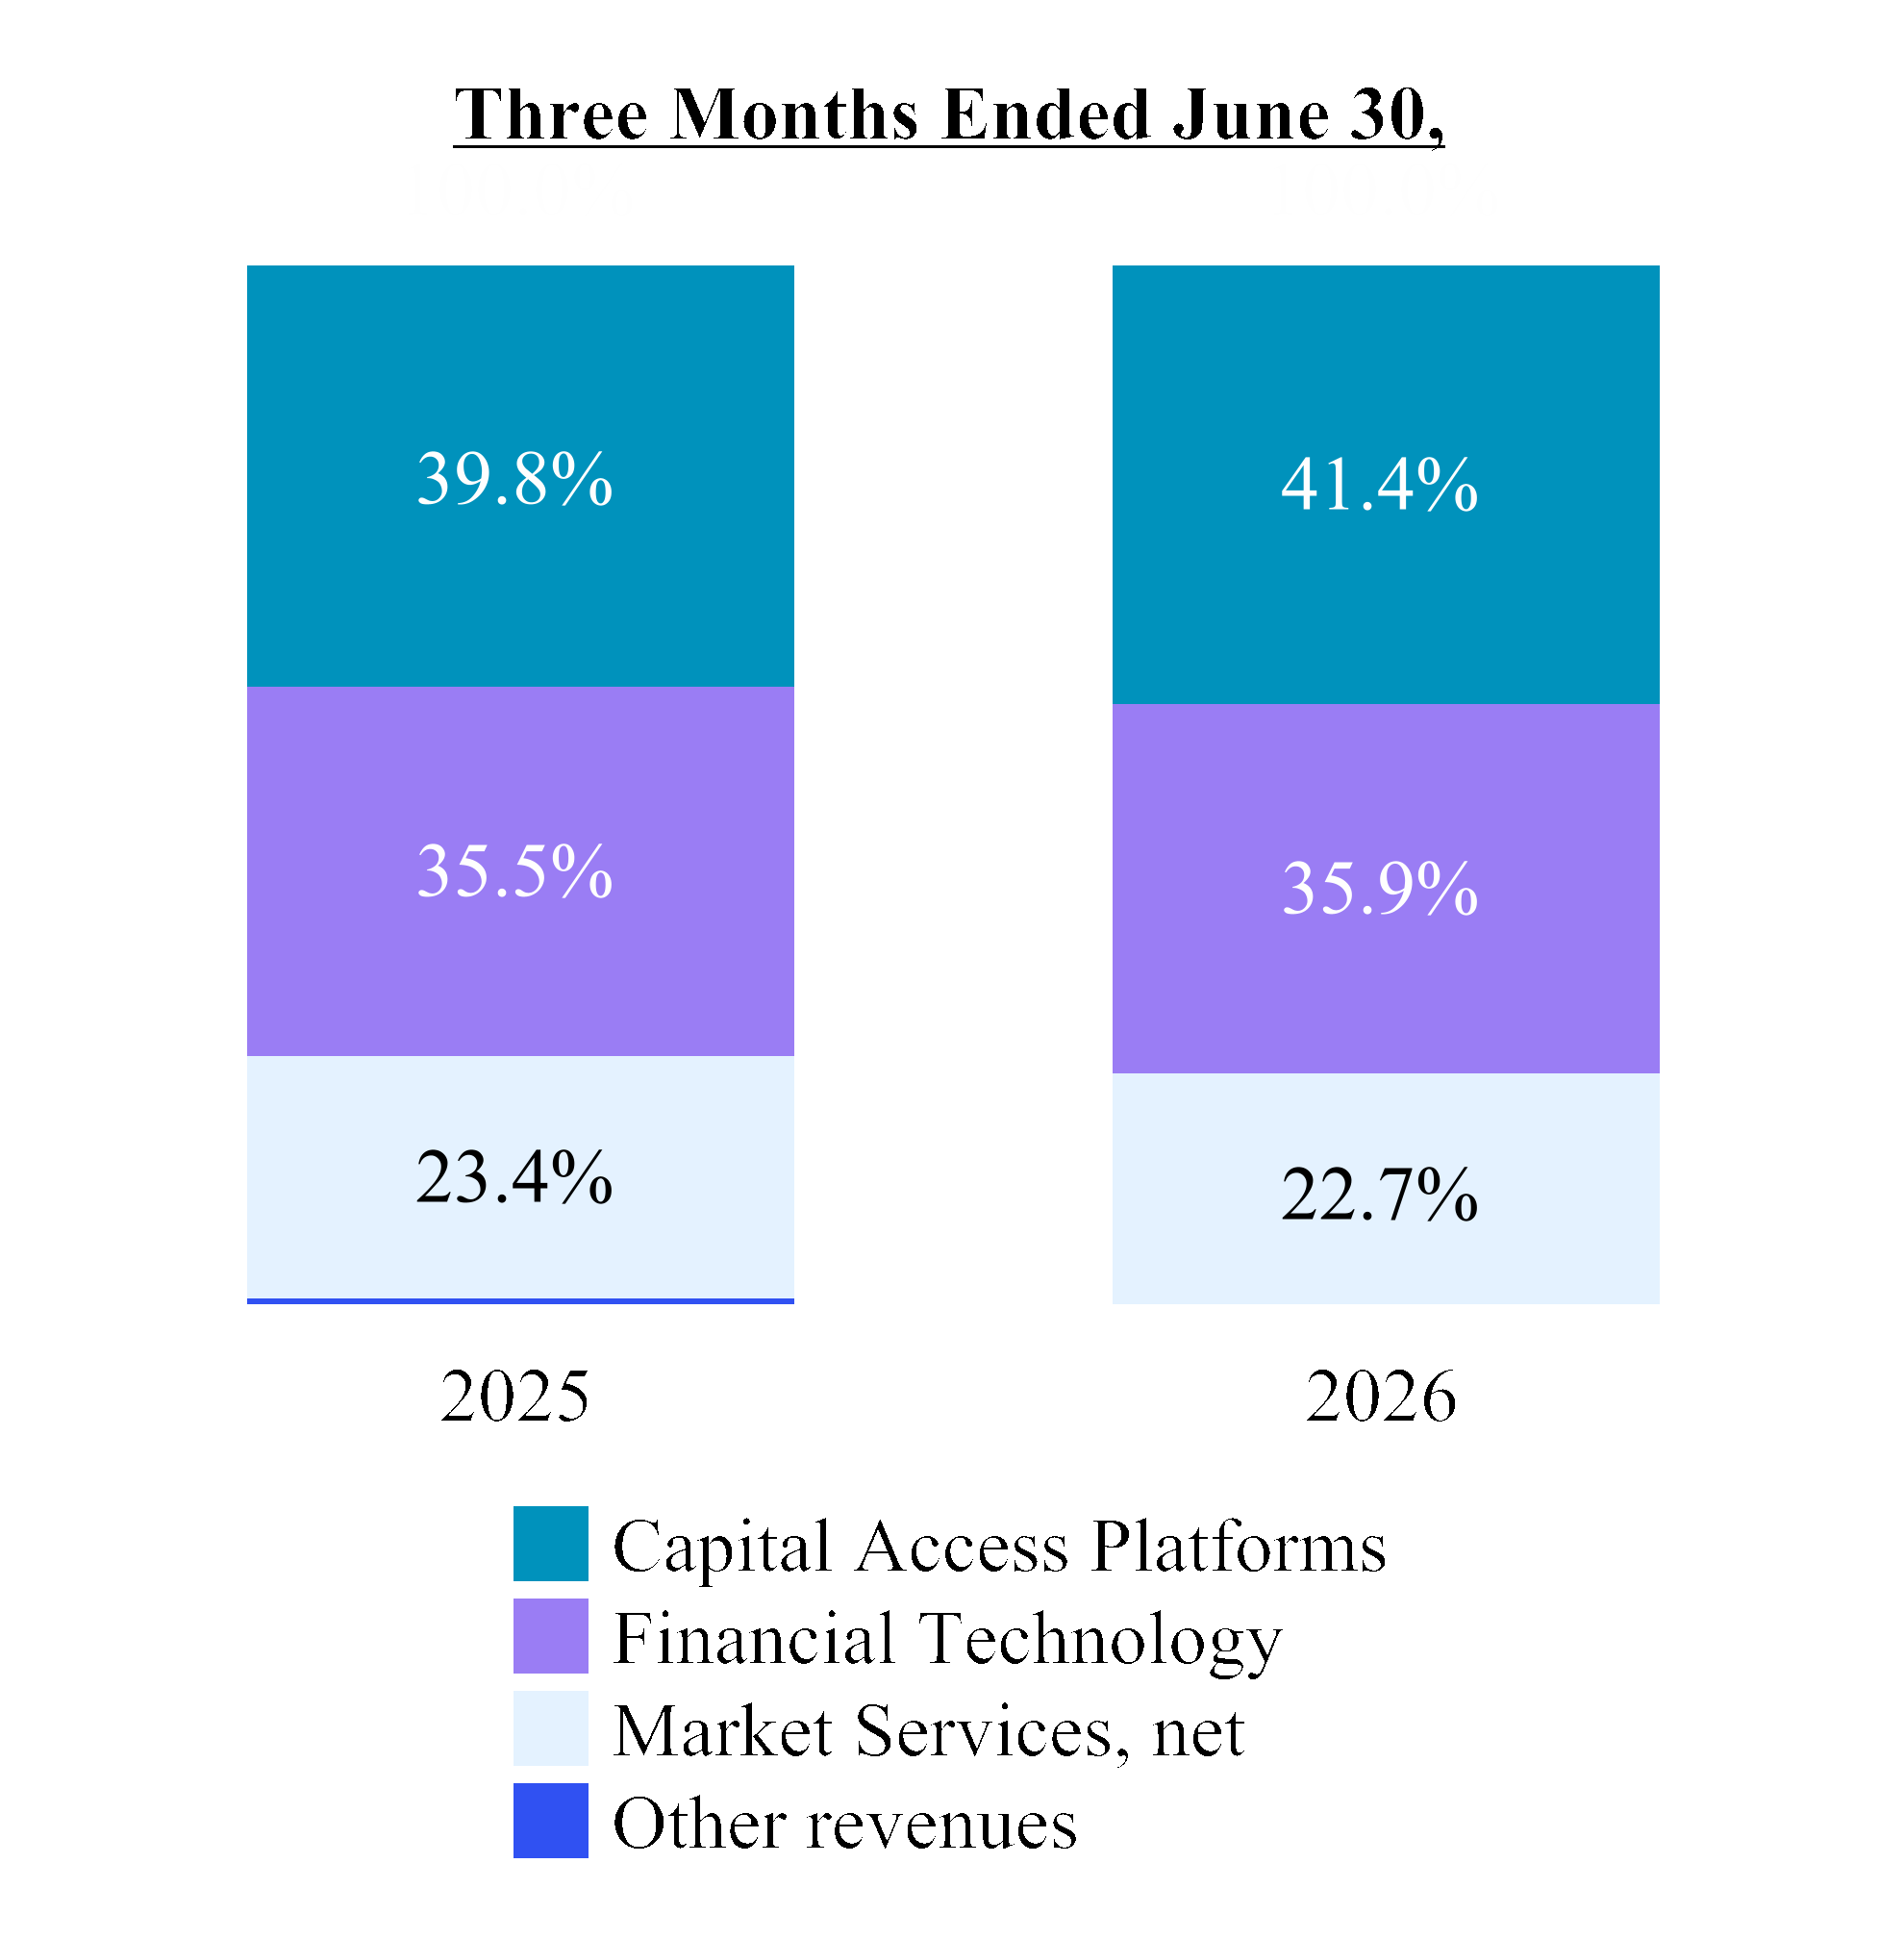
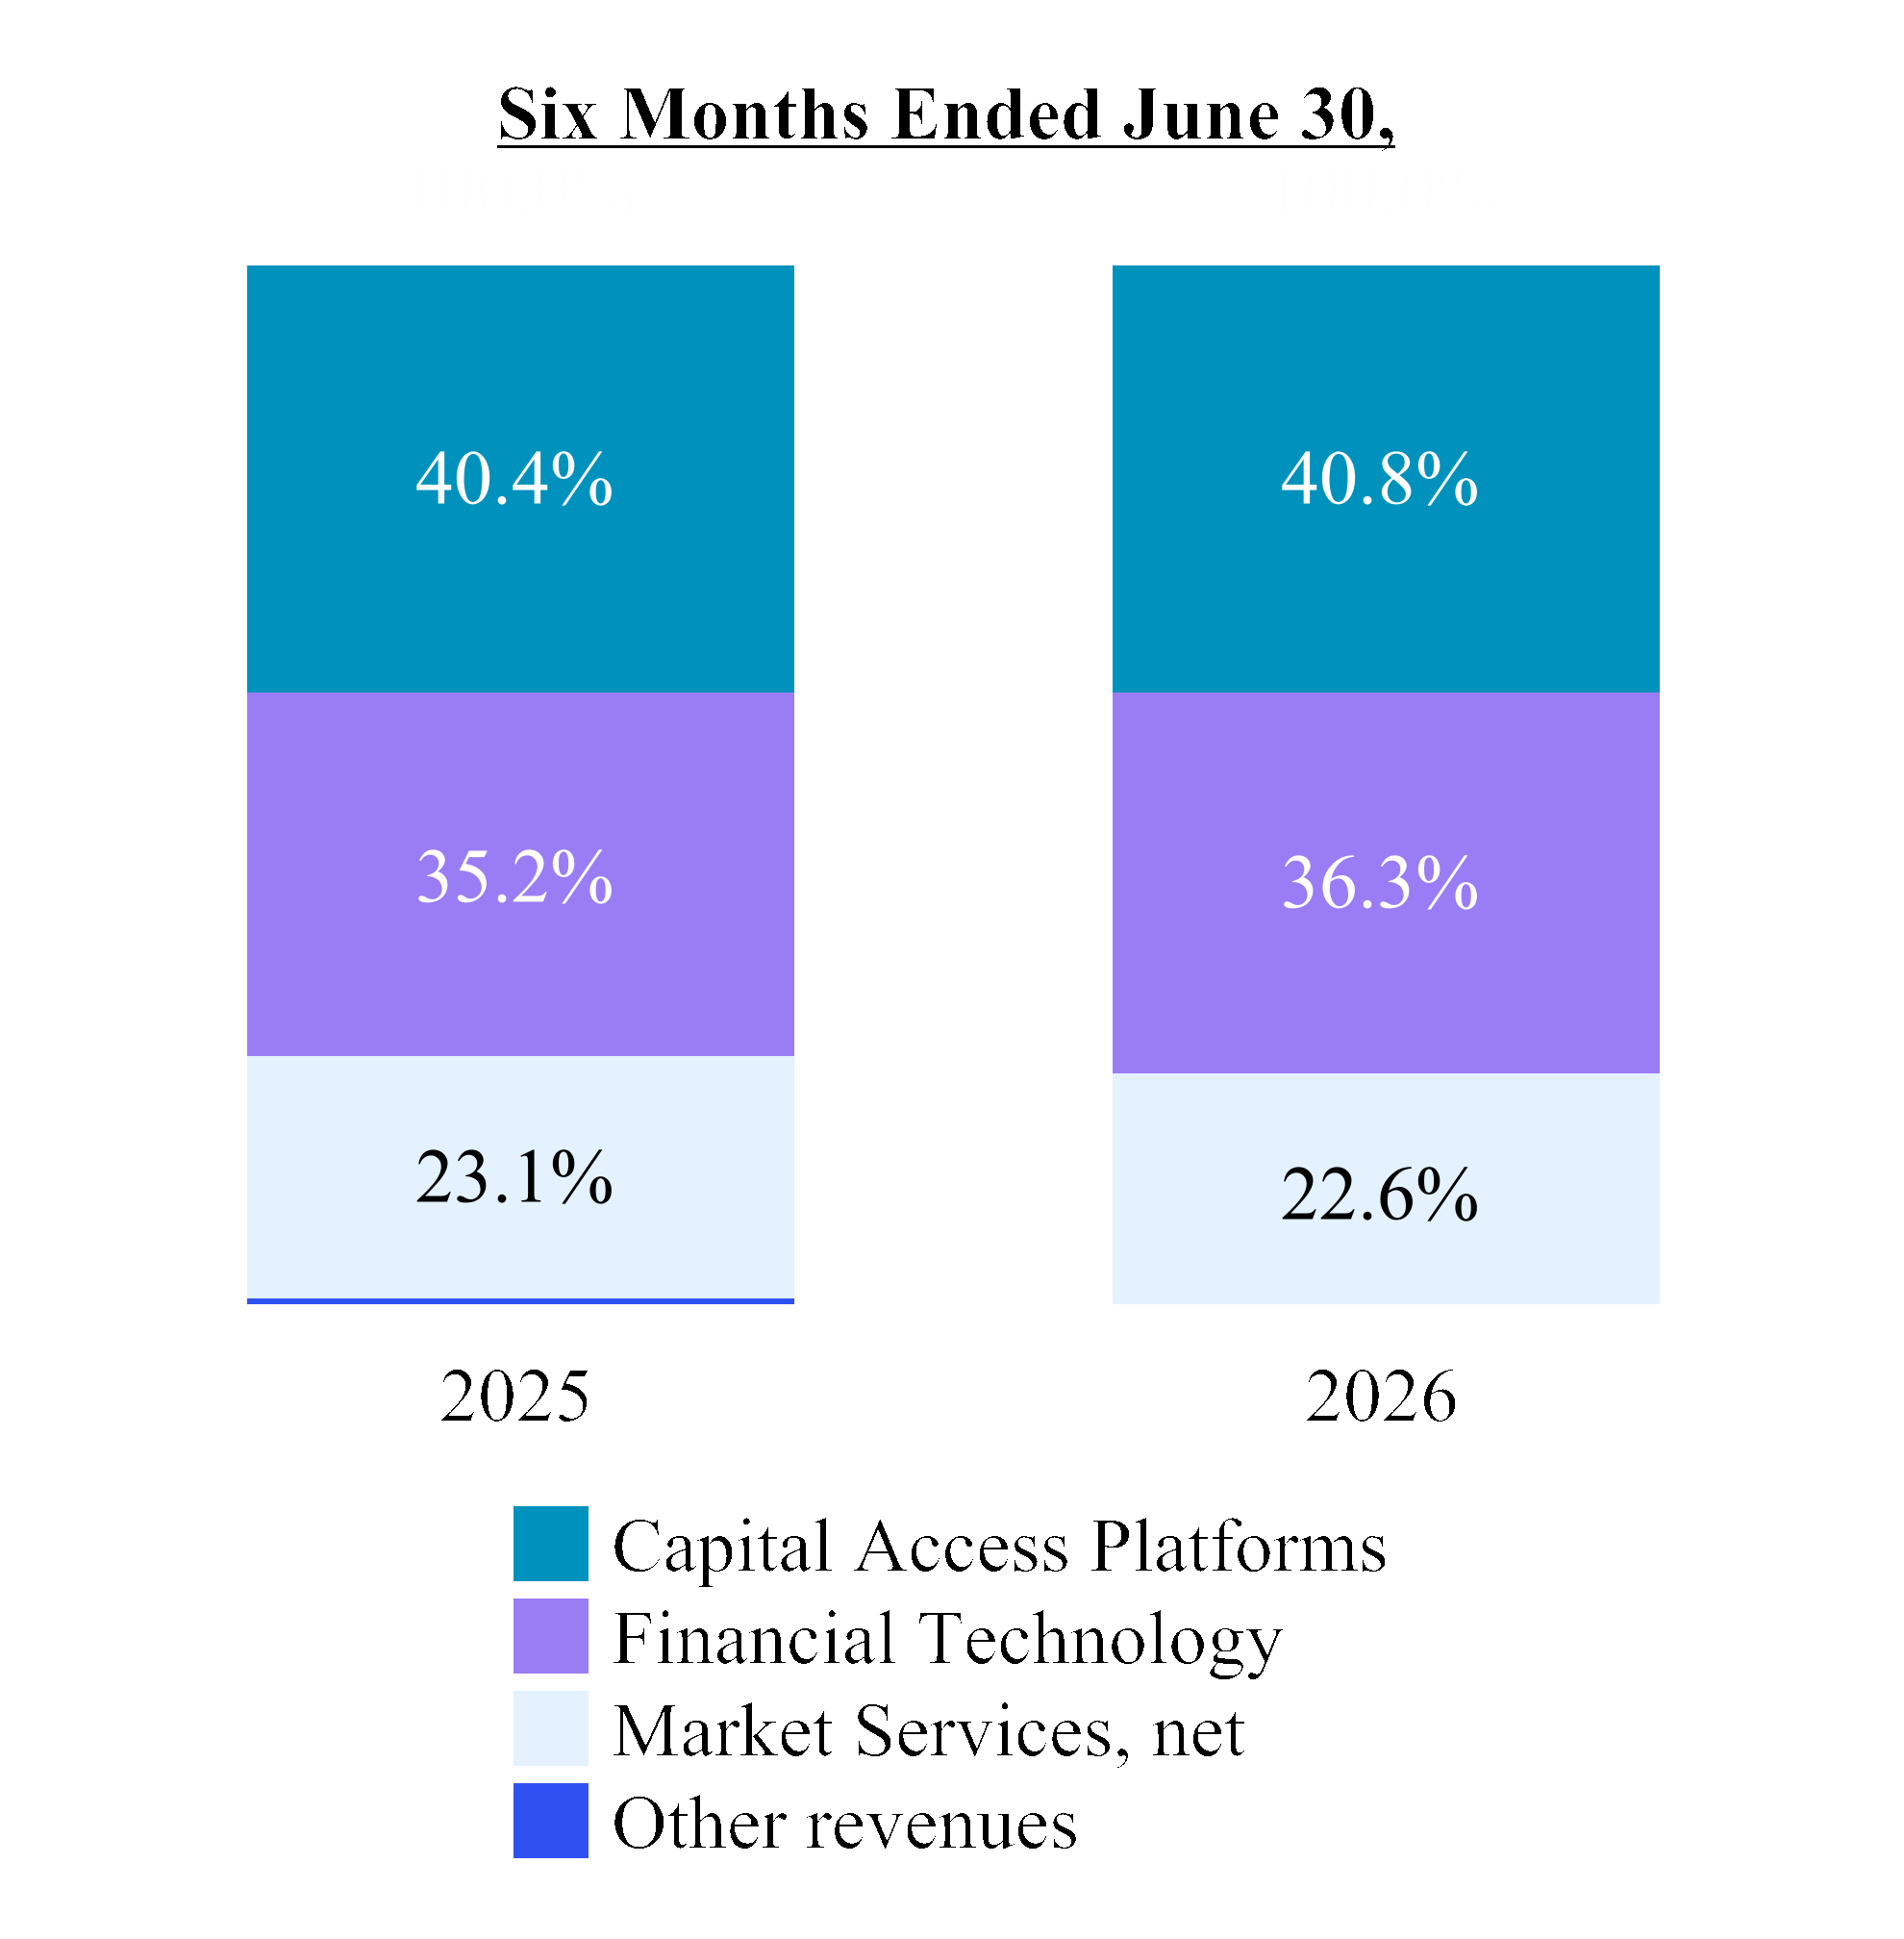
30
Capital Access Platforms
The following tables present revenues and ARR from our
Capital Access Platforms segment:
Three Months Ended June 30, | Percentage Change | ||||
2026 | 2025 | ||||
(in millions) | |||||
Data & Listing Services | $217 | $198 | 9.6% | ||
Index | 271 | 196 | 38.4% | ||
Workflow & Insights | 133 | 126 | 5.4% | ||
Total Capital Access Platforms | $621 | $520 | 19.4% | ||
Six Months Ended June 30, | Percentage Change | ||||
2026 | 2025 | ||||
(in millions) | |||||
Data & Listing Services | $431 | $391 | 10.5% | ||
Index | 491 | 388 | 26.5% | ||
Workflow & Insights | 264 | 249 | 6.0% | ||
Total Capital Access Platforms | $1,186 | $1,028 | 15.5% | ||
As of June 30, | ||||
2026 | 2025 | |||
ARR (in millions) | $1,388 | $1,286 | ||
Data & Listing Services Revenues
The following tables present key drivers from our Data &
Listing Services business:
Three Months Ended June 30, | |||
2026 | 2025 | ||
IPOs | |||
The Nasdaq Stock Market | 68 | 79 | |
Operating company | 26 | 38 | |
SPACs | 42 | 41 | |
Exchanges that comprise Nasdaq Nordic and Nasdaq Baltic | 11 | 6 | |
Total new listings | |||
The Nasdaq Stock Market | 188 | 194 | |
Exchanges that comprise Nasdaq Nordic and Nasdaq Baltic | 15 | 6 | |
Six Months Ended June 30, | |||
IPOs | 2026 | 2025 | |
The Nasdaq Stock Market | 131 | 142 | |
Operating company | 41 | 83 | |
SPACs | 90 | 59 | |
Exchanges that comprise Nasdaq Nordic and Nasdaq Baltic | 13 | 10 | |
Total new listings | |||
The Nasdaq Stock Market | 364 | 364 | |
Exchanges that comprise Nasdaq Nordic and Nasdaq Baltic | 20 | 15 | |
As of June 30, | |||
Number of listed companies | 2026 | 2025 | |
The Nasdaq Stock Market | 4,659 | 4,238 | |
Exchanges that comprise Nasdaq Nordic and Nasdaq Baltic | 1,109 | 1,148 | |
ARR (in millions) | $791 | $726 | |
In the tables above:
•The number of total listed companies on The Nasdaq Stock
Market as of June 30, 2026 and 2025 included 1,243 and
914 ETPs, respectively.
•IPOs, new listings (which includes IPOs) and total listed
companies for exchanges that comprise Nasdaq Nordic and
Nasdaq Baltic represent companies listed on the Nasdaq
Nordic and Nasdaq Baltic exchanges and companies listed
on the alternative markets of Nasdaq First North.
Data & Listing Services revenues increased for the three and
six months ended June 30, 2026, compared with the same
periods in 2025, primarily due to new data sales to new and
existing clients, pricing and usage, and increased revenue
from annual and initial listing fees due to new listings,
partially offset by the impact of prior year delistings and roll-
off of prior period amortization of initial listing fees. The
increase in the six months ended June 30, 2026 also included
a favorable impact from changes in foreign currency rates.
31
Index Revenues
The following table presents key drivers from our Index
business:
As of or Three Months Ended June 30, | ||||
2026 | 2025 | |||
Number of licensed ETPs | 481 | 422 | ||
TTM change in period end ETP AUM tracking Nasdaq indices (in billions) | ||||
Beginning balance | $745 | $569 | ||
Net inflows | 109 | 88 | ||
Net appreciation | 260 | 88 | ||
Ending balance | $1,114 | $745 | ||
Quarterly average ETP AUM tracking Nasdaq indices (in billions) | $1,014 | $663 | ||
ARR (in millions) | $87 | $80 | ||
In the table above, TTM represents trailing twelve months.
Index revenues increased for the three and six months ended
June 30, 2026, compared with the same periods in 2025,
primarily due to higher average AUM in exchange traded
products linked to Nasdaq indices, higher volume based
revenues and a $6 million one-time revenue benefit, due to a
contract modification, recognized in the second quarter of
2026.
Workflow & Insights Revenues
The following table presents key drivers from our Workflow
& Insights business:
As of or Three Months Ended June 30, | |||
2026 | 2025 | ||
(in millions) | |||
ARR | $510 | $480 | |
Quarterly annualized SaaS revenues | 439 | 410 | |
Workflow & Insights revenues increased for the three and six
months ended June 30, 2026, compared with the same
periods in 2025, primarily due to an increase in analytics
revenues, largely driven by eVestment and Nasdaq Data Link
sales growth.
Financial Technology
The following tables present revenues from our Financial
Technology segment:
Three Months Ended June 30, | Percentage Change | ||||
2026 | 2025 | ||||
(in millions) | |||||
Financial Crime Management Technology | $98 | $81 | 21.6% | ||
Regulatory Technology | 120 | 104 | 15.2% | ||
Capital Markets Technology | 321 | 279 | 15.1% | ||
Total Financial Technology | $539 | $464 | 16.3% | ||
Six Months Ended June 30, | Percentage Change | ||||
2026 | 2025 | ||||
(in millions) | |||||
Financial Crime Management Technology | $191 | $157 | 21.3% | ||
Regulatory Technology | 238 | 206 | 15.8% | ||
Capital Markets Technology | 628 | 533 | 17.8% | ||
Total Financial Technology | $1,057 | $896 | 17.9% | ||
Financial Crime Management Technology Revenues
The following table presents key drivers for our Financial
Crime Management Technology business:
As of or Three Months Ended June 30, | ||||
2026 | 2025 | |||
(in millions) | ||||
ARR and Quarterly annualized SaaS revenues | $359 | $308 | ||
Financial Crime Management Technology revenues
increased for the three and six months ended June 30, 2026,
compared with the same periods in 2025, primarily due to
higher subscription revenues from new and existing clients
and higher professional services fees.
Regulatory Technology Revenues
The following table presents key drivers for our Regulatory
Technology business:
As of or Three Months Ended June 30, | ||||
2026 | 2025 | |||
(in millions) | ||||
ARR | $428 | $376 | ||
Quarterly annualized SaaS revenues | 258 | 204 | ||
Regulatory Technology revenues increased for the three and
six months ended June 30, 2026, compared with the same
periods in 2025, primarily due to increased subscription
revenues from our AxiomSL and Surveillance solutions
primarily driven by price increases, revenue from new clients
and the favorable impact from changes in foreign currency
rates.
32
Capital Markets Technology Revenues
The following table presents key drivers for our Capital
Markets Technology business:
As of or Three Months Ended June 30, | |||
2026 | 2025 | ||
(in millions) | |||
ARR | $1,083 | $932 | |
Quarterly annualized SaaS revenues | 172 | 147 | |
Capital Markets Technology revenues increased for the three
and six months ended June 30, 2026 compared with the same
periods in 2025. The increase was primarily due to higher
revenues from data center expansion, including a change in
pricing structure, higher Calypso upfront license revenues
and increased subscription revenues across all businesses,
partially offset by lower professional services revenues. For
the six months ended June 30, 2026 the increase was also
driven by certain one-time fees.
Market Services
The following tables present revenues from our Market
Services segment:
Three Months Ended June 30, | Percentage Change | ||||
2026 | 2025 | ||||
(in millions) | |||||
Market Services | $1,372 | $1,101 | 24.6% | ||
Transaction-based expenses: | |||||
Transaction rebates | (712) | (640) | 11.2% | ||
Brokerage, clearance and exchange fees | (320) | (155) | 106.6% | ||
Total Market Services, net | $340 | $306 | 11.2% | ||
Six Months Ended June 30, | Percentage Change | ||||
2026 | 2025 | ||||
(in millions) | |||||
Market Services | $2,419 | $2,240 | 8.0% | ||
Transaction-based expenses: | |||||
Transaction rebates | (1,436) | (1,224) | 17.2% | ||
Brokerage, clearance and exchange fees | (326) | (429) | (23.9)% | ||
Total Market Services, net | $657 | $587 | 12.0% | ||
The following tables present net revenues by product from
our Market Services segment:
Three Months Ended June 30, | Percentage Change | ||||
2026 | 2025 | ||||
(in millions) | |||||
U.S. Equity Derivative Trading | $123 | $114 | 8.2% | ||
Cash Equity Trading | 160 | 135 | 18.7% | ||
U.S. Tape plans | 33 | 37 | (10.7)% | ||
Other | 24 | 20 | 18.3% | ||
Total Market Services, net | $340 | $306 | 11.2% | ||
Six Months Ended June 30, | Percentage Change | ||||
2026 | 2025 | ||||
(in millions) | |||||
U.S. Equity Derivative Trading | $243 | $222 | 9.4% | ||
Cash Equity Trading | 298 | 255 | 16.8% | ||
U.S. Tape plans | 66 | 70 | (5.0)% | ||
Other | 50 | 40 | 24.5% | ||
Total Market Services, net | $657 | $587 | 12.0% | ||
In the tables above, Other includes Nordic fixed income
trading & clearing, Nordic derivatives and Canadian cash
equities trading.
33
U.S. Equity Derivative Trading
The following tables present total revenues, transaction-based
expenses, and total revenues less transaction-based expenses
as well as key drivers from our U.S. Equity Derivative
Trading business:
Three Months Ended June 30, | Percentage Change | ||||
2026 | 2025 | ||||
(in millions) | |||||
U.S. Equity Derivative Trading Revenues | $462 | $426 | 8.5% | ||
Section 31 fees | 34 | 15 | 129.2% | ||
Transaction-based expenses: | |||||
Transaction rebates | (338) | (311) | 8.6% | ||
Section 31 fees | (34) | (15) | 129.2% | ||
Brokerage and clearance fees | (1) | (1) | (11.1)% | ||
U.S. Equity Derivative Trading Revenues, net | $123 | $114 | 8.2% | ||
Six Months Ended June 30, | Percentage Change | ||||
2026 | 2025 | ||||
(in millions) | |||||
U.S. Equity Derivative Trading Revenues | $894 | $834 | 7.2% | ||
Section 31 fees | 34 | 47 | (26.5)% | ||
Transaction-based expenses: | |||||
Transaction rebates | (650) | (610) | 6.6% | ||
Section 31 fees | (34) | (47) | (26.5)% | ||
Brokerage and clearance fees | (1) | (2) | (53.4)% | ||
U.S. Equity Derivative Trading Revenues, net | $243 | $222 | 9.4% | ||
Section 31 fees are recorded as U.S. equity derivative and
U.S. cash equity trading revenues with a corresponding
amount recorded in transaction-based expenses. We are
assessed these fees from the SEC and pass them through to
our customers in the form of incremental fees. Pass-through
fees can increase or decrease due to rate changes by the SEC,
our percentage of the overall industry volumes processed on
our systems, and differences in actual dollar value traded.
Section 31 fees increased for the three months ended June 30,
2026, compared with the same period in 2025, primarily due
to a higher average SEC fee rate. The decrease in the six
months ended June 30, 2026, compared with the same period
in 2025, is primarily due to lower average SEC fee rates.
Since the amount recorded in revenues is equal to the amount
recorded as Section 31 fees, there is no impact on our net
revenues.
Three Months Ended June 30, | |||
2026 | 2025 | ||
U.S. equity options | |||
Total industry average daily volume (in millions) | 66.5 | 52.5 | |
Nasdaq PHLX matched market share | 11.2% | 9.6% | |
The Nasdaq Options Market matched market share | 2.6% | 4.3% | |
Nasdaq Texas Options matched market share | 1.3% | 1.7% | |
Nasdaq ISE Options matched market share | 6.6% | 6.6% | |
Nasdaq GEMX Options matched market share | 3.4% | 4.4% | |
Nasdaq MRX Options matched market share | 4.0% | 2.8% | |
Total matched market share executed on Nasdaq’s exchanges | 29.1% | 29.4% | |
Six Months Ended June 30, | |||
U.S. equity options | 2026 | 2025 | |
Total industry average daily volume (in millions) | 64.6 | 53.0 | |
Nasdaq PHLX matched market share | 11.8% | 9.4% | |
The Nasdaq Options Market matched market share | 2.6% | 4.7% | |
Nasdaq Texas Options matched market share | 1.3% | 1.7% | |
Nasdaq ISE Options matched market share | 6.4% | 6.7% | |
Nasdaq GEMX Options matched market share | 3.4% | 4.0% | |
Nasdaq MRX Options matched market share | 4.1% | 2.8% | |
Total matched market share executed on Nasdaq’s exchanges | 29.6% | 29.3% | |
U.S. equity derivative trading revenues and U.S. equity
derivative trading revenues, net increased for the three and
six months ended June 30, 2026, compared with the same
periods in 2025, primarily due to higher industry trading
volumes, partially offset by lower capture. The increase for
the six months ended June 30, 2026 was also driven by
higher overall U.S. matched market share executed on
Nasdaq’s exchanges
Transaction rebates, in which we credit a portion of the
execution charge to the market participant, increased for the
three and six months ended June 30, 2026, compared with the
same periods in 2025, primarily due to higher industry
trading volumes executed on Nasdaq’s exchanges, partially
offset by lower rebate capture rate.
34
Cash Equity Trading Revenues
The following tables present total revenues, transaction-based
expenses, and total revenues less transaction-based expenses
as well as key drivers and other metrics from our Cash Equity
Trading business:
Three Months Ended June 30, | Percentage Change | ||||
2026 | 2025 | ||||
(in millions) | |||||
Cash Equity Trading Revenues | $531 | $463 | 14.8% | ||
Section 31 fees | 280 | 133 | 110.4% | ||
Transaction-based expenses: | |||||
Transaction rebates | (366) | (322) | 13.8% | ||
Section 31 fees | (280) | (133) | 110.4% | ||
Brokerage and clearance fees | (5) | (6) | (2.5)% | ||
Cash equity trading revenues, net | $160 | $135 | 18.7% | ||
Six Months Ended June 30, | Percentage Change | ||||
2026 | 2025 | ||||
(in millions) | |||||
Cash Equity Trading Revenues | $1,079 | $870 | 24.0% | ||
Section 31 fees | 280 | 367 | (23.7%) | ||
Transaction-based expenses: | |||||
Transaction rebates | (770) | (602) | 28.0% | ||
Section 31 fees | (280) | (367) | (23.7%) | ||
Brokerage and clearance fees | (11) | (13) | (12.2%) | ||
Cash equity trading revenues, net | $298 | $255 | 16.8% | ||
See the discussion above for an explanation of Section 31
fees for the three and six months ended June 30, 2026
compared with the same periods in 2025.
Three Months Ended June 30, | |||
2026 | 2025 | ||
Total U.S.-listed securities | |||
Total industry average daily share volume (in billions) | 20.2 | 18.4 | |
Matched share volume (in billions) | 184.5 | 158.4 | |
The Nasdaq Stock Market matched market share | 14.3% | 13.5% | |
Nasdaq Texas matched market share | 0.3% | 0.3% | |
Nasdaq PSX matched market share | 0.1% | 0.1% | |
Total matched market share executed on Nasdaq’s exchanges | 14.7% | 13.9% | |
Market share reported to the FINRA/ Nasdaq Trade Reporting Facility | 46.4% | 47.7% | |
Total market share | 61.1% | 61.6% | |
Nasdaq Nordic and Nasdaq Baltic securities | |||
Average daily number of equity trades executed on Nasdaq’s exchanges | 747,410 | 804,121 | |
Total average daily value of shares traded (in billions) | $6.2 | $5.7 | |
Total market share executed on Nasdaq’s exchanges | 74.5% | 71.9% | |
Six Months Ended June 30, | |||
Total U.S.-listed securities | 2026 | 2025 | |
Total industry average daily share volume (in billions) | 20.1 | 17.1 | |
Matched share volume (in billions) | 368.2 | 295.5 | |
The Nasdaq Stock Market matched market share | 14.5% | 13.8% | |
Nasdaq Texas matched market share | 0.3% | 0.3% | |
Nasdaq PSX matched market share | 0.1% | 0.1% | |
Total matched market share executed on Nasdaq’s exchanges | 14.9% | 14.2% | |
Market share reported to the FINRA/ Nasdaq Trade Reporting Facility | 46.0% | 47.9% | |
Total market share | 60.9% | 62.1% | |
Nasdaq Nordic and Nasdaq Baltic securities | |||
Average daily number of equity trades executed on Nasdaq’s exchanges | 773,062 | 796,426 | |
Total average daily value of shares traded (in billions) | $6.5 | $5.5 | |
Total market share executed on Nasdaq’s exchanges | 74.4% | 71.2% | |
Cash equity trading revenues and cash equity trading
revenues, net increased for the three and six months ended
June 30, 2026, compared with the same periods in 2025,
primarily due to higher U.S. industry trading volumes, higher
U.S. and European matched market share executed on
Nasdaq's exchanges, and higher European trading volumes.
For the six months ended June 30, 2026, higher capture also
contributed to the increase in cash equity trading revenues as
compared to the prior period.
35
Transaction rebates, in which we credit a portion of the
execution charge to the market participant, increased for the
three and six months ended June 30, 2026, compared with the
same periods in 2025, primarily due to higher industry
trading volumes and higher U.S. matched market share
executed on Nasdaq’s exchanges. The increase for the six
months ended June 30, 2026 is also driven by a higher rebate
capture rate. For The Nasdaq Stock Market and Nasdaq PSX,
we credit a portion of the per share execution charge to the
market participant that provides the liquidity, and for Nasdaq
Texas, we credit a portion of the per share execution charge
to the market participant that takes the liquidity.
U.S. Tape Plans
The following tables present revenues from our U.S. Tape
plans business:
Three Months Ended June 30, | Percentage Change | ||||
2026 | 2025 | ||||
(in millions) | |||||
U.S. Tape plans | $33 | $37 | (10.7)% | ||
Six Months Ended June 30, | Percentage Change | ||||
2026 | 2025 | ||||
(in millions) | |||||
U.S. Tape plans | $66 | $70 | (5.0)% | ||
U.S. Tape plans revenues decreased for the three and six
months ended June 30, 2026, compared with the same
periods in 2025, primarily due to lower audit revenues as
compared to the three and six months ended June 30, 2025,
which included an industry-wide adjustment.
Other
Other includes Nordic fixed income trading and clearing,
Nordic derivatives and Canadian cash equities trading. The
following tables present revenues from our Other business:
Three Months Ended June 30, | Percentage Change | ||||
2026 | 2025 | ||||
(in millions) | |||||
Other | $24 | $20 | 18.3% | ||
Six Months Ended June 30, | Percentage Change | ||||
2026 | 2025 | ||||
(in millions) | |||||
Other | $50 | $40 | 24.5% | ||
In the preceding tables, Other is presented net of Canadian
cash equity transaction rebates of $7 million for both the
three months ended June 30, 2026 and 2025, and $16 million
and $13 million for the six months ended June 30, 2026 and
2025, respectively.
Other revenues increased for the three and six months ended
June 30, 2026, compared with the same periods in 2025,
primarily due to an increase in Nordic fixed income revenues.
The increase for the six months ended June 30, 2026,
compared with the same period in 2025, was also due to an
increase in Nordic equity derivatives revenues and Canadian
cash equity revenues.
Other Revenues
For the six months ended June 30, 2026, Other revenues
related to our Nordic power futures business. For the three
and six months ended June 30, 2025, Other revenues also
included our Solovis business. See Note 4, “Divestitures,” to
the condensed consolidated financial statements for further
discussion.
36
EXPENSES
Operating Expenses
The following tables present our operating expenses:
Three Months Ended June 30, | Percentage Change | ||||
2026 | 2025 | ||||
(in millions) | |||||
Compensation and benefits | $383 | $352 | 8.8% | ||
Professional and contract services | 42 | 39 | 10.5% | ||
Technology and communication infrastructure | 88 | 79 | 11.6% | ||
Occupancy | 35 | 30 | 20.1% | ||
General, administrative and other | 23 | 23 | (1.9)% | ||
Marketing and advertising | 24 | 14 | 69.4% | ||
Depreciation and amortization | 165 | 158 | 5.0% | ||
Regulatory | 9 | 14 | (35.4)% | ||
Merger and strategic initiatives | 5 | 20 | (76.5)% | ||
Restructuring charges | 14 | 9 | 48.0% | ||
Total operating expenses | $788 | $738 | 6.9% | ||
Six Months Ended June 30, | Percentage Change | ||||
2026 | 2025 | ||||
(in millions) | |||||
Compensation and benefits | $739 | $681 | 8.6% | ||
Professional and contract services | 82 | 75 | 9.5% | ||
Technology and communication infrastructure | 171 | 156 | 9.8% | ||
Occupancy | 68 | 58 | 18.0% | ||
General, administrative and other | 52 | 29 | 79.7% | ||
Marketing and advertising | 44 | 28 | 55.5% | ||
Depreciation and amortization | 331 | 313 | 5.5% | ||
Regulatory | 19 | 29 | (35.5)% | ||
Merger and strategic initiatives | 9 | 44 | (80.9)% | ||
Restructuring charges | 24 | 15 | 68.6% | ||
Total operating expenses | $1,539 | $1,428 | 7.8% | ||
The increase in compensation and benefits expense for the
three and six months ended June 30, 2026, compared with the
same periods in 2025, was primarily driven by increased
headcount and higher incentive compensation driven by our
performance.
Headcount, including employees of non-wholly owned
consolidated subsidiaries, increased to 9,630 employees as of
June 30, 2026 from 9,492 employees as of June 30, 2025, as
we support revenue growth and innovation.
Professional and contract services expense increased for the
three and six months ended June 30, 2026, compared with the
same periods in 2025, primarily due to higher legal fee
accruals.
Technology and communication infrastructure expense
increased for the three and six months ended June 30, 2026,
compared with the same periods in 2025, primarily due to
increased investment in technology, particularly our cloud
initiatives and software licensing.
Occupancy expense increased for the three and six months
ended June 30, 2026, compared with the same periods in
2025, primarily due to colocation data center expansion.
General, administrative and other expense remained
relatively flat for the three months ended June 30, 2026,
compared with the same period in 2025. The increase for the
six months ended June 30, 2026 compared with the same
period in 2025 was primarily due to a gain on extinguishment
of debt recorded in the first quarter of 2025.
Marketing and advertising expense increased for the three
and six months ended June 30, 2026, compared with the
same periods in 2025, primarily due to a strengthening IPO
environment.
Depreciation and amortization expense increased for the
three and six months ended June 30, 2026, compared with the
same periods in 2025, due to increased depreciation of
capitalized software projects.
Regulatory expense decreased for the three and six months
ended June 30, 2026, compared with the same periods in
2025, primarily due to lower CAT operating costs.
We have pursued various strategic initiatives and completed
acquisitions and divestitures in recent years, which have
resulted in expenses which would not have otherwise been
incurred. These expenses generally include integration costs,
as well as legal, due diligence and other third-party
transaction costs and vary based on the size and frequency of
the activities described above. For the three and six months
ended June 30, 2026, these costs included amounts associated
with various strategic initiative costs. For the three and six
months ended June 30, 2025, these costs primarily included
amounts associated with the transfer of open positions in our
Nordic power futures business, Adenza integration costs and
other strategic initiative costs.
Restructuring charges increased for the three and six months
of June 30, 2026, compared with the same periods in 2025,
primarily due to the higher consulting and other services,
partially offset by lower employee-related costs in relation to
our Adenza restructuring program. See Note 19,
“Restructuring Charges,” to the condensed consolidated
financial statements for further discussion.
37
Non-Operating Income and Expenses
The following tables present our non-operating income and
expenses:
Three Months Ended June 30, | Percentage Change | ||||
2026 | 2025 | ||||
(in millions) | |||||
Interest income | $8 | $12 | (37.7)% | ||
Interest expense | (86) | (95) | (9.4)% | ||
Net interest expense | (78) | (83) | (5.2)% | ||
Net gain on divestitures | — | 39 | (100.0)% | ||
Other income (losses) | (2) | 1 | (174.6)% | ||
Net income from unconsolidated investees | 21 | 23 | (6.1)% | ||
Total non-operating expense | $(59) | $(20) | 191.6% | ||
Six Months Ended June 30, | Percentage Change | ||||
2026 | 2025 | ||||
(in millions) | |||||
Interest income | $13 | $24 | (42.8)% | ||
Interest expense | (172) | (192) | (9.7)% | ||
Net interest expense | (159) | (168) | (5.1)% | ||
Net gain on divestitures | 89 | 39 | 127.7% | ||
Other income (losses) | (15) | — | N/M | ||
Net income from unconsolidated investees | 47 | 50 | (4.5)% | ||
Total non-operating expense | $(38) | $(79) | (51.5)% | ||
________
N/M Not meaningful
The following tables present our interest expense:
Three Months Ended June 30, | Percentage Change | ||||
2026 | 2025 | ||||
(in millions) | |||||
Interest expense on debt | $83 | $92 | (9.5)% | ||
Accretion of debt issuance costs and debt discount | 2 | 2 | (6.1)% | ||
Other fees | 1 | 1 | (2.7)% | ||
Interest expense | $86 | $95 | (9.4)% | ||
Six Months Ended June 30, | Percentage Change | ||||
2026 | 2025 | ||||
(in millions) | |||||
Interest expense on debt | $166 | $185 | (9.7)% | ||
Accretion of debt issuance costs and debt discount | 5 | 6 | (10.0)% | ||
Other fees | 1 | 1 | (6.8)% | ||
Interest expense | $172 | $192 | (9.7)% | ||
Interest income decreased for the three and six months ended
June 30, 2026, compared with the same periods in 2025,
primarily due to a lower average cash balance.
Interest expense decreased for the three and six months ended
June 30, 2026, compared with the same periods in 2025,
primarily due to lower outstanding debt following the
repayment of our 2025 Notes and the partial repurchases of
several series of outstanding senior unsecured notes in 2025.
Net gains on divestitures for the six months ended June 30,
2026 primarily relates to the divestiture of our Nordic power
futures business, net of costs to sell. Net gains on divestitures
for the three and six months ended June 30, 2025 relates to
the divestitures of our Nordic power futures business and our
Nasdaq Risk Modelling for Catastrophes business, net of
costs to sell. See Note 4, “Divestitures,” to the condensed
consolidated financial statements for further discussion of
these transactions.
Other income (losses) primarily represents realized and
unrealized gains and losses from strategic investments related
to our corporate venture program. For the three and six
months ended June 30, 2026, this also includes the
impairment of intangible assets related to customer
relationships and licenses associated with the wind-down of
our Nordic power futures business. See “Acquired Intangible
Assets,” of Note 5, “Goodwill and Acquired Intangible
Assets,” and “Equity Securities,” of Note 6, “Investments,” to
the condensed consolidated financial statements for further
discussion of these transactions.
Net income from unconsolidated investees primarily relates
to income recognized from our equity method investment in
OCC. See “Equity Method Investments,” of Note 6,
“Investments,” to the condensed consolidated financial
statements for further discussion.
Tax Matters
The following tables present our income tax provision and
effective tax rate:
Three Months Ended June 30, | Percentage Change | ||||
2026 | 2025 | ||||
($ in millions) | |||||
Income tax provision | $146 | $96 | 51.6% | ||
Effective tax rate | 22.4% | 17.5% | |||
Six Months Ended June 30, | Percentage Change | ||||
2026 | 2025 | ||||
(in millions) | |||||
Income tax provision | $305 | $190 | 60.4% | ||
Effective tax rate | 22.9% | 18.3% | |||
For further discussion of our tax matters, see Note 16,
“Income Taxes,” to the condensed consolidated financial
statements.
38
NON-GAAP FINANCIAL MEASURES
In addition to disclosing results determined in accordance
with U.S. GAAP, we also provide non-GAAP net income
and non-GAAP diluted earnings per share in this Quarterly
Report on Form 10-Q. Management uses this non-GAAP
information internally, along with U.S. GAAP information,
in evaluating our performance and in making financial and
operational decisions. We believe our presentation of these
measures provides investors with greater transparency and
supplemental data relating to our financial condition and
results of operations. In addition, we believe the presentation
of these measures is useful to investors for period-to-period
comparisons of our ongoing operating performance.
These measures are not in accordance with, or an alternative
to, U.S. GAAP, and may be different from non-GAAP
measures used by other companies. In addition, other
companies, including companies in our industry, may
calculate such measures differently, which reduces their
usefulness as comparative measures. Investors should not
rely on any single financial measure when evaluating our
business. This non-GAAP information should be considered
as supplemental in nature and is not meant as a substitute for
our operating results in accordance with U.S. GAAP. We
recommend investors review the U.S. GAAP financial
measures included in this Quarterly Report on Form 10-Q,
including our condensed consolidated financial statements
and the notes thereto. When viewed in conjunction with our
U.S. GAAP results and the accompanying reconciliation, we
believe these non-GAAP measures provide greater
transparency and a more complete understanding of factors
affecting our business than U.S. GAAP measures alone.
We understand that analysts and investors regularly rely on
non-GAAP financial measures, such as non-GAAP net
income and non-GAAP diluted earnings per share, to assess
operating performance. We use non-GAAP net income and
non-GAAP diluted earnings per share because they highlight
trends more clearly in our business that may not otherwise be
apparent when relying solely on U.S. GAAP financial
measures, since these measures eliminate from our results
specific financial items that have less bearing on our ongoing
operating performance.
The following tables present reconciliations between U.S.
GAAP net income and diluted earnings per share and non-
GAAP net income and diluted earnings per share:
Three Months Ended June 30, | |||
2026 | 2025 | ||
(in millions, except per share amounts) | |||
U.S. GAAP net income | $507 | $452 | |
Non-GAAP adjustments: | |||
Amortization expense of acquired intangible assets | 121 | 122 | |
Merger and strategic initiatives expense | 5 | 20 | |
Restructuring charges | 14 | 9 | |
Net gain on divestitures | — | (39) | |
Net income from unconsolidated investees | (21) | (23) | |
Legal and regulatory matters | 6 | 1 | |
Other loss | 6 | 1 | |
Total non-GAAP adjustments | $131 | $91 | |
Non-GAAP tax adjustments | (33) | (24) | |
Other tax adjustments | — | (27) | |
Total non-GAAP adjustments, net of tax | $98 | $40 | |
Non-GAAP net income | $605 | $492 | |
U.S. GAAP effective tax rate | 22.4% | 17.5% | |
Total adjustments from non- GAAP tax rate | 0.4% | 5.5% | |
Non-GAAP effective tax rate | 22.8% | 23.0% | |
Weighted-average common shares outstanding for diluted earnings per share | 567.8 | 579.0 | |
U.S. GAAP diluted earnings per share | $0.89 | $0.78 | |
Total adjustments from non- GAAP net income | 0.18 | 0.07 | |
Non-GAAP diluted earnings per share | $1.07 | $0.85 | |
39
Six Months Ended June 30, | |||
2026 | 2025 | ||
(in millions, except per share amounts) | |||
U.S. GAAP net income | $1,026 | $847 | |
Non-GAAP adjustments: | |||
Amortization expense of acquired intangible assets | 243 | 243 | |
Merger and strategic initiatives expense | 9 | 44 | |
Restructuring charges | 24 | 15 | |
Gain on extinguishment of debt | — | (19) | |
Net gain on divestitures | (89) | (39) | |
Net income from unconsolidated investees | (47) | (50) | |
Legal and regulatory matters | 12 | 4 | |
Other loss | 20 | 1 | |
Total non-GAAP adjustments | $172 | $199 | |
Non-GAAP tax adjustments | (44) | (52) | |
Other tax adjustments | — | (45) | |
Total non-GAAP adjustments, net of tax | $128 | $102 | |
Non-GAAP net income | $1,154 | $949 | |
U.S. GAAP effective tax rate | 22.9% | 18.3% | |
Total adjustments from non- GAAP tax rate | 0.3% | 4.9% | |
Non-GAAP effective tax rate | 23.2% | 23.2% | |
Weighted-average common shares outstanding for diluted earnings per share | 569.7 | 579.5 | |
U.S. GAAP diluted earnings per share | $1.80 | $1.46 | |
Total adjustments from non- GAAP net income | 0.23 | 0.18 | |
Non-GAAP diluted earnings per share | $2.03 | $1.64 | |
We believe that excluding the above items, described further
below, from the non-GAAP net income provides a more
meaningful analysis of Nasdaq’s ongoing operating
performance and comparisons in Nasdaq’s performance
between periods:
•Amortization expense of acquired intangible assets: We
amortize intangible assets acquired in connection with
various acquisitions. Intangible asset amortization expense
can vary from period to period due to episodic acquisitions
completed, rather than from our ongoing business
operations. As such, if intangible asset amortization is
included in performance measures, it is more difficult to
assess the day-to-day operating performance of the
businesses and the relative operating performance of the
businesses between periods.
•Merger and strategic initiatives expense: We have pursued
various strategic initiatives and completed acquisitions and
divestitures in recent years that have resulted in expenses
which would not have otherwise been incurred. The
frequency and the amount of such expenses vary
significantly based on the size, timing and complexity of
the transactions. These expenses primarily include
integration costs, as well as legal, due diligence and other
third-party transaction costs. For the three and six months
ended June 30, 2026, these costs included amounts
associated with various strategic initiative costs. For the
three and six months ended June 30, 2025, these costs
primarily included amounts associated with the transfer of
open positions in our Nordic power futures business,
Adenza integration costs and other strategic initiative costs.
•Restructuring charges: See Note 19, “Restructuring
Charges,” to the condensed consolidated financial
statements for further discussion of this program.
•Gain on extinguishment of debt: This gain is recorded in
general, administrative and other expense in the Condensed
Consolidated Statements of Income.
•Net gain on divestitures: For the six months ended June 30,
2026, this primarily includes the recognition of an
incremental gain on the sale of our Nordic power futures
business, net of costs to sell. For the three and six months
ended June 30, 2025, this includes gains on divestitures of
our Nordic power futures business and our Nasdaq Risk
Modelling for Catastrophes business, net of costs to sell.
See Note 4, “Divestitures,” to the condensed consolidated
financial statements for further discussion of these
transactions.
•Net income from unconsolidated investees: We exclude our
share of the earnings and losses of our equity method
investments. This provides a more meaningful analysis of
Nasdaq’s ongoing operating performance or comparisons
in Nasdaq’s performance between periods. See “Equity
Method Investments,” of Note 6, “Investments,” to the
condensed consolidated financial statements for further
discussion.
•Legal and regulatory matters: For the three and six months
ended June 30, 2026 and 2025, this includes accruals
relating to certain legal matters, which are recorded in
professional and contract services in the Condensed
Consolidated Statements of Income.
•Other loss: For the three and six months ended June 30,
2026 and 2025, other items primarily include net gains and
losses from strategic investments entered into through our
corporate venture program. For the three and six months
ended June 30, 2026, this also includes intangible assets
impairments of customer relationships and licenses relating
to the wind-down of our Nordic power futures business.
The net effect of these items is included in other income
(losses) in our Condensed Consolidated Statements of
Income. See “Acquired Intangible Assets,” of Note 5,
“Goodwill and Acquired Intangible Assets,” and “Equity
40
Securities,” of Note 6, “Investments,” to the condensed
consolidated financial statements for further discussion of
these transactions.
•Non-GAAP tax adjustments: The non-GAAP adjustment to
the income tax provision for all periods primarily includes
the tax impact of each non-GAAP adjustment.
•Other tax adjustments: For the three and six months ended
June 30, 2025, other tax adjustments reflect a tax benefit
related to payments made to certain former Adenza
employees. For the six months ended June 30, 2025, this
also reflects the release of the prior years' reserves
following a favorable audit settlement.
LIQUIDITY AND CAPITAL RESOURCES
Historically, we have funded our operating activities and met
our commitments through cash generated by operations,
augmented by the periodic issuance of debt. Currently, our
cost and availability of funding remain healthy. We continue
to prudently assess our capital deployment strategy through
balancing internal investments, debt repayments, and
shareholder return activity, including dividends and share
repurchases, and potential acquisitions.
We expect that our current cash and cash equivalents
combined with cash flows provided by operating activities,
supplemented with our borrowing capacity and access to
additional financing, including our revolving credit facility
and our commercial paper program, provides us additional
flexibility to meet our ongoing obligations and the capital
deployment strategic actions described above, while allowing
us to invest in activities and product development that
support the long-term growth of our operations.
Principal factors that could affect the availability of our
internally generated funds include:
•deterioration of our revenues in any of our business
segments;
•changes in regulatory and working capital requirements;
and
•an increase in our expenses.
Principal factors that could affect our ability to obtain cash
from external sources include:
•operating covenants contained in our credit facilities that
limit our total borrowing capacity;
•credit rating downgrades, which could limit our access to
additional debt;
•a significant decrease in the market price of our common
stock; and
•volatility or disruption in the public debt and equity
markets.
The following table summarizes selected measures of our
liquidity and capital resources:
June 30, 2026 | December 31, 2025 | |||
(in millions) | ||||
Working capital | $28 | $42 | ||
Cash and cash equivalents | 520 | 604 | ||
Financial investments | 198 | 28 | ||
Working Capital
The decrease in working capital from December 31, 2025 to
June 30, 2026, excluding default funds and margin deposits,
as the corresponding assets and liabilities are both equal and
offsetting, is primarily due to an increase in current liabilities
partially offset by an increase in current assets.
Increased current liabilities were primarily due to:
•increased Section 31 fees payable due to an increase in the
Section 31 fee rate and timing of payment, and
•higher deferred revenue due to timing of billings, primarily
relating to our annual listing fees; partially offset by
•a decrease in short-term debt, see “Debt obligations” below
for further discussion,
•a decrease in accrued personnel costs,
•a decrease in other current liabilities, and
•a decrease in accounts payable and accrued expenses.
Increased current assets were primarily due to:
•higher receivables, net primarily due to an increase in
Section 31 fee rate and due to timing of billings, and
•an increase in financial investments at fair value, partially
offset by
•lower restricted cash primarily due to the movement of
regulatory capital to longer-term investments classified as
financial investments,
•lower other current assets, and
•lower cash and cash equivalents.
Cash and Cash Equivalents
Cash and cash equivalents includes all non-restricted cash in
banks and highly liquid investments with original maturities
of 90 days or less at the time of purchase. The balance
retained in cash and cash equivalents is a function of
anticipated or possible short-term cash needs, prevailing
interest rates, our investment policy, and alternative
investment choices. As of June 30, 2026 and December 31,
2025, our cash and cash equivalents of $520 million and
$604 million, respectively, were primarily invested in money
market funds and bank deposits.
Repatriation of Cash
Our cash and cash equivalents held outside of the U.S. in
various foreign subsidiaries totaled $199 million as of June
30, 2026 and $280 million as of December 31, 2025. The
remaining balance held in the U.S. totaled $321 million as of
June 30, 2026 and $324 million as of December 31, 2025.
41
Restricted Cash and Cash Equivalents
Restricted cash and cash equivalents, which was $26 million
as of June 30, 2026 and $210 million as of December 31,
2025, is restricted from withdrawal due to a contractual or
regulatory requirement or not available for general use and as
such is classified as restricted in the Condensed Consolidated
Balance Sheets. The decrease in this balance as of June 30,
2026 is primarily due to more regulatory capital being
invested in longer term investments, which are classified as
financial investments in the Condensed Consolidated Balance
Sheets as of June 30, 2026. Capital held for regulatory
purposes is invested based on prevailing market rates and our
investment strategy and may be held in shorter term
investments, which meet the criteria to be classified as cash
equivalents, and would then be included in restricted cash
and cash equivalents or longer term investments which would
be classified as financial investments in the Condensed
Consolidated Balance Sheets.
Cash Flow Analysis
The following table summarizes the changes in cash flows:
Six Months Ended June 30, | |||
2026 | 2025 | ||
Net cash provided by (used in): | (in millions) | ||
Operating activities | $1,400 | $1,409 | |
Investing activities | 301 | (317) | |
Financing activities | (4,767) | (2,545) | |
Net Cash Provided by Operating Activities
Net cash provided by operating activities primarily consists
of net income adjusted for certain non-cash items, including,
but not limited to, depreciation and amortization expense,
expense associated with share-based compensation, net
income from unconsolidated investees, net gain on
divestitures and the effects of changes in working capital.
Refer to the above discussion regarding changes in working
capital.
Net cash provided by operating activities decreased $9
million for the six months ended June 30, 2026 compared
with the same period in 2025. The decrease was primarily
driven by changes in working capital, as discussed above and
an increase in net gain on divestitures, partially offset by
higher net income and an increase in other adjustments to net
income.
Net Cash Provided by (Used in) Investing Activities
Net cash provided by (used in) investing activities increased
for the six months ended June 30, 2026 compared with the
same period in 2025. This was primarily driven by higher
proceeds from net sales and redemption of investments
related to default funds and margin deposits of $915 million,
which does not impact Nasdaq's cash, cash equivalents,
restricted cash or restricted cash equivalents as it relates to
customer funds. The increase is also driven by higher
proceeds from divestitures, net of cash divested of $37
million, partially offset by an increase in purchases of
securities of $299 million, primarily due to more regulatory
capital being invested in longer-term investments and
purchases of property and equipment of $29 million.
Net Cash Used in Financing Activities
Net cash used in financing activities increased for the six
months ended June 30, 2026 compared with the same period
in 2025 primarily driven by higher outflows of cash from the
default funds and margin deposits of $1,997 million, which
does not impact Nasdaq's cash, cash equivalents, restricted
cash or restricted cash equivalents as it relates to customer
funds, increases in repurchases of common stock of $688
million and an increase in dividends paid of $34 million.
These increases were partially offset by issuance of
commercial paper, net of $269 million and a decrease in
repayment of debt of $226 million.
See Note 8, “Debt Obligations,” to the condensed
consolidated financial statements for further discussion of our
debt obligations.
See “Default Fund Contributions and Margin Deposits” of
Note 14, “Clearing Operations,” for further discussion of
these balances.
See “Share Repurchase Program,” and “Cash Dividends on
Common Stock,” of Note 11, “Nasdaq Stockholders’
Equity,” to the condensed consolidated financial statements
for further discussion of our share repurchase program and
cash dividends declared and paid on our common stock.
Financial Investments
Our financial investments totaled $198 million as of June 30,
2026 and $28 million as of December 31, 2025. Of these
securities, $163 million as of June 30, 2026 and $18 million
as of December 31, 2025 are assets primarily utilized to meet
regulatory capital requirements, mainly for our clearing
operations at Nasdaq Clearing. See Restricted Cash and Cash
Equivalents above and Note 6, “Investments,” to the
condensed consolidated financial statements for further
discussion.
Regulatory Capital Requirements
Clearing Operations Regulatory Capital Requirements
We are required to maintain minimum levels of regulatory
capital for the clearing operations of Nasdaq Clearing. The
level of regulatory capital required to be maintained is
dependent upon many factors, including market conditions
and creditworthiness of the counterparty. As of June 30,
2026, our required regulatory capital of $131 million was
primarily comprised of European government debt securities
that are included in financial investments in the Condensed
Consolidated Balance Sheets.
Broker-Dealer Net Capital Requirements
Our broker-dealer subsidiaries, Nasdaq Execution Services,
NFSTX, LLC, and Nasdaq Capital Markets Advisory, are
subject to regulatory requirements intended to ensure their
general financial soundness and liquidity. These requirements
obligate these subsidiaries to comply with minimum net
capital requirements. As of June 30, 2026, the combined
42
required minimum net capital totaled $1 million and the
combined excess capital totaled $18 million, substantially all
of which is held in cash and cash equivalents in the
Condensed Consolidated Balance Sheets. The required
minimum net capital is included in restricted cash and cash
equivalents in the Condensed Consolidated Balance Sheets.
Nordic and Baltic Exchange Regulatory Capital
Requirements
The entities that operate trading venues in the Nordic and
Baltic countries are each subject to local regulations and are
required to maintain regulatory capital intended to ensure
their general financial soundness and liquidity. As of June 30,
2026, our required regulatory capital of $41 million was
primarily invested in European government debt securities
that are included in financial investments in the Condensed
Consolidated Balance Sheets and cash and cash equivalents,
which is included in restricted cash and cash equivalents in
the Condensed Consolidated Balance Sheets.
Other Capital Requirements
We operate several other businesses which are subject to
local regulation and are required to maintain certain levels of
regulatory capital. As of June 30, 2026, other required
regulatory capital of $13 million, primarily related to Nasdaq
Central Securities Depository, was primarily invested in
European government debt securities that are included in
financial investments in the Condensed Consolidated Balance
Sheets and cash and cash equivalents, which is included in
restricted cash and cash equivalents in the Condensed
Consolidated Balance Sheets.
Equity and dividends
Share Repurchase Program
See “Share Repurchase Program,” of Note 11, “Nasdaq
Stockholders’ Equity,” to the condensed consolidated
financial statements for further discussion of our share
repurchase program, including our ASR agreements.
Cash Dividends on Common Stock
The following table presents our quarterly cash dividends
paid per common share on our outstanding common stock:
2026 | 2025 | ||
First quarter | $0.27 | $0.24 | |
Second quarter | 0.31 | 0.27 | |
Total | $0.58 | $0.51 |
See “Cash Dividends on Common Stock,” of Note 11,
“Nasdaq Stockholders’ Equity,” to the condensed
consolidated financial statements for further discussion of the
dividends.
Debt Obligations
Our outstanding debt obligations, by contractual maturity, at June 30, 2026 are as follows (in U.S. Dollar millions):
n U.S. Notes n Euro Notes
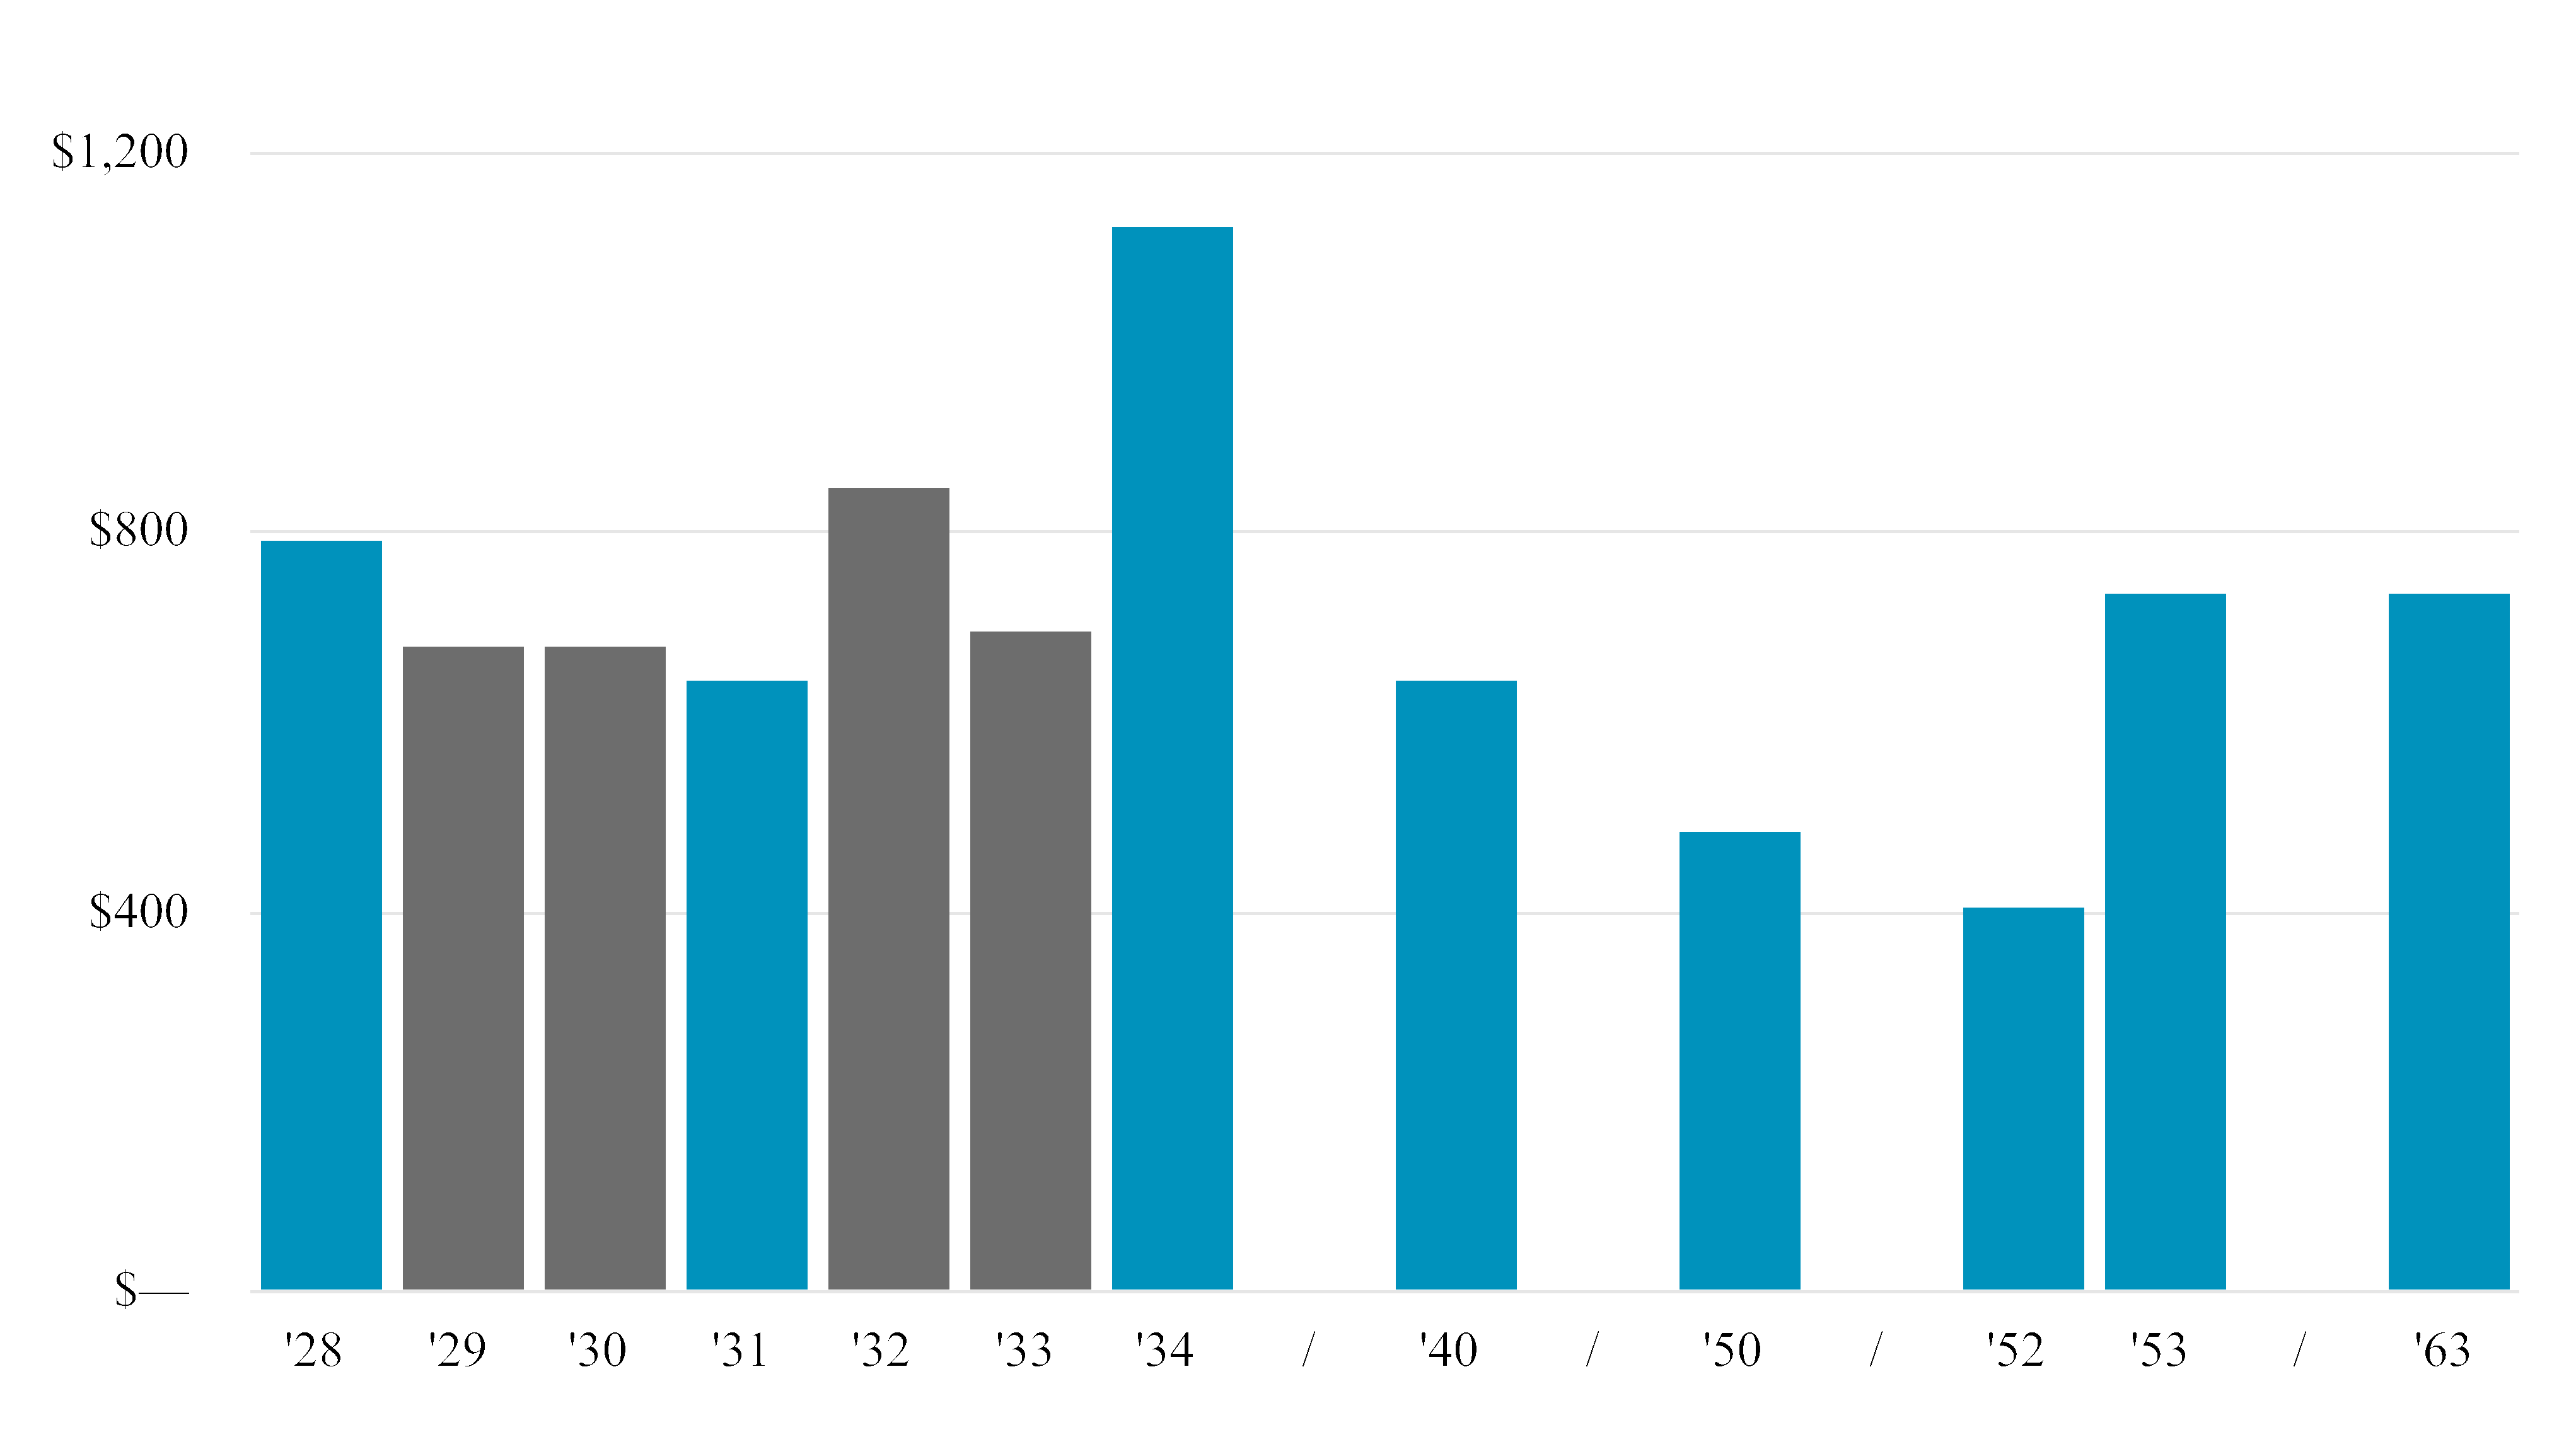
43
As of and for the six months ended June 30, 2026, the
weighted average interest rate on our debt obligations was
approximately 3.7%. This rate can fluctuate based on changes
in foreign currency exchange rates and changes in the amount
and duration of outstanding debt. See “Foreign Currency
Exchange Rate Risk” below for further discussion on
hedging associated with our Euro Notes. In June 2026,
Nasdaq amended and restated our existing $1.25 billion five-
year revolving credit facility, with a new maturity date of
June 30, 2031, and increased the borrowing capacity to
$1.50 billion. In addition to the 2026 Revolving Credit
Facility, we also have other credit facilities primarily to
support our Nasdaq Clearing operations in Europe, as well as
to provide a cash pool credit line.
As of June 30, 2026, we were in compliance with the
covenants of all of our debt obligations.
See Note 8, “Debt Obligations,” to the condensed
consolidated financial statements for further discussion of our
debt obligations.
Contractual Obligations and Contingent Commitments
Nasdaq had no significant changes to our contractual
obligations and contingent commitments from those
disclosed in “Part I. Item 7. Management’s Discussion and
Analysis of Financial Condition and Results of Operations”
in our Annual Report on Form 10-K that was filed with the
SEC on February 12, 2026.
OFF-BALANCE SHEET ARRANGEMENTS
For discussion of off-balance sheet arrangements see:
•Note 14, “Clearing Operations,” to the condensed
consolidated financial statements for further discussion of
our non-cash default fund contributions and margin
deposits received for clearing operations; and
•Note 17, “Commitments, Contingencies and Guarantees,”
to the condensed consolidated financial statements for
further discussion of:
◦Guarantees issued and credit facilities available;
◦Other guarantees; and
◦Routing brokerage activities.
Item 3. Quantitative And Qualitative Disclosures About
Market Risk
As a result of our operating, investing and financing
activities, we are exposed to market risks such as interest rate
risk and foreign currency exchange rate risk. We are also
exposed to credit risk as a result of our normal business
activities.
We have implemented policies and procedures to measure,
manage, monitor and report risk exposures, which are
reviewed regularly by management and the board of
directors. We identify risk exposures and monitor and
manage such risks on a daily basis.
We perform sensitivity analyses to determine the effects of
market risk exposures. We may use derivative instruments
solely to hedge financial risks related to our financial
positions or risks that are incurred during the normal course
of business. We do not use derivative instruments for
speculative purposes.
Interest Rate Risk
We are subject to the risk of fluctuating interest rates in the
normal course of business. Our exposure to market risk for
changes in interest rates relates primarily to our financial
investments and debt obligations, which are discussed below.
We may enter into transactions that expose us to interest rate
risk, for which we may utilize interest rate derivatives
agreements to manage that risk.
Financial Investments
As of June 30, 2026, our investment portfolio was primarily
comprised of highly rated European government debt
securities, which pay a fixed rate of interest. These securities
are subject to interest rate risk and the fair value of these
securities will decrease if market interest rates increase. The
impact of an immediate increase to market interest rates,
uniformly, by a hypothetical 100 basis points from levels as
of June 30, 2026, would not have a material impact on our
financial statements.
Debt Obligations
As of June 30, 2026, the majority of our outstanding debt
obligations are fixed-rate obligations. Interest rates on certain
tranches of notes are subject to adjustment to the extent our
debt rating is downgraded below investment grade, as further
discussed in Note 8, “Debt Obligations,” to the condensed
consolidated financial statements. While changes in interest
rates will have no impact on the interest we pay on fixed-rate
obligations, we are exposed to changes in interest rates as a
result of the borrowings under our 2026 Revolving Credit
Facility, as this facility has a variable interest rate. We may
also be exposed to changes in interest rates if there are
amounts outstanding from the sale of commercial paper
under our commercial paper program, which have variable
interest rates. As of June 30, 2026, we have $269 million
outstanding under our commercial paper program. A
hypothetical 100 basis points increase in interest rates on our
outstanding commercial paper would not have a material
impact on our financial statements.
Foreign Currency Exchange Rate Risk
We are subject to foreign currency exchange rate risk. Our
primary transactional exposure to foreign currency
denominated revenues less transaction-based expenses and
operating income for the three and six months ended June 30,
2026 is presented in the following tables. The tables below
do not include the offsetting impact of our hedging programs.
44
Euro | Swedish Krona | Canadian Dollar | Other Foreign Currencies | U.S. Dollar | |
(in millions, except currency rate) | |||||
Three Months Ended June 30, 2026 | |||||
Average FX rate to the U.S. dollar | 1.162 | 0.107 | 0.722 | # | N/A |
Percentage of revenues less transaction- based expenses | 8.3% | 3.3% | 0.7% | 3.1% | 84.6% |
Percentage of operating income | 12.3% | (2.4)% | (5.4)% | (7.8)% | 103.3% |
Impact of a 10% adverse currency fluctuation on revenues less transaction- based expenses | $(12) | $(5) | $(1) | $(5) | $— |
Impact of a 10% adverse currency fluctuation on operating income | $(9) | $(2) | $(4) | $(6) | $— |
Euro | Swedish Krona | Canadian Dollar | Other Foreign Currencies | U.S. Dollar | |
(in millions, except currency rate) | |||||
Six Months Ended June 30, 2026 | |||||
Average FX rate to the U.S. dollar | 1.167 | 0.108 | 0.726 | # | N/A |
Percentage of revenues less transaction- based expenses | 7.7% | 3.5% | 0.7% | 3.5% | 84.6% |
Percentage of operating income | 10.9% | (2.0)% | (5.5)% | (7.1)% | 103.7% |
Impact of a 10% adverse currency fluctuation on revenues less transaction- based expenses | $(22) | $(10) | $(2) | $(10) | $— |
Impact of a 10% adverse currency fluctuation on operating income | $(15) | $(3) | $(8) | $(10) | $— |
__________
#Represents multiple foreign currency rates.
N/ANot applicable.
The adverse impacts shown in the preceding tables should be
viewed individually by currency and not in aggregate, due to
the correlation between changes in exchange rates for certain
currencies.
We may use foreign exchange contracts to hedge a portion of
our forecasted foreign currency denominated revenues and
expenses in the normal course of business. We hedge these
cash flow exposures to reduce the risk that our earnings and
cash flows will be adversely affected by changes in exchange
rates. These foreign exchange contracts are carried at fair
value, with maturities that can range up to 18 months. We
record changes in fair value of these cash flow hedges of
foreign currency denominated revenue and expenses in
accumulated other comprehensive loss in the Condensed
Consolidated Balance Sheets, until the forecasted transaction
occurs. When the forecasted transaction affects earnings, or
in the event the underlying forecasted transaction does not
occur, or it becomes probable that it will not occur, we
reclassify the related gain or loss on the cash flow hedge to
revenue or operating expenses, as applicable. As of June 30,
2026, the fair value of our derivatives designated as cash
flow hedging instruments are not material.
Our investments in foreign subsidiaries are exposed to
volatility in currency exchange rates through translation of
the foreign subsidiaries’ net assets or equity to U.S. dollars.
Substantially all of our foreign subsidiaries operate in
functional currencies other than the U.S. dollar. The financial
statements of these subsidiaries are translated into U.S.
dollars for consolidated reporting using a current rate of
exchange, with net gains or losses recorded in accumulated
other comprehensive loss in the Condensed Consolidated
Balance Sheets.
Our primary exposure to net assets in foreign currencies as of
June 30, 2026 is presented in the following table:
Net Assets | Impact of a 10% Adverse Currency Fluctuation | |||
(in millions) | ||||
Swedish Krona | $3,146 | $(315) | ||
Canadian Dollar | 146 | (15) | ||
Norwegian Krone | 102 | (10) | ||
Australian Dollar | 91 | (9) | ||
British Pound | 78 | (8) | ||
In the table above, Swedish Krona includes goodwill of
$2,362 million and intangible assets, net of $477 million.
Our Euro Notes have been designated as a hedge of our net
investment in certain foreign subsidiaries to mitigate the
foreign exchange risk associated with certain investments in
these subsidiaries. Accordingly, the remeasurement of these
notes is recorded in accumulated other comprehensive loss in
the Condensed Consolidated Balance Sheets. See Note 8,
“Debt Obligations,” to the condensed consolidated financial
statements for further discussion. We enter into foreign
exchange contracts to hedge a portion of our net investment
in certain foreign subsidiaries. These foreign exchange
contracts are carried at fair value, with remaining maturities
ranging up to eight years, and reported as either an asset or
45
liability depending on their position as of the balance sheet
date, and accumulated other comprehensive loss in the
Condensed Consolidated Balance Sheets. The accumulated
gains and losses associated with these instruments will
remain in accumulated other comprehensive loss until the
foreign subsidiaries are sold or substantially liquidated, at
which point they will be reclassified into earnings.
Credit Risk
Credit risk is the potential loss due to the default or
deterioration in credit quality of customers or counterparties.
We are exposed to credit risk from third parties, including
customers, counterparties and clearing agents. These parties
may default on their obligations to us due to bankruptcy, lack
of liquidity, operational failure or other reasons. We limit our
exposure to credit risk by evaluating the counterparties with
which we make investments and execute agreements. For our
investment portfolio, our objective is to invest in securities to
preserve principal while maximizing yields, without
significantly increasing risk. Credit risk associated with
investments is minimized substantially by ensuring that these
financial assets are placed with governments which have
investment grade ratings, well-capitalized financial
institutions and other creditworthy counterparties.
Our subsidiary, Nasdaq Execution Services, may be exposed
to credit risk due to the default of trading counterparties in
connection with the routing services it provides for our
trading customers. System trades in cash equities routed to
other market centers for members of our cash equity
exchanges are routed by Nasdaq Execution Services for
clearing to the NSCC. In this function, Nasdaq Execution
Services is to be neutral by the end of the trading day, but
may be exposed to intraday risk if a trade extends beyond the
trading day and into the next day, thereby leaving Nasdaq
Execution Services susceptible to counterparty risk in the
period between accepting the trade and routing it to the
clearinghouse. In this interim period, Nasdaq Execution
Services is not novating like a clearing broker but instead is
subject to the short-term risk of counterparty failure before
the clearinghouse enters the transaction. Once the
clearinghouse officially accepts the trade for novation,
Nasdaq Execution Services is legally removed from trade
execution risk. However, Nasdaq has membership
obligations to NSCC independent of Nasdaq Execution
Services’ arrangements.
Pursuant to the rules of the NSCC and Nasdaq Execution
Services’ clearing agreement, Nasdaq Execution Services is
liable for any losses incurred due to a counterparty or a
clearing agent’s failure to satisfy its contractual obligations,
either by making payment or delivering securities. Adverse
movements in the prices of securities that are subject to these
transactions can increase our credit risk. However, we believe
that the risk of material loss is limited, as Nasdaq Execution
Services’ customers are not permitted to trade on margin and
NSCC rules limit counterparty risk on self-cleared
transactions by establishing credit limits and capital deposit
requirements for all brokers that clear with NSCC.
Historically, Nasdaq Execution Services has never incurred a
liability due to a customer’s failure to satisfy its contractual
obligations as counterparty to a system trade. Credit
difficulties or insolvency, or the perceived possibility of
credit difficulties or insolvency, of one or more larger or
visible market participants could also result in market-wide
credit difficulties or other market disruptions.
We have credit risk related to transaction and subscription-
based revenues that are billed to customers on a monthly or
quarterly basis, in arrears. Our potential exposure to credit
losses on these transactions is represented by the receivable
balances in the Condensed Consolidated Balance Sheets. We
review and evaluate changes in the status of our
counterparties’ creditworthiness. Credit losses such as those
described above could adversely affect our consolidated
financial position and results of operations.
We also are exposed to credit risk through our clearing
operations with Nasdaq Clearing. See Note 14, “Clearing
Operations,” to the condensed consolidated financial
statements for further discussion. Our clearinghouse holds
material amounts of clearing member cash deposits, which
are held or invested primarily to provide security of capital
while minimizing credit, market and liquidity risks. While we
seek to achieve a reasonable rate of return, we are primarily
concerned with preservation of capital and managing the
risks associated with these deposits. As the clearinghouse
may remit to the members interest earned at prevailing
market rates, less a spread, this could include negative or
reduced yield due to market conditions. The following is a
summary of the risks associated with these deposits and how
these risks are mitigated.
•Credit Risk: When the clearinghouse has the ability to hold
cash collateral at a central bank, the clearinghouse utilizes
its access to the central bank system to minimize credit risk
exposures. When funds are not held at a central bank, we
seek to substantially mitigate credit risk by ensuring that
investments are primarily placed in large, highly rated
financial institutions, highly rated government debt
instruments and other creditworthy counterparties.
•Liquidity Risk: Liquidity risk is the risk a clearinghouse
may not be able to meet its payment obligations in the right
currency, in the right place and the right time. To mitigate
this risk, the clearinghouse monitors liquidity requirements
closely and maintains funds and assets in a manner which
minimizes the risk of loss or delay in the access by the
clearinghouse to such funds and assets. For example,
holding funds with a central bank where possible or
investing in highly liquid government debt instruments
serves to reduce liquidity risks.
•Interest Rate Risk: Interest rate risk is the risk that interest
rates rise causing the value of purchased securities to
decline. If we were required to sell securities prior to
maturity, and interest rates had risen, the sale of the
securities might be made at a loss relative to the latest
market price. Our clearinghouse seeks to manage this risk
by making short-term investments of members’ cash
46
deposits. In addition, the clearinghouse investment
guidelines allow for direct purchases or repurchase
agreements with short dated maturities of high quality
sovereign debt (for example, European government and
U.S. Treasury securities), central bank certificates and
multilateral development bank debt instruments.
•Security Issuer Risk: Security issuer risk is the risk that an
issuer of a security defaults on its payment when the
security matures. This risk is mitigated by limiting
allowable investments and collateral under reverse
repurchase agreements to high quality sovereign,
government agency or multilateral development bank debt
instruments.
Item 4. Controls and Procedures
Disclosure Controls and Procedures
Nasdaq’s management, with the participation of Nasdaq’s
Chief Executive Officer, and Executive Vice President and
Chief Financial Officer, has evaluated the effectiveness of
Nasdaq’s disclosure controls and procedures (as defined in
Rule 13a-15(e) and Rule 15d-15(e) under the Exchange Act)
as of the end of the period covered by this report. Based upon
that evaluation, Nasdaq’s Chief Executive Officer and
Executive Vice President and Chief Financial Officer, have
concluded that, as of the end of such period, Nasdaq’s
disclosure controls and procedures are effective.
Changes in Internal Control Over Financial Reporting
There have been no changes in Nasdaq’s internal control over
financial reporting (as defined in Rule 13a-15(f) and Rule
15d-15(f) under the Exchange Act) that occurred during the
quarter ended June 30, 2026 that have materially affected, or
are reasonably likely to materially affect, Nasdaq’s internal
control over financial reporting.
PART II - OTHER INFORMATION
Item 1. Legal Proceedings
See “Legal and Regulatory Matters” of Note 17,
“Commitments, Contingencies and Guarantees,” to the
condensed consolidated financial statements for a description
of our legal proceedings, if any.
Item 1A. Risk Factors
In addition to the other information set forth in this Quarterly
Report on Form 10-Q, you should carefully consider the
factors discussed under “Risk Factors” in our most recent
Form 10-K. These risks could materially and adversely affect
our business, financial condition and results of operations.
These risks and uncertainties are not the only ones facing us.
Additional risks and uncertainties not presently known to us
or that we currently believe to be immaterial may also
adversely affect our business.
Item 2. Unregistered Sales of Equity Securities and Use of
Proceeds
Issuer Purchases of Equity Securities
Share Repurchase Program
See “Share Repurchase Program,” of Note 11, “Nasdaq
Stockholders’ Equity,” to the condensed consolidated
financial statements for further discussion of our share
repurchase program.
Purchases of Equity Securities by the Issuer and
Affiliated Purchasers
Under our board approved share repurchase program, we
may repurchase shares from time to time at prevailing market
prices in open market purchases, privately-negotiated
transactions, block purchases, an accelerated share
repurchase program or otherwise, as determined by our
management. As of June 30, 2026, the remaining aggregate
authorized amount under the existing share repurchase
program was $2.5 billion. The share repurchase program may
be suspended, modified or discontinued at any time, and has
no defined expiration date.
47
The table below represents repurchases made by or on behalf
of us or any “affiliated purchaser” of our common stock
during the fiscal quarter ended June 30, 2026:
Period | Total Number of Shares Purchased | Average Price Paid Per Share | Total Number of Shares Purchased as Part of Publicly Announced Plans or Programs | Maximum Dollar Value of Shares that May Yet Be Purchased Under the Plans or Programs (in millions) | ||||
April 2026 | ||||||||
Share repurchase program | 368,054 | $89.40 | 368,054 | $2,851 | ||||
Employee transactions | 429,824 | $85.48 | N/A | N/A | ||||
May 2026 | ||||||||
Share repurchase program | 1,775,498 | $90.53 | 1,775,498 | $2,691 | ||||
Employee transactions | 1,309 | $91.33 | N/A | N/A | ||||
June 2026 | ||||||||
Share repurchase program | 1,930,367 | $83.88 | 1,930,367 | $2,529 | ||||
Employee transactions | 1,141 | $83.34 | N/A | N/A | ||||
Total Quarter Ended June 30, 2026 | ||||||||
Share repurchase program | 4,073,919 | $87.28 | 4,073,919 | $2,529 | ||||
Employee transactions | 432,274 | $85.49 | N/A | N/A | ||||
In the table above:
•N/A - Not applicable.
•Employee transactions represents shares surrendered to us
to satisfy tax withholding obligations arising from the
vesting of restricted stock and PSUs previously issued to
employees.
•See “Share Repurchase Program,” of Note 11, “Nasdaq
Stockholders’ Equity,” to the condensed consolidated
financial statements for further discussion of our share
repurchase program.
Item 5. Other Information
During the three months ended June 30, 2026, none of the
Company’s directors or officers adopted , terminated
modified a “Rule 10b5-1 trading arrangement” or “non-Rule
10b5-1 trading arrangement” (as such terms are defined in
Item 408 of Regulation S-K), except as follows and which is
intended to satisfy the affirmative defense of Rule 10b5-1(c):
plan for the sale of up to 18,000 shares of our common stock
subject to certain conditions and which plan expires on
48
Item 6. Exhibits
Exhibit Number | ||
101 | The following materials from the Nasdaq, Inc. Quarterly Report on Form 10-Q for the quarter ended June 30, 2026, formatted in iXBRL (Inline eXtensible Business Reporting Language): (i) Condensed Consolidated Balance Sheets as of June 30, 2026 and December 31, 2025; (ii) Condensed Consolidated Statements of Income for the three and six months ended June 30, 2026 and 2025; (iii) Condensed Consolidated Statements of Comprehensive Income for the three and six months ended June 30, 2026 and 2025; (iv) Condensed Consolidated Statements of Changes in Stockholders’ Equity for the three and six months ended June 30, 2026 and 2025; (v) Condensed Consolidated Statements of Cash Flows for the six months ended June 30, 2026 and 2025; and (vi) notes to condensed consolidated financial statements. | |
104 | Cover Page Interactive Data File, formatted in iXBRL and contained in Exhibit 101. |
________
* Management contract or compensatory plan or
arrangement.
^ Certain schedules and exhibits have been omitted pursuant
to Item 601(a)(5) of Regulation S-K. Nasdaq, Inc. hereby
undertakes to furnish supplemental copies of any of the
omitted schedules or exhibits to the Securities and Exchange
Commission upon request.
SIGNATURES
Pursuant to the requirements of Section 13 or 15(d) of the
Securities Exchange Act of 1934, the registrant has duly
caused this report to be signed on its behalf by the
undersigned, thereunto duly authorized, on July 23, 2026.
Nasdaq, Inc. | ||
(Registrant) | ||
By: | /s/ Adena T. Friedman | |
Name: | Adena T. Friedman | |
Title: | Chief Executive Officer | |
Date: | July 23, 2026 | |
By: | /s/ Sarah Youngwood | |
Name: | Sarah Youngwood | |
Title: | Executive Vice President and Chief Financial Officer | |
Date: | July 23, 2026 | |
