EXHIBIT 99.1
| PRESS RELEASE |  | |||||||
NOBLE CORPORATION PLC ANNOUNCES SECOND QUARTER 2023 RESULTS
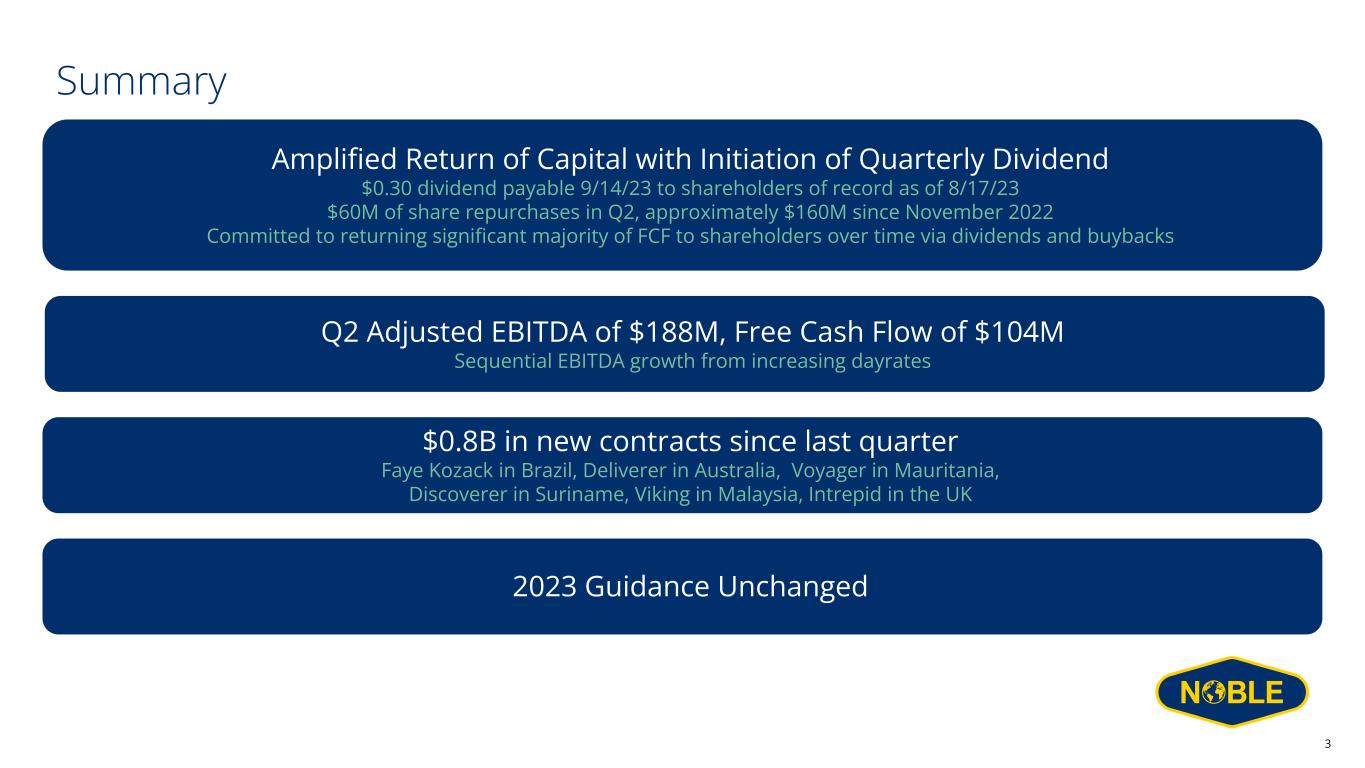
•Amplifying capital returns to shareholders with $60 million of share repurchases in Q2 and quarterly cash dividend initiated at $0.30 per share.
•Total backlog grows by 9% to $5.0 billion with new contracts totaling $0.8 billion secured over the past three months.
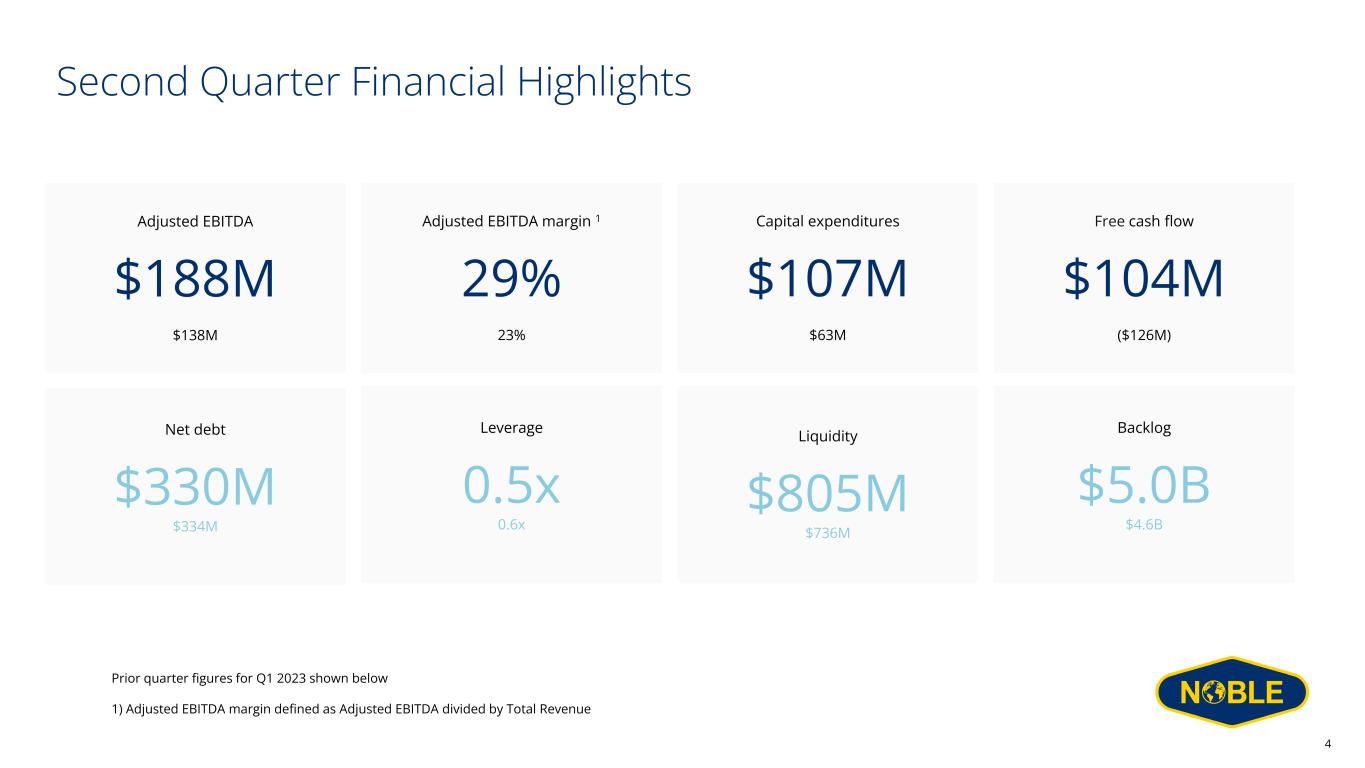
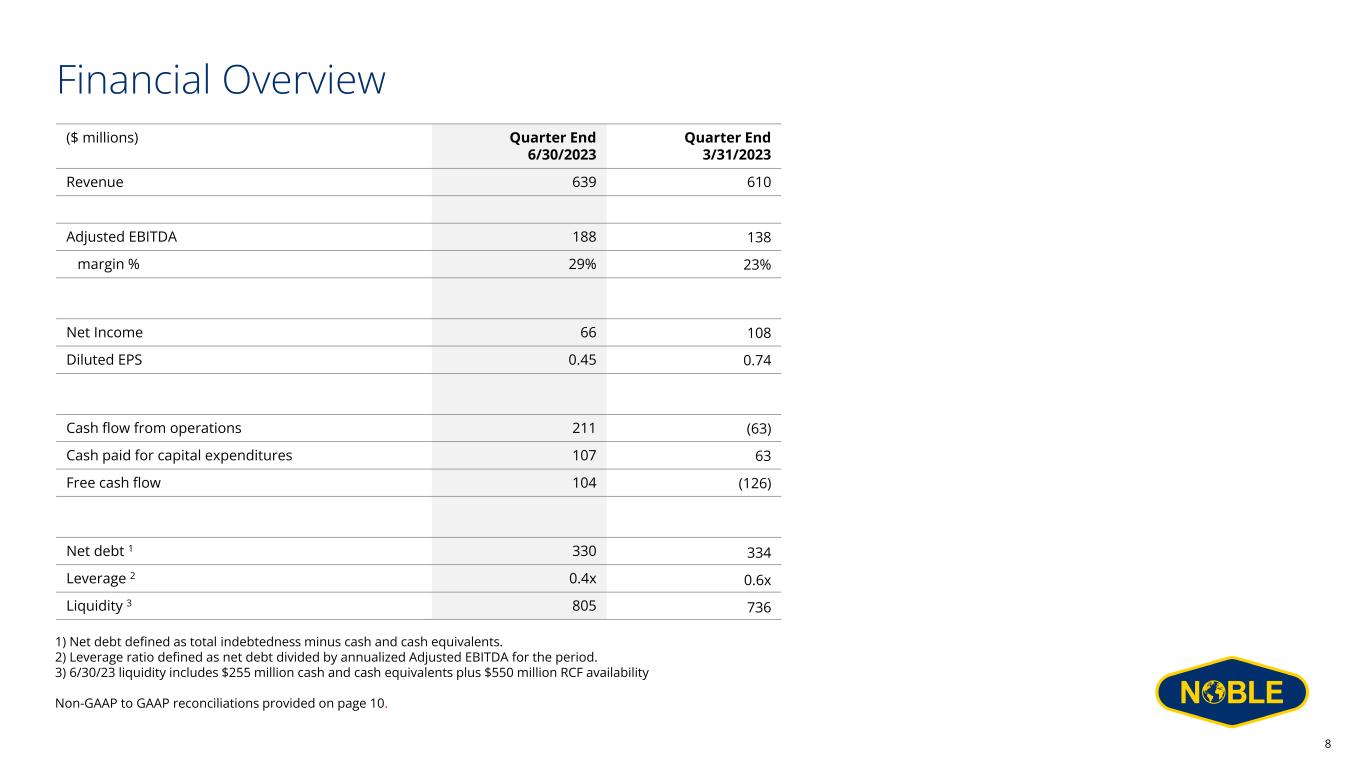
•Q2 Net Income of $66 million, Diluted Earnings Per Share of $0.45, Adjusted EBITDA of $188 million, net cash provided by operating activities of $211 million, and Free Cash Flow of $104 million.
SUGAR LAND, TEXAS, August 2, 2023 - Noble Corporation plc (NYSE: NE, CSE: NOBLE, “Noble”, or the “Company”) today reported second quarter 2023 results.
| Three Months Ended | ||||||||||||||||||||
| (in millions, except per share amounts) | June 30, 2023 | June 30, 2022 | March 31, 2023 | |||||||||||||||||
| Total Revenue | $ | 639 | $ | 275 | $ | 610 | ||||||||||||||
| Contract Drilling Services Revenue | 606 | 262 | 575 | |||||||||||||||||
| Net Income (Loss) | 66 | 37 | 108 | |||||||||||||||||
| Adjusted EBITDA* | 188 | 84 | 138 | |||||||||||||||||
| Adjusted Net Income (Loss)* | 56 | 33 | 27 | |||||||||||||||||
| Basic Earnings (Loss) Per Share | 0.48 | 0.53 | 0.80 | |||||||||||||||||
| Diluted Earnings (Loss) Per Share | 0.45 | 0.45 | 0.74 | |||||||||||||||||
| Adjusted Diluted Earnings (Loss) Per Share* | 0.38 | 0.40 | 0.19 | |||||||||||||||||
| * A Non-GAAP supporting schedule is included with the statements and schedules attached to this press release. | ||||||||||||||||||||
Robert W. Eifler, President and Chief Executive Officer of Noble Corporation plc, stated “Our second quarter results reflected solid operational and financial performance. Our recent initiation of a quarterly dividend starting at $0.30 per share, combined with $60 million of share repurchases in the second quarter, highlights our industry leading platform for cash flow generation and our commitment to returning capital to shareholders. We are realizing the combined benefits of the business combination with Maersk Drilling with our enhanced capabilities, we believe, allowing us to better serve our customers. Continuing improvement in the UDW market has driven our backlog to $5 billion, with several recent floater awards including the Noble Faye Kozack’s 2.5-year contract in Brazil, and we are increasingly encouraged by the expanding geographic breadth of UDW demand worldwide.”
Second Quarter Results
Contract drilling services revenue for the second quarter of 2023 totaled $606 million compared to $575 million in the first quarter, with the sequential increase driven by improving average dayrates. Marketed fleet utilization was 76% in the three months ended June 30, 2023 compared to 80% in the previous quarter. Contract drilling services costs for the second quarter were $363 million, flat versus the first quarter. Adjusted EBITDA increased to $188 million in the second quarter, up from $138 million in the first quarter. Net cash provided by operating
1
activities in the second quarter was $211 million, capital expenditures were $107 million, and free cash flow (non-GAAP) was $104 million.
Balance Sheet and Capital Allocation
The Company's balance sheet as of June 30, 2023 reflected total debt principal value of $600 million and cash (and cash equivalents) of $255 million. Share repurchases totaled $60 million during the second quarter, bringing 2023 year-to-date share repurchases to $70 million, following approximately $86 million of cash used for share repurchases during the fourth quarter of 2022 (including the mandatory purchase associated with the Maersk Drilling squeeze-out).
Subsequent to the end of the second quarter, Noble announced the initiation of a planned quarterly interim dividend program, beginning with a $0.30 per share dividend to be paid on September 14, 2023 to shareholders of record at close of business on August 17, 2023.
Operating Highlights and Backlog
Noble's marketed fleet of sixteen floaters was 90% contracted through the second quarter, compared with 91% in the prior quarter. All sixteen marketed floaters continue to be consistently contracted with strong visibility for future follow-on opportunities, while utilization remains tempered slightly by gaps between contracts and planned SPS related downtime. Leading edge dayrates for working tier 1 drillships are in the mid to high-$400,000s; 6th generation floaters also continue to command a normal price discount to tier 1 drillships consistent with technical capability differentials.
Subsequent to last quarter’s earnings press release, new contracts for Noble’s floater fleet with total contract value of approximately $750 million (including mobilization payments) include the following:
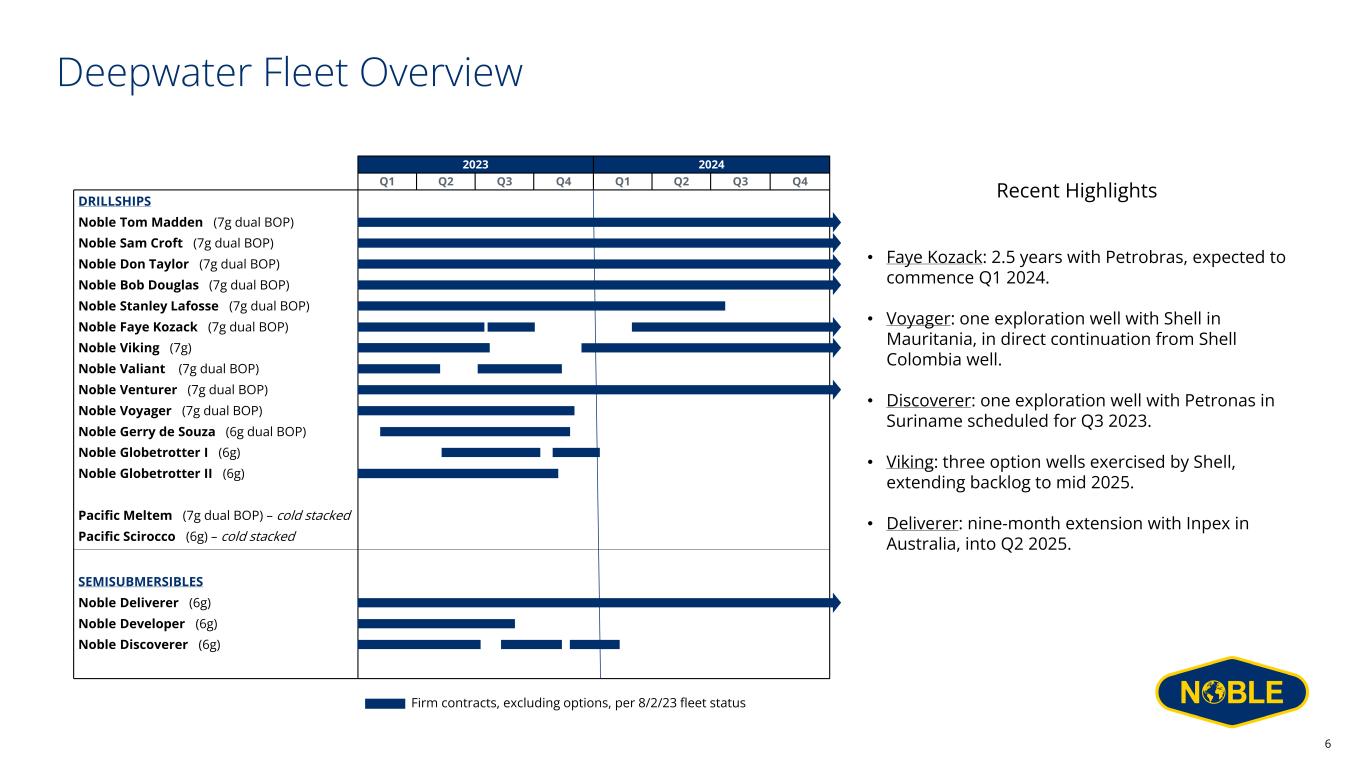
•Noble Faye Kozack was awarded a 2.5 year contract with Petrobras, expected to commence in Q1 2024 and valued at approximately $500 million including mobilization and additional services.
•Noble Voyager was awarded a one-well contract from Shell for an exploration well in Mauritania at an undisclosed value. This contract follows in direct continuation of the current Shell contract in Colombia and is expected to extend the rig through year-end 2023.
•Noble Discoverer was awarded a one-well contract with Petronas in Suriname, expected to commence in August 2023, with an estimated duration of 90 days. The firm contract value is approximately $43 million, including additional services provided, mobilization and demobilization fees.
•Noble Viking had three option wells exercised by Shell, with total contract value of approximately $49 million and estimated total duration of 111 days. The first of these three option wells is scheduled to commence in December following the rig’s SPS, and the rig’s firm backlog is now extended into Q2 2025.
•Noble Deliverer received a nine-month extension from Inpex in Australia, expected to continue from July 2024 to April 2025 at a dayrate of $451,500.
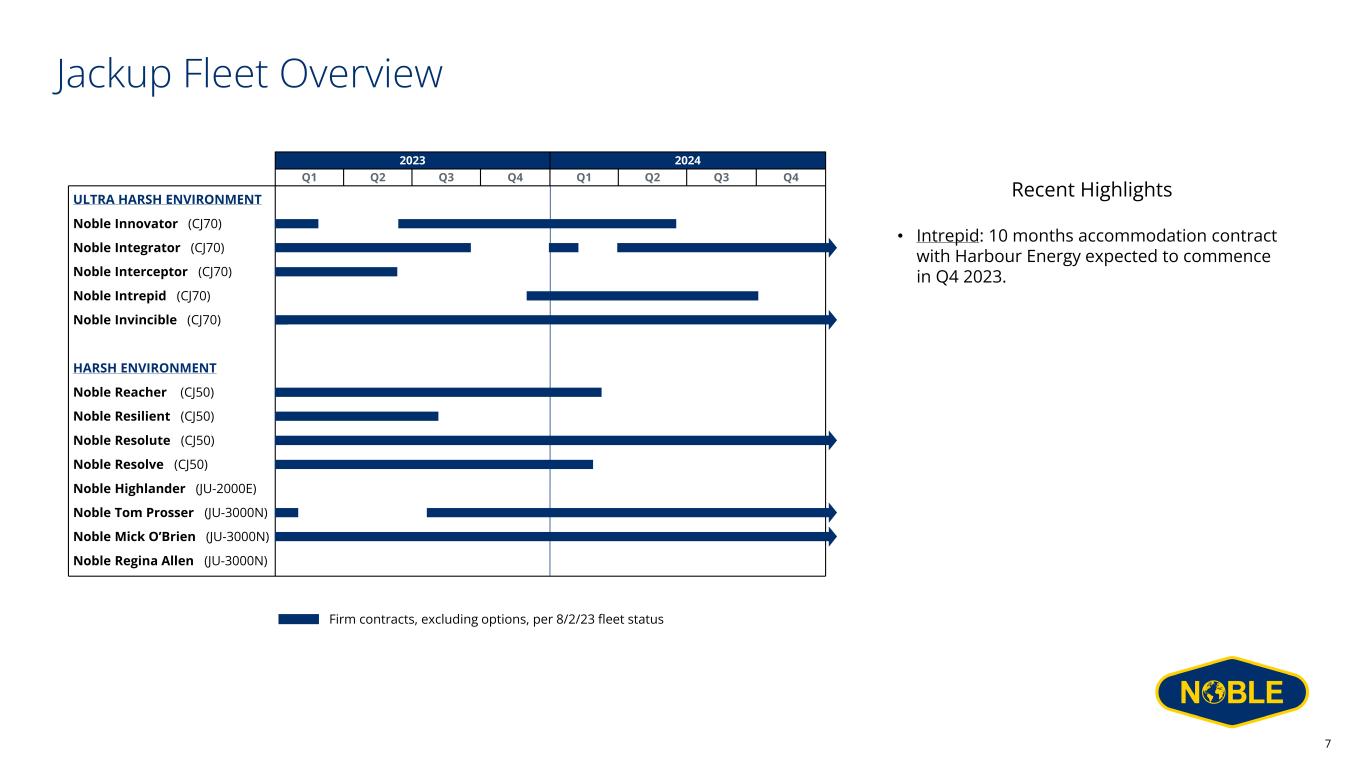
Utilization of Noble's thirteen marketed jackups was 59% in the second quarter, compared with 67% utilization during the first quarter, with sequential downticks in utilization experienced by the Noble Tom Prosser, Noble Innovator and Noble Interceptor.
Commercial activity for the jackup fleet was subdued in the first half of 2023 but has recently begun to pick up, and we anticipate that jackup fleet utilization will begin improving based on existing and potential contracts. The warm stacked Noble Intrepid has recently been awarded a contract with Harbour Energy for 10 months of accommodation scope in the U.K. North Sea with a total contract value of $28.5 million. Additionally, the Noble Tom Prosser has recently commenced its long term program in Malaysia in July, and we believe the Noble Regina Allen is well positioned to resume operations by mid 2024 upon completion of repairs. Based on these dynamics and additional contract prospects over the near term, a steady recovery in jackup revenue and EBITDA contribution is expected to unfold over the coming quarters, with a more assertive recovery still predicated on demand dynamics in Norway and then North Sea from late 2024 onward.
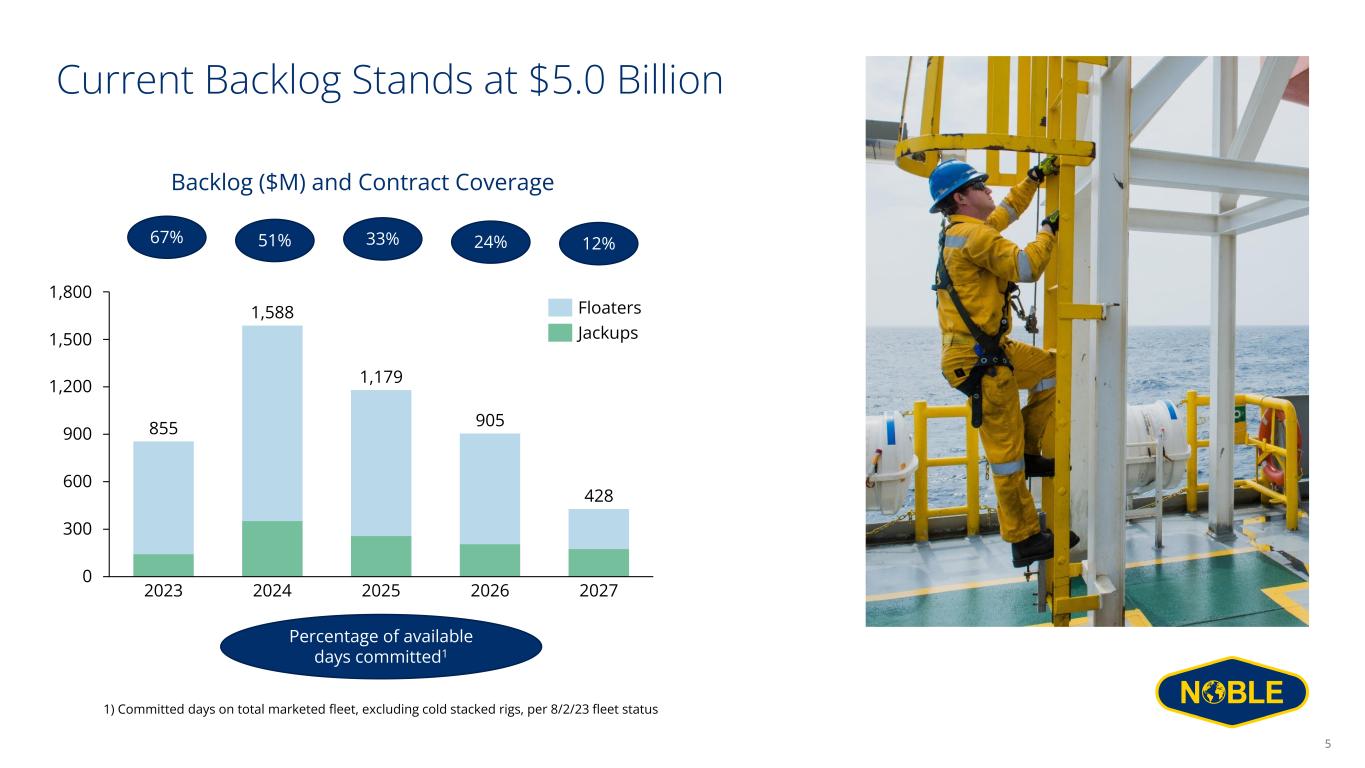
Noble's backlog as of August 2, 2023 stands at $5.0 billion.
Outlook
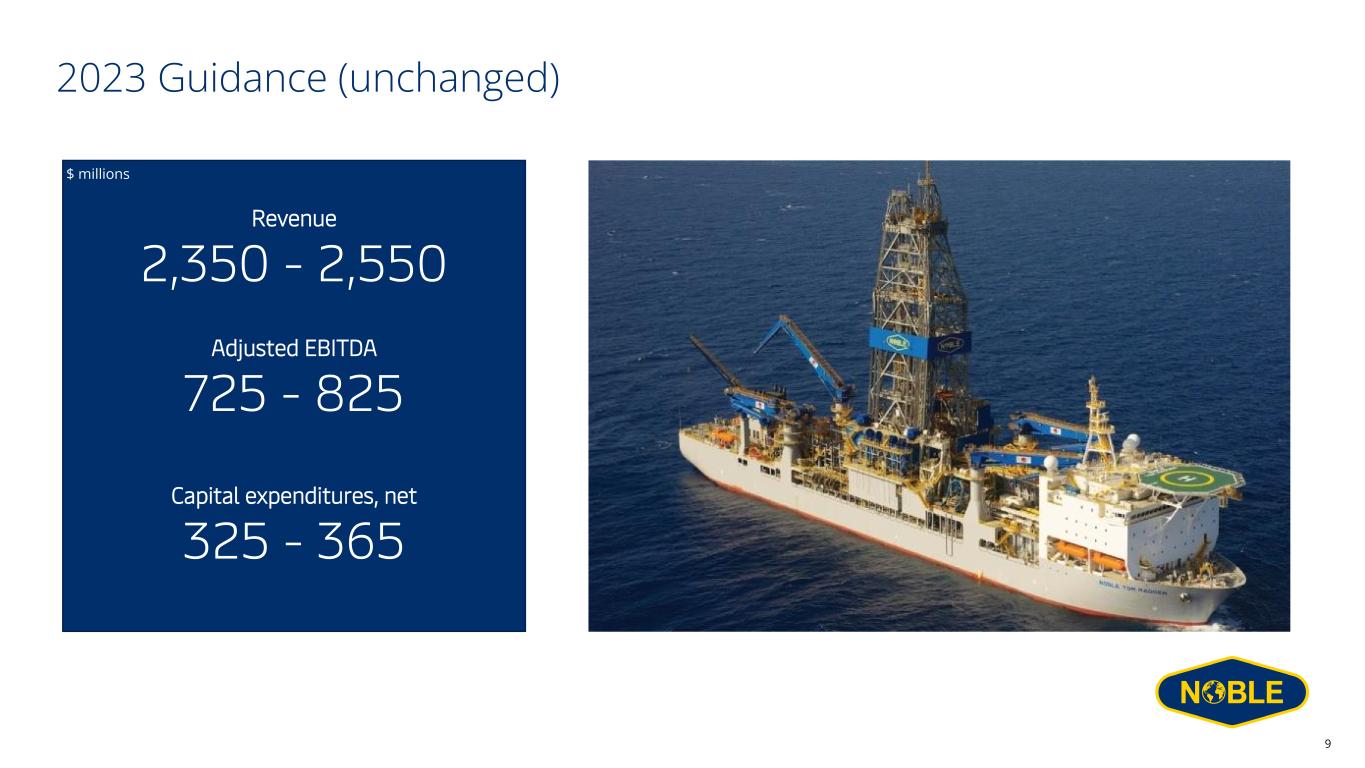
For the full year 2023, Noble maintains the previously communicated guidance for total revenue in the range of $2.35 to $2.55 billion, Adjusted EBITDA of $725 to $825 million, and capital expenditures (net of reimbursable capex) between $325 and $365 million.
2
Commenting on Noble’s outlook, Mr. Eifler stated, “Offshore fundamentals remain exceptionally strong, supporting a steady upward progression in contract status across our fleet. We expect UDW market tightness to persist and drive further upward pressure on dayrates going forward. With Adjusted EBITDA and Free Cash Flow expected to increase in the second half of the year versus the first half, we remain focused on maximizing shareholder value through best-in-class execution and returning the significant majority of free cash flow to shareholders.”
Due to the forward-looking nature of Adjusted EBITDA, management cannot reliably predict certain of the necessary components of the most directly comparable forward-looking GAAP measure. Accordingly, the Company is unable to present a quantitative reconciliation of such forward-looking non-GAAP financial measure to the most directly comparable forward-looking GAAP financial measure without unreasonable effort. The unavailable information could have a significant effect on Noble’s full year 2023 GAAP financial results.
Conference Call
Noble will host a conference call related to its second quarter 2023 results on Thursday, August 3rd, 2023, at 8:00 a.m. U.S. Central Time. Interested parties may dial +1 929-203-0901 and refer to conference ID 31391 approximately 15 minutes prior to the scheduled start time. Additionally, a live webcast link will be available on the Investor Relations section of the Company’s website. A webcast replay will be accessible for a limited time following the scheduled call.
For additional information, visit www.noblecorp.com or email [email protected]
Contact Noble Corporation plc
Ian Macpherson
Vice President - Investor Relations
+1 713-239-6507
About Noble Corporation plc
Noble is a leading offshore drilling contractor for the oil and gas industry. The Company owns and operates one of the most modern, versatile, and technically advanced fleets in the offshore drilling industry. Noble and its predecessors have been engaged in the contract drilling of oil and gas wells since 1921. Noble performs, through its subsidiaries, contract drilling services with a fleet of offshore drilling units focused largely on ultra-deepwater and high specification jackup drilling opportunities in both established and emerging regions worldwide. Additional information on Noble is available at www.noblecorp.com.
Forward-looking Statements
This communication includes “forward-looking statements” within the meaning of Section 27A of the Securities Act and Section 21E of the Exchange Act, as amended. All statements other than statements of historical facts included in this communication are forward looking statements, including those regarding future guidance, including revenue, adjusted EBITDA, the offshore drilling market and demand fundamentals, realization and timing of integration synergies, related costs to achieve, free cash flow expectations, capital expenditure, capital allocation expectations including planned dividend and share repurchases, contract backlog, rig demand, expected future contracts, anticipated contract start dates, dayrates and duration, fleet condition and utilization, 2023 and 2024 financial guidance, business, financial performance and position and our plans, objectives, expectations and intentions related to the Noble-Maersk merger. Forward-looking statements involve risks, uncertainties and assumptions, and actual results may differ materially from any future results expressed or implied by such forward-looking statements. When used in this report, or in the documents incorporated by reference, the words “anticipate,” “believe,” “continue,” “could,” “estimate,” “expect,” “intend,” “may,” “might,” “on track,” “plan,” “possible,” “potential,” “predict,” “project,” “should,” “would,” “shall,” “target,” “will” and similar expressions are intended to be among the statements that identify forward-looking statements. Although we believe that the expectations reflected in such forward-looking statements are reasonable, we cannot assure you that such expectations will prove to be correct. These forward-looking statements speak only as of the date of this communication and we undertake no obligation to revise or update any forward-looking statement for any reason, except as required by law. Risks and uncertainties include, but are not limited to, those detailed in Noble’s most recent Annual Report on Form 10-K, Quarterly Reports Form 10-Q and other filings with the U.S.
3
Securities and Exchange Commission. We cannot control such risk factors and other uncertainties, and in many cases, we cannot predict the risks and uncertainties that could cause our actual results to differ materially from those indicated by the forward-looking statements. You should consider these risks and uncertainties when you are evaluating us. With respect to our capital allocation policy, distributions to shareholders in the form of either dividends or share buybacks are subject to the Board of Directors’ assessment of factors such as business development, growth strategy, current leverage and financing needs. There can be no assurance that a dividend will be declared or continued.
4
NOBLE CORPORATION plc AND SUBSIDIARIES
CONDENSED CONSOLIDATED STATEMENTS OF OPERATIONS
(In thousands, except per share amounts)
(Unaudited)
| Three Months Ended June 30, | Six Months Ended June 30, | |||||||||||||||||||||||||
| 2023 | 2022 | 2023 | 2022 | |||||||||||||||||||||||
| Operating revenues | ||||||||||||||||||||||||||
| Contract drilling services | $ | 606,180 | $ | 262,463 | $ | 1,181,470 | $ | 457,498 | ||||||||||||||||||
| Reimbursables and other | 32,355 | 12,690 | 67,119 | 27,885 | ||||||||||||||||||||||
| 638,535 | 275,153 | 1,248,589 | 485,383 | |||||||||||||||||||||||
| Operating costs and expenses | ||||||||||||||||||||||||||
| Contract drilling services | 362,533 | 178,145 | 724,322 | 344,228 | ||||||||||||||||||||||
| Reimbursables | 24,796 | 10,333 | 50,802 | 23,811 | ||||||||||||||||||||||
| Depreciation and amortization | 71,324 | 26,636 | 141,266 | 52,241 | ||||||||||||||||||||||
| General and administrative | 32,352 | 16,687 | 62,389 | 34,211 | ||||||||||||||||||||||
| Merger and integration costs | 22,452 | 9,057 | 34,083 | 18,578 | ||||||||||||||||||||||
(Gain) loss on sale of operating assets, net | — | 1,103 | — | (3,459) | ||||||||||||||||||||||
| Hurricane losses and (recoveries), net | 15,934 | (14,407) | 19,478 | 2,805 | ||||||||||||||||||||||
| 529,391 | 227,554 | 1,032,340 | 472,415 | |||||||||||||||||||||||
| Operating income (loss) | 109,144 | 47,599 | 216,249 | 12,968 | ||||||||||||||||||||||
| Other income (expense) | ||||||||||||||||||||||||||
| Interest expense, net of amounts capitalized | (14,662) | (7,715) | (31,534) | (15,395) | ||||||||||||||||||||||
| Gain (loss) on extinguishment of debt, net | (26,397) | — | (26,397) | — | ||||||||||||||||||||||
| Interest income and other, net | (2,940) | 1,081 | (914) | 1,531 | ||||||||||||||||||||||
| Income (loss) before income taxes | 65,145 | 40,965 | 157,404 | (896) | ||||||||||||||||||||||
| Income tax benefit (provision) | 671 | (3,908) | 16,475 | 1,297 | ||||||||||||||||||||||
| Net income (loss) | $ | 65,816 | $ | 37,057 | $ | 173,879 | $ | 401 | ||||||||||||||||||
| Per share data | ||||||||||||||||||||||||||
| Basic: | ||||||||||||||||||||||||||
| Net income (loss) | $ | 0.48 | $ | 0.53 | $ | 1.27 | $ | 0.01 | ||||||||||||||||||
| Diluted: | ||||||||||||||||||||||||||
| Net income (loss) | $ | 0.45 | $ | 0.45 | $ | 1.19 | $ | — | ||||||||||||||||||
5
NOBLE CORPORATION plc AND SUBSIDIARIES
CONDENSED CONSOLIDATED BALANCE SHEETS
(In thousands)
(Unaudited)
| June 30, 2023 | December 31, 2022 | |||||||||||||
| ASSETS | ||||||||||||||
| Current assets | ||||||||||||||
| Cash and cash equivalents | $ | 255,356 | $ | 476,206 | ||||||||||
| Accounts receivable, net | 516,800 | 468,802 | ||||||||||||
| Prepaid expenses and other current assets | 160,462 | 106,782 | ||||||||||||
| Total current assets | 932,618 | 1,051,790 | ||||||||||||
| Intangible assets | 17,018 | 34,372 | ||||||||||||
| Property and equipment, at cost | 4,329,002 | 4,163,205 | ||||||||||||
| Accumulated depreciation | (322,444) | (181,904) | ||||||||||||
| Property and equipment, net | 4,006,558 | 3,981,301 | ||||||||||||
| Goodwill | 14,626 | 26,016 | ||||||||||||
| Other assets | 226,582 | 141,385 | ||||||||||||
| Total assets | $ | 5,197,402 | $ | 5,234,864 | ||||||||||
| LIABILITIES AND EQUITY | ||||||||||||||
| Current liabilities | ||||||||||||||
| Current maturities of long-term debt | $ | — | $ | 159,715 | ||||||||||
| Accounts payable | 310,723 | 290,690 | ||||||||||||
| Accrued payroll and related costs | 77,049 | 76,185 | ||||||||||||
| Other current liabilities | 126,379 | 140,508 | ||||||||||||
| Total current liabilities | 514,151 | 667,098 | ||||||||||||
| Long-term debt | 585,389 | 513,055 | ||||||||||||
| Other liabilities | 298,650 | 265,743 | ||||||||||||
| Noncurrent contract liabilities | 79,792 | 181,883 | ||||||||||||
| Total liabilities | 1,477,982 | 1,627,779 | ||||||||||||
| Commitments and contingencies | ||||||||||||||
| Total shareholders’ equity | 3,719,420 | 3,607,085 | ||||||||||||
| Total liabilities and equity | $ | 5,197,402 | $ | 5,234,864 | ||||||||||
6
NOBLE CORPORATION plc AND SUBSIDIARIES
CONDENSED CONSOLIDATED STATEMENTS OF CASH FLOWS
(In thousands)
(Unaudited)
| Six Months Ended June 30, | |||||||||||
| 2023 | 2022 | ||||||||||
| Cash flows from operating activities | |||||||||||
| Net income (loss) | $ | 173,879 | $ | 401 | |||||||
| Adjustments to reconcile net income (loss) to net cash flow from operating activities: | |||||||||||
| Depreciation and amortization | 141,266 | 52,241 | |||||||||
| Amortization of intangible assets and contract liabilities, net | (84,737) | 28,354 | |||||||||
| (Gain) loss on extinguishment of debt, net | 26,397 | — | |||||||||
| (Gain) loss on sale of operating assets, net | — | (6,767) | |||||||||
| Changes in components of working capital | |||||||||||
| Change in taxes receivable | (20,284) | (345) | |||||||||
| Net changes in other operating assets and liabilities | (88,441) | (37,585) | |||||||||
| Net cash provided by (used in) operating activities | 148,080 | 36,299 | |||||||||
| Cash flows from investing activities | |||||||||||
| Capital expenditures | (169,530) | (79,525) | |||||||||
| Proceeds from disposal of assets, net | — | 15,756 | |||||||||
| Net cash provided by (used in) investing activities | (169,530) | (63,769) | |||||||||
| Cash flows from financing activities | |||||||||||
| Issuance of senior notes | 600,000 | — | |||||||||
| Repayments of debt | (673,411) | — | |||||||||
| Debt extinguishment costs | (25,697) | — | |||||||||
| Debt issuance costs | (24,914) | — | |||||||||
| Share repurchases | (70,000) | — | |||||||||
| Other financing activities | (8,253) | (4,486) | |||||||||
| Net cash provided by (used in) financing activities | (202,275) | (4,486) | |||||||||
| Net increase (decrease) in cash, cash equivalents and restricted cash | (223,725) | (31,956) | |||||||||
| Cash, cash equivalents and restricted cash, beginning of period | 485,707 | 196,722 | |||||||||
| Cash, cash equivalents and restricted cash, end of period | $ | 261,982 | $ | 164,766 | |||||||
7
NOBLE CORPORATION plc AND SUBSIDIARIES
OPERATIONAL INFORMATION
(Unaudited)
| Average Rig Utilization | |||||||||||||||||
| Three Months Ended | Three Months Ended | Three Months Ended | |||||||||||||||
| June 30, 2023 | March 31, 2023 | June 30, 2022 | |||||||||||||||
| Floaters | 76 | % | 77 | % | 81 | % | |||||||||||
| Jackups | 62 | % | 70 | % | 68 | % | |||||||||||
| Total | 70 | % | 74 | % | 76 | % | |||||||||||
| Operating Days | |||||||||||||||||
| Three Months Ended | Three Months Ended | Three Months Ended | |||||||||||||||
| June 30, 2023 | March 31, 2023 | June 30, 2022 | |||||||||||||||
| Floaters | 1,305 | 1,314 | 813 | ||||||||||||||
| Jackups | 786 | 877 | 495 | ||||||||||||||
| Total | 2,091 | 2,191 | 1,308 | ||||||||||||||
| Average Dayrates | |||||||||||||||||
| Three Months Ended | Three Months Ended | Three Months Ended | |||||||||||||||
| June 30, 2023 | March 31, 2023 | June 30, 2022 | |||||||||||||||
| Floaters | $ | 363,167 | $ | 331,705 | $ | 266,887 | |||||||||||
| Jackups | 128,885 | 97,940 | 120,824 | ||||||||||||||
| Total | $ | 275,066 | $ | 238,130 | $ | 211,626 | |||||||||||
8
NOBLE CORPORATION plc AND SUBSIDIARIES
CALCULATION OF BASIC AND DILUTED NET INCOME/(LOSS) PER SHARE
(In thousands, except per share amounts)
(Unaudited)
The following tables presents the computation of basic and diluted income (loss) per share:
| Three Months Ended June 30, | Six Months Ended June 30, | |||||||||||||||||||||||||
| 2023 | 2022 | 2023 | 2022 | |||||||||||||||||||||||
| Numerator: | ||||||||||||||||||||||||||
| Net income (loss) | $ | 65,816 | $ | 37,057 | $ | 173,879 | $ | 401 | ||||||||||||||||||
| Denominator: | ||||||||||||||||||||||||||
| Weighted average shares outstanding - basic | 138,058 | 69,789 | 136,502 | 68,722 | ||||||||||||||||||||||
| Dilutive effect of share-based awards | 3,242 | 3,378 | 3,242 | 3,378 | ||||||||||||||||||||||
| Dilutive effect of warrants | 5,692 | 9,535 | 6,810 | 9,185 | ||||||||||||||||||||||
| Weighted average shares outstanding - diluted | 146,992 | 82,702 | 146,554 | 81,285 | ||||||||||||||||||||||
| Per share data | ||||||||||||||||||||||||||
| Basic: | ||||||||||||||||||||||||||
| Net income (loss) | $ | 0.48 | $ | 0.53 | $ | 1.27 | $ | 0.01 | ||||||||||||||||||
| Diluted: | ||||||||||||||||||||||||||
| Net income (loss) | $ | 0.45 | $ | 0.45 | $ | 1.19 | $ | — | ||||||||||||||||||
9
NOBLE CORPORATION plc AND SUBSIDIARIES
NON-GAAP MEASURES AND RECONCILIATION
Certain non-GAAP measures and corresponding reconciliations to GAAP financial measures for the Company have been provided for meaningful comparisons between current results and prior operating periods. Generally, a non-GAAP financial measure is a numerical measure of a company’s performance, financial position, or cash flows that excludes or includes amounts that are not normally included or excluded in the most directly comparable measure calculated and presented in accordance with generally accepted accounting principles.
The Company defines “Adjusted EBITDA” as net income (loss) adjusted for interest expense, net of amounts capitalized; interest income and other, net; income tax benefit (provision); and depreciation and amortization expense, as well as, if applicable, gain (loss) on extinguishment of debt, net; losses on economic impairments; restructuring and similar charges; costs related to mergers and integrations; and certain other infrequent operational events. We believe that the Adjusted EBITDA measure provides greater transparency of our core operating performance. We prepare Adjusted Net Income (Loss) by eliminating from Net Income (Loss) the impact of a number of non-recurring items we do not consider indicative of our on-going performance. We prepare Adjusted Diluted Earnings (Loss) per Share by eliminating from Diluted Earnings per Share the impact of a number of non-recurring items we do not consider indicative of our on-going performance. Similar to Adjusted EBITDA, we believe these measures help identify underlying trends that could otherwise be masked by the effect of the non-recurring items we exclude in the measure.
In order to fully assess the financial operating results, management believes that the results of operations, adjusted to exclude the following items, which are included in the Company’s press release issued on August 2, 2023, are appropriate measures of the continuing and normal operations of the Company:
(i)In the second quarters of 2023 and 2022, merger and integration costs; hurricane losses and (recoveries), net; intangible contract amortization and discrete tax items.
(ii)The second quarter of 2023 included a loss on extinguishment of debt, net.
(iii)In addition, the second quarter of 2022 included (gain) loss on sale of operating assets, net and professional services costs related to corporate initiatives.
The Company also discloses free cash flow as a non-GAAP liquidity measure. Free cash flow is calculated as Net cash provided by (used in) operating activities less cash paid for capital expenditures. We believe Free Cash Flow is useful to investors because it measures our ability to generate or use cash. Once business needs and obligations are met, this cash can be used to reinvest in the company for future growth or to return to shareholders through dividend payments or share repurchases.
We believe that these non-GAAP financial measures provide useful information about our financial performance, enhance the overall understanding of our past performance and future prospects, and allow for greater transparency with respect to key metrics used by our management team for financial and operational decision-making. We are presenting these non-GAAP financial measures to assist investors in seeing our financial performance through the eyes of management, and because we believe that these measures provide an additional tool for investors to use in comparing our core financial performance over multiple periods with other companies in our industry.
These non-GAAP adjusted measures should be considered in addition to, and not as a substitute for, or superior to, contract drilling revenue, contract drilling cost, contract drilling margin, average daily revenue, operating income, cash flows from operations, or other measures of financial performance prepared in accordance with GAAP. Please see the following non-GAAP Financial Measures and Reconciliations for a complete description of the adjustments.
10
NOBLE CORPORATION plc AND SUBSIDIARIES
NON-GAAP MEASURES
(In thousands, except per share amounts)
(Unaudited)
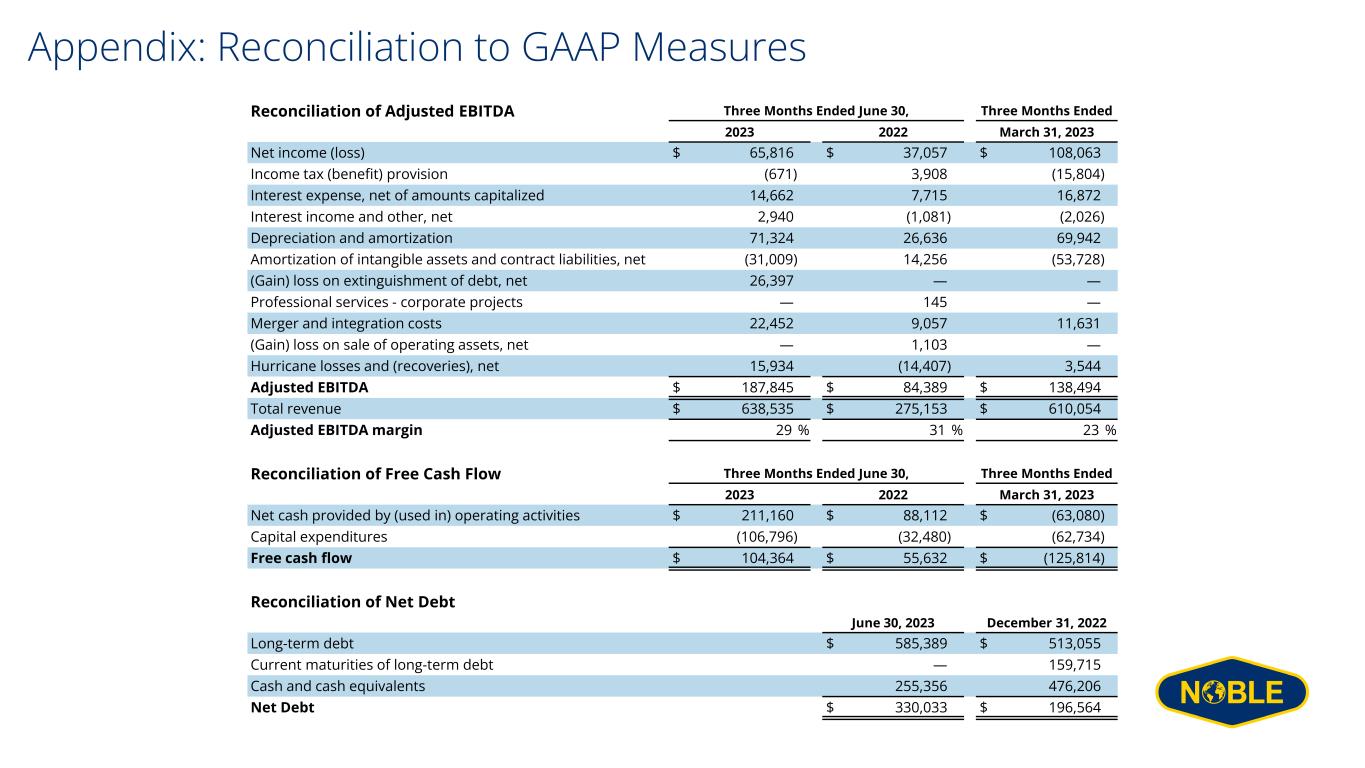
| Reconciliation of Adjusted EBITDA | ||||||||||||||||||||
| Three Months Ended June 30, | Three Months Ended | |||||||||||||||||||
| 2023 | 2022 | March 31, 2023 | ||||||||||||||||||
| Net income (loss) | $ | 65,816 | $ | 37,057 | $ | 108,063 | ||||||||||||||
| Income tax (benefit) provision | (671) | 3,908 | (15,804) | |||||||||||||||||
| Interest expense, net of amounts capitalized | 14,662 | 7,715 | 16,872 | |||||||||||||||||
| Interest income and other, net | 2,940 | (1,081) | (2,026) | |||||||||||||||||
| Depreciation and amortization | 71,324 | 26,636 | 69,942 | |||||||||||||||||
Amortization of intangible assets and contract liabilities, net | (31,009) | 14,256 | (53,728) | |||||||||||||||||
| (Gain) loss on extinguishment of debt, net | 26,397 | — | — | |||||||||||||||||
| Professional services - corporate projects | — | 145 | — | |||||||||||||||||
| Merger and integration costs | 22,452 | 9,057 | 11,631 | |||||||||||||||||
(Gain) loss on sale of operating assets, net | — | 1,103 | — | |||||||||||||||||
| Hurricane losses and (recoveries), net | 15,934 | (14,407) | 3,544 | |||||||||||||||||
| Adjusted EBITDA | $ | 187,845 | $ | 84,389 | $ | 138,494 | ||||||||||||||
| Reconciliation of Income Tax (Provision) Benefit | ||||||||||||||||||||
| Three Months Ended June 30, | Three Months Ended | |||||||||||||||||||
| 2023 | 2022 | March 31, 2023 | ||||||||||||||||||
| Income tax benefit (provision) | $ | 671 | $ | (3,908) | $ | 15,804 | ||||||||||||||
| Adjustments | ||||||||||||||||||||
Amortization of intangible assets and contract liabilities, net | 3,747 | (2,994) | 3,501 | |||||||||||||||||
| Hurricane losses and (recoveries), net | — | (164) | — | |||||||||||||||||
| Discrete tax items | (47,601) | (11,105) | (45,631) | |||||||||||||||||
| Total Adjustments | (43,854) | (14,263) | (42,130) | |||||||||||||||||
| Adjusted income tax benefit (provision) | $ | (43,183) | $ | (18,171) | $ | (26,326) | ||||||||||||||
11
NOBLE CORPORATION plc AND SUBSIDIARIES
NON-GAAP RECONCILIATION
(In thousands, except per share amounts)
(Unaudited)
| Reconciliation of Net Income (Loss) | ||||||||||||||||||||
| Three Months Ended June 30, | Three Months Ended | |||||||||||||||||||
| 2023 | 2022 | March 31, 2023 | ||||||||||||||||||
| Net income (loss) | $ | 65,816 | $ | 37,057 | $ | 108,063 | ||||||||||||||
| Adjustments | ||||||||||||||||||||
| Amortization of intangible assets and contract liabilities, net | (27,262) | 11,262 | (50,227) | |||||||||||||||||
| Professional services - corporate projects | — | 145 | — | |||||||||||||||||
| Merger and integration costs | 22,452 | 9,057 | 11,631 | |||||||||||||||||
(Gain) loss on sale of operating assets, net | — | 1,103 | — | |||||||||||||||||
| Hurricane losses and (recoveries), net | 15,934 | (14,571) | 3,544 | |||||||||||||||||
| (Gain) loss on extinguishment of debt, net | 26,397 | — | — | |||||||||||||||||
| Discrete tax items | (47,601) | (11,105) | (45,631) | |||||||||||||||||
| Total Adjustments | (10,080) | (4,109) | (80,683) | |||||||||||||||||
| Adjusted net income (loss) | $ | 55,736 | $ | 32,948 | $ | 27,380 | ||||||||||||||
| Reconciliation of Diluted EPS | ||||||||||||||||||||
| Three Months Ended June 30, | Three Months Ended | |||||||||||||||||||
| 2023 | 2022 | March 31, 2023 | ||||||||||||||||||
| Unadjusted diluted EPS | $ | 0.45 | $ | 0.45 | $ | 0.74 | ||||||||||||||
| Adjustments | ||||||||||||||||||||
| Amortization of intangible assets and contract liabilities, net | (0.19) | 0.14 | (0.34) | |||||||||||||||||
| Professional services - corporate projects | — | — | — | |||||||||||||||||
| Merger and integration costs | 0.15 | 0.11 | 0.08 | |||||||||||||||||
(Gain) loss on sale of operating assets, net | — | 0.01 | — | |||||||||||||||||
| Hurricane losses and (recoveries), net | 0.11 | (0.18) | 0.02 | |||||||||||||||||
| (Gain) loss on extinguishment of debt, net | 0.18 | — | — | |||||||||||||||||
| Discrete tax items | (0.32) | (0.13) | (0.31) | |||||||||||||||||
| Total Adjustments | (0.07) | (0.05) | (0.55) | |||||||||||||||||
| Adjusted diluted EPS | $ | 0.38 | $ | 0.40 | $ | 0.19 | ||||||||||||||
| Reconciliation of Free Cash Flow | ||||||||||||||||||||
| Three Months Ended June 30, | Three Months Ended | |||||||||||||||||||
| 2023 | 2022 | March 31, 2023 | ||||||||||||||||||
| Net cash provided by (used in) operating activities | $ | 211,160 | $ | 88,112 | $ | (63,080) | ||||||||||||||
| Capital expenditures | (106,796) | (32,480) | (62,734) | |||||||||||||||||
| Free cash flow | $ | 104,364 | $ | 55,632 | $ | (125,814) | ||||||||||||||
12