nem-20251231
0001164727false2025FYhttp://fasb.org/us-gaap/2025#OtherLiabilitiesCurrenthttp://fasb.org/us-gaap/2025#OtherLiabilitiesCurrenthttp://fasb.org/us-gaap/2025#OtherNonoperatingIncomeExpensehttp://fasb.org/us-gaap/2025#DebtAndEquitySecuritiesUnrealizedGainLosshttp://fasb.org/us-gaap/2025#OtherComprehensiveIncomeLossNetOfTaxhttp://fasb.org/us-gaap/2025#DebtAndEquitySecuritiesUnrealizedGainLosshttp://fasb.org/us-gaap/2025#OtherAssetsCurrenthttp://fasb.org/us-gaap/2025#OtherAssetsCurrenthttp://fasb.org/us-gaap/2025#OtherAssetsNoncurrenthttp://fasb.org/us-gaap/2025#OtherAssetsNoncurrenthttp://fasb.org/us-gaap/2025#OtherLiabilitiesCurrenthttp://fasb.org/us-gaap/2025#OtherLiabilitiesCurrenthttp://fasb.org/us-gaap/2025#OtherNonoperatingIncomeExpensehttp://fasb.org/us-gaap/2025#CostOfGoodsAndServiceExcludingDepreciationDepletionAndAmortizationhttp://www.newmont.com/20251231#LeaseAndOtherFinancingObligationsCurrent http://www.newmont.com/20251231#LeaseAndOtherFinancingObligationsNoncurrenthttp://fasb.org/us-gaap/2025#OtherLiabilitiesCurrent http://fasb.org/us-gaap/2025#OtherLiabilitiesNoncurrentiso4217:USDxbrli:sharesiso4217:USDxbrli:sharesxbrli:purenem:assetnem:installmentnem:paymentnem:segmentnem:plantutr:oziso4217:USDutr:ozutr:lbiso4217:USDutr:lbnem:mine_portalnem:planiso4217:AUDiso4217:CADnem:claimnem:plaintiffnem:co-defendant00011647272025-01-012025-12-3100011647272025-06-3000011647272026-02-120001164727nem:PricewaterhouseCoopersLLPMember2025-01-012025-12-3100011647272024-01-012024-12-3100011647272023-01-012023-12-3100011647272025-12-3100011647272024-12-3100011647272023-12-3100011647272022-12-310001164727us-gaap:DiscontinuedOperationsHeldforsaleMembernem:PortfolioOptimizationProgramMember2024-12-310001164727us-gaap:DiscontinuedOperationsHeldforsaleMembernem:PortfolioOptimizationProgramMember2025-12-310001164727us-gaap:CommonStockMember2022-12-310001164727us-gaap:TreasuryStockCommonMember2022-12-310001164727us-gaap:AdditionalPaidInCapitalMember2022-12-310001164727us-gaap:AccumulatedOtherComprehensiveIncomeMember2022-12-310001164727us-gaap:RetainedEarningsMember2022-12-310001164727us-gaap:NoncontrollingInterestMember2022-12-310001164727us-gaap:RetainedEarningsMember2023-01-012023-12-310001164727us-gaap:NoncontrollingInterestMember2023-01-012023-12-310001164727us-gaap:AccumulatedOtherComprehensiveIncomeMember2023-01-012023-12-310001164727us-gaap:CommonStockMember2023-01-012023-12-310001164727us-gaap:AdditionalPaidInCapitalMember2023-01-012023-12-310001164727us-gaap:TreasuryStockCommonMember2023-01-012023-12-310001164727us-gaap:CommonStockMember2023-12-310001164727us-gaap:TreasuryStockCommonMember2023-12-310001164727us-gaap:AdditionalPaidInCapitalMember2023-12-310001164727us-gaap:AccumulatedOtherComprehensiveIncomeMember2023-12-310001164727us-gaap:RetainedEarningsMember2023-12-310001164727us-gaap:NoncontrollingInterestMember2023-12-310001164727us-gaap:RetainedEarningsMember2024-01-012024-12-310001164727us-gaap:NoncontrollingInterestMember2024-01-012024-12-310001164727us-gaap:AccumulatedOtherComprehensiveIncomeMember2024-01-012024-12-310001164727us-gaap:CommonStockMember2024-01-012024-12-310001164727us-gaap:AdditionalPaidInCapitalMember2024-01-012024-12-310001164727us-gaap:TreasuryStockCommonMember2024-01-012024-12-310001164727us-gaap:CommonStockMember2024-12-310001164727us-gaap:TreasuryStockCommonMember2024-12-310001164727us-gaap:AdditionalPaidInCapitalMember2024-12-310001164727us-gaap:AccumulatedOtherComprehensiveIncomeMember2024-12-310001164727us-gaap:RetainedEarningsMember2024-12-310001164727us-gaap:NoncontrollingInterestMember2024-12-310001164727us-gaap:RetainedEarningsMember2025-01-012025-12-310001164727us-gaap:NoncontrollingInterestMember2025-01-012025-12-310001164727us-gaap:AccumulatedOtherComprehensiveIncomeMember2025-01-012025-12-310001164727us-gaap:CommonStockMember2025-01-012025-12-310001164727us-gaap:AdditionalPaidInCapitalMember2025-01-012025-12-310001164727us-gaap:TreasuryStockCommonMember2025-01-012025-12-310001164727us-gaap:CommonStockMember2025-12-310001164727us-gaap:TreasuryStockCommonMember2025-12-310001164727us-gaap:AdditionalPaidInCapitalMember2025-12-310001164727us-gaap:AccumulatedOtherComprehensiveIncomeMember2025-12-310001164727us-gaap:RetainedEarningsMember2025-12-310001164727us-gaap:NoncontrollingInterestMember2025-12-310001164727us-gaap:SubsequentEventMember2026-01-012026-02-190001164727nem:NewcrestMiningLimitedMember2023-11-062023-11-060001164727nem:MerianGoldProjectMemberus-gaap:VariableInterestEntityPrimaryBeneficiaryMember2025-01-012025-12-310001164727us-gaap:DiscontinuedOperationsDisposedOfBySaleMembernem:BatuHijauAndElangMember2024-07-012024-09-300001164727us-gaap:DiscontinuedOperationsDisposedOfBySaleMember2024-01-012024-12-310001164727us-gaap:DiscontinuedOperationsDisposedOfBySaleMember2023-01-012023-12-310001164727nem:YanacochaMember2025-12-310001164727nem:YanacochaMemberus-gaap:AssetUnderConstructionMember2025-12-310001164727nem:CongaMember2025-01-012025-12-310001164727nem:CongaMember2025-12-310001164727nem:CongaMember2024-12-310001164727srt:MinimumMember2025-01-012025-12-310001164727srt:MaximumMember2025-01-012025-12-310001164727nem:NewcrestMiningLimitedMember2023-11-060001164727nem:NewcrestMiningLimitedMember2025-12-310001164727nem:NewcrestMiningLimitedMember2025-01-012025-12-310001164727nem:NewcrestMiningLimitedMembernem:LihirMember2025-12-310001164727nem:NewcrestMiningLimitedMembernem:BrucejackMember2025-12-310001164727nem:NewcrestMiningLimitedMembernem:RedChrisMember2025-12-310001164727nem:NewcrestMiningLimitedMembernem:CadiaMember2025-12-310001164727nem:NewcrestMiningLimitedMember2023-11-062023-12-310001164727nem:NewcrestMiningLimitedMember2023-01-012023-12-310001164727us-gaap:DiscontinuedOperationsHeldforsaleMembernem:PortfolioOptimizationProgramMember2024-02-012024-02-290001164727us-gaap:DiscontinuedOperationsDisposedOfBySaleMembernem:TelferMember2025-12-310001164727us-gaap:DiscontinuedOperationsDisposedOfBySaleMembernem:CrippleCreekAndVictorMineMember2025-12-310001164727us-gaap:DiscontinuedOperationsDisposedOfBySaleMembernem:MusselwhiteMember2025-12-310001164727us-gaap:DiscontinuedOperationsDisposedOfBySaleMembernem:EleonoreMember2025-12-310001164727us-gaap:DiscontinuedOperationsDisposedOfBySaleMembernem:PorcupineMember2025-12-310001164727us-gaap:DiscontinuedOperationsDisposedOfBySaleMembernem:AkyemMember2025-12-310001164727us-gaap:DiscontinuedOperationsDisposedOfBySaleMembernem:CoffeeProjectMember2025-12-310001164727us-gaap:DiscontinuedOperationsDisposedOfBySaleMember2025-12-310001164727us-gaap:DiscontinuedOperationsDisposedOfBySaleMembernem:TelferMember2025-01-012025-12-310001164727us-gaap:DiscontinuedOperationsDisposedOfBySaleMembernem:CrippleCreekAndVictorMineMember2025-01-012025-12-310001164727us-gaap:DiscontinuedOperationsDisposedOfBySaleMembernem:MusselwhiteMember2025-01-012025-12-310001164727us-gaap:DiscontinuedOperationsDisposedOfBySaleMembernem:EleonoreMember2025-01-012025-12-310001164727us-gaap:DiscontinuedOperationsDisposedOfBySaleMembernem:PorcupineMember2025-01-012025-12-310001164727us-gaap:DiscontinuedOperationsDisposedOfBySaleMembernem:AkyemMember2025-01-012025-12-310001164727us-gaap:DiscontinuedOperationsDisposedOfBySaleMembernem:CoffeeProjectMember2025-01-012025-12-310001164727us-gaap:DiscontinuedOperationsDisposedOfBySaleMember2025-01-012025-12-310001164727us-gaap:DiscontinuedOperationsDisposedOfBySaleMembernem:CrippleCreekAndVictorMineMember2024-01-012025-12-310001164727us-gaap:DiscontinuedOperationsDisposedOfBySaleMembernem:PorcupineMember2024-01-012025-12-310001164727us-gaap:DiscontinuedOperationsDisposedOfBySaleMembernem:PorcupineMember2025-01-012025-03-310001164727us-gaap:DiscontinuedOperationsDisposedOfBySaleMembernem:CoffeeProjectMember2024-01-012025-12-310001164727us-gaap:DiscontinuedOperationsDisposedOfBySaleMembernem:CoffeeProjectMember2025-01-012025-03-310001164727us-gaap:DiscontinuedOperationsDisposedOfBySaleMembernem:CoffeeProjectMember2025-04-012025-06-300001164727us-gaap:DiscontinuedOperationsDisposedOfBySaleMembernem:TelferMember2024-12-040001164727nem:GreatlandResourcesLimitedMember2024-12-040001164727nem:GreatlandResourcesLimitedMember2024-12-040001164727nem:GreatlandResourcesLimitedMember2025-04-012025-06-300001164727nem:GreatlandResourcesLimitedMember2025-06-300001164727nem:GreatlandResourcesLimitedMember2025-01-012025-12-310001164727nem:GreatlandOptionMemberus-gaap:SubsequentEventMember2026-01-012026-01-310001164727us-gaap:DiscontinuedOperationsDisposedOfBySaleMembernem:CrippleCreekAndVictorMineMember2025-02-280001164727us-gaap:DiscontinuedOperationsDisposedOfBySaleMembernem:MusselwhiteMember2025-02-280001164727us-gaap:DiscontinuedOperationsDisposedOfBySaleMembernem:PorcupineMember2025-04-150001164727us-gaap:DiscontinuedOperationsDisposedOfBySaleMembernem:AkyemMember2025-04-150001164727us-gaap:DiscontinuedOperationsDisposedOfBySaleMembernem:AkyemMember2025-04-152025-04-150001164727us-gaap:DiscontinuedOperationsDisposedOfBySaleMembernem:AkyemMember2025-07-012025-09-300001164727us-gaap:DiscontinuedOperationsDisposedOfBySaleMembernem:CoffeeProjectMember2025-10-170001164727nem:FuerteMember2025-12-310001164727us-gaap:DiscontinuedOperationsHeldforsaleMembernem:PortfolioOptimizationProgramMember2024-01-012024-12-310001164727us-gaap:OperatingSegmentsMemberus-gaap:DiscontinuedOperationsHeldforsaleMembernem:PortfolioOptimizationProgramMembernem:CrippleCreekAndVictorMineMember2024-12-310001164727us-gaap:OperatingSegmentsMemberus-gaap:DiscontinuedOperationsHeldforsaleMembernem:PortfolioOptimizationProgramMembernem:MusselwhiteMember2024-12-310001164727us-gaap:OperatingSegmentsMemberus-gaap:DiscontinuedOperationsHeldforsaleMembernem:PortfolioOptimizationProgramMembernem:EleonoreMember2024-12-310001164727us-gaap:OperatingSegmentsMemberus-gaap:DiscontinuedOperationsHeldforsaleMembernem:PortfolioOptimizationProgramMembernem:PorcupineMember2024-12-310001164727us-gaap:OperatingSegmentsMemberus-gaap:DiscontinuedOperationsHeldforsaleMembernem:PortfolioOptimizationProgramMembernem:AkyemMember2024-12-310001164727us-gaap:CorporateNonSegmentMemberus-gaap:DiscontinuedOperationsHeldforsaleMembernem:PortfolioOptimizationProgramMember2024-12-310001164727nem:NevadaGoldMinesMember2025-12-310001164727us-gaap:OperatingSegmentsMemberus-gaap:SegmentContinuingOperationsMembernem:LihirMember2025-01-012025-12-310001164727us-gaap:OperatingSegmentsMemberus-gaap:SegmentContinuingOperationsMembernem:LihirMember2025-12-310001164727us-gaap:OperatingSegmentsMemberus-gaap:GoldMemberus-gaap:SegmentContinuingOperationsMembernem:CadiaMember2025-01-012025-12-310001164727us-gaap:OperatingSegmentsMembernem:CopperMemberus-gaap:SegmentContinuingOperationsMembernem:CadiaMember2025-01-012025-12-310001164727us-gaap:OperatingSegmentsMemberus-gaap:SegmentContinuingOperationsMembernem:CadiaMember2025-01-012025-12-310001164727us-gaap:OperatingSegmentsMemberus-gaap:SegmentContinuingOperationsMembernem:CadiaMember2025-12-310001164727us-gaap:OperatingSegmentsMemberus-gaap:SegmentContinuingOperationsMembernem:TanamiMember2025-01-012025-12-310001164727us-gaap:OperatingSegmentsMemberus-gaap:SegmentContinuingOperationsMembernem:TanamiMember2025-12-310001164727us-gaap:OperatingSegmentsMemberus-gaap:GoldMemberus-gaap:SegmentContinuingOperationsMembernem:BoddingtonMember2025-01-012025-12-310001164727us-gaap:OperatingSegmentsMembernem:CopperMemberus-gaap:SegmentContinuingOperationsMembernem:BoddingtonMember2025-01-012025-12-310001164727us-gaap:OperatingSegmentsMemberus-gaap:SegmentContinuingOperationsMembernem:BoddingtonMember2025-01-012025-12-310001164727us-gaap:OperatingSegmentsMemberus-gaap:SegmentContinuingOperationsMembernem:BoddingtonMember2025-12-310001164727us-gaap:OperatingSegmentsMemberus-gaap:SegmentContinuingOperationsMembernem:AhafoSouthMember2025-01-012025-12-310001164727us-gaap:OperatingSegmentsMemberus-gaap:SegmentContinuingOperationsMembernem:AhafoSouthMember2025-12-310001164727us-gaap:OperatingSegmentsMemberus-gaap:SegmentContinuingOperationsMembernem:AhafoNorthMember2025-01-012025-12-310001164727us-gaap:OperatingSegmentsMemberus-gaap:SegmentContinuingOperationsMembernem:AhafoNorthMember2025-12-310001164727us-gaap:OperatingSegmentsMemberus-gaap:SegmentContinuingOperationsMembernem:MerianGoldProjectMember2025-01-012025-12-310001164727us-gaap:OperatingSegmentsMemberus-gaap:SegmentContinuingOperationsMembernem:MerianGoldProjectMember2025-12-310001164727us-gaap:OperatingSegmentsMemberus-gaap:SegmentContinuingOperationsMembernem:CerroNegroMember2025-01-012025-12-310001164727us-gaap:OperatingSegmentsMemberus-gaap:SegmentContinuingOperationsMembernem:CerroNegroMember2025-12-310001164727us-gaap:OperatingSegmentsMemberus-gaap:SegmentContinuingOperationsMembernem:YanacochaMember2025-01-012025-12-310001164727us-gaap:OperatingSegmentsMemberus-gaap:SegmentContinuingOperationsMembernem:YanacochaMember2025-12-310001164727us-gaap:OperatingSegmentsMemberus-gaap:GoldMemberus-gaap:SegmentContinuingOperationsMembernem:PenasquitoMember2025-01-012025-12-310001164727us-gaap:OperatingSegmentsMembernem:SilverMemberus-gaap:SegmentContinuingOperationsMembernem:PenasquitoMember2025-01-012025-12-310001164727us-gaap:OperatingSegmentsMembernem:LeadMemberus-gaap:SegmentContinuingOperationsMembernem:PenasquitoMember2025-01-012025-12-310001164727us-gaap:OperatingSegmentsMembernem:ZincMemberus-gaap:SegmentContinuingOperationsMembernem:PenasquitoMember2025-01-012025-12-310001164727us-gaap:OperatingSegmentsMemberus-gaap:SegmentContinuingOperationsMembernem:PenasquitoMember2025-01-012025-12-310001164727us-gaap:OperatingSegmentsMemberus-gaap:SegmentContinuingOperationsMembernem:PenasquitoMember2025-12-310001164727us-gaap:OperatingSegmentsMemberus-gaap:GoldMemberus-gaap:SegmentContinuingOperationsMembernem:RedChrisMember2025-01-012025-12-310001164727us-gaap:OperatingSegmentsMembernem:CopperMemberus-gaap:SegmentContinuingOperationsMembernem:RedChrisMember2025-01-012025-12-310001164727us-gaap:OperatingSegmentsMemberus-gaap:SegmentContinuingOperationsMembernem:RedChrisMember2025-01-012025-12-310001164727us-gaap:OperatingSegmentsMemberus-gaap:SegmentContinuingOperationsMembernem:RedChrisMember2025-12-310001164727us-gaap:OperatingSegmentsMemberus-gaap:SegmentContinuingOperationsMembernem:BrucejackMember2025-01-012025-12-310001164727us-gaap:OperatingSegmentsMemberus-gaap:SegmentContinuingOperationsMembernem:BrucejackMember2025-12-310001164727us-gaap:OperatingSegmentsMemberus-gaap:SegmentContinuingOperationsMembernem:NevadaGoldMinesMember2025-01-012025-12-310001164727us-gaap:OperatingSegmentsMemberus-gaap:SegmentContinuingOperationsMembernem:NevadaGoldMinesMember2025-12-310001164727us-gaap:OperatingSegmentsMember2025-01-012025-12-310001164727us-gaap:OperatingSegmentsMember2025-12-310001164727us-gaap:CorporateNonSegmentMember2025-01-012025-12-310001164727us-gaap:CorporateNonSegmentMember2025-12-310001164727us-gaap:OperatingSegmentsMemberus-gaap:SegmentDiscontinuedOperationsMembernem:CrippleCreekAndVictorMineMember2025-01-012025-12-310001164727us-gaap:OperatingSegmentsMemberus-gaap:SegmentDiscontinuedOperationsMembernem:CrippleCreekAndVictorMineMember2025-12-310001164727us-gaap:OperatingSegmentsMemberus-gaap:SegmentDiscontinuedOperationsMembernem:MusselwhiteMember2025-01-012025-12-310001164727us-gaap:OperatingSegmentsMemberus-gaap:SegmentDiscontinuedOperationsMembernem:MusselwhiteMember2025-12-310001164727us-gaap:OperatingSegmentsMemberus-gaap:SegmentDiscontinuedOperationsMembernem:PorcupineMember2025-01-012025-12-310001164727us-gaap:OperatingSegmentsMemberus-gaap:SegmentDiscontinuedOperationsMembernem:PorcupineMember2025-12-310001164727us-gaap:OperatingSegmentsMemberus-gaap:SegmentDiscontinuedOperationsMembernem:EleonoreMember2025-01-012025-12-310001164727us-gaap:OperatingSegmentsMemberus-gaap:SegmentDiscontinuedOperationsMembernem:EleonoreMember2025-12-310001164727us-gaap:OperatingSegmentsMemberus-gaap:SegmentDiscontinuedOperationsMembernem:AkyemMember2025-01-012025-12-310001164727us-gaap:OperatingSegmentsMemberus-gaap:SegmentDiscontinuedOperationsMembernem:AkyemMember2025-12-310001164727us-gaap:OperatingSegmentsMembernem:LihirMember2024-01-012024-12-310001164727us-gaap:OperatingSegmentsMembernem:LihirMember2024-12-310001164727us-gaap:OperatingSegmentsMemberus-gaap:GoldMembernem:CadiaMember2024-01-012024-12-310001164727us-gaap:OperatingSegmentsMembernem:CopperMembernem:CadiaMember2024-01-012024-12-310001164727us-gaap:OperatingSegmentsMembernem:CadiaMember2024-01-012024-12-310001164727us-gaap:OperatingSegmentsMembernem:CadiaMember2024-12-310001164727us-gaap:OperatingSegmentsMembernem:TanamiMember2024-01-012024-12-310001164727us-gaap:OperatingSegmentsMembernem:TanamiMember2024-12-310001164727us-gaap:OperatingSegmentsMemberus-gaap:GoldMembernem:BoddingtonMember2024-01-012024-12-310001164727us-gaap:OperatingSegmentsMembernem:CopperMembernem:BoddingtonMember2024-01-012024-12-310001164727us-gaap:OperatingSegmentsMembernem:BoddingtonMember2024-01-012024-12-310001164727us-gaap:OperatingSegmentsMembernem:BoddingtonMember2024-12-310001164727us-gaap:OperatingSegmentsMembernem:AhafoSouthMember2024-01-012024-12-310001164727us-gaap:OperatingSegmentsMembernem:AhafoSouthMember2024-12-310001164727us-gaap:OperatingSegmentsMembernem:AhafoNorthMember2024-01-012024-12-310001164727us-gaap:OperatingSegmentsMembernem:AhafoNorthMember2024-12-310001164727us-gaap:OperatingSegmentsMembernem:MerianGoldProjectMember2024-01-012024-12-310001164727us-gaap:OperatingSegmentsMembernem:MerianGoldProjectMember2024-12-310001164727us-gaap:OperatingSegmentsMembernem:CerroNegroMember2024-01-012024-12-310001164727us-gaap:OperatingSegmentsMembernem:CerroNegroMember2024-12-310001164727us-gaap:OperatingSegmentsMembernem:YanacochaMember2024-01-012024-12-310001164727us-gaap:OperatingSegmentsMembernem:YanacochaMember2024-12-310001164727us-gaap:OperatingSegmentsMemberus-gaap:GoldMembernem:PenasquitoMember2024-01-012024-12-310001164727us-gaap:OperatingSegmentsMembernem:SilverMembernem:PenasquitoMember2024-01-012024-12-310001164727us-gaap:OperatingSegmentsMembernem:LeadMembernem:PenasquitoMember2024-01-012024-12-310001164727us-gaap:OperatingSegmentsMembernem:ZincMembernem:PenasquitoMember2024-01-012024-12-310001164727us-gaap:OperatingSegmentsMembernem:PenasquitoMember2024-01-012024-12-310001164727us-gaap:OperatingSegmentsMembernem:PenasquitoMember2024-12-310001164727us-gaap:OperatingSegmentsMemberus-gaap:GoldMembernem:RedChrisMember2024-01-012024-12-310001164727us-gaap:OperatingSegmentsMembernem:CopperMembernem:RedChrisMember2024-01-012024-12-310001164727us-gaap:OperatingSegmentsMembernem:RedChrisMember2024-01-012024-12-310001164727us-gaap:OperatingSegmentsMembernem:RedChrisMember2024-12-310001164727us-gaap:OperatingSegmentsMembernem:BrucejackMember2024-01-012024-12-310001164727us-gaap:OperatingSegmentsMembernem:BrucejackMember2024-12-310001164727us-gaap:OperatingSegmentsMembernem:NevadaGoldMinesMember2024-01-012024-12-310001164727us-gaap:OperatingSegmentsMembernem:NevadaGoldMinesMember2024-12-310001164727us-gaap:OperatingSegmentsMembernem:CrippleCreekAndVictorMineMember2024-01-012024-12-310001164727us-gaap:OperatingSegmentsMembernem:CrippleCreekAndVictorMineMember2024-12-310001164727us-gaap:OperatingSegmentsMembernem:MusselwhiteMember2024-01-012024-12-310001164727us-gaap:OperatingSegmentsMembernem:MusselwhiteMember2024-12-310001164727us-gaap:OperatingSegmentsMembernem:PorcupineMember2024-01-012024-12-310001164727us-gaap:OperatingSegmentsMembernem:PorcupineMember2024-12-310001164727us-gaap:OperatingSegmentsMembernem:EleonoreMember2024-01-012024-12-310001164727us-gaap:OperatingSegmentsMembernem:EleonoreMember2024-12-310001164727us-gaap:OperatingSegmentsMembernem:AkyemMember2024-01-012024-12-310001164727us-gaap:OperatingSegmentsMembernem:AkyemMember2024-12-310001164727us-gaap:OperatingSegmentsMember2024-01-012024-12-310001164727us-gaap:OperatingSegmentsMember2024-12-310001164727us-gaap:CorporateNonSegmentMember2024-01-012024-12-310001164727us-gaap:CorporateNonSegmentMember2024-12-310001164727us-gaap:OperatingSegmentsMemberus-gaap:GoldMembernem:TelferMember2024-01-012024-12-310001164727us-gaap:OperatingSegmentsMembernem:CopperMembernem:TelferMember2024-01-012024-12-310001164727us-gaap:OperatingSegmentsMembernem:TelferMember2024-01-012024-12-310001164727us-gaap:OperatingSegmentsMembernem:TelferMember2024-12-310001164727us-gaap:OperatingSegmentsMembernem:LihirMember2023-01-012023-12-310001164727us-gaap:OperatingSegmentsMembernem:LihirMember2023-12-310001164727us-gaap:OperatingSegmentsMemberus-gaap:GoldMembernem:CadiaMember2023-01-012023-12-310001164727us-gaap:OperatingSegmentsMembernem:CopperMembernem:CadiaMember2023-01-012023-12-310001164727us-gaap:OperatingSegmentsMembernem:CadiaMember2023-01-012023-12-310001164727us-gaap:OperatingSegmentsMembernem:CadiaMember2023-12-310001164727us-gaap:OperatingSegmentsMembernem:TanamiMember2023-01-012023-12-310001164727us-gaap:OperatingSegmentsMembernem:TanamiMember2023-12-310001164727us-gaap:OperatingSegmentsMemberus-gaap:GoldMembernem:BoddingtonMember2023-01-012023-12-310001164727us-gaap:OperatingSegmentsMembernem:CopperMembernem:BoddingtonMember2023-01-012023-12-310001164727us-gaap:OperatingSegmentsMembernem:BoddingtonMember2023-01-012023-12-310001164727us-gaap:OperatingSegmentsMembernem:BoddingtonMember2023-12-310001164727us-gaap:OperatingSegmentsMemberus-gaap:GoldMembernem:TelferMember2023-01-012023-12-310001164727us-gaap:OperatingSegmentsMembernem:CopperMembernem:TelferMember2023-01-012023-12-310001164727us-gaap:OperatingSegmentsMembernem:TelferMember2023-01-012023-12-310001164727us-gaap:OperatingSegmentsMembernem:TelferMember2023-12-310001164727us-gaap:OperatingSegmentsMembernem:AhafoSouthMember2023-01-012023-12-310001164727us-gaap:OperatingSegmentsMembernem:AhafoSouthMember2023-12-310001164727us-gaap:OperatingSegmentsMembernem:AhafoNorthMember2023-01-012023-12-310001164727us-gaap:OperatingSegmentsMembernem:AhafoNorthMember2023-12-310001164727us-gaap:OperatingSegmentsMembernem:AkyemMember2023-01-012023-12-310001164727us-gaap:OperatingSegmentsMembernem:AkyemMember2023-12-310001164727us-gaap:OperatingSegmentsMembernem:MerianGoldProjectMember2023-01-012023-12-310001164727us-gaap:OperatingSegmentsMembernem:MerianGoldProjectMember2023-12-310001164727us-gaap:OperatingSegmentsMembernem:CerroNegroMember2023-01-012023-12-310001164727us-gaap:OperatingSegmentsMembernem:CerroNegroMember2023-12-310001164727us-gaap:OperatingSegmentsMembernem:PorcupineMember2023-01-012023-12-310001164727us-gaap:OperatingSegmentsMembernem:PorcupineMember2023-12-310001164727us-gaap:OperatingSegmentsMembernem:EleonoreMember2023-01-012023-12-310001164727us-gaap:OperatingSegmentsMembernem:EleonoreMember2023-12-310001164727us-gaap:OperatingSegmentsMembernem:YanacochaMember2023-01-012023-12-310001164727us-gaap:OperatingSegmentsMembernem:YanacochaMember2023-12-310001164727us-gaap:OperatingSegmentsMembernem:MusselwhiteMember2023-01-012023-12-310001164727us-gaap:OperatingSegmentsMembernem:MusselwhiteMember2023-12-310001164727us-gaap:OperatingSegmentsMemberus-gaap:GoldMembernem:PenasquitoMember2023-01-012023-12-310001164727us-gaap:OperatingSegmentsMembernem:SilverMembernem:PenasquitoMember2023-01-012023-12-310001164727us-gaap:OperatingSegmentsMembernem:LeadMembernem:PenasquitoMember2023-01-012023-12-310001164727us-gaap:OperatingSegmentsMembernem:ZincMembernem:PenasquitoMember2023-01-012023-12-310001164727us-gaap:OperatingSegmentsMembernem:PenasquitoMember2023-01-012023-12-310001164727us-gaap:OperatingSegmentsMembernem:PenasquitoMember2023-12-310001164727us-gaap:OperatingSegmentsMembernem:CrippleCreekAndVictorMineMember2023-01-012023-12-310001164727us-gaap:OperatingSegmentsMembernem:CrippleCreekAndVictorMineMember2023-12-310001164727us-gaap:OperatingSegmentsMemberus-gaap:GoldMembernem:RedChrisMember2023-01-012023-12-310001164727us-gaap:OperatingSegmentsMembernem:CopperMembernem:RedChrisMember2023-01-012023-12-310001164727us-gaap:OperatingSegmentsMembernem:RedChrisMember2023-01-012023-12-310001164727us-gaap:OperatingSegmentsMembernem:RedChrisMember2023-12-310001164727us-gaap:OperatingSegmentsMembernem:BrucejackMember2023-01-012023-12-310001164727us-gaap:OperatingSegmentsMembernem:BrucejackMember2023-12-310001164727us-gaap:OperatingSegmentsMembernem:NevadaGoldMinesMember2023-01-012023-12-310001164727us-gaap:OperatingSegmentsMembernem:NevadaGoldMinesMember2023-12-310001164727us-gaap:OperatingSegmentsMember2023-01-012023-12-310001164727us-gaap:OperatingSegmentsMember2023-12-310001164727us-gaap:CorporateNonSegmentMember2023-01-012023-12-310001164727us-gaap:CorporateNonSegmentMember2023-12-310001164727country:AU2025-12-310001164727country:AU2024-12-310001164727country:US2025-12-310001164727country:US2024-12-310001164727country:CA2025-12-310001164727country:CA2024-12-310001164727country:PG2025-12-310001164727country:PG2024-12-310001164727country:MX2025-12-310001164727country:MX2024-12-310001164727country:GH2025-12-310001164727country:GH2024-12-310001164727country:AR2025-12-310001164727country:AR2024-12-310001164727country:PE2025-12-310001164727country:PE2024-12-310001164727country:SR2025-12-310001164727country:SR2024-12-310001164727nem:OtherCountriesMember2025-12-310001164727nem:OtherCountriesMember2024-12-310001164727us-gaap:OperatingSegmentsMembernem:GoldDoreMemberus-gaap:SegmentContinuingOperationsMembernem:LihirMember2025-01-012025-12-310001164727us-gaap:OperatingSegmentsMembernem:SalesFromConcentrateAndOtherProductionMemberus-gaap:SegmentContinuingOperationsMembernem:LihirMember2025-01-012025-12-310001164727us-gaap:OperatingSegmentsMembernem:GoldDoreMemberus-gaap:SegmentContinuingOperationsMembernem:LihirMember2024-01-012024-12-310001164727us-gaap:OperatingSegmentsMembernem:SalesFromConcentrateAndOtherProductionMemberus-gaap:SegmentContinuingOperationsMembernem:LihirMember2024-01-012024-12-310001164727us-gaap:OperatingSegmentsMemberus-gaap:SegmentContinuingOperationsMembernem:LihirMember2024-01-012024-12-310001164727us-gaap:OperatingSegmentsMembernem:GoldDoreMemberus-gaap:SegmentContinuingOperationsMembernem:LihirMember2023-01-012023-12-310001164727us-gaap:OperatingSegmentsMembernem:SalesFromConcentrateAndOtherProductionMemberus-gaap:SegmentContinuingOperationsMembernem:LihirMember2023-01-012023-12-310001164727us-gaap:OperatingSegmentsMemberus-gaap:SegmentContinuingOperationsMembernem:LihirMember2023-01-012023-12-310001164727us-gaap:OperatingSegmentsMembernem:GoldDoreMemberus-gaap:SegmentContinuingOperationsMembernem:CadiaGoldSubsegmentMembernem:CadiaMember2025-01-012025-12-310001164727us-gaap:OperatingSegmentsMembernem:SalesFromConcentrateAndOtherProductionMemberus-gaap:SegmentContinuingOperationsMembernem:CadiaGoldSubsegmentMembernem:CadiaMember2025-01-012025-12-310001164727us-gaap:OperatingSegmentsMemberus-gaap:SegmentContinuingOperationsMembernem:CadiaGoldSubsegmentMembernem:CadiaMember2025-01-012025-12-310001164727us-gaap:OperatingSegmentsMembernem:GoldDoreMemberus-gaap:SegmentContinuingOperationsMembernem:CadiaGoldSubsegmentMembernem:CadiaMember2024-01-012024-12-310001164727us-gaap:OperatingSegmentsMembernem:SalesFromConcentrateAndOtherProductionMemberus-gaap:SegmentContinuingOperationsMembernem:CadiaGoldSubsegmentMembernem:CadiaMember2024-01-012024-12-310001164727us-gaap:OperatingSegmentsMemberus-gaap:SegmentContinuingOperationsMembernem:CadiaGoldSubsegmentMembernem:CadiaMember2024-01-012024-12-310001164727us-gaap:OperatingSegmentsMembernem:GoldDoreMemberus-gaap:SegmentContinuingOperationsMembernem:CadiaGoldSubsegmentMembernem:CadiaMember2023-01-012023-12-310001164727us-gaap:OperatingSegmentsMembernem:SalesFromConcentrateAndOtherProductionMemberus-gaap:SegmentContinuingOperationsMembernem:CadiaGoldSubsegmentMembernem:CadiaMember2023-01-012023-12-310001164727us-gaap:OperatingSegmentsMemberus-gaap:SegmentContinuingOperationsMembernem:CadiaGoldSubsegmentMembernem:CadiaMember2023-01-012023-12-310001164727us-gaap:OperatingSegmentsMembernem:GoldDoreMemberus-gaap:SegmentContinuingOperationsMembernem:CadiaCopperSubsegmentMembernem:CadiaMember2025-01-012025-12-310001164727us-gaap:OperatingSegmentsMembernem:SalesFromConcentrateAndOtherProductionMemberus-gaap:SegmentContinuingOperationsMembernem:CadiaCopperSubsegmentMembernem:CadiaMember2025-01-012025-12-310001164727us-gaap:OperatingSegmentsMemberus-gaap:SegmentContinuingOperationsMembernem:CadiaCopperSubsegmentMembernem:CadiaMember2025-01-012025-12-310001164727us-gaap:OperatingSegmentsMembernem:GoldDoreMemberus-gaap:SegmentContinuingOperationsMembernem:CadiaCopperSubsegmentMembernem:CadiaMember2024-01-012024-12-310001164727us-gaap:OperatingSegmentsMembernem:SalesFromConcentrateAndOtherProductionMemberus-gaap:SegmentContinuingOperationsMembernem:CadiaCopperSubsegmentMembernem:CadiaMember2024-01-012024-12-310001164727us-gaap:OperatingSegmentsMemberus-gaap:SegmentContinuingOperationsMembernem:CadiaCopperSubsegmentMembernem:CadiaMember2024-01-012024-12-310001164727us-gaap:OperatingSegmentsMembernem:GoldDoreMemberus-gaap:SegmentContinuingOperationsMembernem:CadiaCopperSubsegmentMembernem:CadiaMember2023-01-012023-12-310001164727us-gaap:OperatingSegmentsMembernem:SalesFromConcentrateAndOtherProductionMemberus-gaap:SegmentContinuingOperationsMembernem:CadiaCopperSubsegmentMembernem:CadiaMember2023-01-012023-12-310001164727us-gaap:OperatingSegmentsMemberus-gaap:SegmentContinuingOperationsMembernem:CadiaCopperSubsegmentMembernem:CadiaMember2023-01-012023-12-310001164727us-gaap:OperatingSegmentsMembernem:GoldDoreMemberus-gaap:SegmentContinuingOperationsMembernem:CadiaMember2025-01-012025-12-310001164727us-gaap:OperatingSegmentsMembernem:SalesFromConcentrateAndOtherProductionMemberus-gaap:SegmentContinuingOperationsMembernem:CadiaMember2025-01-012025-12-310001164727us-gaap:OperatingSegmentsMembernem:GoldDoreMemberus-gaap:SegmentContinuingOperationsMembernem:CadiaMember2024-01-012024-12-310001164727us-gaap:OperatingSegmentsMembernem:SalesFromConcentrateAndOtherProductionMemberus-gaap:SegmentContinuingOperationsMembernem:CadiaMember2024-01-012024-12-310001164727us-gaap:OperatingSegmentsMemberus-gaap:SegmentContinuingOperationsMembernem:CadiaMember2024-01-012024-12-310001164727us-gaap:OperatingSegmentsMembernem:GoldDoreMemberus-gaap:SegmentContinuingOperationsMembernem:CadiaMember2023-01-012023-12-310001164727us-gaap:OperatingSegmentsMembernem:SalesFromConcentrateAndOtherProductionMemberus-gaap:SegmentContinuingOperationsMembernem:CadiaMember2023-01-012023-12-310001164727us-gaap:OperatingSegmentsMemberus-gaap:SegmentContinuingOperationsMembernem:CadiaMember2023-01-012023-12-310001164727us-gaap:OperatingSegmentsMembernem:GoldDoreMemberus-gaap:SegmentContinuingOperationsMembernem:TanamiMember2025-01-012025-12-310001164727us-gaap:OperatingSegmentsMembernem:SalesFromConcentrateAndOtherProductionMemberus-gaap:SegmentContinuingOperationsMembernem:TanamiMember2025-01-012025-12-310001164727us-gaap:OperatingSegmentsMembernem:GoldDoreMemberus-gaap:SegmentContinuingOperationsMembernem:TanamiMember2024-01-012024-12-310001164727us-gaap:OperatingSegmentsMembernem:SalesFromConcentrateAndOtherProductionMemberus-gaap:SegmentContinuingOperationsMembernem:TanamiMember2024-01-012024-12-310001164727us-gaap:OperatingSegmentsMemberus-gaap:SegmentContinuingOperationsMembernem:TanamiMember2024-01-012024-12-310001164727us-gaap:OperatingSegmentsMembernem:GoldDoreMemberus-gaap:SegmentContinuingOperationsMembernem:TanamiMember2023-01-012023-12-310001164727us-gaap:OperatingSegmentsMembernem:SalesFromConcentrateAndOtherProductionMemberus-gaap:SegmentContinuingOperationsMembernem:TanamiMember2023-01-012023-12-310001164727us-gaap:OperatingSegmentsMemberus-gaap:SegmentContinuingOperationsMembernem:TanamiMember2023-01-012023-12-310001164727us-gaap:OperatingSegmentsMembernem:GoldDoreMemberus-gaap:SegmentContinuingOperationsMembernem:BoddingtonGoldSubsegmentMembernem:BoddingtonMember2025-01-012025-12-310001164727us-gaap:OperatingSegmentsMembernem:SalesFromConcentrateAndOtherProductionMemberus-gaap:SegmentContinuingOperationsMembernem:BoddingtonGoldSubsegmentMembernem:BoddingtonMember2025-01-012025-12-310001164727us-gaap:OperatingSegmentsMemberus-gaap:SegmentContinuingOperationsMembernem:BoddingtonGoldSubsegmentMembernem:BoddingtonMember2025-01-012025-12-310001164727us-gaap:OperatingSegmentsMembernem:GoldDoreMemberus-gaap:SegmentContinuingOperationsMembernem:BoddingtonGoldSubsegmentMembernem:BoddingtonMember2024-01-012024-12-310001164727us-gaap:OperatingSegmentsMembernem:SalesFromConcentrateAndOtherProductionMemberus-gaap:SegmentContinuingOperationsMembernem:BoddingtonGoldSubsegmentMembernem:BoddingtonMember2024-01-012024-12-310001164727us-gaap:OperatingSegmentsMemberus-gaap:SegmentContinuingOperationsMembernem:BoddingtonGoldSubsegmentMembernem:BoddingtonMember2024-01-012024-12-310001164727us-gaap:OperatingSegmentsMembernem:GoldDoreMemberus-gaap:SegmentContinuingOperationsMembernem:BoddingtonGoldSubsegmentMembernem:BoddingtonMember2023-01-012023-12-310001164727us-gaap:OperatingSegmentsMembernem:SalesFromConcentrateAndOtherProductionMemberus-gaap:SegmentContinuingOperationsMembernem:BoddingtonGoldSubsegmentMembernem:BoddingtonMember2023-01-012023-12-310001164727us-gaap:OperatingSegmentsMemberus-gaap:SegmentContinuingOperationsMembernem:BoddingtonGoldSubsegmentMembernem:BoddingtonMember2023-01-012023-12-310001164727us-gaap:OperatingSegmentsMembernem:GoldDoreMemberus-gaap:SegmentContinuingOperationsMembernem:BoddingtonCopperSubsegmentMembernem:BoddingtonMember2025-01-012025-12-310001164727us-gaap:OperatingSegmentsMembernem:SalesFromConcentrateAndOtherProductionMemberus-gaap:SegmentContinuingOperationsMembernem:BoddingtonCopperSubsegmentMembernem:BoddingtonMember2025-01-012025-12-310001164727us-gaap:OperatingSegmentsMemberus-gaap:SegmentContinuingOperationsMembernem:BoddingtonCopperSubsegmentMembernem:BoddingtonMember2025-01-012025-12-310001164727us-gaap:OperatingSegmentsMembernem:GoldDoreMemberus-gaap:SegmentContinuingOperationsMembernem:BoddingtonCopperSubsegmentMembernem:BoddingtonMember2024-01-012024-12-310001164727us-gaap:OperatingSegmentsMembernem:SalesFromConcentrateAndOtherProductionMemberus-gaap:SegmentContinuingOperationsMembernem:BoddingtonCopperSubsegmentMembernem:BoddingtonMember2024-01-012024-12-310001164727us-gaap:OperatingSegmentsMemberus-gaap:SegmentContinuingOperationsMembernem:BoddingtonCopperSubsegmentMembernem:BoddingtonMember2024-01-012024-12-310001164727us-gaap:OperatingSegmentsMembernem:GoldDoreMemberus-gaap:SegmentContinuingOperationsMembernem:BoddingtonCopperSubsegmentMembernem:BoddingtonMember2023-01-012023-12-310001164727us-gaap:OperatingSegmentsMembernem:SalesFromConcentrateAndOtherProductionMemberus-gaap:SegmentContinuingOperationsMembernem:BoddingtonCopperSubsegmentMembernem:BoddingtonMember2023-01-012023-12-310001164727us-gaap:OperatingSegmentsMemberus-gaap:SegmentContinuingOperationsMembernem:BoddingtonCopperSubsegmentMembernem:BoddingtonMember2023-01-012023-12-310001164727us-gaap:OperatingSegmentsMembernem:GoldDoreMemberus-gaap:SegmentContinuingOperationsMembernem:BoddingtonMember2025-01-012025-12-310001164727us-gaap:OperatingSegmentsMembernem:SalesFromConcentrateAndOtherProductionMemberus-gaap:SegmentContinuingOperationsMembernem:BoddingtonMember2025-01-012025-12-310001164727us-gaap:OperatingSegmentsMembernem:GoldDoreMemberus-gaap:SegmentContinuingOperationsMembernem:BoddingtonMember2024-01-012024-12-310001164727us-gaap:OperatingSegmentsMembernem:SalesFromConcentrateAndOtherProductionMemberus-gaap:SegmentContinuingOperationsMembernem:BoddingtonMember2024-01-012024-12-310001164727us-gaap:OperatingSegmentsMemberus-gaap:SegmentContinuingOperationsMembernem:BoddingtonMember2024-01-012024-12-310001164727us-gaap:OperatingSegmentsMembernem:GoldDoreMemberus-gaap:SegmentContinuingOperationsMembernem:BoddingtonMember2023-01-012023-12-310001164727us-gaap:OperatingSegmentsMembernem:SalesFromConcentrateAndOtherProductionMemberus-gaap:SegmentContinuingOperationsMembernem:BoddingtonMember2023-01-012023-12-310001164727us-gaap:OperatingSegmentsMemberus-gaap:SegmentContinuingOperationsMembernem:BoddingtonMember2023-01-012023-12-310001164727us-gaap:OperatingSegmentsMembernem:GoldDoreMemberus-gaap:SegmentContinuingOperationsMembernem:AhafoMember2025-01-012025-12-310001164727us-gaap:OperatingSegmentsMembernem:SalesFromConcentrateAndOtherProductionMemberus-gaap:SegmentContinuingOperationsMembernem:AhafoMember2025-01-012025-12-310001164727us-gaap:OperatingSegmentsMemberus-gaap:SegmentContinuingOperationsMembernem:AhafoMember2025-01-012025-12-310001164727us-gaap:OperatingSegmentsMembernem:GoldDoreMemberus-gaap:SegmentContinuingOperationsMembernem:AhafoMember2024-01-012024-12-310001164727us-gaap:OperatingSegmentsMembernem:SalesFromConcentrateAndOtherProductionMemberus-gaap:SegmentContinuingOperationsMembernem:AhafoMember2024-01-012024-12-310001164727us-gaap:OperatingSegmentsMemberus-gaap:SegmentContinuingOperationsMembernem:AhafoMember2024-01-012024-12-310001164727us-gaap:OperatingSegmentsMembernem:GoldDoreMemberus-gaap:SegmentContinuingOperationsMembernem:AhafoMember2023-01-012023-12-310001164727us-gaap:OperatingSegmentsMembernem:SalesFromConcentrateAndOtherProductionMemberus-gaap:SegmentContinuingOperationsMembernem:AhafoMember2023-01-012023-12-310001164727us-gaap:OperatingSegmentsMemberus-gaap:SegmentContinuingOperationsMembernem:AhafoMember2023-01-012023-12-310001164727us-gaap:OperatingSegmentsMembernem:GoldDoreMemberus-gaap:SegmentContinuingOperationsMembernem:AhafoNorthMember2025-01-012025-12-310001164727us-gaap:OperatingSegmentsMembernem:SalesFromConcentrateAndOtherProductionMemberus-gaap:SegmentContinuingOperationsMembernem:AhafoNorthMember2025-01-012025-12-310001164727us-gaap:OperatingSegmentsMembernem:GoldDoreMemberus-gaap:SegmentContinuingOperationsMembernem:AhafoNorthMember2024-01-012024-12-310001164727us-gaap:OperatingSegmentsMembernem:SalesFromConcentrateAndOtherProductionMemberus-gaap:SegmentContinuingOperationsMembernem:AhafoNorthMember2024-01-012024-12-310001164727us-gaap:OperatingSegmentsMemberus-gaap:SegmentContinuingOperationsMembernem:AhafoNorthMember2024-01-012024-12-310001164727us-gaap:OperatingSegmentsMembernem:GoldDoreMemberus-gaap:SegmentContinuingOperationsMembernem:AhafoNorthMember2023-01-012023-12-310001164727us-gaap:OperatingSegmentsMembernem:SalesFromConcentrateAndOtherProductionMemberus-gaap:SegmentContinuingOperationsMembernem:AhafoNorthMember2023-01-012023-12-310001164727us-gaap:OperatingSegmentsMemberus-gaap:SegmentContinuingOperationsMembernem:AhafoNorthMember2023-01-012023-12-310001164727us-gaap:OperatingSegmentsMembernem:GoldDoreMemberus-gaap:SegmentContinuingOperationsMembernem:MerianGoldProjectMember2025-01-012025-12-310001164727us-gaap:OperatingSegmentsMembernem:SalesFromConcentrateAndOtherProductionMemberus-gaap:SegmentContinuingOperationsMembernem:MerianGoldProjectMember2025-01-012025-12-310001164727us-gaap:OperatingSegmentsMembernem:GoldDoreMemberus-gaap:SegmentContinuingOperationsMembernem:MerianGoldProjectMember2024-01-012024-12-310001164727us-gaap:OperatingSegmentsMembernem:SalesFromConcentrateAndOtherProductionMemberus-gaap:SegmentContinuingOperationsMembernem:MerianGoldProjectMember2024-01-012024-12-310001164727us-gaap:OperatingSegmentsMemberus-gaap:SegmentContinuingOperationsMembernem:MerianGoldProjectMember2024-01-012024-12-310001164727us-gaap:OperatingSegmentsMembernem:GoldDoreMemberus-gaap:SegmentContinuingOperationsMembernem:MerianGoldProjectMember2023-01-012023-12-310001164727us-gaap:OperatingSegmentsMembernem:SalesFromConcentrateAndOtherProductionMemberus-gaap:SegmentContinuingOperationsMembernem:MerianGoldProjectMember2023-01-012023-12-310001164727us-gaap:OperatingSegmentsMemberus-gaap:SegmentContinuingOperationsMembernem:MerianGoldProjectMember2023-01-012023-12-310001164727us-gaap:OperatingSegmentsMembernem:GoldDoreMemberus-gaap:SegmentContinuingOperationsMembernem:CerroNegroMember2025-01-012025-12-310001164727us-gaap:OperatingSegmentsMembernem:SalesFromConcentrateAndOtherProductionMemberus-gaap:SegmentContinuingOperationsMembernem:CerroNegroMember2025-01-012025-12-310001164727us-gaap:OperatingSegmentsMembernem:GoldDoreMemberus-gaap:SegmentContinuingOperationsMembernem:CerroNegroMember2024-01-012024-12-310001164727us-gaap:OperatingSegmentsMembernem:SalesFromConcentrateAndOtherProductionMemberus-gaap:SegmentContinuingOperationsMembernem:CerroNegroMember2024-01-012024-12-310001164727us-gaap:OperatingSegmentsMemberus-gaap:SegmentContinuingOperationsMembernem:CerroNegroMember2024-01-012024-12-310001164727us-gaap:OperatingSegmentsMembernem:GoldDoreMemberus-gaap:SegmentContinuingOperationsMembernem:CerroNegroMember2023-01-012023-12-310001164727us-gaap:OperatingSegmentsMembernem:SalesFromConcentrateAndOtherProductionMemberus-gaap:SegmentContinuingOperationsMembernem:CerroNegroMember2023-01-012023-12-310001164727us-gaap:OperatingSegmentsMemberus-gaap:SegmentContinuingOperationsMembernem:CerroNegroMember2023-01-012023-12-310001164727us-gaap:OperatingSegmentsMembernem:GoldDoreMemberus-gaap:SegmentContinuingOperationsMembernem:YanacochaMember2025-01-012025-12-310001164727us-gaap:OperatingSegmentsMembernem:SalesFromConcentrateAndOtherProductionMemberus-gaap:SegmentContinuingOperationsMembernem:YanacochaMember2025-01-012025-12-310001164727us-gaap:OperatingSegmentsMembernem:GoldDoreMemberus-gaap:SegmentContinuingOperationsMembernem:YanacochaMember2024-01-012024-12-310001164727us-gaap:OperatingSegmentsMembernem:SalesFromConcentrateAndOtherProductionMemberus-gaap:SegmentContinuingOperationsMembernem:YanacochaMember2024-01-012024-12-310001164727us-gaap:OperatingSegmentsMemberus-gaap:SegmentContinuingOperationsMembernem:YanacochaMember2024-01-012024-12-310001164727us-gaap:OperatingSegmentsMembernem:GoldDoreMemberus-gaap:SegmentContinuingOperationsMembernem:YanacochaMember2023-01-012023-12-310001164727us-gaap:OperatingSegmentsMembernem:SalesFromConcentrateAndOtherProductionMemberus-gaap:SegmentContinuingOperationsMembernem:YanacochaMember2023-01-012023-12-310001164727us-gaap:OperatingSegmentsMemberus-gaap:SegmentContinuingOperationsMembernem:YanacochaMember2023-01-012023-12-310001164727us-gaap:OperatingSegmentsMembernem:GoldDoreMemberus-gaap:SegmentContinuingOperationsMembernem:PenasquitoGoldSubsegmentMembernem:PenasquitoMember2025-01-012025-12-310001164727us-gaap:OperatingSegmentsMembernem:SalesFromConcentrateAndOtherProductionMemberus-gaap:SegmentContinuingOperationsMembernem:PenasquitoGoldSubsegmentMembernem:PenasquitoMember2025-01-012025-12-310001164727us-gaap:OperatingSegmentsMemberus-gaap:SegmentContinuingOperationsMembernem:PenasquitoGoldSubsegmentMembernem:PenasquitoMember2025-01-012025-12-310001164727us-gaap:OperatingSegmentsMembernem:GoldDoreMemberus-gaap:SegmentContinuingOperationsMembernem:PenasquitoGoldSubsegmentMembernem:PenasquitoMember2024-01-012024-12-310001164727us-gaap:OperatingSegmentsMembernem:SalesFromConcentrateAndOtherProductionMemberus-gaap:SegmentContinuingOperationsMembernem:PenasquitoGoldSubsegmentMembernem:PenasquitoMember2024-01-012024-12-310001164727us-gaap:OperatingSegmentsMemberus-gaap:SegmentContinuingOperationsMembernem:PenasquitoGoldSubsegmentMembernem:PenasquitoMember2024-01-012024-12-310001164727us-gaap:OperatingSegmentsMembernem:GoldDoreMemberus-gaap:SegmentContinuingOperationsMembernem:PenasquitoGoldSubsegmentMembernem:PenasquitoMember2023-01-012023-12-310001164727us-gaap:OperatingSegmentsMembernem:SalesFromConcentrateAndOtherProductionMemberus-gaap:SegmentContinuingOperationsMembernem:PenasquitoGoldSubsegmentMembernem:PenasquitoMember2023-01-012023-12-310001164727us-gaap:OperatingSegmentsMemberus-gaap:SegmentContinuingOperationsMembernem:PenasquitoGoldSubsegmentMembernem:PenasquitoMember2023-01-012023-12-310001164727us-gaap:OperatingSegmentsMembernem:GoldDoreMemberus-gaap:SegmentContinuingOperationsMembernem:PenasquitoSilverSubsegmentMembernem:PenasquitoMember2025-01-012025-12-310001164727us-gaap:OperatingSegmentsMembernem:SalesFromConcentrateAndOtherProductionMemberus-gaap:SegmentContinuingOperationsMembernem:PenasquitoSilverSubsegmentMembernem:PenasquitoMember2025-01-012025-12-310001164727us-gaap:OperatingSegmentsMemberus-gaap:SegmentContinuingOperationsMembernem:PenasquitoSilverSubsegmentMembernem:PenasquitoMember2025-01-012025-12-310001164727us-gaap:OperatingSegmentsMembernem:GoldDoreMemberus-gaap:SegmentContinuingOperationsMembernem:PenasquitoSilverSubsegmentMembernem:PenasquitoMember2024-01-012024-12-310001164727us-gaap:OperatingSegmentsMembernem:SalesFromConcentrateAndOtherProductionMemberus-gaap:SegmentContinuingOperationsMembernem:PenasquitoSilverSubsegmentMembernem:PenasquitoMember2024-01-012024-12-310001164727us-gaap:OperatingSegmentsMemberus-gaap:SegmentContinuingOperationsMembernem:PenasquitoSilverSubsegmentMembernem:PenasquitoMember2024-01-012024-12-310001164727us-gaap:OperatingSegmentsMembernem:GoldDoreMemberus-gaap:SegmentContinuingOperationsMembernem:PenasquitoSilverSubsegmentMembernem:PenasquitoMember2023-01-012023-12-310001164727us-gaap:OperatingSegmentsMembernem:SalesFromConcentrateAndOtherProductionMemberus-gaap:SegmentContinuingOperationsMembernem:PenasquitoSilverSubsegmentMembernem:PenasquitoMember2023-01-012023-12-310001164727us-gaap:OperatingSegmentsMemberus-gaap:SegmentContinuingOperationsMembernem:PenasquitoSilverSubsegmentMembernem:PenasquitoMember2023-01-012023-12-310001164727us-gaap:OperatingSegmentsMembernem:GoldDoreMemberus-gaap:SegmentContinuingOperationsMembernem:PenasquitoLeadSubsegmentMembernem:PenasquitoMember2025-01-012025-12-310001164727us-gaap:OperatingSegmentsMembernem:SalesFromConcentrateAndOtherProductionMemberus-gaap:SegmentContinuingOperationsMembernem:PenasquitoLeadSubsegmentMembernem:PenasquitoMember2025-01-012025-12-310001164727us-gaap:OperatingSegmentsMemberus-gaap:SegmentContinuingOperationsMembernem:PenasquitoLeadSubsegmentMembernem:PenasquitoMember2025-01-012025-12-310001164727us-gaap:OperatingSegmentsMembernem:GoldDoreMemberus-gaap:SegmentContinuingOperationsMembernem:PenasquitoLeadSubsegmentMembernem:PenasquitoMember2024-01-012024-12-310001164727us-gaap:OperatingSegmentsMembernem:SalesFromConcentrateAndOtherProductionMemberus-gaap:SegmentContinuingOperationsMembernem:PenasquitoLeadSubsegmentMembernem:PenasquitoMember2024-01-012024-12-310001164727us-gaap:OperatingSegmentsMemberus-gaap:SegmentContinuingOperationsMembernem:PenasquitoLeadSubsegmentMembernem:PenasquitoMember2024-01-012024-12-310001164727us-gaap:OperatingSegmentsMembernem:GoldDoreMemberus-gaap:SegmentContinuingOperationsMembernem:PenasquitoLeadSubsegmentMembernem:PenasquitoMember2023-01-012023-12-310001164727us-gaap:OperatingSegmentsMembernem:SalesFromConcentrateAndOtherProductionMemberus-gaap:SegmentContinuingOperationsMembernem:PenasquitoLeadSubsegmentMembernem:PenasquitoMember2023-01-012023-12-310001164727us-gaap:OperatingSegmentsMemberus-gaap:SegmentContinuingOperationsMembernem:PenasquitoLeadSubsegmentMembernem:PenasquitoMember2023-01-012023-12-310001164727us-gaap:OperatingSegmentsMembernem:GoldDoreMemberus-gaap:SegmentContinuingOperationsMembernem:PenasquitoZincSubsegmentMembernem:PenasquitoMember2025-01-012025-12-310001164727us-gaap:OperatingSegmentsMembernem:SalesFromConcentrateAndOtherProductionMemberus-gaap:SegmentContinuingOperationsMembernem:PenasquitoZincSubsegmentMembernem:PenasquitoMember2025-01-012025-12-310001164727us-gaap:OperatingSegmentsMemberus-gaap:SegmentContinuingOperationsMembernem:PenasquitoZincSubsegmentMembernem:PenasquitoMember2025-01-012025-12-310001164727us-gaap:OperatingSegmentsMembernem:GoldDoreMemberus-gaap:SegmentContinuingOperationsMembernem:PenasquitoZincSubsegmentMembernem:PenasquitoMember2024-01-012024-12-310001164727us-gaap:OperatingSegmentsMembernem:SalesFromConcentrateAndOtherProductionMemberus-gaap:SegmentContinuingOperationsMembernem:PenasquitoZincSubsegmentMembernem:PenasquitoMember2024-01-012024-12-310001164727us-gaap:OperatingSegmentsMemberus-gaap:SegmentContinuingOperationsMembernem:PenasquitoZincSubsegmentMembernem:PenasquitoMember2024-01-012024-12-310001164727us-gaap:OperatingSegmentsMembernem:GoldDoreMemberus-gaap:SegmentContinuingOperationsMembernem:PenasquitoZincSubsegmentMembernem:PenasquitoMember2023-01-012023-12-310001164727us-gaap:OperatingSegmentsMembernem:SalesFromConcentrateAndOtherProductionMemberus-gaap:SegmentContinuingOperationsMembernem:PenasquitoZincSubsegmentMembernem:PenasquitoMember2023-01-012023-12-310001164727us-gaap:OperatingSegmentsMemberus-gaap:SegmentContinuingOperationsMembernem:PenasquitoZincSubsegmentMembernem:PenasquitoMember2023-01-012023-12-310001164727us-gaap:OperatingSegmentsMembernem:GoldDoreMemberus-gaap:SegmentContinuingOperationsMembernem:PenasquitoMember2025-01-012025-12-310001164727us-gaap:OperatingSegmentsMembernem:SalesFromConcentrateAndOtherProductionMemberus-gaap:SegmentContinuingOperationsMembernem:PenasquitoMember2025-01-012025-12-310001164727us-gaap:OperatingSegmentsMembernem:GoldDoreMemberus-gaap:SegmentContinuingOperationsMembernem:PenasquitoMember2024-01-012024-12-310001164727us-gaap:OperatingSegmentsMembernem:SalesFromConcentrateAndOtherProductionMemberus-gaap:SegmentContinuingOperationsMembernem:PenasquitoMember2024-01-012024-12-310001164727us-gaap:OperatingSegmentsMemberus-gaap:SegmentContinuingOperationsMembernem:PenasquitoMember2024-01-012024-12-310001164727us-gaap:OperatingSegmentsMembernem:GoldDoreMemberus-gaap:SegmentContinuingOperationsMembernem:PenasquitoMember2023-01-012023-12-310001164727us-gaap:OperatingSegmentsMembernem:SalesFromConcentrateAndOtherProductionMemberus-gaap:SegmentContinuingOperationsMembernem:PenasquitoMember2023-01-012023-12-310001164727us-gaap:OperatingSegmentsMemberus-gaap:SegmentContinuingOperationsMembernem:PenasquitoMember2023-01-012023-12-310001164727us-gaap:OperatingSegmentsMembernem:GoldDoreMemberus-gaap:SegmentContinuingOperationsMembernem:RedChrisGoldSubsegmentMembernem:RedChrisMember2025-01-012025-12-310001164727us-gaap:OperatingSegmentsMembernem:SalesFromConcentrateAndOtherProductionMemberus-gaap:SegmentContinuingOperationsMembernem:RedChrisGoldSubsegmentMembernem:RedChrisMember2025-01-012025-12-310001164727us-gaap:OperatingSegmentsMemberus-gaap:SegmentContinuingOperationsMembernem:RedChrisGoldSubsegmentMembernem:RedChrisMember2025-01-012025-12-310001164727us-gaap:OperatingSegmentsMembernem:GoldDoreMemberus-gaap:SegmentContinuingOperationsMembernem:RedChrisGoldSubsegmentMembernem:RedChrisMember2024-01-012024-12-310001164727us-gaap:OperatingSegmentsMembernem:SalesFromConcentrateAndOtherProductionMemberus-gaap:SegmentContinuingOperationsMembernem:RedChrisGoldSubsegmentMembernem:RedChrisMember2024-01-012024-12-310001164727us-gaap:OperatingSegmentsMemberus-gaap:SegmentContinuingOperationsMembernem:RedChrisGoldSubsegmentMembernem:RedChrisMember2024-01-012024-12-310001164727us-gaap:OperatingSegmentsMembernem:GoldDoreMemberus-gaap:SegmentContinuingOperationsMembernem:RedChrisGoldSubsegmentMembernem:RedChrisMember2023-01-012023-12-310001164727us-gaap:OperatingSegmentsMembernem:SalesFromConcentrateAndOtherProductionMemberus-gaap:SegmentContinuingOperationsMembernem:RedChrisGoldSubsegmentMembernem:RedChrisMember2023-01-012023-12-310001164727us-gaap:OperatingSegmentsMemberus-gaap:SegmentContinuingOperationsMembernem:RedChrisGoldSubsegmentMembernem:RedChrisMember2023-01-012023-12-310001164727us-gaap:OperatingSegmentsMembernem:GoldDoreMemberus-gaap:SegmentContinuingOperationsMembernem:RedChrisCopperSubsegmentMembernem:RedChrisMember2025-01-012025-12-310001164727us-gaap:OperatingSegmentsMembernem:SalesFromConcentrateAndOtherProductionMemberus-gaap:SegmentContinuingOperationsMembernem:RedChrisCopperSubsegmentMembernem:RedChrisMember2025-01-012025-12-310001164727us-gaap:OperatingSegmentsMemberus-gaap:SegmentContinuingOperationsMembernem:RedChrisCopperSubsegmentMembernem:RedChrisMember2025-01-012025-12-310001164727us-gaap:OperatingSegmentsMembernem:GoldDoreMemberus-gaap:SegmentContinuingOperationsMembernem:RedChrisCopperSubsegmentMembernem:RedChrisMember2024-01-012024-12-310001164727us-gaap:OperatingSegmentsMembernem:SalesFromConcentrateAndOtherProductionMemberus-gaap:SegmentContinuingOperationsMembernem:RedChrisCopperSubsegmentMembernem:RedChrisMember2024-01-012024-12-310001164727us-gaap:OperatingSegmentsMemberus-gaap:SegmentContinuingOperationsMembernem:RedChrisCopperSubsegmentMembernem:RedChrisMember2024-01-012024-12-310001164727us-gaap:OperatingSegmentsMembernem:GoldDoreMemberus-gaap:SegmentContinuingOperationsMembernem:RedChrisCopperSubsegmentMembernem:RedChrisMember2023-01-012023-12-310001164727us-gaap:OperatingSegmentsMembernem:SalesFromConcentrateAndOtherProductionMemberus-gaap:SegmentContinuingOperationsMembernem:RedChrisCopperSubsegmentMembernem:RedChrisMember2023-01-012023-12-310001164727us-gaap:OperatingSegmentsMemberus-gaap:SegmentContinuingOperationsMembernem:RedChrisCopperSubsegmentMembernem:RedChrisMember2023-01-012023-12-310001164727us-gaap:OperatingSegmentsMembernem:GoldDoreMemberus-gaap:SegmentContinuingOperationsMembernem:RedChrisMember2025-01-012025-12-310001164727us-gaap:OperatingSegmentsMembernem:SalesFromConcentrateAndOtherProductionMemberus-gaap:SegmentContinuingOperationsMembernem:RedChrisMember2025-01-012025-12-310001164727us-gaap:OperatingSegmentsMembernem:GoldDoreMemberus-gaap:SegmentContinuingOperationsMembernem:RedChrisMember2024-01-012024-12-310001164727us-gaap:OperatingSegmentsMembernem:SalesFromConcentrateAndOtherProductionMemberus-gaap:SegmentContinuingOperationsMembernem:RedChrisMember2024-01-012024-12-310001164727us-gaap:OperatingSegmentsMemberus-gaap:SegmentContinuingOperationsMembernem:RedChrisMember2024-01-012024-12-310001164727us-gaap:OperatingSegmentsMembernem:GoldDoreMemberus-gaap:SegmentContinuingOperationsMembernem:RedChrisMember2023-01-012023-12-310001164727us-gaap:OperatingSegmentsMembernem:SalesFromConcentrateAndOtherProductionMemberus-gaap:SegmentContinuingOperationsMembernem:RedChrisMember2023-01-012023-12-310001164727us-gaap:OperatingSegmentsMemberus-gaap:SegmentContinuingOperationsMembernem:RedChrisMember2023-01-012023-12-310001164727us-gaap:OperatingSegmentsMembernem:GoldDoreMemberus-gaap:SegmentContinuingOperationsMembernem:BrucejackMember2025-01-012025-12-310001164727us-gaap:OperatingSegmentsMembernem:SalesFromConcentrateAndOtherProductionMemberus-gaap:SegmentContinuingOperationsMembernem:BrucejackMember2025-01-012025-12-310001164727us-gaap:OperatingSegmentsMembernem:GoldDoreMemberus-gaap:SegmentContinuingOperationsMembernem:BrucejackMember2024-01-012024-12-310001164727us-gaap:OperatingSegmentsMembernem:SalesFromConcentrateAndOtherProductionMemberus-gaap:SegmentContinuingOperationsMembernem:BrucejackMember2024-01-012024-12-310001164727us-gaap:OperatingSegmentsMemberus-gaap:SegmentContinuingOperationsMembernem:BrucejackMember2024-01-012024-12-310001164727us-gaap:OperatingSegmentsMembernem:GoldDoreMemberus-gaap:SegmentContinuingOperationsMembernem:BrucejackMember2023-01-012023-12-310001164727us-gaap:OperatingSegmentsMembernem:SalesFromConcentrateAndOtherProductionMemberus-gaap:SegmentContinuingOperationsMembernem:BrucejackMember2023-01-012023-12-310001164727us-gaap:OperatingSegmentsMemberus-gaap:SegmentContinuingOperationsMembernem:BrucejackMember2023-01-012023-12-310001164727us-gaap:OperatingSegmentsMembernem:GoldDoreMemberus-gaap:SegmentContinuingOperationsMembernem:NevadaGoldMinesMember2025-01-012025-12-310001164727us-gaap:OperatingSegmentsMembernem:SalesFromConcentrateAndOtherProductionMemberus-gaap:SegmentContinuingOperationsMembernem:NevadaGoldMinesMember2025-01-012025-12-310001164727us-gaap:OperatingSegmentsMembernem:GoldDoreMemberus-gaap:SegmentContinuingOperationsMembernem:NevadaGoldMinesMember2024-01-012024-12-310001164727us-gaap:OperatingSegmentsMembernem:SalesFromConcentrateAndOtherProductionMemberus-gaap:SegmentContinuingOperationsMembernem:NevadaGoldMinesMember2024-01-012024-12-310001164727us-gaap:OperatingSegmentsMemberus-gaap:SegmentContinuingOperationsMembernem:NevadaGoldMinesMember2024-01-012024-12-310001164727us-gaap:OperatingSegmentsMembernem:GoldDoreMemberus-gaap:SegmentContinuingOperationsMembernem:NevadaGoldMinesMember2023-01-012023-12-310001164727us-gaap:OperatingSegmentsMembernem:SalesFromConcentrateAndOtherProductionMemberus-gaap:SegmentContinuingOperationsMembernem:NevadaGoldMinesMember2023-01-012023-12-310001164727us-gaap:OperatingSegmentsMemberus-gaap:SegmentContinuingOperationsMembernem:NevadaGoldMinesMember2023-01-012023-12-310001164727us-gaap:OperatingSegmentsMembernem:GoldDoreMemberus-gaap:SegmentDiscontinuedOperationsMembernem:CrippleCreekAndVictorMineMember2025-01-012025-12-310001164727us-gaap:OperatingSegmentsMembernem:SalesFromConcentrateAndOtherProductionMemberus-gaap:SegmentDiscontinuedOperationsMembernem:CrippleCreekAndVictorMineMember2025-01-012025-12-310001164727us-gaap:OperatingSegmentsMembernem:GoldDoreMemberus-gaap:SegmentDiscontinuedOperationsMembernem:CrippleCreekAndVictorMineMember2024-01-012024-12-310001164727us-gaap:OperatingSegmentsMembernem:SalesFromConcentrateAndOtherProductionMemberus-gaap:SegmentDiscontinuedOperationsMembernem:CrippleCreekAndVictorMineMember2024-01-012024-12-310001164727us-gaap:OperatingSegmentsMemberus-gaap:SegmentDiscontinuedOperationsMembernem:CrippleCreekAndVictorMineMember2024-01-012024-12-310001164727us-gaap:OperatingSegmentsMembernem:GoldDoreMemberus-gaap:SegmentDiscontinuedOperationsMembernem:CrippleCreekAndVictorMineMember2023-01-012023-12-310001164727us-gaap:OperatingSegmentsMembernem:SalesFromConcentrateAndOtherProductionMemberus-gaap:SegmentDiscontinuedOperationsMembernem:CrippleCreekAndVictorMineMember2023-01-012023-12-310001164727us-gaap:OperatingSegmentsMemberus-gaap:SegmentDiscontinuedOperationsMembernem:CrippleCreekAndVictorMineMember2023-01-012023-12-310001164727us-gaap:OperatingSegmentsMembernem:GoldDoreMemberus-gaap:SegmentDiscontinuedOperationsMembernem:MusselwhiteMember2025-01-012025-12-310001164727us-gaap:OperatingSegmentsMembernem:SalesFromConcentrateAndOtherProductionMemberus-gaap:SegmentDiscontinuedOperationsMembernem:MusselwhiteMember2025-01-012025-12-310001164727us-gaap:OperatingSegmentsMembernem:GoldDoreMemberus-gaap:SegmentDiscontinuedOperationsMembernem:MusselwhiteMember2024-01-012024-12-310001164727us-gaap:OperatingSegmentsMembernem:SalesFromConcentrateAndOtherProductionMemberus-gaap:SegmentDiscontinuedOperationsMembernem:MusselwhiteMember2024-01-012024-12-310001164727us-gaap:OperatingSegmentsMemberus-gaap:SegmentDiscontinuedOperationsMembernem:MusselwhiteMember2024-01-012024-12-310001164727us-gaap:OperatingSegmentsMembernem:GoldDoreMemberus-gaap:SegmentDiscontinuedOperationsMembernem:MusselwhiteMember2023-01-012023-12-310001164727us-gaap:OperatingSegmentsMembernem:SalesFromConcentrateAndOtherProductionMemberus-gaap:SegmentDiscontinuedOperationsMembernem:MusselwhiteMember2023-01-012023-12-310001164727us-gaap:OperatingSegmentsMemberus-gaap:SegmentDiscontinuedOperationsMembernem:MusselwhiteMember2023-01-012023-12-310001164727us-gaap:OperatingSegmentsMembernem:GoldDoreMemberus-gaap:SegmentDiscontinuedOperationsMembernem:PorcupineMember2025-01-012025-12-310001164727us-gaap:OperatingSegmentsMembernem:SalesFromConcentrateAndOtherProductionMemberus-gaap:SegmentDiscontinuedOperationsMembernem:PorcupineMember2025-01-012025-12-310001164727us-gaap:OperatingSegmentsMembernem:GoldDoreMemberus-gaap:SegmentDiscontinuedOperationsMembernem:PorcupineMember2024-01-012024-12-310001164727us-gaap:OperatingSegmentsMembernem:SalesFromConcentrateAndOtherProductionMemberus-gaap:SegmentDiscontinuedOperationsMembernem:PorcupineMember2024-01-012024-12-310001164727us-gaap:OperatingSegmentsMemberus-gaap:SegmentDiscontinuedOperationsMembernem:PorcupineMember2024-01-012024-12-310001164727us-gaap:OperatingSegmentsMembernem:GoldDoreMemberus-gaap:SegmentDiscontinuedOperationsMembernem:PorcupineMember2023-01-012023-12-310001164727us-gaap:OperatingSegmentsMembernem:SalesFromConcentrateAndOtherProductionMemberus-gaap:SegmentDiscontinuedOperationsMembernem:PorcupineMember2023-01-012023-12-310001164727us-gaap:OperatingSegmentsMemberus-gaap:SegmentDiscontinuedOperationsMembernem:PorcupineMember2023-01-012023-12-310001164727us-gaap:OperatingSegmentsMembernem:GoldDoreMemberus-gaap:SegmentDiscontinuedOperationsMembernem:EleonoreMember2025-01-012025-12-310001164727us-gaap:OperatingSegmentsMembernem:SalesFromConcentrateAndOtherProductionMemberus-gaap:SegmentDiscontinuedOperationsMembernem:EleonoreMember2025-01-012025-12-310001164727us-gaap:OperatingSegmentsMembernem:GoldDoreMemberus-gaap:SegmentDiscontinuedOperationsMembernem:EleonoreMember2024-01-012024-12-310001164727us-gaap:OperatingSegmentsMembernem:SalesFromConcentrateAndOtherProductionMemberus-gaap:SegmentDiscontinuedOperationsMembernem:EleonoreMember2024-01-012024-12-310001164727us-gaap:OperatingSegmentsMemberus-gaap:SegmentDiscontinuedOperationsMembernem:EleonoreMember2024-01-012024-12-310001164727us-gaap:OperatingSegmentsMembernem:GoldDoreMemberus-gaap:SegmentDiscontinuedOperationsMembernem:EleonoreMember2023-01-012023-12-310001164727us-gaap:OperatingSegmentsMembernem:SalesFromConcentrateAndOtherProductionMemberus-gaap:SegmentDiscontinuedOperationsMembernem:EleonoreMember2023-01-012023-12-310001164727us-gaap:OperatingSegmentsMemberus-gaap:SegmentDiscontinuedOperationsMembernem:EleonoreMember2023-01-012023-12-310001164727us-gaap:OperatingSegmentsMembernem:GoldDoreMemberus-gaap:SegmentDiscontinuedOperationsMembernem:AkyemMember2025-01-012025-12-310001164727us-gaap:OperatingSegmentsMembernem:SalesFromConcentrateAndOtherProductionMemberus-gaap:SegmentDiscontinuedOperationsMembernem:AkyemMember2025-01-012025-12-310001164727us-gaap:OperatingSegmentsMembernem:GoldDoreMemberus-gaap:SegmentDiscontinuedOperationsMembernem:AkyemMember2024-01-012024-12-310001164727us-gaap:OperatingSegmentsMembernem:SalesFromConcentrateAndOtherProductionMemberus-gaap:SegmentDiscontinuedOperationsMembernem:AkyemMember2024-01-012024-12-310001164727us-gaap:OperatingSegmentsMemberus-gaap:SegmentDiscontinuedOperationsMembernem:AkyemMember2024-01-012024-12-310001164727us-gaap:OperatingSegmentsMembernem:GoldDoreMemberus-gaap:SegmentDiscontinuedOperationsMembernem:AkyemMember2023-01-012023-12-310001164727us-gaap:OperatingSegmentsMembernem:SalesFromConcentrateAndOtherProductionMemberus-gaap:SegmentDiscontinuedOperationsMembernem:AkyemMember2023-01-012023-12-310001164727us-gaap:OperatingSegmentsMemberus-gaap:SegmentDiscontinuedOperationsMembernem:AkyemMember2023-01-012023-12-310001164727us-gaap:OperatingSegmentsMembernem:GoldDoreMemberus-gaap:SegmentDiscontinuedOperationsMembernem:TelferGoldSubsegmentMembernem:TelferMember2025-01-012025-12-310001164727us-gaap:OperatingSegmentsMembernem:SalesFromConcentrateAndOtherProductionMemberus-gaap:SegmentDiscontinuedOperationsMembernem:TelferGoldSubsegmentMembernem:TelferMember2025-01-012025-12-310001164727us-gaap:OperatingSegmentsMemberus-gaap:SegmentDiscontinuedOperationsMembernem:TelferGoldSubsegmentMembernem:TelferMember2025-01-012025-12-310001164727us-gaap:OperatingSegmentsMembernem:GoldDoreMemberus-gaap:SegmentDiscontinuedOperationsMembernem:TelferGoldSubsegmentMembernem:TelferMember2024-01-012024-12-310001164727us-gaap:OperatingSegmentsMembernem:SalesFromConcentrateAndOtherProductionMemberus-gaap:SegmentDiscontinuedOperationsMembernem:TelferGoldSubsegmentMembernem:TelferMember2024-01-012024-12-310001164727us-gaap:OperatingSegmentsMemberus-gaap:SegmentDiscontinuedOperationsMembernem:TelferGoldSubsegmentMembernem:TelferMember2024-01-012024-12-310001164727us-gaap:OperatingSegmentsMembernem:GoldDoreMemberus-gaap:SegmentDiscontinuedOperationsMembernem:TelferGoldSubsegmentMembernem:TelferMember2023-01-012023-12-310001164727us-gaap:OperatingSegmentsMembernem:SalesFromConcentrateAndOtherProductionMemberus-gaap:SegmentDiscontinuedOperationsMembernem:TelferGoldSubsegmentMembernem:TelferMember2023-01-012023-12-310001164727us-gaap:OperatingSegmentsMemberus-gaap:SegmentDiscontinuedOperationsMembernem:TelferGoldSubsegmentMembernem:TelferMember2023-01-012023-12-310001164727us-gaap:OperatingSegmentsMembernem:GoldDoreMemberus-gaap:SegmentDiscontinuedOperationsMembernem:TelferCopperSubsegmentMembernem:TelferMember2025-01-012025-12-310001164727us-gaap:OperatingSegmentsMembernem:SalesFromConcentrateAndOtherProductionMemberus-gaap:SegmentDiscontinuedOperationsMembernem:TelferCopperSubsegmentMembernem:TelferMember2025-01-012025-12-310001164727us-gaap:OperatingSegmentsMemberus-gaap:SegmentDiscontinuedOperationsMembernem:TelferCopperSubsegmentMembernem:TelferMember2025-01-012025-12-310001164727us-gaap:OperatingSegmentsMembernem:GoldDoreMemberus-gaap:SegmentDiscontinuedOperationsMembernem:TelferCopperSubsegmentMembernem:TelferMember2024-01-012024-12-310001164727us-gaap:OperatingSegmentsMembernem:SalesFromConcentrateAndOtherProductionMemberus-gaap:SegmentDiscontinuedOperationsMembernem:TelferCopperSubsegmentMembernem:TelferMember2024-01-012024-12-310001164727us-gaap:OperatingSegmentsMemberus-gaap:SegmentDiscontinuedOperationsMembernem:TelferCopperSubsegmentMembernem:TelferMember2024-01-012024-12-310001164727us-gaap:OperatingSegmentsMembernem:GoldDoreMemberus-gaap:SegmentDiscontinuedOperationsMembernem:TelferCopperSubsegmentMembernem:TelferMember2023-01-012023-12-310001164727us-gaap:OperatingSegmentsMembernem:SalesFromConcentrateAndOtherProductionMemberus-gaap:SegmentDiscontinuedOperationsMembernem:TelferCopperSubsegmentMembernem:TelferMember2023-01-012023-12-310001164727us-gaap:OperatingSegmentsMemberus-gaap:SegmentDiscontinuedOperationsMembernem:TelferCopperSubsegmentMembernem:TelferMember2023-01-012023-12-310001164727us-gaap:OperatingSegmentsMembernem:GoldDoreMemberus-gaap:SegmentDiscontinuedOperationsMembernem:TelferMember2025-01-012025-12-310001164727us-gaap:OperatingSegmentsMembernem:SalesFromConcentrateAndOtherProductionMemberus-gaap:SegmentDiscontinuedOperationsMembernem:TelferMember2025-01-012025-12-310001164727us-gaap:OperatingSegmentsMemberus-gaap:SegmentDiscontinuedOperationsMembernem:TelferMember2025-01-012025-12-310001164727us-gaap:OperatingSegmentsMembernem:GoldDoreMemberus-gaap:SegmentDiscontinuedOperationsMembernem:TelferMember2024-01-012024-12-310001164727us-gaap:OperatingSegmentsMembernem:SalesFromConcentrateAndOtherProductionMemberus-gaap:SegmentDiscontinuedOperationsMembernem:TelferMember2024-01-012024-12-310001164727us-gaap:OperatingSegmentsMemberus-gaap:SegmentDiscontinuedOperationsMembernem:TelferMember2024-01-012024-12-310001164727us-gaap:OperatingSegmentsMembernem:GoldDoreMemberus-gaap:SegmentDiscontinuedOperationsMembernem:TelferMember2023-01-012023-12-310001164727us-gaap:OperatingSegmentsMembernem:SalesFromConcentrateAndOtherProductionMemberus-gaap:SegmentDiscontinuedOperationsMembernem:TelferMember2023-01-012023-12-310001164727us-gaap:OperatingSegmentsMemberus-gaap:SegmentDiscontinuedOperationsMembernem:TelferMember2023-01-012023-12-310001164727nem:GoldDoreMember2025-01-012025-12-310001164727nem:SalesFromConcentrateAndOtherProductionMember2025-01-012025-12-310001164727nem:GoldDoreMember2024-01-012024-12-310001164727nem:SalesFromConcentrateAndOtherProductionMember2024-01-012024-12-310001164727nem:GoldDoreMember2023-01-012023-12-310001164727nem:SalesFromConcentrateAndOtherProductionMember2023-01-012023-12-310001164727us-gaap:OperatingSegmentsMembernem:SilverStreamingAgreementMembernem:PenasquitoSilverSubsegmentMembernem:PenasquitoMember2025-01-012025-12-310001164727us-gaap:OperatingSegmentsMembernem:SilverStreamingAgreementMembernem:PenasquitoSilverSubsegmentMembernem:PenasquitoMember2024-01-012024-12-310001164727us-gaap:OperatingSegmentsMembernem:SilverStreamingAgreementMembernem:PenasquitoSilverSubsegmentMembernem:PenasquitoMember2023-01-012023-12-310001164727srt:ConsolidationEliminationsMembernem:NevadaGoldMinesMember2025-01-012025-12-310001164727srt:ConsolidationEliminationsMembernem:NevadaGoldMinesMember2024-01-012024-12-310001164727srt:ConsolidationEliminationsMembernem:NevadaGoldMinesMember2023-01-012023-12-310001164727us-gaap:GoldMember2025-12-310001164727nem:CopperMember2025-12-310001164727nem:SilverMember2025-12-310001164727nem:LeadMember2025-12-310001164727nem:ZincMember2025-12-310001164727country:GB2025-01-012025-12-310001164727country:GB2024-01-012024-12-310001164727country:GB2023-01-012023-12-310001164727country:KR2025-01-012025-12-310001164727country:KR2024-01-012024-12-310001164727country:KR2023-01-012023-12-310001164727country:JP2025-01-012025-12-310001164727country:JP2024-01-012024-12-310001164727country:JP2023-01-012023-12-310001164727country:CN2025-01-012025-12-310001164727country:CN2024-01-012024-12-310001164727country:CN2023-01-012023-12-310001164727country:AU2025-01-012025-12-310001164727country:AU2024-01-012024-12-310001164727country:AU2023-01-012023-12-310001164727country:MX2025-01-012025-12-310001164727country:MX2024-01-012024-12-310001164727country:MX2023-01-012023-12-310001164727country:CH2025-01-012025-12-310001164727country:CH2024-01-012024-12-310001164727country:CH2023-01-012023-12-310001164727country:PH2025-01-012025-12-310001164727country:PH2024-01-012024-12-310001164727country:PH2023-01-012023-12-310001164727country:US2025-01-012025-12-310001164727country:US2024-01-012024-12-310001164727country:US2023-01-012023-12-310001164727nem:OtherCountriesMember2025-01-012025-12-310001164727nem:OtherCountriesMember2024-01-012024-12-310001164727nem:OtherCountriesMember2023-01-012023-12-310001164727us-gaap:GoldMembernem:StandardCharteredMemberus-gaap:CustomerConcentrationRiskMemberus-gaap:RevenueFromContractWithCustomerProductAndServiceBenchmarkMember2025-01-012025-12-310001164727us-gaap:GoldMembernem:StandardCharteredMemberus-gaap:CustomerConcentrationRiskMemberus-gaap:RevenueFromContractWithCustomerProductAndServiceBenchmarkMember2024-01-012024-12-310001164727us-gaap:GoldMembernem:StandardCharteredMemberus-gaap:CustomerConcentrationRiskMemberus-gaap:RevenueFromContractWithCustomerProductAndServiceBenchmarkMember2023-01-012023-12-310001164727us-gaap:GoldMembernem:JPMorganChaseMemberus-gaap:CustomerConcentrationRiskMemberus-gaap:RevenueFromContractWithCustomerProductAndServiceBenchmarkMember2025-01-012025-12-310001164727us-gaap:GoldMembernem:JPMorganChaseMemberus-gaap:CustomerConcentrationRiskMemberus-gaap:RevenueFromContractWithCustomerProductAndServiceBenchmarkMember2024-01-012024-12-310001164727us-gaap:GoldMembernem:JPMorganChaseMemberus-gaap:CustomerConcentrationRiskMemberus-gaap:RevenueFromContractWithCustomerProductAndServiceBenchmarkMember2023-01-012023-12-310001164727us-gaap:GoldMembernem:RoyalBankOfCanadaMemberus-gaap:CustomerConcentrationRiskMemberus-gaap:RevenueFromContractWithCustomerProductAndServiceBenchmarkMember2024-01-012024-12-310001164727us-gaap:GoldMembernem:RoyalBankOfCanadaMemberus-gaap:CustomerConcentrationRiskMemberus-gaap:RevenueFromContractWithCustomerProductAndServiceBenchmarkMember2023-01-012023-12-310001164727us-gaap:GoldMembernem:TorontoDominionBankMemberus-gaap:CustomerConcentrationRiskMemberus-gaap:RevenueFromContractWithCustomerProductAndServiceBenchmarkMember2023-01-012023-12-310001164727us-gaap:EnvironmentalRemediationMember2025-01-012025-12-310001164727us-gaap:EnvironmentalRemediationMember2024-01-012024-12-310001164727us-gaap:EnvironmentalRemediationMember2023-01-012023-12-310001164727nem:YanacochaMember2025-01-012025-12-310001164727nem:YanacochaMember2024-01-012024-12-310001164727nem:YanacochaMember2023-01-012023-12-310001164727nem:NewcrestMiningLimitedMember2024-01-012024-12-310001164727nem:TelferMember2024-10-012024-12-310001164727nem:MineraYanacochaMember2025-12-310001164727nem:MineraYanacochaMember2024-12-310001164727srt:MaximumMember2025-12-310001164727srt:MinimumMember2025-12-310001164727us-gaap:OtherNoncurrentAssetsMember2025-12-310001164727us-gaap:OtherNoncurrentAssetsMember2024-12-310001164727us-gaap:EquitySecuritiesMemberus-gaap:OtherNoncurrentAssetsMember2025-12-310001164727us-gaap:EquitySecuritiesMemberus-gaap:OtherNoncurrentAssetsMember2024-12-310001164727us-gaap:OperatingSegmentsMembernem:YanacochaMember2025-01-012025-12-310001164727us-gaap:OperatingSegmentsMembernem:NevadaGoldMinesMember2025-01-012025-12-310001164727us-gaap:OperatingSegmentsMembernem:PenasquitoMember2025-01-012025-12-310001164727us-gaap:MaterialReconcilingItemsMember2025-01-012025-12-310001164727us-gaap:MaterialReconcilingItemsMember2024-01-012024-12-310001164727us-gaap:MaterialReconcilingItemsMember2023-01-012023-12-310001164727us-gaap:OperatingSegmentsMembernem:YanacochaMember2025-12-310001164727us-gaap:IncomeApproachValuationTechniqueMembernem:MeasurementInputShortTermGoldPriceMember2023-12-310001164727us-gaap:IncomeApproachValuationTechniqueMembernem:MeasurementInputLongTermGoldPriceMember2023-12-310001164727us-gaap:IncomeApproachValuationTechniqueMemberus-gaap:MeasurementInputDiscountRateMembernem:MusselwhiteMember2023-12-310001164727us-gaap:IncomeApproachValuationTechniqueMemberus-gaap:MeasurementInputDiscountRateMembernem:EleonoreMember2023-12-310001164727us-gaap:IncomeApproachValuationTechniqueMemberus-gaap:MeasurementInputDiscountRateMembernem:PenasquitoMember2023-12-310001164727us-gaap:DisposalGroupDisposedOfBySaleNotDiscontinuedOperationsMembernem:PyriteLeachPlantMember2023-01-012023-12-310001164727country:US2025-01-012025-12-310001164727country:US2024-01-012024-12-310001164727country:US2023-01-012023-12-310001164727country:AR2025-01-012025-12-310001164727country:AR2024-01-012024-12-310001164727country:AR2023-01-012023-12-310001164727country:AU2025-01-012025-12-310001164727country:AU2024-01-012024-12-310001164727country:AU2023-01-012023-12-310001164727country:CA2025-01-012025-12-310001164727country:CA2024-01-012024-12-310001164727country:CA2023-01-012023-12-310001164727country:GH2025-01-012025-12-310001164727country:GH2024-01-012024-12-310001164727country:GH2023-01-012023-12-310001164727country:MX2025-01-012025-12-310001164727country:MX2024-01-012024-12-310001164727country:MX2023-01-012023-12-310001164727country:PG2025-01-012025-12-310001164727country:PG2024-01-012024-12-310001164727country:PG2023-01-012023-12-310001164727country:PE2025-01-012025-12-310001164727country:PE2024-01-012024-12-310001164727country:PE2023-01-012023-12-310001164727us-gaap:ForeignTaxJurisdictionOtherMember2025-01-012025-12-310001164727us-gaap:ForeignTaxJurisdictionOtherMember2024-01-012024-12-310001164727us-gaap:ForeignTaxJurisdictionOtherMember2023-01-012023-12-310001164727country:GHnem:AhafoMember2025-12-312025-12-310001164727country:CA2025-12-310001164727country:MX2025-12-310001164727us-gaap:ForeignTaxJurisdictionOtherMember2025-12-310001164727country:US2025-12-310001164727country:US2024-12-310001164727country:USnem:SolarTaxCreditCarryforwardMember2025-12-310001164727country:CAus-gaap:InvestmentCreditMember2025-12-310001164727country:CAus-gaap:InvestmentCreditMember2024-12-310001164727country:GH2025-12-310001164727country:PG2025-12-310001164727us-gaap:PensionPlansDefinedBenefitMember2024-12-310001164727us-gaap:PensionPlansDefinedBenefitMember2023-12-310001164727us-gaap:OtherPostretirementBenefitPlansDefinedBenefitMember2024-12-310001164727us-gaap:OtherPostretirementBenefitPlansDefinedBenefitMember2023-12-310001164727us-gaap:PensionPlansDefinedBenefitMember2025-01-012025-12-310001164727us-gaap:PensionPlansDefinedBenefitMember2024-01-012024-12-310001164727us-gaap:OtherPostretirementBenefitPlansDefinedBenefitMember2025-01-012025-12-310001164727us-gaap:OtherPostretirementBenefitPlansDefinedBenefitMember2024-01-012024-12-310001164727us-gaap:PensionPlansDefinedBenefitMember2025-12-310001164727us-gaap:OtherPostretirementBenefitPlansDefinedBenefitMember2025-12-310001164727us-gaap:DiscontinuedOperationsHeldforsaleMembernem:PortfolioOptimizationProgramMemberus-gaap:PensionPlansDefinedBenefitMembernem:PorcupineMember2024-12-310001164727us-gaap:DiscontinuedOperationsHeldforsaleMembernem:PortfolioOptimizationProgramMemberus-gaap:PensionPlansDefinedBenefitMembernem:PorcupineMember2025-12-310001164727us-gaap:UnfundedPlanMemberus-gaap:PensionPlansDefinedBenefitMember2025-12-310001164727us-gaap:UnfundedPlanMemberus-gaap:PensionPlansDefinedBenefitMember2024-12-310001164727us-gaap:PensionPlansDefinedBenefitMember2023-01-012023-12-310001164727us-gaap:OtherPostretirementBenefitPlansDefinedBenefitMember2023-01-012023-12-310001164727us-gaap:FixedIncomeSecuritiesMemberus-gaap:PensionPlansDefinedBenefitMember2025-12-310001164727us-gaap:FixedIncomeSecuritiesMemberus-gaap:PensionPlansDefinedBenefitMember2024-12-310001164727nem:WorldEquityFundMemberus-gaap:PensionPlansDefinedBenefitMember2025-12-310001164727nem:WorldEquityFundMemberus-gaap:PensionPlansDefinedBenefitMember2024-12-310001164727us-gaap:DefinedBenefitPlanEquitySecuritiesNonUsMemberus-gaap:PensionPlansDefinedBenefitMember2025-12-310001164727us-gaap:DefinedBenefitPlanEquitySecuritiesNonUsMemberus-gaap:PensionPlansDefinedBenefitMember2024-12-310001164727us-gaap:DefinedBenefitPlanEquitySecuritiesUsMemberus-gaap:PensionPlansDefinedBenefitMember2025-12-310001164727us-gaap:DefinedBenefitPlanEquitySecuritiesUsMemberus-gaap:PensionPlansDefinedBenefitMember2024-12-310001164727us-gaap:DefinedBenefitPlanRealEstateMemberus-gaap:PensionPlansDefinedBenefitMember2025-12-310001164727us-gaap:DefinedBenefitPlanRealEstateMemberus-gaap:PensionPlansDefinedBenefitMember2024-12-310001164727nem:HighYieldFixedIncomeInvestmentsMemberus-gaap:PensionPlansDefinedBenefitMember2025-12-310001164727nem:HighYieldFixedIncomeInvestmentsMemberus-gaap:PensionPlansDefinedBenefitMember2024-12-310001164727nem:DefinedBenefitPlanComingledFundsMemberus-gaap:PensionPlansDefinedBenefitMember2025-12-310001164727nem:DefinedBenefitPlanComingledFundsMemberus-gaap:PensionPlansDefinedBenefitMember2024-12-310001164727us-gaap:DefinedBenefitPlanCashAndCashEquivalentsMemberus-gaap:PensionPlansDefinedBenefitMember2025-12-310001164727us-gaap:DefinedBenefitPlanCashAndCashEquivalentsMemberus-gaap:PensionPlansDefinedBenefitMember2024-12-310001164727country:USus-gaap:QualifiedPlanMember2025-01-012025-12-310001164727country:USus-gaap:NonqualifiedPlanMember2025-01-012025-12-310001164727us-gaap:PerformanceSharesMember2018-01-012018-01-310001164727us-gaap:RestrictedStockUnitsRSUMember2018-01-012018-01-310001164727us-gaap:RestrictedStockUnitsRSUMember2018-02-012018-02-280001164727nem:OtherAwardsMember2025-01-012025-12-310001164727nem:OtherAwardsMember2024-01-012024-12-310001164727nem:OtherAwardsMember2023-01-012023-12-310001164727us-gaap:RestrictedStockUnitsRSUMember2024-12-310001164727us-gaap:PerformanceSharesMember2024-12-310001164727us-gaap:RestrictedStockUnitsRSUMember2025-01-012025-12-310001164727us-gaap:PerformanceSharesMember2025-01-012025-12-310001164727us-gaap:RestrictedStockUnitsRSUMember2025-12-310001164727us-gaap:PerformanceSharesMember2025-12-310001164727us-gaap:RestrictedStockUnitsRSUMember2024-01-012024-12-310001164727us-gaap:RestrictedStockUnitsRSUMember2023-01-012023-12-310001164727us-gaap:PerformanceSharesMember2024-01-012024-12-310001164727us-gaap:PerformanceSharesMember2023-01-012023-12-310001164727us-gaap:FairValueMeasurementsRecurringMember2025-12-310001164727us-gaap:FairValueMeasurementsRecurringMemberus-gaap:FairValueInputsLevel1Member2025-12-310001164727us-gaap:FairValueMeasurementsRecurringMemberus-gaap:FairValueInputsLevel2Member2025-12-310001164727us-gaap:FairValueMeasurementsRecurringMemberus-gaap:FairValueInputsLevel3Member2025-12-310001164727us-gaap:FairValueMeasurementsRecurringMember2024-12-310001164727us-gaap:FairValueMeasurementsRecurringMemberus-gaap:FairValueInputsLevel1Member2024-12-310001164727us-gaap:FairValueMeasurementsRecurringMemberus-gaap:FairValueInputsLevel2Member2024-12-310001164727us-gaap:FairValueMeasurementsRecurringMemberus-gaap:FairValueInputsLevel3Member2024-12-310001164727us-gaap:CarryingReportedAmountFairValueDisclosureMember2025-12-310001164727us-gaap:CarryingReportedAmountFairValueDisclosureMember2024-12-310001164727us-gaap:DiscontinuedOperationsHeldforsaleMemberus-gaap:FairValueMeasurementsRecurringMembernem:PortfolioOptimizationProgramMember2024-12-310001164727us-gaap:FairValueInputsLevel3Member2025-12-310001164727us-gaap:DesignatedAsHedgingInstrumentMemberus-gaap:FairValueInputsLevel3Member2025-12-310001164727us-gaap:DesignatedAsHedgingInstrumentMemberus-gaap:MeasurementInputCommodityForwardPriceMemberus-gaap:FairValueInputsLevel3Memberus-gaap:IncomeApproachValuationTechniqueMembersrt:MinimumMember2025-12-310001164727us-gaap:DesignatedAsHedgingInstrumentMemberus-gaap:MeasurementInputCommodityForwardPriceMemberus-gaap:FairValueInputsLevel3Memberus-gaap:IncomeApproachValuationTechniqueMembersrt:MaximumMember2025-12-310001164727us-gaap:DesignatedAsHedgingInstrumentMemberus-gaap:MeasurementInputCommodityForwardPriceMemberus-gaap:FairValueInputsLevel3Memberus-gaap:IncomeApproachValuationTechniqueMembersrt:WeightedAverageMember2025-12-310001164727us-gaap:FairValueInputsLevel3Memberus-gaap:IncomeApproachValuationTechniqueMembersrt:MaximumMemberus-gaap:MeasurementInputDiscountRateMember2025-12-310001164727us-gaap:FairValueInputsLevel3Memberus-gaap:IncomeApproachValuationTechniqueMembersrt:WeightedAverageMemberus-gaap:MeasurementInputDiscountRateMember2025-12-310001164727us-gaap:FairValueInputsLevel3Member2024-12-310001164727us-gaap:FairValueInputsLevel3Memberus-gaap:IncomeApproachValuationTechniqueMembersrt:WeightedAverageMemberus-gaap:MeasurementInputDiscountRateMember2024-12-310001164727us-gaap:DesignatedAsHedgingInstrumentMemberus-gaap:FairValueInputsLevel3Member2024-12-310001164727us-gaap:DesignatedAsHedgingInstrumentMemberus-gaap:MeasurementInputCommodityForwardPriceMemberus-gaap:FairValueInputsLevel3Memberus-gaap:IncomeApproachValuationTechniqueMembersrt:MinimumMember2024-12-310001164727us-gaap:DesignatedAsHedgingInstrumentMemberus-gaap:MeasurementInputCommodityForwardPriceMemberus-gaap:FairValueInputsLevel3Memberus-gaap:IncomeApproachValuationTechniqueMembersrt:MaximumMember2024-12-310001164727us-gaap:DesignatedAsHedgingInstrumentMemberus-gaap:MeasurementInputCommodityForwardPriceMemberus-gaap:FairValueInputsLevel3Memberus-gaap:IncomeApproachValuationTechniqueMembersrt:WeightedAverageMember2024-12-310001164727us-gaap:FairValueInputsLevel3Memberus-gaap:IncomeApproachValuationTechniqueMembersrt:MinimumMemberus-gaap:MeasurementInputDiscountRateMember2024-12-310001164727us-gaap:FairValueInputsLevel3Memberus-gaap:IncomeApproachValuationTechniqueMembersrt:MaximumMemberus-gaap:MeasurementInputDiscountRateMember2024-12-310001164727us-gaap:DiscontinuedOperationsHeldforsaleMembernem:PortfolioOptimizationProgramMemberus-gaap:IncomeApproachValuationTechniqueMembernem:MeasurementInputLongTermGoldPriceMember2024-12-310001164727us-gaap:DiscontinuedOperationsHeldforsaleMembernem:PortfolioOptimizationProgramMemberus-gaap:IncomeApproachValuationTechniqueMemberus-gaap:MeasurementInputDiscountRateMember2024-12-310001164727nem:CadiaPowerPurchaseAgreementMemberus-gaap:DesignatedAsHedgingInstrumentMemberus-gaap:CashFlowHedgingMember2024-12-310001164727nem:ContingentConsiderationAssetMember2023-12-310001164727nem:ContingentConsiderationLiabilityMember2023-12-310001164727nem:ContingentConsiderationAssetMember2024-01-012024-12-310001164727nem:ContingentConsiderationLiabilityMember2024-01-012024-12-310001164727nem:ContingentConsiderationAssetMember2024-12-310001164727nem:ContingentConsiderationLiabilityMember2024-12-310001164727nem:ContingentConsiderationAssetMember2025-01-012025-12-310001164727nem:ContingentConsiderationLiabilityMember2025-01-012025-12-310001164727nem:ContingentConsiderationAssetMember2025-12-310001164727nem:ContingentConsiderationLiabilityMember2025-12-310001164727nem:LundinGoldIncMember2025-12-310001164727us-gaap:ForeignExchangeContractMemberus-gaap:DesignatedAsHedgingInstrumentMemberus-gaap:CashFlowHedgingMember2025-12-310001164727us-gaap:ForeignExchangeContractMemberus-gaap:DesignatedAsHedgingInstrumentMemberus-gaap:CashFlowHedgingMember2024-12-310001164727nem:CadiaPowerPurchaseAgreementMemberus-gaap:DesignatedAsHedgingInstrumentMemberus-gaap:CashFlowHedgingMember2025-12-310001164727us-gaap:CashFlowHedgingMemberus-gaap:DesignatedAsHedgingInstrumentMember2025-12-310001164727us-gaap:CashFlowHedgingMemberus-gaap:DesignatedAsHedgingInstrumentMember2024-12-310001164727nem:ContingentConsiderationDerivativeMemberus-gaap:NondesignatedMember2025-12-310001164727nem:ContingentConsiderationDerivativeMemberus-gaap:NondesignatedMember2024-12-310001164727nem:AUDDenominatedCapitalExpenditureProgramMemberus-gaap:DesignatedAsHedgingInstrumentMemberus-gaap:CashFlowHedgingMember2025-12-310001164727nem:AUDDenominatedOperatingExpenditureProgramMemberus-gaap:DesignatedAsHedgingInstrumentMemberus-gaap:CashFlowHedgingMember2025-12-310001164727nem:CADDenominatedOperatingExpenditureProgramMemberus-gaap:DesignatedAsHedgingInstrumentMemberus-gaap:CashFlowHedgingMember2025-12-3100011647272022-10-310001164727nem:CadiaPowerPurchaseAgreementMemberus-gaap:NondesignatedMember2024-01-012024-01-010001164727nem:CadiaPowerPurchaseAgreementMemberus-gaap:NondesignatedMember2024-01-010001164727us-gaap:InterestRateContractMember2025-01-012025-12-310001164727us-gaap:InterestRateContractMember2024-01-012024-12-310001164727us-gaap:InterestRateContractMember2023-01-012023-12-310001164727us-gaap:ForeignExchangeContractMember2025-01-012025-12-310001164727us-gaap:ForeignExchangeContractMember2024-01-012024-12-310001164727us-gaap:ForeignExchangeContractMember2023-01-012023-12-310001164727nem:CadiaPowerPurchaseAgreementMember2025-01-012025-12-310001164727nem:CadiaPowerPurchaseAgreementMember2024-01-012024-12-310001164727nem:CadiaPowerPurchaseAgreementMember2023-01-012023-12-310001164727nem:StreamCreditFacilityAgreementMemberus-gaap:NondesignatedMember2024-06-300001164727nem:StreamCreditFacilityAgreementMemberus-gaap:NondesignatedMember2024-04-012024-06-300001164727nem:StreamCreditFacilityAgreementMemberus-gaap:NondesignatedMember2024-07-012024-09-300001164727nem:InvestmentsCurrentMember2025-12-310001164727nem:InvestmentsCurrentMember2024-12-310001164727nem:InvestmentsNoncurrentMember2025-12-310001164727nem:InvestmentsNoncurrentMember2024-12-310001164727nem:PuebloViejoMineMember2025-12-310001164727nem:PuebloViejoMineMembernem:InvestmentsNoncurrentMember2025-12-310001164727nem:PuebloViejoMineMembernem:InvestmentsNoncurrentMember2024-12-310001164727nem:NuevaUnionProjectMember2025-12-310001164727nem:NuevaUnionProjectMembernem:InvestmentsNoncurrentMember2025-12-310001164727nem:NuevaUnionProjectMembernem:InvestmentsNoncurrentMember2024-12-310001164727nem:LundinGoldIncMembernem:InvestmentsNoncurrentMember2025-12-310001164727nem:LundinGoldIncMembernem:InvestmentsNoncurrentMember2024-12-310001164727nem:NorteAbiertoProjectMember2025-12-310001164727nem:NorteAbiertoProjectMembernem:InvestmentsNoncurrentMember2025-12-310001164727nem:NorteAbiertoProjectMembernem:InvestmentsNoncurrentMember2024-12-310001164727nem:GreatlandGoldMember2024-12-310001164727nem:GreatlandGoldMembernem:InvestmentsNoncurrentMember2025-12-310001164727nem:GreatlandGoldMembernem:InvestmentsNoncurrentMember2024-12-310001164727nem:GreatlandResourcesLimitedMember2025-12-310001164727nem:PuebloViejoMineMember2025-01-012025-12-310001164727nem:PuebloViejoMineMember2024-01-012024-12-310001164727nem:PuebloViejoMineMember2023-01-012023-12-310001164727nem:LundinGoldIncMember2025-01-012025-12-310001164727nem:LundinGoldIncMember2024-01-012024-12-310001164727nem:LundinGoldIncMember2023-01-012023-12-310001164727nem:OtherInvestmentMember2025-01-012025-12-310001164727nem:OtherInvestmentMember2024-01-012024-12-310001164727nem:OtherInvestmentMember2023-01-012023-12-310001164727nem:PuebloViejoMineMember2020-11-300001164727nem:PuebloViejoMineMember2020-11-012020-11-300001164727nem:PuebloViejoMineMembernem:InvestmentTrancheOneMember2020-11-300001164727nem:PuebloViejoMineMembernem:InvestmentTrancheTwoMember2020-11-300001164727nem:PuebloViejoMineMember2024-10-310001164727nem:PuebloViejoMineMember2024-12-310001164727nem:PuebloViejoMineMemberus-gaap:RelatedPartyMember2025-12-310001164727nem:PuebloViejoMineMemberus-gaap:RelatedPartyMember2024-12-310001164727nem:LundinGoldIncMember2023-11-0600011647272023-11-060001164727nem:LundinGoldIncMemberus-gaap:RelatedPartyMember2025-12-310001164727nem:LundinGoldIncMemberus-gaap:RelatedPartyMember2024-12-310001164727nem:NorteAbiertoProjectMembernem:BarrickGoldCorporationMember2025-12-310001164727us-gaap:CostOfSalesMember2025-01-012025-12-310001164727us-gaap:CostOfSalesMember2024-01-012024-12-310001164727us-gaap:CostOfSalesMember2023-01-012023-12-310001164727nem:DepreciationAndAmortizationMember2025-01-012025-12-310001164727nem:DepreciationAndAmortizationMember2024-01-012024-12-310001164727nem:DepreciationAndAmortizationMember2023-01-012023-12-310001164727nem:StockpilesMember2025-12-310001164727nem:OreOnLeachPadsMember2025-12-310001164727nem:StockpilesMember2024-12-310001164727nem:OreOnLeachPadsMember2024-12-310001164727us-gaap:CostOfSalesMembernem:StockpilesAndOreOnLeachPadsMember2025-01-012025-12-310001164727us-gaap:CostOfSalesMembernem:StockpilesAndOreOnLeachPadsMember2024-01-012024-12-310001164727us-gaap:CostOfSalesMembernem:StockpilesAndOreOnLeachPadsMember2023-01-012023-12-310001164727nem:DepreciationAndAmortizationMembernem:StockpilesAndOreOnLeachPadsMember2025-01-012025-12-310001164727nem:DepreciationAndAmortizationMembernem:StockpilesAndOreOnLeachPadsMember2024-01-012024-12-310001164727nem:DepreciationAndAmortizationMembernem:StockpilesAndOreOnLeachPadsMember2023-01-012023-12-310001164727nem:StockpilesAndOreOnLeachPadsMember2025-01-012025-12-310001164727nem:StockpilesAndOreOnLeachPadsMember2024-01-012024-12-310001164727nem:StockpilesAndOreOnLeachPadsMember2023-01-012023-12-310001164727us-gaap:LandMember2025-12-310001164727us-gaap:LandMember2024-12-310001164727srt:MinimumMembernem:FacilitiesAndEquipmentMember2025-12-310001164727srt:MaximumMembernem:FacilitiesAndEquipmentMember2025-12-310001164727nem:FacilitiesAndEquipmentMember2025-12-310001164727nem:FacilitiesAndEquipmentMember2024-12-310001164727srt:MinimumMemberus-gaap:MineDevelopmentMember2025-12-310001164727srt:MaximumMemberus-gaap:MineDevelopmentMember2025-12-310001164727us-gaap:MineDevelopmentMember2025-12-310001164727us-gaap:MineDevelopmentMember2024-12-310001164727srt:MinimumMemberus-gaap:MiningPropertiesAndMineralRightsMember2025-12-310001164727srt:MaximumMemberus-gaap:MiningPropertiesAndMineralRightsMember2025-12-310001164727us-gaap:MiningPropertiesAndMineralRightsMember2025-12-310001164727us-gaap:MiningPropertiesAndMineralRightsMember2024-12-310001164727us-gaap:ConstructionInProgressMember2025-12-310001164727us-gaap:ConstructionInProgressMember2024-12-310001164727srt:MinimumMembernem:ProductionStageMember2025-12-310001164727srt:MaximumMembernem:ProductionStageMember2025-12-310001164727nem:ProductionStageMember2025-12-310001164727nem:ProductionStageMember2024-12-310001164727nem:DevelopmentStageMember2025-12-310001164727nem:DevelopmentStageMember2024-12-310001164727nem:ExplorationStageMember2025-12-310001164727nem:ExplorationStageMember2024-12-310001164727us-gaap:DiscontinuedOperationsHeldforsaleMembernem:PortfolioOptimizationProgramMemberus-gaap:MiningPropertiesAndMineralRightsMember2024-12-310001164727nem:LihirMember2023-12-310001164727nem:LihirMember2024-01-012024-12-310001164727nem:LihirMember2024-12-310001164727nem:LihirMember2025-12-310001164727nem:CadiaMember2023-12-310001164727nem:CadiaMember2024-01-012024-12-310001164727nem:CadiaMember2024-12-310001164727nem:CadiaMember2025-12-310001164727nem:RedChrisMember2023-12-310001164727nem:RedChrisMember2024-01-012024-12-310001164727nem:RedChrisMember2024-12-310001164727nem:RedChrisMember2025-12-310001164727nem:BrucejackMember2023-12-310001164727nem:BrucejackMember2024-01-012024-12-310001164727nem:BrucejackMember2024-12-310001164727nem:BrucejackMember2025-12-310001164727nem:NevadaGoldMinesMember2023-12-310001164727nem:NevadaGoldMinesMember2024-01-012024-12-310001164727nem:NevadaGoldMinesMember2024-12-310001164727nem:NevadaGoldMinesMember2025-12-310001164727nem:March2026SeniorNotesMemberus-gaap:SeniorNotesMember2025-12-310001164727nem:March2026SeniorNotesMemberus-gaap:SeniorNotesMember2024-12-310001164727nem:October2029SeniorNotesMemberus-gaap:SeniorNotesMember2025-12-310001164727nem:October2029SeniorNotesMemberus-gaap:SeniorNotesMember2024-12-310001164727nem:May2030SeniorNotesMemberus-gaap:SeniorNotesMember2025-12-310001164727nem:May2030SeniorNotesMemberus-gaap:SeniorNotesMember2024-12-310001164727nem:October2030SeniorNotesMemberus-gaap:SeniorNotesMember2025-12-310001164727nem:October2030SeniorNotesMemberus-gaap:SeniorNotesMember2024-12-310001164727nem:July2032SeniorNotesMemberus-gaap:SeniorNotesMember2025-12-310001164727nem:July2032SeniorNotesMemberus-gaap:SeniorNotesMember2024-12-310001164727nem:March2034SeniorNotesMemberus-gaap:SeniorNotesMember2025-12-310001164727nem:March2034SeniorNotesMemberus-gaap:SeniorNotesMember2024-12-310001164727nem:April2035SeniorNotesMemberus-gaap:SeniorNotesMember2025-12-310001164727nem:April2035SeniorNotesMemberus-gaap:SeniorNotesMember2024-12-310001164727nem:October2039SeniorNotesMemberus-gaap:SeniorNotesMember2025-12-310001164727nem:October2039SeniorNotesMemberus-gaap:SeniorNotesMember2024-12-310001164727nem:November2041SeniorNotesMemberus-gaap:SeniorNotesMember2025-12-310001164727nem:November2041SeniorNotesMemberus-gaap:SeniorNotesMember2024-12-310001164727nem:March2042SeniorNotesMemberus-gaap:SeniorNotesMember2025-12-310001164727nem:March2042SeniorNotesMemberus-gaap:SeniorNotesMember2024-12-310001164727nem:June2044SeniorNotesMemberus-gaap:SeniorNotesMember2025-12-310001164727nem:June2044SeniorNotesMemberus-gaap:SeniorNotesMember2024-12-310001164727nem:May2050SeniorNotesMemberus-gaap:SeniorNotesMember2025-12-310001164727nem:May2050SeniorNotesMemberus-gaap:SeniorNotesMember2024-12-310001164727nem:BilateralBankDebtFacilitiesMember2023-11-060001164727nem:BilateralBankDebtFacilitiesMember2023-12-310001164727nem:CorporateRevolvingCreditFacilityMember2019-04-040001164727nem:CorporateRevolvingCreditFacilityMember2024-02-150001164727nem:BilateralBankDebtFacilitiesMember2024-02-202024-02-200001164727nem:CorporateRevolvingCreditFacilityMember2025-12-310001164727us-gaap:LetterOfCreditMembernem:CorporateRevolvingCreditFacilityMember2025-12-310001164727us-gaap:LetterOfCreditMembernem:CorporateRevolvingCreditFacilityMember2024-12-310001164727nem:March2024SeniorNotesMemberus-gaap:SeniorNotesMember2024-03-070001164727nem:March2026SeniorNotesMemberus-gaap:SeniorNotesMember2024-03-070001164727nem:March2024SeniorNotesMemberus-gaap:SeniorNotesMember2024-03-072024-03-070001164727us-gaap:SeniorNotesMember2025-01-012025-12-310001164727us-gaap:SeniorNotesMember2024-01-012024-12-310001164727nem:March2026SeniorNotesMemberus-gaap:SeniorNotesMember2025-01-012025-12-310001164727nem:March2026SeniorNotesMemberus-gaap:SeniorNotesMember2024-01-012024-12-310001164727nem:October2029SeniorNotesMemberus-gaap:SeniorNotesMember2025-01-012025-12-310001164727nem:October2029SeniorNotesMemberus-gaap:SeniorNotesMember2024-01-012024-12-310001164727nem:May2030SeniorNotesMemberus-gaap:SeniorNotesMember2025-01-012025-12-310001164727nem:May2030SeniorNotesMemberus-gaap:SeniorNotesMember2024-01-012024-12-310001164727nem:October2030SeniorNotesMemberus-gaap:SeniorNotesMember2025-01-012025-12-310001164727nem:October2030SeniorNotesMemberus-gaap:SeniorNotesMember2024-01-012024-12-310001164727nem:July2032SeniorNotesMemberus-gaap:SeniorNotesMember2025-01-012025-12-310001164727nem:July2032SeniorNotesMemberus-gaap:SeniorNotesMember2024-01-012024-12-310001164727nem:March2034SeniorNotesMemberus-gaap:SeniorNotesMember2025-01-012025-12-310001164727nem:March2034SeniorNotesMemberus-gaap:SeniorNotesMember2024-01-012024-12-310001164727nem:SeniorNotesDueApril2035Memberus-gaap:SeniorNotesMember2025-12-310001164727nem:SeniorNotesDueApril2035Memberus-gaap:SeniorNotesMember2025-01-012025-12-310001164727nem:SeniorNotesDueApril2035Memberus-gaap:SeniorNotesMember2024-01-012024-12-310001164727nem:October2039SeniorNotesMemberus-gaap:SeniorNotesMember2025-01-012025-12-310001164727nem:October2039SeniorNotesMemberus-gaap:SeniorNotesMember2024-01-012024-12-310001164727nem:November2041SeniorNotesMemberus-gaap:SeniorNotesMember2025-01-012025-12-310001164727nem:November2041SeniorNotesMemberus-gaap:SeniorNotesMember2024-01-012024-12-310001164727nem:March2042SeniorNotesMemberus-gaap:SeniorNotesMember2025-01-012025-12-310001164727nem:March2042SeniorNotesMemberus-gaap:SeniorNotesMember2024-01-012024-12-310001164727nem:June2044SeniorNotesMemberus-gaap:SeniorNotesMember2025-01-012025-12-310001164727nem:June2044SeniorNotesMemberus-gaap:SeniorNotesMember2024-01-012024-12-310001164727nem:SeniorNotesNetOfDiscount2026Member2025-01-012025-03-310001164727nem:NevadaGoldMinesMember2025-12-310001164727nem:NevadaGoldMinesMember2024-12-310001164727nem:WorsleyJVMember2025-01-012025-03-310001164727nem:NevadaGoldMinesMembernem:BarrickGoldCorporationMember2024-12-310001164727nem:NevadaGoldMinesMembernem:BarrickGoldCorporationMember2025-12-310001164727us-gaap:AccumulatedGainLossCashFlowHedgeIncludingNoncontrollingInterestMember2023-12-310001164727nem:AccumulatedOtherAdjustmentsMember2023-12-310001164727us-gaap:AociIncludingPortionAttributableToNoncontrollingInterestMember2023-12-310001164727us-gaap:AccumulatedGainLossCashFlowHedgeIncludingNoncontrollingInterestMember2024-01-012024-12-310001164727nem:AccumulatedOtherAdjustmentsMember2024-01-012024-12-310001164727us-gaap:AccumulatedGainLossCashFlowHedgeIncludingNoncontrollingInterestMember2024-12-310001164727nem:AccumulatedOtherAdjustmentsMember2024-12-310001164727us-gaap:AociIncludingPortionAttributableToNoncontrollingInterestMember2024-12-310001164727us-gaap:AccumulatedGainLossCashFlowHedgeIncludingNoncontrollingInterestMember2025-01-012025-12-310001164727nem:AccumulatedOtherAdjustmentsMember2025-01-012025-12-310001164727us-gaap:AccumulatedGainLossCashFlowHedgeIncludingNoncontrollingInterestMember2025-12-310001164727nem:AccumulatedOtherAdjustmentsMember2025-12-310001164727us-gaap:AociIncludingPortionAttributableToNoncontrollingInterestMember2025-12-310001164727us-gaap:InterestRateSwapMemberus-gaap:ReclassificationOutOfAccumulatedOtherComprehensiveIncomeMemberus-gaap:AccumulatedGainLossCashFlowHedgeIncludingNoncontrollingInterestMember2025-01-012025-12-310001164727us-gaap:InterestRateSwapMemberus-gaap:ReclassificationOutOfAccumulatedOtherComprehensiveIncomeMemberus-gaap:AccumulatedGainLossCashFlowHedgeIncludingNoncontrollingInterestMember2024-01-012024-12-310001164727us-gaap:InterestRateSwapMemberus-gaap:ReclassificationOutOfAccumulatedOtherComprehensiveIncomeMemberus-gaap:AccumulatedGainLossCashFlowHedgeIncludingNoncontrollingInterestMember2023-01-012023-12-310001164727nem:ForeignCurrencyExchangeAndDieselFixedForwardContractsMemberus-gaap:ReclassificationOutOfAccumulatedOtherComprehensiveIncomeMemberus-gaap:AccumulatedGainLossCashFlowHedgeIncludingNoncontrollingInterestMember2025-01-012025-12-310001164727nem:ForeignCurrencyExchangeAndDieselFixedForwardContractsMemberus-gaap:ReclassificationOutOfAccumulatedOtherComprehensiveIncomeMemberus-gaap:AccumulatedGainLossCashFlowHedgeIncludingNoncontrollingInterestMember2024-01-012024-12-310001164727nem:ForeignCurrencyExchangeAndDieselFixedForwardContractsMemberus-gaap:ReclassificationOutOfAccumulatedOtherComprehensiveIncomeMemberus-gaap:AccumulatedGainLossCashFlowHedgeIncludingNoncontrollingInterestMember2023-01-012023-12-310001164727nem:DerivativeInstrumentAmortizationMemberus-gaap:ReclassificationOutOfAccumulatedOtherComprehensiveIncomeMemberus-gaap:AccumulatedGainLossCashFlowHedgeIncludingNoncontrollingInterestMember2025-01-012025-12-310001164727nem:DerivativeInstrumentAmortizationMemberus-gaap:ReclassificationOutOfAccumulatedOtherComprehensiveIncomeMemberus-gaap:AccumulatedGainLossCashFlowHedgeIncludingNoncontrollingInterestMember2024-01-012024-12-310001164727nem:DerivativeInstrumentAmortizationMemberus-gaap:ReclassificationOutOfAccumulatedOtherComprehensiveIncomeMemberus-gaap:AccumulatedGainLossCashFlowHedgeIncludingNoncontrollingInterestMember2023-01-012023-12-310001164727us-gaap:ReclassificationOutOfAccumulatedOtherComprehensiveIncomeMemberus-gaap:AccumulatedGainLossCashFlowHedgeIncludingNoncontrollingInterestMember2025-01-012025-12-310001164727us-gaap:ReclassificationOutOfAccumulatedOtherComprehensiveIncomeMemberus-gaap:AccumulatedGainLossCashFlowHedgeIncludingNoncontrollingInterestMember2024-01-012024-12-310001164727us-gaap:ReclassificationOutOfAccumulatedOtherComprehensiveIncomeMemberus-gaap:AccumulatedGainLossCashFlowHedgeIncludingNoncontrollingInterestMember2023-01-012023-12-310001164727us-gaap:ReclassificationOutOfAccumulatedOtherComprehensiveIncomeMemberus-gaap:AccumulatedDefinedBenefitPlansAdjustmentIncludingPortionAttributableToNoncontrollingInterestMember2025-01-012025-12-310001164727us-gaap:ReclassificationOutOfAccumulatedOtherComprehensiveIncomeMemberus-gaap:AccumulatedDefinedBenefitPlansAdjustmentIncludingPortionAttributableToNoncontrollingInterestMember2024-01-012024-12-310001164727us-gaap:ReclassificationOutOfAccumulatedOtherComprehensiveIncomeMemberus-gaap:AccumulatedDefinedBenefitPlansAdjustmentIncludingPortionAttributableToNoncontrollingInterestMember2023-01-012023-12-310001164727us-gaap:ReclassificationOutOfAccumulatedOtherComprehensiveIncomeMembernem:OtherComprehensiveIncomeLossOtherAdjustmentsAfterTaxMember2025-01-012025-12-310001164727us-gaap:ReclassificationOutOfAccumulatedOtherComprehensiveIncomeMembernem:OtherComprehensiveIncomeLossOtherAdjustmentsAfterTaxMember2024-01-012024-12-310001164727us-gaap:ReclassificationOutOfAccumulatedOtherComprehensiveIncomeMembernem:OtherComprehensiveIncomeLossOtherAdjustmentsAfterTaxMember2023-01-012023-12-310001164727us-gaap:ReclassificationOutOfAccumulatedOtherComprehensiveIncomeMember2025-01-012025-12-310001164727us-gaap:ReclassificationOutOfAccumulatedOtherComprehensiveIncomeMember2024-01-012024-12-310001164727us-gaap:ReclassificationOutOfAccumulatedOtherComprehensiveIncomeMember2023-01-012023-12-310001164727nem:DawnMiningCompanyMember2025-12-310001164727nem:MidniteMineAndDawnMillSitesMember2025-12-310001164727nem:CadiaMember2025-12-310001164727nem:CadiaMember2022-10-132022-10-310001164727nem:NSWDepartmentOfClimateChangeEnergyTheEnvironmentAndWaterMembernem:CadiaMember2025-12-192025-12-190001164727nem:NSWEPAMembernem:CadiaMember2025-12-192025-12-190001164727nem:CrippleCreekAndVictorMineMember2025-12-310001164727nem:CrippleCreekAndVictorMineMember2022-12-310001164727nem:NewmontGhanaGoldLimitedAndNewmontGoldenRidgeLimitedMember2025-12-310001164727us-gaap:UseRightsMembernem:HoltOptionMember2020-08-012020-08-310001164727us-gaap:PendingLitigationMembernem:KirklandRoyaltyMatterMember2021-08-162021-08-160001164727nem:GhanaParliamentCasesMember2018-12-242018-12-240001164727nem:GhanaParliamentCasesMember2025-01-012025-12-310001164727nem:NewmontCapitalLimitedAndNewmontCanadaFNHoldingsULCMember2025-12-310001164727us-gaap:AustralianTaxationOfficeMember2017-10-012017-12-310001164727nem:GaloreCreekMember2025-12-3100011647272025-10-012025-12-310001164727nem:TomPalmerMember2025-10-012025-12-310001164727nem:TomPalmerMember2025-12-310001164727nem:PeterWexlerMember2025-10-012025-12-310001164727nem:PeterWexlerMember2025-12-310001164727nem:PeterTothMember2025-10-012025-12-310001164727nem:PeterTothMember2025-12-310001164727nem:MarkRodgersMember2025-10-012025-12-310001164727nem:MarkRodgersMember2025-12-310001164727nem:DavidThorntonMember2025-10-012025-12-310001164727nem:DavidThorntonMember2025-12-310001164727us-gaap:ValuationAllowanceOfDeferredTaxAssetsMember2024-12-310001164727us-gaap:ValuationAllowanceOfDeferredTaxAssetsMember2023-12-310001164727us-gaap:ValuationAllowanceOfDeferredTaxAssetsMember2022-12-310001164727us-gaap:ValuationAllowanceOfDeferredTaxAssetsMember2025-01-012025-12-310001164727us-gaap:ValuationAllowanceOfDeferredTaxAssetsMember2024-01-012024-12-310001164727us-gaap:ValuationAllowanceOfDeferredTaxAssetsMember2023-01-012023-12-310001164727us-gaap:ValuationAllowanceOfDeferredTaxAssetsMember2025-12-31
Table of Contents
UNITED STATES
SECURITIES AND EXCHANGE COMMISSION
Washington, D. C. 20549
Form 10-K
(Mark One)
☒     ANNUAL REPORT PURSUANT TO SECTION 13 OR 15(d) OF THE SECURITIES EXCHANGE ACT OF 1934
For the Fiscal Year Ended December 31, 2025
or
☐    TRANSITION REPORT PURSUANT TO SECTION 13 OR 15(d) OF THE SECURITIES EXCHANGE ACT OF 1934
For the transition period from__________to__________
Commission File Number: 001-31240

Newmont-Color-RGB.jpg
NEWMONT CORPORATION
(Exact name of registrant as specified in its charter)
Delaware84-1611629
(State or Other Jurisdiction of Incorporation or Organization)(I.R.S. Employer Identification No.)
6900 E Layton Ave
Denver, Colorado
80237
(Address of Principal Executive Offices)(Zip Code)
Registrant’s telephone number, including area code (303) 863-7414
Securities registered or to be registered pursuant to Section 12(b) of the Act.
Title of each class
Trading SymbolName of each exchange on which registered
Common stock, par value $1.60 per shareNEMNew York Stock Exchange
Indicate by check mark if the registrant is a well-known seasoned issuer, as defined in Rule 405 of the Securities Act.     ☒ Yes     ☐ No
Indicate by check mark if the registrant is not required to file reports pursuant to Section 13 or Section 15(d) of the Exchange Act.     ☐ Yes     ☒ No
Indicate by check mark whether the registrant (1) has filed all reports required to be filed by Section 13 or 15(d) of the Securities Exchange Act of 1934 during the preceding 12 months (or for such shorter period that the registrant was required to file such reports), and (2) has been subject to such filing requirements for the past 90 days.     ☒ Yes     ☐ No
Indicate by check mark whether the registrant has submitted electronically every Interactive Data File required to be submitted pursuant to Rule 405 of Regulation S-T during the preceding 12 months (or for such shorter period that the registrant was required to submit such files).     ☒ Yes     ☐ No
Indicate by check mark whether the registrant is a large accelerated filer, an accelerated filer, a non-accelerated filer, a smaller reporting company, or an emerging growth company. See definitions of “large accelerated filer,” “accelerated filer,” “smaller reporting company,” and “emerging growth company” in Rule 12-b2 of the Exchange Act.
Large accelerated filer
☒
Accelerated filer
☐
Non-accelerated filer
☐
Smaller reporting company
☐
Emerging growth company
☐
If an emerging growth company, indicate by check mark if the registrant has elected not to use the extended transition period for complying with any new or revised financial accounting standards provided pursuant to Section 13(a) of the Exchange Act.     ☐
Indicate by check mark whether the Registrant has filed a report on and attestation to its management's assessment of the effectiveness of its internal control over financial reporting under Section 404(b) of the Sarbanes-Oxley Act (15 U.S.C. 7262(b)) by the registered public accounting firm that prepared or issued its audit report.     ☒
If securities are registered pursuant to Section 12(b) of the Act, indicate by check mark whether the financial statements of the registrant included in the filing reflect the correction of an error to previously issued financial statements.     ☐
Indicate by check mark whether any of those error corrections are restatements that required a recovery analysis of incentive-based compensation received by any of the registrant’s executive officers during the relevant recovery period pursuant to §240.10D-1(b).     ☐
Indicate by check mark whether the registrant is a shell company (as defined in Rule 12-b2 of the Exchange Act).     ☐ Yes     ☒ No
At June 30, 2025, the aggregate market value of the registrant’s voting and non-voting common equity held by non-affiliates of the registrant was $64,108,664,771 based on the closing sale price as reported on the New York Stock Exchange. There were 1,087,874,212 shares of common stock outstanding on February 12, 2026.
DOCUMENTS INCORPORATED BY REFERENCE
Portions of Registrant’s definitive Proxy Statement for the Registrant’s 2026 Annual Stockholders Meeting will be filed no later than 120 days after the close of the Registrant's fiscal year ended December 31, 2025, are incorporated by reference into Part III of this report.


TABLE OF CONTENTS
Page
1
SCH-1
SCH-2


Table of Contents
GLOSSARY: UNITS OF MEASURE AND ABBREVIATIONS
UnitUnit of Measure
$United States Dollar
%Percent
A$Australian Dollar
C$Canadian Dollar
gramMetric Gram
ounceTroy Ounce
tonneMetric Ton
Abbreviation
Description
AISC (1)
All-In Sustaining Costs
ARCAsset Retirement Cost
ARS
Argentine Peso
ASCFASB Accounting Standard Codification
ASUFASB Accounting Standard Update
AUDAustralian Dollar
CADCanadian Dollar
CASCosts Applicable to Sales
EBITDA (1)
Earnings Before Interest, Taxes, Depreciation and Amortization
EPAU.S. Environmental Protection Agency
ESGEnvironmental, Social and Governance
Exchange ActU.S. Securities Exchange Act of 1934
FASBFinancial Accounting Standards Board
GAAP
U.S. Generally Accepted Accounting Principles
GEO (2)
Gold Equivalent Ounces
GHG
Greenhouse Gases, which are defined by the EPA as gases that trap heat in the atmosphere
GISTM
Global Industry Standard on Tailings Management
IMF
International Monetary Fund
INDEC
Instituto Nacional de Estadistca y Censos
IFRSInternational Financial Reporting Standards
LBMA
London Bullion Market Association
MD&A
Management’s Discussion and Analysis of Consolidated Financial Condition and Results of Operations
MINAMMinistry of the Environment of Peru
Mine ActU.S. Federal Mine Safety and Health Act of 1977
MINEMMinistry of Energy and Mines of Peru
MSHAFederal Mine Safety and Health Administration
MXN
Mexican Peso
NPDESNational Pollutant Discharge Elimination System
NSR
Net Smelter Return
PNG
Papua New Guinea
PSU
Performance Leverage Stock Unit
RSU
Restricted Stock Unit
SAG
Semi-Autogenous Grinding
SECU.S. Securities and Exchange Commission
Securities ActU.S. Securities Act of 1933
SOFR
Secured Overnight Financing Rate
TSF
Tailings Storage Facility
UN
The United Nations
UOP
Units of Production
U.S.
The United States of America
USDUnited States Dollar
WTPWater Treatment Plant
____________________________
(1)Refer to Non-GAAP Financial Measures within Part II, Item 7, MD&A.
(2)Refer to Results of Consolidated Operations within Part II, Item 7, MD&A.
1

Table of Contents
NEWMONT CORPORATION
RESULTS AND HIGHLIGHTS
(unaudited, dollars in millions, except per share, per ounce, per pound, and per tonne)
Year Ended December 31,
202520242023
Financial Results:
Sales
$22,669 $18,682 $11,812 
Gold$19,304 $15,746 $10,593 
Copper$1,438 $1,327 $575 
Silver$1,080 $792 $335 
Lead$183 $195 $96 
Zinc$664 $622 $213 
Costs applicable to sales (1)
$8,085 $8,963 $6,699 
Gold$6,615 $7,364 $5,689 
Copper$597 $696 $359 
Silver$334 $360 $300 
Lead$116 $116 $98 
Zinc$423 $427 $253 
Net income (loss) from continuing operations
$7,167 $3,313 $(2,494)
Net income (loss)
$7,167 $3,381 $(2,467)
Net income (loss) from continuing operations attributable to Newmont stockholders$7,085 $3,280 $(2,521)
Per common share, diluted:
Net income (loss) from continuing operations attributable to Newmont stockholders$6.39 $2.86 $(3.00)
Net income (loss) attributable to Newmont stockholders$6.39 $2.92 $(2.97)
Adjusted net income (loss) (2)
$7,634 $3,991 $1,324 
Adjusted net income (loss) per share, diluted (2)
$6.89 $3.48 $1.57 
Earnings before interest, taxes and depreciation and amortization (2)
$14,092 $7,528 $320 
Adjusted earnings before interest, taxes and depreciation and amortization (2)
$13,480 $8,675 $4,215 
Net cash provided by (used in) operating activities of continuing operations
$10,334 $6,318 $2,754 
Free cash flow (2)
$7,299 $2,916 $88 
Regular cash dividends paid per common share$1.00 $1.00 $1.60 
Regular cash dividends declared per common share$1.01 $1.00 $1.45 
____________________________
(1)Excludes Depreciation and amortization and Reclamation and remediation.
(2)Refer to Non-GAAP Financial Measures within Part II, Item 7, MD&A.
2

Table of Contents
NEWMONT CORPORATION
RESULTS AND HIGHLIGHTS
(unaudited, dollars in millions, except per share, per ounce, per pound, and per tonne)
Year Ended December 31,
202520242023
Operating Results:
Consolidated gold ounces (thousands):
Produced5,5306,5455,401
Sold5,5196,5395,420
Attributable gold ounces (thousands): 
Attributable to Newmont5,4716,4765,321
Pueblo Viejo (40%)
253235224
Fruta del Norte (1)
165138—
Produced5,8896,8495,545
Sold (2)
5,4596,4715,340
Consolidated and attributable gold equivalent ounces - other metals (thousands):
Produced1,4091,944891
Sold1,4251,916896
Consolidated and attributable - other metals:
Produced copper:
Pounds (millions)296 338 145 
Tonnes (thousands)135 153 65 
Sold copper:
Pounds (millions)294 332 155 
Tonnes (thousands)134 150 71 
Produced silver (million ounces)28 33 18 
Sold silver (million ounces)28 33 17 
Produced lead:
Pounds (millions)216 212 113 
Tonnes (thousands)98 96 51 
Sold lead:
Pounds (millions)209 213 107 
Tonnes (thousands)95 97 49 
Produced zinc:
Pounds (millions)509 569 230 
Tonnes (thousands)231 258 104 
Sold zinc:
Pounds (millions)542 545 222 
Tonnes (thousands)246 247 101 
Average realized price:
Gold (per ounce) $3,498 $2,408 $1,954 
Copper (per pound) $4.89 $4.00 $3.71 
Copper (per tonne)$10,787 $8,831 $8,158 
Silver (per ounce)$38.92 $24.13 $19.97 
Lead (per pound)$0.87 $0.91 $0.90 
Lead (per tonne)$1,927 $2,016 $1,976 
Zinc (per pound)$1.23 $1.14 $0.96 
Zinc (per tonne)$2,705 $2,520 $2,116 


3

Table of Contents
NEWMONT CORPORATION
RESULTS AND HIGHLIGHTS
(unaudited, dollars in millions, except per share, per ounce, per pound, and per tonne)
Year Ended December 31,
202520242023
Operating Results (continued):
Consolidated costs applicable to sales: (3)(4)
Gold (per ounce)$1,199 $1,126 $1,050 
Gold equivalent ounces - other metals (per ounce)$1,032 $834 $1,127 
Copper (per tonne)$4,476 $4,625 $5,081 
Silver (per ounce)$12 $11 $18 
Lead (per tonne)$1,226 $1,201 $2,018 
Zinc (per tonne)$1,723 $1,729 $2,507 
All-in sustaining costs: (5)
Gold (per ounce)$1,609 $1,516 $1,444 
Gold equivalent ounces - other metals (per ounce)$1,392 $1,161 $1,579 
Copper (per tonne)$6,423 $6,638 $6,931 
Silver (per ounce)$15 $14 $24 
Lead (per tonne)$1,456 $1,467 $2,579 
Zinc (per tonne)$2,156 $2,350 $3,622 
____________________________
(1)The Fruta del Norte mine is wholly owned by Lundin Gold Inc., in which the Company holds a 32% interest and is accounted for as an equity method investment on a quarter lag.
(2)Attributable gold ounces sold excludes ounces related to the Pueblo Viejo mine and the Fruta del Norte mine.
(3)Excludes Depreciation and amortization and Reclamation and remediation.
(4)Calculated by dividing the costs applicable to sales of gold and other metals by gold ounces or gold equivalent ounces sold, respectively.
(5)All AISC figures are presented on a co-product basis; costs are allocated to co-product metals based upon the relative sales value, determined using GEO pricing, of gold and other metals produced during the period. Refer to Non-GAAP Financial Measures within Part II, Item 7, MD&A.
4

Table of Contents
2025 Highlights (dollars in millions, except per share, per ounce and per pound amounts)
•Net income: Delivered Net income (loss) from continuing operations attributable to Newmont stockholders of $7,085 or $6.39 per diluted share, an increase of $3,805 from the prior year primarily due to (i) a net increase in Sales largely due to higher average realized gold prices partially offset by the impact from divestitures, (ii) a net gain on completed divestments, compared to prior year write-downs from assets held for sale, recognized in (Gain) loss on sale of assets held for sale, and (iii) a net decrease in costs applicable to sales, recognized in Costs applicable to sales, primarily resulting from divested sites. This increase was partially offset by the increase in Income and mining tax benefit (expense) and Impairment charges, primarily at Yanacocha.
•Adjusted net income: Reported Adjusted net income (loss) of $7,634 or $6.89 per diluted share, an increase of $3.41 per diluted share from the prior year (refer to Non-GAAP Financial Measures within Part II, Item 7, MD&A).
•Adjusted EBITDA: Reported $13,480 in Adjusted EBITDA, an increase of 55% from the prior year (refer to Non-GAAP Financial Measures within Part II, Item 7, MD&A).
•Cash flow: Reported Net cash provided by (used in) operating activities of continuing operations of $10,334, an increase of 64% from the prior year, and Free cash flow of $7,299 (refer to Non-GAAP Financial Measures within Part II, Item 7, MD&A).
•Portfolio updates: Achieved commercial production at the Ahafo North project in Ghana resulting in classification as a reportable segment. Completed the sale of the CC&V, Musselwhite, Éléonore, Akyem, and Porcupine reportable segments and the Coffee development project.
•Attributable gold production: Produced approximately 6 million ounces of gold, a decrease of 14% from prior year largely driven by impact of divestments.
•Financial strength: Ended the year with $7.6 billion of consolidated cash and $11.6 billion of total liquidity; redeemed $3.4 billion of senior notes and settled $2.3 billion of share repurchases; declared a total dividend of $1.01 per share for the year.
Our Global Project Pipeline
Newmont’s project pipeline supports stable production with improving margins and mine life. Near-term development capital projects are presented below. Additional projects represent incremental improvements to production and cost guidance. We manage our wider project portfolio to maintain flexibility to address the development risks associated with our projects including permitting, local community and government support, engineering and procurement availability, technical issues, escalating costs and other associated risks that could adversely impact the timing and costs of certain opportunities.
Tanami Expansion 2, Tanami. This project secures Tanami’s future as a long-life, low-cost producer by extending mine life beyond 2040 through the addition of a 1,460 meter hoisting shaft and supporting infrastructure to achieve higher production and provide a platform for future growth. The expansion is expected to increase average annual gold production and improve efficiency for the first five years (2028 - 2032). The project is expected to achieve commercial production in the second half of 2027, and total capital costs for the project are estimated to be between $1,700 and $1,800. Development capital costs (excluding capitalized interest and capitalized depreciation and amortization) since approval were $1,304, of which $284 related to 2025.
Cadia Panel Caves, Cadia. This project includes two panel caves to recover approximately 5 million ounces of gold reserves and 1.1 million tonnes of copper reserves. Cave establishment continues through the firing of additional drawbells in PC2-3 and cave establishment is expected to be completed by late 2026. The first drawbell in PC1-2 was successfully fired in December 2025, marking the start of the next critical phase of cave establishment, with the last drawbell expected to be completed in 2029. Capital costs for the PC2-3 and PC1-2 project are estimated to be between $2,000 and $2,400. Development capital costs (excluding capitalized interest and capitalized depreciation and amortization) for PC2-3, PC1-2, and PC1 combined since acquisition of Newcrest were $516, of which $268 related to 2025.
5

Table of Contents
PART I
ITEM 1.       BUSINESS (dollars in millions, except per share, per ounce and per pound amounts)
Introduction
Newmont Corporation was incorporated in 1921 and is primarily a gold producer with significant operations and/or assets in the United States, Papua New Guinea, Australia, Ghana, Suriname, Argentina, Dominican Republic, Chile, Peru, Ecuador, Mexico, and Canada. At December 31, 2025, Newmont had attributable proven and probable gold reserves of 118.2 million ounces, attributable measured and indicated gold resources of 88.1 million ounces, attributable inferred gold resources of 60.6 million ounces, and an aggregate land position of approximately 19,200 square miles (49,800 square kilometers). Newmont is also engaged in the production of copper, silver, lead, and zinc. As the world’s leading gold company, Newmont remains committed to creating value and improving lives through sustainable and responsible mining.
Newmont’s corporate headquarters are in Denver, Colorado, U.S. In this report, “Newmont,” the “Company,” “our,” and “we” refer to Newmont Corporation together with our affiliates and subsidiaries, unless the context otherwise requires.
Divestiture of Non-Core Assets
Based on a comprehensive review of the Company’s portfolio of assets following the acquisition of Newcrest Mining Limited ("Newcrest"), the Company’s Board of Directors approved a portfolio optimization program to divest six non-core assets and a development project in February 2024. The non-core assets to be divested included Telfer, CC&V, Musselwhite, Éléonore, Porcupine, Akyem, and the Coffee development project in Canada. The Company presented these assets as held for sale in the first quarter of 2024 and recorded the assets at the lower of their carrying value or fair value, less costs to sell.
The Company completed the sale of the assets of the Telfer reportable segment in the fourth quarter of 2024, the sale of the CC&V, Musselwhite, and Éléonore reportable segments in the first quarter of 2025, the sale of the Porcupine and Akyem reportable segments in the second quarter of 2025, and the sale of the Coffee development project in the fourth quarter of 2025. Refer to Note 3 to the Consolidated Financial Statements for further information on the Company's divestitures.
Newcrest Acquisition
On November 6, 2023, we completed the acquisition of Newcrest (“the Newcrest transaction”). Results of Newcrest for the period November 6 to December 31, 2023 and the years ended December 31, 2024 and 2025 are included in this report. Refer to Note 3 to the Consolidated Financial Statements for further information on the Company's acquisitions.
Segment Information
The Company's 13 reportable segments consist of each of its 12 mining operations that it manages and its 38.5% proportionate interest in Nevada Gold Mines ("NGM"), which it does not directly manage. The reportable segments at December 31, 2025 exclude reportable segments that have been divested.
In October 2025, the Company declared commercial production at its Ahafo North project in Ghana resulting in classification as a reportable segment.
For information on acquisitions and divestitures impacting the comparability of our results, refer to Note 3 to the Consolidated Financial Statements.
Refer to Item 1A, Risk Factors, below, and Note 4 to the Consolidated Financial Statements for further information relating to our reportable segments. Refer to Note 5 to the Consolidated Financial Statements for information relating to domestic and export sales and lack of dependence on a limited number of customers.
Products
References in this report to “attributable” means that portion of gold, copper, silver, lead, or zinc produced, sold or included in proven and probable reserves and measured, indicated, and inferred resources based on our proportionate ownership, unless otherwise noted.
6

Table of Contents
Gold
General. The details of our consolidated and attributable gold production from continuing operations are set forth below:
Year Ended December 31,
202520242023
Consolidated gold ounces produced (thousands)5,530 6,545 5,401 
Attributable gold ounces produced (thousands)5,889 6,849 5,545 
Attributable gold ounces produced from equity method investments (thousands):
Pueblo Viejo (40%)
253 235 224 
Fruta del Norte (32%) (1)
165 138 — 
418 373 224 
____________________________
(1)The Fruta del Norte mine is wholly owned and operated by Lundin Gold Inc. ("Lundin Gold"). The Company acquired a 32% interest in Lundin Gold through the Newcrest transaction, which is accounted for as an equity method investment on a quarterly lag. As a result, results of operations were not reported until the first quarter of 2024. Refer to Notes 3 and 15 to the Consolidated Financial Statements for additional information.
For the years ended December 31, 2025, 2024 and 2023, 85%, 85% and 89%, respectively, of our Sales were attributable to gold. Most of our Sales come from the sale of refined gold. The end product at our gold operations, however, is generally doré bars. Doré is an alloy consisting primarily of gold but also containing silver and other metals. Doré is sent to refiners to produce bullion that meets the required market standard of 99.95% gold. Under the terms of our refining agreements, the doré bars are refined for a fee, and our share of the refined gold and the separately-recovered silver is credited to our account or delivered to buyers. Additionally, a portion of gold is sold in concentrate containing other metals such as copper, silver, lead, and/or zinc.
Gold Uses. Gold generally is used for fabrication or investment. Fabricated gold has a variety of end uses, including jewelry, electronics, dentistry, industrial and decorative uses, medals, medallions, and official coins. Gold investors buy gold bullion, official coins, and jewelry.
Gold Supply. A combination of mine production, recycling and draw-down of existing gold stocks held by governments, financial institutions, industrial organizations and private individuals make up the annual gold supply. Based on public information available, for the years ended December 31, 2023 through 2025, mine production has averaged approximately 73% of the annual gold supply with the remainder primarily sourced from recycled gold.
Gold Price. The following table presents the annual high, low, and average daily afternoon LBMA Gold Price over the past ten years on the London Bullion Market ($/ounce):
YearHighLowAverage
2026 (through February 12, 2026)
$5,405 $4,353 $4,808 
2025$4,449 $2,633 $3,432 
2024$2,778 $1,985 $2,386 
2023$2,078 $1,811 $1,941 
2022$2,039 $1,629 $1,800 
2021$1,943 $1,684 $1,799 
2020$2,067 $1,474 $1,770 
2019$1,546 $1,270 $1,393 
2018$1,355 $1,178 $1,268 
2017$1,346 $1,151 $1,257 
2016$1,366 $1,077 $1,251 
On February 12, 2026, the afternoon LBMA gold price was $5,043 per ounce.
Refer to Note 2 to the Consolidated Financial Statements for information on how we recognize revenue for gold sales from doré production.
Other Co-product Metals
Generally, if a metal expected to be mined represents more than 10% to 20% of the life of mine sales value of all the metal expected to be mined, the metal is considered a co-product and recognized as Sales in the Consolidated Financial Statements.
Copper production at Cadia, Boddington, and Red Chris and silver, lead, and zinc production at Peñasquito are considered co-products. Copper production at Telfer, prior to divestment in the fourth quarter of 2024, was considered a co-product. Copper, silver, lead, and zinc sales are generally in the form of concentrate that is sold to smelters for further treatment and refining.
7

Table of Contents
The following table details consolidated co-product production and the percentage of Sales that was attributable to copper, silver, lead, and zinc for the years ended December 31, 2025, 2024, and 2023:
202520242023
Co-product ProductionSales as % of Total SalesCo-product ProductionSales as % of Total SalesCo-product ProductionSales as % of Total Sales
Copper (pounds/millions)2966 %3387 %1455 %
Silver (ounces/millions)285 %334 %183 %
Lead (pounds/millions)2161 %2121 %1131 %
Zinc (pounds/millions)5093 %5693 %2302 %
By-product Metals
If a metal expected to be mined falls below the co-product sales value percentages, the metal is considered a by-product. Revenues from by-product sales are credited to Costs applicable to sales in the Consolidated Financial Statements.
Aside from the co-product sales at Cadia, Boddington, Peñasquito, Red Chris, and Telfer, copper and silver produced at other Newmont sites are by-product metals.
Gold and Other Metals Processing Methods
Doré. Gold is extracted from naturally-oxidized ores by either milling or heap leaching, depending on the amount of gold contained in the ore, the amenability of the ore to treatment and related capital and operating costs. Higher grade oxide ores are generally processed through mills, where the ore is ground into a fine powder and mixed with water into a slurry, which then passes through a carbon-in-leach circuit to recover the gold. Lower grade oxide ores are generally processed using heap leaching. Heap leaching consists of stacking crushed or run-of-mine ore on impermeable, synthetically lined pads where a weak cyanide solution is applied to the surface of the heap to dissolve the gold contained within the ore. In both cases, the gold-bearing solution is then collected and pumped to process facilities to remove the gold by collection on carbon or by zinc precipitation.
Gold contained in ores that are not naturally-oxidized can be directly milled if the gold is liberated and amenable to cyanidation, generally known as free milling ores. Ores that are not amenable to cyanidation, known as refractory ores, require more costly and complex processing techniques than oxide or free milling ore. Higher grade refractory ores are processed through either roasters or autoclaves. Roasters heat finely ground ore to a high temperature, burn off the carbon and oxidize the sulfide minerals that prevent efficient leaching. Autoclaves use heat, oxygen and pressure to oxidize sulfide ores.
Some gold sulfide ores may be processed through a flotation plant. In flotation, ore is finely ground, turned into slurry, then placed in a tank known as a flotation cell. Chemicals are added to the slurry causing the gold-containing sulfides to attach to air bubbles and float to the top of the tank. The sulfides are removed from the cell and converted into a concentrate that can then be processed in an autoclave, roaster, or fine grinding circuit to recover the gold through leaching. Gold-bearing solution is then plated onto cathodes in an electrowinning process or precipitated using zinc powder. In both cases, the precipitate is melted with fluxes in a furnace to produce doré.
Concentrate. Ore containing zinc, silver, lead, and gold is delivered to a crushing and grinding plant which feeds a sulfide processing plant. The sulfide processing plant primarily comprises lead and zinc flotation stages. In the lead and zinc flotation, the slurry is conditioned with reagents to activate the desired minerals and produce lead and zinc concentrate. The lead concentrate is highly enriched in gold and silver, with a smaller fraction of the precious metal recovered in the zinc concentrate. The resulting concentrate is sold to smelters or traders for further processing.
Ore containing copper and gold is crushed to a coarse size at the mine and then transported via conveyor to a process plant, where it is further crushed and then finely ground as a slurry. The ore is initially treated by successive stages of flotation resulting in a gold/copper concentrate generally containing within 10% to 26% copper and is dewatered and transported off-site. The flotation tailings have a residual gold content that is recovered in a carbon-in-leach circuit.
8

Table of Contents
A summary of product and form by segment is set forth below.
Segment
Products (1)
Form
Lihir, Papua New GuineaGoldDoré
Cadia, AustraliaGold, CopperDoré, Concentrate
Tanami, AustraliaGoldDoré
Boddington, AustraliaGold, CopperDoré, Concentrate
Ahafo South, GhanaGoldDoré
Ahafo North, GhanaGoldDoré
Merian, SurinameGoldDoré
Cerro Negro, ArgentinaGoldDoré
Yanacocha, PeruGoldDoré
Peñasquito, MexicoGold, Silver, Lead, ZincDoré, Concentrate
Red Chris, CanadaGold, CopperConcentrate
Brucejack, CanadaGoldDoré, Concentrate
NGM, U.S.GoldDoré, Concentrate
Divested (2)
CC&V, U.S.GoldDoré
Musselwhite, CanadaGoldDoré
Porcupine, CanadaGoldDoré
Éléonore, CanadaGoldDoré
Akyem, GhanaGoldDoré
Telfer, AustraliaGold, CopperDoré, Concentrate
____________________________
(1)Products listed are only for gold and co-product metals. See above for further information on co-product classification.
(2)Refer to Note 3 to the Consolidated Financial Statements for further information on divestitures.
Competition
The top 10 producers of gold comprise approximately 25% of total worldwide mined gold production. We currently rank as the top gold producer with approximately 5% of estimated total worldwide mined gold production. Our competitive position is based on the size and grade of our ore bodies anchored in favorable mining jurisdictions and our ability to manage costs compared with other producers. We have a diverse portfolio of mining operations with varying ore grades and cost structures. Our costs are driven by the location, grade and nature of our ore bodies, and the level of input costs, including energy, labor, and equipment. The metals markets are cyclical, and our ability to maintain our competitive position over the long term is based on our ability to acquire and develop quality deposits, hire and retain a skilled workforce, and manage our costs.
Licenses and Concessions
Other than operating licenses for our mining and processing facilities, there are no third-party patents, operating licenses, or franchises material to our business. In many countries, however, we conduct our mining and exploration activities pursuant to land-related licenses which include leases, concessions, claims, or prospecting licenses granted by the host government. These countries include, among others, the United States, Papua New Guinea, Australia, Ghana, Suriname, Argentina, Dominican Republic, Chile, Peru, Ecuador, Mexico, and Canada. Refer to Item 2, Properties, below for further information on land-related licenses and concessions by property. The concessions and contracts are subject to the political risks associated with the host country. Refer to Item 1A, Risk Factors, below for further information.
Condition of Physical Assets and Insurance
Our business is capital intensive and requires ongoing capital investment for the replacement, modernization or expansion of equipment and facilities. Refer to Results of Consolidated Operations and Liquidity and Capital Resources within Part II, Item 7, MD&A, for further information.
We maintain insurance policies against property loss, business interruption, and other risks that are typical in the operation of our business, in amounts that we believe to be reasonable. Such insurance, however, contains exclusions and limitations on coverage, particularly with respect to environmental liability and political risk. There can be no assurance that claims would be paid under such insurance policies in connection with a particular event. Refer to Item 1A, Risk Factors, below for further information.
9

Table of Contents
Environmental, Social and Governance
Overview
Focusing on environmental, social and governance ("ESG") practices are an important part of Newmont’s business. Widely recognized for our principled ESG practices, we have been consistently ranked as a leader in the mining and metal sector of the S&P Global, and we have been listed on the Dow Jones Sustainability World Index since 2007.
ESG is a key part of how we make investment decisions and central to our culture and purpose to create value and improve lives through sustainable and responsible mining. Sustainability and safety are integrated into the business at all levels of the organization through our global policies, standards, strategies, business plans, and remuneration plans. Our global strategies, notably those related to Sustainability and Health, Safety, and Security, direct all levels of our business in environmental stewardship, strong workforce safety and health practices, social responsibility and good governance. With clear targets, open communication and transparent reporting, we strive for continuous improvement to meet the evolving expectations of investors, governments, communities and other key stakeholders, and to contribute to a sustainable future for all.
Stakeholder Engagement
We engage regularly with relevant stakeholders, who we consider to be any person or organization potentially impacted by our activities or influential to our success, which allows us to gain a greater understanding of their needs, interests and perspectives while, at the same time, encouraging shared decision making to promote mutually beneficial outcomes. These engagements also inform what information is most useful for stakeholders for the purposes of our non-financial reporting. Newmont also engages with and commits to meeting the expectations of a variety of organizations at a global, regional, national and local level - and where applicable - adhering to these organizations' high standards of governance, social and environmental policies and performance. These memberships and other external commitments reflect our values, support our approach to working collaboratively on best practices across several key matters and allow external stakeholders to hold us accountable. Our participation in industry initiatives, wherein we often take a leadership role, allows us to inform and influence global standards and practices, as well as gain insight into emerging expectations and issues.
Reporting
We believe that transparency and accountability are key attributes of governance. Since 2003, Newmont has been reporting on how we manage the sustainability issues of relevance to stakeholders around the globe. Our sustainability report provides an annual review of non-financial performance on governance, strategy and management approach, risk management, and performance and targets in key areas that include health, safety and security, workforce, the environment, supply chain, social responsibility, business integrity and compliance, value sharing, and inclusion, diversity, and equity domains. Our sustainability report is compiled in accordance with the Global Reporting Initiative ("GRI") Standards (GRI 1: Foundation 2021; G4 Mining and Metals Sector Disclosure), and the Sustainability Accounting Standards Board Metals & Mining Industry Standard (Version 2023-12). Select data is subject to an external limited assurance review and reflects Newmont’s commitment to transparency and reporting obligations as a founding member of the International Council on Mining and Metals ("ICMM") and as an early adopter of the UN Guiding Principles Reporting Framework. Additionally, our sustainability report aligns with the requirements the ICMM's Mining Principles' Performance Expectations and Position Statements, the GISTM and the World Gold Council's Responsible Gold Mining Principles.
Newmont’s sustainability reporting suite also includes our sustainability-linked bond framework, ESG data tables, conflict-free gold report, modern slavery statement, policy influence disclosures, taxes and royalties contributions report, and other reports and responses, which can be found on our website at www.newmont.com/sustainability.
The information in our sustainability report and on our website is not incorporated by reference in this annual report or otherwise “filed” for purposes of Section 18 of the Securities Exchange Act of 1934, as amended, or otherwise subject to the liabilities of that section.
Environmental Practices
Climate Change. We accept the Intergovernmental Panel on Climate Change’s assessment of climate science, and we acknowledge that human activities contribute to climate change and business has an important role in addressing this global challenge. It is our firm belief that climate change is one of the greatest global challenges of our time. For a discussion of climate-related risks, refer to Item 1A, Risk Factors.
Climate Targets and Initiatives to Achieve. We believe that value-creation industries like mining have a responsibility to drive actions to transition us to a low-carbon economy. In an effort to play our part in addressing climate change, in 2020 we announced science-based, GHG emissions reduction targets of 32% for Scope 1 and Scope 2 and 30% for Scope 3 by 2030 ("2030 climate targets"), with an ultimate ambition of being carbon neutral by 2050. Newmont's emission calculation methodology framework dictates that any change of 5% resulting from divestitures or acquisitions requires recalculation of baseline data. The acquisition of Newcrest in November 2023 as well as the divestitures in 2024 through 2025 triggered Newmont to recalculate the target baseline years and trailing years of GHG emissions data. We are continuing to review our targets and roadmap which may result in amendments
10

Table of Contents
in the future. Investors are reminded that climate-related targets are subject to aspirational management goals and forward-looking statements, which remain subject to risks and uncertainties. For example, our ability to achieve our Scope 3 emissions targets is subject to the actions of entities not within our control, though we continue to work with our partners on these matters. While we review our performance annually and seek opportunities to advance, meeting this target should not be projected or relied upon. Refer to Forward-Looking Statements, below, and Item 1A, Risk Factors of this report under the heading "Our operations and projects are subject to a range of risks related to transitioning the business to meet regulatory, societal and investor expectations for operating in a low-carbon economy."
Our most significant opportunities to reduce emissions exist in building or deploying cleaner energy solutions at our mine sites, as well as the greening of the electrical grid that supplies energy to our operations. Since announcing our 2030 climate targets, we have taken steps to invest in climate change initiatives in support of our goal. We also see sustainable finance as a way to further demonstrate Newmont's focus on climate change. In December 2021, Newmont became the first in the mining industry to issue a sustainability-linked bond, with the registered public offering of $1 billion aggregate principal amount of 2.6% Sustainability-Linked Senior Notes due 2032 (the "Notes"), with the coupon linked to Newmont’s performance against key ESG goals regarding 2030 climate targets. In connection with the issuance of the Notes, Newmont published a Sustainability-Linked Bond Framework and obtained a second party opinion on the framework from the Institutional Shareholder Services group of companies ESG. The Notes align Newmont’s business and financing by creating a direct link between its sustainability performance and funding strategies.
In addition to our focus on reducing carbon emissions, we believe that access to clean, safe water is a human right, and reliable water supplies are vital for hygiene, sanitation, livelihoods and the health of the environment. Because water is also critical to our business, we recognize the need to use water efficiently, protect water resources, and collaborate with the stakeholders within the watersheds where we operate to effectively manage this shared resource. We operate in water-stressed areas with limited supply, and increased pressure on water supplies may occur due to increasing populations in and around communities in proximity to our operations.
Biodiversity. Our operations span multiple continents in a range of ecosystems that include tropical, desert and arctic climates. We understand the impact our activities can have on the environment and are committed to protect and prevent – or otherwise minimize, mitigate and remediate – those impacts in the areas where we operate through responsible management during all aspects of the mine lifecycle and collaboration with stakeholders to develop integrated approaches to land use.
Our Environmental Impact. We conduct our operations so as to protect public health and the environment and believe our operations are in compliance with applicable laws and regulations in all material respects. Our mining and exploration activities are subject to various laws and regulations in multiple jurisdictions governing the protection of the environment. These laws and regulations are continually changing.
Our Environmental Reclamation and Remediation Commitments. Each operating mine has a reclamation plan in place that meets, in all material respects, applicable legal and regulatory requirements. We are also involved in several matters concerning environmental obligations associated with former, primarily historical, mining activities. Generally, these matters concern developing and implementing remediation plans at the various sites. The reclamation and remediation stage is a multifaceted process with complex risks. Successfully closing and reclaiming mines is crucial for gaining stakeholder trust and maintaining social acceptance. Notably, Newmont is committed to the implementation of the GISTM and disclosure of implementation status for tailings facilities. Disclosures can be found on our website. Conformance with the GISTM remains ongoing and has and may continue to result in further increases to our sustaining costs and estimated closure costs. Additionally, laws, regulations and permit requirements focused on water management and discharge requirements for operations and water treatment are becoming increasingly stringent. Compliance with water management and discharge quality remains dynamic and has and may continue to result in further increases to our estimated closure costs. For a discussion of the most significant reclamation and remediation activities, refer to Note 6 and Note 24 to the Consolidated Financial Statements. For discussion of regulatory, tailings storage facilities, water, climate and other environmental risks, refer to Item 1A, Risk Factors, for additional information.
Social Practices
Our People. At Newmont, one of the strategic pillars is people.
The success of our business comes from the accomplishments and well-being of our employees and contractors. That is why we strive to build a workplace culture that fosters leaders where everyone belongs, thrives, and is valued.
At December 31, 2025, approximately 17,500 people were employed by Newmont and Newmont subsidiaries, and approximately 26,600 people were working as contractors in support of Newmont’s operations and attainment of our objectives. Additionally, at December 31, 2025, approximately 27% of our workforce were members of a union or participated in collective bargaining. We are committed to fostering solid relationships with all members of our workforce based on trust, treating workers fairly and providing them with safe and healthy working conditions. For a discussion of related risks, refer to Item 1A, Risk Factors.
Our people strategy represents a multi-year journey, and its three pillars and respective aspirations include: (i) leadership – grow and attract exceptional leaders for our Company, the industry and beyond; (ii) inclusion, diversity and equity - through bold actions cultivate an inclusive, diverse and engaged workforce; and (iii) people experiences - foster a meaningful work experience that
11

Table of Contents
enables our culture and strategy to flourish. The Board of Directors’ Leadership Development and Compensation Committee holds reviews with management every quarter and on an ad hoc basis as needed to ensure appropriate management of human capital and progress against our stated goals.
The people who work on our behalf give us a competitive advantage. Through our global people strategy, we align our talent management efforts with the overall business strategy. The strategy’s focus areas include enhancing the employee experience and evolving for future workforce needs; building our bench strength and leadership capabilities; developing effective labor relations that align stakeholders with a shared future; and improving inclusion.
Inclusion, Diversity, and Equity. Inclusion is one of our five core values. We support this through a focus on our culture and four key areas of inclusion: (i) start with respect; (ii) listen to and engage employees; (iii) leverage dissonance, consistency, and persistence toward a future state culture; and (iv) focus on the career progress of underrepresented team members. Newmont is an equal employment opportunity employer and Newmont's policy is to not make employment-related decisions based on gender or any other protected basis.
In our annual sustainability report, Newmont voluntarily reports workforce and labor information in accordance with GRI Standards, including data on workforce demographics, compensation and equal remuneration, gender diversity, union representation, labor relations, employee turnover, hiring representation, and training and development. Newmont also reports employment data in U.S. Equal Employment Opportunity Commission EEO-1 reports which can be found on our website. The information in our sustainability report and on our website is not incorporated by reference in this annual report.
ESG Performance-based Compensation. The importance of ESG performance is emphasized with our workforce through our training and development programs and our compensation design. Employees eligible for our short-term incentive plan are held accountable for the Company’s health, safety, and sustainability performance through Newmont’s performance-based compensation structure. ESG will comprise 30% of the Company’s short-term incentive plan payout for 2025, with 20% allocated to health & safety metrics and 10% to sustainability performance based social and environment metrics.
Additional information regarding the Company’s compensation programs and performance will be provided in the 2026 Proxy Statement.
Health and Safety. Safeguarding the health and safety of our employees and contractors is fundamental to how we operate. Mining activities pose risks and hazards that must be effectively managed and controlled to minimize their impact. Safety is one of Newmont's core values, and our global Health, Safety, and Security strategy aims to advance our journey toward a workplace free from fatalities, injuries and illnesses. We believe that our operations are in compliance with applicable laws and regulations in all material respects. We continue to sustain robust controls at our operations and offices around the globe. We measure the effectiveness of our approach to managing the wide range of health and safety risks by setting measurable objectives and targets. The quality and effectiveness of our health and safety controls are audited regularly as part of our assurance and governance process.
Commitments to Communities. Gaining and maintaining the trust of stakeholders impacted by a business is an ongoing endeavor. At Newmont, we use a collaborative approach to relationships with stakeholders and earning social acceptance. Through understanding and managing our activities' impacts on communities and involving local stakeholders in decision making, we aim to build enduring relationships based on respect and mutually beneficial and sustainable development outcomes. We monitor various metrics and performance objectives to assess the effectiveness of our social acceptance approach, and to better understand both the positive and negative impacts that our activities have on host communities. We seek to include impacted communities and groups in determining mitigation or optimization of these impacts in a manner that is culturally appropriate and with the consent of those impacted. We also recognize our responsibility to respect and promote human rights.
Governance Practices
Board of Directors Oversight. Newmont believes that strong corporate governance, with management accountability and active oversight from an experienced Board of Directors, is essential for mitigating risk, serving in the best interests of all stakeholders and creating long-term value. The highest level of oversight at Newmont resides with Newmont’s Board of Directors (the “Board"). The Board of Directors plays a critical role, overseeing the Company’s business strategy and the overall goal of delivering long-term value creation for stockholders and other stakeholders. The members of the Board of Directors bring a broad range of backgrounds, experiences and talents, along with ethnic and gender diversity, to our governance process. As of December 31, 2025, the Board of Directors was comprised of 12 directors (11 independent non-executive directors and one executive director) with more than 55% of the independent directors with a form of ethnic or gender diversity to the Board of Directors, with 36% female representation among independent directors. With the retirement of Tom Palmer, and the appointment of Natascha Viljoen to the Board on January 1, 2026, to her new role as President and Chief Executive Officer, overall female representation on the Board increased to 42%.
Four core Board committees, Audit, Corporate Governance and Nominating, Leadership Development and Compensation, and Safety and Sustainability, provide oversight and guidance in these key areas. Each committee assists the Board of Directors in carrying out responsibilities such as assessing major risks, ensuring high standards of ethical business conduct, succession planning and talent management, and approving and providing oversight of the sustainability strategy, which includes commitments to the adoption of best practices in promotion of a healthy and safe work environment, and environmentally sound and socially responsible mining and
12

Table of Contents
resource development. All members of these four core Committees are independent, as defined in the listing standards of the New York Stock Exchange and Newmont’s Corporate Governance Guidelines. More information on Newmont’s Board, governance practices and risk oversight can be found in our annual Proxy Statement.
Code of Conduct. Our global Code of Conduct (the “Code”), which was adopted and approved by Newmont’s Board, forms the foundation for our integrity expectations, and six overarching policies, along with our standards on Anti-Corruption, Conflicts of Interest, Gifts and Entertainment and U.S. Export Compliance, state the minimum requirements for conducting business honestly, ethically and in the best interests of Newmont. Our Code reflects our belief that as important as what we do is how we do it. It requires all representatives of Newmont to demonstrate our values – safety, integrity, sustainability, inclusion and responsibility – in every aspect of our professional lives and ultimately, to live up to our purpose, which is to create value and improve lives through sustainable and responsible mining.
Governance Materials. Our Corporate Governance Guidelines, Proxy Statement, policies, and the charters for the Committees of the Board of Directors are available on our website, www.newmont.com, and are available free of charge upon request to Investor Relations at our principal executive office. We also file with the New York Stock Exchange an annual certification that our Chief Executive Officer is unaware of any violation of the NYSE’s corporate governance standards. We make available free of charge through our website this annual report on Form 10-K, quarterly reports on Form 10-Q, current reports on Form 8-K and amendments to those reports filed or furnished pursuant to Section 13(a) or 15(d) of the Exchange Act, as soon as reasonably practicable after such material is electronically filed with or furnished to the SEC. The information on our website is not incorporated by reference in this report.
Risk Factor Summary
We are subject to a variety of risks and uncertainties, including risks related to our operations and business, financial risks, risks related to our industry, environmental and climate risks, risks related to the jurisdictions in which we operate, risks related to our workforce, legal risks and risks related to our common stock, which could have a material adverse effect on our business, financial condition, results of operations and cash flows. Risks that we deem material are described in Item 1A, Risk Factors of this report. These risks include, but are not limited to, the following:
•A substantial or extended decline in gold, copper, silver, lead or zinc prices would have a material adverse effect on us.
•We may be unable to replace gold, copper, silver, lead or zinc reserves as they become depleted.
•Estimates of proven and probable reserves and measured, indicated and inferred resources are uncertain and the volume and grade of ore actually recovered may vary from our estimates.
•Estimates relating to projects and mine plans of existing operations are uncertain and we may incur higher costs and lower economic returns than estimated.
•Increased operating and capital costs could affect our profitability.
•Mine closure, reclamation and remediation costs for environmental liabilities may exceed the provisions we have made.
•Damage to our reputation may result in decreased investor confidence, challenges in maintaining positive community relations and can pose additional obstacles to our ability to develop our projects, which may result in a material adverse impact on our business, financial position, results of operations and growth prospects.
•We are dependent upon information technology and operational technology systems, which are subject to disruption, damage, failure or cybersecurity attacks and risks associated with implementation, upgrade, operation and integration.
•To the extent we hold or acquire interests in any joint ventures or enter into any joint ventures, our interests in these properties is subject to risks normally associated with the conduct of joint ventures.
•Our operations and business have in the past been affected by the COVID-19 pandemic, and may be materially and adversely impacted in the future by pandemics, epidemics and other health emergencies.
•Increased exposure to foreign exchange fluctuations and capital controls may adversely affect Newmont’s costs, earnings and the value of some of our assets.
•Future funding requirements may affect our business, our ability to pursue new business opportunities, invest in existing and new projects, pay cash dividends or engage in share repurchase transactions.
•Our long-lived assets and goodwill could become impaired, which could have a material non-cash adverse effect on our results of operations.
•Our ability to recognize the benefits of deferred tax assets is dependent on future cash flows and taxable income.
•Any downgrade in the credit ratings assigned to our debt securities could increase our future borrowing costs and adversely affect the availability of new financing.
•Returns for investments in pension plans are uncertain.
13

Table of Contents
•We may experience increased costs or losses resulting from the hazards and uncertainties associated with mining.
•Mining operations involve a high degree of risk, including hazards related to the use of explosives and hazardous chemicals and critical equipment failure.
•We rely on our supply chain operations to procure goods and services to support our operations and projects, and competition with other natural resource companies, and shortage of critical parts, services and equipment may adversely affect our operations and development projects.
•We may be unable to obtain or retain necessary permits and land or mining tenure which could adversely affect our operations and projects.
•Mining companies are increasingly required to consider and provide benefits to the communities and countries in which they operate in order to maintain operations.
•Illegal mining and artisanal mining occurs on or adjacent to certain of our properties exposing such sites to security risks.
•Civil disturbances and criminal activities can disrupt business and expose the Company to liability.
•Our operations and projects face substantial regulation of health and safety.
•Our operations and projects are subject to extensive environmental laws and regulations.
•Our operations and projects are subject to a range of risks related to transitioning the business to meet regulatory, societal and investor expectations for operating in a low-carbon economy.
•Our operations and projects are subject to a range of transitional and physical risks related to climate change.
•Our Company and the mining industry are facing continued geotechnical, geothermal and hydrogeological challenges, which could adversely impact our production and profitability.
•Our operations and projects may be adversely affected by rising energy prices or energy shortages.
•Our operations and projects are dependent on the availability of sufficient water supplies and subject to water-related risks.
•Our operations and projects are subject to risks related to our relationships and/or agreements with local communities, including Indigenous Peoples, and laws for the protection of cultural heritage.
•Our operations and projects are subject to risks of doing business in multiple jurisdictions.
•New or changing legislation and tax risks in certain operating jurisdictions could negatively affect us.
•Changes in mining or investment policies or shifts in political and social attitudes in the jurisdictions in which we operate may adversely affect our operations or profitability.
•Our operations at Yanacocha and projects in Peru are subject to political and social unrest risks.
•Our Merian operation in Suriname is subject to political, security and economic risks.
•Our operations at Ahafo South and Ahafo North in Ghana are subject to political, economic, security and other risks.
•Our operations in Argentina are susceptible to risk as a result of economic and political instability in Argentina, regulatory risk and labor unrest.
•Our operations at Lihir and project at Wafi-Golpu in PNG are subject to political and regulatory risks and other uncertainties.
•Our operations and projects in Canada are subject to legal and regulatory risks and other uncertainties in connection with claims and challenges by Indigenous groups.
•Our business depends on good relations with our employees.
•Our Peñasquito operation in Mexico is subject to social, political, regulatory, and economic risks.
•We may not be able to operate successfully if we are unable to recruit, hire, retain and develop key personnel and a qualified and diverse workforce. In addition, we are dependent upon our employees being able to perform their jobs in a safe and respectful work environment.
•We rely on contractors to conduct a significant portion of our operations and construction projects.
•Our business is subject to the U.S. Foreign Corrupt Practices Act, and other related anti-bribery laws and regulations. A breach or violation of these rules and regulations could lead to substantial sanctions and civil and criminal prosecution, as well as fines and penalties, litigation, loss of licenses or permits and other collateral consequences and reputational harm.
•Newmont’s global operations create exposure to U.S. and international trade, sanctions, and export control risks. As a U.S.-headquartered company, Newmont must comply with U.S. trade laws worldwide, as well as applicable local regulations. These risks stem from cross-border movement of mineral, equipment, technology, services, capital, and data, often involving third
14

Table of Contents
parties. Trade compliance failures may result in legal exposure, financial penalties, operational disruption, reputational damage, and restricted access financial systems or markets.
•Unanticipated litigation or negative developments in pending litigation or with respect to other contingencies may adversely affect our financial condition and results of operations.
•Title to some of our properties may be insufficient, defective, or challenged.
•The price of our common stock may be volatile, which may make it difficult for you to sell the common stock at the price you paid or at prices you find attractive.
•Holders of our common stock, CDIs and PDIs may not receive dividends.
•Compliance with exchange listing rules as a foreign exempt listing may differ from investor expectations.
•We may not receive any or all deferred or contingent consideration for divested assets.
•We are subject to ongoing indemnification and other retained liabilities from certain recent and historical transactions.
Additional risks and uncertainties not presently known to us or that we currently deem immaterial also may impair our business, financial condition, results of operations and cash flows.
Forward-Looking Statements
Certain statements contained in this report (including information incorporated by reference herein) are “forward-looking statements” within the meaning of Section 27A of the Securities Act of 1933, as amended (the “Securities Act”), and Section 21E of the Securities Exchange Act of 1934, as amended (the “Exchange Act”), and are intended to be covered by the safe harbor provided for under these sections. Words such as “expect(s),” “feel(s),” “believe(s),” “will,” “may,” “anticipate(s),” “estimate(s),” “should,” “intend(s),” "target(s)," "plan(s)," "potential," and similar expressions are intended to identify forward-looking statements. Our forward-looking statements may include, without limitation:
•estimates regarding future earnings and the sensitivity of earnings to gold, copper, silver, lead, zinc and other metal prices;
•estimates of future mineral production and sales;
•estimates of future production costs, other expenses and taxes for specific operations and on a consolidated basis, including estimates of future costs applicable to sales and all-in sustaining costs;
•estimates of future cash flows and the sensitivity of cash flows to gold, copper, silver, lead, zinc and other metal prices;
•estimates of future capital expenditures, including development and sustaining capital, as well as construction or closure activities and other cash needs, for specific operations and on a consolidated basis, and expectations as to the funding or timing thereof;
•estimates as to the projected development of certain ore deposits or projects, such as the Tanami Expansion 2, Cerro Negro District Expansion 1, Cadia Panel Caves, Red Chris Block Cave and Wafi-Golpu, including without limitation expectations for the production, milling, costs applicable to sales, all-in sustaining costs, mine-life extension, the costs of such development and other capital costs, financing plans for these deposits and expected production commencement dates, construction completion dates and other timelines;
•estimates of reserves and resources statements regarding future exploration results and reserve and resource replacement and the sensitivity of reserves to metal price changes;
•statements regarding the availability of, and terms and costs related to, future borrowing or financing and expectations regarding future share repurchase transactions, debt repayments or debt tender transactions;
•statements regarding future cash flows and returns to stockholders, including with respect to future dividends and expected payout levels;
•estimates regarding future exploration expenditures and discoveries;
•statements regarding fluctuations in financial and currency markets;
•estimates regarding potential cost savings, productivity, operating performance and ownership and cost structures;
•expectations regarding statements on future or recently completed transactions and expectations regarding potential future transactions;
•estimates of future cost reductions, synergies, including pre-tax synergies, savings and efficiencies, and future cash flow enhancements through portfolio optimization, restructurings and cost savings initiatives;
•expectations of future equity and enterprise value;
15

Table of Contents
•expectations regarding the start-up time, design, mine life, production and costs applicable to sales and exploration potential of our projects;
•statements regarding future hedge and derivative positions or modifications thereto;
•statements regarding local, community, political, economic or governmental conditions and environments;
•statements and expectations regarding the impacts of health and safety conditions;
•statements regarding the impacts of changes in the legal and regulatory environment in which we operate, including, without limitation, relating to regional, national, domestic and foreign laws;
•statements regarding climate strategy and expectations regarding greenhouse gas emission targets (including Scope 1, Scope 2 and Scope 3 targets) and other climate-related goals, aspirations and ambitions, and related operating costs and capital expenditures;
•statements regarding expected changes in the tax regimes in which we operate, including, without limitation, estimates of future tax rates and estimates of the impacts to income tax expense, valuation of deferred tax assets and liabilities, and other financial impacts;
•estimates of income taxes and expectations relating to tax contingencies or tax audits;
•estimates of future costs, accruals for reclamation costs and other liabilities for certain environmental matters, including without limitation, in connection with water treatment, such as the Yanacocha water treatment plants, and tailings management;
•statements relating to potential impairments, revisions or write-offs, including without limitation, the result of fluctuation in metal prices, unexpected production or capital costs, or unrealized reserve potential;
•estimates of pension and other post-retirement costs;
•statements regarding estimates of timing of adoption of recent accounting pronouncements and expectations regarding future impacts to the financial statements resulting from accounting pronouncements; and
•estimates of future cost reductions, savings and efficiencies in connection with programs and cost saving initiatives.
Where we express an expectation or belief as to future events or results, such expectation or belief is expressed in good faith and believed to have a reasonable basis. However, our forward-looking statements are subject to risks, uncertainties and other factors, which could cause actual results to differ materially from future results expressed, projected or implied by those forward-looking statements. Such risks include, but are not limited to:
•there being no significant change to current geotechnical, metallurgical, hydrogeological and other physical conditions;
•the price of gold, copper, silver, lead, zinc and other metal prices and commodities;
•the cost of operations and prices for key supplies;
•currency fluctuations, including exchange rate assumptions;
•other macroeconomic events impacting inflation, interest rates, supply chain, and capital markets;
•operating performance of equipment, processes and facilities;
•environmental impacts and geotechnical challenges including in connection with climate-related and other catastrophic events;
•labor relations;
•healthy and safety impacts including in connection with global events, pandemics, and epidemics;
•timing of receipt of necessary governmental and regulatory permits or approvals;
•domestic and foreign laws or regulations, particularly relating to the environment, mining and processing;
•changes in tax laws;
•political developments in any jurisdiction in which Newmont operates being consistent with its current expectations;
•our ability to obtain or maintain necessary financing; and
•other risks and hazards associated with mining operations.
More detailed information regarding these factors is included in Item 1A, Risk Factors and elsewhere throughout this report. Many of these factors are beyond our ability to control or predict. Given these uncertainties, readers are cautioned not to place undue reliance on our forward-looking statements.
16

Table of Contents
All subsequent written and oral forward-looking statements attributable to Newmont or to persons acting on its behalf are expressly qualified in their entirety by these cautionary statements. We disclaim any intention or obligation to update publicly any forward-looking statements, whether as a result of new information, future events or otherwise, except as may be required under applicable securities laws.
Available Information
Newmont maintains a website at www.newmont.com and makes available, through the Investor Relations section of the website, its Annual Reports on Form 10-K, Quarterly Reports on Form 10-Q, Current Reports on Form 8-K, Section 16 filings and all amendments to those reports, as soon as reasonably practicable after such material is electronically filed with the SEC. Certain other information, including Newmont’s Corporate Governance Guidelines, the charters of key committees of its Board of Directors and its Code of Conduct are also available on the website.
ITEM 1A.       RISK FACTORS (dollars in millions, except per share, per ounce and per pound amounts)
Our business activities are subject to significant risks, including those described below. You should carefully consider these risks. If any of the described risks actually occurs, our business, financial position and results of operations could be materially adversely affected. Such risks are not the only ones we face and additional risks and uncertainties not presently known to us or that we currently deem immaterial may also affect our business. This report contains forward-looking statements that involve risks and uncertainties. Our actual results could differ materially from those anticipated in the forward-looking statements as a result of a number of factors, including the risks described below. Refer to “Forward-Looking Statements.”
Risks Related to Our Operations and Business
A substantial or extended decline in gold, copper, silver, lead or zinc prices would have a material adverse effect on us.
Our business is dependent on the prices of gold, copper, silver, lead and zinc, which fluctuate on a daily basis and are affected by numerous factors beyond our control. Factors tending to influence prices include:
•Gold sales, purchases or leasing by governments and central banks;
•Speculative short positions taken by significant investors or traders in gold, copper, silver, lead, zinc or other metals;
•The relative strength of the U.S. dollar;
•The monetary policies employed by the world’s major Central Banks;
•The fiscal policies employed by the world’s major industrialized economies;
•Expectations of the future rate of inflation;
•Interest rates;
•Recession or reduced economic activity in the United States, Australia, China, India and other industrialized or developing countries;
•Decreased industrial, jewelry, base metal or investment demand;
•Increased import and export taxes;
•Increased supply from production, disinvestment and scrap;
•Forward sales by producers in hedging or similar transactions;
•Availability of cheaper substitute materials; and
•Changing investor or consumer sentiment, including in connection with transition to a low-carbon economy, investor interest in crypto currencies and other investment alternatives and other factors.
Average gold prices for 2025 were $3,432 per ounce (2024: $2,386; 2023: $1,941), average copper prices for 2025 were $4.51 per pound (2024: $4.15; 2023: $3.85), average silver prices for 2025 were $40.03 per ounce (2024: $28.27; 2023: $23.35), average lead prices for 2025 were $0.89 per pound (2024: $0.94; 2023: $0.97), and average zinc prices for 2025 were $1.30 per pound (2024: $1.26; 2023: $1.20). Prices are obtained from the London Bullion Market Association for gold and silver and the London Metal Exchange for copper, lead and zinc. Any decline in our realized prices adversely impacts our revenues, net income and operating cash flows, particularly in light of our strategy of not engaging in hedging transactions with respect to sales of gold, copper, silver, lead or zinc. Historically, the commodity markets have been very volatile, and there can be no assurance that commodity prices will not be subject to wide fluctuations in the future. A substantial or extended decline in commodity prices could have a material adverse effect on the Company’s financial position, results of operations, cash flows, access to capital, and on the quantities of reserves that the Company can economically produce. Refer to Note 2 to the Consolidated Financial Statements for further information.
In addition, sustained lower gold, silver, copper, zinc or lead prices can:
17

Table of Contents
•Reduce revenues further through production declines due to cessation of the mining of deposits, or portions of deposits, that become uneconomic at sustained lower metal prices;
•Reduce or eliminate the profit that we currently expect from ore stockpiles and ore on leach pads and increase the likelihood and amount that the Company might be required to record write downs related to the carrying value of its stockpiles and ore on leach pads;
•Halt or delay the development of new projects;
•Reduce funds available for exploration and advanced projects with the result that depleted reserves may not be replaced; and
•Reduce existing reserves by removing ores from reserves that can no longer be economically processed at prevailing prices.
We may be unable to replace gold, copper, silver, lead or zinc reserves as they become depleted.
Mining companies must continually replace reserves depleted by production to maintain production levels over the long term and provide a return on invested capital. Depleted reserves can be replaced in several ways, including expanding known ore bodies, by locating new deposits or acquiring interests in reserves from third parties. Exploration is highly speculative in nature, involves many risks and uncertainties and is frequently unsuccessful in discovering significant mineralization. Accordingly, our current or future exploration programs may not result in new mineral producing operations. Even if significant mineralization is discovered, it will likely take many years from the initial phases of exploration until commencement of production, during which time the economic feasibility of production may change.
We may consider, from time to time, the acquisition of ore reserves from others related to development properties and operating mines. Such acquisitions are typically based on an analysis of a variety of factors including historical operating results, estimates of and assumptions regarding the extent of ore reserves, the timing of production from such reserves and cash and other operating costs. Other factors that affect our decision to make any such acquisitions may also include our assumptions for future gold, copper, silver, lead or zinc prices or other mineral prices and the projected economic returns and evaluations of existing or potential liabilities associated with the property and its operations and projections of how these may change in the future. In addition, in connection with any acquisitions we may rely on data and reports prepared by third parties (including ability to permit and compliance with existing regulations) and which may contain information or data that we are unable to independently verify or confirm. Other than historical operating results, all these factors are uncertain and may have an impact on our revenue, our cash flow and other operating issues, as well as contributing to the uncertainties related to the process used to estimate reserves and resources. In addition, there may be intense competition for the acquisition of attractive mining properties.
As a result of these uncertainties, our exploration programs and any acquisitions which we may pursue may not result in the expansion or replacement of our current production with new ore reserves or operations, which could have a material adverse effect on our business, prospects, results of operations and financial position.
Estimates of proven and probable reserves and measured, indicated and inferred resources are uncertain and the volume and grade of ore actually recovered may vary from our estimates.
The mineral reserves stated in this report represent the amount of gold, copper, silver, lead, zinc and molybdenum that we estimated, at December 31, 2025, could be economically and legally extracted or produced at the time of the reserve determination. Estimates of proven and probable reserves are subject to considerable uncertainty. Such estimates are, or will be, to a large extent, based on the prices of gold, copper, silver, lead, zinc, and molybdenum and interpretations of geologic data obtained from drill holes and other exploration techniques, which data may not necessarily be indicative of future results. If our reserve estimations are required to be revised due to significantly lower gold, copper, silver, lead, zinc, and molybdenum prices, increases in operating costs, reductions in metallurgical recovery or other modifying factors, this could result in material write-downs of our investment in mining properties, goodwill and increased amortization, reclamation and closure charges.
Producers use pre-feasibility or feasibility studies for undeveloped ore bodies to derive estimates of capital and operating costs based upon anticipated tonnage and grades of ore to be mined and processed, the predicted configuration of the ore body, expected recovery rates of metals from the ore, the costs of comparable facilities, the costs of operating and processing equipment and other factors. Actual operating and capital cost and economic returns on projects may differ significantly from original estimates. Further, it may take many years from the initial phases of exploration until commencement of production, during which time, the economic feasibility of production may change.
Additionally, resources do not indicate proven and probable reserves as defined by the SEC or the Company’s standards. Estimates of measured, indicated and inferred resources are subject to further exploration and development, and are, therefore, subject to considerable uncertainty. Inferred resources, in particular, have a great amount of uncertainty as to their existence and their economic and legal feasibility. The Company cannot be certain that any part or parts of the resource will ever be converted into mineral reserves.
In addition, if the price of gold, copper, silver, lead, zinc, or molybdenum declines from recent levels, if production costs increase, grades decline, recovery rates decrease or if applicable laws and regulations are adversely changed, the indicated level of
18

Table of Contents
recovery may not be realized or mineral reserves or resources might not be mined or processed profitably. Similarly, mineral reserves may be impacted if assumptions relating to mine planning change or are not achieved, for example if planned improvements from our business improvement programs are not realized. If we determine that certain of our mineral reserves have become uneconomic, this may ultimately lead to a reduction in our aggregate reported mineral reserves and resources. Consequently, if our actual mineral reserves and resources are less than current estimates, our business, prospects, results of operations and financial position may be materially impaired.
Estimates relating to projects and mine plans of existing operations are uncertain and we may incur higher costs and lower economic returns than estimated.
Mine development and expansion projects typically require a number of years and significant expenditures during the development phase before production is possible. Such projects could experience unexpected problems and delays during permitting, development, construction and mine start-up. Our decision to develop a project is typically based on the results of studies, which estimate the anticipated economic returns of a project. The actual project profitability or economic feasibility may differ from such estimates as a result of any of the following factors, among others:
•Changes in tonnage, grades and metallurgical characteristics of ore to be mined and processed;
•Changes in input commodity and labor costs, including as a result of inflation or tariffs;
•The quality of the data on which engineering assumptions were made;
•Increases in development capital and investment costs;
•Adverse geotechnical, geothermal and hydrogeological conditions;
•Availability of adequate and skilled labor force;
•Availability, supply and cost including: critical assets, water, reagents, and power;
•Costs related to environmental management and sales including waste management, monitoring and transport and storage of product sales;
•Fluctuations in inflation and currency exchange rates;
•Availability, cost and terms of financing;
•Ability to achieve anticipated benefits, synergies, savings and other efficiencies in connection with acquisitions, business improvement programs and initiatives, and through portfolio optimization and divestitures;
•Delays or inability to obtain environmental or other government permits or approvals or changes in the laws and regulations related to our operations or project development;
•Changes in tax laws, customs law and tariffs, the laws and/or regulations around royalties and other taxes due to the regional and national governments and royalty agreements;
•Government instability, including in jurisdictions that do not have a long-standing or significant mining industry, such that there may be limited clarity on agreements with such governments, or decreased governmental support for development of mining projects;
•Weather or severe climate impacts, including, without limitation, prolonged or unexpected precipitation, drought and/or sub-zero temperatures;
•Potential delays and restrictions in connection with health and safety issues, including pandemics (such as COVID-19 and related variants) and other infectious diseases, such as malaria or the zika virus;
•Potential delays relating to social and community issues, including, without limitation, issues resulting in protests, road blockages or work stoppages; and
•Potential challenges to mining activities or to permits or other approvals or delays in development and construction of projects based on claims of disturbance of cultural resources or the inability to secure consent generally from Indigenous groups.
New projects require, among other things, the successful completion of feasibility studies, attention to various fiscal, tax and royalty matters, obtainment of, and compliance with, required governmental and regulatory permits and arrangements for necessary surface and other land rights. We may also have to identify adequate sources of water and power for new projects, ensure that appropriate community infrastructure (for example, reliable rail, ports, roads, and bridges) is developed to support the project and secure appropriate financing to fund a new project. These infrastructures and services are often provided by third parties whose operational activities are outside of our control. Establishing infrastructure for our development projects requires significant resources, identification of adequate sources of raw materials and supplies, and the cooperation of national and regional governments, none of which can be assured. In addition, new projects have no operating history upon which to base estimates of future financial and operating performance, including future cash flow. Thus, it is possible that actual costs may increase and economic returns may differ materially from our estimates. Consequently, our future development activities may not result in the expansion or replacement of
19

Table of Contents
current production with new production, or one or more of these new production sites or facilities may be less profitable than currently anticipated or may not be profitable at all, any of which could have a material adverse effect on our results of operations and financial position.
For our existing operations, we base our mine plans on geological and metallurgical assumptions, financial projections and commodity price estimates. These estimates are periodically updated to reflect changes in our operations, including modifications to our proven and probable reserves, revisions to environmental obligations, changes in legislation and/or our political or economic environment, and other significant events associated with or impacting mining operations. Further, future positive revisions, if any, remain subject to improvements in costs, recovery, commodity price or a combination of these and other factors. Additionally, we review our operations for events and circumstances that could indicate that the carrying value of our long-lived assets may not be recoverable. If indicators of impairment are determined to exist at our mine operations, and an impairment charge is incurred, such charges are not reversible at a later date even when favorable modifications to our proven and probable reserves and measured, indicated and inferred resources, favorable revisions to environmental obligations, favorable changes in legislation and/or our political or economic environment, and other favorable events occur. As a result of these uncertainties, actual results may be less favorable than estimated returns and initial financial outlook.
Increased operating and capital costs could affect our profitability.
Costs at any particular mining location are subject to variation due to a number of factors, such as variable ore grade, changing metallurgy and revisions to mine plans in response to the physical shape and location of the ore body, as well as the age and utilization rates for the mining and processing related facilities and equipment. In addition, costs are affected by the price and availability of input commodities, such as fuel, electricity, labor, chemical reagents, explosives, steel, concrete and mining and processing related equipment and facilities. Commodity costs are, at times, subject to volatile price movements, including increases that could make production at certain operations less profitable. Further, changes in laws and regulations can affect commodity prices, uses, and transport. Reported costs may also be affected by changes in accounting standards. A material increase in costs at any significant location could have a significant effect on our profitability and operating cash flow.
Our operational costs, including, without limitation, labor costs, can be impacted by inflation. Certain of our operations are located in countries that have in the past experienced high rates of inflation, such as in Argentina, Suriname, and Ghana. It is possible that in the future, high inflation in the countries in which we operate may result in an increase in operational costs in local currencies (without a concurrent devaluation of the local currency of operations against the dollar or an increase in the dollar price of gold, copper, silver, lead or zinc). A material increase in costs at any significant location could have a significant effect on our profitability and operating cash flow.
We could have significant increases in capital and operating costs over the next several years in connection with new projects, costs related to closure reclamation activities, and in the sustaining and/or expansion of existing mining and processing operations. Costs associated with capital expenditures may increase in the future as a result of factors beyond our control. Increased capital expenditures may have an adverse effect on the profitability of and cash flow generated from existing operations, as well as the economic returns anticipated from new projects. Significantly higher and sustained increases in operational costs or capital expenditures could result in the deferral or closure of projects and mines in the event that costs become prohibitive.
At the beginning of the third quarter of 2025, management committed to a strategic plan designed to reduce operating costs and continue to advance the Company’s ongoing commitment to profitability, which included streamlining its organizational structure and a reduction of the Company’s workforce and office space in certain markets. Such initiatives involve expenses primarily relating to employee severance, consulting costs, and other restructuring charges. Cost saving estimates are based on a number of assumptions, including compliance with local legal requirements across jurisdictions. Actual costs, timing, and benefits may differ from current estimates as the Company continues to assess the full scope of the impact arising from, or related to, the workforce reduction and operating model changes. There can be no assurance that the expected cost reductions or operational efficiencies will be realized within the anticipated timeframe, or at all.
Mine closure, reclamation and remediation costs for environmental liabilities may exceed the provisions we have made.
Natural resource extractive companies are required to close their operations and rehabilitate the lands that they mine in accordance with a variety of environmental laws and regulations. Estimates of the total ultimate closure and rehabilitation costs for gold, silver, copper, zinc and lead mining operations are significant and based principally on current legal, community and regulatory requirements and mine closure plans that may change materially.
Additionally, we may be held responsible for the costs of addressing contamination at the site of current or former activities or at third party sites or be held liable to third parties for exposure to hazardous substances should those be identified in the future. Under the U.S. Comprehensive Environmental Response, Compensation, and Liability Act of 1980 (“CERCLA”) and its state law equivalents, current or former owners of properties may be held jointly and severally liable for the costs of site cleanup or required to undertake remedial actions in response to unpermitted releases of hazardous substances at such property, in addition to, among other potential consequences, liability to governmental entities for the cost of damages to natural resources, which may be significant. These subject properties are referred to as “superfund” sites. For example, the inactive Midnite uranium mine is a superfund site subject to CERCLA.
20

Table of Contents
It is possible that certain of our other current or former operations, projects or exploration locations in the U.S. could be designated as a superfund site in the future, exposing us to potential liability under CERCLA.
The laws and regulations governing mine closure and reclamation in a particular jurisdiction are subject to review at any time and may be amended to impose additional requirements and conditions which may cause our provisions for environmental liabilities to be underestimated and could materially affect our financial position or results of operations. For a more detailed description of potential environmental liabilities, see the discussion in Environmental Matters in Note 24 to the Consolidated Financial Statements. In addition, regulators are increasingly requesting security in the form of cash collateral, credit, trust arrangements or guarantees to secure the performance of environmental obligations, which could have an adverse effect on our financial position. Any underestimated or unanticipated retirement and rehabilitation costs could materially affect our financial position, results of operations and cash flows. Environmental liabilities are accrued when they become known, or new permit conditions or limits are added, are probable and can be reasonably estimated. Whenever a previously unrecognized remediation liability becomes known, or a previously estimated reclamation cost is increased, the amount of that liability and additional cost will be recorded at that time and could materially reduce our consolidated net income attributable to Newmont stockholders and potentially result in impairments.
For example, in early 2015 and again in June 2017, the Peruvian government agency responsible for certain environmental regulations, the MINAM, issued proposed modifications to water quality criteria for designated beneficial uses which apply to mining companies, including Yanacocha. These criteria modified the in-stream water quality criteria pursuant to which Yanacocha has been designing water treatment processes and infrastructure. In 2017, Yanacocha submitted a modification to its previously approved compliance achievement plan to the MINEM. In May 2022, Yanacocha submitted a proposed modification to this plan requesting an extension of time for coming into full compliance with the new regulations to 2027. In June 2023, Yanacocha received approval of its updated compliance plan from MINEM and was granted an extension to June 2026 to achieve compliance. The Company appealed this approval to the Mining Council requesting the regulatory extension until 2027, and in April 2024, MINEM approved the compliance schedule.
The Company is conducting detailed studies to better estimate water management and other closure activities that will ensure water quality and quantity discharge requirements, including the modifications promulgated by MINAM, as referenced above, will be met. During 2025, a comprehensive update to the Yanacocha reclamation plan was completed which addressed changes in closure activities and estimated closure costs while aiming to preserve optionality for potential future projects at Yanacocha. Ongoing studies, which will extend beyond the current year, continue to evaluate and revise assumptions and estimated costs of changes to the reclamation plan. While certain estimated costs remain subject to revision, the Company’s asset retirement obligation includes construction and operating costs for two new water treatment plants and initial consideration of known risks (including the associated risk that these water treatment estimates could change in the future as more work is completed). The ultimate water treatment costs of the two water treatment plants remain uncertain as ongoing study work and assessment of opportunities that incorporates the latest design considerations remain in progress. These and other risks and contingencies that are the subject of ongoing studies could result in future material increases to the reclamation obligation at Yanacocha, including, but not limited to, a comprehensive review of our tailings storage facility management, review of Yanacocha’s water balance and storm water management system and review of post-closure management costs. The ongoing Yanacocha closure studies are expected to continue in the future. Future material increases or decreases to the asset retirement obligation could occur as additional analyses are completed and further refinements to water quality and volume modeling are completed. Additionally, revisions to the Yanacocha reclamation plan may change in connection with the Company’s ultimate submission and review of the plan with Peruvian regulators. Refer to Notes 6 and 24 to our Consolidated Financial Statements for information regarding reclamation and remediation, and Note 1 to our Consolidated Financial Statements regarding the Company’s interest in Yanacocha.
Damage to our reputation may result in decreased investor confidence, challenges in maintaining positive community relations and can pose additional obstacles to our ability to develop our projects, which may result in a material adverse impact on our business, financial position, results of operations and growth prospects.
Damage to our reputation can be the result of the actual or perceived occurrence of a variety of events and circumstances, and could result in negative publicity (for example, with respect to handling of environmental, tailings and tailings failures, employee, safety and security matters, dealings with local community organizations or individuals, community commitments, handling of cultural sites or resources, and various other matters).
In recent years we have provided greater transparency on environmental, social and governance performance in response to stakeholder engagement and requests, and provided supplemental disclosures in our Annual Sustainability Report and other sustainability reports on our website in connection with stakeholder concerns and issues. Such increased transparency may result in greater scrutiny and impact how the Company is perceived.
The Code forms the foundation of our internal governance structure as well as our commitment to responsible mining. We encourage employees and others to promptly report incidents of possible violations of the Code and/or our global policies and standards, including without limitation in the areas of business integrity, social and environmental, community relations and human rights. Employees and non-employees, including suppliers and community members, can anonymously report concerns via our third-party-administered helpline. Each mine site also has a complaints and grievances register to record matters raised by local stakeholders. When necessary, we use independent mechanisms agreed to by the complainants, such as a local leader or committee,
21

Table of Contents
to facilitate resolution of such matters before they require public or legal intervention. However, we are not always able to resolve these matters before they are raised publicly or in legal or regulatory proceedings and in the future we may not be able to meet the growing demands of stakeholders through these mechanisms. Such matters once publicized may negatively impact our reputation and may have a material adverse effect on our business, financial position and results of operations.
The growing use of social media to generate, publish and discuss community news and issues and to connect with others has made it significantly easier, among other things, for individuals and groups to share their opinions of us and our activities, whether true or not. We do not have direct control over how we are perceived by others and any resulting loss of reputation could have a material adverse effect on our business, financial position and results of operations.
We are dependent upon information technology and operational technology systems, which are subject to disruption, damage, failure or cybersecurity attacks and risks associated with implementation, upgrade, operation and integration.
Our business operations rely heavily on technology platforms and systems to manage and optimize our globally diverse mining assets. These systems are critical to ensuring safety, operational efficiency, cost management, and meeting environmental, social, and governance (ESG) objectives. However, the increasing sophistication of cybersecurity threats, coupled with the adoption of emerging technologies such as artificial intelligence (AI), automation, and cloud-based platforms, poses important risks to our operations, financial performance, and reputation.
Our systems, as well as those of our third-party service providers, vendors, and partners, face a wide range of cybersecurity threats, including: Ransomware, malware, and phishing schemes targeting critical systems and sensitive data; unauthorized access and breaches affecting intellectual property, financial information, and operational data; vulnerabilities introduced through supply chain dependencies and third-party security weaknesses; human error, design flaws, and system misconfigurations.
The adoption of new technologies and the adoption of remote and flexible work arrangements enhances our operational capabilities but introduces additional risks. AI, for example, is increasingly leveraged by Newmont for decision-making, mineral extraction optimization, and autonomous operations. While AI has the potential to improve efficiency and safety, it also presents unique vulnerabilities, including algorithmic biases that could lead to inaccurate decisions or unintended outcomes; data integrity risks, such as manipulation or corruption of datasets used to train AI systems; unauthorized access or exploitation of AI-powered systems, potentially compromising operations or sensitive data.
Additionally, the increased interconnectivity of automated and cloud-based systems and increase of our remote workforce expands our cyber-attack surface, requiring heightened vigilance and advanced security measures. These risks are further compounded for our operations in countries with higher geopolitical risk.
The Newmont cybersecurity program is designed to protect our technology platforms and address risks associated with the implementation of emerging technologies. While these efforts are designed to align with industry best practices, no system can eliminate all risks, especially given the pace of technological advancement and the evolving nature and increased frequency of cyber threats. In addition, we do not carry specific cybersecurity insurance to help mitigate such costs due to increased premiums and limited market availability.
A successful cyberattack or other cybersecurity incident could result in production and operational downtimes, data corruption, and unauthorized disclosure of sensitive information. For example, in 2020, we detected a cyberattack on our systems. Although we were able to respond quickly to stop the continued spread of the threat, it took significant time and resources to fully identify the scope of the attack and to recover our systems and data. The cost of responding to and remediating such event was immaterial. Although the 2020 attempts and other cyber incidents to date have not resulted in any material breaches, disruptions, or loss of business-critical information, our systems and procedures for preparing and protecting against such attempts and mitigating such risks may prove to be insufficient against future attacks. These events may subject us to significant expenses, remediation costs, disputes, financial losses, regulatory actions or investigations, litigation, reputational harm, and delays in the deployment of critical technologies, that could results in damages, material fines and penalties, and harm to our reputation, any of which could have a significant effect on our financial condition, results of operations, liquidity, and cash flows. The risks associated with the implementation of emerging technologies, if not effectively mitigated, could undermine the benefits of these advancements and impact our competitive position.
In addition, we are subject to various legislation, regulations, directives and guidelines from federal, state, local and foreign agencies, that are intended to strengthen cybersecurity measures required for information and operational technology, and that apply to the collection, use, retention, protection, disclosure, transfer and other processing of personal information. Failure to comply with any of applicable legal requirements could result in enforcement action against us, including fines, which could harm our reputation and have a significant effect on our financial condition, results of operations, liquidity, and cash flows.
To the extent we hold or acquire interests in any joint ventures or enter into any joint ventures, our interest in these properties is subject to the risks normally associated with the conduct of joint ventures.
To the extent we hold or acquire interests in any joint ventures or enter into any joint ventures in the future, the existence or occurrence of one or more of the following circumstances and events could have a material adverse impact on our profitability or the
22

Table of Contents
viability of our interests held through joint ventures, which could have a material adverse impact on our future cash flows, earnings, results of operations and financial condition:
•inconsistent economic, political or business interests or goals between partners or disagreements with partners on strategy for the most efficient development or operation of mines;
•inability to control certain strategic decisions made in respect of properties;
•exercise of majority rights by our partners so as to take actions for which we may not believe to be in the joint venture’s best interests, including but not limited to decisions related to day to day operations, labor relations, litigation, government relations, political contributions, community relations, project approval and project funding mechanisms;
•inability of partners to meet their financial and other obligations to the joint venture or third parties;
•disputes between partners regarding management, funding or other decisions related to the joint venture; and
•activities conducted by partners outside the joint venture may lead to reputational or regulatory consequences that negatively affect the performance or reputation of the joint venture due to their association.
To the extent that we are not the operator of joint venture properties, such that we will be unable to control the activities of the operator, the success of such operations will be beyond our control. In many cases we will be bound by the decisions made by the operator in the operation of such property, and will rely on the operator to manage the property and to provide accurate information related to such property. We can provide no assurance that all decisions of operators of properties we do not control will achieve the expected results.
For example, our joint ventures, including the joint venture that combined our and Barrick Mining Corporation’s (“Barrick”) respective Nevada operations, forming NGM, pursuant to the operating agreement entered into on July 1, 2019 between Barrick, Newmont and their wholly-owned subsidiaries party thereto (the “Nevada JV Agreement”), may not be as beneficial to us as expected, whether due to the above-described risks, unfavorable global economic conditions, increases in construction costs, political risks, labor disputes or other factors. Pursuant to the terms of the Nevada JV Agreement, we hold a 38.5 percent economic interest and Barrick holds a 61.5 percent economic interest in NGM. Barrick operates NGM with overall management responsibility and is subject to the supervision and direction of NGM’s Board of Managers, which is comprised of three managers appointed by Barrick and two managers appointed by Newmont. Outside of certain prescribed matters, decisions of the Board of Managers will be determined by majority vote, with the managers appointed by each company having voting power in proportion to such company’s economic interests in NGM. Because we beneficially own less than a majority of the ownership and governance interests in NGM, we have limited control of NGM’s operations, and we depend on Barrick to operate NGM. In the event that Barrick has interests, objectives and incentives with respect to NGM that differ from our own, there can be no assurance that we will be able to resolve such disagreement in our favor. On January 26, 2026, we informed Barrick and the NGM Board of Managers that we had identified evidence of mismanagement at NGM, including diversion of resources from NGM to the benefit of Barrick’s wholly-owned property Fourmile and Barrick, and that we were exercising our contractual inspection and audit rights. On February 3, 2026, we sent Barrick a notice of default under the Nevada JV Agreement related to this conduct. Although we continue to work with Barrick to improve the performance of NGM and will take appropriate steps to address this matter, any such disagreements could have a material adverse effect on our interest in NGM, the business of NGM or the portion of our growth strategy related to NGM.
Newmont is also exposed to non-managed investments related to its joint venture interest in Pueblo Viejo Mine (40% owned) and Norte Abierto Project (50% owned), and NuevaUnión Project (50% owned). We also hold a 32% equity interest in Lundin Gold, a Canadian mine development and operating company, operating the Fruta del Norte gold mine in Ecuador, in addition to a variety of exploration and project joint ventures.
Additionally, the Company is subject to certain funding requirements in connection with its joint ventures. Joint venture funding requirements, as well as the ability of partners to meet their financial and other obligations, may result in increases to our costs and required capital expenditures and possible delays in joint venture activities. Refer to Note 15 to the Consolidated Financial Statements for more information including with respect to loan agreements with Pueblo Viejo.
To the extent any of our joint ventures is subject to liabilities or litigation, we would be responsible for a proportional share of the liabilities and/or the joint venture’s operations could be impacted, which could have an adverse impact on the Company’s cash flows, earnings, results of operations and financial position.
Our operations and business have in the past been affected by the COVID-19 pandemic, and may be materially and adversely impacted in the future by pandemics, epidemics and other health emergencies.
The Company faces risks related to health epidemics and other outbreaks of communicable diseases, which could significantly disrupt operations and may materially and adversely affect its business and financial conditions. For example, the global COVID-19 pandemic significantly impacted our operations in 2020 and 2021, and to a lesser extent in 2022. In order to protect nearby communities and align with government travel restrictions or health considerations, certain of Newmont’s operations were temporarily put into care and maintenance resulting in a temporary decrease in production at these sites in 2020 and 2021. Additionally, the majority of our sites experienced pandemic-related absenteeism in 2021 and early 2022. In addition, the Company incurred costs
23

Table of Contents
during 2020 and 2021 as a result of actions taken to protect against the impact of the COVID-19 pandemic and comply with local mandates, and could be required to incur such costs in the future. Reductions in our operational activities due to COVID-19, or another pandemic, epidemic or health outbreak, could result in additional sites being placed into care and maintenance for extended periods of time and/or have a material adverse impact on our business, or financial condition, results of operations and cash flows. If the majority of our sites are placed into care and maintenance, this could significantly reduce our cash flow and impact our ability to meet certain covenants related to our revolving credit facility and borrowing capacity.
Financial Risk
Increased exposure to foreign exchange fluctuations and capital controls may adversely affect Newmont’s costs, earnings and the value of some of our assets.
Our reporting currency is the U.S. dollar and the majority of our earnings and cash flows are denominated in U.S. dollars. We conduct certain business in currencies other than the U.S. dollar. A portion of our operating expenses are incurred in local currencies. The appreciation of those local currencies against the U.S. dollar increases our costs of production in U.S. dollar terms at mines located outside the United States. The foreign currencies that primarily affect our results of operations are the Australian Dollar and the Canadian Dollar. Our consolidated earnings and cash flows may also be impacted by movements in the exchange rates. Change in the value of the currencies of the Australian Dollar, Canadian Dollar, the Mexican Peso, the Argentine Peso, the Ghana Cedi, the Papua New Guinea Kina, the Chilean Peso or the Surinamese Dollar versus the U.S. dollar could negatively impact our earnings. For information concerning the sensitivity of our Costs applicable to sales to changes in foreign currency exchange rates and more information our exposure to foreign exchange rate fluctuations, see Foreign Currency Exchange Rates section in Part II, Item 7, Management’s Discussion and Analysis of Consolidated Financial Condition and Results of Operations.
From time to time, countries in which we operate adopt measures to restrict the availability of the local currency or the repatriation of capital across borders. These measures are imposed by governments or central banks, in some cases during times of economic instability, to prevent the removal of capital or the sudden devaluation of local currencies or to maintain in-country foreign currency reserves. In addition, many emerging market countries require consents or reporting processes before local currency earnings can be converted into U.S. dollars or other currencies and/or such earnings can be repatriated or otherwise transferred outside of the operating jurisdiction. These measures may have a number of negative effects on Newmont, reducing the immediately available capital that we could otherwise deploy for investment opportunities or the payment of expenses. Measures that restrict the availability of the local currency or impose a requirement to operate in the local currency may create other practical difficulties for Newmont. For example, Argentina has been considered a hyperinflationary environment with a cumulative inflation rate of over 100% over the last three years. In recent years, Argentina’s central bank enacted a number of foreign currency controls in an effort to stabilize the local currency. These restrictions directly impact the timing of Cerro Negro's ability to remit cash from gold sales and pay principal portions of intercompany debt to the Company. In addition, in recent years, PNG has experienced a backlog by foreign and domestic companies and governmental agencies to convert kina into foreign currencies. The Bank of PNG implements foreign exchange controls and manages the exchange rate of the kina against the U.S. dollar. There is a risk that further changes in foreign exchange controls may adversely impact future revenue and profitability. For more information, see Results of Consolidated Operations and Foreign Currency Exchange Rates sections in Item 7, Management’s Discussion and Analysis of Consolidated Financial Condition and Results of Operations. See also risk factors under the headings “Our operations in Argentina are susceptible to risk as a result of economic and political instability in Argentina and labor unrest”, “Our operations at Ahafo South and Ahafo North in Ghana are subject to political, economic, security and other risks” and “Our Merian operation in Suriname is subject to political, security and economic risks”, “Our operations at Lihir and project at Wafi-Golpu in PNG are subject to political and regulatory risks and other uncertainties” and “Our operations and projects Canada are subject to legal and regulatory risks and other uncertainties in connection with claims and challenges by Indigenous groups” below.
Future funding requirements may affect our business, our ability to pursue new business opportunities, invest in existing and new projects, pay cash dividends or engage in share repurchase transactions.
Potential future investments, including projects in the Company’s project pipeline, acquisitions and other investments, will require significant funds for capital expenditures. Depending on gold, copper, silver, lead and zinc prices, our operating cash flow may not be sufficient to meet all of these expenditures, or result in strategic reprioritization of the project portfolio, depending on the timing of development of these and other projects. As a result, new sources of capital may be needed to meet the funding requirements of these investments, fund our ongoing business activities, and fund construction and operation of potential future projects. Our ability to raise and service significant new sources of capital will be a function of macroeconomic conditions, future gold, copper, silver, lead and zinc prices as well as our operational performance, current cash flow and debt position, among other factors. We may determine that it may be necessary or preferable to issue additional equity or other securities, defer projects or sell assets.
U.S. and global markets have, from time to time, experienced significant dislocations and liquidity disruptions. For example, the COVID-19 pandemic and events related to the recent and on-going conflicts (such as sanctions in Ukraine, Russia and/or Belarus), have in the past, and may in the future cause volatility and pricing in the capital markets. Additional financing may not be commercially available when needed or, if available, the terms of such financing may not be favorable to us and, if raised by offering equity securities, any additional financing may involve substantial dilution to existing stockholders. In the event of lower gold, copper, silver, lead or zinc prices, unanticipated operating or financial challenges, or new funding limitations, our ability to pursue new business
24

Table of Contents
opportunities, invest in existing and new projects, fund our ongoing business activities, retire or service all outstanding debt, fund share repurchase programs and transactions and pay dividends could be significantly constrained.
The Company’s share repurchase program may be discontinued at any time, and the program does not obligate the Company to acquire any specific number of shares of its common stock or to repurchase the full authorized amount. Consequently, the Board of Directors may revise or terminate such share repurchase authorization in the future. See also the risk factor under the heading “Holders of our common stock may not receive dividends.” In addition, our joint venture partners may not have sufficient funds or borrowing ability in order to make their capital commitments. In the case that our partners do not make their economic commitments, the Company may be prevented from pursuing certain development opportunities or may assume additional financial obligations, which may require new sources of capital.
Our long-lived assets and goodwill could become impaired, which could have a material non-cash adverse effect on our results of operations.
We review our operations for events and circumstances that could indicate that the carrying value of our long-lived assets may not be recoverable. If indicators of impairment are determined to exist at our mine operations, we review the recoverability of the carrying value of long-lived assets by estimating the future undiscounted cash flows expected to result from the use and eventual disposition of the asset. We also review our goodwill for impairment annually and when events or changes in circumstances indicate that the carrying value of a reporting unit exceeds its fair value. Management makes multiple assumptions in estimating future cash flows, which include production levels based on life of mine plans, future costs of production, estimates of future production levels based on value beyond proven and probable reserves at our operations, prices of metals, the historical experience of our operations and other factors. There are numerous uncertainties inherent in estimating production levels of gold, copper, silver, lead and zinc and the costs to mine recoverable reserves, including many factors beyond our control that could cause actual results to differ materially from expected financial and operating results or result in future impairment charges. We may be required to recognize material non-cash charges relating to impairments of long-lived assets and/or goodwill in the future if actual results differ materially from management’s estimates, which include metal prices, our ability to reduce or control production costs or capital costs through strategic mine optimization initiatives, increased costs or decreased production due to regulatory issues or if we do not realize the mineable reserves, resources or exploration potential at our mining properties. Additions to asset retirement costs could result in impairment charges.
We recorded substantial goodwill, primarily as the result of our acquisition of Newcrest in 2023. We accounted for the acquisition of Newcrest using the acquisition method of accounting, which requires that purchase price is allocated to the underlying tangible and intangible assets acquired and liabilities assumed of Newcrest based on their respective fair market values. Any excess purchase price is allocated to goodwill. Our balance sheet reflects additions to the carrying amount of goodwill recognized in connection with the Newcrest transaction.
The Company continues to evaluate strategic priorities and deployment of capital to projects in the pipeline. A decision to reprioritize, sell or abandon a development project could result in a future impairment charge. For example, in response to challenging market conditions, which included inflationary pressures and supply chain disruptions, in 2023 the Company announced the deferral for at least two years of the full-funds investment decision for the Yanacocha Sulfides project in Peru. In 2025, the Company reassessed its strategy in Peru and is progressing mine closure activities while prioritizing other future development opportunities at Yanacocha ahead of any future re-evaluation of the Yanacocha Sulfides project, resulting in an indefinite deferral of the future development of this project and the impairment of the balances included in assets under construction and deferred mine development for the project. See Note 2 to the Consolidated Financial Statement for additional information. The Company also periodically updates the economic model for its Conga project to understand changes to the estimated capital costs, cash flows, and economic returns from the project. Certain decisions or changes in circumstances could result in determinations that carrying value is not recoverable and could result in impairment. See Part II, Item 7 under the heading “Critical Accounting Estimates – Carrying value of long-lived assets and Carrying value of Conga” for additional information.
If an impairment charge is incurred, such charges are not reversible at a later date even when favorable modifications to our proven and probable reserves and measured, indicated and inferred resources, favorable revisions to environmental obligations, favorable changes in legislation and/or our political or economic environment, or other favorable events occur. As a result of these uncertainties, our operating results may be significantly impacted from both the impairment and the underlying trends in the business that triggered the impairment, and actual results may be less favorable than estimated returns and initial financial outlook. For additional information regarding goodwill, refer to Note 19 to our Consolidated Financial Statements.
Our ability to recognize the benefits of deferred tax assets is dependent on future cash flows and taxable income.
We recognize the expected future tax benefit from deferred tax assets when the tax benefit is considered to be more likely than not of being realized, otherwise, a valuation allowance is applied against deferred tax assets. Assessing the recoverability of deferred tax assets requires management to make significant estimates related to expectations of future taxable income. Estimates of future taxable income are based on historical results of operations, forecasted cash flows from operations, and the application of existing tax laws in each jurisdiction. To the extent that future cash flows and taxable income differ significantly from estimates, our ability to realize the deferred tax assets could be impacted. In the future, our estimates could change requiring a valuation allowance or
25

Table of Contents
impairment of our deferred tax assets. Additionally, future changes in tax laws could limit our ability to obtain the future tax benefits represented by our deferred tax assets. Refer to Note 10 to our Consolidated Financial Statements under the heading “Income and Mining Taxes - Valuation of Deferred Tax Assets” and Note 2 under the heading “Summary of Significant Accounting Policies - Valuation of Deferred Tax Assets” for additional information and factors that could impact the Company’s ability to realize the deferred tax assets. For additional information regarding Newmont’s non-current deferred tax assets, refer to Note 10 to our Consolidated Financial Statements.
Any downgrade in the credit ratings assigned to our debt securities could increase our future borrowing costs and adversely affect the availability of new financing.
There can be no assurance that any rating currently assigned by Standard & Poor’s Rating Services, Moody’s Investors Service, or Fitch Ratings to Newmont will remain unchanged for any given period of time or that a rating will not be lowered if, in that rating agency’s judgment, future circumstances relating to the basis of the rating so warrant. If we are unable to maintain our outstanding debt and financial ratios at levels acceptable to the credit rating agencies, or should our business prospects or financial results deteriorate, our ratings could be downgraded by the rating agencies. The Company’s credit ratings have been subject to change over the years. We currently maintain a Standard & Poor’s rating of BBB+ (stable outlook), Moody’s Investors Service rating of A3 (stable outlook), and a Fitch Ratings rating of A- (stable outlook). We cannot make assurances regarding how long these ratings will remain unchanged or regarding the outcome of the rating agencies future reviews (including following any planned or future business combinations). A downgrade by the rating agencies could adversely affect the value of our outstanding securities, our existing debt and our ability to obtain new financing on favorable terms, if at all, and increase our borrowing costs, which in turn could impair our results of operations and financial position.
Returns for investments in pension plans are uncertain.
We maintain pension plans for certain employees which provide for specified payments after retirement. The Company’s qualified pension plans are funded with cash contributions in compliance with IRS rules and regulations. The Company’s non-qualified and other benefit plans are currently not funded, but exist as general corporate obligations. Refer to Note 11 to our Consolidated Financial Statements under the heading “Pension and Other Benefit Plans” for additional information regarding the funding status of qualified and non-qualified plans. The Company reviews its retirement benefit programs on a regular basis and will consider market conditions and the funded status of its qualified pension plans in determining whether additional contributions are appropriate. The ability of the pension plans to provide the specified benefits depends on our funding of the plans and returns on investments made by the plans. Returns, if any, on investments are subject to fluctuations based on investment choices and market conditions. A sustained period of low returns or losses on investments could require us to fund the pension plans to a greater extent than anticipated. If future plan investment returns are not sufficient, we may be required to increase the amount of future cash contributions.
Risks Related to Our Industry
We may experience increased costs or losses resulting from the hazards and uncertainties associated with mining.
The exploration for natural resources and the development and production of mining operations are activities that involve a high level of uncertainty. These can be difficult to predict and are often affected by risks and hazards outside of our control. These factors include, but are not limited to:
•Environmental hazards, including discharge of metals, concentrates, pollutants or hazardous chemicals;
•Industrial accidents, including in connection with the operation of heavy mobile equipment, milling equipment and/or conveyor systems and accidents associated with the preparation and ignition of large-scale blasting operations, milling and processing;
•Accidents in connection with transportation, including transportation of chemicals, explosives or other materials, transportation of large mining equipment and transportation of employees and business partners to and from sites;
•Social, community or labor force disputes resulting in work stoppages or shipping delays, such as at Peñasquito, Cerro Negro, Merian, and Lihir, or related loss of social acceptance of community support;
•Changes and/or increasingly stringent legal and regulatory requirements;
•Delays in permitting due to reduced resources and capacity for review and formulation of permits at regulatory agencies;
•Security incidents, including activities of illegal or artisanal miners, gold bullion or concentrate theft, including in transport, and corruption and fraud;
•Shortages in materials or equipment and energy and electrical power supply interruptions or rationing;
•Failure of unproven or evolving technologies or loss of information integrity or data;
•Unexpected geological formations or conditions (whether in mineral or gaseous form);
•Metallurgical conditions and gold, copper, silver, lead, zinc and other metal recovery, including unexpected decline of ore grade;
26

Table of Contents
•Unanticipated changes in inventory levels at heap-leach operations;
•Ground and surface water conditions;
•Fall-of-ground accidents in underground operations;
•Failure of mining pit slopes, heap leach facilities, tailings embankments, and other tailing depositions, or water storage dams;
•Seismic activity;
•Surface or underground fires or floods, inundation or inrush of water and other materials; and
•Other natural phenomena, such as lightning, cyclonic or tropical storms, drought, avalanches, landslides, wildfires, tsunami, floods, or other inclement weather conditions, including those impacting operations or the ability to access and supply sites.
The occurrence of one or more of these events in connection with our exploration activities, development and production and closure of mining operations may result in the death of, or personal injury to, our employees, other personnel or third parties, the loss of mining equipment and infrastructure, work stoppages, damage to or destruction of mineral properties or production facilities, monetary losses, deferral or unanticipated fluctuations in production, environmental damage and potential legal liabilities, all of which may adversely affect our reputation, business, prospects, results of operations and financial position.
Mining operations involve a high degree of risk, including hazards related to the use of explosives and hazardous chemicals and critical equipment failure.
Our operations are subject to risks associated with the transportation, storage, handling and use of explosives and hazardous chemicals. These include unplanned detonation of explosives and catastrophic release of hazardous chemicals (for example, due to vessel rupture resulting in an explosion or toxic gas release). Critical equipment related risks that apply to various Newmont sites include for example, mill failure arising from catastrophic failure of a component, or unavailability of mine haul fleet. Other critical equipment related risks may be site specific. For example, asset integrity at Lihir may be impacted by the proximity of the mine to a corrosive marine environment. The occurrence of such catastrophic events may result in work stoppages, damage to or destruction of mines and other producing facilities, damage to or loss of life and property, environmental damage and possible legal liability for any or all damage or loss and may adversely affect the Company’s operating results and financial condition.
We rely on our supply chain operations to procure goods and services to support our operations and projects, and competition with other natural resource companies, and shortage of critical parts, services and equipment may adversely affect our operations and development projects.
Production continuity and cost profile can be impacted by risks associated with the management and operation of the Company’s inbound global supply chain (including risks associated with the inventory management of critical equipment, spares and consumables). We rely on our global supply chain to procure goods and services from suppliers and contractors to support our operations and projects. We are exposed to material availability, disruption and performance risks across our supply chain, including lack of suitable suppliers or contractors, cost increases, impacts of pandemics and epidemics on the supply chain, transportation and logistics issues including delays in delivery, disruption to trade flows due to geopolitical tensions and/or changes in legislation, performance of suppliers and contractors to contractual terms, and damage to our reputation caused by actions of our suppliers or contractors. In addition, our ability to competitively source goods and services may be affected by local content procurement commitments in the jurisdictions in which we operate. See the risk factors “We rely on contractors to conduct a significant portion of our operations and construction projects” and “Our operations and projects may be adversely affected by rising energy prices or energy shortages” below for further information.
Inbound supply chain disruptions could lead to mine site production curtailment or stoppage if a critical material or labor input is unavailable. This could have a material adverse impact to our financial condition depending on the duration of the curtailment or stoppage. The Company is also exposed to outbound supply chain risk, particularly fluctuating transportation charges, delays in delivery of shipments, theft, terrorism, geopolitical tensions and border closures and adverse weather conditions.
In addition, we compete with other natural resource companies for specialized equipment and supplies necessary for exploration and development, as well as for rights to mine properties containing gold, copper, silver, lead, zinc, and other minerals. The mining industry has been impacted, from time to time, by increased demand for critical resources such as input commodities, drilling equipment, trucks, shovels and tires. These shortages have, at times, impacted the efficiency of our operations, and resulted in cost increases and delays in construction of projects; thereby impacting operating costs, capital expenditures and production and construction schedules. We may be unable to obtain the services of skilled personnel and contractors or specialized equipment or supplies, or to acquire additional rights to mine properties, which could have an adverse effect on our competitive position or adversely impact our results of operations.
27

Table of Contents
We may be unable to obtain or retain necessary permits and land or mining tenure, which could adversely affect our operations and projects.
Our mining and processing operations and development and exploration activities are subject to extensive permitting requirements. The requirements to obtain and/or achieve or maintain full compliance with such permits can be costly and involve extended timelines. While we strive to obtain and comply with all permits required of us, there can be no assurance that we will obtain all such permits and/or achieve or maintain full compliance with such permits at all times. Previously obtained permits may be suspended or revoked for a number of reasons, including through government or court action. New or amended permits may also be required to continue existing activities, as new laws come into effect or regulators change their application of laws. Failure to obtain and/or comply with required permits can have serious consequences, including damage to our reputation; cessation of the development of a project; increased costs of development or production and litigation or regulatory action, any of which could materially adversely affect our business, results of operations or financial condition.
Our ability to obtain the required permits and approvals to explore for, develop and operate mines and to successfully operate near communities in the jurisdictions in which we operate depends in part on our ability to develop, operate and close mines in a manner that is consistent with the creation of social and economic benefits in the surrounding communities, which may or may not be required by law. Our ability to obtain permits and approvals and to operate near certain communities may be adversely impacted by real or perceived detrimental events associated with our activities or those of other mining companies affecting the environment, health and safety of communities in which we operate. Key permits and approvals may be revoked or suspended or may be adjusted in a manner that adversely affects our operations, including our ability to explore or develop properties, commence production or continue operations. Permit review and approval could be delayed, adversely impacting project implementation due to delays in review and development of permits from limited resources at the regulatory agencies.
Many of our mining and processing operations, including tailings storage, project expansions, and exploration and development activities require mineral, mining and/or surface land tenure properties that are leased, granted to, or otherwise acquired by the Company for specified periods of time. Securing, maintaining, extending, and renewing the Company’s rights, titles, or interests ("Legal Title") in and to these land tenures can be costly, subject to political, regulatory, and social risks, and no assurance can be provided that all required leases or other types of land tenure will be granted, maintained, extended, or renewed. For example, additional tailings capacity is needed to support future growth and sustainability of Boddington operations beyond 2025. Boddington’s existing tailings facility is expected to reach the permitted capacity in 2026. Following advancement of the life of mine tailings study to explore options for continued tailings deposition, the Company decided to expand the existing F1/F3 Residue Disposal Area ("RDA") from an ultimate capacity of 600Mt to 750Mt to provide storage capacity to 2029, subject to permitting and other approvals. Beyond 2029 an additional tailings facility would need to be built, termed RDA2, and this facility is also subject to permitting and other approvals, including additional environmental permits. Further, the Boddington operation is primarily located on mining leases with renewal dates commencing in 2028. The lease renewal, as well as additional leases required in connection with tailings expansion, require cooperation and agreements with third parties. No assurances can be provided that such renewals and additional lease scope for further tailings capacity will be secured at similar cost, commercially reasonable terms, or at all. A failure to secure agreement on commercially reasonable terms could result in increased costs, requirements to move infrastructures, modification to future plans, including cessation of mining.
Similarly, the current capacity of the TSFs at Cadia should support operations through to the current permitted time period by exhausting capacity within the current Pit TSF ("PTSF") and by constructing a raise to the South Tailings Storage Facility ("STSF"), as has been permitted. Studies evaluating potential options to increase tailings storage capacity are underway, including additional placement of tailings on the North Tailings Storage Facility ("NTSF") and a proposal to construct an extension to the current STSF ("STSFX") to provide capacity to approximately 2050. Cadia is currently approved to continue operations until 2031 and is seeking approval from the NSW Government to extend our mining operations beyond 2031. This is known as the Cadia Continued Operations Project (“CCOP”), of which the construction of the STSFX is a project feature. No assurances can be provided that approvals will be secured.
Merian was able to obtain a Legal Title (the right of leasehold, which is a surface right) to facilitate the expansion of its tailings storage facility (TSF2). This title was granted by the Republic of Suriname in early 2025 under certain conditions as well as commitments to the local community in the area. To maintain this Legal Title in good legal standing, including its extension in due time, it remains important to adhere to the conditions related to the granting of this surface right as well as community commitments in relation to this surface right.
Failure to obtain required land tenure can have serious consequences, including loss of Legal Title in and to mineral and/or surface properties that are owned or controlled by the Company, cessation of operations, project delays or cancellations, increased costs, and potential litigation or regulatory action. Any of these outcomes could materially and adversely affect our business, reputation, operational performance, and financial condition. See risk factors under the headings “Our Company and the mining industry are facing continued geotechnical, geothermal and hydrogeological challenges, which could adversely impact our production and profitability,” and “Title to some of our properties may be insufficient, defective, or challenged.”
28

Table of Contents
Mining companies are increasingly required to consider and provide benefits to the communities and countries in which they operate in order to maintain operations.
Greater scrutiny on the private sector broadly and multi-national companies specifically, to contribute to sustainable outcomes in the places where they operate, has led to a proliferation of standards and reporting initiatives focused on environmental stewardship, social performance and transparency. Extractive industries, and mining in particular, have seen significant increases in stakeholder expectations. These businesses are increasingly required to meaningfully engage with impacted stakeholders; understand and avoid or mitigate negative impacts while optimizing economic participation and uplift opportunities associated with their operations. The expectation is for companies to create shared value for stockholders, employees, governments, local communities and host countries. Such expectations tend to be particularly focused on companies whose activities are perceived to have high socio-economic and environmental impacts. In Canada, for instance, there is increased expectation that is also increasingly supported by regulations and/or case law for Indigenous communities on whose traditional territories mineral development occurs or is impacted by mineral development to share in the economic prosperity of the mine, and for such communities to share in joint decision making with government regulators on various permitting efforts. Newmont has over many years developed and continues to evolve a robust system of ESG management that includes policies, standards, guidance, assurance, participation in international organizations focused on improved performance and outcomes for host communities and the environment. In Ghana, for instance, in response to resettlement-related complaints, Newmont worked with national and local government authorities, traditional leaders, impacted farmers/landowners and other concerned stakeholders to analyze impacts, extend programs to support vulnerable households and provide enhanced and/or alternative livelihood support. Despite the Company’s commitment to on-going engagement with communities and stakeholders, no assurances can be provided that increased stakeholder expectations will not result in adverse financial and operational impacts to the business, including, without limitation, operational disruption, increased costs, increased investment obligations, increased commitments to local and/or Indigenous communities with fiscal implications, and increased taxes and royalties payable to governments.
Illegal mining and artisanal mining occur on or adjacent to certain of our properties exposing such sites to security risks.
Artisanal, small scale and illegal miners have been active on, or adjacent to, some of Newmont’s African and South American properties, including in Peru, Suriname and Ghana in recent years. For example, in Ghana in 2019, illegal miners attacked a field team of security guards employed by a security contractor, tragically resulting in a fatality. While we are working collaboratively with the artisanal miners of the Pamaka Community in Suriname on a program that includes improving mining practices for improved safety, environmental and processing practices as well as alternative livelihood opportunities, this not always possible. Illegal mining, which involves trespass and occupation of exploration, development, and operating properties present significant security, safety, legal, and environmental risk, which could result in a security threat to human life, infrastructure, and equipment, and lead to the loss of legal title, environmental liabilities, possession, or use of Newmont's land tenure. The illegal miners from time to time have clashed with security staff and law enforcement personnel who have attempted to move them away from the facilities. Although, under certain circumstances, artisanal mining may be a legally sanctioned activity, artisanal mining is also associated with a number of negative impacts, including environmental degradation, poor working practices, erosion of civil society, human rights abuse and funding of conflict. The environmental, social, legal, safety and health impacts of artisanal and illegal mining are frequently attributed to formal large scale mining activity, and it is often assumed that artisanally-mined gold is channeled through large-scale mining operators, even though artisanal and large-scale miners normally have separate and distinct supply chains. These misconceptions impact negatively on the reputation of the industry. The activities of the illegal miners could cause damage to Newmont’s properties or result in inappropriate or unlawful use of force for which Newmont could potentially be held responsible. The presence of illegal miners could lead to exploration and project delays and disputes regarding the development or operation of commercial gold deposits. Illegal mining could also result in lost gold production and reserves, mine and development stoppages, and have a material adverse effect on financial condition or results of operations or project development. Finally, it is difficult to separate potential or actual environmental impacts from Newmont's activities from those of artisanal miners who have illegally accessed and are operating on our land tenure. This can cause both reputational and compliance challenges.
Civil disturbances and criminal activities can disrupt business and expose the Company to liability.
Civil disturbances and criminal activities such as trespass, illegal mining, sabotage, theft, blockades, organized crime and vandalism may cause disruptions and could result in the suspension of operations, delays to project development and negative impacts on exploration activities at certain sites. Incidents of such activities have occasionally led to conflict with security personnel and/or police, which in some cases resulted in serious injuries or death including in Ghana, Peru, Mexico, PNG and Suriname in recent years. Additionally, some areas in which we conduct operations, develop projects and exploration activities are affected by civil unrest such as in PNG and Ecuador in early 2024, and persistent violence and organized crime involving significant drug cartels, such as in Mexico.
Although security measures have been implemented by the Company to protect employees, community members, property and assets, such measures will not guarantee that such civil disturbances and criminal activities will not continue to occur in the future, or result in harm to employees, community members or trespassers, decrease operational efficiency or construction delays, increase community tensions or result in liabilities or reputational harm to Newmont. Security incidents, in the future, may have a material adverse effect on our operations, development projects, exploration and reclamation activities, especially if criminal activity and violence escalate. Such incidents may halt or delay production, increase operating costs; result in harm to employees, contractors,
29

Table of Contents
visitors or community members; decrease operational efficiency due to employee absenteeism and other factors; increase community tensions or otherwise adversely affect our ability to conduct business. The manner in which the Company’s personnel, national police or other security forces respond to civil disturbances and criminal activities can give rise to additional risks where those responses are not conducted in a manner consistent with international and Newmont standards relating to the use of force and respect for human rights. Newmont takes seriously our obligation to respect and promote human rights, is a signatory to and active participant in the Voluntary Principles on Security and Human Rights, and has adopted a Sustainability and Stakeholder Engagement Policy and Human Rights Standard in-line with the UN Guiding Principles on Business and Human Rights. Nonetheless, although the Company has implemented a number of significant measures and safeguards which are intended to ensure that personnel understand and uphold these standards, the implementation of these measures will not guarantee that personnel, national police or other security forces will uphold these standards in every instance. The evolving expectations related to human rights, human rights defenders, Indigenous rights, and environmental protections may result in opposition to our current and future operations, the development of new projects and mines, and exploration activities. Such opposition may take the form of legal or administrative proceedings or manifestations such as protests, roadblocks or other forms of public expression against our activities, and may have a negative impact on our local or global reputation and operations. Opposition by community and activist groups to our operations may require modification of, or preclude the operation or development of, our projects and mines or may require us to enter into agreements with such groups or local governments with respect to our projects and mines or exploration activities, in some cases, causing increased costs and significant delays to the advancement of our projects. For example, in Peru, our Conga project faced opposition from anti-mining activists, after which we suspended construction on the project’s mining facilities and eventually reclassified Conga’s reserves to resource as the result of certain operating and construction permits expiring at the end of 2015. The failure to conduct operations in accordance with Company standards can result in harm to employees, community members or trespassers, increase community tensions, reputational harm to Newmont or result in criminal and/or civil liability and/or financial damages or penalties.
Our operations and projects face substantial regulation of health and safety.
Our operations are subject to extensive and complex laws and regulations governing worker health and safety across our operating regions and our failure to comply with applicable legal requirements can result in substantial penalties. Future changes in applicable laws, regulations, permits and approvals or changes in their enforcement or regulatory interpretation could substantially increase costs to achieve compliance, lead to the revocation of existing or future exploration or mining rights or otherwise have an adverse impact on our results of operations and financial position.
Our mines are inspected on a regular basis by government regulators who may issue citations and orders when they believe a violation has occurred under local mining regulations. If inspections result in an alleged violation, we may be subject to fines, penalties or sanctions and our mining operations could be subject to temporary or extended closures.
In addition to potential government restrictions and regulatory fines, penalties or sanctions, our ability to operate (including the effect of any impact on our workforce) and thus, our results of operations and our financial position (including because of potential related fines and sanctions), could be adversely affected by accidents, injuries, fatalities or events detrimental (or perceived to be detrimental) to the health and safety of our employees, the environment or the communities in which we operate.
Our operations and projects are subject to extensive environmental laws and regulations.
Our exploration, development, mining and processing operations, and closed facilities are subject to extensive laws and regulations governing land use and the protection of the environment, which generally apply to air and water, protection of endangered, protected or other specified species, hazardous and non-hazardous waste management and reclamation. Many of the countries in which we operate have laws and regulations related to water (quality and quantity), nature and greenhouse gas (“GHG") emissions which are becoming increasingly more stringent. We have made, and expect to make in the future, significant expenditures to comply with such laws and regulations. Compliance with these laws and regulations imposes substantial costs and burdens, and can cause delays in obtaining, or a failure to obtain or renew, or cancellation of, government permits and approvals which may adversely impact our operations and closure processes. Increased global attention or regulation on consumption of shared resources and use products or development of waste that have the potential to impact human health and the environment could similarly have an adverse impact on our results of operations and financial position due to increased compliance and input costs. Specific examples where we face such risks include:
Waste Rock and Tailings Management
Our gold and copper mining and ore refining/metals extraction processes generate waste by-products such as waste rock (managed in waste rock dumps or, in the case of Lihir, harbor waste rock platforms and permitted barge dumping locations) and tailings (managed by the use of tailings storage facilities, lacustrine deposition in the case of Brucejack or deep sea tailings placement in the case of Lihir and as proposed at Wafi-Golpu). Tailings storage facilities are constructed progressively throughout the life of the mine to support increasing capacity requirements. If there is a failure in the integrity of a tailings storage facility, there is a risk that tailings or large volumes of water and/or potentially contaminating materials may be released and cause material harm to human health and/or the environment downstream of the facility. Such an occurrence could severely damage our reputation and materially adversely impact our operating results and financial condition. It may also subject us to civil and/or criminal action, penalties and claims from environmental and planning regulators and/or affected third parties, and may lead to the suspension or disruption of our
30

Table of Contents
operations and projects. See also risk factor under the heading "Our operations and projects are dependent on the availability of sufficient water supplies and subject to water-related risk."
Tailings Storage Facilities and Dust Emissions at Cadia
Tailings deposition was suspended at Cadia Holdings Pty Ltd’s (“Cadia Holdings”) tailings storage facilities in March 2018 following an embankment slump of its NTSF. Use of the NTSF is subject to a prohibition notice issued by the NSW Resources Regulator and deposition is expected to remain suspended until repairs of the NTSF wall are completed. In December 2019, Cadia Holdings received approval from the New South Wales Department of Planning and Environment (the “NSW DPE”) to fully utilize the decommissioned Cadia Hill mine pit for deposition of thickened tailings. In December 2021, the NSW DPE granted approval to increase the permitted processing capacity from 32 to 35 million tonnes of ore in a calendar year. Such approval is subject to certain conditions, including that Cadia Holdings commission and publish an independent air quality audit report that includes a description of the details and scheduling of all reasonable and feasible best practice measures that are being implemented by Cadia Holdings to minimize off-site air quality impacts of the mine.
The independent air quality audit report published by Cadia Holdings in August 2022 indicated that dust emitted from two ventilation exhaust rises which vent emissions from underground processing operations exceeded levels permitted by applicable law. During the quarter ended June 2023, the New South Wales Environment Protection Authority (“NSW EPA”) issued variations to its Environment Protection License (“EPL”), a Prevention Notice and Notices to Provide Information regarding the management of, and investigation into potential breaches relating to, dust emissions and other air pollutants from the Cadia tailings storage facilities and ventilation rises. The license variations largely formalized the actions Cadia Holdings had developed in consultation with the NSW EPA and was already undertaking across a range of measures.
Cadia Holdings received a letter from the NSW EPA in June 2023 requiring it to immediately comply with specific statutory requirements and EPL conditions. Adjustments were implemented underground, including a reduction in mining rates, modifications to the ventilation circuit and the installation of additional dust sprays and spray curtains. Additional dust collection units were subsequently installed enabling normal mining rates to be restored.
In August 2023, the NSW EPA commenced proceedings in the Land and Environment Court of NSW (the “NSW Land and Environment Court”) against Cadia Holdings, alleging that air emissions from Cadia in March 2022 exceeded the standard of concentration for total solid particles permitted under applicable laws due to the use of surface exhaust fans at the mine. On September 29, 2023, Cadia Holdings entered a plea of guilty and the NSW Land and Environmental Court listed the case for a sentencing hearing on March 28, 2024. On October 13, 2023, the NSW EPA commenced additional proceedings in the NSW Land and Environment Court against Cadia Holdings, alleging two additional contraventions of applicable air emissions requirements in November 2021 and May 2023 and two contraventions related to alleged air pollution from tailings storage facilities on October 13 and 31, 2022. On November 24, 2023 Cadia Holdings entered a plea of guilty to the two additional charges relating to applicable air emissions requirements the sentencing hearing took place before the NSW Land and Environment Court on June 21, 2024. On March 31, 2025, Cadia Holdings was convicted of three offenses relating to applicable air emissions requirements and the Court ordered Cadia Holdings to pay a penalty of A$350 thousand and pay A$61.5 thousand to the Department of Climate Change, Energy, Environment and Water (the “NSW DCCEEW”) for the Rural Air Quality Monitoring Network funding for a new Dust Track system located in Mudgee NSW. On October 18, 2024, Cadia Holdings entered a plea of not guilty to the proceedings related to alleged air pollution from Cadia Holdings’ tailings storage facilities. The proceedings were withdrawn and discontinued on December 19, 2025, with no order as to costs. Cadia Holdings and the NSW EPA entered into an enforceable undertaking where Cadia Holdings has agreed to pay A$307,500 to the NSW DCCEEW to support the Rural Dust Monitoring Network managed by Climate and Atmospheric Science and the NSW DCCEEW. Cadia Holdings will also pay A$25,000 to the NSW EPA as a contribution to the investigative and legal costs incurred by the NSW EPA in connection with the incidents and with respect to negotiating and entering into the enforceable undertaking. The NSW EPA continues to monitor Cadia’s operations and EPL compliance.
Failure to maintain compliance with applicable law or Cadia Holdings’ EPL may result in the NSW EPA suspending or revoking Cadia Holdings’ EPL, seeking court orders or issuing additional prevention notices to modify or cease certain activities. Ongoing enforcement, and challenges in maintaining compliance, may impact Cadia Holdings’ ability to secure a future expansion of its project approval to extend the life of mine from 2031 to 2055. In addition, Cadia Holdings has previously been, and may in the future be, subject to prosecutions and penalties for noncompliance with air quality requirements or the terms of its EPL, including in respect of emissions from any vent rise or emissions from the NTSF and the STSF. Operational changes required to achieve or maintain compliance, including reductions in mining rates and other limitations on mining or processing operations, or additional requirements to install costly pollution control equipment, may adversely impact our operating results and financial condition.
Environmental Sampling in the Cadia Area
In early 2023, residents living near Cadia raised concerns about potential impacts to drinking water supplies by various contaminants, including metals such as lead, nickel and copper, which they allege are related to emissions from the vent rises at Cadia, as well as periodic dust emission events at NTSF and STSF. In response to community concerns, the New South Wales Department of Health tested the quality of residents’ kitchen tap water and reported that it was safe to drink. The NSW EPA also undertook a comprehensive water testing program in the local area and the majority of results from the kitchen tap samples show metal
31

Table of Contents
concentrations below the Australian Drinking Water Guidelines values. The majority of the instances of non-compliance from both Cadia Holdings’ and the NSW EPA’s sampling programs showed that such instances of non-compliance were influenced by building and plumbing materials.
A particulate characterization study, which was undertaken by the Australian government’s Australian Nuclear Science and Technology Organisation (the “ANSTO”) and commissioned by Cadia Holdings in collaboration with the local community, assessed the PM2.5 dust contribution from Cadia to the regional air shed over a three-year period and concluded that Cadia contributed only a small percentage of soil particulate matter. In fact, soil was determined to be the least significant source of air pollution over the three-year period, contributing less than 10% to the total PM2.5 mass. The ANSTO study also determined that metals of concern recently identified by the community, such as lead, nickel, selenium and chromium, occurred at very low levels in the PM2.5 fraction and did not exceed any national standard. The report is part of a comprehensive suite of independent air and water quality investigations, including with respect to sampling of drinking water sources, air quality monitoring, dispersion modelling and lead fingerprinting, that have been or are being conducted to determine the source of metals within the local airshed and to assess any health risks to the local community, if any, from air emissions from the Cadia mine site.
In 2024, some local residents reported perfluoroalkyl and polyfluoroalkyl Substances (“PFAS”) and other contaminants were allegedly being detected in the river catchment surrounding Cadia. The NSW EPA conducted sampling and the results show PFAS, particularly perfluorooctane sulfonate (“PFOS”) and perfluorooctanoic acid (“PFOA”), at several sites in the river catchment upstream and downstream from Cadia. The NSW EPA sampling program showed that upstream results for PFAS are the major source in the river system. The NSW EPA has placed conditions on Cadia and other EPA license holders in the area to engage an independent consultant to undertake a PFAS site investigations.
In light of these developments at Cadia, and the ongoing approval process to expand the TSF, there is a heightened level of community activism relating to the perceived impact of mining activities on the health of the community, and the condition of residential properties, located in proximity to Cadia. These developments, including community complaints associated with our activities at Cadia could give rise to reputational harm, operational disruptions, civil action, increased regulatory scrutiny of mining activities or delays to project development.
Our operations and projects are subject to a range of risks related to transitioning the business to meet regulatory, societal and investor expectations for operating in a low-carbon economy.
Climate change and the transition to a low-carbon economy is expected to impact Newmont in a number of ways. Producing gold is an energy-intensive business, currently resulting in a significant carbon footprint. Transitioning to a low-carbon economy will require significant investment and may entail extensive policy, legal, technology, and market changes to address mitigation and adaptation requirements related to climate change. Depending on the nature, speed, focus and jurisdiction of these changes, transition risks may pose varying levels of financial and reputational risk to the business.
A number of governments or governmental bodies have introduced or are contemplating regulatory changes in response to the potential impacts of climate change that are viewed as the result of emissions from the combustion of carbon-based fuels. At the 21st Conference of the Parties of the United Nations Framework Convention on Climate Change (“UNFCC”) held in Paris in 2015, the Paris Agreement was adopted which was intended to govern emission reductions beyond 2020, and subsequent UN Climate Change Conferences reaffirmed the commitments of the Paris Agreement. Newmont supports the UNFCC goal of limiting global warming to “well below 2oC” compared to pre-industrial levels and plans to transition its operations to meet this goal by 2030, with an aspiration of carbon neutrality by 2050. Material investments and capital expenditures will be required in order to meet our climate targets in the future. Inconsistent implementation or significant delay in the implementation of country-level policy is likely to increase the risk for future regulatory impacts and rapid shifts to low-carbon technologies, including renewable energy use. In addition, the UN Climate Change Conference of the Parties 2024 (COP29) reported several challenges in the transition to renewable energy, including that many countries are not transitioning as quickly as needed, which could jeopardize their ability to meet climate targets. This may cause competition for renewable resources, which may lead to increased costs and reliability issues for Newmont.
Policy and regulatory risk related to actual and proposed changes in climate-, nature-, and water-related laws, regulations and taxes developed to regulate the transition to a low-carbon economy may result in increased costs for our operations, venture partners and our suppliers, including increased energy, capital equipment, environmental monitoring and reporting and other costs to comply with such regulations. Regulatory uncertainty may cause us to incur higher costs and lower economic returns than originally estimated for new development projects and operations, including closure reclamation obligations. For example, operational and capital expenses are expected to increase in order to meet renewable portfolio standard requirements from current costs over the next 10 years in Australia, Canada, Mexico and the Carbon taxes, fuel switching and the transition to cleaner purchased power and/or on-site renewable energy generation will require significant upfront capital expenditures and may also increase operating costs. As another example, the carbon tax in Canada of C$80/tonne of CO2 set to increase to C$170 by 2030, is impacting operating costs at our Canadian operations. We expect the potential for similar tax increases in other jurisdictions. Additionally, we do not maintain insurance policies against such climate-related risks or taxes.
The development and deployment of technological improvements or innovations will be required to support the transition to a low-carbon economy, which could result in write-offs and early retirement of existing assets, increased costs to adopt and deploy new
32

Table of Contents
practices and processing including planning and design for mines, development of alternative power sources, site level efficiencies and other capital investments. Our investments in these technologies may also expose us to legal, operational and reputational and other risks. The pace of development of such technologies may be inadequate, such technologies may be insufficient, and we may not be able to deploy such technologies at a commercial scale. We will also consider the limited use of carbon neutralization or offsets in the future for hard to abate emissions to assist in meeting our 2050 carbon neutral ambition, and there may be an insufficient supply of offsets to achieve our goals.
There will be varied and complex market impacts due to climate change and the transition to a low-carbon economy. There will be shifts in supply and demand for certain commodities, products and services in connection with evolving consumer and investor sentiments. Market perceptions of the mining sector, and, in particular, the role that certain metals will or will not play in the transition to a low-carbon economy remains uncertain. Potential financial impacts may include reduced investment in gold due to shifts in investor sentiment, increased production costs due to changing input prices, re-pricing of land valuation and assets, increased global competition for key materials needed for new technologies (lithium, copper, rare earth minerals used in solar technology, etc.), potential cost increases by insurers and lenders, and potential increases in taxation of the mining and metals sector.
Should the mining and metals sector not respond quickly enough to meeting globally accepted science-based reductions required to mitigate the long-term impacts of climate change, industry members may be subject to an increased risk of future climate litigation. In the U.S. and Canada, lawsuits have been filed against oil and gas companies to assign liability for climate-related impacts. Over time, litigation may also apply to other resource intensive sectors that fail to set and/or meet long-term reduction targets. While the Company is not currently subject to any lawsuits related to climate, no assurances can be provided that similar suits will not be brought in the future.
Our ability to meet our climate strategy goals and aspirations, including our Scope 1, Scope 2, and Scope 3 emissions targets, is subject to numerous risks and uncertainties and relies on, among other things, our ability to invest in emissions reduction projects, our ability to implement operational changes and the availability of technology to achieve such commitments and goals. In addition, our ability to achieve our Scope 3 emissions targets remains highly uncertain and is subject to the actions of entities not within our control. There is also a risk that some or all of the expected benefits of achieving such targets and goals may fail to materialize within our anticipated time frames or at all. Investors and other stakeholders may not agree with our climate strategy, and we also face pressure from some in the investment community and certain public interest groups to limit the focus on ESG in our decision-making, arguing that ESG considerations do not relate to financial outcomes. A failure to meet our climate strategy targets and goals and/or societal or investor expectations could result in damage to our reputation, decreased investor confidence and challenges in maintaining positive community relations, which can pose additional obstacles to our ability to conduct our operations and develop our projects, which may result in a material adverse impact on our business, financial position, results of operations, and growth prospects. Further, the interest rate of Newmont’s $1 billion aggregate principal amount of 2.6% Sustainability-Linked Senior Notes due 2032 is linked to Newmont’s performance against certain ESG commitments regarding 2030 emissions reduction targets and the representation of women in senior leadership roles target. As such, a failure to meet our climate and sustainability targets will result in further expense.
Our targets are unique to our business, operations and capabilities, which do not easily lend to benchmarking against similar sustainability performance targets, and the related performance, of other companies. In addition, our climate-related targets are aspirational and subject to change, and reflect assumptions that are necessarily uncertain and may not be realized. We continue to review and revise our approach, and our targets may be further adjusted to align with future updates to our approach. The acquisition of Newcrest Mining Limited in late 2023 required that we recalculate the target baseline years and trailing years GHG emissions data pursuant to our publicly disclosed greenhouse gas emissions calculation methodology framework. Additional rebaselining was required to reflect Newmont’s portfolio following the sale of non-core operating assets in 2025, and may be required again in the future. We are continuing to review our targets and roadmap which may result in additional adjustments in the future. Additionally, the methodologies that we use to calculate our Scope 1, Scope 2 and Scope 3 GHG emissions may change over time based upon changing industry standards, which may impact, positively or negatively, our ability to satisfy our targets, which could in turn adversely affect our reputation. Any major acquisition, merger, consolidation or divestiture or any series of related acquisitions, mergers, consolidations or divestitures, by or involving us, may impact our ability to achieve our targets and commitments. There is currently no generally accepted global definition (legal, regulatory or otherwise) of, nor market consensus as to what criteria qualify as, “green,” “social,” “sustainable” or “sustainability-linked” (and, in addition, the requirements of any such label may evolve from time to time), and therefore no assurance is or can be given that Newmont will meet any or all investor expectations.
Our operations and projects are subject to a range of transitional and physical risks related to climate change.
We believe that climate change has the potential to impact the regions and sites in which Newmont operates, as well as the surrounding communities. Long-term potential physical climate risks include, but are not limited to, higher temperature in all regions, higher intensity storm events in all regions, impacts to annual precipitation depending upon the latitude and proximity of the site to oceans, and more extreme heat for sites near the equator or in Australia. Unusually dry climates can increase the chance of our operations being impacted by bush or forest fires.
Physical risks related to extreme weather events such as extreme precipitation, flooding, longer wet or dry seasons, flooding and drought conditions, increased temperatures, sea level rise, landslides, mine flooding, tsunami, geysers and outbursts, avalanches, landslides, wildfires or brushfires, or more severe storms may have financial implications for the business. In particular, the effects of
33

Table of Contents
changes in rainfall and intensities, water shortages and changing storm patterns have from time to time adversely impacted, and may in the future adversely impact, our costs, production levels and financial performance. For example, we experienced severe flooding in early 2017 at our Tanami mine in Australia which led to shutdown of operations for several weeks. In 2019, Tanami completed the construction of a natural gas pipeline to deliver fuel to the site to replace diesel fuel that is trucked to the site on roads that regularly flood due to increasing seasonal rainfall. Our operations in Suriname and Peru have also experienced delays in connection with the delivery of key production supplies due to temporary flooding. In 2019, Cadia experienced droughts, which resulted in temporary process plant water shortages and lower processed volumes. In 2023, Lihir’s operating and financial performance was impacted by lower feed grade reflecting a higher proportion of low grade material being processed in the second half of the year, following extreme rainfall that limited pit access and caused materials handling issues at the mine crusher. This followed prolonged drought conditions across the province of New Ireland in PNG, where Lihir is located, which resulted in limited raw water supply to Lihir. Floods and wildfires have also occurred near Cadia and Red Chris in recent years. In late 2025, a bushfire that began in mid‑December affected the area surrounding our Boddington operations in Western Australia, resulting in a temporary suspension of operations. While major infrastructure remained secure and undamaged due to established bushfire preparedness protocols, portions of the site’s water supply infrastructure were impacted.
There is also the potential for disruption to transport routes associated with the distribution of our products. For example, Brucejack’s glacial access road, which is an essential means of entering that mine site, may be subject to a risk of thawing due to the potential for an increase in average temperatures, which may be related to climate change. Conversely, heavier‑than‑normal snowfall and severe winter storm conditions have the potential to obstruct transport routes and access roads to Brucejack and Red Chris. Severe storm events can also result in unpermitted off-site discharges, slope instability, mine pit erosion and structural failures, tailings storage facility overtopping and other impacts, including water storage and treatment facility capacity considerations. Extended dry seasons or unseasonal dry conditions could exacerbate dust generation from operating activities that may require additional controls for continued operation or result in compliance breaches. Changing climatic conditions may also affect the likelihood of meeting closure success criteria and require adjustments to mine site rehabilitation and closure plans. The higher potential for extreme heat conditions may affect equipment efficiency. For additional information, see risk factors under the headings “Our operations and projects are dependent on the availability of sufficient water supplies and subject to water-related risks” and “Our Company and the mining industry are facing continued geotechnical, geothermal and hydrogeological challenges, which could adversely impact our production and profitability.”
Such events can temporarily slow or halt operations due to physical damage to assets, reduced worker productivity for safety protocols on site related to extreme temperatures or lightening events, preservation of resources such as water, worker aviation and bus transport to or from the site, and local or global supply route disruptions that may limit transport of essential materials, chemicals and supplies, which could have an adverse impact on our results of operations and financial position. Additional financial impacts could include increased capital or operating costs to increase water storage and treatment capacity, obtain or develop maintenance and monitoring technologies, increase resiliency of facilities and establish supplier climate resiliency and contingency plans.
An increase in frequency and duration of extreme weather conditions can be followed by extended power outages. Energy disruptions can have an adverse impact on our results of operations and financial position due to production delays or additional costs to ensure business continuity through reliable sources of on-site power generation. Energy transmission and supply may be impacted by wildfires, such as those that occurred in Australia in 2020, which may interrupt electrical power transmission lines to mine sites, and that may pose risks to on-site facilities and energy generators, fuel dispensing systems and supplies. In jurisdictions that rely on purchased hydroelectric power, such as in Ghana and Peru, extreme drought and extended dry seasons may impact the electric utility’s water supplies needed to generate hydroelectric power purchased by the mine to run operations, which would result in higher costs and/or limit energy availability for continuity of operations as well as impact our environmental systems and processes.
Our Company and the mining industry are facing continued geotechnical, geothermal, and hydrogeological challenges, which could adversely impact our production and profitability.
Newmont and the mining industry are facing continued geotechnical, geothermal and hydrogeological challenges due to the older age of certain of our mines and a trend toward mining of more complex deposits, the use of deeper and larger pits and the use of deep, bulk or selective underground mining techniques. This leads to higher pit walls, more complex underground environments and increased exposure to geotechnical instability and geothermal and hydrogeological impacts. As our operations are maturing, the open pits at many of our sites are getting deeper and we have experienced geotechnical failures (such as pit wall and slope failures) at some of our mines, including, without limitation, at our operations in Australia, Ghana, Peru, Canada, and at NGM, in Nevada. See also the risk factor under the heading “Mining companies are increasingly required to consider and provide benefits to the communities and countries in which they operate in order to maintain operations.”
Additionally, there are a number of risks and uncertainties associated with the block cave mining methods applied at Cadia, in New South Wales, Australia. These risks include a cave not propagating as anticipated, excessive air gaps forming during the cave propagation, unplanned ground movement occurring due to changes in stresses released in the surrounding rock and larger or more frequent mining-induced seismicity than anticipated. Additionally, during cave establishment and propagation, higher levels of seismic activity, and higher likelihood of damage to excavations from seismic events, are expected. This has been observed during the cave establishment phase of Cadia’s PC2-3 project and is expected during the establishment of Cadia’s PC1-2 project in the coming years. Such seismic events and associated damage may require changes to the mining plan and upgrades to ground support systems, which could take several months. Large seismic events may also occur after cave establishment and propagation and during steady state
34

Table of Contents
caving, although the likelihood of this is lower. Excessive water ingress, disturbance and the presence of fine materials may also give rise to unplanned releases of material of varying properties and of water through drawbells. Cadia recorded sudden unplanned releases of both dry fine ore material and wet mud material through drawbells in 2023. In addition, in June 2025 two fall of ground incidents occurred in the access way to the underground work area of a non-producing project at the Red Chris Mine in British Columbia, Canada.
In addition, there are a number of risks and uncertainties associated with the application of techniques used in the civil engineering industry for the stabilization of steep open pit slopes by Newmont at Lihir, which is located in Papua New Guinea. These risks include variation to technical models when compared to actual conditions, performance of reinforcement system in hot ground and delays with the execution of the civil works due to lack of experience with these techniques. The success of our operations depends, in part, on implementing engineering solutions to particular geotechnical, hydrogeological and geothermal conditions. For example, underground operations, large vertical shafts need to be excavated in order to provide ventilation to the underground environment, and sometimes these shafts are excavated using unsupported techniques such as raiseboring, whereby the walls of the shafts cannot be supported until the excavation is completed. If adverse and unexpected geotechnical and hydrogeological conditions are encountered, the shaft walls may become unstable. To prevent this type of incident occurring, thorough geotechnical and hydrogeological investigations and stability assessments are required and, if needed, alternate excavation locations or techniques need to be implemented. One such shaft wall failure incident occurred at Cadia in 2022, resulting in the need to abandon and backfill a shaft shortly after the completion of excavation to prevent further unravelling of the shaft wall and potential interruptions to other operations.
Operations may also experience challenges to operating conditions, such as inundation, inrush of water or other materials, airblast and those relating to elevated temperatures (including management and discharge of hot water encountered in the underground workings). These risks could result in damage to, or destruction of, mineral properties, production facilities, equipment or other properties, personal injury or death of employees or third parties, environmental damage, community outrage, delays in mining, increased production costs, monetary losses and possible legal liability. Our operations are also subject to risks associated with a natural disaster, which include risk of tsunami, wildfires, mine flooding, geysers and outbursts, cyclones, avalanches and landslides. In addition, seismic activity may impact operations that are located in seismically active areas and subject to risks of earthquakes, such as Cadia and, with the related risks of tidal surge and tsunamis, Lihir. For instance, a large seismic event in 2017 impacted Cadia resulting in a temporary suspension of operations. Additionally, our Lihir operation is located within the Luise Caldera of the Luise Volcano which is located on the east coast of the Aniolam Island. The caldera is geothermally active in the form of hot springs and fumaroles.
Adverse geotechnical, geothermal and hydrogeological conditions, including surface or underground fires, floods, droughts, geysers and outbursts, coastal erosion and landslides, avalanches, cyclones and pit wall failures, can be difficult to predict. Such conditions are often affected by risks and hazards outside of our control, such as severe weather and considerable rainfall, which may lead to periodic floods, mudslides, wall instability and seismic activity, which may result in slippage of material. Such events may not be detected in advance.
In addition, Newmont has both operational (active and inactive) and closed tailings storage facilities ("TSFs") in a variety of climatic and geographic settings. Annually, Newmont manages and disposes approximately 150 million tonnes of milled rock slurry, referred to as tailings, that are placed within engineered or surface containment facilities, or placed as structural backfill paste in underground mines (e.g., Tanami). Newmont has experienced seepage and/or localized instability at TSFs which required us to re-evaluate our emergency response systems and make modifications to our TSFs. Issues with TSFs, such as instability, failure and/or seepage could occur in the future, and Newmont conducts detailed risk assessments considering potential failure modes to support understanding and development of risk mitigation measures in accordance with the As Low As Reasonably Practicable principle. The failure of a TSF embankment or a water storage dam at one of our mine sites could cause severe, and in some cases catastrophic, property and environmental damage and loss of life. For example, in early 2019, the extractive industry experienced a large-scale tailings dam failure at an unaffiliated mine in Brazil, which resulted in numerous fatalities and caused extensive property, environmental and reputational damage. Recognizing this risk, Newmont continues to review and refine our existing practices and, as a member of the ICMM, commits to implementation of the GISTM. Work is underway to bring all TSFs in our portfolio into conformance with the GISTM. Conformance with the GISTM as well as improved understanding of our tailings risks and requisite mitigation remains on-going and has and may continue to result in increases to our estimated sustaining costs and closure costs for existing tailings facilities. Despite these efforts, no assurance can be given that TSF failure events will not occur in the future.
A geotechnical failure of a TSF, dam, or pit slope could result in limited or restricted access to mine sites, suspension of operations, government investigations, regulatory actions or penalties, increased monitoring costs, remediation costs and other impacts, which could result in a material adverse effect on our results of operations and financial position.
A failure to safely resolve any unexpected problems relating to these conditions at a commercially reasonable cost may result in damage to infrastructure or equipment or injury to personnel and may adversely impact the Company’s operating results and financial position. See also the risk factors under the heading “We may experience increased costs or losses resulting from the hazards and uncertainties associated with mining” and “Damage to our reputation may result in decreased investor confidence, challenges in maintaining positive community relations and can pose additional obstacles to our ability to develop our projects, which may result in a material adverse impact on our business, financial position, results of operations and growth prospects” and “Our operations and projects are subject to extensive environmental laws and regulations.”
35

Table of Contents
Our operations and projects may be adversely affected by rising energy prices or energy shortages.
Our mining operations and development projects require significant amounts of energy. Some of our operations are in remote locations requiring long-distance transmission of power or energy sources needed to generate power, and in some locations we compete with other companies for access to third party power generators or electrical supply networks. A disruption in the generation or transmission of energy, inadequate energy transmission infrastructure or the termination of any of our energy supply contracts could interrupt our energy supply and adversely affect our operations.
Our principal energy sources are purchased electricity, diesel fuel, heavy fuel oil and natural gas. A variety of factors, including higher energy usage in emerging market economies, actual and proposed taxation of carbon emissions as well as concerns surrounding global conflicts, could result in increased demand or limited supply of energy and/or sharply escalating diesel fuel, natural gas and other energy prices. A reduction in Northern Territory natural gas production is a specific concern for Tanami’s short-term energy prices. Availability of renewable power sources or conflicting government regulations, such as the proposed reform of the energy market in Mexico, may have an impact on our ability to meet our reduction targets with a specific timeline. Changes in energy laws and regulations in various jurisdictions, restrictions on energy supply and increased energy prices could negatively impact our operating costs and cash flow.
As our operations move to reduce our GHG emissions, renewable power sources and technology at our operations will continue to be evaluated and implemented. Such transitions are likely to require capital expenditures and may result in additional costs. Certain of our operations may also become more dependent upon access to electrical power supply as certain mines advance projects aimed at the electrification of large haulage fleets. The availability to access renewable power (with greater competition) and the readiness of technology to support decarbonization with the timeframe of the 2030 and 2050 targets remains subject to uncertainties, which could impact ability to achieve targets. See the risk factor above under the heading “Our operations and projects are subject to a range of risks related to transitioning the business to meet regulatory, societal and investor expectations for operating in a low-carbon economy.”
Our operations and projects are dependent on the availability of sufficient water supplies and subject to water-related risks.
We recognize the right to clean, safe water and that reliable water supplies are vital for hygiene, sanitation, livelihoods and the health of the environment. Water is also critical to our business, and the increasing pressure on water resources requires us to consider both current and future conditions in our management approach. We have set annual water efficiency targets at each of our operating sites. Additionally, we aim to achieve ambitious long-term water stewardship actions, which integrate our operations and value chain and support collective management of water through external partnerships and collaborations. A failure to meet our water targets and/or societal or investor expectations could also result in damage to our reputation, decreased investor confidence and challenges in maintaining positive community relations, which can pose additional obstacles to our ability to develop our projects, which may result in a material adverse impact on our business, financial position, results of operations and growth prospects.
Across the globe, water is a shared and regulated resource. Newmont operates in areas where watersheds are under stress with limited supply, increasing population and water demand, and impacted water in various forms. Increasing pressure on water use may occur due to in-migration of communities and increased populations in proximity to our operations. Although each of our operations currently has sufficient water rights, claims and contracts to cover its operational demands, we cannot predict the potential outcome of pending or future legal proceedings or community negotiations relating to our water rights, claims, contracts and uses.
Water shortages and surplus may also result from weather or climate impacts outside of the Company’s control. Changes in the quantity of water, whether in excess or deficient amounts, may impact exploration and development activities, mining and processing operations, water management and treatment facilities, tailings storage facilities, closure and reclamation efforts, and may increase levels of dust land erosion and wildfires in dry conditions, and increase slope instability and the risk of water ingress in the case of prolonged wet conditions.
Our Peñasquito operation is situated in an area with high baseline water stress. Peñasquito in Mexico takes its water supply from the Cedros Aquifer which has limited and declining yield as it is located in a dry and arid area that is prone to drought, and also is relied upon by nearby communities as a water supply for drinking water and agriculture. The water supply at Peñasquito is thus subject to a significant degree of regulatory and community scrutiny, and increased costs, and Peñasquito has made long-term commitments to provide safe community water supplies.
Seasonality and changes in the levels of rainfall can also impact our operations. For example, in January 2023, our Tanami site in Australia experienced unexpected and significant rain resulting in flooding and road closure limiting our ability to get supplies to the site, causing mill backup and impacts to production. Similarly, at Boddington in Australia severe weather and heavy rainfall at Boddington caused delays and impacted productivity during the third quarter of 2021 and 2022. There is also a risk at Boddington that extended below average rainfall or the occurrence of drought in southwest Australia could impact raw water supply for the site. While we have incorporated systems to address the impact of the dry season and water shortages as part of our operating plans, we can make no assurances that those systems will be sufficient to address all shortages in water supply, which could result in production and processing interruptions.
36

Table of Contents
In 2023, Lihir’s performance was impacted following extreme rainfall limiting pit access and causing material handling issues at the crushers. Lihir has also experienced reduced milling rates due to limited raw water supply to the plant driven by drought conditions experienced across the New Ireland Province in PNG. Lihir has progressed options to improve its water management resilience, including improving its internal water recycling and identifying additional water sources and storage options. In addition, Cadia has previously experienced water scarcity from drought conditions in 2019 which resulted in a reduction in water use to assist the Orange community response to the drought.
Increased precipitation and severe storm events may potentially impact tailings storage facilities in the future by exceeding water management capacity, overtopping the facility, and/or undermining the geotechnical stability of the structure. We have experienced impacts at various sites in recent years due to heavy rainfall and severe storms. For example, in 2022, Yanacocha experienced heavy rainfall, above average historical levels, which resulted in significant water balance stress and required active emergency management. Refer to Note 24 to the Consolidated Financial Statements under the heading Environmental Matters - Minera Yanacocha S.R.L, for additional information. Increased amounts of water may also result in flooding of mine pits, maintenance and storage facilities; or may exceed current water management and treatment capacity to store and treat water, physical conditions resulting in an unintended overflow and discharge either on or off of the mine site property. See the risk factor above under the heading “Our operations and projects are subject to a range of risks related to transitioning the business to meet regulatory, societal and investor expectations for operating in a low-carbon economy” for additional information.
Operations have identified seepage from infrastructure (tailings, waste rock and ore stockpiles) that may have an impact on water resources (groundwater and/or surface water); for example, seepage has been detected in the shallow and deep aquifers underlying the tailings facility at Red Chris. We are currently managing this risk through monitoring, collection and treatment systems. There is a risk that the seepage could have an impact on beneficial use of groundwater resulting in increased requirements for collection and treatment as well as the potential requirement to provide alternative water sources. See also the risk factor under the heading “Our Company and the mining industry are facing continued geotechnical, geothermal and hydrogeological challenges, which could adversely impact our production and profitability.”
Laws and regulations may be introduced in some jurisdictions in which we operate which could limit our access to sufficient water resources in our operations, thus adversely affecting our operations. Additionally, laws, regulations and permit requirements focused on water management and discharge requirements are becoming increasingly stringent and may continue to require additional water management activities and/or water treatment during operation and into closure. We are also seeing increasingly stringent regulations of surface and groundwater at a number of our sites resulting in increased monitoring and potentially the need for pump back systems and treatment in the future. New requirements and regulation have resulted or may result in increased costs and could negatively impact our operating costs and cash flows in the future.
For more information on the Company’s reclamation and remediation liabilities, refer to Notes 6 and 24 to the Consolidated Financial Statements, and the risk factor under the heading “Mine closure, reclamation and remediation costs for environmental liabilities may exceed the provisions we have made.”
Our operations and projects are subject to risks related to our relationships and/or agreements with local communities, including Indigenous Peoples, and laws for the protection of cultural heritage.
The Company’s relationships with the communities that are located near its operations or on whose land it operates are essential to the success of its existing operations, exploration activities and the construction and development of its projects. A failure to manage relationships with such communities may lead to local dissatisfaction which, in turn, may lead to interruptions to the Company’s operations, exploration activities and development projects. Specific challenges in community relations include community concerns over management of increased traffic, migratory workforces, environmental impacts and resource depletion, social, environmental and cultural heritage impacts, increasing expectations regarding the level of benefits that communities receive, benefits sharing with Indigenous peoples’ governments, concerns focused on the level of transparency regarding the payment of compensation and the provision of other benefits to affected landholders and the wider community. In particular, opposition by Indigenous communities to the Company’s activities may require modifications to or preclude operation or development of its projects or may require entry into additional agreements with Indigenous communities, which may result in additional costs. Newmont’s current and future operations are subject to a risk that one or more Indigenous communities in the locations in which we operate may oppose continued operation, further development or new development of its projects or operations. Claims and protests driven by such opposition may disrupt or delay activities, including permitting, at the Newmont’s operations and projects. The negotiation and review of agreements, including components such as business development, participation, co-management and compensation and other benefits, involve complicated and sensitive issues, associated expectations and often competing interests. The nature and subject matter of these negotiations may result in community unrest which, in some instances, may lead to interruptions in our exploration programs, operational activities or delays to project implementation or development.
Additionally, the evolving obligations of governments and Indigenous people under international, national and local legislation and international conventions pertaining to the rights of Indigenous people may impact Newmont’s operations and projects. For example, the Government of British Columbia, Canada has adopted the Declaration on the Rights of Indigenous Peoples Act (2019) to implement the United Nations Declaration on the Rights of Indigenous Peoples ("UNDRIP") in British Columbia, which may impact Red Chris and Brucejack.
37

Table of Contents
Our operations are also subject to laws and regulations that provide for the protection and management of cultural heritage in the jurisdictions in which we operate. For example, following the destruction of Indigenous heritage sites at Juukan Gorge in Western Australia in 2020 and the inquiry and reports issued by the Commonwealth Parliament Joint Standing Committee on Northern Australia in 2021, mining companies have come under heightened scrutiny regarding cultural heritage management, including, for example, with respect to their governance and management processes and procedures around cultural heritage, engagement with Indigenous communities and protection of cultural landscapes. Although the parliamentary inquiry focused on Indigenous cultural heritage, laws to protect and manage cultural heritage also cover non-Indigenous (historic) heritage. Another example, in Western Australia, where Boddington is located, a new Aboriginal Cultural Heritage Act 2021 (WA) came into force in 2023, replacing the Aboriginal Heritage Act 1972 (WA) and introducing new offenses and increased penalties aimed at better protecting Aboriginal cultural heritage in Western Australia. In 2023, the WA Premier announced that the Aboriginal Cultural Heritage Act 2021 (WA) will be completely repealed, with an amended Aboriginal Heritage Act 1972 (WA) replacing it.
Further, cultural heritage in PNG is protected under the National Cultural Property (Preservation) Act 1965 (PNG). The main government bodies responsible for enforcing this Act are the National Museum and Art Gallery of PNG and the National Cultural Commission. The Lihir operation has a culturally significant site called the Ailaya Rock, located near the mining operations. Significant civil reinforcement work is being undertaken to protect the surrounding area's structural integrity. A failure to maintain the integrity of the surrounding area could inadvertently damage the site, resulting in impacts to community relations and reputation.
Newmont’s operations could inadvertently disturb protected cultural heritage assets, resulting in international scrutiny by investors and non-governmental organizations, negative impact on stockholder value, compensation and/or offset claims, increased costs to projects and operations, delays impacting construction or production or project development, court action or other legal proceedings and lasting reputational damage.
Risks Related to the Jurisdictions in Which We Operate
Our operations and projects are subject to risks of doing business in multiple jurisdictions.
Exploration, development, production and mine closure activities are subject to regional, political, economic, community and other risks of doing business in multiple jurisdictions, including:
•Potential instability of foreign governments and changes in government policies, including relating to or in response to changes of U.S. laws or foreign policies;
•Expropriation or nationalization of property;
•Restrictions on the ability to pay dividends offshore or to otherwise repatriate funds;
•Restrictions on the ability of local operating companies to sell gold and other metals offshore for U.S. dollars, or on the ability of such companies to hold U.S. dollars or other foreign currencies in offshore bank accounts;
•Import and export regulations, including restrictions on the export of gold, copper, silver, lead and/or zinc;
•Disadvantages relating to submission to the jurisdiction of foreign courts or arbitration panels or enforcement or appeals of judgments at foreign courts or arbitration panels against a sovereign nation within its own territory;
•Royalty and tax increases or claims, including retroactive increases and claims and requests to renegotiate terms of existing investment agreements, contracts of work, leases, royalties and taxes, by governmental entities, including such increases, claims and/or requests by the governments of Argentina, Australia, Canada, Chile, the Dominican Republic, Ecuador, Ghana, Mexico, Papua New Guinea, Peru, Suriname, the State of Colorado and the State of Nevada in the U.S.;
•Changes in laws or regulations in the jurisdictions in which we operate, including in changes resulting from changes in political administrations;
•Risk of increased taxation related to impacts to government revenue as a result of challenging socioeconomic conditions, including recessions and/or in connection with heath and community emergencies, such as pandemics, epidemics or outbreaks, and climate events;
•Fines, fees, and sanctions imposed for failure to comply with the laws and regulations of the jurisdictions in which we operate;
•Risk of loss due to inability to access our properties or operations;
•Other risks arising out of foreign sovereignty over the areas in which our operations are conducted, including risks inherent in contracts with government owned entities such as unilateral cancellation or renegotiation of contracts, licenses or other mining rights;
•Delays in obtaining or renewing, or the inability to obtain, maintain or renew, necessary governmental permits, mining or operating leases and other agreements and/or approvals;
•Risk of loss due to civil strife, acts of war, guerrilla activities, insurrection and terrorism;
•Claims for increased mineral royalties or ownership interests by local or Indigenous communities;
38

Table of Contents
•Increased expectations of local Indigenous communities for profit or other benefit sharing;
•Risk of loss due to criminal activities such as trespass, blockade, local artisanal or illegal mining, organized crime by drug cartels, theft and vandalism;
•Delays in obtaining or renewing collective bargaining or certain labor agreements, workforce unionization, or demand for profit sharing;
•Disadvantages of competing against companies from countries that are not subject to the rigorous laws and regulations of the U.S. or other jurisdictions, including without limitation, the U.S. Foreign Corrupt Practices Act, the U.K. Bribery Act and the Dodd-Frank Act;
•Increases in training and other costs and challenges relating to requirements by governmental entities to employ the nationals of the country in which a particular operation is located;
•Increased financing costs;
•Currency fluctuations, particularly in countries with high inflation;
•Foreign exchange controls;
•Increases in costs relating to, or restrictions or prohibitions on, the use of ports for concentrate storage and shipping, such as in relation to our Boddington operation where use of alternative ports is not currently economical, or in relation to our ability to procure economically feasible ports for developing projects;
•Risk of disruption, damage or failure of information technology systems, and risk of loss and operational delays due to impacts to operational technology systems, such as due to cyber-attacks, malicious software computer viruses, security breaches, design failures and natural disasters;
•Risk of loss due to disease, such as malaria or the zika virus, and other potential medical endemic or pandemic issues, such as Ebola or COVID-19, as a result of the potential related impact to employees, disruption to operations, supply chain delays, trade restrictions and impact on economic activity in affected countries or regions; and
•Disadvantage and risk of loss due to the limitations of certain local health systems and infrastructure to contain diseases and potential endemic health issues.
Consequently, our exploration, development and production activities may be affected by these and other factors, many of which are beyond our control, some of which could materially adversely affect our financial position or results of operations.
New or changing legislation and tax risks in certain operating jurisdictions could negatively affect us.
We have operations and conduct business in a number of jurisdictions, which may increase our susceptibility to sudden tax changes. For instance, a 12% export duty was imposed by the Argentina government in 2018, revised down to 8% thereafter, however, with the election of new government in 2023, the rate is now currently 0%. The state of New South Wales, Australia, passed 2023 legislation that imposes an increased stamp duty which materially affected the Newcrest transaction. Also in Australia, the Debt Deduction Creation Rules, introduced during 2024 and which will first apply to the 2025 year, could have the potential to limit the tax deductibility of intercompany interest expense. In the State of Zacatecas, Mexico, environmental taxes became effective in 2017 with little clarity on how the taxes are to be calculated. Ecological tax agreements were executed which provided clarity for 2021 to 2024, after which, the Company, along with other companies in the State of Zacatecas, continue to need to engage with governmental authorities to understand how the environmental tax would be levied year-over-year. The current governmental authorities are currently seeking to renegotiate the scope and manner of tax calculation for purposes of the 2025 to 2027 tax period, which includes request for expansion of taxable volumes of extracted materials. The Company continues to engage with the government to align renewal terms with the prior agreements. However, if the change to tax extraction volumes is imposed by the government, it would result in significantly higher tax obligations and would materially impact financial results. With the expected election of state governor in 2027, a change in government authorities will also result in more uncertainty of this environmental tax calculation in future years. Also, in Mexico, a 2021 tax reform bill passed which eliminated the tax benefit to offset mining fees with mining tax. Furthermore, a new Economic Plan for 2022 was enacted. While the changes under the plan are not substantive in nature (in the sense that they do not create new taxes or increase applicable rates), they may increase the future cost of our compliance and pose additional uncertainties in application of the law and further reforms could be proposed in the future. Further, the Mexican government has increased the mining tax rate from 7.5% to 8.5%, and 0.5% to 1% for gold, silver, platinum sales, both effective on January 1, 2025, which remains in effect but subject to potential change in the future. In Australia, the policy of allowing mining companies to benefit from fuel tax credits has been under increasing pressure, any changes to related regulations would impact the Company. In the United States, at the federal and state level, regulatory changes which may be implemented in the area of tax reform remain uncertain and may adversely affect companies in the mining sector. For example, NGM could be impacted by the resolutions brought to the State of Nevada Legislature to amend the State Constitution to increase mining taxes. An example of this was the passing of Assembly Bill 495 in 2021 that results in a new excise tax on mining companies engaged in the business of extracting gold and silver in the state of Nevada. In 2024, Pillar II has been enacted in a number of countries. The Pillar II agreement was signed by 138 countries with the intent to equalize corporate tax around the world by implementing a global minimum tax of 15%. As Newmont primarily does business
39

Table of Contents
in jurisdictions with a tax rate greater than 15%, the Company does not anticipate a material impact to its financial statements. A number of changes in the laws, regulations and policies in PNG have recently been proposed or are currently being considered. See the risk factor under the heading “Our operations at Lihir and project at Wafi-Golpu in PNG are subject to political and regulatory risks and other uncertainties.” Taxation laws and other regulations of the jurisdictions in which we operate are complex, subject to varying interpretations and applications by the relevant tax authorities and subject to changes and revisions in the ordinary course. It is difficult to predict whether proposed changes to regulations will be passed or to what extent they will impact the Company. Any additional and/or unexpected taxes imposed on us could have a material and adverse impact on our Company. See also the risk factor under the heading “Our operations and projects are subject to a range of risks related to transitioning the business to meet regulatory, societal and investor expectations for operating in a low-carbon economy” for a discussion of uncertainties and potential tax increases in connection with climate change considerations.
Changes in mining or investment policies or shifts in political and social attitudes in the jurisdictions in which we operate may adversely affect our operations or profitability.
Our operations may be affected in a number of ways by laws and regulations related, but not limited to: restrictions on production; price controls; export controls; import restrictions, such as restrictions applicable to, among other things, equipment, services and supplies, currency remittance, income taxes, expropriation of property, foreign investment, maintenance of mineral, mining, or surface land tenure, environmental legislation, land use, surface land access, land claims of local communities, water use, and mine safety. Failure to comply strictly with applicable laws, regulations and local practices relating to applying for and maintaining land and tenure could result in loss, reduction or expropriation of entitlements, or the imposition of additional local or foreign parties as partners with carried or other interests, any of which may adversely affect our operations or profitability.
In addition, when governments struggle with deficits and concerns over the potential and actual effects of depressed economic conditions, many of them have in the past, and may in the future, target the mining and metals sector in order to raise revenue. Governments are continually assessing the fiscal terms of the economic rent for a mining company to exploit resources in their countries. Numerous countries have implemented changes to their mining regimes that reflect increased government control over or participation in the mining sector, including, but not limited to, changes of law affecting foreign ownership and takeovers, mandatory government participation in mining enterprises, taxation and royalties, working conditions, rates of exchange, exchange controls, exploration licensing, export duties, requirements to sell to the government, repatriation of income or return of capital, environmental protection, as well as requirements intended to boost the local economy, including usage of local goods and employment of local and community staff or contractors, among other benefits to be provided to local residents. The effects of the various requirements and uncertainties related to the economic risks of operating in foreign jurisdictions cannot be accurately predicted and could have a material adverse effect on our financial position or results of operations. Some concern exists with respect to investments in parts of the world where civil unrest, war, nationalist movements, political violence or economic crises are possible. These countries may also pose heightened risks of expropriation of assets, business interruption, increased taxation or unilateral modification of concessions and contracts. We do not maintain insurance policies against political risk. Occurrence of events for which we are not insured may affect our results of operations and financial position.
Our operations at Yanacocha and projects in Peru are subject to political and social unrest risks.
Minera Yanacocha S.R.L. (“Yanacocha”), including the mining operations at Yanacocha and the Conga project in Peru, has been the target of local political and community protests, some of which blocked the road between the Yanacocha mine and Conga project complexes and the City of Cajamarca in Peru and resulted in vandalism and equipment damage. While recent roadblocks and protests have diminished, and there is focus on local political activism and labor disputes, we cannot predict whether similar or more significant incidents will occur in the future. The recurrence of significant political or community opposition or protests could continue to adversely affect the continued operation of Yanacocha and other projects in the area.
Construction activities on our Conga project were suspended in 2011, at the request of Peru’s central government following protests in Cajamarca by anti-mining activists led by the regional president. Based on the Company's internal project portfolio evaluation process, we have reprioritized other projects ahead of the Conga project, and therefore do not anticipate developing Conga in the next ten years. As a result, the Conga project is currently in care and maintenance and we will continue to evaluate long-term options to progress development of the Conga project. Should the Company be unable to develop the Conga project or conclude that future development is not in the best interest of the business, a future impairment charge may result.
The prior Central Government of Peru supported responsible mining as a vehicle for the growth and future development of Peru. However, following the presidential election in 2021, there has been considerable political unrest in Peru. In a close and contested election, Pedro Castillo was declared the president-elect of Peru in July 2021, which resulted in a period of protests, unrest and uncertainty around the political and social environment in Peru and Cajamarca. Amidst political turmoil and instability, Castillo was ultimately removed from office in late 2022 due to his attempt to dissolve the legislative body and install an emergency government. Political turmoil and division has continued in Peru as protest and demonstrations against the current President Dina Boluarte escalated in early 2023 resulting in clashes with security forces and violence. In October 2025, the Congress declared the vacancy of President Dina Boluarte, assuming the presidency of José Jerí, making him the eighth Peruvian president in less than a decade. In February 2026, Peru's Congress voted to impeach José Jerí, resulting in further political uncertainties. General elections are scheduled to be held in Peru in April 2026, which will also be impactful to the political and social environment in Peru.
40

Table of Contents
The current Central Government’s legislative priorities and support for responsible mining in Peru remains uncertain. Previous regional governments of Cajamarca and other political parties actively opposed certain mining projects in the past, including by protests, community demands and road blockages, which may occur again in the future. We are unable to predict the positions that will be taken by the Central or regional government and neighboring communities in the future and whether such positions or changes in law will affect current operations and new projects in Peru. Risks related to mining and foreign investment under the new administration include, without limitation, risks to mineral, mining and surface, land tenure and permitting, increased taxes and royalties, nationalization of mining assets and increased labor regulations, environmental and other regulatory requirements. Any change in government positions or laws on these issues could adversely affect the assets and operations of Yanacocha or other projects in Peru, which could have a material adverse effect on our results of operations and financial position. Additionally, the inability to operate or expand at Yanacocha could have an adverse impact on our growth and production in the region. See also the risk factor under the heading “Mine closure, reclamation and remediation costs for environmental liabilities may exceed the provisions we have made” and refer to Note 1 to the Consolidated Financial Statements regarding the Company’s interest in Yanacocha.
Our Merian operation in Suriname is subject to political, security and economic risks.
We hold a 75% interest in the Merian gold mine (“Merian”) in the mid-eastern part of Suriname. Suriname has experienced political instability and uncertainty in the past which may continue in future years. Suriname is faced with high debts to foreign creditors, significant inflation rates and has experienced, and may in the future experience, a hyperinflationary economy. Significant devaluation of the Surinamese dollar against the U.S. dollar in recent years has resulted in an increase of the prices of certain goods and services within Suriname, including without limitation, the price of fuel, which had been subsidized by successive governments. The government of Suriname passed a new law to introduce Value Added Tax, which came into effect in 2023 and has drastically increased the cost of living and negatively impacts the purchasing power of the residents of Suriname, including our employees. These impacts and negative economic trends can cause social unrest, which may present risks for our operations in Suriname.
Operations and development in Suriname are governed by a mineral agreement with the Republic of Suriname. The mineral agreement was approved by parliament and requires approval by parliament to change. However, in 2021, the government made requests for prepayment of taxes and special solidarity payments in light of budgetary concerns, it is possible that the government may request changes to the mineral agreement in the future. While the government is generally considered by the Company to be mining friendly, it is possible that the current or future government may adopt substantially different policies, make changes in taxation treatment or regulations, take arbitrary action which might halt operations, increase costs, or otherwise impact mining and exploration rights and/or permits, any of which could have a material and adverse effect on the Company's future cash flows, earnings, results of operations and/or financial condition.
The government of Suriname previously exercised an option to participate in a fully-funded 25 percent equity ownership stake in Merian. Suriname manages its participation through Staatsolie Maatschappij Suriname N.V. (“Staatsolie”), a Surinamese corporation with the Republic of Suriname as sole stockholder. If Staatsolie does not have sufficient funds or borrowing ability to make their capital commitments in accordance with the terms of the partnership agreement, our operations in Suriname could be impacted. See the risk factor under the heading “Future funding requirements may affect our business, our ability to pay cash dividends or our ability to engage in share repurchase transactions.” Earlier in this section under “Risks Related to Our Business.”
The government of Suriname has amended its immigration laws such that business visas can no longer be used for rotational expatriates, and a residence permit will be required from Q4 2025 on. The process and requirements for approval of residence permits have also been heightened. The restrictions on expatriates may impact our ability to hire and retain skilled and experienced workers for core technical roles. Additionally, collective agreement negotiations has been protracted for eighteen months as at December 2025 and currently at the mediation board stage. Inability for both parties to reach agreement poses risk of labor unrest, strikes and business continuity. See "Risks Related to Our Workforce" for additional information on labor risks.
Our operations at Ahafo South and Ahafo North in Ghana are subject to political, economic and other risks.
Newmont operates in Ghana pursuant to a Revised Investment Agreement ratified by Ghana’s Parliament in 2015, which established a fixed fiscal and legal regime, including fixed royalty and tax rates, for Newmont operations in Ghana. The tenure of the Revised Investments Agreement is linked to the mining leases. The financial and tax stability periods established by such agreements expired on December 31, 2025 which results in loss of tax advantages and tax protection. Upcoming Regulatory changes in the mining law, the royalties, and the local content enhancement provides exposures for the future.
Ghana is showing signs of economic recovery from the worsening socioeconomic conditions in recent years. The recovery has been marked by decline in inflation from 23.8% in December 2024 to 5.4% in December 2025; the Ghana cedi has appreciated by 29% year-to-date as of December 2025; building up of international reserves and renewed investor confidence. Ghana’s sovereign credit ratings have recently been upgraded by Fitch, S&P, and Moody's reflecting the progress being made in its economic recovery. In spite of the positive economic recovery, the country continues to be under the IMF program for support, signaling progress but not completely out of the conditions that got Ghana to seek an IMF support program. The Government continues to be under pressure for more revenue generation, keeping in place levies such as the Growth and Sustainability Levy (introduced in 2023) and the Emissions Levy and VAT on electricity. The Government of Ghana has announced plans to amend the country’s mineral royalty regime by replacing the current maximum 5% royalty rate with a sliding scale ranging from 5% to 12%, linked to prevailing gold prices. The
41

Table of Contents
proposed amendment was submitted to Parliament in December 2025, and is expected to be considered when parliamentary sessions resume in early February 2026. If enacted, the revised royalty framework could increase the Company’s operating costs at its Ghanaian operations, particularly during periods of higher gold prices. The timing, final structure, and implementation mechanisms of the proposed regime remain uncertain.
Other risks include impacts to supply chain, restrictions and local procurement requirements under local content regulations. In January 2025, the Minerals Commission published the 6th edition of the Local Procurement List which includes a prohibition on mining by mining lease holders and requiring surface mining operations to be outsourced to companies with 100% Ghanaian stockholders and directors and underground operations to be outsourced to companies with 50% Ghanaian stockholders and directors. The Ghana Chamber of Mines, of which Newmont is a member, is reviewing the list and continues to engage the government to revise its position on this prohibition on owner mining. Additionally, there is a risk of increase in key commodity prices, more restrictive local banking requirements including requirements for repatriation of proceeds to banks domiciled in Ghana, limitations on capacity of banks to provide reclamation bonds, requests for further local employment requirements, requests for contract renegotiation and increases in contract rates and other costs. The government may grant artisanal mining rights or alternative mining rights, such as sand and gravel, in locations in which the Company has tenure rights, but no active operations, impacting the Company’s non-operational land positions. Economic setbacks and anti-mining sentiment can also result in an increase in community frustration and friction with artisanal small-scale mining resulting in conflicts, which can negatively impact our operations in Ghana.
Our operations in Argentina are susceptible to risk as a result of economic and political instability in Argentina and labor unrest.
With the election of a new President at the end of 2023, the economic environment in Argentina has experienced stabilization during 2024 and 2025. Although inflation was drastically reduced, it still is at a high level and will remain as a challenge. In October 2025, the National Government won the mid-term elections which considerably increased its representation in Congress, giving the Government more power to push the reforms in 2026. Despite this result, there continue to be risks relating to the uncertain and unpredictable political and economic environment in Argentina, especially at the provincial level in Santa Cruz where our Cerro Negro mine is located. Argentina’s central bank instituted a number of foreign currency controls in an effort to stabilize the local currency. Although some flexibility has been introduced, major restrictions and controls remain in place. For information on Argentina’s foreign currency controls and their effect on our operations, see the section titled “Foreign Currency Exchange Rates” in Item 7, Management’s Discussion and Analysis of Consolidated Financial Condition and Results of Operations. Maintaining operating revenues in Argentine pesos could expose us to the risks of peso devaluation and high domestic inflation.
In January 2026 the Argentinian province of Santa Cruz enacted the 90/10 employment law with the goal to ensure that local residents receive the majority of jobs in key industries, including mining. If required to comply, Newmont’s operations in the Santa Cruz Province would be required to employ 90% of its workforce from the Santa Cruz Province. Exceptions may be provided, subject to government discretion, and there is no guarantee this requirement can be met due to the lack of local technical resources.
In recent years, we experienced work stoppages by miners represented by unions at the Cerro Negro Mine. Disruptions may arise again in the future with the unions at the Cerro Negro mine that could adversely affect access to, and operations at, the Cerro Negro Mine. Collective agreements for two Unions are due for negotiations in the first quarter of 2026. For more information see the risk factor under the heading “Our business depends on good relations with our employees.”
Our operations at Lihir and project at Wafi-Golpu in PNG are subject to political and regulatory risks and other uncertainties.
Our Lihir operation, which comprises an open pit mine that produces gold doré, is located on the island of Aniolam, PNG. We also hold a 50% interest in a joint venture that owns the Wafi-Golpu exploration project (“Wafi-Golpu” and such joint venture, “WGJV”), which is located in the province of Morobe, PNG. The current PNG administration, led by Prime Minister James Marape, has stated that it wants to increase benefits for PNG from extractive projects. Potential policy changes could include introducing a new production sharing regime for minerals and/or oil/gas, amending or replacing the PNG Mining Act of 1992, introducing domestic processing/refining requirements, changing the level and manner of local equity participation in projects and introducing new taxation regimes, banking and foreign exchange controls and/or controls pertaining to the holding of cash and remittance of profits and capital to parent companies. Any such change could impact our operating results and financial condition.
In 2020, the PNG Government announced that the special mining lease ("SML") for the Porgera mining operation (a major mining operation in PNG which was owned and operated by the Porgera JV and not Newmont) would not be renewed. It subsequently amended the Mining Act and issued a new SML for Porgera to Kumul Mineral Holdings Limited (a State-owned company). Since taking this decision, the PNG Government has been working with the Porgera JV participants and other key stakeholders to establish new arrangements for restarting and operating Porgera. During 2023, the parties signed various agreements and the Government passed specific enabling legislation for a restart of operations at Porgera under new commercial terms. The restart occurred in December 2023. The PNG Government has stated that the decision not to renew the Porgera SML is specifically related to environmental damages claims and resettlement at the Porgera mine and has no bearing on any other operations, including Lihir, or advanced exploration projects, including Wafi-Golpu.
42

Table of Contents
In 2020, the PNG government prepared and submitted to the National Parliament of PNG (the “PNG Parliament”) a proposed new organic law to introduce a production sharing regime for the mining sector. The proposed organic law will require the approval of a two thirds majority of the PNG Parliament and, if passed in its current proposed form, purports to transfer ownership of minerals from the State of PNG to state-owned entities who would then be responsible for negotiating mineral production sharing arrangements. As currently drafted, the bill containing the proposed organic law will not apply to Lihir, but could potentially apply to Wafi-Golpu if a mining lease or mining development contract is not in place before the effective date for the proposed organic law. The bill is yet to be debated in the PNG Parliament. In December 2024 Prime Minister Marape reaffirmed the Government’s intention to reform PNG’s mining and oil/gas laws as part of PNG’s 50th anniversary of independence in 2025 and indicated a production sharing regime for minerals and/or oil/gas remains under consideration.
In October 2021, Prime Minister Marape announced proposed legislation which, if enacted, would regulate the export of gold from PNG and require that mining companies operating in PNG refine gold with a new national mint. At this stage, it is unclear whether this proposed legislation will become law and, if so, when it would take effect. In addition, in June 2023, the PNG government released a new national gold bullion policy setting out the government’s objective of establishing a domestic gold bullion program to refine gold, hold gold reserves and eventually enter into trading in the world gold market. It is unclear when or how the new national gold bullion policy will be implemented, and how the policy will interact with the legislation proposed in 2021, if it is eventually passed into law. Under the terms of the Lihir mining development contract, we may be required to refine a portion of our Lihir gold production within PNG if certain quality and security requirements are met and the terms offered are commercially competitive, but Lihir is otherwise free to enter into arms’ length refining contracts with refineries outside of PNG.
The PNG government has recently enacted a new Income Tax Act 2025 (the “NITA”) which replaces the existing PNG Income Tax Act 1959. The NITA came into force from January 1, 2026. The NITA has been introduced with limited consultation and transition to the new regime is expected to create uncertainty in the medium-term. Key regulations and other key ancillary pieces of legislation have not been enacted at this time and it remains uncertain how any such regulations and other ancillary legislation will impact Lihir and Wafi-Golpu. Any adverse changes to the tax laws and regulations will affect Lihir because its Mining Development Contract does not provide protection against income tax law change. Such changes may also affect Wafi-Golpu depending on the terms of any project agreements that may be entered into with the PNG Government.
There is also the potential for legal challenges to the Wafi-Golpu permitting process as it progresses towards completion, including by PNG provincial governments, landowner groups, and civil society organizations. For example, in March 2021 the Governor of the Morobe Province commenced judicial review proceedings against the State of PNG, and in December 2022 a civil society group and certain residents of the areas surrounding Wafi-Golpu commenced their own litigation in relation to the same matter, each challenging the December 2020 grant of the environmental permit for Wafi-Golpu. Both reviews are still to be determined, however, a decision in relation to the review commenced by a civil society group is expected imminently. The outcome of such legal challenges may adversely impact the Wafi-Golpu permitting process. In addition, WGJV is currently engaging with the State of PNG to progress the permitting of Wafi-Golpu and has commenced discussions relating to its application for a special mining lease, which was submitted to the PNG Mineral Resources Authority in 2016. In April 2023, WGJV signed a Framework Memorandum of Understanding with the State of PNG, which confirmed the parties’ intent to proceed with the project at Wafi-Golpu, subject to finalizing the permitting process and approvals of the boards of both Newcrest (now Newmont) and Harmony Gold, and progress toward signing a mining development contract, which is a prerequisite to granting a special mining lease. The timing for the completion of these discussions remains uncertain, and there is no assurance as to their outcome.
Changes in the laws, regulations and policies described above, or to the manner in which they are interpreted or applied to us, may also adversely impact our ability to extend the Lihir special mining lease upon its expiration in 2035.
Our operations and projects in Canada are subject to legal and regulatory risks and other uncertainties in connection with claims and challenges by Indigenous groups.
First Nations have made claims in respect of Indigenous rights and title to substantial portions of land and water across Canada, which could impact our exploration projects, and operations at Red Chris and Brucejack. Some of these claims are made outside of treaty and other processes. The effect of such claims on any particular area of land will not be determinable until the exact nature of historical use, occupancy and rights to such property have been clarified, whether by a decision of the Canadian courts or definition in a treaty or otherwise. First Nations throughout Canada are seeking settlements with respect to these claims, including compensation from governments, and are seeking rights to regulate activities by companies within their traditional territories. The effect of these claims cannot be estimated at this time. The federal and provincial governments in Canada have been seeking to negotiate settlements with respective groups in order to resolve many of these claims, and the government routinely delegates procedural aspects of its duty to consult the First Nations to project proponents, particularly with respect to the permitting process.
We hold a 70% interest in the Red Chris operation, which comprises an open pit mine that produces gold, copper and silver concentrate, located in British Columbia, Canada. Our Brucejack operation, which comprises an underground mine that produces gold/silver doré and flotation concentrate and hosts the Valley of the Kings high-grade gold deposit, is also located in British Columbia, Canada. In British Columbia, as well as in Canada more generally, the nature and extent of Indigenous rights and title remains the subject of active debate, claims and litigation issues surrounding Indigenous title and rights remain ongoing.
43

Table of Contents
In addition, the government of British Columbia has adopted the UNDRIP and committed to implement UNDRIP in British Columbia, with federal government following suit in 2021 where UNDRIP became federal law in 2021. The provincial and federal legislations commits to systematically review the province’s laws for alignment with UNDRIP principles, while also encouraging new agreements with Indigenous groups that are intended to address outstanding governance questions around the nature of Indigenous rights and title interests in Canada and in British Columbia. In November 2023 a consent-based decision making agreement under section 7 of the UNDRIP was entered into between the government of British Columbia and the Tahltan Central Government (“TCG”) of the Tahltan Nation outlining the process for consent-based decision making for the review of substantial changes to the environmental assessment certificate for the Red Chris mine. The processes outlined in this agreement will apply to changes to the Red Chris environmental assessment certificate relating to the proposed development and operation of the Red Chris block cave mine. Failure or delays in implementing the agreement or to obtain prior informed consent of the TCG may impact the proposed development of the Red Chris block cave mine.
Additionally, the government of British Columbia has committed to reform the Mineral Tenure Act, which governs the acquisition and holding of mineral tenures in British Columbia, in consultation with First Nations and First Nation organizations. This follows challenges by several First Nations in British Columbia against the “free entry” mineral staking regime in the province and a September 2023 Supreme Court of British Columbia decision that held that the province of British Columbia has a duty to consult Indigenous groups when registering mineral claims under the Mineral Tenure Act within their traditional territories. As part of these reforms, in March 2025, the government of British Columbia introduced a new mineral claims application process which requires the government to under take consultation with First Nations before new claims are registered. However, a broader reform to the Mineral Tenure Act is expected as part of the government’s initiative to align provincial laws with UNDRIP principles. As this reform work remains on-going, the impacts of these developments on the acquisition and renewal of mineral tenures in British Columbia are not yet known.
Risks Related to Our Workforce
Our business depends on good relations with our employees.
Production at our mines is dependent upon the efforts of our employees and, consequently, our maintenance of good relationships with our employees. Due to union activities or other employee actions, we could experience labor disputes, work stops or other disruptions in production that could adversely affect us. For example, in recent years, there have been work stoppages by miners represented by unions at our Peñasquito, Cerro Negro and Merian mines, which have disrupted operations. Certain regions in which we operate, including Latin America and Caribbean, have witnessed notable trends in labor relations, including increasing emphasis on workers' rights and labor protections. Governments and civil society organizations have been advocating for improved labor standards, wages and working conditions, leading to the implementation of new labor laws and regulations in a number of jurisdictions. Additionally, collective bargaining has gained prominence as a means to negotiate and secure favorable terms for workers.
At December 31, 2025, various unions represented approximately 26.6% of our employee workforce worldwide. In 2022, Newmont implemented a new employment model in Ghana converting permanent employees into two-year fixed term contracts. Although 99.8% of eligible employees accepted the new fixed term contract and received severance for their years of service, following implementation of the new employment model, the two unions requested and were granted new collective bargaining certificates from Ghana’s Chief Labor Officer for bargaining rights for the class of workers to be represented. The two unions are litigating for bargaining rights to be determined based on verification of membership numbers resulting in targeted efforts to increase membership and a writ of summons was issued by the Ghana Mine Workers Union and the suit is ongoing. In Peru, our two labor agreements expire in 2026 and 2027. In Suriname, the collective bargaining with the union for our Merian mine was entered into in 2023, and expired in April 2025. The negotiations with the union commenced in December 2024 and are currently at the mediation stage. In Argentina two collective agreements will be due for renewal in the first half of 2026. In Mexico, following negotiations, we reached a profit sharing agreement in 2022 whereby union represented workforce will participate in uncapped profit-sharing bonus up to 10%, which resulted in increased labor costs. A collective bargaining agreement expired in 2024 and in October 2024 Newmont Peñasquito and the National Union of Mining, Metal, Steel, and Allied Workers of the Mexican Republic (the "Union") agreed on a new Collective Bargain Agreement (CBA) for 2024-2026, and negotiations for a new agreement is planned to commence in the first half of 2026 reflecting the mutual commitment of all parties. Red Chris has a unionized workforce and has a collective agreement in place from April 2025 until April 2029. One provision of the Red Chris CBA is still being resolved through arbitration. A new employee enterprise agreement was negotiated at Cadia in 2025, with a nominal expiry date in 2029. A failure to successfully enter into new contracts or resolve ongoing union complaints could result in future labor disputes, work stoppages or other disruptions in production that could adversely affect our operations and financial performance. Future disputes at the Company’s operations, projects or joint ventures may not be resolved without disruptions.
Our Peñasquito operation in Mexico is subject to social, political, regulatory, and economic risks.
Our Peñasquito operation has in the past, and may in the future, be affected significantly and adversely by social, political, regulatory, or economic developments in Mexico. A wide range of general and industry-specific Mexican federal and state environmental laws and regulations apply to our operations. These laws and regulations are often difficult and costly to comply with and carry substantial penalties for non-compliance. For example, in the State of Zacatecas, Mexico, environmental taxes became effective in 2017 with little clarity on how the taxes are to be calculated. The Company, along with other companies in the State of
44

Table of Contents
Zacatecas, continue to need to engage with governmental authorities to understand how the environmental tax would be levied year-over-year, which could result in significant increases in tax amounts. See the Risk Factor under the heading “New or changing legislation and tax risks in certain operating jurisdictions could negatively affect us” for additional information. Additionally, in May 2023, the Mexican government published several amendments to laws relating to the country's mining industry, which includes changes to Mexico's Mining Law, National Waters Law, General Law of Ecological Equilibrium and Environmental Protection and General Law for the Prevention and Integral Handling of Wastes (“Mining Reform”). The Mining Reform has added significant uncertainty for foreign investors in Mexico and companies operating in the mining sector, including Newmont. As a result of the Mining Reform, we expect that it will be more difficult for us to access/maintain rights to land and water, thereby negatively impacting our mining activities within Mexico, raising concerns around exploration programs, security of concessions, and out of cycle community negotiations. If political and regulatory trends continue in a manner that is increasingly less supportive of mining, it will have an adverse impact on our operations and financial results. In June 2023, the Company filed an injunction (Amparo) against the reforms, and was served with a provisional suspension to the applicability of several provisions of the Mining Reform on January 2024, which remains pending resolution. Additionally, in February 2024, Mexico's president presented before parliament a series of new constitutional reforms. The proposed reforms include a possible ban on the granting of open pit mining concessions and banning activities related to the exploration, exploitation, benefit or use of minerals or metals using open pit mining methods, and potential limitations on water concessions in certain areas of the country. If proposed reforms were to be enacted it could materially impact our exploration activities and operations at Peñasquito and adversely impact financial results. In December 2025, a decree issuing the General Waters Law and amendment to the National Waters Law was enacted, which could negatively impact the Company and its operations in Mexico if the Company requires additional volumes to those under its current concessions. Potential impacts include restrictions on transfer of water volumes among concessionaires and other water volume limitations.
Production at our Peñasquito operation is dependent upon the efforts of our employees and, consequently, our maintenance of good relationships with our employees. In recent years, we have had several disputes with the Union. Following negotiations in 2022, Newmont and the Union reached a CBA in June 2022 whereby Union represented workforce will participate in uncapped profit-sharing bonus up to 10%, which resulted in increased labor costs. In June 2023, the Union made claims regarding violations of legal regulations and labor agreements (which the Company refuted) and notified the Company of a strike action demanding an increase in the uncapped profit-sharing benefit provided for in the CBA that represented a 100 percent increase equivalent to a 20 percent instead of 10 percent profit-sharing. The Company urged the Union to abide by the mutually agreed CBA and engaged in dialogue with the Union and the government, but the disagreement remained unresolved until October 2023 when the parties reached a definitive agreement to end the strike. Per the agreement, the Company paid Peñasquito workers a fixed amount equivalent to approximately 60% of wages for the duration of the strike, and an additional bonus of two months’ wages to be paid out in the second quarter of 2024, given that the Peñasquito mine reported no profit in 2023 as a consequence of the strike. Additionally, as a part of a separate annual negotiation under the Collective Bargaining Agreement, the Company agreed to an annual salary increase of 8% effective as of August 1, 2023, which is in line with the Mexican mining industry wage increases for 2023. In October 2024, Newmont Peñasquito and the Union agreed on a new CBA for 2024-2026, reflecting the mutual commitment of all parties.
From June 2023 to October 2023, Minera Peñasquito suspended operations, which negatively impacted production and revenue. Any failure to successfully resolve future union complaints could result in additional work stoppages and/or other future disruptions in production and labor issues that could adversely affect our operations and financial performance and our ability to achieve expected results and guidance.
A deterioration in Mexico’s economy, social instability, political unrest, or other adverse social developments in Mexico could also adversely affect operating results at Peñasquito, as well as the safety and security of the site and workforce. For example, in recent years, Mexico has experienced a period of increasing criminal activity, primarily due to the activities of drug cartels and related criminal organizations, including in the State of Zacatecas. Any increase in the level of violence or a concentration of violence near or around the Peñasquito mine could have an adverse effect on operating results.
We may not be able to operate successfully if we are unable to recruit, hire, retain and develop key personnel and a qualified and diverse workforce. In addition, we are dependent upon our employees being able to perform their jobs in a safe and respectful work environment.
We depend upon the services of a number of key executives and management personnel. Our success is also dependent on the contributions of our highly skilled and experienced workforce. Our ability to achieve our operating goals depends upon our ability to recruit, hire, retain and develop qualified and diverse personnel to execute on our strategy. There continues to be competition over highly skilled personnel in our industry. If we lose key personnel, or one or more members of our senior management team and/or executive leadership team and we fail to develop adequate succession plans, or if we fail to hire, retain and develop qualified and diverse employees, our business, financial condition, results of operations and cash flows could be harmed. Additionally, efforts to retain, attract and develop key personnel may also result in additional expenses which could adversely impact our financial performance and profitability.
Our business is dependent upon our workforce being able to safely perform their jobs, including the potential for physical injuries or illness or fatality. If we experience periods where our employees are unable to perform their jobs for any reason, including as a result of illness, our operations could be adversely affected. See the risk factor under the heading “Our operations and business
45

Table of Contents
have in the past been affected by the COVID-19 pandemic, and may be materially and adversely impacted in the future by pandemics, epidemics and other health emergencies.”
In addition to physical safety, protecting the psychological safety of our employees is necessary to maintaining a safe, respectful and inclusive work environment. We are fundamentally committed to creating and maintaining a work environment in which employees are treated fairly, with dignity, decency, respect and in accordance with all applicable laws. We recognize that bullying, sexual misconduct and sexual harassment, and harassment based on other protected categories, including race, have been prevalent in every industry, including the mining industry. Features of the mining industry, such as being a historically hierarchical and male-dominated culture, create risk factors for harmful workplace behavior. While we do not tolerate discrimination and harassment of any kind (including but not limited to gender, sexual orientation, gender identity, gender expression, race, religion, national origin, ethnicity, age, or disability, among others), our policies and processes may not prevent or detect all potential harmful workplace behaviors. We occasionally identify or are apprised of information or allegations that certain employees, affiliates, agents or associated persons may have engaged in harmful behaviors and improper, inappropriate or unlawful conduct, including but not limited to bullying, discrimination and harassment. If the Company fails to maintain a safe, respectful and inclusive work environment, it could impact our ability to retain talent and maintain a diverse workforce and damage the Company’s reputation.
If the Company fails to maintain a safe environment that is free of harassment, discrimination or bullying, it could adversely impact employee engagement, performance and productivity, result in potential legal claims and/or damage the Company’s reputation, which could have a material adverse effect on our business, financial position and results of operations or adversely affect the Company’s market value. See also the risk factor under the heading "Damage to our reputation may result in decreased investor confidence, challenges in maintaining positive community relations and can pose additional obstacles to our ability to develop our projects, which may result in a material adverse impact on our business, financial position, results of operations and growth prospects.”
We rely on contractors to conduct a significant portion of our operations and construction projects.
A significant portion of our operations and construction projects are currently conducted in whole or in part by contractors. As a result, our operations are subject to a number of risks, some of which are outside our control, including:
•Negotiating agreements with contractors on acceptable terms;
•New legislation limiting or altering the ability to utilize contractors or outsourced resources;
•The inability to replace a contractor and its operating equipment in the event that either party terminates the agreement;
•Reduced control over those aspects of operations which are the responsibility of the contractor;
•Failure of a contractor to perform under its agreement;
•Interruption of operations or increased costs in the event that a contractor ceases its business due to insolvency or other unforeseen events;
•Failure of a contractor to comply with applicable legal and regulatory requirements, to the extent it is responsible for such compliance;
•Problems of a contractor with managing its workforce, labor unrest or other employment issues; and
•Liability to third parties as a result of the actions of our contractors.
A failure of contractors to align employment practices with Newmont standards can also result in reactions from our employees and our workforce as they express solidarity with their counterparts in the field.
In addition, laws and regulations relating to the use of contractors may vary in the jurisdictions in which we operate, and changes in legal and regulatory restrictions may also impact our ability to utilize contractors and outsourcing services. For example, new mining industry regulations came into effect in Ghana, Africa, which require that the supply of specific products and services, and certain roles, be reserved for citizens, which may limit the pool of available contractors and service providers and restrict our ability to utilize certain contractors. Additionally, the Mexican government enacted labor and tax laws in April 2021, significantly restricting certain subcontracting and outsourcing of personnel, which has required the conversion of certain contractors to employee status and resulted in increased labor costs. Further changes in law and the occurrence of one or more of these risks could adversely affect our results of operations and financial position.
46

Table of Contents
Legal Risks
Our business is subject to the U.S. Foreign Corrupt Practices Act, and other related anti-bribery laws and regulations. A breach or violation of these rules and regulations could lead to substantial sanctions and civil and criminal prosecution, as well as fines and penalties, litigation, loss of licenses or permits and other collateral consequences and reputational harm.
We operate in certain jurisdictions that have experienced governmental and private sector corruption to some degree, and, in certain circumstances, compliance with anti-bribery laws and heightened expectations of enforcement authorities may be in tension with certain local customs and practices. The U.S. Foreign Corrupt Practices Act and other laws with extraterritorial reach, including the U.K. Bribery Act, and anti-bribery laws in other jurisdictions in which we operate generally prohibit companies and their intermediaries from making improper payments for the purpose of obtaining or retaining business or other improper commercial advantage. We have a business integrity and compliance program which includes our Code of Conduct, Business Integrity Policy and other policies, standards, and procedures, all of which mandate compliance with these anti-bribery laws by the Company and its affiliates and their personnel, and also by third parties when they are engaged on our behalf. Our program also includes preventative and detective controls, and a well-publicized business integrity helpline for raising complaints (including the option for anonymity if the reporter so chooses), questions and concerns as well as processes for evaluating and investigating such concerns and assurances of non-retaliation for persons who raise concerns in good faith. We report regularly to the executive leadership team and the Audit Committee of our Board of Directors on such program components.
We could be held responsible if our internal controls, policies, and procedures fail to protect us from misinterpretation of, or noncompliance with, applicable anti-bribery laws, regulations and internal policies, recklessness, fraudulent behavior, dishonesty or other inappropriate acts committed by our affiliates, employees, agents, or associated persons for which we might be considered responsible. As such, our corporate internal controls policies and processes may not prevent or detect all potential breaches of law or other governance practices. In addition, and despite the fact that Newmont undertook significant pre and post-acquisition due diligence efforts, the compliance mechanisms and monitoring programs adopted and implemented by Newcrest prior to our acquisition of Newcrest in November 2023 may not have adequately prevented or detected all possible violations of the U.S. Foreign Corrupt Practices Act and/or other applicable anti-bribery laws and regulations attributable to Newcrest prior to Newmont's acquisition and we may be held liable for any such violations.
We occasionally identify or are apprised of information or allegations that certain employees, affiliates, agents or associated persons may have engaged in improper or unlawful conduct for which we might be held responsible. Our policy when receiving credible information or allegations is to conduct investigations and compliance reviews to evaluate that information, determine compliance with applicable anti-bribery laws and regulations and company policies and take such remedial steps as may be warranted, including the possibility of making a voluntary self-disclosure to the applicable authorities. Violations of these laws, or allegations of such violations, could lead to substantial investigation and remedial costs, sanctions and civil and criminal prosecution, as well as fines and penalties, litigation, loss of operating licenses or permits and other collateral consequences, and may damage the Company’s reputation, which could have a material adverse effect on our business, financial position and results of operations or cause the market value of our common shares to decline.
Newmont’s global operations create exposure to U.S. and international trade, sanctions, and export control risks. As a U.S.-headquartered company, Newmont must comply with U.S. trade laws worldwide, as well as applicable local regulations. These risks stem from cross-border movement of mineral, equipment, technology, services, capital, and data, often involving third parties. Trade compliance failures may result in legal exposure, financial penalties, operational disruption, reputational damage, and restricted access financial systems or markets.
Export control laws, economic sanctions and international trade compliance regulations are always changing. As such, we have established a trade compliance program that includes policies, standards, and procedures, designed to ensure compliance with these regulations. Our program includes preventive and detective controls, employee training, and a robust third-party screening and ongoing monitoring program. Despite these efforts, our internal controls, policies, and procedures may not detect or prevent all violations of trade compliance laws, and we could be held accountable for misconduct, errors, or failures by employees, affiliates, agents, or third-party partners. We conduct investigations and evaluations in response to credible allegations of noncompliance, and may take remedial actions, including, where applicable, voluntary disclosures to authorities. Violations or allegations of trade compliance breaches could result in significant investigation costs, sanctions, litigation, loss of licenses, and reputational damage, which may materially impact our financial condition, operations, and the market value of our common shares.
Unanticipated litigation or negative developments in pending litigation or with respect to other contingencies may adversely affect our financial condition and results of operations.
We are currently, and may in the future become, subject to litigation, arbitration or other legal proceedings with other parties. Developments in these legal proceedings, or others that could be brought against us in the future, could have a material adverse effect on our business, financial position and/or results of operations. For further detailed discussion of litigation, please refer to Note 24 to the Consolidated Financial Statements.
47

Table of Contents
Title to some of our properties may be insufficient, defective, or challenged.
The sufficiency or validity of the Company's Legal Title in and to its properties may be uncertain or subject to challenges by third parties, including governmental authorities, Indigenous or communal groups, or private entities. For example, at our Conga project in Peru, we continue to seek resolution to a land dispute with local residents. In Mexico, exploration and mining rights are granted through a mining concession, pertaining to the mineral estate, and do not confer rights of ownership, possession, use, or access in or to the corresponding surface estate. Surface rights must be acquired through purchase, lease, or easement from private parties, local communities, or governmental authorities. We enter into temporary occupation agreements ranging from five to thirty years with the Ejido communities, which allow us to use the surface of the lands for our mining operations, and at any particular time we may be involved in negotiations to enter into new temporary occupation agreements or other surface access agreements or amend existing agreements. Failure to reach new, or renewal of existing, agreements or disputes regarding these agreements may lead to blockades, suspension of operations, project delays, and on occasion may lead to legal disputes.
In addition, certain Australian and Canadian properties are owned by Indigenous peoples or are subject to certain inherent aboriginal rights, treaty rights, and/or asserted rights in and to their traditional territories, and our ability to acquire necessary rights to explore, develop, or mine these properties is dependent on agreements with them. Our ability to secure permits, licenses and/or agreements may be dependent on formal determinations of Indigenous or Native title rights issued by governmental authorities, the lack or delay of which may impede the Company’s ability to explore, develop, or mine. In Ghana, Peru, and Suriname, our Legal Title may be subject to challenge based on the presence and activities of artisanal miners or other trespassers due to adverse possession and/or the inability of the Company to satisfy its statutory, regulatory, or contractual obligations required to maintain, extend, or renew Legal Title in and to its land tenure. See risk factors under the headings “We may be unable to obtain or retain necessary permits and land or mining tenure, which could adversely affect our operations”, “Illegal mining and artisanal mining occurs on or adjacent to certain of our properties exposing such sites to security risks”, and “Civil disturbances and criminal activities can disrupt business and expose the Company to liability” above for further information. A determination of insufficient or defective Legal Title, or an adverse outcome from a challenge to our Legal Title, could result in loss, litigation, insurance claims, reputational damage, and the impairment, suspension, or cessation of exploration, development, or mining activities. Such outcomes could materially impact our operations, and result in significant financial losses that affect the Company's business as a whole.
Risks Related to Our Common Stock
The price of our common stock may be volatile, which may make it difficult for you to sell the common stock at the price you paid or at prices you find attractive.
As a publicly traded company with securities listed on the New York Stock Exchange ("NYSE"), the Australian Securities Exchange ("ASX"), and the Papua New Guinea Stock Exchange ("PNGX") the market price and volume of our common stock may be subject to significant fluctuations due not only to general stock market conditions but also to a change in sentiment in the market regarding the performance of our operations, business prospects or liquidity. Among the factors that could affect the price of our common stock are: (i) changes in gold, and to a lesser extent, silver, copper, zinc or lead prices; (ii) operating and financial performance that vary from the outlook provided to securities analysts and investors or the expectations of securities analysts and investors or changes in our outlook; (iii) developments in our business or in the mining sector generally; (iv) regulatory changes affecting our industry generally or our business and operations; (v) the operating and stock price performance of companies that investors consider to be comparable to us; (vi) announcements of strategic developments, acquisitions, dispositions and other material events by us or our competitors; (vii) our ability to integrate and operate the companies and the businesses that we acquire; (viii) the perception of the Company’s ESG performance and its ability to deliver on ESG commitments and expectations, including in connection with the Company's climate strategy; (ix) response to activism; and (x) changes in global financial markets and macroeconomic and geopolitical conditions, such as interest or foreign exchange rates, an escalation of sanctions, tariffs, or other trade tensions, stock, commodity, credit or asset valuations or volatility. The stock markets in general have experienced extreme volatility that has at times been unrelated to the operating performance of a particular company, and has in the past been impacted by the COVID-19 pandemic and global conflicts, and could in the future be impacted by geopolitical and other macroeconomic factors. These broad market fluctuations may adversely affect the trading price of our common stock. In addition, securities class action litigation is sometimes brought against companies after periods of volatility in the market price of their securities, such as the putative securities class action filed in January 2025 initially asserting, among other things, that statements we made from February 2024 to October 2024 in conjunction with our financial outlook were false or misleading, or failed to include material information (see Note 24 - Commitments and Contingencies of Notes to Consolidated Financial Statements in Part II, Item 8 of this Annual Report on Form 10-K for additional information regarding this putative class action law suit). We may in the future be the target of similar litigation which could result in substantial costs and divert management’s attention and resources.
Newmont CHESS depositary interest ("CDIs") are quoted and trade on the ASX in Australian dollars, whereas Newmont common stock is quoted and trade on NYSE in US dollars. While Newmont CDI holders cannot directly trade the underlying Newmont stock on the NYSE, they are entitled to transmute their Newmont CDIs into common stock. There is a risk that the liquidity in the market for Newmont CDIs reduces for a range of reasons including a reduction in the number of CDIs on issue due to the conversion of CDIs to Newmont common stock. Reduced liquidity in the market can impact the speed at which CDIs are able to be bought or sold and the price at which they trade. For a range of reasons, including liquidity, market sentiment and the AUD:USD exchange rate, there is potential CDIs may trade at a discount to our common stock trading on NYSE.
48

Table of Contents
Newmont PETS depository interests (“PDIs”) on the PNGX have similar risks to Newmont CDIs as set out above. In addition, as PNG is a developing country, PNGX is a stock exchange located in an emerging market set within a dynamic political landscape. As a result of this, the PNGX and its listing rules may be liable to review and overhaul. This occurred with the introduction of a new suite of PNGX Listing Rules which came into effect in 2023. As the PNGX currently has only 12 companies listed, these new PNGX Listing Rules are largely yet to be tested in practice and, as the PNGX has complete discretion over any application for listing, a risk of uncertainty arises as to their application, particularly in respect of PDIs, as changes to the PNGX Business Rules addressing PDI’s were not included in the recent suite of amendments.
In addition, it is possible that further changes to the PNGX Listing Rules or the PNGX Business Rules will be made in the future, either in respect of PDIs or more generally. Uncertainty created as a result of changing or untested PNGX Listing Rules or PNGX Business Rules may give rise to delays in actions sought to be taken by Newmont, by Newmont PDI holders, and any new compliance requirements may impact on the desirability of Newmont PDIs as a security.
The PNGX is a small market resulting in limited liquidity. Newmont does not know the extent to which investor interest will lead to the development of an active trading market for the Newmont PDIs or how liquid that market may become. There can be no guarantee that an active trading market for the Newmont PDIs will develop or that the price of the Newmont PDIs will increase. There may be relatively few potential buyers or sellers of the Newmont PDIs on the PNGX at any time. This may increase the volatility of the market price of the Newmont PDIs. It may also affect the prevailing market price at which stockholders are able to sell their Newmont PDIs. This may result in stockholders receiving a market price for their Newmont PDIs that is less than the price that the stockholder paid. Newmont ceased trading on the Toronto Stock Exchange (“TSX”) following voluntary delisting that became effective at the close of trading in September 2025. Market conditions, investor demand, or other factors beyond the Company’s control could result in reduced trading activity or liquidity over time which could limit the liquidity and marketability of the Company’s securities. There can be no assurances as to the level of trading volume, liquidity, or interest in the Company’s securities on other foreign exchanges or whether the Company's securities will continue to be traded on secondary exchanges in the future.
Holders of our common stock, CDIs and PDIs may not receive dividends.
Holders of our common stock (including those who hold Newmont CDIs and Newmont PDIs) are entitled to receive only such dividends as our Board of Directors may declare out of funds legally available for such payments. We are incorporated in Delaware and governed by the Delaware General Corporation Law. Delaware law allows a corporation to pay dividends only out of surplus, as determined under Delaware law or, if there is no surplus, out of net profits for the fiscal year in which the dividend was declared and for the preceding fiscal year. Under Delaware law, however, we cannot pay dividends out of net profits if, after we pay the dividend, our capital would be less than the capital represented by the outstanding stock of all classes having a preference upon the distribution of assets. Our ability to pay dividends will be determined based on Newmont’s financial results, balance sheet strength, cash and liquidity requirements, future prospects, gold and commodity prices and other factors deemed relevant by our Board of Directors. Although we have historically declared cash dividends on our common stock, we are not required to declare cash dividends on our common stock (and, by extension, Newmont CDIs and PDIs). An annualized dividend payout level has not been declared by the Board of Directors, and the declaration and payment of future dividends, including future quarterly dividends, remains at the discretion of the Board of Directors. Our dividend framework is non-binding, and our Board of Directors may modify the dividend framework or reduce, defer or eliminate our common stock dividend in the future. A reduction or suspension in our dividend payments could have a negative effect on the price of our common stock.
Compliance with exchange listing rules as a foreign exempt listing may differ from investor expectations.
Newmont is subject to the listing standards of the NYSE, as its primary stock exchange. In addition, it is subject to additional requirements and standards of its secondary listings on the ASX and PNGX. For example, as part of Newmont’s acquisition of Newcrest, Newmont was admitted to the Official List of ASX Limited as a foreign exempt listing. As a foreign exempt listing, Newmont is exempt from complying with substantially all of the ASX Listing Rules on the basis that Newmont must comply with the rules of its home exchange, the NYSE. ASX Listing Rules with regard to Foreign Exempt Listings which apply to Newmont include: (i) providing the ASX with copies of its public filings; (ii) continuing to comply with the NYSE Listing Rules; (iii) registering as a foreign company carrying on business in Australia under the Corporations Act; and (iv) complying with certain ASX Listing Rules concerning procedural and administrative matters, including lodging announcements, trading halt, suspension and removal. While a benefit of holding CDIs for Australian investors is that it enables trading of Newmont stock on the ASX (via a Newmont CDI), individual investors need to weigh this convenience with the risks inherent in trading CDIs on the ASX rather than the underlying stock on the NYSE, including the potential for delays in disclosure being released to the ASX and fluctuations in price due to trading in underlying Newmont common stock on the NYSE that occurs outside of the ASX trading hours (and which may be influenced by disclosures made outside of ASX trading hours). There may also be a commercial or other disadvantage to investors from the differing disclosure regimes and expectations, as between a stock with a primary listing on the ASX compared to a CDI that is underpinned by a stock with a primary listing on the NYSE. Accordingly, investors in Australia and PNG should be aware that under applicable listing rules, Newmont’s disclosure obligations as a foreign exempt listing will differ from those of companies with a primary or non-exempt listing on ASX or PNGX, including without limitation, in connection with certain filing and distribution requirements, financial presentation requirements, and reserve and resource declaration requirements.
49

Table of Contents
Risks Related to Divestitures and Related Agreement
We may not receive any or all deferred or contingent consideration for divested assets.
The Company completed a series of asset divestments in recent years, including the sale of the Telfer reportable segment in the fourth quarter of 2024, the sale of the CC&V, Musselwhite, and Éléonore reportable segments in the first quarter of 2025, the sale of the Porcupine and Akyem reportable segments in the second quarter of 2025, and the sale of the Coffee development project in the fourth quarter of 2025. In addition, the Company has entered other asset and business transactions in prior periods that include continuing indemnification, guarantee, or contingent payment obligations.
For recent completed divestments certain portions of the total consideration remain deferred, and the Company has continuing obligations under various sale agreements. Deferred payments are subject to future events and conditions outside of the Company’s control, including but not limited to regulatory approvals and the gold price. For example, deferred consideration for the sale of CC&V consists of $175 payable in two installments of $87.5 upon certain regulatory approvals. Deferred consideration for the sale of Musselwhite consists of $40 payable in two installments of $20 on the first and second year anniversary of the close date, dependent on the average spot gold price over the respective period. There can be no assurance that the Company will receive all such deferred amounts when due, or at all, or that such payments will not be delayed, reduced, or disputed by purchasers.
Any failure to realize the expected benefits of transactions, delays or shortfalls in receipt of deferred consideration, or the crystallization of retained liabilities or indemnification claims could materially and adversely affect the Company’s results of operations, cash flows, and overall financial condition. No assurances can be provided with respect to the timing or receipt of contingent consideration payments in the future, or adjustments due to indemnification requirements or liabilities.
We are subject to ongoing indemnification and other retained liabilities from both recent and historical transactions.
The Company is subject to certain indemnifications, guarantees, and obligations in connection with both recent divestitures and prior transactions, including those related to reclamation, remediation and closure costs, environmental liabilities, tax matters, regulatory actions, or other historical obligations. For example, the recent CC&V sale agreement includes an indemnification provision pursuant to which the Company will indemnify the buyer for 90% of certain closure costs over $500 related to the Company’s historical mining activities with no limitation to the maximum potential future payments. See Note 2 (under the heading Indemnification Liabilities) and Note 3 (under the heading Divestitures) the Consolidated Financial Statements for additional information. In 2025, the Company also completed the sale of the Akyem, including Newmont Golden Ridge Limited (“NGRL”). In the case of an adverse final judgment against NGRL pursuant to a non-appealable governmental order, if any, in connection with the Constitutional case described in Note 24 to the Consolidated Financial Statements, Newmont would be required to indemnify the buyer for certain fines, penalties, and disgorgements.
It is not always possible to estimate the Company's maximum exposure under these indemnifications or guarantees due to the conditional nature of these obligations. For indemnifications provided in sales agreements, a portion of the sale proceeds is allocated to these residual obligations and accounted for as a contingent liability, which adjusts the gain or loss that would otherwise result from the transaction. The subsequent accounting for the liability depends on the nature of the underlying obligation and subsequent developments that affect the likelihood or magnitude of the risk. Indemnification liabilities are reduced as the Company is released from risk under the obligation. However, purchasers or counterparties may pursue an indemnification claim triggered by future events outside the Company’s control, including events arising long after the completion of the underlying transaction, which may also result in interest and penalties. For example, in 2020, Newmont completed the sale of Continental Gold, which included indemnification against future tax assessments related to the transaction, subject to the conditions of the agreement. In 2025, Newmont was notified of a potential indemnification claim from the buyer, which remains uncertain and subject to the outcome of related tax and legal proceedings, as well as a determination on the applicability of the indemnity. An adverse determination by the relevant tax authority against the buyer could result in a significant liability. Indemnity obligations, if applicable, may require future payments and could adversely affect the Company’s financial position.
ITEM 1B.       UNRESOLVED STAFF COMMENTS
None.
ITEM 1C.       CYBERSECURITY
Risk Management and Strategy
We rely upon technology and information systems to support our mining and business operations globally. These systems may be susceptible to cybersecurity risks including, but not limited to, external attackers, malware, viruses, and unauthorized access to our IT systems. Cybersecurity and the secure adoption of emerging technologies, including artificial intelligence ("AI"), remain strategic priorities for Newmont. In November 2025, we implemented an enterprise-wide Artificial Intelligence Standard that governs AI adoption and use, model lifecycle management, and associated cybersecurity and privacy controls. We continuously invest in developing our cybersecurity controls and processes to address these threats and reduce the risk of future breaches and cyber attacks. Our processes to assess, identify, and manage cybersecurity risk are integrated with our global Risk Management System ("RMS") and include periodic
50

Table of Contents
enterprise-wide cyber risk assessments, continuous control monitoring, scenario-based exercises, and site-level reviews of our operational technology environments. Our Board of Directors and management team oversee these risks ensuring alignment with our business objectives and regulatory obligations.
Foundationally, we seek to manage cyber risk through a structure of controls that includes cybersecurity standards, policies and cyber solutions that protect the availability, integrity, and confidentiality of our critical IT and mining systems. We monitor for emergent cyber threats and assess any actions required to reduce those risks. Our cybersecurity program is aligned to globally recognized security frameworks including the Mitre Att&ck Framework, NIST and ISO27001. We previously maintained ISO27001 certification; while we are no longer certified, we continue to align our cybersecurity program to ISO27001 principles and conduct periodic independent assessments of our controls. We further test our cybersecurity controls by engaging leading third-party cybersecurity service providers to perform external and internal penetration tests of critical business applications and mining system. Additionally, we review and tabletop test our incident response plan. We leverage continuous monitoring of our internet facing presence, as well as, known internet based criminal communities for indicators referencing Newmont, our executives, and employees. Our Security Operations Center ("SOC") continuously monitors for security events and threats, responding and escalating when appropriate. We also hold employee trainings on privacy and current cybersecurity topics, conduct phishing tests and generally seek to promote awareness of cybersecurity risk through communication and education of our employee population.
Newmont requires third parties that supply IT services, have access to Newmont systems, or manage Newmont data to adhere to established Newmont security policies. Additionally, Newmont requires such third parties to provide detailed information on their established security controls via our third party risk assessment process. The third party risk assessment informs our contracting process. Specific certification may be required of critical third party IT service providers and partners. All third party workers are bound by our Acceptable Technology Use standard which governs appropriate IT systems access and usage.
Our operations rely on the secure processing, storage and transmission of confidential and other information in our computer systems and networks. Computer viruses, hackers, employee or vendor misconduct, and other external hazards could expose our information systems, and those of our vendors, to security breaches, cybersecurity incidents or other disruptions, any of which could materially and adversely affect our business. Cybersecurity incidents may also cause disruption to mining operations; critical financial or reporting systems impairment; breach or integrity loss of Newmont proprietary or confidential data; or external reputational damage.
The sophistication of cybersecurity threats, including through the use of AI, continues to increase, and the controls and preventative actions we take to reduce the risk of cybersecurity incidents and protect our systems, including the regular testing of our cybersecurity incident response plan, may become insufficient. We evaluate the effectiveness of our controls through continuous monitoring, testing, and lessons-leaned reviews following incidents and exercises, and adapt our program accordingly. In addition, new technology that could result in greater operational efficiency such as our use of AI, fleet electrification, and autonomous vehicles may further expose our operations and computer systems to the risk of cybersecurity incidents. Newmont did not identify any cybersecurity incidents during the year ended December 31, 2025 that have materially affected or are reasonably likely to materially affect Newmont's business strategy, results of operations, or financial condition.
Additional information about cybersecurity risks we face is discussed in Item 1A, Risk Factors of this report under the heading "We are dependent upon information technology and operational technology systems, which are subject to disruption, damage, failure or cybersecurity attacks and risks associated with implementation, upgrade, operation and integration" which should be read in conjunction with the information above.
Governance
As part of our overall risk management approach, we prioritize the identification and management of cybersecurity risk at several levels, including Board oversight, executive commitment and employee training. Our Audit Committee, comprised of independent directors from our Board, oversees the responsibilities relating to the operational (including information technology ("IT") risks and data security) risk affairs of the Company. Our Audit Committee is informed of such risks through quarterly reports from our cybersecurity leadership and it reports any material findings and recommendations to the full Board for consideration.
Our Cybersecurity team, comprised of seasoned IT and cybersecurity members, has decades of experience across multiple technical and compliance disciplines including cyber incident response, forensics, IT compliance, incident recovery, threat investigation and information technology. Our cybersecurity team includes several individuals who hold industry recognized certifications and advanced degrees in cybersecurity. Cybersecurity oversees the implementation and compliance of our information security standards, information technology compliance, and mitigation of information security related risks. The Chief Technology Officer and Chief Information Officer have direct oversight of the cybersecurity function. We also have management level committees, leaders, and a cybersecurity incident team who support our processes to assess and manage cybersecurity risk as follows:
•Working closely with the legal team, cybersecurity leadership drives the identification and mitigation of privacy-related risks across the enterprise. This collaborative approach engages legal, compliance, and other functional leaders as needed.
•The Cybersecurity Disclosure Steering Committee, comprised of leadership from IT, cybersecurity, operations, risk, finance, legal and compliance across business segments, contributes to the assessment of cybersecurity breach, planned response, and required disclosures and filings.
51

Table of Contents
•The Rapid Response Team, which includes senior executives across the Company and its global operations, is alerted as appropriate to cybersecurity incidents, natural disasters and business outages. The Rapid Response Team performs tabletop exercises on a yearly basis with inclusion across functions.
Each of these committees provides summary reports on their activities, which are then communicated as appropriate to the Audit Committee.
52

Table of Contents
ITEM 2.       PROPERTIES (dollars in millions, except per share, per ounce and per pound amounts)
The Company maintains its corporate headquarters in Denver, Colorado, U.S. and has various regional offices. Newmont’s production, development, and exploration properties are described below. All key permits have either been obtained by Newmont or approval is expected to be received in the normal course of business. In addition, Newmont holds investment interests in Papua New Guinea, Chile, Peru, Mexico, Canada, and various other locations. Refer to Item 1A, Risk Factors, for risks related to our properties.
Operating Statistics, Proven and Probable Reserves, and Measured, Indicated and Inferred Resources contain tabular information that is presented in both metric and imperial as follows: (i) metric tonnage is utilized for all metals; (ii) gold and silver grades are presented in grams per tonne; (iii) copper, lead, zinc, and molybdenum grades are presented in percentages; and (iv) metal content for gold and silver is presented in ounces while metal content for copper, lead, zinc, and molybdenum is presented in pounds or tonnes. Refer to Operating Statistics, Proven and Probable Reserves, and Measured, Indicated and Inferred Resources below.
Production Properties
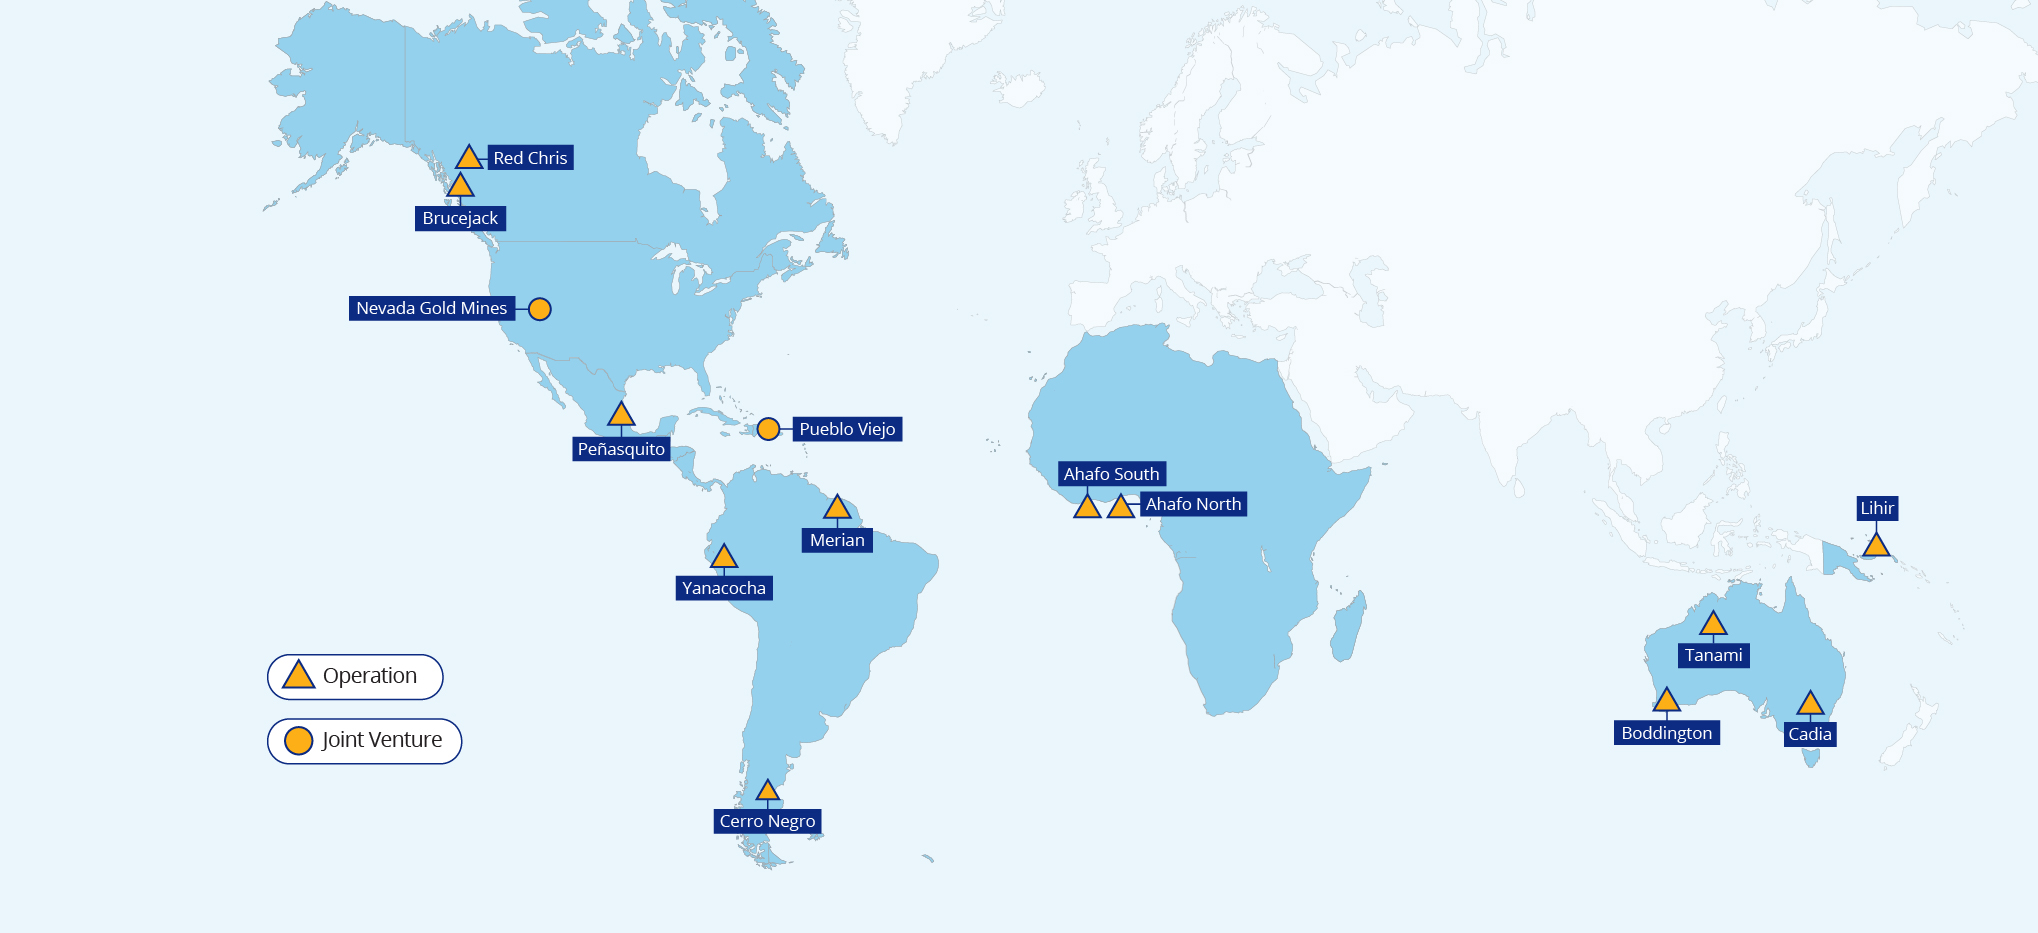
9858_Newmont_Ops_Map_AR2025_01.jpg
Newmont’s properties described below are in the production stage and are operated by Newmont, unless otherwise noted. Production and other operating statistics are presented below in the Operating Statistics section for each site. At December 31, 2025, the Lihir, Cadia, Boddington, and NGM properties are classified as material individual properties under Regulation S-K 1300 and additional details are provided for these properties accordingly. Additionally, the "Ahafo Complex", which includes the Company's Ahafo South and Ahafo North properties, is classified as material under Regulation S-K 1300.
Lihir, Papua New Guinea. (100% owned) Lihir is an open pit mine located near the town of Londolovit on Aniolam Island, approximately 560 miles (900 kilometers) northeast of Port Moresby, the national capital. Access to Aniolam Island is through the Kunaye airport located approximately 4 miles (7 kilometers) north of the mine. Newcrest acquired the Lihir mine in 2010. Newmont obtained the 100% ownership of Lihir when Newmont acquired Newcrest in 2023.
The Lihir deposit is considered to be an example of an epithermal gold deposit. Aniolam Island is part of a 155 mile (250-kilometers) long, northwest-trending, alkalic volcanic island chain that sits within an area where several micro-plates (Solomon Sea Plate, South Bismarck Plate and North Bismarck Plate) developed between the converging Australian and South Pacific plates. Lihir comprises two Plio–Pleistocene volcanic blocks, Londolovit Block and Wurtol Wedge and three Pleistocene volcanic edifices, Huniho, Kinami, and Luise.
20260116_MAP_Lihir_LOC.jpg
Lihir consists of a granted Special Mining Lease, two granted Mining Leases, one granted Exploration License, five granted Leases for Mining Purposes, and three Mining Easements held in the name of Lihir Gold. All leases expire in March 2035, except the
53

Table of Contents
Exploration License and two Mining leases, which are subject to renewal. The total area under license is approximately 63,506 acres (25,700 hectares). Lihir is situated on land held variously under customary, State of PNG, and private ownership, including under State of PNG lease. The bulk of the land that is or will be affected by development, operations and closure of the Lihir Operations is customary owned. Newmont has been granted rights to undertake mining and processing of gold and related activities, through negotiations with the state and local government, and landowners in the area. Environment Permits for water extraction and waste disposal are in place to support mining operations. The Londolovit River is the main source of water for the process plant and surrounding area.
A 2% royalty is payable to the State on the realized prices of all gold and silver bullion sold, less transport and refining costs. In addition, a production levy of 0.5% is also payable to the PNG Mineral Resource Authority on the gross income from the sale of the minerals (i.e., excluding the offsets of treatment and refining charges, payable terms and freight) and other income derived from or in connection with the mining operations.
Operations at Lihir are conducted using a fleet of nine hydraulic shovels and 40 haul trucks, with payload ranging from 90 to 131 tonnes. The process plant consists of crushing and grinding followed by the option of bulk sulphide flotation, then pressure oxidation, and recovery of gold from washed oxidized slurry using conventional cyanidation and electrowinning. For tailings management, Lihir utilizes deep-sea tailings placement in a suitable deep-ocean location. The plant has undergone a number of alterations and expansions since first commissioning in 1997. Lihir’s gross property, plant and mine development at December 31, 2025 was $3,970.
As of December 31, 2025 and 2024, Lihir reported 16.0 million and 15.8 million ounces of gold reserves, respectively. The gold reserves remained consistent in 2025 compared to 2024.
As of December 31, 2025 and 2024, Lihir reported 20.7 million and 20.4 million ounces of gold resources, respectively. The gold resources remained consistent in 2025 compared to 2024.
Cadia, Australia. (100% owned) Cadia is located approximately 16 miles (25 kilometers) south-southwest of the town of Orange in New South Wales ("NSW") and is accessible primarily by paved roads and through the Orange airport located approximately 8 miles (13 kilometers) northeast of the Cadia Operations. The Cadia Operations consist of six granted mining leases and five granted exploration licenses and one granted Exploration Prospecting License through NSW encompassing a total area of 43,720 acres (17,693 hectares).

Newmont predominantly owns all properties covered by the mining leases and a number of properties in the surrounding area. The main mining lease expires in October 2038 but can be renewed. Newcrest acquired the Cadia mine in 1991. Newmont obtained the 100% ownership of Cadia when Newmont acquired Newcrest in 2023.
20260116_MAP_Cadia_LOC.jpg
    The NSW government levies a royalty rate of 4% for gold, silver, copper, and molybdenum based on revenue. Treatment costs, depreciation, realization, and administration costs are allowable deductions from revenue for royalty calculations.
Cadia consists of the Cadia East, Cadia Hill, Cadia Extended, and Ridgeway deposits which consist of alkalic porphyry gold-copper style mineralization and the Big Cadia deposit which is a skarn-style occurrence.
Cadia operates two adjacent concentrators, Concentrator 1 and Concentrator 2, currently treating ore from Cadia East mine. Both concentrators have undergone throughput upgrades, including operational improvements, over the years. Water supply at Cadia is sourced from the Cadiangullong Dam, Upper Rodds Creek Dam, Flyers Creek Weir, Cadia Creek Weir, Orange Sewage Treatment Plant treated effluent, on-site groundwater bores, Belubula River, and site runoff. Cadia sources all of its power from the National Electricity Market. Cadia is currently under an electricity supply agreement and holds a power purchase agreement.
Production mining is an underground panel cave mining from Cadia East with underground crushing and conveyor to surface. The processing plant infrastructure includes high pressure grinding rolls, SAG mills, ball mills, flotation, coarse ore flotation, gravity concentrator and a molybdenum plant to produce copper and gold concentrate, gold doré, and molybdenum concentrate. The available primary production fleet consists of 28 underground production loaders with an average 18 tonne payload. Cadia’s gross property, plant and mine development at December 31, 2025 was $6,321.
As of December 31, 2025 and 2024, Cadia reported 13.5 million and 14.1 million ounces of gold reserves, respectively, 2.9 million and 3.1 million tonnes of copper reserves, respectively, 21.8 million and 22.8 million ounces of silver reserves, respectively and 0.1 million and 0.1 million tonnes of molybdenum reserves, respectively. This represents a decrease of approximately 6% in copper reserves in 2025 compared to 2024; gold, silver, molybdenum reserves remained consistent.
54

Table of Contents
As of December 31, 2025 and 2024, Cadia reported 11.0 million and 19.5 million ounces of gold resources, 2.9 million and 4.2 million tonnes of copper resources, 22.5 million and 34.0 million ounces of silver resources, and 0.1 million and 0.1 million tonnes of molybdenum resources. These changes represent a decrease of approximately 44% in gold resources, a decrease of approximately 31% in copper resources, and a decrease of approximately 34% in silver resources in 2025 compared to 2024. Molybdenum resources remained consistent. The overall reduction in resources is primarily due to negative technical revisions.
Tanami and Boddington, Australia. Newmont’s Tanami and Boddington operations in Australia take place on land that falls under the custodianship of Aboriginal people. Aboriginal land rights in Australia, which recognize the traditional rights and customs of Aboriginal people, are governed by the Commonwealth Native Title Act and certain other Acts specific to individual states and territories. The Commonwealth Native Title Act was enacted in 1993 following a decision in the High Court of Australia, which held that Aboriginal people, who have maintained a continuing connection with their land according to their traditional laws and customs, may hold certain rights which should be recognized under Australian common law. In the Northern Territory, where the Tanami operation is located, the Aboriginal Land Rights Act (“ALRA”) was introduced in 1976, which established an Aboriginal Land rights regime. Under the ALRA, approximately 50% of the land in the Northern Territory was granted as inalienable Aboriginal freehold titled land.
Newmont has existing agreements with the Traditional Owner groups of the land utilized by our Tanami and Boddington operations. Any future agreements would depend on a determination of native title, which is likely to take many years. If successful, a native title determination could give rights to compensation claims in the future. Throughout Australia, new exploratory and mining tenements may require native title agreements to be entered into and will be subject to a negotiation process, which often gives rise to compensation payments and heritage survey protocols. Newmont does not consider that native title claims or determined areas where rights have been established are an impediment to the operation of existing mines.
In Australia, various ad valorem royalties and taxes are paid to state and territorial governments, typically based on a percentage of gross revenues or earnings. Aboriginal groups have negotiated compensation/royalty payments as a condition to granting access to areas where native title rights are determined or where they own the land.
Tanami, Australia. (100% owned) Tanami is located in the Northern Territory approximately 342 miles (550 kilometers) northwest of Alice Springs. The underground mining infrastructure and operation is located at Dead Bullock Soak (“DBS”). The processing infrastructure is located 25 miles (40 kilometers) to the east of the mining operations at the Granites. Ore is transported by road train from DBS underground to the processing facility at the Granites.
The Newmont Tanami Operations are comprised of exploration licenses encompassing a total area of 1,540,301 acres (623,339 hectares) including 556,545 acres (225,226 hectares) relating to the Tobruk and Monza Joint Ventures entered into with Prodigy Gold, and 44,333 acres (17,941 hectares) relating to a Joint Venture entered into with Top End Exploration Pty Ltd, for which Newmont is the operator, and 44,333 acres (17,941 hectares) relating to the Terry's South Joint Venture entered into with JRE. An additional, 11,025 acres (4,462 hectares) of mineral leases granted pursuant to the Northern Territory Mineral Titles Act. Newmont operates through exploration and mining agreements with the Central Land Council who represent Traditional Owners, the Warlpiri people.
Tanami consists of sediment hosted sheeted quartz vein mineralization. Tanami, as an underground mining operation, has a fleet of ten underground loaders, 22 haul trucks, each with 60 to 65-tonne payloads, and one ejector truck with a 45 tonne capacity. Processing plant facilities currently consist of a crushing plant, a grinding circuit, a gravity circuit, carbon in pulp and absorption tanks, thickeners and a conventional tailings storage facility. Tanami’s gross property, plant and mine development at December 31, 2025 was $3,965. Tanami reported 5.3 million ounces of gold reserves at December 31, 2025.
Brownfield exploration and development for new reserves is ongoing with the main focus being underground ore definition drilling of the Auron, Federation and Liberator ore bodies as well as exploration of the Oberon deposit. Surface drilling continues to test targets with Exploration Upside, proximal to known Tanami mineralization.
55

Table of Contents
Boddington, Australia. (100% owned) Boddington is located 81 miles (130 kilometers) southeast of Perth in Western Australia and is accessible primarily by paved road. Boddington has been wholly owned since June 2009 when Newmont acquired the final 33.33% interest from AngloGold Ashanti Australia Limited.
The Boddington project area comprises 52,065 acres (21,070 hectares) of mining tenure leased from the State of Western Australia, of which 26,910 acres (10,890 hectares) is subleased from the South 32 Worsley Joint Venturers ("Worsley JV"). The total project area is comprised of multiple leases that expire between 2027 and 2046. Royalties are paid to the state government at 2.5% for gold and 5% for copper based on revenue. Shipping and treatment and refining costs are allowable deductions from revenue for royalty calculations for copper. Newmont owns 74,474 acres (30,139 hectares) of rural freehold property, some of which overlaps existing mining tenure. The majority of its current operational area is located on its freehold property.
20260116_MAP_Boddington_LOC.jpg
The subleases from the Worsley JV expire immediately prior to the expiry of the relevant mining leases. Newmont holds rights to renew the subleases. The mining leases are renewable upon application to the State of Western Australia by the Worsley JV. As these mining leases are in their third term, renewal of these mining leases is at the discretion of the State. The subleases do not confer an express right to require the Worsley JV to seek application to renew the mining leases. Newmont is entitled to all gold and other non-bauxite mineralization conferred by the mining leases. The Worsley JV retains the rights to bauxite mineralization. The relationship between the Worsley JV bauxite operations and the Boddington gold operations are regulated through a cross-operation agreement. This agreement confers priority on the bauxite operations such that the bauxite/alumina mining operations of the Worsley JV will take priority over the gold mining operations and Newmont is required to take reasonable measures to conserve bauxite including by mining and stockpiling bauxite on behalf of the Worsley JV.
Boddington consists of greenstone diorite hosted mineralization and exploration activities continue to develop the known reserve. The mine operates two pits (North and South Pits), utilizing two electric shovels, and three excavators as its prime ex-pit material movers with a fleet of 41 production autonomous haulage trucks. Boddington has a current capacity to mine approximately 200,000 to 250,000 tonnes of material per day. The milling plant includes a three-stage crushing facility (two primary crushers, six secondary crushers and four high-pressure grinding rolls), four ball mills, a flotation circuit and a carbon-in-leach circuit. The flotation circuit process recovers gold-copper concentrate before the material is then processed by a traditional carbon-in-leach circuit where the remaining gold is recovered to produce doré. Mining operations consist of two open pit operations located adjacent to each other. Boddington’s gross property, plant and mine development at December 31, 2025 was $4,976.
Power for the operation is sourced through the local power grid under a long-term power purchase agreement with Bluewaters Power. The power supply contract with Bluewaters expires in 2031 and includes an option to extend.
As of December 31, 2025 and 2024, Boddington reported 10.2 million and 10.8 million ounces of gold reserves, respectively, and 0.5 million and 0.5 million tonnes of copper reserves, respectively. This represents a decrease of approximately 6% in gold reserves, while copper reserves remained consistent in 2025 compared to 2024. The reduction in gold reserves is primarily due to depletion and negative technical revisions.
As of December 31, 2025 and 2024, Boddington reported 4.4 million and 4.3 million ounces of gold resources, respectively, and 0.3 million and 0.3 million tonnes of copper resources, respectively. The gold and copper resources remained consistent in 2025 compared to 2024.
Brownfield exploration and development for new reserves is ongoing.

56

Table of Contents
Ahafo South and Ahafo North, Ghana.
The Company's Ahafo South and Ahafo North properties are together known as the Ahafo Complex and together are classified as material properties under Regulation S-K 1300. All of Newmont’s operations in Africa are located in Ghana.

In December 2003, Ghana’s Parliament unanimously ratified an Investment Agreement (“IA”) between Newmont and the government of Ghana. The IA established a fixed fiscal and legal regime, including fixed royalty and tax rates, for the life of any Newmont project in Ghana. In December 2015, Ghana’s Parliament ratified the Revised Investment Agreements (“Ghana Investment Agreements” or “Revised IAs”).
20260116_MAP_Ahafo_LOC.jpg
The Revised IAs contain commitments with respect to job training for local Ghanaians, community development, purchasing of local goods, services and environmental protection, and also include a change in tax stabilization from life of mine to 15 years from commercial production for each mine. In October 2017, the government of Ghana approved Newmont’s request to extend the stability period of the Revised IAs at the Ahafo operations for five years to December 31, 2025.
The maximum corporate income tax rate was previously 32.5% under the Revised IAs; however, upon the expiration of the tax stability extension on December 31, 2025, the Company’s operations in Ghana have become subject to a maximum corporate income tax rate of 35% and customs duties on imported goods used in mining operations ranging from 5% to 20% of the value of such items.
Royalties were paid to the Government of Ghana under a sliding‑scale system, based on average monthly gold prices and ranging up to 5% of revenues, plus an additional 0.6% on any production from forest reserve areas. The sliding-scale royalty regime expired on December 31, 2025. Effective January 1, 2026, royalties transitioned to a fixed 5% rate on gold production, with the additional 0.6% forest reserve royalty continuing to apply where applicable.
The government of Ghana is also entitled to receive 10% of a project’s net cash flow after reaching specific production milestones by receiving 1/9th of the total amount paid as dividends to Newmont parent. When the average quoted gold price exceeds $1,300 per ounce within a calendar year, an advance payment on these amounts of 0.6% of total revenues is required. Upon the expiration of the tax extension regime on December 31, 2025, dividends paid in addition to the carried interest will become subject to an 8% withholding tax, effective January 1, 2026.
The Company is now also be subject to a Growth and Sustainability Levy of 3% on gross revenue. As a result, the Company will also be exposed to future changes in fiscal, tax, and other related regulatory regimes in Ghana as they may be enacted from time to time. For instance, the Government of Ghana has announced plans to amend the country’s mineral royalty regime by replacing the flat 5% royalty rate, which became effective on January 1, 2026, with a sliding scale ranging from 5% to 12%, linked to prevailing gold prices. The proposed amendment was submitted to the Ghanaian Parliament on December 19, 2025, and is expected to be considered when parliamentary sessions resume in February 2026. If enacted, the revised royalty framework could increase the Company’s operating costs at its Ghanaian operations, particularly during periods of higher gold prices. The timing, final structure, and implementation mechanisms of the proposed regime currently remain uncertain.
Ahafo South, Ghana. (100% owned) Ahafo South is located near Kenyasi in the Ahafo Region of Ghana, approximately 180 miles (290 kilometers) northwest of the national capital city of Accra, and is largely accessible by paved roads. In 2002, Newmont acquired 50% of Ahafo South as a result of the merger with Normandy. In 2003, Newmont purchased the remaining interest from Moydow Mines International Inc. (“Moydow”), thereby making it a wholly owned subsidiary. The Ahafo South mine is composed of three orogenic gold deposits that have oxide and primary mineralization. Gold occurs primarily in pyrite and secondarily as native gold in quartz veins.
The Ahafo South operations are comprised of three mining leases issued under the Ghanaian Mining Act encompassing a total area of approximately 137,222 acres (55,532 hectares) with current mine take area of approximately 13,698 acres (5,543 hectares) that has been fully compensated and approximately 11,216 acres (4,539 hectares) of mining area that has not been fully compensated (e.g. payment would be necessary to move people from their land). The mining leases grant the exclusive rights to work, develop and produce gold in the lease area, including the processing, storing and transportation of mineral and materials. The mining leases require Ahafo South to respect or perform certain financial and statutory reporting obligations and expire in 2031 and are renewable subject to certain conditions. Ahafo South pays a royalty of 2% on net smelter returns to Franco-Nevada for all gold ounces recovered from areas previously owned by Moydow.
57

Table of Contents
Ahafo South sources all of its power from the National Electricity Market. Ahafo South is currently under an electricity supply agreement and holds a power purchase agreement. Power for the operation is sourced through the local power grid under a long-term power purchase agreement with the Volta River Authority. The power supply contract with Volta River Authority expires in 2028 and includes an option to extend.
Ahafo South currently operates one open pit, following the completion of the Subika open pit in July 2025. The active pit is Awonsu, which is being mined concurrently in two phases: (Layback 3 and Layback 4). Subika added an underground operation, which reached commercial production in November 2018, and Awonsu completed a layback in November 2019. The available mining fleet for surface mining consists of three shovels and 36 haul trucks, each with 141-tonne payload. The available mining fleet for underground mining consists of eight underground loaders and 14 haul trucks, with payload ranging from 55 to 57 tonnes. The daily production rate is approximately 88,000 tonnes. The original processing plant was commissioned in 2006. The Ahafo Mill Expansion, which was completed in October 2019, expanded the plant capacity to process approximately 11 million tonnes per year. The current processing plant consists of two crushing plants, two grinding circuits, carbon-in-leach circuits, elution circuit, counter current decantation circuit, a tailings disposal facility, and a reverse osmosis water treatment plant. Ahafo South’s gross property, plant and mine development at December 31, 2025 was $2,982.
As of December 31, 2025 and 2024, Ahafo South reported 4.1 million and 4.6 million ounces of gold reserves, respectively. This change represents a decrease of approximately 11% in gold reserves in 2025 compared to 2024. The overall reduction in gold reserves is primarily due to depletion.
As of December 31, 2025 and 2024, Ahafo South reported 7.4 million and 5.1 million ounces of gold resources, respectively. This change represents an increase of approximately 45% in gold resources in 2025 compared to 2024. The overall increase in gold resources is primarily due to ounces added from exploration activities.
Brownfield exploration and development for new reserves is ongoing.
Ahafo North, Ghana. (100% owned) Ahafo North operation achieved commercial production in the fourth quarter of 2025 and is located approximately 31 miles (50 kilometers) northeast of Ahafo South and approximately 236 miles (380 kilometers) northwest of the capital city of Accra, Ghana accessible by paved road. In July 2021, the Board of Directors approved full funding for the Ahafo North project. The operation currently includes a mill and two active pits, with a third pit expected to commence operations in early 2026.
Ahafo North sources its power from the Ghana national grid through a long-term power purchase agreement with the Volta River Authority. This contract is valid through 2028 and includes an option for renewal. Water is also sourced from Susuan River, Boreholes 1 and 5, rainfall water, and from the sediments control structures.
The Ahafo North operation is comprised of one mining lease issued under the Ghanaian Mining Act encompassing a total area of approximately 465 kilometers with current mine take area of approximately 7,338 acres (2,970 hectares) that has been fully compensated and approximately 2,623 acres (1,061 hectares) of mining area that has not been fully compensated (e.g. payment would be necessary to resettle the community). The mining lease grants the exclusive rights to work, develop and produce gold in the lease area, including the processing, storing and transportation of mineral and materials. The mining lease requires Ahafo North to respect or perform certain financial and statutory reporting obligations and expires in 2031 and is renewable subject to certain conditions.
The Ahafo North mine is comprised of six open pit orogenic gold deposits with both oxide and primary mineralization. Ahafo North currently has two active pits, Subenso South and Susuan. The available mining fleet for surface mining consists of 3 shovels and 16 haul trucks to increase to 20 in 2026, each with 74.6 and 86.5 tonne payload for saprolite and primary materials respectively. Daily production rate is approximately 66,000 tonnes. The processing plant was commissioned in October 2025, with a plant capacity to process approximately 3.7 million tonnes per year. The current processing plant consists of one jaw crusher, SAG and ball mill combination, carbon-in-leach circuit, elution circuit, counter current decantation circuit, and a tailings disposal facility currently constructed to phase two of the life of mine plan. Ahafo North’s gross property, plant and mine development at December 31, 2025 was $1,114.
As of December 31, 2025 and 2024, Ahafo North reported 4.7 million and 4.6 million ounces of gold reserves, respectively. The gold reserves remained consistent in 2025 compared to 2024.
As of December 31, 2025 and 2024, Ahafo North reported 3.2 million and 2.6 million ounces of gold resources, respectively. This change represents an increase of approximately 23% in gold resources in 2025 compared to 2024. The overall increase in gold resources is primarily due to net positive technical revisions.
Brownfield exploration and development for new reserves is ongoing.
Merian, Suriname. (75% owned) Merian is operated in a partnership, named Suriname Gold Project CV, whereby 75% is owned by Newmont Suriname, LLC (“Newmont Suriname”), formerly known as Suriname Gold Company LLC and 100% directly owned by Newmont Corporation and 25% by Staatsolie. Merian is located in Suriname, approximately 40 miles (66 kilometers) south of the town of Moengo and 19 miles (30 kilometers) north of the Nassau Mountains, close to the eastern border with French Guiana.
58

Table of Contents
Newmont Suriname holds one Right of Exploitation encompassing an area of 41,485 acres (16,788 hectares) and four Rights of Exploration encompassing an area of 160,153 acres (64,812 hectares). In addition to these mining rights, Newmont Suriname holds a surface right, the right of leasehold (recht van grondhuur) for the expansion of its tailings storage facilities. This right of leasehold encompasses an area of 7,771 acres (3,145 hectares). All of the gold mineralization at Merian is closely associated with quartz veining within siltstone and sandstone formations. The operation currently includes the Merian 2 open pit, the Merian 1 open pit, the Maraba open pit, and the Kupari open pit. The available mining fleet consists of three shovels, three mining excavators, and 41 haul trucks, each with 150-tonne payload. Newmont Suriname includes processing facilities that utilize a conventional gold mill, primary crusher and processing plant, consisting of a comminution plant, including gravity and cyanide leach processes, with recovery by carbon-in-leach, elution, electrowinning and induction furnace smelting to produce a gold doré product. Merian’s gross property, plant and mine development at December 31, 2025 was $1,384. Merian reported 4.5 million attributable ounces of gold reserves at December 31, 2025. Brownfield exploration and development for new reserves is ongoing.
Cerro Negro, Argentina. (100% owned) Cerro Negro is located in southern Argentina about 250 miles (400 kilometers) southwest of the coastal city of Comodoro Rivadavia. The mineral tenure consists of ten mining property titles encompassing 53,246 acres (21,548 hectares), and three exploration licenses, encompassing 13,193 acres (5,339 hectares). We also own lands in the Cerro Negro mine area, totaling approximately 27,429 acres (11,100 hectares), which overlie the Bajo Negro and Vein Zone deposits and adjacent prospects. Cerro Negro consists of the Eureka, Mariana Central, Mariana Norte, Emilia, and San Marcos operating underground mines and the Baja Negro and Silica Cap underground mines, which are currently in development. Deposits within the Cerro Negro mine operations are low sulfidation, epithermal gold/silver vein deposits. Cerro Negro’s available underground mining fleet consists of nine underground loaders, 12 underground haul trucks, and six surface haul trucks, each with 30 to 40-tonne payloads and additional auxiliary equipment as required. The processing plant facilities consist of a crushing plant, a grinding circuit, agitated leaching, counter-current decantation, solution clarification, Merril Crowe zinc precipitation and smelting to produce gold and silver doré bars that are shipped to a refinery for further processing. Cerro Negro’s gross property, plant and mine development at December 31, 2025 was $2,449. Cerro Negro reported 3.0 million ounces of gold reserves at December 31, 2025. Brownfield exploration and development for new reserves is ongoing, including the development of the Eastern district.
Yanacocha, Peru. (100% owned) Yanacocha is located approximately 375 miles (604 kilometers) north of Lima and 30 miles (48 kilometers) north of the city of Cajamarca. Yanacocha is comprised of 9 mining concessions and 3 processing concessions encompassing 237,741 acres (96,086 hectares). Yanacocha is an epithermal type deposit of high sulfidation hosted in volcanic rock formations. Gold is associated with iron-oxides and pyrite, which is placed on leach pads. Yanacocha consists of the following open pit mines: the La Quinua Complex, the Yanacocha Complex, the Carachugo Complex, and Maqui Maqui. Yanacocha has four leach pads (La Quinua, Yanacocha, Carachugo and Maqui Maqui). Yanacocha also has three gold processing plants (Pampa Larga, Yanacocha Norte and La Quinua), one limestone processing facility (China Linda) and one mill (Yanacocha Gold Mill). The La Quinua Complex mined material from the La Quinua Sur and the Tapado Oeste Layback and finished mining operations in 2021. The Yanacocha Complex mined material from the Yanacocha Layback and Yanacocha Pinos has had limited mining operations in recent years. The Maqui Maqui operations mined material from multiple mines that are no longer in operation. The Yanacocha Gold Mill and China Linda ceased operations in February 2021 and in December 2022, respectively, and both facilities have been placed into care and maintenance. The Carachugo leach pad processes oxide material from Quecher Main. Yanacocha’s available mining fleet consists of two shovels, two excavators, and 25 haul trucks, each with 233-tonne payload. Yanacocha’s gross property, plant and mine development at December 31, 2025 was $4,130. Yanacocha reported 0.5 million ounces of gold reserves at December 31, 2025.
Peñasquito, Mexico. (100% owned) Peñasquito is an open pit operation located in the northeast corner of Zacatecas State, approximately 125 miles (200 kilometers) northeast of the city of Zacatecas. Peñasquito is comprised of 20 mining concessions for operations comprising 113,231 acres (45,823 hectares) and 60 mining concessions for exploration of 107,456 acres (43,486 hectares). Surface rights in the vicinity of the Peñasco and Chile Colorado open pits are held by three ejidos: Ejido Cedros, Ejido Mazapil and Ejido Cerro Gordo. Peñasquito has signed land use agreements with each ejido, valid through 2035 and 2036, and the relevant private owners. Peñasquito consists of the Peñasco and Chile Colorado open pit mines. The mineralization at Peñasquito contains gold, silver, lead and zinc. Deposits currently mined within the Peñasquito operations are considered to be examples of breccia pipes developed as a result of intrusion-related hydrothermal activity. Process facilities include a sulfide processing plant, comprising two stages of flotation: lead and zinc. In the lead and zinc flotation, the slurry is conditioned with reagents to activate the desired minerals and produce lead and zinc concentrates. The flotation tailings go for final deposition in the tailings storage facility. The available mining fleet consists of five rope shovels, three hydraulic shovels, four loaders, and 81 haul trucks, each with a 312-tonne payload. The fleet is supported by blast hole production drills, as well as track dozers, rubber tire dozers, excavators, and graders. Peñasquito’s gross property, plant and mine development at December 31, 2025 was $5,957. Peñasquito reported 3.2 million ounces of gold reserves, 230 million ounces of silver reserves, 0.7 million tonnes of lead reserves, and 1.5 million tonnes of zinc reserves at December 31, 2025. Brownfield exploration and development for new reserves is ongoing.
Pueblo Viejo, Dominican Republic. (40% owned) Pueblo Viejo is a joint venture with Barrick, where Barrick is the operator who holds the remaining 60% interest. We report our interest in Pueblo Viejo on an equity method basis. The Pueblo Viejo mine is located approximately 60 miles (100 kilometers) northwest of Santo Domingo, Dominican Republic. The Pueblo Viejo mine is situated on the Montenegro Fiscal Reserve, an area specially designated by Presidential Decree for the leasing of minerals and mine development, which covers an area of approximately 19,756 acres (7,995 hectares) in aggregate. The Pueblo Viejo mine is an open pit conventional truck and shovel mining operation with deposits located in two major areas, the Monte Negro pit and the Moore pit, and consists of high sulfidation or acid sulfate epithermal gold, silver, copper and zinc mineralization. Process facilities include a
59

Table of Contents
conventional mill which consists of a crushing and grinding circuit, autoclaves, and a carbon-in-leach circuit. The plant expansion project added a new crusher, SAG mill, carbon-in-leach circuit and a flotation circuit. The tailings storage facility continues to advance. The plant expansion and tailings storage facility are designed to extend its life to 2040 and beyond. The available mining fleet consists of three shovels, five front loaders, 46 haul trucks, each with an average payload of 185 tonnes, and seven drills. The Company's attributable portion of Pueblo Viejo’s gross property, plant and mine development is $3,127 at December 31, 2025. We report our 40% interest in Pueblo Viejo on an equity method basis under U.S. GAAP and as a result our attributable portion of Pueblo Viejo's gross property, plant and mine development is included in the carrying value of our equity method investment at December 31, 2025. As of December 31, 2025, Pueblo Viejo reported 8.2 million ounces of attributable gold reserves and 49 million ounces of attributable silver reserves.
Red Chris, Canada. (70% owned) Red Chris is 70% owned by Newcrest Red Chris Mining Limited, a Newmont subsidiary, and 30% owned by Red Chris Development Company Ltd., an Imperial Metals subsidiary, and is accounted for under proportionate consolidation. Red Chris is located in northwest British Columbia, Canada, approximately 11 miles (18 kilometers) southeast of the Iskut village, 50 miles (80 kilometers) south of Dease Lake, and 7 miles (12 kilometers) east of the Stewart-Cassiar Highway 37. The Red Chris operation is comprised of five mining leases which cover 12,703 acres (5,141 hectares) and 199 mineral claims, encompassing an area of approximately 164,903 acres (66,734 hectares). The mining leases expire in 2042. Red Chris is a copper-gold open pit mining operation. Newmont is conducting a feasibility study on a potential underground block cave mine, and has commenced an exploration decline. Gold and copper porphyry-style mineralization consists of vein, disseminated and breccia sulfides. The main sulfide mineral assemblage is pyrite-chalcopyrite-bornite. Ore from the mine is fed to a primary crusher with crushed ore conveyed to a coarse ore stockpile. From there ore is reclaimed and fed to a conventional SAG mill–ball mill–pebble crushing comminution circuit which in turn feeds a flotation circuit. Flotation concentrate is dewatered and loaded into trucks for transportation off-site. The processing facilities are housed in a single process building. Additional to crushing and processing are waste rock storage facilities, a tailings storage facility, water treatment facilities, and waste treatment facilities. The available fleet consists of three face shovels, five drills, 22 trucks (dump and water trucks), three graders, one PC2000 excavator, five-non-production excavators, two mini excavators, ten loaders, and nine dozers. Red Chris’s gross property, plant and mine development at December 31, 2025 was $2,127. Red Chris reported 3.6 million ounces of gold reserves and 0.9 million tonnes of copper reserves at December 31, 2025.
Brucejack, Canada. (100% owned) Brucejack is located in western British Columbia, approximately 40 miles (65 kilometers) north of Stewart and 28 miles (45 kilometers) southwest of the Stewart-Cassiar Highway 37. The Brucejack operation comprises four mining leases and six core mineral claims which cover 8,169 acres (3,306 hectares) and 337 mineral claims covering 298,795 acres (120,918 hectares). The mining leases expire in 2045. Brucejack is an underground operation and is a deformed, porphyry-related transitional to intermediate sulphidation epithermal high-grade gold-silver deposit. Gold is hosted in quartz-calcite vein stockworks, sheeted veins and veinlets and can also be associated with arsenian pyrite. Process facilities include a mill building containing process equipment, including a rock bin, SAG mill-ball mill circuit followed by conventional flotation, concentrate dewatering, concentrate load-out and tailings dewater operations, a water treatment plant, a paste backfill plant, and a metallurgical laboratory. The mining fleet includes a fleet of load-haul-dump vehicles, trucks for material loading and transport to surface, bolters, jumbo drills, shotcrete sprayers, long-hole drills, and cable bolters. Brucejack’s gross property, plant and mine development at December 31, 2025 was $2,202. Brucejack reported 2.9 million ounces of gold reserves at December 31, 2025.
NGM, Nevada, U.S. (38.5% owned) NGM is located in Elko, Nevada. On July 1, 2019, Newmont and Barrick consummated the Nevada JV Agreement, which combined the Company’s Nevada mining operations with Barrick’s Nevada mining operations resulting in the establishment of NGM, a joint venture with Barrick, who is the operator, and which is accounted for by the Company under proportionate consolidation. NGM operations are primarily accessible by paved road and are comprised of 180,921 acres (73,217 hectares) in aggregate including Cortez 53,999 acres (21,853 hectares), Carlin 58,255 acres (23,575 hectares), Turquoise Ridge 26,679 acres (10,797 hectares), Phoenix 17,900 acres (7,244 hectares), and Long Canyon 24,088 acres (9,748 hectares).
20260116_MAP_NGM_LOC.jpg
All sites at NGM contain open pit operations while Cortez, Carlin, and Turquoise Ridge also include underground operations. At Cortez, mineralization is sedimentary rock-hosted and consists of submicron to micrometer-sized gold particles and gold in solid solution in pyrite. Refractory ore is transported to Carlin for processing. Phoenix is a skarn-hosted polymetallic massive sulfide replacement deposit. The Phoenix mill produces a gravity gold concentrate and a copper/gold flotation concentrate and recovers additional gold from cyanide leaching of the flotation tails. Carlin and Turquoise Ridge are a sediment-hosted disseminated gold deposit.
In Nevada, mining taxes are assessed on up to 5% of net proceeds of a mine. During 2021, the Nevada legislature enacted a new excise tax which is assessed up to 1.1% of gross revenues.
60

Table of Contents
NGM owns, or controls through leases, fee ownership, and unpatented mining claims, all of the minerals and surface area within the boundaries of the present Nevada mining operations. The long-term leases extend for at least the anticipated mine life of those deposits. With respect to a significant portion of the Gold Quarry mine at Carlin, NGM pays a net smelter royalty equivalent to 16.2% of the mineral production. NGM wholly-owns or controls the remainder of the Gold Quarry mineral rights, in some cases subject to additional royalties. With respect to certain smaller deposits in Nevada, NGM is obligated to pay royalties on production to third parties that vary from 1% to 8% of production.
Each site has its own process facilities which include: an oxide mill, which consists of a crushing and grinding circuit and carbon-in-leach circuit, and two heap leach pads at Cortez; an autoclave, two roasters, an oxide mill/flotation circuit and three heap leach pads at Carlin; the Sage autoclave, an oxide mill, and three heap leach pads at Turquoise Ridge; a flotation mill, a carbon-in-leach plant, a copper leach pad and a solvent extraction electrowinning plant at Phoenix. NGM has a current capacity across all sites to mine approximately 244,000 tonnes of material per day. The milling facilities were commissioned over a range of years beginning in the 1990’s. They undergo routine maintenance each year with process improvements implemented as the projects are identified and approved. Power is either purchased in the open market or supplied by the power plants owned and operated by NGM.
The NGM operations include, in aggregate, an open pit mining fleet consisting of 24 shovels and 154 haul trucks with an average payload of 298 tonnes, and an underground mining fleet consisting of 72 underground loaders and 88 haul trucks, with an average payload of 40 tonnes. Newmont’s share of NGM’s gross property, plant and mine development at December 31, 2025 was $9,273.
As of December 31, 2025 and 2024, NGM reported 17.4 million and 17.9 million attributable ounces of gold reserves, respectively, 0.1 million and 0.1 million tonnes of copper reserves, respectively, and 14.6 million and 14.5 million ounces of silver reserves, respectively. The gold, copper, and silver reserves remained consistent in 2025 compared to 2024.
As of December 31, 2025 and 2024, NGM reported 15.9 million and 15.2 million attributable ounces of gold resources, respectively, 0.2 million and 0.2 million attributable tonnes of copper resources, respectively, and 22.1 million and 19.2 million attributable ounces of silver resources, respectively. This represents an increase of approximately 15% in silver resources, while gold and copper resources remained consistent in 2025 compared to 2024.
Brownfield exploration and development for new reserves is ongoing.
Development and Exploration Properties
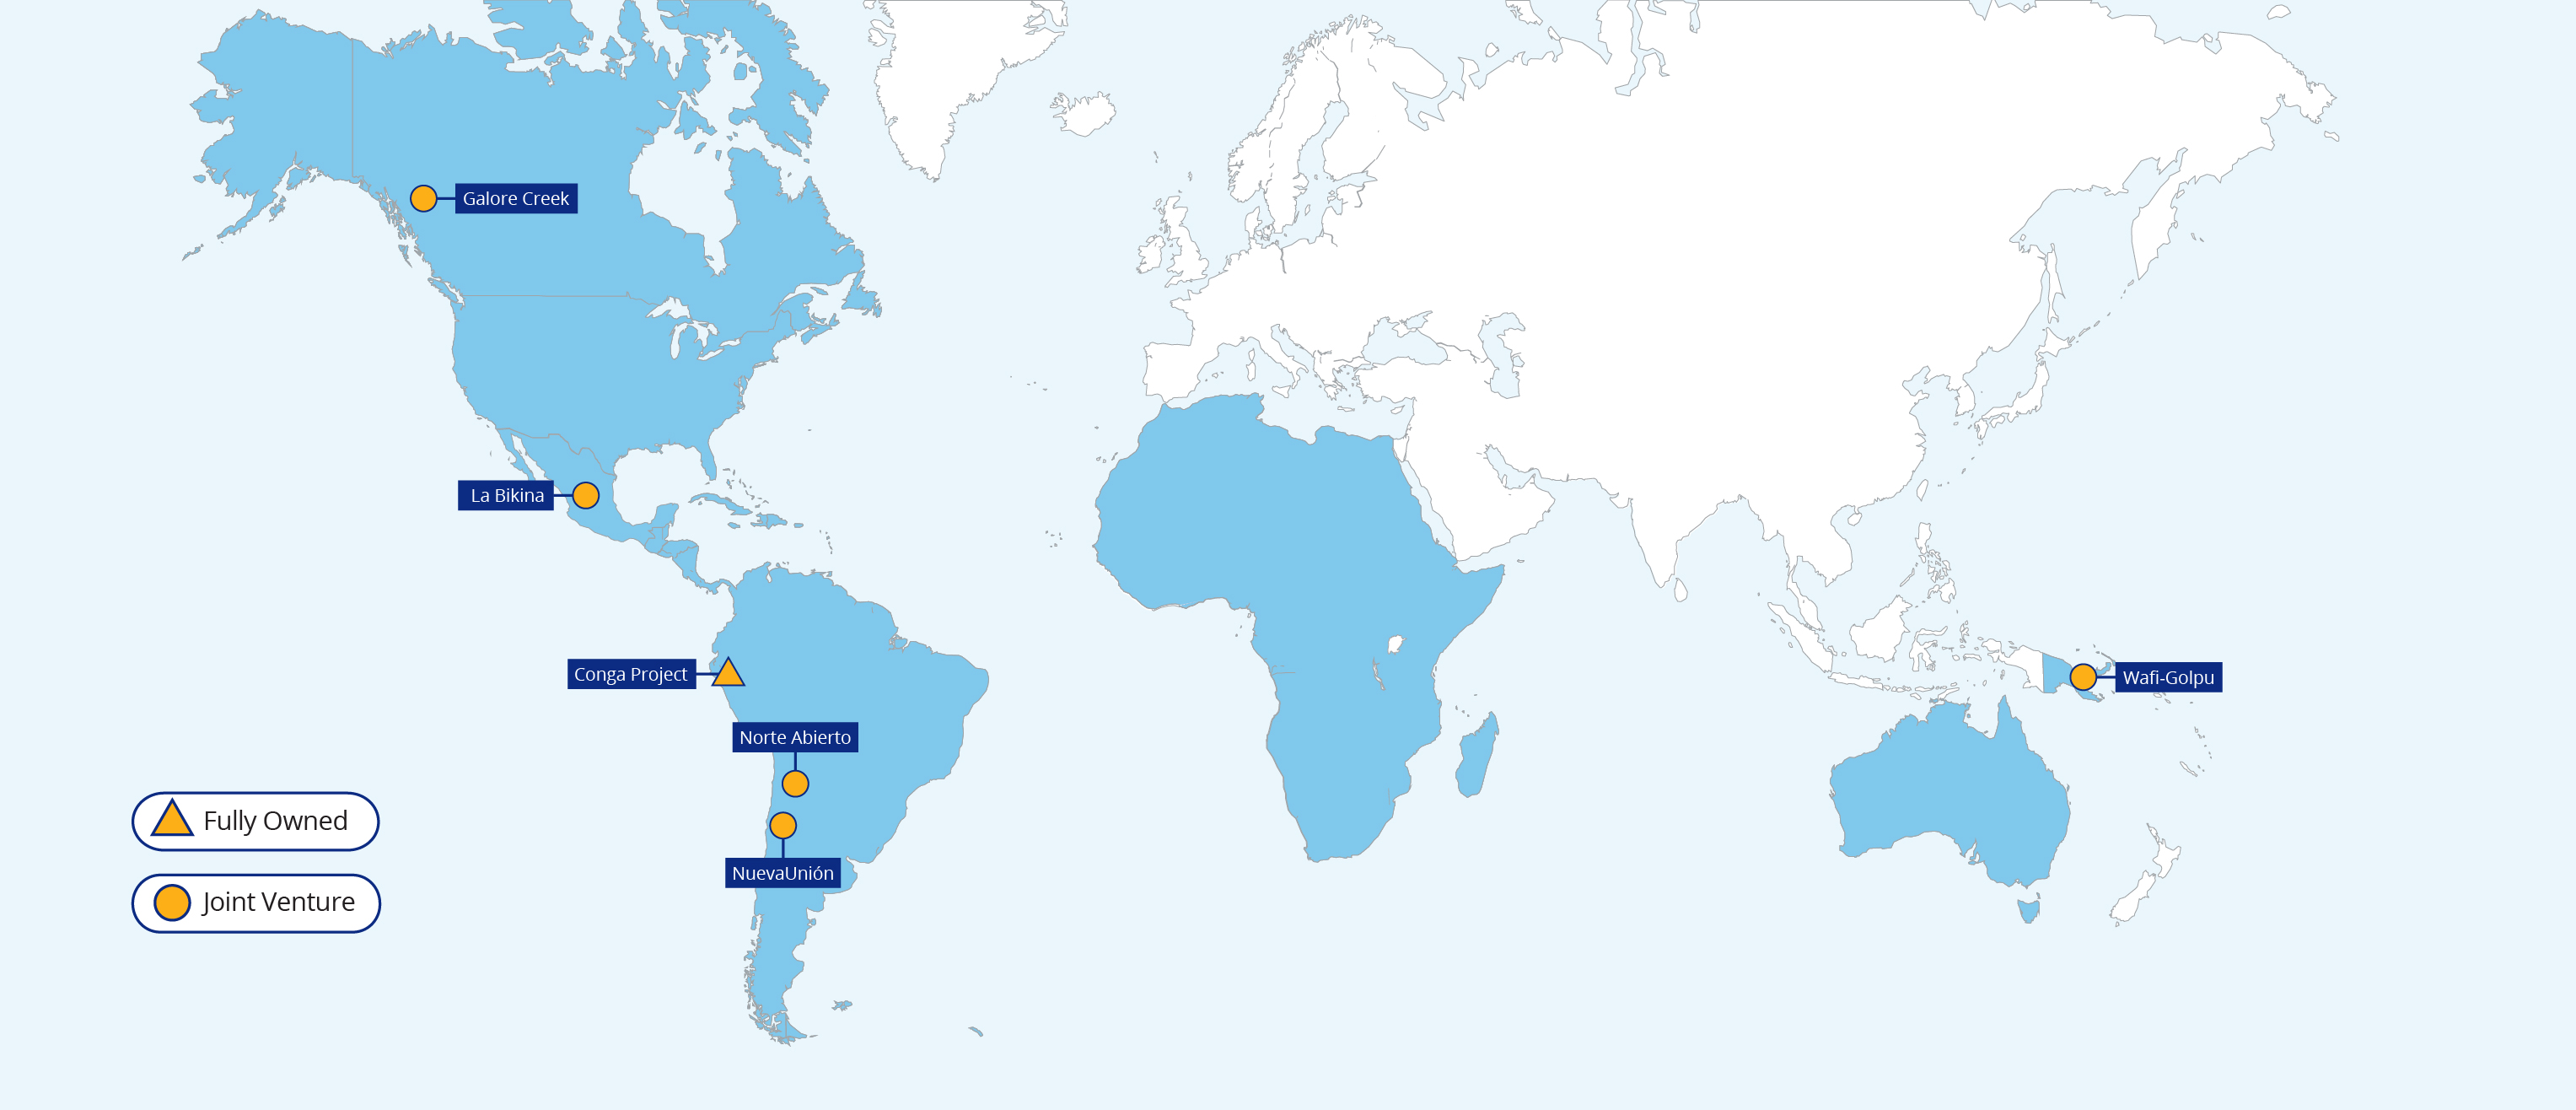
2025 Dev Exp Map.jpg
Newmont’s development and exploration stage properties are set forth below for which we have declared reserves and/or resources. As these are in the development and exploration stages, the properties have not reached commercial production and do not have processing plants or other available facilities.
61

Table of Contents
PropertyStageSize and LocationOwnership Type and OperatorMine Types and Mineralization StylesTitles, Mineral Rights, Leases or Options
Wafi-Golpu
(50% owned)
Development31,862 acres (12,894 hectares); located approximately 40 miles from the city of Lae, Papua New Guinea.Joint venture with Harmony Gold Mining Company Limited that is jointly operated and proportionately consolidated.Contains three separate but genetically related deposits: (1) Nambonga, a mineralized copper-gold quartz vein array; (2) Wafi, a high sulphidation epithermal gold deposit; and (3) Golpu, a mineralized multiphase porphyry style copper-gold deposit.Consists of two exploration licenses. The State of PNG retains the right to purchase, at a pro rata share of accumulated exploration expenditure, up to 30% equity interest in any mineral discovery at Wafi-Golpu, at any time before the commencement of mining.
NuevaUnión
(50% owned)
Development414,262 acres (167,646 hectares); located in the Atacama Region of Chile.
Joint venture with Teck Resources Limited that is jointly operated and accounted for as an equity method investment.
Open pit mine and is a porphyry copper gold deposit.Consists of 546 exploitation licenses and 630 exploration licenses.
Norte Abierto
(50% owned)
Development326,785 acres (132,245 hectares); located in the Atacama Region of Chile.
Joint venture with Barrick that is jointly operated and accounted for as an equity method investment.
Open pit mine and is a porphyry copper gold deposit with minor epithermal gold deposits.Consists of 504 exploitation licenses, 174 exploration licenses, and 26 water rights.
Conga Project
(100% owned)
Exploration35,427 acres (14,337 hectares); located within the Cajamarca Region of Northern Peru.Operated by Newmont.Consists of a cluster of porphyry gold-copper deposits, including the Chailhuagón and Perol open pits.Consists of one mining concession, included within the Yanacocha production property, and 278 surface rights (5,900 hectares).
La Bikina (1)
(50% owned)
Exploration3,946 acres (1,597 hectares); located 35 miles northwest of Caborca, Sonora, Mexico, within the Peñasquito production property.Joint venture with Minera Frisco; operated by Newmont.Intermediate sulfidation/skarn deposit. Consists of 32 mining concessions included within the Peñasquito production property.
Galore Creek
(50% owned)
Exploration455,502 acres (184,335 hectares); located 230 miles northwest of Smithers in British Columbia, Canada.
Joint venture with Teck Resources Limited that is jointly operated and proportionately consolidated.
Open pit mine and is an alkali porphyry copper gold deposit.Consists of 390 mineral claims.
____________________________
(1)Formerly Noche Buena.
62

Table of Contents
Operating Statistics
The following tables detail operating statistics related to gold production, ounces sold, and production costs per ounce of our continuing operations:
Mining and Production Detail (1)
Year Ended
December 31, 2025
Tonnes MinedTonnes Processed
Average Ore Grade (2)
Average Mill Recovery RateOunces ProducedOunces Sold
Open PitUndergroundMillLeachMillLeachMillLeachConsolidatedConsolidated
Lihir30,984 — 10,072 — 2.344 — 77.1%585 — 585 582 
Cadia— 29,581 29,520 — 0.524 — 79.0%385 — 385 384 
Tanami— 2,334 2,393 — 5.189 — 97.9%391 — 391 385 
Boddington79,235 — 36,532 — 0.572 — 85.0%565 — 565 550 
Ahafo South25,631 2,485 9,663 — 2.291 — 93.6%664 — 664 672 
Ahafo North (3)
4,595 — 621 — 2.602 — 93.0%70 — 70 58 
Merian (4)
45,920 — 12,815 — 0.644 — 92.0%237 — 237 238 
Cerro Negro— 789 790 — 8.287 — 95.5%202 — 202 196 
Yanacocha32,340 — — 25,935 — 0.844 —%— 515 515 517 
Peñasquito137,086 — 34,902 — 0.643 — 64.2%415 — 415 422 
Red Chris19,097 — 6,076 — 0.534 — 62.0%62 — 62 61 
Brucejack— 1,212 1,226 — 6.388 — 96.8%231 — 231 235 
NGM85,185 2,731 10,751 5,441 3.431 0.158 82.7%971 28 999 1,006 
Divested (5)
CC&V5,839 — — 2,813 — 0.427 —%— 28 28 27 
Musselwhite— 174 175 — 6.618 — 96.0%33 — 33 32 
Porcupine296 250 519 — 3.516 — 92.5%55 — 55 60 
Éléonore— 290 291 — 5.640 — 92.8%50 — 50 49 
Akyem7,013 — 2,073 — 0.708 — 90.8%43 — 43 45 
Total Gold (6)
473,221 39,846 158,419 34,189 1.183 0.700 83.5%4,959 571 5,530 5,519 
____________________________
(1)All amounts are reported in thousands unless otherwise noted.
(2)Average ore grade reported in grams/tonne.
(3)Ounces produced includes 21 development ounces.
(4)Merian produced 178 attributable ounces, which reflects our 75% ownership interest. Total attributable ounces were 5,471 ounces.
(5)Refer to Note 3 to the Consolidated Financial Statements for information on the Company's divestitures.
(6)Total gold consolidated ounces produced excludes 253 attributable ounces related to Pueblo Viejo, which is 40% owned by Newmont, managed by Barrick, and accounted for as an equity method investment.
63

Table of Contents
Production Costs per Ounce Sold (1)(2)
Year Ended
December 31, 2025
Direct Mining and Production CostsBy-Product CreditsRoyalties and Production Taxes Write-Downs and Inventory Change
Costs Applicable to Sales (3)
Depreciation and AmortizationReclamation and Remediation
Total Production Costs (4)
All-In Sustaining Costs per Ounce Sold (1)(2)
Lihir$1,662 $(2)$85 $(448)$1,297 $322 $23 $1,642 $1,607 
Cadia$877 $(136)$123 $(19)$845 $324 $7 $1,176 $1,253 
Tanami$1,023 $(3)$90 $4 $1,114 $323 $8 $1,445 $1,716 
Boddington$1,242 $(39)$90 $(49)$1,244 $233 $24 $1,501 $1,514 
Ahafo South$838 $(2)$403 $(12)$1,227 $276 $11 $1,514 $1,494 
Ahafo North$579 $(1)$210 $(256)$532 $168 $1 $701 $696 
Merian$1,369 $(1)$209 $(15)$1,562 $317 $20 $1,899 $1,921 
Cerro Negro$1,665 $(219)$180 $(32)$1,594 $633 $29 $2,256 $2,220 
Yanacocha$776 $(28)$106 $(59)$795 $218 $15 $1,028 $964 
Peñasquito$916 $(29)$73 $(38)$922 $382 $17 $1,321 $1,120 
Red Chris$1,366 $(36)$53 $(25)$1,358 $399 $40 $1,797 $1,750 
Brucejack$1,570 $(74)$46 $(77)$1,465 $775 $22 $2,262 $2,020 
NGM$1,328 $(76)$106 $(24)$1,334 $475 $11 $1,820 $1,629 
Divested (5)
CC&V$1,366 $(26)$190 $(133)$1,397 $62 $91 $1,550 $1,684 
Musselwhite$1,095 $(3)$91 $(143)$1,040 $— $19 $1,059 $1,531 
Porcupine$1,358 $(5)$52 $(105)$1,300 $19 $48 $1,367 $1,810 
Éléonore$1,031 $(2)$64 $11 $1,104 $— $13 $1,117 $1,403 
Akyem$1,611 $(11)$275 $483 $2,358 $62 $101 $2,521 $2,664 
Total Gold$1,175 $(44)$142 $(74)$1,199 $362 $17 $1,578 $1,609 
____________________________
(1)Production costs and All-in sustaining costs are not comparable due to differences in the items included in each of the measures. All-in sustaining costs is a non-GAAP financial measure. Refer to Non-GAAP Financial Measures within Part II, Item 7, MD&A.
(2)Per ounce measures may not recalculate due to rounding.
(3)Costs applicable to sales per ounce is calculated as the sum of Direct mining and production costs, By-product credits, Royalties and production taxes, and Write-downs and inventory change.
(4)Total production costs is calculated as the sum of Costs applicable to sales, Depreciation and amortization, and Reclamation and remediation.
(5)Refer to Note 3 to the Consolidated Financial Statements for information on the Company's divestitures.
64

Table of Contents
Mining and Production Detail (1)
Year Ended
December 31, 2024
Tonnes MinedTonnes Processed
Average Ore Grade (2)
Average Mill Recovery RateOunces ProducedOunces Sold
Open PitUndergroundMillLeachMillLeachMillLeachConsolidatedConsolidated
Lihir34,515 — 10,885 — 2.334 — 74.8%614 — 614 620 
Cadia— 30,742 29,824 — 0.626 — 79.6%464 — 464 454 
Tanami— 2,416 2,359 — 5.442 — 98.5%408 — 408 411 
Boddington68,208 — 34,936 — 0.623 — 85.2%590 — 590 581 
Ahafo South26,252 2,524 9,470 — 2.807 — 94.1%798 — 798 798 
Merian (3)
50,433 — 14,141 — 0.646 — 92.9%274 — 274 274 
Cerro Negro— 837 836 — 9.379 — 94.2%238 — 238 236 
Yanacocha 54,836 — — 23,265 — 0.396 —%— 354 354 352 
Peñasquito138,280 — 32,896 — 0.539 — 59.9%299 — 299 290 
Red Chris19,591 — 6,293 — 0.367 — 56.3%40 — 40 39 
Brucejack— 1,083 1,073 — 7.811 — 96.8%258 — 258 249 
NGM82,300 2,642 11,140 3,859 3.296 0.205 82.3%974 65 1,039 1,036 
Held for sale (4)
CC&V36,240 — — 21,029 — 0.443 —%— 146 146 144 
Musselwhite— 1,033 1,029 — 6.630 — 96.4%212 — 212 215 
Porcupine1,423 902 2,938 — 3.224 — 92.9%284 — 284 282 
Éléonore— 1,808 1,807 — 4.521 — 91.4%240 — 240 243 
Akyem24,210 — 8,287 — 0.857 — 89.0%204 — 204 212 
Divested (4)
Telfer25,568 639 3,665 — 0.770 — 89.9%73 10 83 103 
Total Gold (5)
561,856 44,626 171,579 48,153 1.292 0.401 84.7%5,970 575 6,545 6,539 
____________________________
(1)All amounts are reported in thousands unless otherwise noted.
(2)Average ore grade reported in grams/tonne.
(3)Merian produced 205 attributable ounces, which reflects our 75% ownership interest. Total attributable ounces were 6,476 ounces.
(4)Refer to Note 3 to the Consolidated Financial Statements for information on the Company's divestitures.
(5)Total gold consolidated ounces produced excludes 235 attributable ounces related to Pueblo Viejo, which is 40% owned by Newmont, managed by Barrick, and accounted for as an equity method investment.
65

Table of Contents
Production Costs per Ounce Sold (1)(2)
Year Ended
December 31, 2024
Direct Mining and Production CostsBy-Product CreditsRoyalties and Production TaxesWrite-Downs and Inventory Change
Costs Applicable to Sales (3)
Depreciation and AmortizationReclamation and Remediation
Total Production Costs (4)
All-In Sustaining Costs per Ounce Sold (1)(2)
Lihir$1,575 $(1)$59 $(363)$1,270 $270 $19 $1,559 $1,512 
Cadia$681 $(103)$82 $(7)$653 $263 $5 $921 $1,048 
Tanami$900 $(2)$60 $(11)$947 $300 $5 $1,252 $1,281 
Boddington$1,057 $(24)$62 $(39)$1,056 $193 $16 $1,265 $1,288 
Ahafo South$644 $(2)$199 $63 $904 $270 $9 $1,183 $1,072 
Merian$1,300 $(1)$144 $14 $1,457 $305 $16 $1,778 $1,852 
Cerro Negro$1,359 $(120)$121 $(35)$1,325 $521 $19 $1,865 $1,631 
Yanacocha$968 $(19)$72 $(18)$1,003 $279 $21 $1,303 $1,196 
Peñasquito$755 $(5)$40 $(14)$776 $355 $14 $1,145 $984 
Red Chris$1,257 $(11)$35 $(56)$1,225 $367 $43 $1,635 $1,607 
Brucejack$1,317 $(36)$32 $(59)$1,254 $691 $19 $1,964 $1,603 
NGM$1,208 $(60)$74 $(3)$1,219 $413 $12 $1,644 $1,605 
Held for sale (5)
CC&V$1,568 $(13)$135 $(300)$1,390 $90 $76 $1,556 $1,691 
Musselwhite$953 $(3)$75 $20 $1,045 $86 $16 $1,147 $1,541 
Porcupine$998 $(6)$43 $62 $1,097 $127 $33 $1,257 $1,437 
Éléonore$1,271 $(2)$54 $16 $1,339 $88 $15 $1,442 $1,811 
Akyem$1,105 $(7)$297 $201 $1,596 $271 $65 $1,932 $1,816 
Divested (5)
Telfer$3,443 $(9)$63 $(1,120)$2,377 $142 $110 $2,629 $2,993 
Total Gold$1,110 $(27)$94 $(51)$1,126 $304 $19 $1,449 $1,516 
____________________________
(1)Production Costs and All-in sustaining costs are not comparable due to differences in the items included in each of the measures. All-in sustaining costs is a non-GAAP financial measure. Refer to Non-GAAP Financial Measures within Part II, Item 7, MD&A.
(2)Per ounce measures may not recalculate due to rounding.
(3)Costs applicable to sales per ounce is calculated as the sum of Direct mining and production costs, By-product credits, Royalties and production taxes, and Write-downs and inventory change.
(4)Total production costs is calculated as the sum of Costs applicable to sales, Depreciation and amortization, and Reclamation and remediation.
(5)Refer to Note 3 to the Consolidated Financial Statements for information on the Company's divestitures.

66

Table of Contents
Mining and Production Detail (1)
Year Ended
December 31, 2023
Tonnes MinedTonnes Processed
Average Ore Grade (2)
Average Mill Recovery RateOunces ProducedOunces Sold
Open PitUndergroundMillLeachMillLeachMillLeachConsolidatedConsolidated
Lihir (3)
6,395 — 2,061 — 2.567— 76.5%134 — 134 131 
Cadia (3)
— 4,366 5,229 — 0.722— 81.5%97 — 97 120 
Tanami— 2,314 2,369 — 6.012— 98.3%448 — 448 444 
Boddington61,543 — 36,467 — 0.754— 85.4%745 — 745 749 
Telfer (3)
6,435 206 2,807 — 0.649— 73.2%43 — 43 67 
Ahafo South26,851 2,344 7,976 — 2.399— 93.9%581 — 581 578 
Akyem24,494 — 7,646 — 1.317— 89.5%295 — 295 296 
Merian (4)
41,031 — 14,403 — 0.758— 91.3%322 — 322 319 
Cerro Negro— 1,076 1,084 — 8.314— 92.8%269 — 269 261 
Porcupine6,972 859 2,911 — 3.015— 91.4%260 — 260 258 
Éléonore— 1,656 1,661 — 4.785— 91.0%232 — 232 233 
Yanacocha62,173 — — 19,682 — 0.494—%— 276 276 275 
Musselwhite— 1,027 1,028 — 5.701— 95.7%180 — 180 181 
Peñasquito96,099 — 20,850 — 0.429— 57.0%143 — 143 130 
CC&V38,555 — — 25,566 — 0.452—%— 172 172 171 
Red Chris (3)
3,769 — 1,139 — 0.276— 54.2%5 — 5 4 
Brucejack (3)
— 167 166 — 5.685— 96.0%29 — 29 36 
NGM100,728 2,490 11,426 10,853 3.4870.398 82.5%1,057 113 1,170 1,167 
Total Gold (5)
475,045 16,505 119,223 56,101 1.4630.45686.7%4,840 561 5,401 5,420 
____________________________
(1)All amounts are reported in thousands unless otherwise noted.
(2)Average ore grade reported in grams/tonne.
(3)Sites acquired through the Newcrest transaction in 2023. Refer to Note 3 to the Consolidated Financial Statements for further information.
(4)Merian produced 242 attributable ounces, which reflects our 75% ownership interest. Total attributable ounces were 5,321 ounces.
(5)Total gold consolidated ounces produced excludes 224 attributable ounces related to Pueblo Viejo, which is 40% owned by Newmont, managed by Barrick, and accounted for as an equity method investment.
67

Table of Contents
Production Costs per Ounce Sold (1)(2)
Year Ended
December 31, 2023
Direct Mining and Production CostsBy-Product CreditsRoyalties and Production TaxesWrite-Downs and Inventory Change
Costs Applicable to Sales (3)
Depreciation and AmortizationReclamation and Remediation
Total Production Costs (4)
All-In Sustaining Costs per Ounce Sold (1)(2)
Lihir (5)
$1,235 $(2)$50 $(166)$1,117 $153 $— $1,270 $1,517 
Cadia (5)
$477 $(59)$51 $610 $1,079 $130 $1 $1,210 $1,271 
Tanami$704 $(2)$51 $6 $759 $249 $4 $1,012 $1,060 
Boddington$822 $(17)$49 $(7)$847 $144 $12 $1,003 $1,067 
Telfer (5)
$1,360 $(9)$60 $471 $1,882 $87 $— $1,969 $1,988 
Ahafo South$820 $(1)$141 $(13)$947 $312 $11 $1,270 $1,222 
Akyem$826 $(6)$115 $(4)$931 $413 $40 $1,384 $1,210 
Merian$1,080 $(1)$117 $11 $1,207 $256 $9 $1,472 $1,541 
Cerro Negro$1,261 $(102)$93 $5 $1,257 $524 $14 $1,795 $1,509 
Porcupine$1,214 $(4)$25 $(68)$1,167 $455 $33 $1,655 $1,577 
Éléonore$1,230 $(2)$44 $(9)$1,263 $433 $13 $1,709 $1,838 
Yanacocha$1,122 $(16)$59 $(96)$1,069 $310 $20 $1,399 $1,266 
Musselwhite$1,152 $(2)$48 $(12)$1,186 $444 $17 $1,647 $1,843 
Peñasquito$1,296 $(6)$33 $(104)$1,219 $516 $28 $1,763 $1,590 
CC&V$1,327 $(7)$121 $(285)$1,156 $136 $59 $1,351 $1,644 
Red Chris (5)
$1,825 $(1)$27 $(946)$905 $298 $15 $1,218 $1,439 
Brucejack (5)
$1,484 $(41)$30 $425 $1,898 $617 $— $2,515 $2,646 
NGM$1,037 $(55)$68 $20 $1,070 $387 $9 $1,466 $1,397 
Total Gold$999 $(23)$74 $— $1,050 $327 $15 $1,392 $1,444 
____________________________
(1)Production costs and All-in sustaining costs are not comparable due to differences in the items included in each of the measures. All-in sustaining costs is a non-GAAP financial measure. Refer to Non-GAAP Financial Measures within Part II, Item 7, MD&A.
(2)Per ounce measures may not recalculate due to rounding.
(3)Costs applicable to sales per ounce is calculated as the sum of Direct mining and production costs, By-product credits, Royalties and production taxes, and Write-downs and inventory change.
(4)Total production costs is calculated as the sum of Costs applicable to sales, Depreciation and amortization, and Reclamation and remediation.
(5)Sites acquired through the Newcrest transaction in 2023. Refer to Note 3 to the Consolidated Financial Statements for further information.
68

Table of Contents
The following tables detail operating statistics related to co-product metal production and sales:
Year Ended December 31, 2025
Tonnes Milled
(thousands)
Average Milled Grade (1)
Average Mill Recovery RateConsolidated Pounds/Ounces Produced (millions)Consolidated Pounds/Ounces Sold (millions)
Copper (pounds)
Cadia29,520 0.34%84.3%180 180 
Boddington36,532 0.09%81.0%53 53 
Red Chris6,076 0.58%83.3%63 61 
Total Copper72,128 0.23%83.5%296 294 
Silver (ounces) (2)
34,901 34.1081.2%28 28 
Lead (pounds) (2)
34,901 0.38%77.5%216 209 
Zinc (pounds) (2)
34,901 0.96%82.7%509 542 
Year Ended December 31, 2024
Tonnes Milled
(thousands)
Average Milled Grade (1)
Average Mill Recovery RateConsolidated Pounds/Ounces Produced (millions)Consolidated Pounds/Ounces Sold (millions)
Copper (pounds)
Cadia29,824 0.36%84.5%191186 
Boddington34,936 0.14%83.1%8383 
Telfer (3)
3,665 0.11%73.8%66 
Red Chris6,293 0.52%83.4%58 57 
Total Copper74,718 0.26%83.7%338 332 
Silver (ounces) (2)
32,896 42.6181.3%33 33 
Lead (pounds) (2)
32,896 0.41%75.9%212 213 
Zinc (pounds) (2)
32,896 1.13%83.0%569 545 
Year Ended December 31, 2023
Tonnes Milled
(thousands)
Average Milled Grade (1)
Average Mill Recovery RateConsolidated Pounds/Ounces Produced (millions)Consolidated Pounds/Ounces Sold (millions)
Copper (pounds)
Cadia (4)
5,229 0.38%85.3%36 45 
Boddington36,467 0.16%84.2%98 98 
Telfer (4)
2,807 0.08%59.3%3 5 
Red Chris (4)
1,139 0.40%81.2%8 7 
Total Copper45,642 0.18%83.6%145 155 
Silver (ounces) (2)
20,850 36.6579.1%18 17 
Lead (pounds) (2)
20,850 0.37%69.3%113 107 
Zinc (pounds) (2)
20,850 0.78%78.5%230 222 
____________________________
(1)Average milled grade is calculated as the percentage of the respective metal contained in the total tonnes that were milled, with the exception of silver, which is reported in grams/tonne.
(2)All of our silver, lead, and zinc co-product production came from Peñasquito.
(3)In the fourth quarter of 2024, the Company completed the sale of the assets of the Telfer reportable segment. Refer to Note 3 to the Consolidated Financial Statements for further information.
(4)Sites acquired through the Newcrest transaction in 2023. Refer to Note 3 to the Consolidated Financial Statements for further information.
The following tables detail operating statistics related to co-product metal production costs per gold equivalent ounce (“GEO”) sold. Gold equivalent ounces are calculated as pounds or ounces produced multiplied by the ratio of the other metals’ price to the gold price, using the metal prices as provided in Results of Consolidated Operations within Part II, Item 7 below.
69

Table of Contents
Year Ended December 31, 2025CadiaBoddingtonPeñasquitoRed ChrisTotal / Weighted-Average
Consolidated GEO sold (thousands)370 109 820 126 1,425 
Production costs per GEO sold: (1)(2)
Costs applicable to sales$812 $1,165 $1,066 $1,341 $1,032 
Depreciation and amortization326 223 402 399 368 
Reclamation and remediation7 23 18 40 17 
Total production costs per GEO sold$1,145 $1,411 $1,486 $1,780 $1,417 
All-in sustaining costs per GEO sold (1)(2)
$1,230 $1,397 $1,318 $1,692 $1,392 
Year Ended December 31, 2024CadiaBoddingtonPeñasquito
Red Chris
Telfer (3)
Total / Weighted-Average
Consolidated GEO sold (thousands)465 205 1,088 142 16 1,916 
Production costs per GEO sold: (1)(2)
Costs applicable to sales$603 $994 $831 $1,209 $2,398 $834 
Depreciation and amortization263 189 343 366 161 307 
Reclamation and remediation5 16 15 37 106 15 
Total production costs per GEO sold$871 $1,199 $1,189 $1,612 $2,665 $1,156 
All-in sustaining costs per GEO sold (1)(2)
$987 $1,172 $1,090 $1,640 $2,885 $1,161 
Year Ended December 31, 2023
Cadia (3)
BoddingtonPeñasquito
Red Chris (3)
Telfer (3)
Total / Weighted-Average
Consolidated GEO sold (thousands)1142465071613896
Production costs per GEO sold: (1)(2)
Costs applicable to sales$1,017 $830 $1,283 $1,020 $1,703 $1,127 
Depreciation and amortization127 144 561 181 109 378 
Reclamation and remediation— 12 28 — 6 19 
Total production costs per GEO sold$1,144 $986 $1,872 $1,201 $1,818 $1,524 
All-in sustaining costs per GEO sold (1)(2)
$1,342 $1,067 $1,756 $1,660 $2,580 $1,579 
____________________________
(1)Production costs and All-in sustaining costs are not comparable due to differences in the items included in each of the measures. All-in sustaining costs is a non-GAAP financial measure. Refer to Non-GAAP Financial Measures within Part II, Item 7, MD&A. All-in sustaining costs per GEO are non-GAAP financial measures. Refer to Non-GAAP Financial Measures within Part II, Item 7, MD&A.
(2)Per GEO measures may not recalculate due to rounding.
(3)Sites acquired through the Newcrest transaction in 2023. In the fourth quarter of 2024, the Company completed the sale of the assets of the Telfer reportable segment. Refer to Note 3 to the Consolidated Financial Statements for further information.
Proven and Probable Reserves
All of our reserves are located on land (i) we own or control, or (ii) that is owned or controlled by business entities established with our joint venture partners, in which the Company owns its pro-rata share of the capital stock, membership units, or interests. The risks that could affect title to our property are included above in Item 1A, Risk Factors.
A “mineral reserve” is an estimate of tonnage and grade or quality of measured and indicated mineral resources that, in the opinion of the qualified person, can be the basis of an economically viable project. More specifically, it is the economically mineable part of a measured or indicated mineral resource, which includes diluting materials and allowances for losses that may occur when the material is mined or extracted. The term “economically viable,” as used in the definition of reserve, means that the qualified person has analytically determined that extraction of the mineral reserve is economically viable under reasonable investment and market assumptions.
70

Table of Contents
The term “proven reserves” means the economically mineable part of a measured mineral resource and can only result from conversion of a measured mineral resource. The term “probable reserves” means reserves for which quantity and grade are computed from information similar to that used for proven reserves, but the sites for sampling are less closely spaced. The degree of assurance, although lower than that for proven reserves, is high enough to assume continuity between points of observation. Proven and probable reserves include gold, copper, silver, lead, zinc or molybdenum attributable to Newmont’s ownership or economic interest.
Proven and probable reserves are based on extensive drilling, sampling, mine modeling and metallurgical testing from which we determined economic feasibility. The reference point for mineral reserves is the point of delivery to the process plant. Metal price assumptions, adjusted for our exchange rate assumption, are based on such factors as market forecasts, industry consensus and management estimates. The price sensitivity of reserves depends upon several factors including grade, metallurgical recovery, operating cost, waste-to-ore ratio and ore type. Metallurgical recovery rates vary depending on the metallurgical properties of each deposit and the production process used. The reserve tables below list the average metallurgical recovery rate for each deposit, which takes into account the relevant processing methods. The cut-off grade, or lowest grade of mineralization considered economic to process, varies between deposits depending upon prevailing economic conditions, mineability of the deposit, by-products, amenability of the ore to gold, copper, silver, lead, zinc or molybdenum extraction and type of milling or leaching facilities available. Reserve estimates may have non-material differences in comparison to our joint venture partners due to differences in classification and rounding methodology.
The proven and probable reserve figures presented herein are estimates based on information available at the time of calculation. No assurance can be given that the indicated levels of recovery of gold, copper, silver, lead, zinc and molybdenum will be realized. Ounces of gold or silver or pounds of copper, lead, zinc or molybdenum included in the proven and probable reserves are those contained prior to losses during metallurgical treatment. Reserve estimates may require revision based on actual production. Market fluctuations in the price of gold, copper, silver, lead, zinc and molybdenum, as well as increased production costs or reduced metallurgical recovery rates, could render certain proven and probable reserves containing higher cost reserves uneconomic to exploit and might result in a reduction of reserves.
We had attributable proven and probable gold reserves of 118.2 million ounces at December 31, 2025. For 2025 and 2024, reserves were estimated at a gold price assumption of $2,000 and $1,700 per ounce, respectively, except as noted below. The increase in the reserves gold price assumption is based on the Company's assessment of multiple factors, including historical gold pricing trends, consensus price forecasts, and impacts of inflation. We estimate that our 2025 reserves would increase by 5% (6.4 million ounces), or decline by 2% (2.8 million ounces), if the gold price assumption increased or decreased $100 per ounce, respectively, with all other assumptions remaining constant.
We publish reserves annually, and will recalculate reserves at December 31, 2026, taking into account metal prices, changes, if any, to future production and capital costs, divestments and depletion as well as any acquisitions and additions during 2026.
The Company has internal controls for reviewing and documenting the information supporting the mineral reserve and mineral resource estimates, describing the methods used, and ensuring the validity of the estimates. Information that is utilized to compile mineral reserves and resources is prepared and certified by appropriately qualified persons at the mine site level and is subject to our internal review process which includes review by the Newmont-designated site and the Qualified Person (“QP”) based in our corporate office in Denver, Colorado. Additionally, all material sites are generally audited on a three-year cycle, and non-material sites on a four-year cycle, by subject matter experts for compliance with internal standards, guidelines, and applicable regulatory requirements. Audit timing may be adjusted, as appropriate, based on factors such as site-specific risk assessments, the presence or absence of material changes, or alignment with the timing of significant projects of planned additions. The QP presents the mineral reserve and mineral resource information to the Audit Committee and the Disclosure Committee on an annual basis for further review.
The following tables detail proven and probable reserves reflecting only those reserves attributable to Newmont’s ownership or economic interest at December 31, 2025 and 2024.
71

Table of Contents
Gold Reserves at December 31, 2025 (1)
Proven ReservesProbable ReservesProven and Probable Reserves
Metallurgical
Recovery (3)
Deposits/DistrictsNewmont
Share
Tonnage (2)
(000 tonnes)
Grade
(g/tonne)
Ounces (3)
(000)
Tonnage (2)
(000 tonnes)
Grade
(g/tonne)
Ounces (3)
(000)
Tonnage (2)
(000 tonnes)
Grade
(g/tonne)
Ounces (3)
(000)
Lihir Open Pits
100%— —— 147,900 2.5512,100 147,900 2.5512,100 76%
Lihir Stockpiles (4)
100%— —— 72,300 1.653,800 72,300 1.653,800 76%
Total Lihir, Papua New
Guinea (5)
100%— —— 220,200 2.2616,000 220,200 2.2616,000 76%
Wafi-Golpu, Papua New Guinea (6)(7)
50%— —— 194,500 0.825,100 194,500 0.825,100 68%
Cadia, Australia (8)
100%— —— 1,007,600 0.4213,500 1,007,600 0.4213,500 81%
Tanami, Australia
100%10,100 4.881,600 22,700 5.103,700 32,800 5.035,300 98%
Boddington Open Pit
100%265,300 0.625,300 216,300 0.584,100 481,700 0.609,300 85%
Boddington Stockpiles (4)
100%5,600 0.56100 57,800 0.43800 63,400 0.44900 84%
Total Boddington, Australia (9)
100%271,000 0.615,400 274,100 0.554,900 545,100 0.5810,200 85%
Ahafo South Open Pit (10)
100%2,500 1.16100 40,900 1.481,900 43,400 1.462,000 88%
Ahafo South Underground (11)
100%9,400 2.51800 10,000 2.23700 19,400 2.371,500 94%
Ahafo South Stockpiles (4)(12)
100%18,500 0.94600 — —— 18,500 0.94600 91%
Total Ahafo South, Ghana100%30,400 1.441,400 50,900 1.632,700 81,300 1.564,100 91%
Ahafo North, Ghana (13)
100%— —— 65,500 2.234,700 65,500 2.234,700 89%
Total Ahafo Complex, Ghana
100%30,400 1.441,400 116,500 1.977,400 146,900 1.868,800 90%
Merian, Suriname
75%24,800 1.211,000 104,600 1.063,600 129,400 1.094,500 93%
Cerro Negro, Argentina
100%2,200 11.20800 6,800 10.382,300 9,000 10.583,000 94%
Pueblo Viejo Open Pit40%35,800 2.222,600 51,300 1.953,200 87,100 2.065,800 81%
Pueblo Viejo Stockpiles (4)
40%— —— 36,900 2.042,400 36,900 2.042,400 81%
Total Pueblo Viejo, Dominican Republic (7)(14)
40%35,800 2.222,600 88,200 1.995,600 123,900 2.068,200 81%
NuevaUnión, Chile (7)(15)
50%— —— 341,100 0.475,100 341,100 0.475,100 66%
Norte Abierto, Chile (7)(16)
50%— —— 521,100 0.6510,800 521,100 0.6510,800 86%
Yanacocha, Peru
100%18,800 0.81500 — —— 18,800 0.81500 71%
Peñasquito Open Pits100%79,500 0.541,400 114,800 0.441,600 194,300 0.483,000 62%
Peñasquito Stockpiles (4)
100%4,900 0.44100 21,800 0.21100 26,700 0.25200 45%
Total Peñasquito, Mexico
100%84,400 0.531,400 136,600 0.401,800 221,000 0.453,200 61%
Red Chris, Canada (17)
70%2,600 0.32— 178,900 0.633,600 181,500 0.623,600 69%
Brucejack, Canada
100%— —— 13,500 6.652,900 13,500 6.652,900 96%
NGM Open Pit (18)
38.5%— —— 131,100 1.024,300 131,100 1.024,300 75%
NGM Stockpiles (4)(19)
38.5%6,800 1.29300 20,800 2.351,600 27,600 2.091,800 67%
NGM Underground (20)
38.5%4,200 11.671,600 37,900 7.939,700 42,100 8.3011,200 84%
Total NGM, United States (21)
38.5%10,900 5.241,800 189,800 2.5415,500 200,700 2.6917,400 80%
Total Gold490,900 1.0416,500 3,416,100 0.93101,800 3,907,000 0.94118,200 81%
72

Table of Contents
Gold Reserves at December 31, 2024 (1)
Proven ReservesProbable ReservesProven and Probable Reserves
Metallurgical
Recovery (3)
Deposits/DistrictsNewmont
Share
Tonnage (2)
(000 tonnes)
Grade
(g/tonne)
Ounces (3)
(000)
Tonnage (2)
(000 tonnes)
Grade
(g/tonne)
Ounces (3)
(000)
Tonnage (2)
(000 tonnes)
Grade
(g/tonne)
Ounces (3)
(000)
Lihir Open Pits100%— —— 125,900 2.8611,600 125,900 2.8611,600 77%
Lihir Stockpiles (4)
100%— —— 77,100 1.684,200 77,100 1.684,200 77%
Total Lihir, Papua New
Guinea
100%— —— 203,000 2.4115,800 203,000 2.4115,800 77%
Wafi-Golpu, Papua New Guinea (7)
50%— —— 194,500 0.825,100 194,500 0.825,100 68%
Cadia, Australia
100%— —— 1,051,800 0.4214,100 1,051,800 0.4214,100 81%
Tanami, Australia
100%10,100 5.251,700 19,800 5.283,400 29,900 5.275,100 98%
Boddington Open Pit
100%276,500 0.645,600 219,200 0.614,300 495,700 0.629,900 84%
Boddington Stockpiles (4)
100%2,100 0.67— 61,900 0.42800 64,100 0.43900 83%
Total Boddington, Australia100%278,600 0.645,700 281,200 0.575,100 559,800 0.6010,800 84%
Ahafo South Open Pit
100%2,400 2.64200 39,700 1.572,000 42,000 1.632,200 89%
Ahafo South Underground
100%6,100 2.97600 15,200 2.361,200 21,300 2.541,700 94%
Ahafo South Stockpiles (4)
100%21,700 0.97700 — —— 21,700 0.97700 91%
Total Ahafo South, Ghana100%30,200 1.511,500 54,800 1.793,200 85,000 1.694,600 91%
Ahafo North, Ghana
100%— —— 62,000 2.324,600 62,000 2.324,600 91%
Total Ahafo Complex, Ghana
100%30,200 1.511,500 116,800 2.077,800 147,000 1.969,200 91%
Merian, Suriname
75%23,400 1.26900 87,300 1.143,200 110,700 1.164,100 93%
Cerro Negro, Argentina
100%2,200 11.84800 7,100 10.502,400 9,300 10.823,200 94%
Pueblo Viejo Open Pit40%32,200 2.272,300 49,500 2.043,300 81,700 2.135,600 88%
Pueblo Viejo Stockpiles (4)
40%— —— 38,800 2.072,600 38,800 2.072,600 83%
Total Pueblo Viejo, Dominican Republic (7)(14)
40%32,200 2.272,300 88,300 2.065,800 120,500 2.118,200 86%
NuevaUnión, Chile (7)(15)
50%— —— 341,100 0.475,100 341,100 0.475,100 66%
Norte Abierto, Chile (7)(16)
50%— —— 598,800 0.6011,600 598,800 0.6011,600 74%
Yanacocha Open Pits
100%17,700 0.90500 96,300 0.782,500 114,100 0.802,900 55%
Yanacocha Underground
100%— —— 12,300 6.062,400 12,300 6.062,400 97%
Total Yanacocha, Peru100%17,800 0.90500 108,600 1.384,800 126,400 1.315,300 74%
Peñasquito Open Pits100%93,900 0.581,700 130,800 0.482,000 224,700 0.523,800 62%
Peñasquito Stockpiles (4)
100%4,700 0.60100 27,300 0.21200 32,000 0.26300 37%
Total Peñasquito, Mexico
100%98,600 0.581,800 158,100 0.442,200 256,600 0.494,100 60%
Red Chris, Canada
70%— —— 186,400 0.623,700 186,400 0.623,700 69%
Brucejack, Canada100%— —— 8,600 6.951,900 8,600 6.951,900 96%
NGM Open Pit38.5%— —— 124,200 1.164,600 124,200 1.164,600 77%
NGM Stockpiles (4)
38.5%16,400 1.861,000 12,900 2.361,000 29,200 2.082,000 69%
NGM Underground38.5%4,000 11.281,400 39,700 7.739,900 43,700 8.0611,300 89%
Total NGM, United States (21)
38.5%20,400 3.692,400 176,800 2.7215,500 197,100 2.8217,900 84%
Held for sale (22)
CC&V Open Pit
100%87,000 0.431,200 28,600 0.44400 115,600 0.431,600 58%
CC&V Leach Pads (23)
100%— —— 34,600 0.73800 34,600 0.73800 55%
Total CC&V, United States100%87,000 0.431,200 63,200 0.601,200 150,200 0.502,400 57%
Musselwhite, Canada
100%4,100 6.69900 3,200 6.10600 7,400 6.431,500 96%
Porcupine Underground
100%1,600 5.09300 2,700 7.27600 4,400 6.46900 89%
Porcupine Open Pit
100%300 2.09— 30,200 1.461,500 30,600 1.461,500 93%
Total Porcupine, Canada100%2,000 4.57300 33,000 1.942,100 34,900 2.092,300 92%
Éléonore, Canada
100%2,200 4.86300 7,900 5.101,300 10,100 5.051,600 92%
Akyem Open Pit
100%12,700 1.52600 5,500 1.58300 18,200 1.54900 90%
Akyem Stockpiles (4)
100%700 0.72— — —— 700 0.72— 90%
Total Akyem, Ghana100%13,500 1.48600 5,500 1.58300 19,000 1.51900 90%
Total Gold622,100 1.0621,100 3,741,000 0.94113,000 4,363,000 0.96134,100 81%
____________________________
(1)At December 31, 2025 and 2024, gold reserves at sites for which Newmont is the operator were estimated at a gold price of $2,000 and $1,700 per ounce, respectively, unless otherwise noted. Reserves provided by other operators may use pricing that differs. Amounts presented may not recalculate in total due to rounding.
73

Table of Contents
(2)Tonnages include allowances for losses resulting from mining methods. Tonnages are rounded to the nearest 100,000.
(3)Ounces are estimates of metal contained in ore tonnages and do not include allowances for processing losses. Metallurgical recovery rates represent the estimated amount of metal to be recovered through metallurgical extraction processes. Ounces may not recalculate as they are rounded to the nearest 100,000.
(4)Stockpiles are comprised primarily of material that has been set aside to allow processing of higher grade material in the mills. Stockpiles increase or decrease depending on current mine plans. Stockpile reserves are reported separately where ounces exceed 100,000 and are greater than 5% of the total site-reported reserves.
(5)Cut-off grade utilized in 2025 reserves not less than 1.00 gram per tonne.
(6)Project is currently undeveloped. Gold reserves at December 31, 2025 were estimated at a gold price of $1,200 per ounce.
(7)Included in the non-operating segment Corporate and Other in Note 4 to the Consolidated Financial Statements.
(8)The net smelter return value utilized in 2025 reserves not less than $24.62 per tonne.
(9)The net smelter return value utilized in 2025 reserves not less than $18.24 per tonne.
(10)Cut-off grade utilized in 2025 reserves not less than 0.49 gram per tonne.
(11)Cut-off grade utilized in 2025 reserves not less than 1.80 gram per tonne.
(12)Cut-off grade utilized in 2025 reserves not less than 0.48 gram per tonne.
(13)Cut-off grade utilized in 2025 reserves not less than 0.60 gram per tonne.
(14)The Pueblo Viejo mine, which is 40% owned by Newmont, is accounted for as an equity method investment. Gold reserves at December 31, 2025 were estimated at a gold price of $1,500 per ounce. Gold reserves at December 31, 2025 and 2024 were provided by Barrick, the operator of Pueblo Viejo.
(15)Project is currently undeveloped. Gold reserves at December 31, 2025 were estimated at a gold price of $1,300 per ounce. Gold reserves at December 31, 2025 and 2024 were provided by the NuevaUnión joint venture.
(16)Project is currently undeveloped. Gold reserves at December 31, 2025 were estimated at a gold price of $1,700 per ounce. Gold reserves at December 31, 2025 and 2024 were provided by the Norte Abierto joint venture.
(17)Gold reserves related to the underground mine at December 31, 2025 were estimated at a gold price of $1,300 per ounce.
(18)Cut-off grade utilized in 2025 reserves not less than 0.15 gram per tonne.
(19)Cut-off grade utilized in 2025 reserves not less than 0.44 gram per tonne.
(20)Cut-off grade utilized in 2025 reserves not less than 3.34 gram per tonne.
(21)Gold reserves at December 31, 2025 were estimated at a gold price of $1,500 per ounce. Gold reserves at December 31, 2025 and 2024 were provided by Barrick, the operator of the NGM joint venture.
(22)Sites were classified as held for sale as of December 31, 2024 and were divested as of December 31, 2025. Refer to Note 3 of the Consolidated Financial Statements for further information on the Company's divestitures.
(23)Leach pad material is the material on leach pads at the end of the year from which gold remains to be recovered. In-process reserves are reported separately where ounces exceed 100,000 and are greater than 5% of the total site-reported reserves.

Copper Reserves at December 31, 2025 (1)
Proven ReservesProbable ReservesProven and Probable Reserves
Metallurgical
Recovery (3)
Deposits/DistrictsNewmont
Share
Tonnage (2)
(000 tonnes)
Grade
(Cu %)
Tonnes (3)
(000)
Tonnage (2)
(000 tonnes)
Grade
(Cu %)
Tonnes (3)
(000)
Tonnage (2)
(000 tonnes)
Grade
(Cu %)
Tonnes (3)
(000)
Wafi-Golpu, Papua New Guinea (4)(5)
50%— —%— 194,500 1.20%2,300 194,500 1.20%2,300 95%
Cadia, Australia (6)
100%— —%— 1,007,600 0.29%2,900 1,007,600 0.29%2,900 87%
Boddington, Australia (7)
100%271,000 0.09%200 274,100 0.10%300 545,100 0.09%500 81%
NuevaUnión, Chile (5)(8)
50%— —%— 1,118,000 0.40%4,400 1,118,000 0.40%4,400 88%
Norte Abierto, Chile (5)(9)
50%— —%— 521,100 0.24%1,200 521,100 0.24%1,200 79%
Red Chris, Canada (10)
70%2,600 0.41%— 178,900 0.52%900 181,500 0.52%900 84%
NGM, United States (11)
38.5%3,700 0.15%— 76,500 0.18%100 80,200 0.18%100 68%
Total Copper 277,300 0.09%200 3,370,700 0.36%12,300 3,648,000 0.34%12,500 87%
74

Table of Contents
Copper Reserves at December 31, 2024 (1)
Proven ReservesProbable ReservesProven and Probable Reserves
Metallurgical
Recovery (3)
Deposits/DistrictsNewmont
Share
Tonnage (2)
(000 tonnes)
Grade
(Cu %)
Tonnes (3)
(000)
Tonnage (2)
(000 tonnes)
Grade
(Cu %)
Tonnes (3)
(000)
Tonnage (2)
(000 tonnes)
Grade
(Cu %)
Tonnes (3)
(000)
Wafi-Golpu, Papua New Guinea (5)
50%— —%— 194,500 1.20%2,300 194,500 1.20%2,300 95%
Cadia, Australia
100%— —%— 1,051,800 0.29%3,100 1,051,800 0.29%3,100 87%
Boddington, Australia
100%278,600 0.09%200 281,200 0.10%300 559,800 0.09%500 81%
NuevaUnión, Chile (5)(8)
50%— —%— 1,118,000 0.40%4,400 1,118,000 0.40%4,400 88%
Norte Abierto, Chile (5)(9)
50%— —%— 598,800 0.22%1,300 598,800 0.22%1,300 87%
Yanacocha, Peru
100%— —%— 111,100 0.63%700 111,100 0.63%700 83%
Red Chris, Canada
70%— —%— 186,400 0.52%1,000 186,400 0.52%1,000 84%
NGM, United States (11)
38.5%4,300 0.16%— 71,000 0.18%100 75,400 0.18%100 66%
Total Copper282,900 0.09%200 3,612,900 0.37%13,200 3,895,800 0.35%13,500 88%
____________________________
(1)At December 31, 2025 and 2024, copper reserves at sites for which Newmont is the operator were estimated at a copper price of $3.75 and $3.50 per pound, respectively, unless otherwise noted. Reserves provided by other operators may use pricing that differs. Amounts presented may not recalculate in total due to rounding.
(2)Tonnages include allowances for losses resulting from mining methods. Tonnages are rounded to nearest 100,000.
(3)Tonnes are estimates of metal contained in ore tonnages and do not include allowances for processing losses. Metallurgical recovery rates represent the estimated amount of metal to be recovered through metallurgical extraction processes. Tonnes may not recalculate as they are rounded to the nearest 100,000.
(4)Project is currently undeveloped. Copper reserves at December 31, 2025 were estimated at a copper price of $3.00 per pound.
(5)Included in the non-operating segment Corporate and Other in Note 4 to the Consolidated Financial Statements.
(6)The net smelter return value utilized in 2025 reserves not less than $24.62 per tonne.
(7)The net smelter return value utilized in 2025 reserves not less than $18.24 per tonne.
(8)Project is currently undeveloped. Copper reserves at December 31, 2025 were estimated at a copper price of $3.00 per pound. Copper reserves at December 31, 2025 and 2024 were provided by the NuevaUnión joint venture.
(9)Project is currently undeveloped. Copper reserves at December 31, 2025 were estimated at a copper price of $3.50. Copper reserves at December 31, 2025 and 2024 were provided by the Norte Abierto joint venture.
(10)Copper reserves related to the underground mine at December 31, 2025 were estimated at a copper price of $3.00 per pound.
(11)Copper cut-off grade varies with gold and silver credits. Copper reserves at December 31, 2025 were estimated at a copper price of $3.25 per ounce. Copper reserves at December 31, 2025 and 2024 were provided by Barrick, the operator of the NGM joint venture.
Silver Reserves at December 31, 2025 (1)
Proven ReservesProbable ReservesProven and Probable Reserves
Metallurgical
Recovery (3)
Deposits/DistrictsNewmont
Share
Tonnage (2)
(000 tonnes)
Grade
(g/tonne)
Ounces (3)
(000)
Tonnage (2)
(000 tonnes)
Grade
(g/tonne)
Ounces (3)
(000)
Tonnage (2)
(000 tonnes)
Grade
(g/tonne)
Ounces (3)
(000)
Cadia, Australia (4)
100%— —— 1,007,600 0.6721,800 1,007,600 0.6721,800 67%
Cerro Negro, Argentina
100%2,200 84.415,900 6,800 66.2014,400 9,000 70.6220,300 74%
Pueblo Viejo Open Pits
40%35,800 12.0113,800 51,300 11.5819,100 87,100 11.7632,900 53%
Pueblo Viejo Stockpiles (5)
40%— —— 36,900 13.5916,100 36,900 13.5916,100 53%
Total Pueblo Viejo, Dominican Republic (6)(7)
40%35,800 12.0113,800 88,200 12.4235,200 123,900 12.3049,000 53%
NuevaUnión, Chile (7)(8)
50%— —— 1,118,000 1.3147,200 1,118,000 1.3147,200 66%
Norte Abierto, Chile (7)(9)
50%— —— 521,100 1.6127,000 521,100 1.6127,000 76%
Yanacocha, Peru
100%— —— 68,300 8.8219,400 68,300 8.8219,400 5%
Peñasquito Open Pits
100%79,500 34.5088,200 114,800 31.09114,700 194,300 32.49202,900 83%
Peñasquito Stockpiles (5)
100%4,900 47.377,500 21,800 27.9019,600 26,700 31.4827,000 76%
Total Peñasquito, Mexico
100%84,400 35.2595,700 136,600 30.58134,300 221,000 32.37230,000 82%
Brucejack, Canada100%— —— 13,500 29.3912,800 13,500 29.3912,800 83%
NGM Open Pit38.5%— —— 66,200 6.5413,900 66,200 6.5413,900 38%
NGM Stockpiles (5)
38.5%2,700 7.89700 — —— 2,700 7.89700 38%
Total NGM, United States (10)
38.5%2,700 7.89700 66,200 6.5413,900 68,900 6.5914,600 38%
Total Silver 125,000 28.88116,000 3,026,200 3.35326,000 3,151,200 4.36442,000 71%
75

Table of Contents
Silver Reserves at December 31, 2024 (1)
Proven ReservesProbable ReservesProven and Probable Reserves
Metallurgical
Recovery (3)
Deposits/DistrictsNewmont
Share
Tonnage (2)
(000 tonnes)
Grade
(g/tonne)
Ounces (3)
(000)
Tonnage (2)
(000 tonnes)
Grade
(g/tonne)
Ounces (3)
(000)
Tonnage (2)
(000 tonnes)
Grade
(g/tonne)
Ounces (3)
(000)
Cadia, Australia
100%— —— 1,051,800 0.6722,800 1,051,800 0.6722,800 68%
Cerro Negro, Argentina
100%2,200 89.856,400 7,100 65.8715,000 9,300 71.5821,400 75%
Pueblo Viejo Open Pits
40%32,200 12.4412,900 49,500 11.4918,300 81,700 11.8631,200 71%
Pueblo Viejo Stockpiles (5)
40%— —— 38,800 14.2217,700 38,800 14.2217,700 71%
Total Pueblo Viejo, Dominican Republic (6)(7)
40%32,200 12.4412,900 88,300 12.6936,000 120,500 12.6248,900 71%
NuevaUnión, Chile (7)(8)
50%— —— 1,118,000 1.3147,200 1,118,000 1.3147,200 66%
Norte Abierto, Chile (7)(9)
50%— —— 598,800 1.5229,300 598,800 1.5229,300 74%
Yanacocha Open Pits and Underground
100%— —— 93,400 19.8959,800 93,400 19.8959,800 54%
Yanacocha Stockpiles and Leach Pads (5)(11)
100%— —— 78,900 9.3323,600 78,900 9.3323,600 13%
Total Yanacocha, Peru100%— —— 172,300 15.0583,400 172,300 15.0583,400 43%
Peñasquito Open Pits
100%93,900 34.68104,700 130,800 28.52119,900 224,700 31.09224,600 83%
Peñasquito Stockpiles (5)
100%4,700 25.383,800 27,300 28.3224,800 32,000 27.8928,700 73%
Total Peñasquito, Mexico
100%98,600 34.24108,500 158,100 28.49144,800 256,600 30.70253,300 82%
Brucejack, Canada100%— —— 8,600 34.369,500 8,600 34.369,500 83%
NGM Open Pit38.5%— —— 54,600 7.7813,700 54,600 7.7813,700 38%
NGM Stockpiles (5)
38.5%3,200 7.87800 — —— 3,200 7.87800 38%
Total NGM, United States (10)
38.5%3,200 7.87800 54,600 7.7813,700 57,900 7.7814,500 38%
Total Silver136,200 29.37128,600 3,257,700 3.83401,600 3,393,800 4.86530,200 71%
____________________________
(1)At December 31, 2025 and 2024, silver reserves at sites for which Newmont is the operator were estimated at a silver price of $25 and $20 per ounce, respectively, unless otherwise noted. Reserves provided by other operators may use pricing that differs. Amounts presented may not recalculate in total due to rounding.
(2)Tonnages include allowances for losses resulting from mining methods. Tonnages are rounded to nearest 100,000.
(3)Ounces are estimates of metal contained in ore tonnages and do not include allowances for processing losses. Metallurgical recovery rates represent the estimated amount of metal to be recovered through metallurgical extraction processes. Ounces may not recalculate as they are rounded to the nearest 100,000.
(4)The net smelter return value utilized in 2025 reserves not less than $24.62 per tonne.
(5)Stockpiles are comprised primarily of material that has been set aside to allow processing of higher grade material in the mills. Stockpiles increase or decrease depending on current mine plans. Stockpile reserves are reported separately where ounces exceed 100,000 and are greater than 5% of the total site-reported reserves.
(6)The Pueblo Viejo mine, which is 40% owned by Newmont, is accounted for as an equity method investment. Silver reserves at December 31, 2025 were estimated at a silver price of $21 per ounce. Silver reserves at December 31, 2025 and 2024 were provided by Barrick, the operator of Pueblo Viejo.
(7)Included in the non-operating segment Corporate and Other in Note 4 to the Consolidated Financial Statements.
(8)Project is currently undeveloped. Silver reserves at December 31, 2025 were estimated at a silver price of $18 per ounce. Silver reserves at December 31, 2025 and 2024 were provided by the NuevaUnión joint venture.
(9)Project is currently undeveloped. Silver reserves at December 31, 2025 were estimated at a silver price of $25 per ounce. Silver reserves at December 31, 2025 and 2024 were provided by the Norte Abierto joint venture.
(10)Silver cut-off grade varies with gold and copper credits. Silver reserves at December 31, 2025 were estimated at a silver price of $21 per ounce. Silver reserves at December 31, 2025 and 2024 were provided by Barrick, the operator of the NGM joint venture.
(11)Leach pad material is the material on leach pads at the end of the year from which silver remains to be recovered. In-process reserves are reported separately where ounces exceed 100,000 and are greater than 5% of the total site-reported reserves.

Lead Reserves at December 31, 2025 (1)
Proven ReservesProbable ReservesProven and Probable Reserves
Metallurgical
Recovery (3)
Deposits/DistrictsNewmont
Share
Tonnage (2)
(000 tonnes)
Grade
(Pb %)
Tonnes (3)
(000)
Tonnage (2)
(000 tonnes)
Grade
(Pb %)
Tonnes (3)
(000)
Tonnage (2)
(000 tonnes)
Grade
(Pb %)
Tonnes (3)
(000)
Peñasquito, Mexico
100%84,400 0.34%300 136,600 0.28%400 221,000 0.30%700 75%
Total Lead84,400 0.34%300 136,600 0.28%400 221,000 0.30%700 75%
76

Table of Contents
Lead Reserves at December 31, 2024 (1)
Proven ReservesProbable ReservesProven and Probable Reserves
Metallurgical
Recovery (3)
Deposits/DistrictsNewmont
Share
Tonnage (2)
(000 tonnes)
Grade
(Pb %)
Tonnes (3)
(000)
Tonnage (2)
(000 tonnes)
Grade
(Pb %)
Tonnes (3)
(000)
Tonnage (2)
(000 tonnes)
Grade
(Pb %)
Tonnes (3)
(000)
Peñasquito, Mexico
100%98,600 0.35%300 158,100 0.29%500 256,600 0.31%800 74%
Total Lead98,600 0.35%300 158,100 0.29%500 256,600 0.31%800 74%
____________________________
(1)At December 31, 2025 and 2024, lead reserves were estimated at a lead price of $0.90 per pound. Amounts presented may not recalculate in total due to rounding.
(2)Tonnages include allowances for losses resulting from mining methods. Tonnages are rounded to nearest 100,000.
(3)Tonnes are estimates of metal contained in ore tonnages and do not include allowances for processing losses. Metallurgical recovery rates represent the estimated amount of metal to be recovered through metallurgical extraction processes. Tonnes may not recalculate as they are rounded to the nearest 100,000.
Zinc Reserves at December 31, 2025 (1)
Proven ReservesProbable ReservesProven and Probable Reserves
Metallurgical
Recovery (3)
Deposits/DistrictsNewmont
Share
Tonnage (2)
(000 tonnes)
Grade
(Zn %)
Tonnes (3)
(000)
Tonnage (2)
(000 tonnes)
Grade
(Zn %)
Tonnes (3)
(000)
Tonnage (2)
(000 tonnes)
Grade
(Zn %)
Tonnes (3)
(000)
Peñasquito Open Pits,
Mexico
100%79,500 0.77%600 114,800 0.60%700 194,300 0.67%1,300 83%
Peñasquito Stockpiles,
Mexico (4)
100%4,900 1.25%100 21,800 0.54%100 26,700 0.67%200 78%
Total Zinc84,400 0.80%700 136,600 0.59%800 221,000 0.67%1,500 82%
Zinc Reserves at December 31, 2024 (1)
Proven ReservesProbable ReservesProven and Probable Reserves
Metallurgical
Recovery (3)
Deposits/DistrictsNewmont
Share
Tonnage (2)
(000 tonnes)
Grade
(Zn %)
Tonnes (3)
(000)
Tonnage (2)
(000 tonnes)
Grade
(Zn %)
Tonnes (3)
(000)
Tonnage (2)
(000 tonnes)
Grade
(Zn %)
Tonnes (3)
(000)
Peñasquito Open Pits,
Mexico
100%93,900 0.81%800 130,800 0.6%800 224,700 0.69%1,500 83%
Peñasquito Stockpiles,
Mexico (4)
100%4,700 0.80%— 27,300 0.54%100 32,000 0.58%200 75%
Total Zinc98,600 0.81%800 158,100 0.59%900 256,600 0.68%1,700 82%
____________________________
(1)At December 31, 2025 and 2024, zinc reserves were estimated at a zinc price of $1.20 per pound. Amounts presented may not recalculate in total due to rounding.
(2)Tonnages include allowances for losses resulting from mining methods. Tonnages are rounded to nearest 100,000.
(3)Tonnes are estimates of metal contained in ore tonnages and do not include allowances for processing losses. Metallurgical recovery rates represent the estimated amount of metal to be recovered through metallurgical extraction processes. Tonnes may not recalculate as they are rounded to the nearest 100,000.
(4)Stockpiles are comprised primarily of material that has been set aside to allow processing of higher grade material in the mills. Stockpiles increase or decrease depending on current mine plans. Stockpile reserves are reported separately where pounds exceed 100 million and are greater than 5% of the total site-reported reserves.
Molybdenum Reserves at December 31, 2025 (1)
Proven ReservesProbable ReservesProven and Probable Reserves
Metallurgical
Recovery (3)
Deposits/DistrictsNewmont
Share
Tonnage (2)
(000 tonnes)
Grade
(Mo %)
Tonnes (3)
(000)
Tonnage (2)
(000 tonnes)
Grade
(Mo %)
Tonnes (3)
(000)
Tonnage (2)
(000 tonnes)
Grade
(Mo %)
Tonnes (3)
(000)
Cadia, Australia (4)
100%— —%— 996,400 0.01%100 996,400 0.01%100 67%
NuevaUnión, Chile (5)(6)
50%— —%— 776,900 0.02%100 776,900 0.02%100 48%
Total Molybdenum— —%— 1,773,300 0.01%200 1,773,300 0.01%200 56%
Molybdenum Reserves at December 31, 2024 (1)
Proven ReservesProbable ReservesProven and Probable Reserves
Metallurgical
Recovery (3)
Deposits/DistrictsNewmont
Share
Tonnage (2)
(000 tonnes)
Grade
(Mo %)
Tonnes (3)
(000)
Tonnage (2)
(000 tonnes)
Grade
(Mo %)
Tonnes (3)
(000)
Tonnage (2)
(000 tonnes)
Grade
(Mo %)
Tonnes (3)
(000)
Cadia, Australia
100%— —%— 1,040,600 0.01%100 1,040,600 0.01%100 67%
NuevaUnión, Chile (5)(6)
50%— —%— 776,900 0.02%100 776,900 0.02%100 48%
Total Molybdenum— —%— 1,817,500 0.01%200 1,817,500 0.01%200 56%
77

Table of Contents
____________________________
(1)At December 31, 2025 and 2024, molybdenum reserves at sites for which Newmont is the operator were estimated at a molybdenum price of $13 per pound, unless otherwise noted. Amounts presented may not recalculate in total due to rounding.
(2)Tonnages include allowances for losses resulting from mining methods. Tonnages are rounded to nearest 100,000.
(3)Tonnes are estimates of metal contained in ore tonnages and do not include allowances for processing losses. Metallurgical recovery rates represent the estimated amount of metal to be recovered through metallurgical extraction processes. Tonnes may not recalculate as they are rounded to the nearest 100,000.
(4)The net smelter return value utilized in 2025 reserves not less than $25 per tonne.
(5)Project is currently undeveloped. Molybdenum reserves at December 31, 2025 were estimated at a molybdenum price of $10 per pound. Molybdenum reserves at December 31, 2025 and 2024 were provided by the NuevaUnión joint venture.
(6)Included in the non-operating segment Corporate and Other in Note 4 to the Consolidated Financial Statements.
Measured, Indicated, and Inferred Resources
All of our resources are located on land (i) we own or control, or (ii) that is owned or controlled by business entities established with our joint venture partners, in which the Company owns its pro-rata share of the capital stock, membership units, or interests. The risks that could affect title to our property are included above in Item 1A, Risk Factors.
The measured, indicated, and inferred resource figures presented herein are estimates based on information available at the time of calculation and are exclusive of reserves. A “mineral resource” is a concentration or occurrence of solid material of economic interest in or on the Earth’s crust in such form, grade, or quality and quantity that there are reasonable prospects for eventual economic extraction. The location, quantity, grade or quality, continuity and other geological characteristics of a mineral resource are known, estimated or interpreted from specific geological evidence and knowledge, including sampling. The reference point for mineral resources is in situ. Mineral resources are sub-divided, in order of increasing geological confidence, into inferred, indicated and measured categories. Ounces of gold and silver or pounds of copper, zinc, lead, and molybdenum included in the measured, indicated and inferred resources are those contained prior to losses during metallurgical treatment. The terms "measured resource," "indicated resource," and "inferred resource" mean that part of a mineral resource for which quantity and grade or quality are estimated on the basis of geological evidence and sampling that is considered to be comprehensive, adequate, or limited, respectively.
Market fluctuations in the price of gold, silver, copper, zinc, lead, and molybdenum, as well as increased production costs or reduced metallurgical recovery rates, could change future estimates of resources. Metal price assumptions are based on approximately a ten to twenty-five percent premium over reserve prices.
Our exploration efforts are directed to the discovery of new resources and converting them into proven and probable reserves. We conduct brownfield exploration around our existing mines and greenfield exploration in other locations globally. Brownfield exploration can result in the discovery of additional deposits, which may receive the economic benefit of existing operating, processing and administrative infrastructures. In contrast, the discovery of mineralization through greenfield exploration efforts will require capital investment to build a stand-alone operation. Our Exploration expense was $243, $266, and $265 for the years ended December 31, 2025, 2024, and 2023, respectively.
We had attributable measured and indicated gold resources of 88.1 million ounces and attributable inferred gold resources of 60.6 million ounces at December 31, 2025. For 2025 and 2024, attributable measured, indicated, and inferred gold resources were estimated at a gold price assumption of $2,300 and $2,000 per ounce, respectively, except as noted below. The increase in the resources gold price assumption is based on the Company's assessment of multiple factors, including historical gold pricing trends, consensus price forecasts, and impacts of inflation.
The resource figures presented herein do not include that part of our resources that have been converted to Proven and Probable Reserves as shown above, as they are reported exclusive of reserves, and have been estimated based on information available at the time of calculation.
The Company has internal controls for reviewing and documenting the information supporting the mineral reserve and mineral resource estimates, describing the methods used, and ensuring the validity of the estimates. Refer to Proven and Probable Reserves above for further information on these internal controls.
We publish measured, indicated, and inferred resources annually, and will recalculate them at December 31, 2026, taking into account metal prices, changes, if any, in future production and capital costs, divestments and conversion to reserves, as well as any acquisitions and additions during 2026.
The following tables detail measured, indicated, and inferred resources reflecting only those that are attributable to Newmont’s ownership or economic interest at December 31, 2025 and 2024.
78

Table of Contents
Gold Resources at December 31, 2025 (1)(2)
Measured ResourcesIndicated Resources
Measured and Indicated Resources
Inferred Resources
Deposits/DistrictsNewmont
Share
Tonnage
(000 tonnes)
Grade
(g/tonne)
Ounces (3)
(000)
Tonnage
(000 tonnes)
Grade
(g/tonne)
Ounces (3)
(000)
Tonnage
(000 tonnes)
Grade
(g/tonne)
Ounces (3)
(000)
Tonnage
(000 tonnes)
Grade
(g/tonne)
Ounces (3)
(000)
Metallurgical
Recovery (3)
Lihir, Papua New Guinea
100%———37,5001.992,40037,5001.992,400239,8002.418,30075%
Wafi-Golpu Open Pit (4)
50%———53,6001.662,90053,6001.662,90015,5001.360065%
Wafi-Golpu Underground (5)
50%———140,8000.452,000140,8000.452,00091,9000.61,90068%
Total Wafi-Golpu, Papua New Guinea (6)
50%— —— 194,5000.784,900194,5000.784,900107,3000.72,60067%
Cadia Underground100%———1,009,3000.299,4001,009,3000.299,400163,9000.21,30081%
Cadia Stockpiles
100%28,5000.30300———28,5000.30300———64%
Total Cadia, Australia
100%28,5000.303001,009,3000.299,4001,037,8000.299,700163,9000.21,30081%
Tanami Open Pit100%10,0001.6250027,3001.421,20037,2001.471,8005,5001.120090%
Tanami Underground100%2,6003.353006,8003.778009,4003.651,10017,6004.42,50096%
Total Tanami, Australia100%12,5001.9880034,1001.892,10046,6001.912,90023,1003.62,70094%
Boddington, Australia
100%97,3000.521,600168,2000.492,600265,5000.504,3003,8000.510085%
Ahafo South Open Pit100%1,0001.13—5,0000.721006,1000.792003,2001.110087%
Ahafo South Underground100%1,200 3.6910041,4003.845,10042,5003.845,20019,5002.91,80091%
Total Ahafo South, Ghana100%2,2002.4920046,4003.515,20048,6003.465,40022,7002.72,00091%
Ahafo North, Ghana100%6,6001.4430036,3001.742,00042,9001.692,30018,1001.690090%
Total Ahafo Complex, Ghana
100%8,7001.7050082,7002.737,30091,4002.637,70040,9002.22,90091%
Merian, Suriname75%5,2000.9620049,6001.051,70054,8001.051,80079,7000.82,10090%
Cerro Negro, Argentina
100%1,3003.732001,9005.423003,2004.735007,5005.11,20095%
Pueblo Viejo, Dominican Republic (6)(7)
40%7,3001.3130033,1001.371,50040,3001.361,8006,3001.530081%
NuevaUnión, Chile (6)(8)
50%4,8000.47100118,3000.592,300123,1000.592,300239,8000.43,10068%
Norte Abierto, Chile (6)(9)
50%77,7000.611,500525,5000.518,600603,2000.5210,100381,1000.45,30078%
Conga, Peru (6)(10)
100%———693,8000.6514,600693,8000.6514,600230,5000.42,90075%
Yanacocha Open Pit100%12,8000.4120099,1000.702,300111,9000.672,400360,3000.56,20058%
Yanacocha Underground100%3,8007.2890015,2005.132,50019,0005.563,4003,6004.960097%
Total Yanacocha, Peru (11)
100%16,6001.981,100114,3001.294,700130,9001.385,800363,9000.66,70071%
Peñasquito, Mexico
100%52,8000.30500172,1000.211,100224,9000.231,6009,2000.210056%
La Bikina, Mexico (6)
50%———19,9000.3720019,9000.372001,6000.2—50%
Galore Creek, Canada (6)(12)
50%212,8000.292,000385,6000.222,700598,4000.254,700118,9000.270075%
Red Chris, Canada (13)
70%———334,8000.343,700334,8000.343,70062,0000.370055%
Brucejack, Canada
100%———4,3004.136004,3004.1360014,5005.32,50096%
NGM Open Pit
38.5%2,9001.04100178,0000.643,600180,9000.643,70063,2000.81,50075%
NGM Underground38.5%1,4008.8340021,9006.344,50023,4006.504,90025,6006.95,70082%
Total NGM, Nevada (14)
38.5%4,3003.61500199,9001.268,100204,3001.318,60088,9002.57,30080%
Total Gold529,9000.569,5004,179,3000.5978,7004,709,3000.5888,1002,182,6000.960,60078%
79

Table of Contents
Gold Resources at December 31, 2024 (1)(2)
Measured ResourcesIndicated Resources
Measured and Indicated Resources
Inferred Resources
Deposits/DistrictsNewmont
Share
Tonnage
(000 tonnes)
Grade
(g/tonne)
Ounces (3)
(000)
Tonnage
(000 tonnes)
Grade
(g/tonne)
Ounces (3)
(000)
Tonnage
(000 tonnes)
Grade
(g/tonne)
Ounces (3)
(000)
Tonnage
(000 tonnes)
Grade
(g/tonne)
Ounces (3)
(000)
Metallurgical
Recovery (3)
Namosi, Fiji73.24%———105,5000.22700105,5000.227001,346,9000.14,30072%
Lihir, Papua New Guinea
100%———44,6001.972,80044,6001.972,800227,4002.417,60075%
Wafi-Golpu Open Pit50%———53,6001.662,90053,6001.662,90015,5001.360065%
Wafi-Golpu Underground50%———140,8000.452,000140,8000.452,00091,9000.61,90068%
Total Wafi-Golpu, Papua New
Guinea (6)
50%———194,5000.784,900194,5000.784,900107,3000.72,60067%
Cadia Underground100%———1,245,1000.3614,2001,245,1000.3614,200549,4000.34,80081%
Cadia Open Pit
100%30,8000.30300———30,8000.3030011,0000.720065%
Total Cadia, Australia
100%30,8000.303001,245,1000.3614,2001,275,9000.3514,500560,4000.35,00081%
Tanami Open Pit100%9,7001.6550026,5001.451,20036,2001.501,7005,3001.120090%
Tanami Underground100%2,8003.223006,6003.808009,3003.631,10017,2004.42,40097%
Total Tanami, Australia100%12,5001.9980033,0001.922,00045,5001.942,80022,5003.62,60094%
Boddington, Australia
100%90,6000.551,600154,1000.532,600244,7000.544,2003,5000.610084%
Ahafo South Open Pit
100%3,9001.131006,5000.8320010,4000.953003,5001.210085%
Ahafo South Underground
100%7003.8510027,1003.963,40027,8003.953,50011,5003.11,20091%
Total Ahafo South, Ghana100%4,7001.5620033,5003.353,60038,2003.133,80015,0002.71,30091%
Ahafo North, Ghana
100%6,9001.4130028,3001.781,60035,2001.711,90013,7001.670090%
Total Ahafo Complex, Ghana100%11,6001.4750061,8002.645,20073,4002.455,70028,7002.22,00091%
Merian, Suriname75%5,8001.0320058,6001.082,00064,5001.082,20070,0000.92,00090%
Cerro Negro, Argentina100%1,3003.772001,9005.653003,2004.885007,6004.81,20094%
Pueblo Viejo, Dominican Republic (6)(7)
40%8,2001.3940038,2001.441,80046,4001.432,1005,0001.630088%
NuevaUnión, Chile (6)(8)
50%4,8000.47100118,3000.592,300123,1000.592,300239,8000.43,10068%
Norte Abierto, Chile (6)(9)
50%77,2000.611,500596,9000.499,300674,2000.5010,800369,6000.44,40076%
Conga, Peru (6)
100%———693,8000.6514,600693,8000.6514,600230,5000.42,90075%
Yanacocha Open Pit100%16,6000.41200109,2000.401,400125,7000.401,600287,2000.65,10066%
Yanacocha Underground100%5004.071006,2004.709006,7004.651,0003,4005.050097%
Total Yanacocha, Peru
100%17,1000.52300115,4000.632,300132,5000.622,600290,7000.65,60072%
Peñasquito, Mexico
100%48,2000.30500163,1000.221,100211,3000.241,60021,1000.210057%
La Bikina, Mexico (6)
50%———19,9000.3720019,9000.372001,6000.2—50%
Galore Creek, Canada (6)(12)
50%212,8000.292,000385,6000.222,700598,4000.254,700118,9000.270075%
Red Chris, Canada
70%———335,1000.343,700335,1000.343,70062,1000.370055%
Brucejack, Canada
100%———4,3004.686004,3004.6860016,6005.83,10096%
NGM Open Pit
38.5%3,7001.24100158,5000.743,800162,2000.764,00056,7000.91,60072%
NGM Underground38.5%20023.5520021,5006.344,40021,8006.524,60025,1006.45,20087%
Total NGM, United States (14)
38.5%3,9002.51300180,0001.418,200183,9001.448,50081,8002.66,70082%
80

Table of Contents
Gold Resources at December 31, 2024 (1)(2) (continued)
Measured ResourcesIndicated Resources
Measured and Indicated Resources
Inferred Resources
Deposits/DistrictsNewmont
Share
Tonnage
(000 tonnes)
Grade
(g/tonne)
Ounces (3)
(000)
Tonnage
(000 tonnes)
Grade
(g/tonne)
Ounces (3)
(000)
Tonnage
(000 tonnes)
Grade
(g/tonne)
Ounces (3)
(000)
Tonnage
(000 tonnes)
Grade
(g/tonne)
Ounces (3)
(000)
Metallurgical
Recovery (3)
Held for sale (15)
CC&V, United States100%20,3000.5330026,5000.4840046,7000.5080071,4000.490051%
Musselwhite, Canada100%1,5004.212002,3004.103003,8004.155001,9005.030096%
Porcupine Underground100%———1,0007.703001,1007.593001,9007.850092%
Porcupine Open Pit100%———75,6001.513,70075,6001.513,70065,9001.42,90092%
Total Porcupine, Canada100%———76,6001.593,90076,6001.593,90067,9001.53,40092%
Éléonore, Canada100%4004.941002,9004.114003,3004.214002,4004.640092%
Coffee, Canada (6)
100%9002.1410049,3001.262,00050,2001.282,1006,7001.020081%
Akyem, Ghana
100%8000.73—9,7003.831,20010,6003.581,2005,5003.050092%
Total Gold548,8000.539,3004,717,0000.5990,1005,265,9000.5999,4003,967,8000.670,60078%
____________________________
(1)Resources are reported exclusive of reserves. Amounts presented may not recalculate in total due to rounding.
(2)At December 31, 2025 and 2024, gold resources at sites for which Newmont is the operator were estimated at a gold price of $2,300 and $2,000 per ounce, respectively, unless otherwise noted. Resources provided by other operators may use pricing that differs. Tonnage amounts have been rounded to the nearest 100,000.
(3)Ounces are estimates of metal contained in ore tonnages and do not include allowances for processing losses. Metallurgical recovery rates represent the estimated amount of metal to be recovered through metallurgical extraction processes. Ounces may not recalculate as they are rounded to the nearest 100,000.
(4)Project is currently undeveloped. Gold resources at December 31, 2025 were estimated at a gold price of $1,400 per ounce.
(5)Project is currently undeveloped. Gold resources at December 31, 2025 were estimated at a gold price of $1,300 per ounce.
(6)Included in the non-operating segment Corporate and Other in Note 4 to the Consolidated Financial Statements.
(7)The Pueblo Viejo mine, which is 40% owned by Newmont, is accounted for as an equity method investment. Gold resources at December 31, 2025 were estimated at a gold price of $2,000 per ounce. Gold resources at December 31, 2025 and 2024 were provided by Barrick, the operator of Pueblo Viejo.
(8)Project is currently undeveloped. Gold resources at December 31, 2025 were estimated at a gold price of $1,300 per ounce. Gold resources at December 31, 2025 and 2024 were provided by the NuevaUnión joint venture.
(9)Project is currently undeveloped. Gold resources at December 31, 2025 were estimated at a gold price of $2,000 per ounce. Gold resources at December 31, 2025 and 2024 were provided by the Norte Abierto joint venture.
(10)Gold resources at December 31, 2025 were estimated at a gold price of $1,400 per ounce.
(11)Gold resources related to the Yanacocha Sulfides project at December 31, 2025 were estimated at a gold price of $1,400 per ounce.
(12)Project is currently undeveloped. Resource estimates provided by Teck Resources, the Galore Creek joint venture partner.
(13)Gold resources related to the underground mine at December 31, 2025 were estimated at a gold price of $1,400 per ounce.
(14)Gold resources at December 31, 2025 were estimated at a gold price of $2,000 per ounce. Gold resources at December 31, 2025 and 2024 were provided by Barrick, the operator of the NGM joint venture.
(15)Sites were classified as held for sale as of December 31, 2024 and were divested as of December 31, 2025. Refer to Note 3 of the Consolidated Financial Statements for further information on the Company's divestitures.

81

Table of Contents
Copper Resources at December 31, 2025 (1)(2)
Measured ResourcesIndicated ResourcesMeasured and Indicated Resources Inferred Resources
Deposits/DistrictsNewmont
Share
Tonnage
(000 tonnes)
Grade
(Cu%)
Tonnes (3)
(000)
Tonnage
(000 tonnes)
Grade
(Cu%)
Tonnes (3)
(000)
Tonnage
(000 tonnes)
Grade
(Cu%)
Tonnes (3)
(000)
Tonnage
(000 tonnes)
Grade
(Cu%)
Tonnes (3)
(000)
Metallurgical
Recovery (3)
Wafi-Golpu, Papua New Guinea (4)(5)
50%— —%— 140,800 0.73%1,000 140,800 0.73%1,000 91,900 0.7%600 95%
Cadia, Australia
100%28,500 0.13%— 1,009,300 0.25%2,600 1,037,800 0.25%2,600 163,900 0.2%300 87%
Boddington, Australia100%97,300 0.12%100 168,200 0.11%200 265,500 0.11%300 3,800 0.1%— 82%
NuevaUnión, Chile (4)(6)
50%164,300 0.19%300 349,900 0.34%1,200 514,100 0.30%1,500 602,200 0.4%2,300 89%
Norte Abierto, Chile (4)(7)
50%58,000 0.23%100 479,900 0.20%900 537,900 0.20%1,100 373,300 0.2%800 86%
Conga, Peru (4)(8)
100%— —%— 693,800 0.26%1,800 693,800 0.26%1,800 230,500 0.2%400 84%
Yanacocha, Peru (9)
100%3,700 0.29%— 114,100 0.61%700 117,800 0.60%700 134,900 0.4%500 83%
Galore Creek, Canada (4)(10)
50%212,800 0.44%900 385,600 0.47%1,800 598,400 0.46%2,800 118,900 0.3%300 93%
Red Chris, Canada (11)
70%— —%— 334,800 0.34%1,100 334,800 0.34%1,100 62,000 0.4%200 81%
NGM, United States (12)
38.5%— —%— 130,600 0.16%200 130,600 0.16%200 12,100 0.1%— 69%
Total Copper564,600 0.27%1,500 3,806,800 0.30%11,600 4,371,500 0.30%13,100 1,793,400 0.3%5,600 88%
Copper Resources at December 31, 2024 (1)(2)
Measured ResourcesIndicated ResourcesMeasured and Indicated Resources Inferred Resources
Deposits/DistrictsNewmont
Share
Tonnage
(000 tonnes)
Grade
(Cu%)
Tonnes (3)
(000)
Tonnage
(000 tonnes)
Grade
(Cu%)
Tonnes (3)
(000)
Tonnage
(000 tonnes)
Grade
(Cu%)
Tonnes (3)
(000)
Tonnage
(000 tonnes)
Grade
(Cu%)
Tonnes (3)
(000)
Metallurgical
Recovery (3)
Namosi Open Pit73.24%— —%— 105,500 0.61%600 105,500 0.61%600 1,346,900 0.3%4,300 84%
Namosi Underground73.24%— —%— — —%— — —%— 209,900 0.4%900 92%
Total Namosi, Fiji (4)
73.24%— —%— 105,500 0.61%600 105,500 0.61%600 1,556,800 0.3%5,200 85%
Wafi-Golpu, Papua New Guinea (4)
50%— —%— 140,800 0.73%1,000 140,800 0.73%1,000 91,900 0.7%600 95%
Cadia, Australia
100%30,800 0.13%— 1,245,100 0.25%3,200 1,275,900 0.25%3,200 560,400 0.2%1,000 86%
Boddington, Australia100%90,600 0.12%100 154,100 0.11%200 244,700 0.12%300 3,500 0.1%— 83%
NuevaUnión, Chile (4)(6)
50%164,300 0.19%300 349,900 0.34%1,200 514,100 0.30%1,500 602,200 0.4%2,300 89%
Norte Abierto, Chile (4)(7)
50%57,600 0.24%100 551,300 0.19%1,100 608,900 0.20%1,200 361,800 0.2%700 90%
Conga, Peru (4)
100%— —%— 693,800 0.26%1,800 693,800 0.26%1,800 230,500 0.2%400 84%
Yanacocha, Peru
100%1,500 1.02%— 99,800 0.36%400 101,300 0.37%400 39,700 0.4%100 81%
Galore Creek, Canada (4)(10)
50%212,800 0.44%900 385,600 0.47%1,800 598,400 0.46%2,800 118,900 0.3%300 93%
Red Chris, Canada
70%— —%— 335,100 0.34%1,100 335,100 0.34%1,100 62,100 0.4%200 81%
NGM, United States (12)
38.5%— —%— 113,700 0.17%200 113,700 0.17%200 11,100 0.2%— 67%
Total Copper557,600 0.28%1,600 4,174,600 0.30%12,600 4,732,200 0.30%14,100 3,638,800 0.3%11,000 87%
____________________________
(1)Resources are reported exclusive of reserves. Amounts presented may not recalculate in total due to rounding.
(2)At December 31, 2025 and 2024, copper resources at sites in which Newmont is the operator were estimated at a copper price of $4.25 and $4.00 per pound, respectively, unless otherwise noted. Resources provided by other operators may use pricing that differs. Tonnage amounts have been rounded to the nearest 100,000.
(3)Tonnes are estimates of metal contained in ore tonnages and do not include allowances for processing losses. Metallurgical recovery rates represent the estimated amount of metal to be recovered through metallurgical extraction processes. Tonnes may not recalculate as they are rounded to the nearest 100,000.
82

Table of Contents
(4)Included in the non-operating segment Corporate and Other in Note 4 to the Consolidated Financial Statements.
(5)Project is currently undeveloped. Copper resources related to the open pit mine at December 31, 2025 were estimated at a copper price of $3.40 per pound.
(6)Project is currently undeveloped. Copper resources at December 31, 2025 were estimated at a copper price of $3.00 per pound. Copper resources at December 31, 2025 and 2024 were provided by the NuevaUnión joint venture.
(7)Project is currently undeveloped. Copper resources at December 31, 2025 were estimated at a copper price of $4.00 per pound. Copper resources at December 31, 2025 and 2024 were provided by the Norte Abierto joint venture.
(8)Copper resources at December 31, 2025 were estimated at a copper price of $3.50 per pound.
(9)Copper resources related to the Yanacocha Sulfides project at December 31, 2025 were estimated at a copper price of $3.25 per pound.
(10)Project is currently undeveloped. Resource estimates provided by Teck Resources.
(11)Copper resources related to the underground mine at December 31, 2025 were estimated at a copper price of $3.40 per pound.
(12)Copper resources at December 31, 2025 were estimated at a copper price of $4.50 per pound. Copper resources at December 31, 2025 and 2024 were provided by Barrick, the operator of the NGM joint venture.
Silver Resources at December 31, 2025 (1)(2)
Measured ResourcesIndicated Resources
Measured and Indicated Resources
Inferred Resources
Deposits/DistrictsNewmont
Share
Tonnage
(000 tonnes)
Grade
(g/tonne)
Ounces (3)
(000)
Tonnage
(000 tonnes)
Grade
(g/tonne)
Ounces (3)
(000)
Tonnage
(000 tonnes)
Grade
(g/tonne)
Ounces (3)
(000)
Tonnage
(000 tonnes)
Grade
(g/tonne)
Ounces (3)
(000)
Metallurgical
Recovery (3)
Wafi-Golpu, Papua New Guinea (4)
50%— —— 53,600 4.427,600 53,600 4.427,600 15,500 4.52,200 45%
Cadia, Australia
100%— —— 1,009,300 0.6220,200 1,009,300 0.6220,200 163,900 0.42,300 68%
Pueblo Viejo, Dominican Republic (4)(5)
40%7,300 6.951,600 33,100 7.798,300 40,300 7.649,900 6,300 8.31,700 53%
NuevaUnión, Chile (4)(6)
50%164,300 0.965,100 349,900 1.1913,400 514,100 1.1218,400 602,200 1.222,500 66%
Norte Abierto, Chile (4)(7)
50%77,700 1.213,000 525,500 1.0718,100 603,200 1.0921,100 381,100 1.012,600 79%
Peñasquito, Mexico100%52,800 28.3248,100 172,100 25.28139,900 224,900 26.00188,000 9,200 24.27,100 80%
La Bikina, Mexico (4)
50%— —— 19,900 13.999,000 19,900 13.999,000 1,600 11.0500 25%
Cerro Negro Underground100%100 72.50200 700 57.191,300 800 59.071,500 7,200 28.36,500 75%
Cerro Negro Open Pit100%1,200 6.76300 1,200 6.62300 2,400 6.70500 300 6.7100 71%
Total Cerro Negro, Argentina100%1,300 11.74500 1,900 25.501,600 3,200 19.882,000 7,500 27.46,600 75%
Conga, Peru (4)(8)
100%— —— 693,800 2.0645,900 693,800 2.0645,900 175,000 1.16,300 70%
Yanacocha Open Pit
100%15,600 7.913,900 96,300 19.8061,300 111,900 18.1465,200 89,500 14.341,300 55%
Yanacocha Leach Pad (9)
100%— —— 57,100 2.033,700 57,100 2.033,700 11,600 4.41,600 3%
Yanacocha Underground100%3,700 0.21— 14,900 15.497,400 18,600 12.457,400 3,600 38.44,400 83%
Total Yanacocha, Peru (10)
100%19,300 6.414,000 168,200 13.3972,400 187,500 12.6776,400 104,700 14.147,300 55%
Galore Creek, Canada (4)(11)
50%212,800 4.0827,900 385,600 4.7759,100 598,400 4.5287,000 118,900 2.69,900 73%
Brucejack, Canada
100%— —— 4,300 15.902,200 4,300 15.902,200 14,500 11.75,500 82%
NGM, United States (12)
38.5%— —— 121,000 5.2220,300 121,000 5.2220,300 10,100 5.41,800 38%
Total Silver535,5005.2490,200 3,538,100 3.67418,000 4,073,600 3.88508,200 1,610,400 2.4126,400 68%
83

Table of Contents
Silver Resources at December 31, 2024 (1)(2)
Measured ResourcesIndicated Resources
Measured and Indicated Resources
Inferred Resources
Deposits/DistrictsNewmont
Share
Tonnage
(000 tonnes)
Grade
(g/tonne)
Ounces (3)
(000)
Tonnage
(000 tonnes)
Grade
(g/tonne)
Ounces (3)
(000)
Tonnage
(000 tonnes)
Grade
(g/tonne)
Ounces (3)
(000)
Tonnage
(000 tonnes)
Grade
(g/tonne)
Ounces (3)
(000)
Metallurgical
Recovery (3)
Wafi-Golpu, Papua New Guinea (4)
50%— —— 53,600 4.427,600 53,600 4.427,600 15,500 4.52,200 45%
Cadia, Australia
100%— —— 1,245,100 0.6526,100 1,245,100 0.6526,100 549,400 0.47,900 67%
Pueblo Viejo, Dominican Republic (4)(5)
40%8,200 7.692,000 38,200 7.829,600 46,400 7.8011,600 5,000 6.81,100 71%
NuevaUnión, Chile (4)(6)
50%164,300 0.965,100 349,900 1.1913,400 514,100 1.1218,400 602,200 1.222,500 66%
Norte Abierto, Chile (4)(7)
50%77,200 1.203,000 596,900 1.0720,600 674,200 1.0923,500 369,600 1.011,300 78%
Peñasquito, Mexico
100%48,200 27.2242,200 163,100 24.84130,300 211,300 25.39172,400 21,100 25.417,200 80%
La Bikina, Mexico (4)
50%— —— 19,900 13.999,000 19,900 13.999,000 1,600 11.0500 25%
Cerro Negro Underground100%100 70.12300 700 61.421,400 900 62.671,700 7,300 26.56,200 76%
Cerro Negro Open Pit100%1,200 6.76300 1,200 6.62300 2,400 6.70500 300 6.7100 71%
Total Cerro Negro, Argentina100%1,300 12.61500 1,900 27.541,700 3,200 21.432,200 7,600 25.76,300 75%
Conga, Peru (4)
100%— —— 693,800 2.0645,900 693,800 2.0645,900 175,000 1.16,300 70%
Yanacocha Open Pit
100%16,300 6.713,500 103,900 10.1633,900 120,200 9.6937,400 26,300 13.411,400 43%
Yanacocha Leach Pad
100%— —— — —— — —— 62,700 2.24,500 4%
Yanacocha Underground100%500 0.37— 6,200 37.027,300 6,700 34.237,400 3,400 40.44,400 83%
Total Yanacocha, Peru (9)
100%16,800 6.523,500 110,100 11.6641,300 126,900 10.9844,800 92,400 6.820,300 47%
Galore Creek, Canada (4)(11)
50%212,800 4.0827,900 385,600 4.7759,100 598,400 4.5287,000 118,900 2.69,900 73%
Brucejack, Canada
100%— —— 4,300 19.682,700 4,300 19.682,700 16,600 11.66,200 82%
NGM, United States (12)
38.5%— —— 98,300 5.6417,800 98,300 5.6417,800 10,300 4.21,400 38%
Total Silver528,9004.9684,300 3,760,700 3.18385,000 4,289,600 3.40469,200 1,985,100 1.8113,200 69%
____________________________
(1)Resources are reported exclusive of reserves. Amounts presented may not recalculate in total due to rounding.
(2)At December 31, 2025 and 2024, silver resources at sites in which Newmont is the operator were estimated at a silver price of $28 and $23 per ounce, respectively, unless otherwise noted. Resources provided by other operators may use pricing that differs. Tonnage amounts have been rounded to the nearest 100,000.
(3)Ounces are estimates of metal contained in ore tonnages and do not include allowances for processing losses. Metallurgical recovery rates represent the estimated amount of metal to be recovered through metallurgical extraction processes. Ounces may not recalculate as they are rounded to the nearest 100,000.
(4)Included in the non-operating segment Corporate and Other in Note 4 to the Consolidated Financial Statements.
(5)Silver resources at December 31, 2025 were estimated at a silver price of $25 per ounce. Silver resources at December 31, 2025 and 2024 were provided by Barrick, the operator of the Pueblo Viejo.
(6)Project is currently undeveloped. Silver resources at December 31, 2025 were estimated at a silver price of $18 per ounce. Silver resources at December 31, 2025 and 2024 were provided by the NuevaUnión joint venture.
(7)Project is currently undeveloped. Silver resources at December 31, 2025 were estimated at a silver price of $23 per ounce. Silver resources at December 31, 2025 and 2024 were provided by the Norte Abierto joint venture.
(8)Silver resources at December 31, 2025 were estimated at a silver price of $26 per ounce.
(9)Leach pad material is the material on leach pads at the end of the year from which silver remains to be recovered. In-process resources are reported separately where ounces exceed 100,000 and are greater than 5% of the total site-reported resources.
(10)Silver resources related to the Yanacocha Sulfides project at December 31, 2025 were estimated at a silver price of $23 per ounce.
(11)Project is currently undeveloped. Resource estimates provided by Teck Resources.
(12)Silver resources at December 31, 2025 were estimated at a silver price of $25 per ounce. Silver resources at December 31, 2025 and 2024 were provided by Barrick, the operator of the NGM joint venture.
84

Table of Contents
Lead Resources at December 31, 2025 (1)(2)
Measured ResourceIndicated ResourceMeasured and Indicated ResourceInferred Resource
Deposits/DistrictsNewmont
Share
Tonnage
(000 tonnes)
Grade
(Pb%)
Tonnes (3)
(000)
Tonnage
(000 tonnes)
Grade
(Pb%)
Tonnes (3)
(000)
Tonnage
(000 tonnes)
Grade
(Pb%)
Tonnes (3)
(000)
Tonnage
(000 tonnes)
Grade
(Pb%)
Tonnes (3)
(000)
Metallurgical
Recovery (3)
Peñasquito, Mexico
100%52,800 0.26%100 172,100 0.24%400 224,900 0.24%500 9,200 0.2%— 73%
Total Lead52,800 0.26%100 172,100 0.24%400 224,900 0.24%500 9,200 0.2%— 73%
Lead Resources at December 31, 2024 (1)(2)
Measured ResourceIndicated ResourceMeasured and Indicated ResourceInferred Resource
Deposits/DistrictsNewmont
Share
Tonnage
(000 tonnes)
Grade
(Pb%)
Tonnes (3)
(000)
Tonnage
(000 tonnes)
Grade
(Pb%)
Tonnes (3)
(000)
Tonnage
(000 tonnes)
Grade
(Pb%)
Tonnes (3)
(000)
Tonnage
(000 tonnes)
Grade
(Pb%)
Tonnes (3)
(000)
Metallurgical
Recovery (3)
Peñasquito, Mexico
100%48,200 0.25%100 163,100 0.23%400 211,300 0.23%500 21,100 0.2%— 73%
Total Lead48,200 0.25%100 163,100 0.23%400 211,300 0.23%500 21,100 0.2%— 73%
____________________________
(1)Resources are reported exclusive of reserves.
(2)At December 31, 2025 and 2024, lead resources were estimated at a lead price of $1.00 per pound. Tonnage amounts have been rounded to the nearest 100,000.
(3)Tonnes are estimates of metal contained in ore tonnages and do not include allowances for processing losses. Metallurgical recovery rates represent the estimated amount of metal to be recovered through metallurgical extraction processes. Tonnes may not recalculate as they are rounded to the nearest 100,000.
Zinc Resources at December 31, 2025 (1)(2)
Measured ResourceIndicated Resource
Measured and Indicated Resource
Inferred Resource
Deposits/DistrictsNewmont
Share
Tonnage
(000 tonnes)
Grade
(Zn%)
Tonnes (3)
(000)
Tonnage
(000 tonnes)
Grade
(Zn%)
Tonnes (3)
(000)
Tonnage
(000 tonnes)
Grade
(Zn%)
Tonnes (3)
(000)
Tonnage
(000 tonnes)
Grade
(Zn%)
Tonnes (3)
(000)
Metallurgical
Recovery (3)
Peñasquito, Mexico
100%52,800 0.72%400 172,100 0.57%1,000 224,900 0.60%1,400 9,200 0.5%— 82%
Total Zinc52,800 0.72%400 172,100 0.57%1,000 224,900 0.60%1,400 9,200 0.5%— 82%
Zinc Resources at December 31, 2024 (1)(2)
Measured ResourceIndicated Resource
Measured and Indicated Resource
Inferred Resource
Deposits/DistrictsNewmont
Share
Tonnage
(000 tonnes)
Grade
(Zn%)
Tonnes (3)
(000)
Tonnage
(000 tonnes)
Grade
(Zn%)
Tonnes (3)
(000)
Tonnage
(000 tonnes)
Grade
(Zn%)
Tonnes (3)
(000)
Tonnage
(000 tonnes)
Grade
(Zn%)
Tonnes (3)
(000)
Metallurgical
Recovery (3)
Peñasquito, Mexico
100%48,200 0.69%300 163,100 0.55%900 211,300 0.59%1,200 21,100 0.6%100 81%
Total Zinc48,200 0.69%300 163,100 0.55%900 211,300 0.59%1,200 21,100 0.6%100 81%
____________________________
(1)Resources are reported exclusive of reserves.
(2)At December 31, 2025 and 2024, zinc resources were estimated at a zinc price of $1.30 per pound. Tonnage amounts have been rounded to the nearest 100,000.
(3)Tonnes are estimates of metal contained in ore tonnages and do not include allowances for processing losses. Metallurgical recovery rates represent the estimated amount of metal to be recovered through metallurgical extraction processes. Tonnes may not recalculate as they are rounded to the nearest 100,000.
85

Table of Contents
Molybdenum Resources at December 31, 2025 (1)(2)
Measured ResourceIndicated ResourceMeasured and Indicated ResourceInferred Resource
Deposits/DistrictsNewmont
Share
Tonnage
(000 tonnes)
Grade
(Mo%)
Tonnes (3)
(000)
Tonnage
(000 tonnes)
Grade
(Mo%)
Tonnes (3)
(000)
Tonnage
(000 tonnes)
Grade
(Mo%)
Tonnes (3)
(000)
Tonnage
(000 tonnes)
Grade
(Mo%)
Tonnes (3)
(000)
Metallurgical
Recovery (3)
Cadia, Australia
100%— —%— 938,100 0.01%100 938,100 0.01%100 124,200 —%— 67%
NuevaUnión, Chile (4)
50%159,500 0.01%— 231,500 0.01%— 391,000 0.01%— 362,300 —%— 52%
Total Molybdenum159,500 0.01%— 1,169,600 0.01%100 1,329,100 0.01%100 486,500 —%— 59%
Molybdenum Resources at December 31, 2024 (1)(2)
Measured ResourceIndicated ResourceMeasured and Indicated ResourceInferred Resource
Deposits/DistrictsNewmont
Share
Tonnage
(000 tonnes)
Grade
(Mo%)
Tonnes (3)
(000)
Tonnage
(000 tonnes)
Grade
(Mo%)
Tonnes (3)
(000)
Tonnage
(000 tonnes)
Grade
(Mo%)
Tonnes (3)
(000)
Tonnage
(000 tonnes)
Grade
(Mo%)
Tonnes (3)
(000)
Metallurgical
Recovery (3)
Cadia, Australia
100%— —%— 1,173,900 0.01%100 1,173,900 0.01%100 509,600 —%— 72%
NuevaUnión, Chile (4)
50%159,500 0.01%— 231,500 0.01%— 391,000 0.01%— 362,300 —%— 52%
Total Molybdenum159,500 0.01%— 1,405,400 0.01%100 1,564,900 0.01%100 872,000 —%100 62%
____________________________
(1)Resources are reported exclusive of reserves.
(2)At December 31, 2025 and 2024, molybdenum resources at sites in which Newmont is the operator were estimated at a molybdenum price of $16 per pound, unless otherwise noted. Tonnage amounts have been rounded to the nearest 100,000.
(3)Tonnes are estimates of metal contained in ore tonnages and do not include allowances for processing losses. Metallurgical recovery rates represent the estimated amount of metal to be recovered through metallurgical extraction processes. Tonnes may not recalculate as they are rounded to the nearest 100,000.
(4)Project is currently undeveloped and is included in Corporate and Other in Note 4 to the Consolidated Financial Statements. Molybdenum resources at December 31, 2025 were estimated at a molybdenum price of $10 per pound. Molybdenum resources at December 31, 2025 and 2024 were provided by the NuevaUnión joint venture.
86

Table of Contents
ITEM 3.       LEGAL PROCEEDINGS
Information regarding legal proceedings is contained in Note 24 to the Consolidated Financial Statements contained in this Report and is incorporated herein by reference. The Company has elected to apply a threshold of $1 million pursuant to Item 103(c)(3)(iii) of Regulation S-K in connection with environmental proceedings to which a governmental authority is a party.
ITEM 4.       MINE SAFETY DISCLOSURES
At Newmont, safety is a core value, and we strive for superior performance. We are working diligently to strengthen and improve our safety systems, along with the key safety tools that we use in the field. Newmont’s unified approach to safety and health called Always Safe, focuses on Integrated Systems, Robust Capabilities and Empowered Behaviors, through a leadership commitment to care, clarity, and capability. We will also continue to transparently share the lessons we learned with our employees and our peers in the industry to help improve the safety performance of our sector.
Our health and safety management system, which includes detailed standards and procedures for safe production, addresses topics such as employee training, risk management, workplace inspection, emergency response, accident investigation and program auditing. In addition to strong leadership and involvement from all levels of the organization, these programs and procedures form the cornerstone of safety at Newmont, ensuring that employees are provided a safe and healthy environment and are intended to reduce workplace accidents, incidents and losses, comply with all mining-related regulations and provide support for both regulators and the industry to improve mine safety.
In addition, we have established our “Rapid Response” crisis management process to mitigate and prevent the escalation of adverse consequences if existing risk management controls fail, particularly if an incident may have the potential to seriously impact the safety of employees, the community or the environment. This process provides appropriate support to an affected site to complement their technical response to an incident, so as to reduce the impact by considering the environmental, strategic, legal, financial and public image aspects of the incident, to ensure communications are being carried out in accordance with legal and ethical requirements and to identify actions in addition to those addressing the immediate hazards. The health and safety of our people and our host communities is paramount.
Issuers operating U.S. mine sites regulated by MSHA are required to report certain mine safety violations or other regulatory matters required by Section 1503(a) of the Dodd-Frank Wall Street Reform and Consumer Protection Act and Item 104 of Regulation S-K. On February 28, 2025, the Company sold its ownership in the CC&V mine. Refer to Note 3 to the Consolidated Financial Statements for further information. As a result of this sale, the Company no longer operates any U.S. based mine sites regulated by MSHA. The information concerning mine safety violations or other regulatory matters required by Section 1503(a) of the Dodd-Frank Wall Street Reform and Consumer Protection Act and Item 104 of Regulation S-K is incorporated herein by reference to Exhibit 95 to Newmont Corporation’s Quarterly Report on Form 10-Q for the period ended March 31, 2025 filed with the SEC on April 24, 2025.
It is noted that the Nevada mines owned by Nevada Gold Mines LLC, the joint venture between the Company (38.5%) and Barrick (61.5%), are not required to be disclosed in Exhibit 95 mine safety disclosure reporting as such sites are operated by our joint venture partner, Barrick.
87

Table of Contents
PART II
ITEM 5.       MARKET FOR REGISTRANT'S COMMON EQUITY, RELATED STOCKHOLDER MATTERS AND ISSUER PURCHASE OF EQUITY SECURITIES (dollars in millions, except share, stockholders, and per share data)
Our common stock is listed and principally traded on the New York Stock Exchange under the symbol “NEM.” On February 12, 2026, there were 1,087,874,212 shares of Newmont’s common stock outstanding, which were held by approximately 6,000 stockholders of record.
During the period from October 1, 2025 to December 31, 2025, 4,943,977 shares of Newmont's equity securities registered pursuant to Section 12 of the Exchange Act of 1934, as amended, were purchased by the Company, or an affiliated purchaser.
(a)(b)(c)(d)
Period
Total Number of Shares
Purchased (1)
Average Price Paid Per Share (1)
Total Number of Shares Purchased as Part of Publicly Announced Plans or Programs (2)
Maximum Dollar Value of Shares that may yet be Purchased under the Plans or Programs (2)
October 1, 2025 through October 31, 20252,571,734 $85.08 2,546,672 $2,662 
November 1, 2025 through November 30, 20251,382,003 $84.92 1,373,974 $2,545 
December 1, 2025 through December 31, 2025990,240 $95.85 978,903 $2,451 
____________________________
(1)The total number of shares purchased (and the average price paid per share) reflects: (i) shares purchased pursuant to the repurchase program described in (2) below; and (ii) shares delivered to the Company from stock awards held by employees upon vesting for the purpose of covering the recipients’ tax withholding obligations, totaling 25,062 shares, 8,029 shares, and 11,337 shares for the fiscal months of October, November, December 2025, respectively. Subsequent to the end of the covered period, the Company repurchased 672,232 additional shares at an average price of $111.81 per share pursuant to a Rule 10b5-1 plan for a total amount of $3,624 repurchased as of the date of filing under the stock repurchase programs described in (2) below.
(2)In February 2024, the Board of Directors authorized a stock repurchase program to repurchase shares of outstanding common stock to offset the dilutive impact of employee stock award vesting and to provide returns to stockholders, provided that the aggregate value of shares of common stock repurchased does not exceed $1,000; this program has been completed. In October 2024, the Board of Directors authorized an additional $2,000 stock repurchase program to repurchase shares of outstanding common stock; this program has been completed. In July 2025, the Board of Directors authorized an additional $3,000 stock repurchase program to repurchase shares of outstanding common stock. The program will be executed at the Company's discretion. The repurchase program has no expiration date, may be discontinued at any time, and the program does not obligate the Company to acquire any specific number of shares of its common stock or to repurchase the full authorized amount. Consequently, the Board of Directors may revise or terminate such share repurchase authorization in the future.
ITEM 6.       RESERVED
None.
88

Table of Contents
ITEM 7.       MANAGEMENT’S DISCUSSION AND ANALYSIS OF CONSOLIDATED FINANCIAL CONDITION AND RESULTS OF OPERATIONS (dollars in millions, except per share, per ounce and per pound amounts)
The following Management’s Discussion and Analysis of Consolidated Financial Condition and Results of Operations (“MD&A”) provides information that management believes is relevant to an assessment and understanding of the consolidated financial condition and results of operations of Newmont Corporation, a Delaware corporation, and its subsidiaries (collectively, “Newmont,” the “Company,” “our” and “we”). We use certain non-GAAP financial measures in our MD&A. For a detailed description of each of the non-GAAP measures used in this MD&A, please refer to the discussion under Non-GAAP Financial Measures. This item should be read in conjunction with our Consolidated Financial Statements and the notes thereto included in this annual report.
The following MD&A generally discusses our consolidated financial condition and results of operations for 2025 and 2024 and year-to-year comparisons between 2025 and 2024. Discussions of our consolidated financial condition and results of operations for 2023 and year-to-year comparisons between 2024 and 2023 are included in Item 7, Management’s Discussion and Analysis of Consolidated Financial Condition and Results of Operations, of the Company’s Annual Report on Form 10-K, filed with the Securities and Exchange Commission on February 21, 2025.
Overview
Newmont is the world’s leading gold company and is the only gold company included in the S&P 500 Index and the Fortune 500 list of companies. We have been included in the Dow Jones Sustainability Index-World since 2007 and have adopted the World Gold Council’s Conflict-Free Gold Policy. Since 2015, Newmont has been ranked as the mining and metal sector’s top gold miner by the S&P Global Corporate Sustainability Assessment. Newmont has been ranked the top miner in 3BL Media’s 100 Best Corporate Citizens list which ranks the 1,000 largest publicly traded U.S. companies on ESG transparency and performance since 2020. We are primarily engaged in the exploration for and acquisition of gold properties, some of which may contain copper, silver, lead, zinc or other metals. We have significant operations and/or assets in the United States, Papua New Guinea, Australia, Ghana, Suriname, Argentina, Dominican Republic, Chile, Peru, Ecuador, Mexico, and Canada. Our goal is to create value and improve lives through sustainable and responsible mining.
Refer to the Consolidated Financial Results, Results of Consolidated Operations, Liquidity and Capital Resources and Non-GAAP Financial Measures for information about the continued impacts from inflationary pressures, effects of certain countermeasures taken by central banks, and supply chain disruptions, with particular consideration on the outlook for increased costs specific to labor, materials, consumables and fuel and energy on operations, as well as impacts on the timing and cost of capital expenditures and the risk of potential impairment to certain assets. Refer to discussion of Risk and Uncertainties within Note 2 to the Consolidated Financial Statements for further information.
Reportable Segments
In October 2025, the Company declared commercial production at its Ahafo North project in Ghana resulting in classification as a reportable segment. Prior to declaration of commercial production, Ahafo North was classified as a development project and all activity was included in the Ahafo South reportable segment up to the date of commercial production. Although not a reportable segment until the fourth quarter of 2025, the amounts related to Ahafo North have been reported separately for comparability purposes. Refer to Note 4 to the Consolidated Financial Statements for further information.
One of our reportable segments, NGM, is a joint venture that combined our and Barrick Mining Corporation’s (“Barrick”) respective Nevada operations, pursuant to the operating agreement entered into on July 1, 2019 between Barrick, Newmont and their wholly-owned subsidiaries party thereto (the “Nevada JV Agreement”). Barrick operates NGM with overall management responsibility and is subject to the supervision and direction of NGM’s Board of Managers, which is comprised of three managers appointed by Barrick and two managers appointed by Newmont. On January 26, 2026, we informed Barrick and the NGM Board of Managers that we had identified evidence of mismanagement at NGM, including diversion of resources from NGM to the benefit of Barrick’s wholly-owned property Fourmile and Barrick, and that we were exercising our contractual inspection and audit rights. On February 3, 2026, we sent Barrick a notice of default under the Nevada JV Agreement related to this conduct. Although we continue to work with Barrick to improve the performance of NGM and will take appropriate steps to address this matter, any such disagreements could have a material adverse effect on NGM and the Company. Refer to Item 1A, Risk Factors, for a discussion of risk factors related to our joint ventures.
Divestiture of Non-Core Assets
Based on a comprehensive review of the Company’s portfolio of assets following the Newcrest acquisition, the Company’s Board of Directors approved a portfolio optimization program to divest six non-core assets and a development project in February 2024. The non-core assets to be divested included Akyem, CC&V, Éléonore, Porcupine, Musselwhite, Telfer, and the Coffee development project in Canada. In February 2024, the Company concluded that these non-core assets and the development project met the accounting requirements to be presented as held for sale in the first quarter of 2024.
The Company completed the sale the assets of the Telfer reportable segment in the fourth quarter 2024, the sale of the CC&V, Musselwhite, and Éléonore reportable segments in the first quarter of 2025, the sale of the Akyem and Porcupine reportable segments in the second quarter of 2025, and the sale of the Coffee development project in the fourth quarter of 2025.
89

Table of Contents
Assets classified as held for sale are recorded at the lower of the carrying value or fair value, less costs to sell and are periodically valued until sale occurs with any resulting gain or loss recognized in (Gain) loss on sale of assets held for sale. Additionally, gains or losses recognized on the completion of the sale are recognized in (Gain) loss on sale of assets held for sale.
As a result, for the year ended December 31, 2025 a gain of $1,066 was recognized within (Gain) loss on sale of assets held for sale, primarily resulting from the completed sales. For the year ended December 31, 2024, a loss of $1,114 was recognized within (Gain) loss on sale of assets held for sale, primarily consisting of write-downs on assets held for sale. Refer to Note 3 to the Consolidated Financial Statements for further information on divestitures.
Newcrest Acquisition
On November 6, 2023, the Company completed its business combination transaction with Newcrest Mining Limited, a public Australian mining company limited by shares ("Newcrest"), whereby Newmont, through Newmont Overseas Holdings Pty Ltd, an Australian proprietary company limited by shares (“Newmont Sub”), acquired all of the ordinary shares of Newcrest in a fully stock transaction for total non-cash consideration of $13,549. Newcrest became a direct wholly owned subsidiary of Newmont Sub and an indirect wholly owned subsidiary of Newmont (such acquisition, the “Newcrest transaction”). The combined company continues to be traded on the New York Stock Exchange under the ticker NEM. The combined company is also listed on the Australian Securities Exchange under the ticker NEM and on the Papua New Guinea Securities Exchange under the ticker NEM. Refer to Note 3 to the Consolidated Financial Statements for further information.
Ghanaian Stability Agreement and Royalty
The Revised Investment Agreement, under which Newmont previously operated in Ghana, expired on December 31, 2025. As a result, the previous maximum corporate income tax rate of 32.5% is now subject to a maximum corporate income tax rate of 35% and customs duties on imported goods used in mining operations ranging from 5% to 20% of the value of such items. Additionally, royalties were previously paid to the Government of Ghana under a sliding‑scale system, based on average monthly gold prices and ranging up to 5% of revenues, plus an additional 0.6% on any production from forest reserve areas. The sliding-scale royalty regime also expired on December 31, 2025. Effective January 1, 2026, royalties transitioned to a fixed 5% rate on gold production, with the additional 0.6% forest reserve royalty continuing to apply where applicable.
The Government of Ghana is also entitled to receive 10% of a project’s net cash flow after reaching specific production milestones by receiving 1/9th of the total amount paid as dividends to Newmont parent. When the average quoted gold price exceeds $1,300 per ounce within a calendar year, an advance payment on these amounts of 0.6% of total revenues is required. Upon the expiration of the tax extension regime on December 31, 2025, dividends paid in addition to the carried interest will become subject to an 8% withholding tax. Also as a result of the agreement's expiration, Newmont is subject to a Growth and Sustainability Levy of 3% on gross revenue. As a result, the Company will also be exposed to future changes in fiscal, tax, and other related regulatory regimes in Ghana as they may be enacted from time to time. For instance, the Government of Ghana has announced plans to amend the country’s mineral royalty regime by replacing the flat 5% royalty rate, which became effective on January 1, 2026, with a sliding scale ranging from 5% to 12%, linked to prevailing gold prices. The proposed amendment was submitted to the Ghanaian Parliament on December 19, 2025, and is expected to be considered when parliamentary sessions resume in early February 2026. If enacted, the revised royalty framework could increase the Company’s operating costs at its Ghanaian operations, particularly during periods of higher gold prices. The timing, final structure, and implementation mechanisms of the proposed regime currently remain uncertain.
Consolidated Financial Results
The details of our Net income (loss) from continuing operations attributable to Newmont stockholders are set forth below:
Year Ended December 31,
Increase (decrease)
202520242023
2025 vs. 2024
2024 vs. 2023
Net income (loss) from continuing operations attributable to Newmont stockholders $7,085 $3,280 $(2,521)$3,805 $5,801 
Net income (loss) from continuing operations attributable to Newmont stockholders per common share, diluted$6.39 $2.86 $(3.00)$3.53 $5.86 
Net income (loss) from continuing operations attributable to Newmont stockholders increased during the year ended December 31, 2025, compared to the same period in 2024, primarily due to (i) a net increase in Sales largely due to higher average realized gold prices partially offset by the impact from divestitures, (ii) a net gain on completed divestments, compared to prior year write-downs from assets held for sale, recognized in (Gain) loss on sale of assets held for sale, and (iii) a net decrease in costs applicable to sales, recognized in Costs applicable to sales, primarily resulting from divested sites. This increase was partially offset by the increase in Income and mining tax benefit (expense) and Impairment charges, primarily at Yanacocha.
Refer below for further information on the change in Costs applicable to sales and Depreciation and amortization.
90

Table of Contents
The details and analyses of our Sales for all periods presented are set forth below. Refer to Note 5 to the Consolidated Financial Statements for additional information.
Year Ended December 31,
Increase (decrease)
202520242023
2025 vs. 2024
2024 vs. 2023
Gold$19,304 $15,746 $10,593 $3,558 $5,153 
Copper1,438 1,327 575 111 752 
Silver1,080 792 335 288 457 
Lead183 195 96 (12)99 
Zinc664 622 213 42 409 
$22,669 $18,682 $11,812 $3,987 $6,870 

Year Ended December 31, 2025
GoldCopperSilverLeadZinc
(ounces)(pounds)(ounces)(pounds)(pounds)
Consolidated sales:
Gross before provisional pricing and streaming impact$19,067 $1,320 $846 $188 $699 
Provisional pricing mark-to-market274 119 177 (1)3 
Silver streaming amortization— — 84 — — 
Gross after provisional pricing and streaming impact19,341 1,439 1,107 187 702 
Treatment and refining charges(37)(1)(27)(4)(38)
Net$19,304 $1,438 $1,080 $183 $664 
Consolidated ounces/pounds sold (1)(2)
5,519 294 28 209 542 
Average realized price (per ounce/pound): (3)
Gross before provisional pricing and streaming impact$3,455 $4.49 $30.49 $0.89 $1.30 
Provisional pricing mark-to-market50 0.40 6.37 — — 
Silver streaming amortization— — 3.03 — — 
Gross after provisional pricing and streaming impact3,505 4.89 39.89 0.89 1.30 
Treatment and refining charges(7)— (0.97)(0.02)(0.07)
Net$3,498 $4.89 $38.92 $0.87 $1.23 
____________________________
(1)Amounts reported in millions except gold ounces, which are reported in thousands.
(2)The Company sold 134 thousand tonnes of copper, 95 thousand tonnes of lead, and 246 thousand tonnes of zinc.
(3)Per ounce/pound measures may not recalculate due to rounding.
Year Ended December 31, 2024
GoldCopperSilverLeadZinc
(ounces)(pounds)(ounces)(pounds)(pounds)
Consolidated sales:
Gross before provisional pricing and streaming impact$15,701 $1,377 $724 $200 $691 
Provisional pricing mark-to-market105 — 14 (2)8 
Silver streaming amortization— — 91 — — 
Gross after provisional pricing and streaming impact15,806 1,377 829 198 699 
Treatment and refining charges(60)(50)(37)(3)(77)
Net$15,746 $1,327 $792 $195 $622 
Consolidated ounces/pounds sold (1)(2)
6,539 332 33 213 545 
Average realized price (per ounce/pound): (3)
Gross before provisional pricing and streaming impact$2,401 $4.15 $22.05 $0.94 $1.27 
Provisional pricing mark-to-market16 — 0.42 (0.01)0.02 
Silver streaming amortization— — 2.79 — — 
Gross after provisional pricing and streaming impact2,417 4.15 25.26 0.93 1.29 
Treatment and refining charges(9)(0.15)(1.13)(0.02)(0.15)
Net$2,408 $4.00 $24.13 $0.91 $1.14 
____________________________
(1)Amounts reported in millions except gold ounces, which are reported in thousands.
91

Table of Contents
(2)The Company sold 150 thousand tonnes of copper, 97 thousand tonnes of lead, and 247 thousand tonnes of zinc.
(3)Per ounce/pounds measures may not recalculate due to rounding.
Year Ended December 31, 2023
GoldCopperSilverLeadZinc
(ounces)(pounds)(ounces)(pounds)(pounds)
Consolidated sales:
Gross before provisional pricing and streaming impact$10,605 $601 $312 $103 $281 
Provisional pricing mark-to-market34 15 7 (4)(15)
Silver streaming amortization— — 42 — — 
Gross after provisional pricing and streaming impact10,639 616 361 99 266 
Treatment and refining charges(46)(41)(26)(3)(53)
Net$10,593 $575 $335 $96 $213 
Consolidated ounces/pounds sold (1)(2)
5,420 155 17 107 222 
Average realized price (per ounce/pound): (3)
Gross before provisional pricing and streaming impact$1,957 $3.87 $18.53 $0.96 $1.27 
Provisional pricing mark-to-market6 0.10 0.44 (0.03)(0.07)
Silver streaming amortization— — 2.56 — — 
Gross after provisional pricing and streaming impact1,963 3.97 21.53 0.93 1.20 
Treatment and refining charges(9)(0.26)(1.56)(0.03)(0.24)
Net$1,954 $3.71 $19.97 $0.90 $0.96 
____________________________
(1)Amounts reported in millions except gold ounces, which are reported in thousands.
(2)The Company sold 71 thousand tonnes of copper, 49 thousand tonnes of lead, and 101 thousand tonnes of zinc.
(3)Per ounce/pound measures may not recalculate due to rounding.
The change in consolidated Sales is due to:
Year Ended December 31,
2025 vs. 2024 (1)
GoldCopperSilverLeadZinc
(ounces)(pounds)(ounces)(pounds)(pounds)
Increase (decrease) in average realized price$6,001 $217 $406 $(8)$7 
Increase (decrease) in consolidated ounces/pounds sold(2,466)(155)(128)(3)(4)
Decrease (increase) in treatment and refining charges23 49 10 (1)39 
$3,558 $111 $288 $(12)$42 
Year Ended December 31,
2024 vs. 2023 (2)
GoldCopperSilverLeadZinc
(ounces)(pounds)(ounces)(pounds)(pounds)
Increase (decrease) in consolidated ounces/pounds sold$2,197 $698 $346 $98 $387 
Increase (decrease) in average realized price2,970 63 122 1 46 
Decrease (increase) in treatment and refining charges(14)(9)(11)— (24)
$5,153 $752 $457 $99 $409 
____________________________
(1)Included in the change in Sales is the impact relating to the divested sites which resulted in a decrease of $2,254 for the year ended 2025 compared to 2024.
(2)Included in the change in Sales is the impact attributable to the sites acquired in the Newcrest acquisition which resulted in an increase of $3,593 for the year ended 2024 compared to 2023.
For discussion regarding drivers impacting sales volumes by site, refer to Results of Consolidated Operations below.
92

Table of Contents
The details of our Costs applicable to sales are set forth below.
Year Ended December 31,
Increase (decrease)
202520242023
2025 vs. 2024
2024 vs. 2023
Gold$6,615 $7,364 $5,689 $(749)$1,675 
Copper597 696 359 (99)337 
Silver334 360 300 (26)60 
Lead116 116 98 — 18 
Zinc423 427 253 (4)174 
$8,085 $8,963 $6,699 $(878)$2,264 
The decrease in Costs applicable to sales during the year ended December 31, 2025, compared to the same period in 2024, is primarily due to the impact of the divested sites, which resulted in a decrease of $1,370.
Excluding the impact of divestitures, Costs applicable to sales increased during the year ended December 31, 2025, compared to the same period in 2024, primarily due to higher mining and milling costs at NGM and Brucejack, higher government royalties largely at Ahafo South, and higher worker's participation costs at Peñasquito and Yanacocha.
For discussion regarding other significant drivers impacting Costs applicable to sales by site, refer to Results of Consolidated Operations below.
The Company uses both straight-line and UOP methods of depreciation. Depreciation and amortization will vary as a result of fluctuations in sales volumes and depreciation rates utilized at our mining sites. The details of our Depreciation and amortization are set forth below. Refer to Note 4 to the Consolidated Financial Statements for additional information.
Year Ended December 31,
Increase (decrease)
202520242023
2025 vs. 2024
2024 vs. 2023
Gold$1,924 $1,918 $1,730 $6 $188 
Copper194 217 53 (23)164 
Silver131 159 134 (28)25 
Lead46 52 45 (6)7 
Zinc152 162 105 (10)57 
Other74 68 41 6 27 
$2,521 $2,576 $2,108 $(55)$468 
The decrease in Depreciation and amortization during the year ended December 31, 2025, compared to the same period in 2024, is primarily due to the impact of divested sites, which contributed $156 to the decrease in Depreciation and amortization.
Excluding the impact of divested sites, Depreciation and amortization was in line with the same period in 2024.
For discussion regarding other significant drivers impacting Depreciation and amortization by site, refer to Results of Consolidated Operations below.
Exploration was $243, $266 and $265 for the years ended December 31, 2025, 2024, and 2023, respectively. Exploration decreased in 2025, compared to 2024, primarily due to a reduction in exploration spend due to the impact of divested sites.
Advanced projects, research and development was $166, $197 and $200 for the years ended December 31, 2025, 2024, and 2023, respectively. Advanced projects, research and development decreased in 2025, compared to 2024, primarily due to the discontinuation of certain studies and lower consulting costs.
General and administrative was $382, $442, and $299 for the years ended December 31, 2025, 2024, and 2023, respectively. General and administrative decreased in 2025, compared to 2024, primarily due to lower salaries and benefits resulting from a strategic plan committed by management in the third quarter of 2025 to streamline organization structure and reduce the Company's workforce, lower consulting costs, and lower charges resulting from the Newcrest transaction. The strategic plan was designed to reduce operating costs and advance the Company’s ongoing commitment to profitability and included streamlining the Company’s organizational structure, a reduction in workforce, and a reduction in office space in certain markets. Refer to Note 8 of the Consolidated Financial Statements for further information.
Interest expense, net of capitalized interest was $229, $375, and $243 for the years ended December 31, 2025, 2024, and 2023, respectively. Capitalized interest totaled $144, $114, and $89 in each year, respectively. Interest expense, net of capitalized interest decreased in 2025, compared to 2024, as a result of the reduction in debt which was driven by a $2 billion debt tender for the partial redemption of certain senior notes, the full redemption of certain other senior notes, and an increase in capitalized interest.
93

Table of Contents
Income and mining tax expense (benefit) was $4,596, $1,397, and $526 for the years ended December 31, 2025, 2024 and 2023, respectively. The effective tax rate is driven by a number of factors and the comparability of our income tax expense for the reported periods will be primarily affected by (i) variations in our income before income taxes; (ii) geographic distribution of that income; (iii) impacts of the changes in tax law; (iv) valuation allowances on tax assets; (v) percentage depletion; (vi) fluctuation in the value of the United States dollar and foreign currencies; (vii) changes in permanent reinvestment assertions for Papua New Guinea and Ghana and (viii) the impact of specific transactions and assessments. As a result, the effective tax rate will fluctuate, sometimes significantly, year to year. This trend is expected to continue in future periods. Refer to Note 10 to the Consolidated Financial Statements for further discussion of income taxes.
Year Ended December 31,
20252024
Income
(Loss) (1)
Effective
Tax Rate
Income Tax
(Benefit)
Provision
Income
(Loss) (1)
Effective
Tax Rate
Income Tax
(Benefit)
Provision
Nevada$1,722 21 %$360 $733 18 %$133 
CC&V(161)30 %(48)88 13 %11 
Corporate and Other (2)
(34)174 %(59)(285)(37)%106 
Total US1,527 17 %253 536 47 %250 
Argentina102 (1)%(1)— — %35 
Australia3,383 33 %1,101 1,741 34 %596 
Canada1,067 46 %489 (171)138 %(236)
Ghana2,071 41 %848 998 35 %348 
Mexico1,492 41 %609 601 19 %112 
Papua New Guinea974 74 %723 441 32 %140 
Peru455 107 %485 346 37 %129 
Suriname290 26 %75 82 17 %14 
Other Foreign(19)(74)%14 3 300 %9 
Consolidated (2)
$11,342 40 %$4,596 $4,577 31 %$1,397 
____________________________
(1)Represents income (loss) from continuing operations by geographic location before income taxes and equity in affiliates. These amounts will not reconcile to the Segment Information for the reasons stated in Note 4 to the Consolidated Financial Statements.
(2)The consolidated effective income tax rate is a function of the combined effective tax rates for the jurisdictions in which we operate. Variations in the relative proportions of jurisdictional income could result in fluctuations to our combined effective income tax rate.
Other
On July 4, 2025, the One Big Beautiful Bill Act H.R. 1 was signed into law in the U.S. The legislation has multiple effective dates, with certain provisions effective in 2025 and others implemented through 2027. The Company does not anticipate the bill will have a material impact on the financial statements.
In 2024, Pillar II went into effect. The Pillar II agreement was signed by numerous countries with the intent to equalize corporate tax around the world by implementing a global minimum tax of 15%. On January 5, 2026, the Organization for Economic Cooperation and Development released Administrative Guidance containing two Pillar II safe harbours under the new Side-by-side ("SbS") System. The Company is still examining the applicability of the new guidance to Newmont, but at this time, believes the new SbS Safe Harbour exempts the Company from Pillar II.
Refer to the Notes to the Consolidated Financial Statements for explanations of other financial statement line items.
Results of Consolidated Operations
Newmont has developed gold equivalent ounce (“GEO”) metrics to provide a comparable basis for analysis and understanding of our operations and performance related to copper, silver, lead and zinc. Gold equivalent ounces are calculated as pounds or ounces produced or sold multiplied by the ratio of the other metals’ price to the gold price, using the metal prices in the table below:
GoldCopperSilverLeadZinc
(ounce)(pound)(ounce)(pound)(pound)
2025 GEO Price (1)(2)
$1,700 $3.50 $20.00 $0.90 $1.20 
2024 GEO Price
$1,400 $3.50 $20.00 $1.00 $1.20 
2023 GEO Price
$1,400 $3.50 $20.00 $1.00 $1.20 
____________________________
(1)Effective January 1 2025, the Company updated the metal prices utilized for the GEO calculation. Utilizing the updated 2025 pricing resulted in 317 thousand and 320 thousand fewer calculated "gold equivalent ounces - other metals" produced and sold, respectively, than would have been calculated using the 2024 pricing for the year ended December 31, 2025.
94

Table of Contents
(2)Effective January 1, 2026, the GEO calculation was updated to use the following metal price assumptions: Gold ($4,000/oz), Copper ($5.00/lb.), Silver ($50.00/oz), Lead ($0.90/lb.), and Zinc ($1.30/lb.). This update to the GEO calculation will have an impact on the calculated gold equivalent ounces, and will impact how costs are allocated to the respective GEOs, particularly resulting in higher costs allocated to gold. Utilizing the updated 2026 pricing would have resulted in 479 and 487 fewer calculated "gold equivalent ounces - other metals" produced and sold, respectively, than was calculated using the 2025 pricing for the year ended December 31, 2025.
Gold or Other Metals Produced
Costs Applicable to Sales (1)
Depreciation and Amortization
All-In Sustaining Costs (2)
Year Ended December 31,202520242023202520242023202520242023202520242023
Gold(ounces in thousands)($ per ounce sold)($ per ounce sold)($ per ounce sold)
Lihir (3)
585 614 134 $1,297 $1,270 $1,117 $322 $270 $153 $1,607 $1,512 $1,517 
Cadia (3)
385 464 97 $845 $653 $1,079 $324 $263 $130 $1,253 $1,048 $1,271 
Tanami391 408 448 $1,114 $947 $759 $323 $300 $249 $1,716 $1,281 $1,060 
Boddington565 590 745 $1,244 $1,056 $847 $233 $193 $144 $1,514 $1,288 $1,067 
Ahafo South664 798 581 $1,227 $904 $947 $276 $270 $312 $1,494 $1,072 $1,222 
Ahafo North (4)
70 — — $532 $— $— $168 $— $— $696 $— $— 
Merian237 274 322 $1,562 $1,457 $1,207 $317 $305 $256 $1,921 $1,852 $1,541 
Cerro Negro (5)
202 238 269 $1,594 $1,325 $1,257 $633 $521 $524 $2,220 $1,631 $1,509 
Yanacocha515 354 276 $795 $1,003 $1,069 $218 $279 $310 $964 $1,196 $1,266 
Peñasquito415 299 143 $922 $776 $1,219 $382 $355 $516 $1,120 $984 $1,590 
Red Chris (3)
62 40 5 $1,358 $1,225 $905 $399 $367 $298 $1,750 $1,607 $1,439 
Brucejack (3)
231 258 29 $1,465 $1,254 $1,898 $775 $691 $617 $2,020 $1,603 $2,646 
NGM999 1,039 1,170 $1,334 $1,219 $1,070 $475 $413 $387 $1,629 $1,605 $1,397 
Divested (6)
CC&V28 146 172 $1,397 $1,390 $1,156 $62 $90 $136 $1,684 $1,691 $1,644 
Musselwhite33 212 180 $1,040 $1,045 $1,186 $— $86 $444 $1,531 $1,541 $1,843 
Porcupine55 284 260 $1,300 $1,097 $1,167 $19 $127 $455 $1,810 $1,437 $1,577 
Éléonore50 240 232 $1,104 $1,339 $1,263 $— $88 $433 $1,403 $1,811 $1,838 
Akyem43 204 295 $2,358 $1,596 $931 $62 $271 $413 $2,664 $1,816 $1,210 
Telfer (3)(7)
— 83 43 $— $2,377 $1,882 $— $142 $87 $— $2,993 $1,988 
Total/Weighted Average (8)
5,530 6,545 5,401 $1,199 $1,126 $1,050 $362 $304 $327 $1,609 $1,516 $1,444 
Merian (25%)
(59)(69)(80)
Attributable to Newmont5,471 6,476 5,321 
Gold equivalent ounces - other metals(ounces in thousands)($ per ounce sold)($ per ounce sold)($ per ounce sold)
Cadia (3)(9)
372 478 90 $812 $603 $1,017 $326 $263 $127 $1,230 $987 $1,342 
Boddington (10)
109 206 245 $1,165 $994 $830 $223 $189 $144 $1,397 $1,172 $1,067 
Peñasquito (11)
799 1,102 529 $1,066 $831 $1,283 $402 $343 $561 $1,318 $1,090 $1,756 
Red Chris(3)(12)
129 144 20 $1,341 $1,209 $1,020 $399 $366 $181 $1,692 $1,640 $1,660 
Divested (6)
Telfer (3)(7)(13)
— 14 7 $— $2,398 $1,703 $— $161 $109 $— $2,885 $2,580 
Total/Weighted-Average (8)
1,409 1,944 891 $1,032 $834 $1,127 $368 $307 $378 $1,392 $1,161 $1,579 
Copper(tonnes in thousands)
Cadia (3)(9)
82 87 16 
Boddington (10)
24 37 44 
Red Chris (3)(12)
29 26 4 
Divested (6)
Telfer (3)(7)(13)
— 3 1 
Total/Weighted-Average135 153 65 
Lead(tonnes in thousands)
Peñasquito (11)
98 96 51 
Zinc(tonnes in thousands)
Peñasquito (11)
231 258 104 
Attributable gold from equity method investments (14)
(ounces in thousands)
Pueblo Viejo (40%)
253 235 224 
95

Table of Contents
Fruta del Norte (32%) (3)(15)
165 138 — 
Attributable to Newmont418 373 224 
____________________________
(1)Excludes Depreciation and amortization and Reclamation and remediation.
(2)All-in sustaining costs is a non-GAAP financial measure. Refer to Non-GAAP Financial Measures below.
(3)Sites acquired through the Newcrest transaction during the fourth quarter of 2023. Refer to Note 3 to the Consolidated Financial Statements for further information on the Newcrest transaction.
(4)In October 2025, the Company declared commercial production at its Ahafo North project in Ghana resulting in classification as a reportable segment. As such, the comparative results of operations information is not meaningful. Refer to Note 4 to the Consolidated Financial Statements for further information.
(5)During the first quarter of 2025, mining and processing operations at the site were temporarily suspended due to safety events (the "Cerro Negro shutdowns"). Full operations resumed in April 2025. In the second quarter of 2024, the Company suspended operations at Cerro Negro to conduct a full investigation into the tragic fatalities of two members of the Newmont workforce on April 9, 2024. The site ramped up to full operations in June 2024.
(6)These sites were classified as held for sale beginning in the first quarter of 2024, and as such, the Company ceased recording depreciation and amortization in March 2024. Telfer was divested at December 31, 2024. All other sites previously classified as held for sale were divested at December 31, 2025. As a result, the comparative results of these operations are not meaningful. Refer to Note 3 of the Consolidated Financial Statements for further information.
(7)During the second quarter of 2024, seepage points were detected on the outer wall and around the tailings storage facility at Telfer and we temporarily ceased placing new tailings on the facility. Production resumed at the end of the third quarter of 2024. During the fourth quarter of 2024, we recognized a benefit of $50 related to business insurance proceeds as a result of the event, recorded in Costs applicable to sales.
(8)All-in sustaining costs and Depreciation and amortization include expense for Corporate and Other.
(9)For the years ended December 31, 2025, 2024 and 2023, Cadia produced 180 million, 191 million, and 36 million pounds of copper, respectively.
(10)For the years ended December 31, 2025, 2024 and 2023, Boddington produced 53 million, 83 million and 98 million pounds of copper, respectively.
(11)For the year ended December 31, 2025, Peñasquito produced 28 million ounces of silver, 216 million pounds of lead and 509 million pounds of zinc. For the year ended December 31, 2024, Peñasquito produced 33 million ounces of silver, 212 million pounds of lead and 569 million pounds of zinc. For the year ended December 31, 2023, Peñasquito produced 18 million ounces of silver, 113 million pounds of lead and 230 million pounds of zinc.
(12)For the years ended December 31, 2025, 2024 and 2023, Red Chris produced 63 million, 58 million, and 8 million pounds of copper, respectively.
(13)For the years ended December 31, 2024 and 2023, Telfer produced 6 million and 3 million pounds of copper, respectively.
(14)Income and expenses of equity method investments are included in Equity income (loss) of affiliates. Refer to Note 15 to the Consolidated Financial Statements for further discussion of our equity method investments.
(15)The Fruta del Norte mine is wholly owned and operated by Lundin Gold, and is accounted for as an equity method investment on a quarter lag. Due to the quarter lag, comparative results of operations are not meaningful for the year ended December 31, 2025.
Year ended December 31, 2025 compared to 2024
Lihir, Papua New Guinea. Gold production was generally in line with the prior year. Costs applicable to sales per gold ounce were generally in line with the prior year. Depreciation and amortization per gold ounce increased 19% primarily due to higher non-cash inventory costs per unit from ore processed from stockpiles and lower gold ounces sold. All-in sustaining costs per gold ounce increased 6% primarily due to higher sustaining capital spend per gold ounce.
Cadia, Australia. Gold production decreased 17% primarily due to lower ore grade milled. Gold equivalent ounces – other metals production decreased 22% primarily as a result of the change in GEO pricing, noted above, that had an unfavorable impact to the calculated gold equivalent ounces - other metals produced of 16%, as well as lower other metals produced of 6% as a result of lower ore grade milled. Costs applicable to sales per gold ounce increased 29% primarily due to lower gold ounces sold, higher government royalties, and higher allocation of direct costs to gold as a result of the GEO price change, partially offset by higher by-product credits. Costs applicable to sales per gold equivalent ounce – other metals sold increased 35% primarily due to lower gold equivalent ounces - other metals sold and higher government royalties, partially offset by lower allocation of direct costs to gold equivalent ounces - other metals as a result of the GEO price change and higher by-product credits. Depreciation and amortization per gold ounce increased 23% primarily due to lower gold ounces sold. Depreciation and amortization per gold equivalent ounce – other metals increased 24% primarily due to lower gold equivalent ounces - other metals sold. All-in sustaining costs per gold ounce increased 20% primarily due to higher costs applicable to sales per gold ounce, partially offset by lower treatment and refining costs. All-in sustaining costs per gold equivalent ounce – other metals increased 25% primarily due to higher costs applicable to sales per gold equivalent ounce - other metals, partially offset by lower treatment and refining costs.
Tanami, Australia. Gold production was generally in line with the prior year. Costs applicable to sales per gold ounce increased 18% primarily due to higher underground mining costs as a result of increased development, higher third party royalties, and lower gold ounces sold. Depreciation and amortization per gold ounce increased 8% primarily due to lower gold ounces sold. All-in sustaining costs per gold ounce increased 34% primarily due to higher sustaining capital spend and higher costs applicable to sales per gold ounce.
Boddington, Australia. Gold production was generally in line with the prior year. Gold equivalent ounces – other metals production decreased 47% primarily due to lower other metals produced of 36% from lower ore grade milled, as well as the change in
96

Table of Contents
GEO pricing, noted above, that had an unfavorable impact to the calculated gold equivalent ounces - other metals produced of 11%. Costs applicable to sales per gold ounce increased 18% primarily due to higher allocation of direct costs to gold as a result of the GEO price change and higher government royalties. Costs applicable to sales per gold equivalent ounce – other metals increased 17% primarily due to lower gold equivalent ounces - other metals sold and higher government royalties, partially offset by lower allocation of direct costs to gold equivalent ounces - other metals as a result of the GEO price change. Depreciation and amortization per gold ounce increased 21% primarily due to higher allocation of costs to gold as a result of the GEO price change. Depreciation and amortization per gold equivalent ounce - other metals increased 18% primarily due to lower gold equivalent ounces - other metals sold, partially offset by lower depreciation rates as a result of lower gold equivalent ounces - other metals mined. All-in sustaining costs per gold ounce increased 18% primarily due to higher costs applicable to sales per gold ounce and higher sustaining capital spend, partially offset by lower treatment and refining costs. All-in sustaining costs per gold equivalent ounce – other metals increased 19% primarily due to higher costs applicable to sales per gold equivalent ounce - other metals, partially offset by lower treatment and refining costs.
Ahafo South, Ghana. Gold production decreased 17% primarily due to lower ore grade milled, partially offset by higher mill throughput. Costs applicable to sales per gold ounce increased 36% primarily due to higher government royalties, higher community development costs, and lower gold ounces sold, partially offset by a buildup of stockpile inventory compared to a draw down in the prior year. Depreciation and amortization per gold ounce was generally in line with the prior year. All-in sustaining costs per gold ounce increased 39% primarily due to higher costs applicable to sales per gold ounce and higher sustaining capital spend.
Merian, Suriname. Gold production decreased 14% primarily due to lower mill throughput and a buildup of in-circuit inventory compared to a drawdown in the prior year. Costs applicable to sales per gold ounce increased 7% primarily due to lower gold ounces sold and higher government royalties, partially offset by lower labor costs and lower contracted services costs. Depreciation and amortization per gold ounce was generally in line with the prior year. All-in sustaining costs per gold ounce were generally in line with the prior year.
Cerro Negro, Argentina. Gold production decreased 15% primarily due to lower ore grade milled as a result of mine sequencing and lower mill throughput as a result of the Cerro Negro shutdowns. Costs applicable to sales per gold ounce increased 20% primarily due to lower gold ounces sold, higher labor costs, and higher government royalties, partially offset by higher by-product credits, lower inventory write-downs in the current year compared to the prior year, and lower contracted services costs. Depreciation and amortization per gold ounce increased 21% primarily due to lower gold ounces sold. All-in sustaining costs per gold ounce increased 36% primarily due to higher sustaining capital spend and higher costs applicable to sales per gold ounce.
Yanacocha, Peru. Gold production increased 45% primarily due to higher leach pad production as a result of injection leaching. Costs applicable to sales per gold ounce decreased 21% primarily due to higher gold ounces sold, higher buildup of leach pad inventory in the current year compared to in the prior year, and higher by-product credits, partially offset by higher workers participation costs and higher third-party royalties. Depreciation and amortization per gold ounce decreased 22% primarily due to higher gold ounces sold, partially offset by higher depreciation rates in the current year as a result of higher ounces mined. All-in sustaining costs per gold ounce decreased 19% primarily due to lower costs applicable to sales per gold ounce and lower sustaining capital spend, partially offset by higher other expense related to a Yanacocha discharge event during the second quarter of 2025 that impacted canals supporting the surrounding community. The event was contained as of June 30, 2025.
Peñasquito, Mexico. Gold production increased 39% primarily due to higher ore grade milled as a result of mine sequencing, higher mill recovery, and higher mill throughput. Gold equivalent ounces – other metals production decreased 27% primarily as a result of a change in GEO pricing, noted above, that had an unfavorable impact to the calculated gold equivalent ounces - other metals produced of 16%, as well as lower other metals produced of 11% as a result of lower ore grade milled due to mine sequencing. Costs applicable to sales per gold ounce increased 19% primarily due to higher allocation of direct costs to gold as a result of the GEO price change, higher workers participation costs, and higher third party and government royalties, partially offset by higher gold ounces sold and higher by-product credits. Costs applicable to sales per gold equivalent ounce – other metals increased 28% primarily due to lower gold equivalent ounces - other metals sold, higher workers participation costs and higher third party and government royalties, partially offset by lower allocation of direct costs to gold equivalent ounces - other metals as a result of the GEO price change and higher by-product credits. Depreciation and amortization per gold ounce increased 8% primarily due to higher allocation of costs to gold as a result of the GEO price change, partially offset by higher gold ounces sold. Depreciation and amortization per gold equivalent ounce – other metals increased 17% primarily due to lower gold equivalent ounces - other metals sold, partially offset by lower allocation of costs to gold equivalent ounces - other metals as a result of the GEO price change. All-in sustaining costs per gold ounce increased 14% primarily due to higher costs applicable to sales per gold ounce. All-in sustaining costs per gold equivalent ounce – other metals increased 21% primarily due to higher costs applicable to sales per gold equivalent ounce - other metals, partially offset by lower treatment and refining costs.
Red Chris, Canada. Gold production increased 55% primarily due to higher ore grade milled. Gold equivalent ounces - other metals production decreased 10% as a result of the change in GEO pricing, noted above, that had an unfavorable impact to the calculated gold equivalent ounces - other metals produced of 19%, partially offset by higher other metals produced of 9% as a result of higher ore grade milled. Costs applicable to sales per gold ounce increased 11% primarily due to higher allocation of direct costs to gold as a result of the GEO price change, partially offset by higher gold ounces sold and lower inventory write-downs in the current year compared to the prior year. Costs applicable to sales per gold equivalent ounce – other metals sold increased 11% primarily due to lower gold equivalent ounces - other metals sold, partially offset by lower allocation of direct costs to gold equivalent ounces - other
97

Table of Contents
metals as a result of the GEO price change, and lower inventory write-downs in the current year compared to the prior year. Depreciation and amortization per gold ounce increased 9% primarily due to higher depreciation rates as a result of higher gold ounces mined, partially offset by higher gold ounces sold. Depreciation and amortization per gold equivalent ounce – other metals increased 9% primarily due to lower gold equivalent ounces - other metals sold. All-in sustaining costs per gold ounce increased 9% primarily due to higher costs applicable to sales per gold ounce. All-in sustaining costs per gold equivalent ounce – other metals were generally in line with the prior year.
Brucejack, Canada. Gold production decreased 10% primarily due to lower ore grade milled and higher buildup of in-circuit inventory in the current year, partially offset by higher mill throughput. Costs applicable to sales per gold ounce increased 17% primarily due to lower gold ounces sold and higher labor costs, partially offset by higher by-product credits. Depreciation and amortization per gold ounce increased 12% primarily due to lower gold ounces sold. All-in sustaining costs per gold ounce increased 26% primarily due to higher costs applicable to sales per gold ounce and higher sustaining capital spend.
NGM, U.S. Attributable gold production was generally in line with the prior year. Costs applicable to sales per gold ounce increased 9% primarily due to lower gold ounces sold coupled with higher mining and processing costs at Carlin, partially offset by higher gold ounces sold at Turquoise Ridge. Depreciation and amortization per gold ounce increased 15% primarily due to higher amortization rates and lower gold ounces sold at Carlin, partially offset by higher gold ounces sold at Turquoise Ridge. All-in sustaining costs per gold ounce were generally in line with the prior year.
Pueblo Viejo, Dominican Republic. Attributable gold production increased 8% primarily due to higher mill throughput, partially offset by lower mill recovery. Refer to Note 15 of the Consolidated Financial Statements for further discussion of our equity method investments.
Foreign Currency Exchange Rates
Our foreign operations sell their gold, copper, silver, lead, and zinc production based on USD metal prices. Therefore, fluctuations in foreign currency exchange rates do not have a material impact on our revenue. Despite selling gold and silver in London, we have no exposure to the euro or the British pound.
Foreign currency exchange rates can increase or decrease profits to the extent costs are paid in foreign currencies. In 2025, approximately 59% of Costs applicable to sales were paid in currencies other than the U.S. dollar as follows:
Year Ended
December 31, 2025
Australian Dollar27 %
Canadian Dollar9 %
Mexican Peso8 %
Papua New Guinean Kina6 %
Argentine Peso4 %
Surinamese Dollar3 %
Peruvian Sol2 %
Ghanaian Cedi— %
Variations in the local currency exchange rates in relation to the USD at our foreign mining operations decreased Costs applicable to sales at sites by $190 during the year ended December 31, 2025, compared to the same period in 2024. The decrease was primarily due to significant currency devaluation of the Argentine peso as well as devaluation of the Mexican peso.
At December 31, 2025, the Company held AUD- and CAD-denominated fixed forward contracts to mitigate variability in the USD functional cash flows related to the AUD- and CAD-denominated operating expenditures to be incurred between October 2024 and December 2026 at certain sites, respectively. The unrealized changes in fair value for the fixed forward contracts are recorded in Accumulated other comprehensive income (loss) and will be reclassified to earnings through Costs applicable to sales beginning October 2024. Refer to Note 14 of the Consolidated Financial Statements for further information on our hedging instruments.
Hyperinflationary Economies
Hyperinflationary economies are defined by the International Monetary Fund as economies in which the projected three-year cumulative inflation exceeds 100%. For the year ended December 31, 2025, Argentina was the only hyperinflationary economy in which the Company held operations.
Argentina. Our Cerro Negro mine is located in Argentina and is a USD functional currency entity. Beginning in 2020, Argentina’s central bank enacted a number of foreign currency controls in an effort to stabilize the local currency, including requiring the Company to convert USD proceeds from metal sales to local currency within 60 days from shipment date or 20 business days from receipt of cash, whichever happens first, as well as restricting payments to foreign-related entities denominated in foreign currency, such as dividends or distributions to the parent and related companies and royalties and other payments to foreign beneficiaries. These
98

Table of Contents
restrictions directly impact Cerro Negro's ability to repay intercompany debt to the Company. In the third quarter of 2024, certain restrictions were lifted or modified, allowing companies to repay intercompany debt in certain circumstances.
In April 2025, the IMF Executive Board approved a 48-month, $20 billion extended arrangement under the Extended Fund Facility for Argentina. Within the program objectives, the IMF expressly mentions transitioning toward exchange rate flexibility, while gradually lifting foreign currency restrictions. The new exchange rate regime allows the Argentine peso to float within a moving band of 1,000 to 1,400 pesos per USD, expanding by 1% monthly at both limits. From January 1, 2026, the floating exchange rate regime between bands will remain in effect, and the monthly rate of adjustment of the upper and lower limits of the exchange rate band will be determined according to the latest monthly inflation data reported by INDEC. The central bank can intervene if the band is breached and may operate in secondary peso markets within the band. This managed float led to an immediate devaluation of the Argentine Peso. Further, a series of foreign currency restrictions have been lifted, including allowing companies to transfer to their foreign shareholders profits and dividends corresponding to fiscal years that began on or after January 1, 2025, provided applicable requirements are met.
We continue to monitor the foreign currency exposure risk and the evolution of currency controls, which are currently not expected to have a material impact on our financial statements.
Liquidity and Capital Resources
Liquidity Overview
We have a disciplined capital allocation strategy of maintaining financial flexibility to execute our capital priorities and generate long-term value for our stockholders. The Company continues to experience the impacts from geopolitical and macroeconomic pressures. With the resulting volatile environment, we continue to monitor inflationary conditions, the effects of certain countermeasures taken by central banks, and the potential for further supply chain disruptions, as well as an uncertain and evolving labor market including tariff and regulatory changes. Depending on the duration and extent of the impact of these events, or changes in commodity prices, the prices for gold and other metals, and foreign exchange rates, we could continue to experience volatility; transportation industry disruptions could occur, including limitations on shipping produced metals; our supply chain could experience disruption; cost inflation rates could further increase; or we could incur credit related losses of certain financial assets, which could materially impact our results of operations, cash flows and financial condition.
As of December 31, 2025, we believe our available liquidity allows us to manage the short- and, possibly, long-term material adverse impacts of these events on our business. Refer to Note 2 to the Consolidated Financial Statements for further discussion on risks and uncertainties.
At December 31, 2025, the Company had $7,647 in Cash and cash equivalents. The majority of our cash and cash equivalents are invested in a variety of highly liquid and low-risk investments with original maturities of three months or less that are available to fund our operations as necessary. We may have investments in prime money market funds that are classified as cash and cash equivalents; however, we continually monitor the need for reclassification under the SEC requirements for money market funds, and the potential that the shares of such funds could have a net asset value of less than their par value. We believe that our liquidity and capital resources are adequate to fund our operations and corporate activities.
At December 31, 2025, $2,347 of Cash and cash equivalents was held in foreign subsidiaries and is primarily held in USD denominated accounts with the remainder in foreign currencies readily convertible to USD. Cash and cash equivalents denominated in Argentine peso are subject to regulatory restrictions. Refer to Foreign Currency Exchange Rates above for further information. At December 31, 2025, $2,078 of consolidated Cash and cash equivalents was held at certain foreign subsidiaries that, if repatriated, may be subject to withholding taxes. We expect that there would be no additional tax burden upon repatriation after considering the cash cost associated with any potential withholding taxes.
We believe our existing consolidated Cash and cash equivalents, available capacity on our revolving credit facility, and cash generated from continuing operations will be adequate to satisfy working capital needs, fund future growth, meet debt obligations and meet other liquidity requirements for the foreseeable future. At December 31, 2025, our borrowing capacity on our revolving credit facility was $4,000 and we had no borrowings outstanding. We continue to remain compliant with covenants and do not currently anticipate any events or circumstances that would impact our ability to access funds available on this facility. Refer to Note 20 to the Consolidated Financial Statements for further information on our Debt.
99

Table of Contents
Our financial position was as follows:
At December 31, 2025At December 31, 2024
Cash and cash equivalents$7,647 $3,619 
Cash and cash equivalents included in assets held for sale (1)
— 45 
Available borrowing capacity on revolving credit facilities
4,000 4,000 
Total liquidity$11,647 $7,664 
Net debt (cash) (2)
$(2,058)$5,308 
____________________________
(1)During the first quarter of 2024, certain non-core assets were determined to meet the criteria for assets held for sale. As a result, the related Cash and cash equivalents was reclassified to Assets held for sale. At December 31, 2025, no amounts relating to Cash and cash equivalents and restricted cash remained in Assets held for sale. Refer to Note 3 to the Consolidated Financial Statements for additional information.
(2)Net debt is a non-GAAP financial measure. Refer to Non-GAAP Financial Measures, below.
Cash Flows
Year Ended December 31,
20252024
Net cash provided by (used in) operating activities of continuing operations$10,334 $6,318 
Net cash provided by (used in) investing activities of continuing operations$606 $(2,855)
Net cash provided by (used in) financing activities$(7,040)$(2,953)
Net cash provided by (used in) operating activities of continuing operations had an increase in cash provided of $4,016 during the year ended December 31, 2025 compared to the same period in 2024, primarily due to the net increase in Sales largely resulting from higher average realized gold prices in 2025, partially offset by higher cash tax payments which is directly correlated to the increase in pre-tax income driven by the higher average realized gold prices. Refer to Consolidated Financial Results, above, for more information on Sales, and Note 10 to the Consolidated Financial Statements for more information on Income and mining tax benefit (expense).
Net cash provided by (used in) investing activities of continuing operations had an increase in cash provided of $3,461 during the year ended December 31, 2025 compared to the same period in 2024, primarily due to the sales of non-core assets in 2025, including net proceeds received of $2,811 and a reduction in capital expenditures of $405 as a result of the divestments, as well as an increase in proceeds received from the sale of investments. Refer to Notes 3 to the Consolidated Financial Statements for additional information.
Net cash provided by (used in) financing activities had an increase in cash used of $4,087 during the year ended December 31, 2025 compared to the same period in 2024, primarily due to higher redemptions of debt and repurchases of common stock in 2025. Refer to Note 20 to the Consolidated Financial Statements for additional information on our Debt transactions.
Capital Resources
In February 2026, the Board declared a dividend of $0.26 per share as part of its updated capital allocation framework. This new framework is designed to be sustainable through the commodity cycle while also focusing on return of capital to shareholders, maintaining a resilient balance sheet, and making prudent capital investments for long-term value. The declaration and payment of future dividends remains at the full discretion of the Board and will depend on the Company’s financial results, cash requirements, future prospects and other factors deemed relevant by the Board.
In February 2024, the Board of Directors authorized a stock repurchase program to repurchase shares of outstanding common stock to provide returns to stockholders, provided that the aggregate value of shares of common stock repurchased under the new program does not exceed $1 billion; this program has been completed. In October 2024, the Board of Directors authorized an additional $2 billion stock repurchase program to repurchase shares of outstanding common stock; this program has been completed. In July 2025, the Board of Directors authorized an additional $3 billion stock repurchase program to repurchase shares of outstanding common stock.
The program will be executed at the Company’s discretion, permits shares to be repurchased under a variety of methods, has no expiration date, may be discontinued at any time, and the program does not obligate the Company to acquire any specific number of shares of its common stock or to repurchase the full authorized amount. Consequently, the Board of Directors may revise or terminate such share repurchase authorization in the future. Through the date of filing, we have executed and settled total trades of common stock repurchases under the previously authorized programs of $3,624, of which $2,303 was repurchased during the year ended December 31, 2025.
100

Table of Contents
Capital Expenditures
Cash generated from operations is used to execute our capital priorities, which include sustaining and developing our global portfolio of long-lived assets. Our near-term development capital projects include Tanami Expansion 2 and Cadia Panel Caves.
These projects are being funded from existing liquidity and will continue to be funded from future operating cash flows. Capital costs are estimated to be between $1,700 and $1,800 for Tanami Expansion 2 with an expected commercial production date in the second half of 2027. Capital costs are estimated to be between $2,000 and $2,400 for the PC 2-3 and PC1-2 Cadia Panel Caves project with development capital costs expected to continue until 2029.
We consider sustaining capital as those capital expenditures that are necessary to maintain current production and execute the current mine plan. Capital expenditures to develop new operations or related to projects at existing operations, where these projects will enhance production or reserves, are considered non-sustaining or development capital. The Company’s decision to reprioritize, sell or abandon a development project, which may include returning mining concessions to host governments, could result in a future impairment charge.
The Company continues to evaluate strategic priorities and deployment of capital to projects in the pipeline to ensure we execute on our capital priorities and provide long-term value to stockholders. Included in the Company's continuous evaluation is consideration of current market opportunities or pressures. Refer to Note 2 to the Consolidated Financial Statements for further discussion.
The Company had Additions to property, plant and mine development as follows:
Year Ended December 31,
202520242023
Development ProjectsSustaining CapitalTotalDevelopment ProjectsSustaining CapitalTotalDevelopment ProjectsSustaining CapitalTotal
Lihir$4 $144 $148 $89 $104 $193 $2 $51 $53 
Cadia294 303 597 246 291 537 42 33 75 
Tanami367 204 571 321 116 437 291 122 413 
Boddington— 145 145 — 129 129 — 164 164 
Ahafo South (1)
12 156 168 19 108 127 5 134 139 
Ahafo North (1)
312 9 321 255 — 255 171 — 171 
Merian— 58 58 — 81 81 — 84 84 
Cerro Negro39 111 150 125 61 186 107 55 162 
Yanacocha11 10 21 39 22 61 288 24 312 
Peñasquito— 123 123 — 129 129 — 113 113 
Red Chris99 58 157 90 60 150 16 9 25 
Brucejack— 104 104 3 67 70 1 21 22 
NGM146 241 387 97 351 448 138 334 472 
Corporate and Other— 23 23 — 22 22 8 43 51 
Divested (2)
CC&V— 5 5 — 26 26 — 64 64 
Musselwhite— 14 14 — 97 97 — 104 104 
Porcupine28 26 54 122 79 201 98 68 166 
Éléonore— 12 12 — 100 100 — 106 106 
Akyem— 9 9 1 23 24 3 37 40 
Telfer
— — — 12 39 51 1 8 9 
Accrual basis$1,312 $1,755 $3,067 $1,419 $1,905 $3,324 $1,171 $1,574 $2,745 
(Increase) decrease in non-cash adjustments
(32)78 (79)
Cash basis $3,035 $3,402 $2,666 
____________________________
(1)In the fourth quarter of 2025, the Ahafo North development project achieved commercial production resulting in designation as a reportable segment. Prior to declaration of commercial production, Ahafo North was classified as a development project and all activity was included in the Ahafo South reportable segment. Although not a reportable segment until the fourth quarter of 2025, the amounts related to Ahafo North have been reported separately for comparability purposes. Refer to Note 4 to the Consolidated Financial Statements for information.
(2)Refer to Note 3 to the Consolidated Financial Statements for information on the Company's divestitures.
For the year ended December 31, 2025, development projects primarily included Tanami Expansion 2, Ahafo North, Cadia Panel Caves, Red Chris Block Cave, Cerro Negro expansions projects, and the Goldrush Complex at NGM. Development capital costs
101

Table of Contents
(excluding capitalized interest and capitalized depreciation and amortization) on our Tanami Expansion 2, Ahafo North, and Cadia Panel Caves projects since approval were $1,304, $900, and $516, respectively, of which $284, $284, and $268 related to the year ended December 31, 2025, respectively.
For the year ended December 31, 2024, development projects included Red Chris Block Caves, Pamour at Porcupine, Cerro Negro expansion projects, Yanacocha Sulfides, Tanami Expansion 2, Cadia Panel Caves, Phase 14A Wall construction at Lihir, Ahafo North, and Goldrush Complex at NGM.
For the year ended December 31, 2023, development projects included Pamour at Porcupine, Cerro Negro expansion projects Yanacocha Sulfides, Tanami Expansion 2, Cadia Panel Caves, Ahafo North, and the TS Solar Plant and Goldrush Complex at NGM.
The Company will from time to time enter into hedging relationships to mitigate variability in development capital spend denominated in foreign currency. The Company has entered into A$1,734 AUD-denominated fixed forward contracts, designated as foreign currency cash flow hedges, to mitigate variability in the USD functional cash flows related to the AUD-denominated capital expenditures related to the construction and development phase of the Tanami Expansion 2, Cadia Panel Caves, and Cadia Tailings projects expected to be incurred between October 2024 and December 2026. Refer to Note 14 to the Consolidated Financial Statements for further information.
For the years ended December 31, 2025, 2024, and 2023, sustaining capital includes capital expenditures such as tailings facility construction, infrastructure improvements, underground and surface mine development, capital component purchases, mining equipment, and reserves drilling conversion. Additionally, for the year ended December 31, 2023, sustaining capital included haul truck purchases for the Autonomous Haulage System at Boddington. The Company currently expects to incur higher annual sustaining capital spend over the next few years at our ongoing operations relative to historical amounts as we continue to advance the critical tailings work at Cadia and Boddington and strengthen operating efficiency across our portfolio.
Refer to Note 4 to our Consolidated Financial Statements and Non-GAAP Financial Measures, "All-In Sustaining Costs", below, for further information.
Debt
Debt and Corporate Revolving Credit Facilities. The Company from time to time will redeem its outstanding senior notes ahead of their scheduled maturity dates utilizing Cash and cash equivalents. Additionally, depending upon market conditions and strategic considerations, we may choose to refinance debt in the capital markets. We generally expect to be able to fund maturities of debt from Net cash provided by (used in) operating activities, existing cash balances, and available credit facilities.
In 2025, the Company completed debt extinguishments comprised of (i) a $2 billion debt tender consisting of partial redemptions of certain senior notes, (ii) the full redemption of the outstanding 2026 Senior Notes, and (iii) the partial redemption of certain other senior notes through open market repurchases. As a result of these redemptions, the company recognized a loss on extinguishment of $101 for the year ended December 31, 2025, recognized in Other income (loss), net.
Debt Covenants. Our senior notes and revolving credit facilities contain various covenants and default provisions including payment defaults, limitations on liens, leases, sales and leaseback agreements, merger restrictions, limiting the sale of all or substantially all of our assets, certain change of control provisions, and a negative pledge on certain assets. Additionally, the corporate revolving credit facility contains a financial ratio covenant requiring us to maintain a net debt (total debt net of Cash and cash equivalents) to total capitalization ratio of less than or equal to 62.50%.
At December 31, 2025, we were in compliance with all existing debt covenants and provisions related to potential defaults.
Letters of Credit and Other Guarantees. We have off-balance sheet arrangements of $1,943 of outstanding surety bonds, bank letters of credit and bank guarantees (refer to Note 24 to the Consolidated Financial Statements). At December 31, 2025, none of the $4,000 corporate revolving credit facility was used to secure the issuance of letters of credit.
For further information on our Debt, refer to Note 20 to the Consolidated Financial Statements.
Co-Issuer and Supplemental Guarantor Information. The Company filed a shelf registration statement with the SEC on Form S-3 under the Securities Act, of 1933, as amended, which enables us to issue an indeterminate number or amount of common stock, preferred stock, depository shares, debt securities, guarantees of debt securities, warrants and units (the “Shelf Registration Statement”). Under the Shelf Registration Statement, our debt securities may be guaranteed by Newmont USA Limited (“Newmont USA”), one of our consolidated subsidiaries.
Newmont and Newcrest Finance, as issuers, and Newmont USA, as guarantor, are collectively referred to herein as the "Obligor Group."
These guarantees are full and unconditional, and none of our other subsidiaries guarantee any security issued and outstanding. The cash provided by operations of the Obligor Group, and all of its subsidiaries, is available to satisfy debt repayments as they become due, and there are no material restrictions on the ability of the Obligor Group to obtain funds from subsidiaries by
102

Table of Contents
dividend, loan, or otherwise, except to the extent of any rights, noncontrolling interests, foreign currency or regulatory restrictions limiting repatriation of cash. Net assets attributable to noncontrolling interests were $175 at December 31, 2025. All noncontrolling interests relate to non-guarantor subsidiaries.
Newmont and Newmont USA are primarily holding companies with no material operations, sources of income or assets other than equity interest in their subsidiaries and intercompany receivables or payables. Newcrest Finance is a finance subsidiary with no material assets or operations other than those related to issued external debt. Newmont USA’s primary investments are comprised of its 38.5% interest in NGM. For further information regarding these and our other operations, refer to Note 4 to the Consolidated Financial Statements and Results of Consolidated Operations within Part II, Item 7, MD&A.
In addition to equity interests in subsidiaries, the Obligor Group’s balance sheets consisted primarily of the following intercompany assets, intercompany liabilities, and external debt. The remaining assets and liabilities of the Obligor Group are considered immaterial at December 31, 2025.
December 31, 2025
Obligor GroupNewmont USA
Current intercompany assets$24,979 $17,426 
Non-current intercompany assets$770 $283 
Current intercompany liabilities$28,983 $1,621 
Non-current intercompany liabilities$49 $— 
Non-current external debt$5,108 $— 
Newmont USA's subsidiary guarantees (the “subsidiary guarantees”) are general unsecured senior obligations of Newmont USA and rank equal in right of payment to all of Newmont USA's existing and future senior unsecured indebtedness and senior in right of payment to all of Newmont USA's future subordinated indebtedness. The subsidiary guarantees are effectively junior to any secured indebtedness of Newmont USA to the extent of the value of the assets securing such indebtedness.
At December 31, 2025, Newmont USA guaranteed $5,051 of the $5,108 in total Obligor Group external debt. Under the terms of the subsidiary guarantees, holders of Newmont’s securities subject to such subsidiary guarantees will not be required to exercise their remedies against Newmont before they proceed directly against Newmont USA.
Newmont USA will be released and relieved from all its obligations under the subsidiary guarantees in certain specified circumstances, including, but not limited to, the following:
•upon the sale or other disposition (including by way of consolidation or merger), in one transaction or a series of related transactions, of a majority of the total voting power of the capital stock or other interests of Newmont USA (other than to Newmont or any of Newmont’s affiliates);
•upon the sale or disposition of all or substantially all the assets of Newmont USA (other than to Newmont or any of Newmont’s affiliates); or
•upon such time as Newmont USA ceases to guarantee more than $75 aggregate principal amount of Newmont’s debt (at December 31, 2025, Newmont USA guaranteed $517 aggregate principal amount of debt of Newmont that did not contain a similar fall-away provision).
Newmont’s debt securities are effectively junior to any secured indebtedness of Newmont to the extent of the value of the assets securing such indebtedness, and structurally subordinated to all debt and other liabilities of Newmont’s non-guarantor subsidiaries. At December 31, 2025, (i) Newmont’s total consolidated indebtedness was approximately $5,589, none of which was secured (other than $474 of Lease and other financing obligations), and (ii) Newmont’s non-guarantor subsidiaries had $9,133 of total liabilities (including trade payables, but excluding intercompany, external debt, and reclamation and remediation liabilities), which would have been structurally senior to Newmont’s debt securities.
For further information on our Debt, refer to Note 20 to the Consolidated Financial Statements.
103

Table of Contents
Contractual Obligations
Our contractual obligations at December 31, 2025 are summarized as follows:
Payments Due by Period
TotalCurrentNon-Current
Debt (1)
$8,242 $239 $8,003 
Finance lease and other financing obligations (2)
608 119 489 
Remediation and reclamation liabilities (3)
9,894 922 8,972 
Uncertain income tax liabilities and interest (4)
128 — 128 
Employee-related benefits (5)
1,207 432 775 
Operating leases and other obligations (6)
123 33 90 
Minimum royalty payments (7)
29 29 — 
Purchase obligations (8)
836 380 456 
Other
392 213 179 
$21,459 $2,367 $19,092 
____________________________
(1)Debt includes principal of $5,343 on senior notes and estimated interest payments of $2,899 on senior notes, assuming no early extinguishment.
(2)Finance lease and other financing obligations includes finance lease payments of $608.
(3)Mining operations are subject to extensive environmental regulations in the jurisdictions in which they operate. Pursuant to environmental regulations, we are required to close our operations and reclaim and remediate the lands that operations have disturbed. The estimated undiscounted cash outflows of these Reclamation and remediation liabilities are reflected here. For more information regarding reclamation and remediation liabilities, refer to Note 6 to the Consolidated Financial Statements.
(4)We are unable to reasonably estimate the timing of our uncertain income tax liabilities and interest payments due to uncertainties in the timing of the effective settlement of tax positions.
(5)Contractual obligations for Employee-related benefits include severance, workers’ participation, pension and other benefit plans. Pension plan and other benefit payments beyond 2035 cannot be reasonably estimated given variable market conditions and actuarial assumptions and are not included.
(6)Operating lease and other obligations includes operating lease payments of $123.
(7)Minimum royalty payments are related to continuing operations and are presented net of recoverable amounts.
(8)Purchase obligations are not recorded in the Consolidated Financial Statements. Purchase obligations represent contractual obligations for purchase of power, materials and supplies, consumables, inventories and capital projects.
Environmental
Our mining and exploration activities are subject to various federal and state laws and regulations governing the protection of the environment. We have made, and expect to make in the future, expenditures to comply with such laws and regulations, but cannot predict the full amount of such future expenditures. We perform a comprehensive review of our reclamation and remediation liabilities annually and review changes in facts and circumstances associated with these obligations at least quarterly. Newmont is committed to the implementation of the GISTM and the disclosure of implementation status for tailings facilities. Conformance with the GISTM is on-going and has and may continue to result in further increases to our estimated sustaining costs and closure costs for existing operations and non-operating sites. Disclosures can be found on our website. Additionally, laws, regulations and permit requirements focused on water management and discharge requirements for operations and water treatment are becoming increasingly stringent. Compliance with water management and discharge quality remains dynamic and has and may continue to result in further increases to our estimated closure costs.
At December 31, 2025 and 2024, $6,800 and $7,015, respectively, were accrued for reclamation costs relating to currently or recently producing or development stage mineral properties, of which $829 and $928, respectively, were classified as current liabilities.
In addition, we are involved in several matters concerning environmental obligations associated with former, primarily historical, mining activities. Based upon our best estimate of our liability for these matters, $390 and $370 were accrued for such obligations at December 31, 2025 and 2024, respectively, of which $64 and $63, respectively, were classified as current liabilities. We spent $71, $82, and $44 during the years ended December 31, 2025, 2024, and 2023, respectively, for environmental obligations related to the former mining activities.
Reclamation and remediation adjustments during 2025 primarily related to increased cost estimates at Peñasquito resulting from updated risk assessments and the identification of additional uncertainties regarding long‑term tailings storage facility embankment stability, partially offset by a reduction in cost estimates at portions of the Yanacocha site that are no longer in production and with no expected substantive economic value (i.e., non-operating) following the completion of several closure related studies. Reclamation and remediation adjustments during 2024 primarily related to a reduction in cost estimates at non-operating portions of the Yanacocha site.
104

Table of Contents
During the year ended December 31, 2025, 2024, and 2023, capital expenditures were approximately $58, $35, and $41, respectively, to comply with environmental regulations.
Our sustainability strategy is a foundational element in achieving our purpose to create value and improve lives through sustainable and responsible mining. Sustainability and safety are integrated into the business at all levels of the organization through our global policies, standards, strategies, business plans and remuneration plans. For more information on the Company’s reclamation and remediation liabilities, refer to Notes 6 and 24 to the Consolidated Financial Statements. For discussion of regulatory, tailings, water, climate and other environmental risks, refer to Part I, Item 1A. Risk Factors, for additional information.
Forward-Looking Statements
The foregoing discussion and analysis, as well as certain information contained elsewhere in this Annual Report, contain “forward-looking statements” within the meaning of Section 27A of the Securities Act of 1933, as amended, and Section 21E of the Securities Exchange Act of 1934, as amended, and are intended to be covered by the safe harbor created thereby. For a more detailed discussion of risks and other factors that might impact forward-looking statements and other important information about forward-looking statements, refer to the discussion in Forward-Looking Statements in Part I, Item 1, Business and Part I, Item 1A, Risk Factors.
Non-GAAP Financial Measures
Non-GAAP financial measures are intended to provide additional information only and do not have any standard meaning prescribed by GAAP. These measures should not be considered in isolation or as a substitute for measures of performance prepared in accordance with GAAP. Unless otherwise noted, we present the non-GAAP financial measures of our continuing operations in the tables below. For additional information regarding our discontinued operations, refer to Note 1 to the Consolidated Financial Statements.
Earnings Before Interest, Taxes, and Depreciation and Amortization and Adjusted Earnings Before Interest, Taxes, and Depreciation and Amortization
Management uses Earnings before interest, taxes, and depreciation and amortization (“EBITDA”) and EBITDA adjusted for non-core or certain items that have a disproportionate impact on our results for a particular period (“Adjusted EBITDA”) as non-GAAP measures to evaluate the Company’s operating performance. EBITDA and Adjusted EBITDA do not represent, and should not be considered an alternative to, net income (loss), operating income (loss), or cash flow from operations as those terms are defined by GAAP, and do not necessarily indicate whether cash flows will be sufficient to fund cash needs. Although Adjusted EBITDA and similar measures are frequently used as measures of operations and the ability to meet debt service requirements by other companies, our calculation of Adjusted EBITDA is not necessarily comparable to such other similarly titled captions of other companies. The Company believes that Adjusted EBITDA provides useful information to investors and others in understanding and evaluating our operating results in the same manner as our management and Board of Directors. Management’s determination of the components of Adjusted EBITDA are evaluated periodically and based, in part, on a review of non-GAAP financial measures used by mining industry analysts. Net income (loss) attributable to Newmont stockholders is reconciled to EBITDA and Adjusted EBITDA as follows:
105

Table of Contents
Year Ended December 31,
202520242023
Net income (loss) attributable to Newmont stockholders
$7,085 $3,348 $(2,494)
Net income (loss) attributable to non-controlling interests82 33 27 
Net (income) loss from discontinued operations (1)
— (68)(27)
Equity loss (income) of affiliates(421)(133)(63)
Income and mining tax expense (benefit)4,596 1,397 526 
Depreciation and amortization
2,521 2,576 2,108 
Interest expense, net of capitalized interest
229 375 243 
EBITDA14,092 7,528 320 
Adjustments:
(Gain) loss on sale of assets held for sale (2)
(1,066)1,114 — 
Impairment charges (3)
842 78 1,891 
Change in fair value of investments and options (4)
(604)(62)47 
Restructuring and severance (5)
186 38 24 
Loss (gain) on debt extinguishment (6)
101 (32)— 
Reclamation and remediation charges (7)
(96)(71)1,260 
Loss (gain) on asset and investment sales (8)
20 (35)197 
Settlement costs (9)
2 44 7 
Newcrest transaction and integration costs (10)
— 72 464 
Pension settlements and curtailments (11)
— 1 9 
Other (12)
3 — (4)
Adjusted EBITDA$13,480 $8,675 $4,215 
____________________________
(1)For additional information regarding our discontinued operations, refer to Note 1 of the Consolidated Financial Statements.
(2)Primarily consists of the gain on the sales of certain non-core assets in 2025 and the write-downs on assets held for sale in 2024; included in (Gain) loss on sale of assets held for sale. Refer to Note 3 of the Consolidated Financial Statements for further information.
(3)Represents non-cash write-downs of various assets that are no longer in use and materials and supplies inventories; included in Impairment charges. Refer to Note 7 of the Consolidated Financial Statements for further information.
(4)Primarily consists of the unrealized gains and losses related to the Company's marketable equity and other securities; included in Change in fair value of investments and options.
(5)Primarily represents severance and related costs associated with significant organizational or operating model changes implemented by the Company; included in Other expense, net. Refer to Note 8 of the Consolidated Financial Statements for further information.
(6)Represents the losses and gains on debt redemptions; included in Other income (loss), net. Refer to Note 20 of the Consolidated Financial Statements for further information.
(7)Represent revisions to reclamation and remediation plans at the Company's former operating properties and historic mining operations that have entered the closure phase and have no substantive future economic value; included in Reclamation and remediation. Refer to Note 6 of the Consolidated Financial Statements for further information.
(8)Primarily represents gains and losses related to the sale of certain assets and investments; included in Other income (loss), net.
(9)Primarily consists of litigation expenses and other settlements in 2025, wind-down and demobilization costs related to the French Guiana project in 2024, and costs related to additional employee related accruals as a result of the Australian Fair Work legislation in 2023; included in Other expense, net.
(10)Represents costs incurred related to the Newcrest transaction; included in Other expense, net. In 2025, includes a gain recognized on the reduction of the stamp duty tax liability incurred as a result of the Newcrest transaction. In 2023, these costs primarily include $316 related to the stamp duty tax incurred in connection with the transaction.
(11)Represents pension settlement charges and curtailment gains; included in Other income (loss), net. Refer to Note 11 of the Consolidated Financial Statements for further information.
(12)Primarily consists of costs incurred related to transition service agreements for divested reportable segments in 2025 and in 2023 represents income received related to prior period investment sales; included in Other income (loss), net.
Adjusted Net Income (Loss)
Management uses Adjusted net income (loss) to evaluate the Company’s operating performance and for planning and forecasting future business operations. The Company believes the use of Adjusted net income (loss) allows investors and analysts to understand the results of the continuing operations of the Company and its direct and indirect subsidiaries relating to the sale of products, by excluding certain items that have a disproportionate impact on our results for a particular period. Adjustments to continuing operations are presented before tax and net of our partners’ noncontrolling interests, when applicable. The tax effect of adjustments is presented in the Tax effect of adjustments line and is calculated using the applicable tax rate. Management’s determination of the components of Adjusted net income (loss) are evaluated periodically and based, in part, on a review of non-GAAP
106

Table of Contents
financial measures used by mining industry analysts. Net income (loss) attributable to Newmont stockholders is reconciled to Adjusted net income (loss) as follows:
Year Ended December 31, 2025
per share data (1)
basicdiluted
Net income (loss) attributable to Newmont stockholders
$7,085 $6.41 $6.39 
(Gain) loss on sale of assets held for sale (2)
(1,066)(0.97)(0.97)
Impairment charges (3)
841 0.76 0.76 
Change in fair value of investments and options (4)
(604)(0.54)(0.54)
Restructuring and severance (5)
184 0.16 0.16 
Loss on debt extinguishment (6)
101 0.09 0.09 
Reclamation and remediation charges (7)
(96)(0.09)(0.09)
Loss on asset and investment sales (8)
20 0.02 0.02 
Settlement costs (9)
2 — — 
Other (10)
3 — — 
Tax effect of adjustments (11)
281 0.27 0.27 
Valuation allowance and other tax adjustments (12)
883 0.80 0.80 
Adjusted net income (loss)$7,634 $6.91 $6.89 
Weighted average common shares (millions): (13)
1,106 1,108 
____________________________
(1)Per share measures may not recalculate due to rounding.
(2)Primarily consists of the gain on the sales of certain non-core assets; included in (Gain) loss on sale of assets held for sale. Refer to Note 3 of the Consolidated Financial Statements for further information.
(3)Represents non-cash write-downs of various assets that are no longer in use and materials and supplies inventories; included in Impairment charges. Refer to Note 7 of the Consolidated Financial Statements for further information. Amounts are presented net of Net loss (income) attributable to non-controlling interests of $(1).
(4)Primarily consists of the unrealized gains and losses related to the Company's marketable equity and other securities; included in Change in fair value of investments and options.
(5)Primarily represents severance and related costs associated with significant organizational or operating model changes implemented by the Company; included in Other expense, net. Refer to Note 8 of the Consolidated Financial Statements for further information. Amounts are presented net of Net loss (income) attributable to non-controlling interests of $(2).
(6)Represents the losses on debt redemptions; included in Other income (loss), net. Refer to Note 20 of the Consolidated Financial Statements for further information.
(7)Represent revisions to reclamation and remediation plans at the Company's former operating properties and historic mining operations that have entered the closure phase and have no substantive future economic value; included in Reclamation and remediation. Refer to Note 6 of the Consolidated Financial Statements for further information.
(8)Primarily represents gains and losses related to the sale of certain assets and investments; included in Other income (loss), net.
(9)Primarily consists of litigation expenses and other settlements; included in Other expense, net.
(10)Primarily consists of costs incurred related to transition service agreements for divested reportable segments; included in Other income (loss), net. Refer to Note 3 of the Consolidated Financial Statements for further information.
(11)The tax effect of adjustments, included in Income and mining tax benefit (expense), represents the tax effect of adjustments in footnotes (2) through (10), as described above, and are calculated using the applicable tax rate.
(12)Valuation allowance and other tax adjustments, included in Income and mining tax benefit (expense), is recorded for items such as foreign tax credits, alternative minimum tax credits, capital losses, disallowed foreign losses, and the effects of changes in foreign currency exchange rates on deferred tax assets and deferred tax liabilities. The adjustment reflects the net increase or (decrease) to net operating losses, capital losses, tax credit carryovers, and other deferred tax assets subject to valuation allowance of $295, the effects of changes in foreign exchange rates on deferred tax assets and liabilities of $(139), net reductions to the reserve for uncertain tax positions of $1, and other tax adjustments of $726.
(13)Adjusted net income (loss) per diluted share is calculated using diluted common shares, which are calculated in accordance with GAAP.
107

Table of Contents
Year Ended December 31, 2024
per share data (1)
basicdiluted
Net income (loss) attributable to Newmont stockholders
$3,348 $2.92 $2.92 
Net loss (income) attributable to Newmont stockholders from discontinued operations (2)
(68)(0.06)(0.06)
Net income (loss) attributable to Newmont stockholders from continuing operations3,280 2.86 2.86 
(Gain) loss on sale of assets held for sale (3)
1,114 0.97 0.97 
Impairment charges (4)
78 0.07 0.07 
Newcrest transaction and integration costs (5)
72 0.06 0.06 
Reclamation and remediation charges (6)
(71)(0.06)(0.06)
Change in fair value of investments (7)
(62)(0.05)(0.05)
Settlement costs (8)
44 0.04 0.04 
Restructuring and severance (9)
38 0.03 0.03 
(Gain) on asset and investment sales (10)
(35)(0.03)(0.03)
(Gain) on debt extinguishment (11)
(32)(0.03)(0.03)
Pension settlements (12)
1 — — 
Tax effect of adjustments (13)
(315)(0.27)(0.27)
Valuation allowance and other tax adjustments (14)
(121)(0.11)(0.11)
Adjusted net income (loss)$3,991 $3.48 $3.48 
Weighted average common shares (millions): (15)
1,146 1,148 
____________________________
(1)Per share measures may not recalculate due to rounding.
(2)For additional information regarding our discontinued operations, refer to Note 1 of the Consolidated Financial Statements.
(3)Primarily consists of the loss on the sales of certain non-core assets and write-downs on assets held for sale; included in (Gain) loss on sale of assets held for sale. Refer to Note 3 of the Consolidated Financial Statements for further information.
(4)Represents non-cash write-downs of various assets that are no longer in use and materials and supplies inventories; included in Impairment charges. Refer to Note 7 of the Consolidated Financial Statements for further information.
(5)Represents costs incurred related to the Newcrest transaction; included in Other expense, net.
(6)Represent revisions to reclamation and remediation plans at the Company's former operating properties and historic mining operations that have entered the closure phase and have no substantive future economic value; included in Reclamation and remediation. Refer to Note 6 of the Consolidated Financial Statements for further information.
(7)Primarily consists of the unrealized gains and losses related to the Company's marketable equity and other securities; included in Change in fair value of investments and options.
(8)Primarily consists of wind-down and demobilization costs related to the French Guiana; included in Other expense, net.
(9)Primarily represents severance and related costs associated with significant organizational or operating model changes implemented by the Company; included in Other expense, net. Refer to Note 8 of the Consolidated Financial Statements for further information.
(10)Primarily represents gains and losses related to the sale of certain assets and investments; included in Other income (loss), net.
(11)Represents the gains on debt redemptions; included in Other income (loss), net. Refer to Note 20 of the Consolidated Financial Statements for further information.
(12)Primarily represents pension settlement charges related to lump sum payments to participants; included in Other income (loss), net. Refer to Note 11 of the Consolidated Financial Statements for further information.
(13)The tax effect of adjustments, included in Income and mining tax benefit (expense), represents the tax effect of adjustments in footnotes (3) through (12), as described above, and are calculated using the applicable tax rate.
(14)Valuation allowance and other tax adjustments, included in Income and mining tax benefit (expense), is recorded for items such as foreign tax credits, alternative minimum tax credits, capital losses, disallowed foreign losses, and the effects of changes in foreign currency exchange rates on deferred tax assets and deferred tax liabilities. The adjustment reflects the net increase or (decrease) to net operating losses, capital losses, tax credit carryovers, and other deferred tax assets subject to valuation allowance of $(302), the effects of changes in foreign exchange rates on deferred tax assets and liabilities of $(30), net reductions to the reserve for uncertain tax positions of $(63), recording of a deferred tax liability for the outside basis difference at Akyem of $49 due to the status change to held for sale, and other tax adjustments of $225.
(15)Adjusted net income (loss) per diluted share is calculated using diluted common shares, which are calculated in accordance with GAAP.
108

Table of Contents
Year Ended December 31, 2023
per share data (1)
basicdiluted
Net income (loss) attributable to Newmont stockholders$(2,494)$(2.97)$(2.97)
Net loss (income) attributable to Newmont stockholders from discontinued operations (2)
(27)(0.03)(0.03)
Net income (loss) attributable to Newmont stockholders from continuing operations (3)
(2,521)(3.00)(3.00)
Impairment charges (4)
1,888 2.25 2.25 
Reclamation and remediation charges (5)
1,260 1.50 1.50 
Newcrest transaction and integration costs (6)
464 0.56 0.56 
(Gain) loss on asset and investment sales (7)
197 0.23 0.23 
Change in fair value of investments (8)
47 0.05 0.05 
Restructuring and severance (9)
24 0.03 0.03 
Pension settlements (10)
9 0.01 0.01 
Settlement costs (11)
7 0.01 0.01 
Other (12)
(4)— — 
Tax effect of adjustments (13)
(613)(0.73)(0.73)
Valuation allowance and other tax adjustments (14)
566 0.66 0.66 
Adjusted net income (loss)$1,324 $1.57 $1.57 
Weighted average common shares (millions): (3)
841 841 
____________________________
(1)Per share measures may not recalculate due to rounding.
(2)For additional information regarding our discontinued operations, refer to Note 1 of the Consolidated Financial Statements.
(3)Adjusted net income (loss) per diluted share is calculated using diluted common shares, which are calculated in accordance with GAAP. For the year ended December 31, 2023, potentially dilutive shares, which were insignificant, were excluded from the computation of diluted loss per common share attributable to Newmont stockholders in the Consolidated Statement of Operations as they were antidilutive. These shares were included in the computation of adjusted net income per diluted share for the year ended December 31, 2023.
(4)Represents non-cash write-downs of various assets that are no longer in use and materials and supplies inventories; included in Impairment charges. Refer to Note 7 of the Consolidated Financial Statements for further information. Amount is presented net of Net loss (income) attributable to non-controlling interests of $(3).
(5)Represent revisions to reclamation and remediation plans at the Company's former operating properties and historic mining operations that have entered the closure phase and have no substantive future economic value; included in Reclamation and remediation. Refer to Note 6 of the Consolidated Financial Statements for further information.
(6)Primarily consists of $316 related to the stamp duty tax incurred in connection with the Newcrest transaction; included in Other expense, net.
(7)Primarily represents gains and losses related to the sale of certain assets and investments; included in Other income (loss), net.
(8)Primarily consists of the unrealized gains and losses related to the Company's marketable equity and other securities; included in Change in fair value of investments and options.
(9)Primarily represents severance and related costs associated with significant organizational or operating model changes implemented by the Company; included in Other expense, net.
(10)Primarily represents pension settlement charges related to lump sum payments to participants; included in Other income (loss), net. Refer to Note 11 of the Consolidated Financial Statements for further information.
(11)Primarily consists of costs related to additional employee related accruals as a result of the Australian Fair Work legislation; included in Other expense, net.
(12)Primarily consists of income received related to prior period investment sales; included in Other income (loss), net.
(13)The tax effect of adjustments, included in Income and mining tax benefit (expense), represents the tax effect of adjustments in footnotes (4) through (12), as described above, and are calculated using the applicable tax rate.
(14)Valuation allowance and other tax adjustments, included in Income and mining tax benefit (expense), is recorded for items such as foreign tax credits, alternative minimum tax credits, capital losses, disallowed foreign losses, and the effects of changes in foreign currency exchange rates on deferred tax assets and deferred tax liabilities. The adjustment reflects the net increase or (decrease) to net operating losses, capital losses, tax credit carryovers, and other deferred tax assets subject to valuation allowance of $357, the effects of changes in foreign exchange rates on deferred tax assets and liabilities of $(3), net removal to the reserve for uncertain tax positions of $(28), and other tax adjustments of $240.
Free Cash Flow
Management uses Free cash flow as a non-GAAP measure to analyze cash flows generated from operations. Free cash flow is Net cash provided by (used in) operating activities less Net cash provided by (used in) operating activities of discontinued operations less Additions to property, plant and mine development as presented on the Consolidated Statements of Cash Flows. The Company believes Free cash flow is also useful as one of the bases for comparing the Company’s performance with its competitors. Although Free cash flow and similar measures are frequently used as measures of cash flows generated from operations by other companies, the Company’s calculation of Free cash flow is not necessarily comparable to such other similarly titled captions of other companies.
109

Table of Contents
The presentation of non-GAAP Free cash flow is not meant to be considered in isolation or as an alternative to net income as an indicator of the Company’s performance, or as an alternative to cash flows from operating activities as a measure of liquidity as those terms are defined by GAAP, and does not necessarily indicate whether cash flows will be sufficient to fund cash needs. The Company’s definition of Free cash flow is limited in that it does not represent residual cash flows available for discretionary expenditures due to the fact that the measure does not deduct the payments required for debt service and other contractual obligations or payments made for business acquisitions. Therefore, the Company believes it is important to view Free cash flow as a measure that provides supplemental information to the Company’s Consolidated Statements of Cash Flows.
The following table sets forth a reconciliation of Free cash flow, a non-GAAP financial measure, to Net cash provided by (used in) operating activities, which the Company believes to be the GAAP financial measure most directly comparable to Free cash flow, as well as information regarding Net cash provided by (used in) investing activities and Net cash provided by (used in) financing activities.
Year Ended December 31,
202520242023
Net cash provided by (used in) operating activities
$10,334 $6,363 $2,763 
Less: Net cash used in (provided by) investing activities of discontinued operations— (45)(9)
Net cash provided by (used in) operating activities of continuing operations
10,334 6,318 2,754 
Less: Additions to property, plant and mine development
(3,035)(3,402)(2,666)
Free cash flow$7,299 $2,916 $88 
Net cash provided by (used in) investing activities (1)
$606 $(2,702)$(1,002)
Net cash provided by (used in) financing activities
$(7,040)$(2,953)$(1,603)
____________________________
(1)Net cash provided by (used in) investing activities includes Additions to property, plant and mine development, which is included in the Company’s computation of Free cash flow.
Net Debt
Management uses Net debt to measure the Company’s liquidity and financial position. Net debt is calculated as Debt and Lease and other financing obligations less Cash and cash equivalents, as presented on the Consolidated Balance Sheets. Cash and cash equivalents are subtracted from Debt and Lease and other financing obligations as these could be used to reduce the Company's debt obligations. The Company believes that the use of Net debt provides investors and other stakeholders with a meaningful measure of financial flexibility and balance sheet strength, and is also a key metric used in the Company’s debt covenant calculations. The Company has also presented Net debt excluding Lease and other financing obligations to provide a supplemental view of evaluating the financial flexibility and strength of the Company's balance sheet. Net debt is intended to provide additional information only and does not have any standardized meaning prescribed by GAAP and should not be considered in isolation or as a substitute for measures of liquidity prepared in accordance with GAAP. Other companies may calculate this measure differently.
The following table sets forth a reconciliation of Net debt, a non-GAAP financial measure, to Debt and Lease and other financing obligations, which the Company believes to be the GAAP financial measures most directly comparable to Net debt.
At December 31, 2025At December 31, 2024
Debt
$5,115 $8,476 
Less: Cash and cash equivalents
(7,647)(3,619)
Less: Cash and cash equivalents included in assets held for sale (1)
— (45)
Net debt excluding leases and other financing obligations(2,532)4,812 
Add: Lease and other financing obligations
474 496 
Net debt (cash)
$(2,058)$5,308 
____________________________
(1)During the first quarter of 2024, certain non-core assets were determined to meet the criteria for assets held for sale. As a result, the related Cash and cash equivalents was reclassified to Assets held for sale. Refer to Note 3 to the Consolidated Financial Statements for additional information.
All-In Sustaining Costs
Current GAAP measures used in the mining industry, such as costs applicable to sales, do not capture all of the expenditures incurred to discover, develop, and sustain production. Therefore, Newmont calculates All-in sustaining costs (“AISC”) based on the definition published by the World Gold Council. The World Gold Council is a market development organization for the gold industry comprised of and funded by gold mining companies around the world and is a regulatory organization.
AISC is a metric that expands on GAAP measures, such as costs applicable to sales, to provide visibility into the economics of our mining operations related to expenditures, operating performance, and the ability to generate cash flow from our continuing
110

Table of Contents
operations. We believe that AISC is a non-GAAP measure that provides additional information to management, investors and others that aids in the understanding of the economics of our operations and performance compared to other producers and provides investors visibility by better defining the total costs associated with production.
AISC amounts are intended to provide additional information only and do not have any standardized meaning prescribed by GAAP and should not be considered in isolation or as a substitute for measures of performance prepared in accordance with GAAP. The measures are not necessarily indicative of operating profit or cash flow from operations as determined under GAAP. Other companies may calculate these measures differently as a result of differences in the underlying accounting principles, policies applied and in accounting frameworks such as in IFRS, or by reflecting the benefit from selling non-gold metals as a reduction to AISC. Differences may also arise related to definitional differences of sustaining versus development (i.e. non-sustaining) activities based upon each company’s internal policies.
The following disclosure provides information regarding the adjustments made in determining the AISC measure:
Costs applicable to sales. Includes all direct and indirect costs related to current production incurred to execute the current mine plan. We exclude certain exceptional or unusual amounts from costs applicable to sales, such as significant revisions to recovery amounts. Costs applicable to sales includes by-product credits from certain metals obtained during the process of extracting and processing the primary ore-body. Costs applicable to sales is accounted for on an accrual basis and excludes Depreciation and amortization and Reclamation and remediation, which is consistent with our presentation of Costs applicable to sales on the Consolidated Statements of Operations. In determining gold AISC, only the costs applicable to sales associated with producing and selling an ounce of gold is included in the measure. Therefore, the amount of costs applicable to sales included in gold AISC is derived from the Costs applicable to sales presented in the Company’s Consolidated Statements of Operations less the amount of costs applicable to sales attributable to the production of other metals. The other metals' costs applicable to sales at those mine sites is disclosed in Note 4 to the Consolidated Financial Statements. The allocation of costs applicable to sales between gold and other metals is based upon the relative sales value, determined using GEO pricing, of gold and other metals produced during the period.
Reclamation costs. Includes accretion expense related to reclamation liabilities and the amortization of the related ARC for the Company’s operating properties. Accretion related to the reclamation liabilities and the amortization of the ARC assets for reclamation does not reflect annual cash outflows but are calculated in accordance with GAAP. The accretion and amortization reflect the periodic costs of reclamation associated with current production and are therefore included in the measure. The allocation of these costs to gold and other metals is determined using the same allocation used in the allocation of costs applicable to sales between gold and other metals.
Advanced projects, research and development and exploration. Includes incurred expenses related to projects that are designed to sustain current production and exploration. We note that as current resources are depleted, exploration and advanced projects are necessary for us to replace the depleting reserves or enhance the recovery and processing of the current reserves to sustain production at existing operations. As these costs relate to sustaining our production, and are considered a continuing cost of a mining company, these costs are included in the AISC measure. These costs are derived from the Advanced projects, research and development and Exploration amounts presented in the Consolidated Statements of Operations less incurred expenses related to the development of new operations, or related to major projects at existing operations where these projects will materially benefit the operation in the future. The allocation of these costs to gold and other metals is determined using the same allocation used in the allocation of costs applicable to sales between gold and other metals. We also allocate these costs incurred at Corporate and Other using the proportion of costs applicable to sales between gold and other metals.
General and administrative. Includes costs related to administrative tasks not directly related to current production, but rather related to supporting our corporate structure and fulfilling our obligations to operate as a public company. Including these expenses in the AISC metric provides visibility of the impact that general and administrative activities have on current operations and profitability on a per ounce basis. We allocate these costs to gold and other metals at Corporate and Other using the proportion of costs applicable to sales between gold and other metals.
Other expense, net. Excludes certain exceptional or unusual expenses, such as restructuring, as these are not indicative to sustaining our current operations. Furthermore, this adjustment to Other expense, net is also consistent with the nature of the adjustments made to Net income (loss) attributable to Newmont stockholders as disclosed in the Company’s non-GAAP financial measure Adjusted net income (loss). The allocation of these costs to gold and other metals is determined using the same allocation used in the allocation of costs applicable to sales between gold and other metals.
Treatment and refining costs. Includes costs paid to smelters for treatment and refining of our concentrates to produce the salable metal. These costs are presented net as a reduction of Sales on the Consolidated Statements of Operations. The allocation of these costs to gold and other metals is determined using the same allocation used in the allocation of costs applicable to sales between gold and other metals.
Sustaining capital and lease related costs. We determined sustaining capital and lease related costs as those capital expenditures and lease payments that are necessary to maintain current production and execute the current mine plan. We determined development (i.e. non-sustaining) capital expenditures and lease payments to be those payments used to develop new operations or related to projects at existing operations where those projects will materially benefit the operation and are excluded from the
111

Table of Contents
calculation of AISC. The classification of sustaining and development capital projects and leases is based on a systematic review of our project portfolio in light of the nature of each project. Sustaining capital and lease related costs are relevant to the AISC metric as these are needed to maintain the Company’s current operations and provide improved transparency related to our ability to finance these expenditures from current operations. The allocation of these costs to gold and other metals is determined using the same allocation used in the allocation of costs applicable to sales between gold and other metals. We also allocate these costs incurred at Corporate and Other using the proportion of costs applicable to sales between gold and other metals.
Year Ended
December 31, 2025
Costs Applicable to Sales (1)(2)(3)
Reclamation Costs (4)
Advanced Projects, Research and Development and Exploration (5)
General and Administrative
Other Expense, Net (6)
Treatment and Refining Costs
Sustaining Capital and Lease Related Costs (7)(8)
All-In Sustaining CostsOunces (000) Sold
All-In Sustaining Costs per Ounce (9)
Gold
Managed
Lihir$755 $15 $10 $— $(3)$— $159 $936 582$1,607 
Cadia
324 2 3 — — 4 152 485 384$1,253 
Tanami429 5 6 — — — 221 661 385$1,716 
Boddington685 21 3 — — 3 122 834 550$1,514 
Ahafo South (10)
825 13 9 — 3 — 154 1,004 672$1,494 
Ahafo North (10)
31 — — — — — 9 40 58$696 
Merian 373 8 16 — — 1 60 458 238$1,921 
Cerro Negro312 9 1 — 3 — 110 435 196$2,220 
Yanacocha411 42 3 — 32 — 10 498 517$964 
Peñasquito389 13 — 1 — 22 48 473 422$1,120 
Red Chris
82 3 1 — 1 (1)20 106 61$1,750 
Brucejack
344 5 19 — — 2 104 474 235$2,020 
Non-managed
NGM1,343 17 10 10 16 6 237 1,639 1,006$1,629 
Corporate and Other (11)
— — 81 307 41 — 19 448 —$— 
Divested (12)
CC&V39 2 — — — — 5 46 27$1,684 
Musselwhite33 1 — — — — 14 48 32$1,531 
Porcupine79 3 1 — 1 — 25 109 60$1,810 
Éléonore54 1 2 — — — 12 69 49$1,403 
Akyem107 5 — — — — 8 120 45$2,664 
Total Gold6,615 165 165 318 94 37 1,489 8,883 5,519$1,609 
Gold equivalent ounces - other metals (13)(14)
Managed
Cadia
301 2 2 — — 3 141 449 370$1,230 
Boddington127 3 — — — — 23 153 109$1,397 
Peñasquito (15)
873 26 — 2 — 69 110 1,080 820$1,318 
Red Chris
169 6 2 — 2 (2)37 214 126$1,692 
Corporate and Other (11)
— — 16 62 2 — 2 82 —$— 
Total Gold Equivalent Ounces1,470 37 20 64 4 70 313 1,978 1,425$1,392 
Consolidated$8,085 $202 $185 $382 $98 $107 $1,802 $10,861 
____________________________
(1)Excludes Depreciation and amortization and Reclamation and remediation.
(2)Includes by-product credits of $328.
(3)Includes stockpile, leach pad, and product inventory adjustments of $3 at Cerro Negro and $24 at NGM.
(4)Includes operating accretion of $120, included in Reclamation and remediation, and amortization of asset retirement costs $82; excludes accretion and reclamation and remediation adjustments at former operating properties that have entered the closure phase and have no substantive future economic value of $194 and $(65), respectively, included in Reclamation and remediation.
(5)Excludes development expenditures of $8 at Cadia, $4 at Tanami, $2 at Boddington, $39 at Ahafo South, $7 at Ahafo North $23 at Merian, $24 at Cerro Negro, $9 at Yanacocha, $17 at Peñasquito, $8 at Red Chris, $11 at NGM, and $72 at Corporate and Other, totaling $224 related to developing new operations or major projects at existing operations where these projects will materially benefit the operation.
(6)Excludes restructuring and severance costs of $186, and settlement costs of $2 included in Other expense, net.
112

Table of Contents
(7)Excludes capitalized interest related to sustaining capital expenditures. Refer to Liquidity and Capital Resources within Part II, Item 7, MD&A for sustaining capital by segment.
(8)Includes finance lease payments and other costs for sustaining projects of $82 and excludes finance lease payments for development projects of $43.
(9)Per ounce measures may not recalculate due to rounding.
(10)In the fourth quarter of 2025, the Ahafo North development project achieved commercial production resulting in designation as a reportable segment. Prior to declaration of commercial production, Ahafo North was classified as a development project and all activity was included in the Ahafo South reportable segment. Although not a reportable segment until the fourth quarter of 2025, the amounts related to Ahafo North have been reported separately for comparability purposes.
(11)Corporate and Other is a non-operating segment and includes the Company's business activities relating to its corporate and regional offices and all equity method investments. Refer to Note 4 to the Consolidated Financial Statements for further information.
(12)Refer to Note 3 to the Consolidated Financial Statements for information on the Company's divestitures.
(13)Gold equivalent ounces is calculated as pounds or ounces produced multiplied by the ratio of the other metals price to the gold price, using Gold ($1,700/oz.), Copper ($3.50/lb.), Silver ($20.00/oz.), Lead ($0.90/lb.) and Zinc ($1.20/lb.) pricing for 2025.
(14)For the year ended December 31, 2025, Cadia sold 82 thousand tonnes of copper, Boddington sold 24 thousand tonnes of copper, Peñasquito sold 28 million ounces of silver, 95 thousand tonnes of lead and 246 thousand tonnes of zinc, and Red Chris sold 28 thousand tonnes of copper.
(15)All-in sustaining costs at Peñasquito is comprised of $413, $138, and $529 for silver, lead, and zinc, respectively.
113

Table of Contents
Year Ended
December 31, 2024
Costs Applicable to Sales (1)(2)(3)
Reclamation Costs (4)
Advanced Projects, Research and Development and Exploration (5)
General and Administrative
Other Expense, Net (6)
Treatment and Refining Costs
Sustaining Capital and Lease Related Costs (7)(8)
All-In Sustaining CostsOunces (000) Sold
All-In Sustaining Costs per Ounce (9)
Gold
Managed
Lihir$787 $12 $16 $— $2 $— $121 $938 620$1,512 
Cadia
297 2 9 — — 16 152 476 454$1,048 
Tanami390 3 7 — — — 127 527 411$1,281 
Boddington613 16 1 — — 13 105 748 581$1,288 
Ahafo South
722 19 5 — 1 1 108 856 798$1,072 
Merian 401 8 15 — — 1 83 508 274$1,852 
Cerro Negro312 6 2 1 2 — 61 384 236$1,631 
Yanacocha353 34 9 — 3 — 22 421 352$1,196 
Peñasquito
225 8 — — — 16 36 285 290$984 
Red Chris
47 2 1 — — — 12 62 39$1,607 
Brucejack
312 5 13 — — 3 66 399 249$1,603 
Non-managed
NGM1,263 18 13 9 4 6 350 1,663 1,036$1,605 
Corporate and Other (10)
— — 111 386 19 — 18 534 —$— 
Held for sale (11)
CC&V200 11 3 — 2 — 27 243 144$1,691 
Musselwhite224 4 6 — 1 — 96 331 215$1,541 
Porcupine310 12 5 — — — 79 406 282$1,437 
Éléonore325 5 11 — — — 99 440 243$1,811 
Akyem338 21 1 — 1 — 23 384 212$1,816 
Divested (11)
Telfer245 11 10 — — 4 38 308 103$2,993 
Total Gold7,364 197 238 396 35 60 1,623 9,913 6,539$1,516 
Gold equivalent ounces - other metals (12)(13)
Managed
Cadia
280 2 10 — — 32 136 460 465$987 
Boddington204 3 — — — 11 22 240 205$1,172 
Peñasquito (14)
903 32 1 2 2 117 129 1,186 1,088$1,090 
Red Chris
172 5 4 — — 5 47 233 142$1,640 
Corporate and Other (10)
— — 14 44 — — 1 59 —$— 
Divested (11)
Telfer40 2 1 — — 2 4 49 16$2,885 
Total Gold Equivalent Ounces1,599 44 30 46 2 167 339 2,227 1,916$1,161 
Consolidated$8,963 $241 $268 $442 $37 $227 $1,962 $12,140 
____________________________
(1)Excludes Depreciation and amortization and Reclamation and remediation.
(2)Includes by-product credits of $240.
(3)Includes stockpile and leach pad inventory adjustments of $9 at Cerro Negro, $1 at Peñasquito, $27 at Red Chris, $2 at Brucejack, $21 at NGM, and $32 at Telfer.
(4)Includes operating accretion of $153, included in Reclamation and remediation, and amortization of asset retirement costs $88; excludes accretion and reclamation and remediation adjustments at former operating properties that have entered the closure phase and have no substantive future economic value of $219 and $(44), respectively, included in Reclamation and remediation.
(5)Excludes development expenditures of $21 at Tanami, $3 at Boddington, $27 at Ahafo South, $9 at Ahafo North, $6 at Merian, $17 at Cerro Negro, $12 at Peñasquito, $8 at Red Chris, $10 at NGM, $70 at Corporate and Other, $4 at CC&V, $1 at Porcupine, $4 at Akyem, and $3 at Telfer, totaling $195 related to developing new operations or major projects at existing operations where these projects will materially benefit the operation.
(6)Excludes Newcrest transaction and integration costs of $72, settlement of costs of $44, and restructuring and severance costs of $38, included in Other expense, net.
(7)Excludes capitalized interest related to sustaining capital expenditures. Refer to Liquidity and Capital Resources within Part II, Item 7, MD&A for sustaining capital by segment.
(8)Includes finance lease payments for sustaining projects of $84 and excludes finance lease payments for development projects of $37.
114

Table of Contents
(9)Per ounce measures may not recalculate due to rounding.
(10)Corporate and Other is a non-operating segment and includes the Company's business activities relating to its corporate and regional offices and all equity method investments. Refer to Note 4 to the Consolidated Financial Statements for further information.
(11)Refer to Note 3 to the Consolidated Financial Statements for information on the Company's divestitures.
(12)Gold equivalent ounces is calculated as pounds or ounces produced multiplied by the ratio of the other metals price to the gold price, using Gold ($1,400/oz.), Copper ($3.50/lb.), Silver ($20.00/oz.), Lead ($1.00/lb.) and Zinc ($1.20/lb.) pricing for 2024.
(13)For the year ended December 31, 2024, Cadia sold 84 thousand tonnes of copper, Boddington sold 37 thousand tonnes of copper, Peñasquito sold 33 million ounces of silver, 97 thousand tonnes of lead and 247 thousand tonnes of zinc, Red Chris sold 26 thousand tonnes of copper, and Telfer sold 3 thousand tonnes of copper.
(14)All-in sustaining costs at Peñasquito is comprised of $464, $141, and $581 for silver, lead, and zinc, respectively.
Year Ended
December 31, 2023
Costs Applicable to Sales (1)(2)(3)
Reclamation Costs (4)
Advanced Projects, Research and Development and Exploration (5)
General and Administrative
Other Expense, Net (6)
Treatment and Refining Costs
Sustaining Capital and Lease Related Costs (7)(8)
All-In Sustaining CostsOunces (000) Sold
All-In Sustaining Costs per Ounce (9)
Gold
Managed
Lihir (10)
$146 $— $2 $— $— $— $51 $199 131 $1,517 
Cadia (10)
129 — 1 — — 6 16 152 120 $1,271 
Tanami337 3 1 — — — 130 471 444 $1,060 
Boddington634 17 5 — — 18 125 799 749 $1,067 
Telfer (10)
126 — 2 — — 3 2 133 67 $1,988 
Ahafo South
547 20 2 — 2 — 135 706 578 $1,222 
Akyem275 44 1 — — — 37 357 296 $1,210 
Merian385 7 14 — — 1 85 492 319 $1,541 
Cerro Negro328 5 5 — 5 — 51 394 261 $1,509 
Porcupine301 23 12 — — — 71 407 258 $1,577 
Éléonore295 9 10 — — — 114 428 233 $1,838 
Yanacocha294 24 7 — — — 24 349 275 $1,266 
Musselwhite214 5 10 — — — 104 333 181 $1,843 
Peñasquito
158 7 1 — 2 9 29 206 130 $1,590 
CC&V198 10 10 — 2 — 62 282 171 $1,644 
Red Chris (10)
4 — — — — — 2 6 4 $1,439 
Brucejack (10)
69 — 7 — 1 3 16 96 36 $2,646 
Non-managed
NGM1,249 17 13 11 2 6 332 1,630 1,167 $1,397 
Corporate and Other (11)
— — 89 255 6 — 37 387 — $— 
Total Gold5,689 191 192 266 20 46 1,423 7,827 5,420 $1,444 
Gold equivalent ounces - other metals (12)(13)
Managed
Cadia (10)
116 — 1 — — 19 17 153 114 $1,342 
Boddington204 3 1 — — 15 39 262 246 $1,067 
Telfer (10)
22 — 2 — — 4 5 33 13 $2,580 
Peñasquito (14)
651 30 5 1 1 82 120 890 507 $1,756 
Red Chris (10)
17 — — — — 3 7 27 16 $1,660 
Corporate and Other (11)
— — 11 32 — — 6 49 — $— 
Total Gold Equivalent Ounces
1,010 33 20 33 1 123 194 1,414 896 $1,579 
Consolidated$6,699 $224 $212 $299 $21 $169 $1,617 $9,241 
____________________________
(1)Excludes Depreciation and amortization and Reclamation and remediation.
(2)Includes by-product credits of $137.
(3)Includes stockpile and leach pad inventory adjustments of $4 at Telfer, $1 at Akyem, $2 at Cerro Negro, $3 at Porcupine, $5 at Éléonore, $5 at Yanacocha, $32 at Peñasquito, $2 at Brucejack, and $43 at NGM.
(4)Includes operating accretion of $97, included in Reclamation and remediation, and amortization of asset retirement costs $127; excludes accretion and reclamation and remediation adjustments at former operating properties that have entered the closure phase and have no substantive future economic value of $148 and $1,288, respectively, included in Reclamation and remediation.
115

Table of Contents
(5)Excludes development expenditures of $29 at Tanami, $29 at Ahafo South, $9 at Ahafo North, $18 at Akyem, $9 at Merian, $5 at Cerro Negro, $5 at Porcupine, $4 at Yanacocha, $5 at Peñasquito, $3 at CC&V, $16 at NGM and $121 at Corporate and Other, totaling $253 related to developing new operations or major projects at existing operations where these projects will materially benefit the operation.
(6)Excludes Newcrest transaction and integration costs of $464, restructuring and severance costs of $24, settlement costs of $7, and distributions from the Newmont Global Community Support fund of $1, included in Other expense, net.
(7)Excludes capitalized interest related to sustaining capital expenditures. Refer to Liquidity and Capital Resources within Part II, Item 7, MD&A for sustaining capital by segment.
(8)Includes finance lease payments for sustaining projects of $64 and excludes finance lease payments for development projects of $36.
(9)Per ounce measures may not recalculate due to rounding.
(10)Sites acquired through Newcrest transaction. Refer to Note 3 to the Consolidated Financial Statements for further information.
(11)Corporate and Other is a non-operating segment and includes the Company's business activities relating to its corporate and regional offices and all equity method investments. Refer to Note 4 to the Consolidated Financial Statements for further information.
(12)Gold equivalent ounces is calculated as pounds or ounces produced multiplied by the ratio of the other metals price to the gold price, using Gold ($1,400/oz.), Copper ($3.50/lb.), Silver ($20.00/oz.), Lead ($1.00/lb.) and Zinc ($1.20/lb.) pricing for 2023.
(13)For the year ended December 31, 2023, Cadia sold 21 thousand tonnes of copper, Boddington sold 45 thousand tonnes of copper, Peñasquito sold 17 million ounces of silver, 49 thousand tonnes of lead and 101 thousand tonnes of zinc, Red Chris sold 3 thousand tonnes of copper, and Telfer sold 2 thousand tonnes of copper.
(14)All-in sustaining costs at Peñasquito is comprised of $400, $125, and $365 for silver, lead, and zinc, respectively.
Accounting Developments
For a discussion of Recently Adopted and Recently Issued Accounting Pronouncements, refer to Note 2 to the Consolidated Financial Statements.
Critical Accounting Estimates
Our discussion of financial condition and results of operations is based upon the information reported in our Consolidated Financial Statements. The preparation of these Consolidated Financial Statements in conformity with GAAP requires us to make assumptions and estimates that affect the reported amounts of assets, liabilities, revenues, and expenses, as well as the disclosure of contingent assets and liabilities as of the date of our financial statements. We have identified the accounting estimates listed below as critical to understanding and evaluating the financial results reported in our Consolidated Financial Statements. These accounting estimates require the application of significant management judgment and are critical due to the significant level of estimation uncertainty regarding the assumptions involved and the magnitude of the asset, liability, revenue or expense being reported. We base our assumptions and estimates on historical experience and various other sources that we believe to be reasonable under the circumstances. We review the underlying factors used in our estimates regularly, including reviewing the significant accounting policies impacting the estimates, to ensure compliance with GAAP. However, due to the uncertainty inherent in our estimates, actual results may materially differ from the estimates we calculate due to changes in circumstances, global economics and politics, and general business conditions. A summary of our significant accounting policies is detailed in Note 2 to the Consolidated Financial Statements. 
Business Combinations
We recognize and measure the assets acquired and liabilities assumed in a business combination based on their estimated fair values at the acquisition date, while transaction and integration costs related to business combinations are expensed as incurred. Any excess of the purchase consideration when compared to the fair value of the net tangible and intangible assets acquired, if any, is recorded as goodwill. For material acquisitions, we engage independent appraisers to assist with the determination of the fair value of assets acquired, liabilities assumed, noncontrolling interest, if any, and goodwill, based on recognized business valuation methodologies. An income, market or cost valuation method may be utilized to estimate the fair value of the assets acquired, liabilities assumed, and noncontrolling interest, if any, in a business combination. The income valuation method represents the present value of future cash flows over the life of the asset using: (i) discrete financial forecasts, which rely on management’s estimates of reserves, resources and exploration potential quantities, costs to produce and develop reserves, revenues, and operating expenses; (ii) short-term and long-term metal price assumptions, (iii) long-term growth rates; (iv) appropriate discount rates; and (v) expected future capital requirements (“income valuation method”). The market valuation method uses prices paid for a similar asset by other purchasers in the market, normalized for any differences between the assets (“market valuation method”). The cost valuation method is based on the replacement cost of a comparable asset at the time of the acquisition adjusted for depreciation and economic and functional obsolescence of the asset (“cost valuation method”). If the initial accounting for the business combination is incomplete by the end of the reporting period in which the acquisition occurs, an estimate is recorded. Subsequent to the acquisition date, and not later than one year from the acquisition date, we record any material adjustments to the initial estimate based on new information obtained that would have existed as of the date of the acquisition. Any adjustment that arises from information obtained that did not exist as of the date of the acquisition is recorded in the period the adjustments arises.
Carrying Value of Long-lived Assets
We review and evaluate our long-lived assets for impairment when events or changes in circumstances indicate that the related carrying amounts may not be recoverable. Significant negative industry or economic trends, adverse social or political developments, declines in our market capitalization, geotechnical difficulties, reduced estimates of future cash flows from our reporting
116

Table of Contents
segments or other disruptions to our business are a few examples of events that we monitor, as they could indicate that the carrying value of the Company’s long-lived assets, including development projects, may not be recoverable. In such cases, a recoverability test may be necessary to determine if an impairment charge is required.
For development projects, including our Conga project which is discussed further below, we review and evaluate changes to project plans and timing to determine continued technical, economic and social viability of the projects. If the Company determines to sell or abandon a project due to uncertainty from changes in circumstances related to technical, economic, social, political or community factors, or other evolving circumstances indicate that the carrying value may not be recoverable, then a recoverability test is performed to determine if an impairment charge should be recorded.
An impairment loss is measured and recorded based on the estimated fair value of the long-lived assets being tested for impairment and their carrying amounts. Fair value is typically determined through the use of an income approach utilizing estimates of discounted pre-tax future cash flows or a market approach utilizing recent transaction activity for comparable properties. These approaches are primarily considered Level 3 fair value measurements. Occasionally, such as when an asset is held for sale, market prices are used. We believe our estimates and models used to determine fair value are similar to what a market participant would use.
The estimated undiscounted cash flows used to assess recoverability of long-lived assets and to measure the fair value of our mining operations are derived from current business plans, which are developed using short-term price forecasts reflective of the current price environment and our projections for long-term metal prices. In addition to short- and long-term metal price assumptions, other assumptions include estimates of commodity-based and other input costs; proven and probable mineral reserves estimates, including the timing and cost to develop and produce the reserves; value beyond proven and probable mineral reserve estimates; estimated future closure costs; the use of appropriate discount rates; and applicable U.S. dollar long-term exchange rates. Refer to Item 7A, Quantitative and Qualitative Disclosures About Market Risk.
The significant assumption in determining the future cash flows for each mine site at December 31, 2025 is a long-term gold price of $2,500 per ounce. A decrease of $100 per ounce in the long-term gold price assumption would result in no impairment of our long-lived assets, including goodwill.
Various factors could impact our ability to achieve our forecasted production schedules from proven and probable reserves which could impact the carrying value of our long-lived assets. The ability to achieve the estimated quantities of recoverable minerals from exploration stage mineral interests involves further risks in addition to those factors applicable to mineral interests where proven and probable reserves have been identified, due to the lower level of confidence that the identified measured, indicated and inferred resources could ultimately be mined economically. Assets classified as exploration potential have the highest level of risk that the carrying value of the asset can be ultimately realized, due to the still lower level of geological confidence and economic modeling.
Events that could result in additional impairment of our long-lived assets include, but are not limited to, decreases in future metal prices, unfavorable changes in foreign exchange rates, increases in future closure costs, and any event that might otherwise have a material adverse effect on mine site cash flows.
Goodwill
Goodwill represents the excess of the purchase price over the estimated fair value of the net assets acquired in a business acquisition. Goodwill is allocated to reporting units and tested for impairment annually and when events or changes in circumstances indicate that the carrying value of a reporting unit exceeds its fair value. Each operating mine is considered a distinct reporting unit for purposes of goodwill impairment testing.
The Company may elect to perform a qualitative assessment when it is more likely than not that the fair value of a reporting unit is higher than its carrying value. At the Company's election or if it is determined to be more likely than not that the fair value is less than the carrying value, a quantitative goodwill impairment test is performed to determine the fair value of the reporting unit. The fair value of a reporting unit is determined using either the income approach utilizing estimates of discounted future cash flows or the market valuation approach utilizing recent transaction activity for comparable properties. These approaches are considered Level 3 fair value measurements. If the carrying amount of the reporting unit exceeds its fair value, an impairment loss is recognized in an amount equal to that excess, limited to the total amount of goodwill allocated to that reporting unit. Any impairment loss recognized in the current period is not reversed in future periods. The Company recognizes its pro rata share of goodwill and any subsequent goodwill impairment losses recorded by entities that are proportionately consolidated.
When the income approach is utilized to determine fair value, the estimated cash flows used to assess the fair value of a reporting unit are derived from the Company’s current business plans, which are developed using short-term price forecasts reflective of the current price environment and management’s projections for long-term metal prices. The significant assumption in determining the future cash flows for each mine site at December 31, 2025 is a long-term gold price of $2,500 per ounce. In addition to short- and long-term metal price assumptions, other assumptions include estimates of commodity-based and other input costs; proven and probable mineral reserves estimates, including the timing and cost to develop and produce the reserves; value beyond proven and probable reserve estimates; estimated future closure costs; the use of appropriate discount rates; and applicable U.S. dollar long-term exchange rates. Refer to Item 7A, Quantitative and Qualitative Disclosures About Market Risk.
117

Table of Contents
Fair value determinations require considerable judgment and are sensitive to changes in underlying assumptions and factors. For testing purposes of our reporting units, management's best estimates of the expected future results are the primary driver in determining the fair value. However, there can be no assurance that the estimates and assumptions made for purposes of the goodwill impairment tests will prove to be an accurate prediction of the future. Examples of events or circumstances that could reasonably be expected to negatively affect the underlying key assumptions and ultimately impact the estimated fair value of our reporting units include, but are not limited to, such items as: (i) a decrease in forecasted production levels if we are unable to realize the mineable reserves, resources and exploration potential at our mining properties and extend the life of mine (ii) increased production or capital costs (iii) adverse changes in macroeconomic conditions including the market price of metals and changes in the equity and debt markets or country specific factors which could result in higher discount rates, (iv) significant unfavorable changes in tax rates including increased corporate income or mining tax rates, and (v) negative changes in regulation, legislation, and political environments which could impact our ability to operate in the future. Refer to Notes 7 and 19 to the Consolidated Financial Statements for further information regarding goodwill.
Carrying Value of Idled Development Projects in Peru
We review and evaluate the Company’s idled development projects in Peru, including Conga and Yanacocha Sulfides, for recoverability whenever events or changes in circumstances indicate that the carrying amount may not be recoverable. The Company also periodically updates the economic model for idled development projects to understand changes to the estimated capital costs, cash flows, and economic returns from the project.
We have considered a variety of technical, economic, social and political developments related to the Conga project during our evaluation of impairment indicators since November 2011, when construction and development activities at the project were largely suspended. Project activities in recent years have focused on continued engagement with the local communities and maintaining and protecting existing project infrastructure and equipment through our active care and maintenance program. Although we have reclassified Conga reserves to resources and reallocated exploration and development capital to other projects, we continue to evaluate long-term options to progress development of the Conga project and improve social and political acceptance. As of December 31, 2025, we have not identified events or changes in circumstances that indicate that the carrying value of the Conga project is not recoverable.
We have considered similar developments related to the Yanacocha Sulfides project since the full funds decision for this project was initially deferred for two years in 2022 and deferred again the following year in 2023. During the fourth quarter of 2025, the Company removed the project from its updated life of mine business plan and downgraded the Yanacocha Sulfide reserves to resources and as a result of a change in strategic direction for the Company’s operations in Peru. The Company no longer considers the project, as previously contemplated, to be temporarily idled and determined that an impairment indicator existed for the project. Refer to Note 7 to the Consolidated Financial Statements for further information on this impairment charge.
Reclamation and Remediation Obligations
The Company records the estimated asset retirement obligations associated with operating and non-operating mine sites when an obligation is incurred and the estimated costs can be reasonably measured. Fair value is measured as the present value of expected cash flow estimates, after considering inflation, our credit-adjusted risk-free rates and a market risk premium appropriate for our operations. Reclamation costs are allocated to expense over the life of the related assets and are periodically adjusted to reflect changes in the estimated present value resulting from the passage of time and revisions to the estimates of either the timing or amount of the reclamation costs. Reclamation obligations are based on our best estimate of when the expected spending for an existing environmental disturbance will occur. Our cost estimates are reflected on a third-party cost basis and comply with our legal obligation to retire long-lived assets in the period incurred. Changes in reclamation estimates at non-operating mines where the mine or portion of the mine site has entered the closure phase and has no substantive future economic value are reflected in earnings in the period an estimate is revised. Costs included in estimated asset retirement obligations are discounted to their present value and are estimated over a period of up to fifty years. We review, on at least an annual basis, the reclamation obligation at each mine.
Remediation costs are accrued when it is probable that an obligation has been incurred and the cost can be reasonably estimated. Such cost estimates may include ongoing care, maintenance and monitoring costs. Changes in remediation estimates at non-operating mines are reflected in earnings in the period an estimate is revised. Water treatment costs included in environmental remediation obligations are discounted to their present value and are estimated over a period of up to fifty years.
Accounting for reclamation and remediation obligations requires management to make estimates unique to each mining operation of the future costs the Company expects to incur to complete the reclamation and remediation work required to comply with existing laws and regulations. These estimates require considerable judgment and are sensitive to changes in underlying inputs and assumptions. Such changes, including, but not limited to, (i) changes to environmental laws and regulations, which could increase the scope and extent of work required, (ii) changes in the timing of reclamation and remediation activities, which could occur over an extended future period and (iii) changes in the methods and technology utilized to settle reclamation and remediation obligations, could have a material impact on our business, financial condition, results of operations and cash flows.
Refer to Note 6 to the Consolidated Financial Statements for further information regarding reclamation and remediation obligations.
118

Table of Contents
Income and Mining Taxes
We account for income taxes using the liability method, recognizing certain temporary differences between the financial reporting basis of our liabilities and assets and the related income tax basis for such liabilities and assets. This method generates either a net deferred income tax liability or asset for us, as measured by the statutory tax rates in effect. We derive our deferred income tax charge or benefit by recording the change in either the net deferred income tax liability or asset balance for the year. The financial statement effects of changes in tax law are recorded as discrete items in the period enacted as part of income tax expense or benefit from continuing operations, regardless of the category of income or loss to which the deferred taxes relate. We have exposure to the impact of foreign exchange fluctuations on tax positions in certain jurisdictions, such movements are recorded within Income and mining tax benefit (expense) related to deferred income tax assets and liabilities, as well as non-current uncertain tax positions, while foreign exchange fluctuations impacting current tax positions are recorded within Other income (loss), net as foreign currency exchange gains (losses). With respect to the earnings that we derive from the operations of our consolidated subsidiaries, in those situations where the earnings are indefinitely reinvested, no deferred taxes have been provided on the unremitted earnings (including the excess of the carrying value of the net equity of such entities for financial reporting purposes over the tax basis of such equity) of these consolidated companies. In the fourth quarter of 2025, the permanent reinvestment assertion was removed for operations at PNG and Ghana and deferred tax liabilities were recorded for the estimated withholding tax impact on future repatriated earnings.
Mining taxes represent state and provincial taxes levied on mining operations and are classified as income taxes as such taxes are based on a percentage of mining profits.
Our operations are in multiple jurisdictions where uncertainties arise in the application of complex tax regulations. Some of these tax regimes are defined by contractual agreements with the local government, while others are defined by general tax laws and regulations. We are subject to reviews of our income tax filings and other tax payments, and disputes can arise with the taxing authorities over the interpretation of its contracts or laws. We recognize potential liabilities and record tax liabilities for anticipated tax audit issues in the U.S. and other tax jurisdictions based on our estimate of whether it is more likely than not, and the extent to which, additional taxes will be due. We adjust these reserves in light of changing facts and circumstances; however, due to the complexity of some of these uncertainties, the ultimate resolution may result in a payment that is materially different from our current estimate of the tax liabilities. If our estimate of tax liabilities proves to be less than the ultimate assessment, an additional charge to expense would result. If the estimate of tax liabilities proves to be greater than the ultimate assessment, a tax benefit would result. We recognize interest and penalties, if any, related to unrecognized tax benefits in Income and mining tax benefit (expense). In certain jurisdictions, we must pay a portion of the disputed amount to the local government in order to formally appeal the assessment. Such payment is recorded as a receivable if we believe the amount is ultimately collectible.
Valuation of Deferred Tax Assets
Our deferred income tax assets include certain future tax benefits. We record a valuation allowance against any portion of those deferred income tax assets when we believe, based on the weight of available evidence, it is more likely than not that some portion or all of the deferred income tax asset will not be realized. We review the likelihood that we will realize the benefit of our deferred tax assets and therefore the need for valuation allowances on a quarterly basis, or more frequently if events indicate that a review is required. In determining the requirement for a valuation allowance, the historical and projected financial results of the legal entity or consolidated group recording the net deferred tax asset is considered, along with all other available positive and negative evidence.
Certain categories of evidence carry more weight in the analysis than others based upon the extent to which the evidence may be objectively verified. We look to the nature and severity of cumulative pretax losses (if any) in the current three-year period ending on the evaluation date or the expectation of future pretax losses and the existence and frequency of prior cumulative pretax losses.
We utilize a rolling twelve quarters of pre-tax income or loss as a measure of our cumulative results in recent years. Concluding that a valuation allowance is not required is difficult when there is significant negative evidence which is objective and verifiable, such as cumulative losses in recent years. However, a cumulative three year loss is not solely determinative of the need for a valuation allowance. We also consider all other available positive and negative evidence in our analysis.
Other factors considered in the determination of the probability of the realization of the deferred tax assets include, but are not limited to:
•Earnings history;
•Projected future financial and taxable income based upon existing reserves and long-term estimates of commodity prices;
•The duration of statutory carry forward periods;
•Prudent and feasible tax planning strategies readily available that may alter the timing of reversal of the temporary difference;
•Nature of temporary differences and predictability of reversal patterns of existing temporary differences; and
•The sensitivity of future forecasted results to commodity prices and other factors.
119

Table of Contents
The Company assesses available positive and negative evidence to estimate if sufficient future taxable income will be generated to utilize the existing deferred tax assets. A significant piece of objective negative evidence is recent pretax losses and/or expectations of future pretax losses. Such objective evidence limits the ability to consider other subjective evidence including projections for future growth. On the basis of this evaluation, a valuation allowance has been recorded in Peru and Argentina. The amount of the deferred tax asset considered realizable, however, could be adjusted if estimates of future taxable income during the carryforward period are increased or if objective negative evidence in the form of cumulative losses is no longer present and additional weight may be given to subjective evidence such as our projections for growth. Refer to Note 10 to the Consolidated Financial Statements for additional detail on the valuation allowance.
For additional risk factors that could impact the Company’s ability to realize the deferred tax assets, refer to Note 2 to the Consolidated Financial Statements.
ITEM 7A.       QUANTITATIVE AND QUALITATIVE DISCLOSURES ABOUT MARKET RISK (dollars in millions, except per ounce and per pound amounts)
Metal Prices
Changes in the market price of gold significantly affect our profitability and cash flow. Gold prices can fluctuate widely due to numerous factors, such as demand; forward selling by producers; central bank sales, purchases and lending; investor sentiment; the strength of the USD; inflation, deflation, or other general price instability; and global mine production levels. Changes in the market price of copper, silver, lead, and zinc also affect our profitability and cash flow. These metals are traded on established international exchanges and prices generally reflect market supply and demand, but can also be influenced by speculative trading in the commodity or by currency exchange rates. The Company does not currently hold instruments that are designated to hedge against the potential impacts due to market price changes in metals. Consideration of these impacts are discussed below.
Decreases in the market price of metals can significantly affect the value of our product inventory, stockpiles and leach pads, and it may be necessary to record a write-down to the net realizable value, as well as significantly impact the carrying value of our long-lived assets and goodwill. For information concerning the sensitivity of our impairment analysis over long-lived assets and goodwill to changes in metal price, refer to Critical Accounting Estimates within Item 7, MD&A, and Note 2 to the Consolidated Financial Statements.
Net realizable value represents the estimated future sales price based on short-term and long-term metals prices, less estimated costs to complete production and bring the product to sale. The primary factors that influence the need to record write-downs of our stockpiles, leach pads and product inventory include short-term and long-term metals prices and costs for production inputs such as labor, fuel and energy, materials and supplies as well as realized ore grades and recovery rates. The significant assumptions in determining the stockpile, leach pad and product inventory adjustments for each mine site reporting unit at December 31, 2025 included production cost and capitalized expenditure assumptions unique to each operation, and the following short-term and long-term assumptions:
Short-termLong-term
Gold price (per ounce)$4,135 $2,500 
Copper price (per pound)$5.03 $4.00 
Silver price (per ounce)$54.73 $25.00 
Lead price (per pound)$0.89 $0.90 
Zinc price (per pound)$1.44 $1.25 
AUD to USD exchange rate$0.66 $0.70 
CAD to USD exchange rate$0.72 $0.75 
MXN to USD exchange rate$0.05 $0.05 
The net realizable value measurement involves the use of estimates and assumptions unique to each mining operation regarding current and future operating and capital costs, metal recoveries, production levels, commodity prices, proven and probable reserve quantities, engineering data and other factors. A high degree of judgment is involved in determining such assumptions and estimates and no assurance can be given that actual results will not differ significantly from those estimates and assumptions.
Interest Rate Risk
We are subject to interest rate risk related to the fair value of our senior notes which is wholly comprised of fixed rates at December 31, 2025. For fixed rate debt, changes in interest rates generally affect the fair value of the debt instrument, but not our earnings or cash flows. The terms of our fixed rate debt obligations do not generally allow investors to demand payment of these obligations prior to maturity. Therefore, we do not have significant exposure to interest rate risk for our fixed rate debt; however, we do have exposure to potentially material fair value risk if we repurchase or exchange long-term debt prior to maturity. Refer to Note 13 to our Consolidated Financial Statements for further information pertaining to the fair value of our fixed rate debt.
120

Table of Contents
Foreign Currency
We have significant operations and/or assets in the United States, Papua New Guinea, Australia, Ghana, Suriname, Argentina, Dominican Republic, Chile, Peru, Ecuador, Mexico, and Canada. All of our operations sell their gold, copper, silver, lead, and zinc production based on USD metal prices. Foreign currency exchange rates can fluctuate widely due to numerous factors, such as supply and demand for foreign and U.S. currencies and U.S. and foreign country economic conditions. Fluctuations in the local currency exchange rates in relation to the U.S. dollar can increase or decrease profit margins, cash flow and Costs applicable to sales to the extent costs are paid in local currency at foreign operations.
We performed a sensitivity analysis to estimate the impact to Costs applicable to sales arising from a hypothetical 10% adverse movement to local currency exchange rates at December 31, 2025 in relation to the U.S. dollar at our foreign mining operations, with no mitigation assumed from our foreign currency cash flow hedges. The sensitivity analysis indicated that a hypothetical 10% adverse movement would result in an approximate increase of $498 to Costs applicable to sales at December 31, 2025.
Commodity Price Exposure
Our provisional concentrate sales contain an embedded derivative that is required to be separated from the host contract for accounting purposes. The host contract is the receivable from the sale of the respective metal concentrates at the prevailing indices’ prices at the time of sale. The embedded derivative, which is not designated for hedge accounting, is marked to market through earnings each period prior to final settlement.
We perform an analysis on the provisional concentrate sales to determine the potential impact to Net income (loss) attributable to Newmont stockholders for each 10% change to the average price on the provisional concentrate sales subject to final pricing over the next several months. Refer below for our analysis as of December 31, 2025.
Provisionally Priced Sales Subject to Final Pricing (1)
Average Provisional
Price (per ounce/pound)
Effect of 10% change in Average Price (millions)
Market Closing
Settlement Price (2)
(per ounce/pound)
Gold (ounces, in thousands) 141 $4,332 $42 $4,368 
Copper (pounds, in millions)66 $5.65 $26 $5.67 
Silver (ounces, in millions)7 $70.31 $33 $71.99 
Lead (pounds, in millions)48 $0.90 $3 $0.89 
Zinc (pounds, in millions)84 $1.41 $8 $1.39 
____________________________
(1)Includes provisionally priced by-product sales subject to final pricing, which are recognized as a reduction to Costs applicable to sales.
(2)The closing settlement price as of December 31, 2025 is determined utilizing the London Metal Exchange for copper, lead and zinc and the London Bullion Market Association for gold and silver.
Hedging
The Company's hedging instruments consisted of the Cadia Power Purchase Agreement ("Cadia PPA") and foreign currency cash flow hedges at December 31, 2025, which were transacted for risk management purposes. The Cadia PPA mitigates the variability in future cash flows related to a portion of power purchases at the Cadia mine and the foreign currency cash flow hedges were entered into to mitigate variability in the USD functional cash flows related to the AUD- and CAD-denominated operating expenditures and AUD-denominated capital expenditures. By using hedges, we are affected by market risk, credit risk, and market liquidity risk.
Market Risk
Market risk is the risk that the fair value of a derivative might be adversely affected by a change in commodity prices or currency exchange rates, and that this in turn affects our financial condition. We manage market risk by establishing and monitoring parameters that limit the types and degree of market risk that may be undertaken. We mitigate this potential risk to our financial condition by establishing trading agreements with counterparties under which we are not required to post any collateral or be subject to any margin calls on our derivatives. Our counterparties cannot require settlement solely because of an adverse change in the fair value of a derivative.
We have performed sensitivity analyses as of December 31, 2025 regarding the Cadia PPA and foreign currency cash flow hedges. For the Cadia PPA, we utilized a modeling technique that measures the change in the fair values arising from a hypothetical 10% adverse movement in the forward electricity rates relative to current rates, with all other variables held constant. For the foreign currency cash flow hedges, we utilized a modeling technique that measures the change in the fair values arising from a hypothetical 10% adverse movement in the AUD and CAD foreign currency exchange rates relative to the U.S. dollar, with all other variables held constant. The foreign currency exchange rates we used in performing the sensitivity analysis were based on AUD and CAD market rates in effect at December 31, 2025.
121

Table of Contents
The sensitivity analyses indicated that a hypothetical 10% adverse movement would result in an approximate decrease in the fair value of the Cadia PPA cash flow hedge and the foreign currency cash flow hedges of $40 and $220 at December 31, 2025, respectively.
Credit Risk
Credit risk is the risk that a third party might fail to fulfill its performance obligations under the terms of a financial instrument. We mitigate credit risk by entering into derivatives with high credit quality counterparties, limiting the amount of exposure to each counterparty and monitoring the financial condition of the counterparties.
Market Liquidity Risk
Market liquidity risk is the risk that a derivative cannot be eliminated quickly, by either liquidating it or by establishing an offsetting position. Under the terms of our trading agreements, counterparties cannot require us to immediately settle outstanding derivatives, except upon the occurrence of customary events of default such as covenant breaches, including financial covenants, insolvency or bankruptcy. We further mitigate market liquidity risk by spreading out the maturity of our derivatives over time.
Refer to Note 14 to the Consolidated Financial Statements for further information on our derivative instruments.
122

Table of Contents
ITEM 8.       FINANCIAL STATEMENTS AND SUPPLEMENTARY DATA
INDEX TO FINANCIAL STATEMENTS AND SUPPLEMENTARY DATA
Page
Report of Independent Registered Public Accounting Firm (PricewaterhouseCoopers LLP; PCAOB ID: 271)
123

Table of Contents
REPORT OF INDEPENDENT REGISTERED PUBLIC ACCOUNTING FIRM
To the Stockholders and Board of Directors of Newmont Corporation
Opinion on the Financial Statements
We have audited the accompanying consolidated balance sheets of Newmont Corporation (the Company) as of December 31, 2025 and 2024, the related consolidated statements of operations, comprehensive income (loss), changes in equity and cash flows for each of the three years in the period ended December 31, 2025, the related notes and the financial statement schedule in Item 15 (collectively referred to as the “consolidated financial statements”). In our opinion, based on our audits and the report of PricewaterhouseCoopers LLP, the consolidated financial statements referred to above present fairly, in all material respects, the financial position of the Company at December 31, 2025 and 2024, and the results of its operations and its cash flows for each of the three years in the period ended December 31, 2025, in conformity with U.S. generally accepted accounting principles.
We did not audit the financial statements of Nevada Gold Mines LLC, a 38.5% owned investment which is proportionately consolidated, whose financial statements reflect total assets constituting 13% and 13% of consolidated assets as of December 31, 2025 and 2024, respectively, and sales constituting 16% in 2025, 13% in 2024, and 19% in 2023 of the related consolidated totals. Those statements were audited by PricewaterhouseCoopers LLP, whose report has been furnished to us, and our opinion, insofar as it relates to the amounts included for Nevada Gold Mines LLC, is based solely on the report of PricewaterhouseCoopers LLP.
We also have audited, in accordance with the standards of the Public Company Accounting Oversight Board (United States) (PCAOB), the Company's internal control over financial reporting as of December 31, 2025, based on criteria established in Internal Control-Integrated Framework issued by the Committee of Sponsoring Organizations of the Treadway Commission (2013 framework), and our report dated February 19, 2026 expressed an unqualified opinion thereon, based on our audit and the report of PricewaterhouseCoopers LLP.
Basis for Opinion
These financial statements are the responsibility of the Company's management. Our responsibility is to express an opinion on the Company’s financial statements based on our audits. We are a public accounting firm registered with the PCAOB and are required to be independent with respect to the Company in accordance with the U.S. federal securities laws and the applicable rules and regulations of the Securities and Exchange Commission and the PCAOB.
We conducted our audits in accordance with the standards of the PCAOB. Those standards require that we plan and perform the audit to obtain reasonable assurance about whether the financial statements are free of material misstatement, whether due to error or fraud. Our audits included performing procedures to assess the risks of material misstatement of the financial statements, whether due to error or fraud, and performing procedures that respond to those risks. Such procedures included examining, on a test basis, evidence regarding the amounts and disclosures in the financial statements. Our audits also included evaluating the accounting principles used and significant estimates made by management, as well as evaluating the overall presentation of the financial statements. We believe that our audits and the report of PricewaterhouseCoopers LLP provide a reasonable basis for our opinion.
Critical Audit Matter
The critical audit matter communicated below is a matter arising from the current period audit of the financial statements that was communicated or required to be communicated to the audit committee and that: (1) relates to accounts or disclosures that are material to the financial statements and (2) involved our especially challenging, subjective or complex judgments. The communication of the critical audit matter does not alter in any way our opinion on the consolidated financial statements, taken as a whole, and we are not, by communicating the critical audit matter below, providing a separate opinion on the critical audit matter or on the accounts or disclosures to which it relates.
124

Table of Contents
Reclamation liabilities
Description of the Matter
As discussed in Notes 2, 6 and 24 of the consolidated financial statements, the Company’s mining and exploration activities are subject to various domestic and international laws and regulations governing the protection of the environment. Reclamation obligations are recognized when incurred and recorded as liabilities at fair value. Reclamation liabilities are periodically adjusted to reflect changes in the estimated present value resulting from revisions to the estimates of either the timing or amount of the reclamation costs. As of December 31, 2025, the Company’s consolidated reclamation liabilities totaled $6.8 billion.

Auditing management’s accounting for reclamation liabilities was challenging, as significant judgment is required by the Company to estimate future reclamation costs. The significant judgment was due to the complexity of engineering designs for closure and the scope and cost of reclamation activities.

How We Addressed the Matter in Our Audit
We obtained an understanding, evaluated the design, and tested the operating effectiveness of the controls over the Company’s accounting for reclamation liabilities, including controls over management’s methodology, review of the reclamation liability calculation and estimated future costs.

To test the reclamation liabilities, among other procedures, we evaluated the Company’s assessment of factors that would necessitate an update to a mine’s estimated reclamation cash flows, and when such an update occurs, the methodology and the reclamation costs used by the Company in its estimate. To assess the estimates of certain reclamation activities and costs, we evaluated significant changes from the prior estimate, verified cost rates against third-party information or internal cost records and recalculated management’s estimate. We involved our reclamation specialists to interview certain members of the Company’s engineering staff, assess the completeness of the mine reclamation estimates with respect to meeting mine closure and post closure requirements, and evaluate the reasonableness of the cost of future reclamation activities.
/s/ Ernst & Young LLP
We have served as the Company’s auditor since 2014.
Denver, Colorado
February 19, 2026
125

Table of Contents
REPORT OF INDEPENDENT REGISTERED PUBLIC ACCOUNTING FIRM
To the Board of Managers and Members of Nevada Gold Mines LLC
Opinions on the Financial Statements and Internal Control over Financial Reporting
We have audited the consolidated balance sheets of Nevada Gold Mines LLC and its subsidiaries (the Joint Venture) as of December 31, 2025 and 2024, and the related consolidated statements of operations and comprehensive income, of changes in members’ equity and of cash flows for each of the three years in the period ended December 31, 2025, including the related notes (collectively referred to as the consolidated financial statements) (not presented herein). We also have audited the Joint Venture’s internal control over financial reporting as of December 31, 2025, based on criteria established in Internal Control ‒ Integrated Framework (2013) issued by the Committee of Sponsoring Organizations of the Treadway Commission (COSO).
In our opinion, the consolidated financial statements referred to above present fairly, in all material respects, the financial position of the Joint Venture as of December 31, 2025 and 2024, and the results of its operations and its cash flows for each of the three years in the period ended December 31, 2025 in conformity with accounting principles generally accepted in the United States of America. Also in our opinion, the Joint Venture maintained, in all material respects, effective internal control over financial reporting as of December 31, 2025, based on criteria established in Internal Control ‒ Integrated Framework (2013) issued by the COSO.
Basis for Opinions
The Joint Venture’s management is responsible for these consolidated financial statements, for maintaining effective internal control over financial reporting, and for its assessment of the effectiveness of internal control over financial reporting, included in the Management’s Report on Internal Control over Financial Reporting (not presented herein). Our responsibility is to express opinions on the Joint Venture’s consolidated financial statements and on the Joint Venture’s internal control over financial reporting based on our audits. We are a public accounting firm registered with the Public Company Accounting Oversight Board (United States) (PCAOB) and are required to be independent with respect to the Joint Venture in accordance with the U.S. federal securities laws and the applicable rules and regulations of the Securities and Exchange Commission and the PCAOB.
We conducted our audits in accordance with the standards of the PCAOB. Those standards require that we plan and perform the audits to obtain reasonable assurance about whether the consolidated financial statements are free of material misstatement, whether due to error or fraud, and whether effective internal control over financial reporting was maintained in all material respects.
Our audits of the consolidated financial statements included performing procedures to assess the risks of material misstatement of the consolidated financial statements, whether due to error or fraud, and performing procedures that respond to those risks. Such procedures included examining, on a test basis, evidence regarding the amounts and disclosures in the consolidated financial statements. Our audits also included evaluating the accounting principles used and significant estimates made by management, as well as evaluating the overall presentation of the consolidated financial statements. Our audit of internal control over financial reporting included obtaining an understanding of internal control over financial reporting, assessing the risk that a material weakness exists, and testing and evaluating the design and operating effectiveness of internal control based on the assessed risk. Our audits also included performing such other procedures as we considered necessary in the circumstances. We believe that our audits provide a reasonable basis for our opinions.
Definition and Limitations of Internal Control over Financial Reporting
A company’s internal control over financial reporting is a process designed to provide reasonable assurance regarding the reliability of financial reporting and the preparation of financial statements for external purposes in accordance with generally accepted accounting principles. A company’s internal control over financial reporting includes those policies and procedures that (i) pertain to the maintenance of records that, in reasonable detail, accurately and fairly reflect the transactions and dispositions of the assets of the company; (ii) provide reasonable assurance that transactions are recorded as necessary to permit preparation of financial statements in accordance with generally accepted accounting principles, and that receipts and expenditures of the company are being made only in accordance with authorizations of management and directors of the company; and (iii) provide reasonable assurance regarding prevention or timely detection of unauthorized acquisition, use, or disposition of the company’s assets that could have a material effect on the financial statements.
Because of its inherent limitations, internal control over financial reporting may not prevent or detect misstatements. Also, projections of any evaluation of effectiveness to future periods are subject to the risk that controls may become inadequate because of changes in conditions, or that the degree of compliance with the policies or procedures may deteriorate.
Critical Audit Matters
Critical audit matters are matters arising from the current period audit of the consolidated financial statements that were communicated or required to be communicated to the Board of Managers (acting in a role equivalent to the audit committee) and that (i) relate to
126

Table of Contents
accounts or disclosures that are material to the consolidated financial statements and (ii) involved our especially challenging, subjective, or complex judgments. We determined there are no critical audit matters.
/s/PricewaterhouseCoopers LLP

Chartered Professional Accountants, Licensed Public Accountants
Toronto, Canada
February 19, 2026

We have served as the Joint Venture’s auditor since 2019.
127

Table of Contents
NEWMONT CORPORATION
CONSOLIDATED STATEMENTS OF OPERATIONS
(dollars in millions except per share)
Year Ended December 31,
202520242023
Sales (Note 5)
$22,669 $18,682 $11,812 
Costs and expenses:
Costs applicable to sales (1)
8,085 8,963 6,699 
Depreciation and amortization
2,521 2,576 2,108 
Reclamation and remediation (Note 6)
249 328 1,533 
Exploration
243 266 265 
Advanced projects, research and development
166 197 200 
General and administrative
382 442 299 
Impairment charges (Note 7)
842 78 1,891 
(Gain) loss on sale of assets held for sale (Note 3)
(1,066)1,114 — 
Other expense, net (Note 8)
286 191 517 
11,708 14,155 13,512 
Other income (expense):
Change in fair value of investments and options
604 62 (47)
Other income (loss), net (Note 9)
6 363 (41)
Interest expense, net of capitalized interest of $144, $114 and $89, respectively
(229)(375)(243)
381 50 (331)
Income (loss) before income and mining tax and other items
11,342 4,577 (2,031)
Income and mining tax benefit (expense) (Note 10)
(4,596)(1,397)(526)
Equity income (loss) of affiliates (Note 15)
421 133 63 
Net income (loss) from continuing operations
7,167 3,313 (2,494)
Net income (loss) from discontinued operations (Note 1)
— 68 27 
Net income (loss)
7,167 3,381 (2,467)
Net loss (income) attributable to non-controlling interests (Note 1)
(82)(33)(27)
Net income (loss) attributable to Newmont stockholders
$7,085 $3,348 $(2,494)
Net income (loss) attributable to Newmont stockholders:
Continuing operations
$7,085 $3,280 $(2,521)
Discontinued operations
— 68 27 
$7,085 $3,348 $(2,494)
Weighted average common shares:
Basic1,106 1,146 841 
Effect of employee stock-based awards2 2 — 
Diluted1,108 1,148 841 
Net income (loss) per common share:
Basic:
Continuing operations$6.41 $2.86 $(3.00)
Discontinued operations— 0.06 0.03 
$6.41 $2.92 $(2.97)
Diluted: (2)
Continuing operations$6.39 $2.86 $(3.00)
Discontinued operations— 0.06 0.03 
$6.39 $2.92 $(2.97)
____________________________
(1)Excludes Depreciation and amortization and Reclamation and remediation.
(2)For the year ended December 31, 2023, potentially dilutive shares were excluded in the computation of diluted loss per common share attributable to Newmont stockholders as they were antidilutive.
The accompanying notes are an integral part of these Consolidated Financial Statements.
128

Table of Contents
NEWMONT CORPORATION
CONSOLIDATED STATEMENTS OF COMPREHENSIVE INCOME (LOSS)
(dollars in millions)
Year Ended December 31,
202520242023
Net income (loss)
$7,167 $3,381 $(2,467)
Other comprehensive income (loss):
Change in cash flow hedges, net of tax
234 (123)(1)
Other adjustments, net of tax
(2)14 (14)
Other comprehensive income (loss)
232 (109)(15)
Comprehensive income (loss)
$7,399 $3,272 $(2,482)
Comprehensive income (loss) attributable to:
Newmont stockholders
$7,317 $3,239 $(2,509)
Noncontrolling interests
82 33 27 
$7,399 $3,272 $(2,482)
The accompanying notes are an integral part of these Consolidated Financial Statements.
129

Table of Contents
NEWMONT CORPORATION
CONSOLIDATED BALANCE SHEETS
(dollars in millions except per share)
At December 31, 2025At December 31, 2024
ASSETS
Cash and cash equivalents
$7,647 $3,619 
Trade receivables (Note 5)
1,067 1,056 
Investments (Note 15)
594 21 
Inventories (Note 16)
1,512 1,423 
Stockpiles and ore on leach pads (Note 17)
1,177 761 
Other receivables678 496 
Other current assets
391 290 
Assets held for sale (Note 3)
— 4,609 
Current assets
13,066 12,275 
Property, plant and mine development, net (Note 18)
33,310 33,547 
Investments ($212 valued under fair value option at December 31, 2024) (Note 15)
4,186 4,471 
Stockpiles and ore on leach pads (Note 17)
2,410 2,266 
Deferred income tax assets (Note 10)
45 124 
Goodwill (Note 19)
2,658 2,658 
Other non-current assets
1,446 1,008 
Total assets
$57,121 $56,349 
LIABILITIES
Accounts payable
$816 $843 
Employee-related benefits (Note 11)
898 630 
Income and mining taxes (Note 10)
1,188 381 
Lease and other financing obligations (Note 21)
118 107 
Debt (Note 20)
— 924 
Other current liabilities ($339 valued under fair value option at December 31, 2025) (Note 22)
2,692 2,481 
Liabilities held for sale (Note 3)
— 2,177 
Current liabilities
5,712 7,543 
Debt (Note 20)
5,115 7,552 
Lease and other financing obligations (Note 21)
356 389 
Reclamation and remediation liabilities (Note 6)
6,297 6,394 
Deferred income tax liabilities (Note 10)
4,045 2,820 
Employee-related benefits (Note 11)
634 555 
Silver streaming agreement (Note 5)
598 699 
Other non-current liabilities ($51 valued under fair value option at December 31, 2024) (Note 22)
322 288 
Total liabilities
23,079 26,240 
Commitments and contingencies (Note 24)
EQUITY
Common stock - $1.60 par value;
1,753 1,813 
Authorized - 2,550 million and 2,550 million shares, respectively
Outstanding shares - 1,089 million and 1,127 million shares, respectively
Treasury stock - 7 million and 7 million shares, respectively
(301)(278)
Additional paid-in capital
28,847 29,808 
Accumulated other comprehensive income (loss) (Note 23)
137 (95)
Retained earnings (Accumulated deficit)
3,431 (1,320)
Newmont stockholders' equity
33,867 29,928 
Noncontrolling interests
175 181 
Total equity
34,042 30,109 
Total liabilities and equity
$57,121 $56,349 
The accompanying notes are an integral part of these Consolidated Financial Statements.
130

Table of Contents
NEWMONT CORPORATION
CONSOLIDATED STATEMENTS OF CASH FLOWS
(dollars in millions)
Year Ended December 31,
202520242023
Operating activities:
Net income (loss)
$7,167 $3,381 $(2,467)
Adjustments:
Depreciation and amortization
2,521 2,576 2,108 
Impairment charges
842 78 1,891 
(Gain) loss on sale of assets held for sale
(1,066)1,114 — 
Net loss (income) from discontinued operations
— (68)(27)
Deferred income taxes
1,391 80 (104)
Change in fair value of investments and options
(604)(62)47 
Reclamation and remediation
219 302 1,506 
Loss (gain) on debt extinguishment
101 (32)— 
Stock-based compensation
99 89 80 
Other non-cash adjustments
(126)(115)233 
Change in operating assets and liabilities:
Trade and other receivables
(93)(441)(240)
Inventories, stockpiles and ore on leach pads
(454)(534)(187)
Other assets
(247)64 50 
Accounts payable
(19)(2)(42)
Reclamation and remediation liabilities
(803)(433)(275)
Accrued tax liabilities
1,039 235 (197)
Other accrued liabilities
367 86 378 
Net cash provided by (used in) operating activities of continuing operations
10,334 6,318 2,754 
Net cash provided by (used in) operating activities of discontinued operations
— 45 9 
Net cash provided by (used in) operating activities
10,334 6,363 2,763 
Investing activities:
Additions to property, plant and mine development
(3,035)(3,402)(2,666)
Proceeds from sales of mining operations and other assets, net
2,811 560 — 
Proceeds from sales of investments
986 21 234 
Return of investment from equity method investees
62 56 36 
Contributions to equity method investees
(59)(96)(108)
Purchases of investments
(14)(66)(551)
Maturities of investments
— 28 1,363 
Acquisitions, net (1)
— — 668 
Other
(145)44 22 
Net cash provided by (used in) investing activities of continuing operations
606 (2,855)(1,002)
Net cash provided by (used in) investing activities of discontinued operations
— 153 — 
Net cash provided by (used in) investing activities
606 (2,702)(1,002)
Financing activities:
Repayment of debt
(3,430)(3,860)— 
Repurchases of common stock
(2,303)(1,246)— 
Dividends paid to common stockholders
(1,106)(1,145)(1,415)
Distributions to noncontrolling interests
(217)(161)(150)
Funding from noncontrolling interests
133 115 138 
Payments on lease and other financing obligations
(95)(87)(67)
Payments for withholding of employee taxes related to stock-based compensation
(23)(14)(25)
Proceeds from issuance of debt, net
— 3,476 — 
Other
1 (31)(84)
Net cash provided by (used in) financing activities
(7,040)(2,953)(1,603)
Effect of exchange rate changes on cash, cash equivalents and restricted cash
(4)(20)(2)
Net change in cash, cash equivalents and restricted cash, including cash and restricted cash reclassified to assets held for sale3,896 688 156 
Less: Cash and restricted cash reclassified to assets held for sale (2)
138 (138)— 
Net change in cash, cash equivalents and restricted cash4,034 550 156 
Cash, cash equivalents and restricted cash at beginning of period 3,650 3,100 2,944 
Cash, cash equivalents and restricted cash at end of period $7,684 $3,650 $3,100 
131

Table of Contents
NEWMONT CORPORATION
CONSOLIDATED STATEMENTS OF CASH FLOWS
(dollars in millions)
Year Ended December 31,
202520242023
Reconciliation of cash, cash equivalents and restricted cash:
Cash and cash equivalents$7,647 $3,619 $3,002 
Restricted cash included in Other current assets3 1 11 
Restricted cash included in Other non-current assets34 30 87 
Total cash, cash equivalents and restricted cash$7,684 $3,650 $3,100 
Supplemental cash flow information:
Interest paid, net of amounts capitalized$233 $317 $228 
____________________________
(1)Acquisitions, net is related to the cash acquired in the Newcrest transaction for the year ended December 31, 2023. Refer to Note 3 for additional information.
(2)During the first quarter of 2024, certain non-core assets were determined to meet the criteria for assets held for sale. As a result, at December 31, 2024 the related assets, including $45 of Cash and cash equivalents and $93 of restricted cash, included in Other current assets and Other non-current assets, were reclassified to Assets held for sale. At December 31, 2025, no amounts relating to Cash and cash equivalents and restricted cash remained in Assets held for sale. Refer to Note 3 for additional information.
The accompanying notes are an integral part of these Consolidated Financial Statements.
132

Table of Contents

NEWMONT CORPORATION
CONSOLIDATED STATEMENT OF CHANGES IN EQUITY
(dollars in millions, except per share)
Common StockTreasury StockAdditional
Paid-In
Capital
Accumulated
Other
Comprehensive
Income (Loss)
Retained
Earnings (Accumulated Deficit)
Noncontrolling
Interests
Total
Equity
SharesAmountSharesAmount
Balance at December 31, 2022799 $1,279 (6)$(239)$17,369 $29 $916 $179 $19,533 
Net income (loss)— — — — — — (2,494)27 (2,467)
Other comprehensive income (loss)— — — — — (15)— — (15)
Shares issued for the Newcrest transaction358 572 — — 12,977 — — — 13,549 
Dividends declared (1)
— — — — — — (1,418)— (1,418)
Distributions declared to noncontrolling interests— — — — — — — (156)(156)
Cash calls requested from noncontrolling interests— — — — — — — 128 128 
Withholding of employee taxes related to stock-based compensation— — (1)(25)— — — — (25)
Stock-based awards and related share issuances2 3 — — 73 — — — 76 
Balance at December 31, 20231,159 1,854 (7)(264)30,419 14 (2,996)178 29,205 
Net income (loss)— — — — — — 3,348 33 3,381 
Other comprehensive income (loss)— — — — — (109)— — (109)
Dividends declared (1)
— — — — — — (1,148)— (1,148)
Distributions declared to noncontrolling interests— — — — — — — (156)(156)
Cash calls requested from noncontrolling interests— — — — — — — 126 126 
Repurchase and retirement of common stock(26)(42)— — (693)— (524)— (1,259)
Withholding of employee taxes related to stock-based compensation— — — (14)— — — — (14)
Stock-based awards and related share issuances1 1 — — 82 — — — 83 
Balance at December 31, 20241,134 1,813 (7)(278)29,808 (95)(1,320)181 30,109 
Net income (loss)— — — — — — 7,085 82 7,167 
Other comprehensive income (loss)— — — — — 232 — — 232 
Dividends declared (1)
— — — — — — (1,108)— (1,108)
Distributions declared to noncontrolling interests— — — — — — — (217)(217)
Cash calls requested from noncontrolling interests— — — — — — — 129 129 
Repurchase and retirement of common stock (2)(3)
(39)(63)— — (1,037)— (1,226)— (2,326)
Withholding of employee taxes related to stock-based compensation— — — (23)— — — — (23)
Stock-based awards and related share issuances1 3 — — 76 — — — 79 
Balance at December 31, 20251,096 $1,753 (7)$(301)$28,847 $137 $3,431 $175 $34,042 
____________________________
(1)Cash dividends paid per common share was $1.00, $1.00 and $1.60 for 2025, 2024 and 2023, respectively. Dividends declared and dividends paid to common stockholders differ by $2, $3, and $3 for 2025, 2024 and 2023, respectively, due to timing.
(2)As of December 31, 2025, the Company has accrued for excise tax on share repurchases of $23, included in Other non-current liabilities.
(3)An additional $75 of common stock was repurchased and retired subsequent to December 31, 2025 through the date of filing.
The accompanying notes are an integral part of these Consolidated Financial Statements.
133

Table of Contents
NEWMONT CORPORATION
NOTES TO CONSOLIDATED FINANCIAL STATEMENTS
(dollars in millions, except per share, per ounce and per pound amounts)

NOTE 1     THE COMPANY
Newmont Corporation and its affiliates and subsidiaries (collectively, “Newmont,” “we,” “us” or the “Company”) predominantly operate in the mining industry, focused on the production of and exploration for gold properties, some of which may contain copper, silver, zinc, lead or other metals. The Company has significant operations and/or assets in the United States (“U.S.”), Papua New Guinea, Australia, Ghana, Suriname, Argentina, Dominican Republic, Chile, Peru, Ecuador, Mexico, and Canada. The cash flow and profitability of the Company’s operations are significantly affected by the market price of gold, copper, silver, lead, and zinc. The prices of gold, copper, silver, lead, and zinc are affected by numerous factors beyond the Company’s control.
Reportable Segments
In October 2025, the Company declared commercial production at its Ahafo North project in Ghana resulting in classification as a reportable segment. Prior to declaration of commercial production, Ahafo North was classified as a development project and all activity was included in the Ahafo South reportable segment up to the date of commercial production. Although not a reportable segment until the fourth quarter of 2025, the amounts related to Ahafo North have been reported separately for comparability purposes. Refer to Note 4 for further information.
Divestiture of Non-core Assets
The Company completed the sale of the assets of the Telfer reportable segment in the fourth quarter of 2024, the sale of the CC&V, Musselwhite, and Éléonore reportable segments in the first quarter of 2025, the sale of the Porcupine and Akyem reportable segments in the second quarter of 2025, and the sale of the Coffee development project in the fourth quarter of 2025. Refer to Note 3 for further information on the Company's divestitures.
Newcrest Transaction
On November 6, 2023, the Company completed its business combination transaction with Newcrest Mining Limited, a public Australian mining company limited by shares ("Newcrest"), whereby Newmont, through Newmont Overseas Holdings Pty Ltd, an Australian proprietary company limited by shares (“Newmont Sub”), acquired all of the ordinary shares of Newcrest in a fully stock transaction for total non-cash consideration of $13,549. Newcrest became a direct wholly owned subsidiary of Newmont Sub and an indirect wholly owned subsidiary of Newmont (such acquisition, the “Newcrest transaction”). The combined company continues to be traded on the New York Stock Exchange under the ticker NEM. The combined company is also listed on the Australian Securities Exchange under the ticker NEM and on the Papua New Guinea Securities Exchange under the ticker NEM. Refer to Note 3 for further information.
Noncontrolling Interests
Newmont has a 75% economic interest in Suriname Gold project C.V. (“Merian”), with the remaining interests held by Staatsolie Maatschappij Suriname N.V., a company wholly owned by the Republic of Suriname. Newmont consolidates Merian, through its wholly-owned subsidiary, Newmont Suriname LLC., in its Consolidated Financial Statements as the primary beneficiary of Merian, which is a variable interest entity. For the years ended December 31, 2025, 2024, and 2023, the Company recognized income of $82, $33, and $27, respectively, within Net loss (income) attributable to non-controlling interests related to Merian.
Discontinued Operations
Net income (loss) from discontinued operations included results related to the Batu Hijau and Elang contingent consideration assets obtained in connection with the sale of PT Newmont Nusa Tenggara in 2016. In the third quarter of 2024, the Company sold these contingent consideration assets for cash consideration of $153, resulting in a gain of $15 included in Net income (loss) from discontinued operations. Following this sale, the Company no longer has discontinued operations activity.
For the years ended December 31, 2024 and 2023, the Company recorded income of $68 and $27, net of a tax benefit (expense) of $31 and $(5), respectively, within Net income (loss) from discontinued operations. The Company received $45 and $9 for the years ended December 31, 2024 and 2023, respectively, related to discontinued operations.
NOTE 2     SUMMARY OF SIGNIFICANT ACCOUNTING POLICIES
Risks and Uncertainties
As a global mining company, the Company’s revenue, profitability, and future rate of growth are substantially dependent on prevailing metal prices, primarily for gold, but also for copper, silver, lead, and zinc. Historically, the commodity markets have been very volatile, and there can be no assurance that commodity prices will not be subject to wide fluctuations in the future. A substantial or extended decline in commodity prices could have a material adverse effect on the Company’s financial position, results of operations, cash flows, access to capital, and on the quantities of reserves that the Company can economically produce. The carrying value of the Company’s Property, plant and mine development, net; Inventories; Stockpiles and ore on leach pads; Investments; Deferred income
134

Table of Contents
NEWMONT CORPORATION
NOTES TO CONSOLIDATED FINANCIAL STATEMENTS
(dollars in millions, except per share, per ounce and per pound amounts)
tax assets; and Goodwill are particularly sensitive to the outlook for commodity prices. A decline in the Company’s price outlook from current levels could result in material impairment charges related to these assets.
The Company's global operations expose it to risks associated with public health crises, geopolitical and macroeconomic pressures, including but not limited to inflationary conditions, as well as the effects of certain countermeasures taken by central banks, supply chain disruptions resulting from global conflicts and other global events, and an uncertain and evolving labor market.
Factors that could have further potential short- and, possibly, long-term material adverse impacts on the Company include, but are not limited to, volatility in commodity prices and the prices for gold and other metals, changes in the equity and debt markets or country-specific factors adversely impacting discount rates, significant cost inflation impacts on production, capital and asset retirement costs, logistical challenges, workforce interruptions and financial market disruptions, energy market disruptions, as well as potential impacts to estimated costs and timing of projects.
The Company had previously extended the timeline of a full-funds decision for its Yanacocha Sulfides development project. The delay of the project was intended to focus funds on current operations and other capital commitments while management assessed execution and project options, up to and including transitioning the Yanacocha operations into full closure. During the year, the Company reassessed its strategy in Peru and is progressing mine closure activities while prioritizing other future development opportunities at Yanacocha ahead of any future re-evaluation of the Yanacocha Sulfides project, resulting in an indefinite deferral of the future development of this project and the impairment of the balances included in assets under construction and deferred mine development for the project. As of December 31, 2025, the Yanacocha operations have total long-lived assets of approximately $374, inclusive of $78 of assets under construction related to the estimated sales value of project equipment. Refer to Note 7 for additional information on this impairment charge.
The Company continues to hold the Conga project in Peru. While the Company continues to evaluate its strategy and global project pipeline potential, particularly in Peru, the Company does not currently anticipate developing Conga in the next ten years, while it remains a part of its long-term development project pipeline; consistent with prior years, the Conga project remained temporarily idled in care and maintenance during 2025. Should the Company be unable to develop the Conga project or conclude that future development is not in the best interest of the business, the Company may consider other alternatives for the project, which may result in a future impairment charge for the remaining assets. The total assets at Conga were $883 and $892 at December 31, 2025 and 2024.
The Company's global operations also expose it to foreign currency exchange rates which can increase or decrease profits to the extent costs are paid in foreign currencies, including the Papua New Guinean kina, Australian dollar, the Ghanaian cedi, the Surinamese dollar, the Argentine peso, the Peruvian sol, the Mexican peso, and the Canadian dollar.
The Cerro Negro mine is located in Argentina which is a hyperinflationary economy as of December 31, 2025. The Cerro Negro mine is a USD functional currency entity with the majority of the activity historically having been denominated in USD. As a result, the devaluation of the Argentine peso has resulted in an immaterial impact on the Company's financial statements. Therefore, future devaluation is not expected to have a material impact on the Company's financial statements. Argentina’s central bank has enacted a number of foreign currency controls in an effort to stabilize the local currency, including requiring the Company to convert USD proceeds from metal sales to local currency and restricting payments to foreign-related entities denominated in foreign currency, such as dividends or distributions to the parent and related companies. The Company continues to monitor the foreign currency exposure risk and the limitations of repatriating cash to the United States. Currently, these currency controls are not expected to impact the Company's ability to repay its debt obligations or declare dividends.
Use of Estimates
The Company’s Consolidated Financial Statements have been prepared in accordance with GAAP. The preparation of the Company’s Consolidated Financial Statements requires the Company to make estimates and assumptions that affect the reported amounts of assets and liabilities and the related disclosure of contingent assets and liabilities at the date of the Consolidated Financial Statements and the reported amounts of revenues and expenses during the reporting period. The Company must make these estimates and assumptions because certain information used is dependent on future events, cannot be calculated with a high degree of precision from data available or simply cannot be readily calculated based on generally accepted methodologies. Actual results could differ from these estimates.
The more significant areas requiring the use of management estimates and assumptions relate to mineral reserves that are the basis for future cash flow estimates utilized in impairment calculations and units-of-production amortization calculations; environmental remediation, reclamation and closure obligations; estimates of recoverable gold and other minerals in stockpile and leach pad inventories; estimates of fair value for certain reporting units and asset impairments (including impairments of long-lived assets, goodwill and investments); write-downs of inventory, stockpiles and ore on leach pads to net realizable value; post-employment, post-retirement and other employee benefit liabilities; valuation allowances for deferred tax assets; provisional amounts related to income tax effects of newly enacted tax laws; provisional amounts related to uncertain tax positions; valuation of assets acquired and liabilities assumed in a business combination; valuation of assets held for sale; reserves for contingencies and litigation; and the fair value and accounting treatment of financial instruments including marketable and other equity securities and derivative instruments. The
135

Table of Contents
NEWMONT CORPORATION
NOTES TO CONSOLIDATED FINANCIAL STATEMENTS
(dollars in millions, except per share, per ounce and per pound amounts)
Company bases its estimates on historical experience and on various other assumptions that are believed to be reasonable under the circumstances. Accordingly, actual results will differ from those amounts estimated in these financial statements.
Principles of Consolidation
The Consolidated Financial Statements include the accounts of Newmont Corporation, more-than-50%-owned subsidiaries that it controls and variable interest entities where it is the primary beneficiary. The proportionate consolidation method is used for investments in which the Company has an undivided interest in the assets, liabilities and operations and for certain unincorporated joint ventures in the extractive industry. All significant intercompany balances and transactions have been eliminated. Equity method accounting is applied for certain entities where the Company does not have control, but does have significant influence over the activities that most significantly impact the entities’ operations and financial performance. The functional currency for the majority of the Company’s operations is the U.S. dollar.
The Company follows the ASC guidance for identification and reporting of entities over which control is achieved through means other than voting rights. The guidance defines such entities as Variable Interest Entities.
Business Combination and Asset Acquisition Accounting
The Company applies a screen test to evaluate if substantially all of the fair value of the gross assets acquired is concentrated in a single identifiable asset or group of similar identifiable assets to determine whether a transaction should be accounted for as an asset acquisition or business combination.
When an acquisition does not meet the definition of a business combination because either: (i) substantially all of the fair value of the gross assets acquired is concentrated in a single identifiable asset, or group of similar identified assets, or (ii) the acquired entity does not have an input and a substantive process that together significantly contribute to the ability to create outputs, the Company accounts for the acquisition as an asset acquisition. In an asset acquisition, goodwill is not recognized, but rather, any excess purchase consideration over the fair value of the net assets acquired is allocated on a relative fair value basis to the identifiable net assets as of the acquisition date and any direct acquisition-related transaction costs are capitalized as part of the purchase consideration.
When an acquisition is accounted for as a business combination, the Company recognizes and measures the assets acquired and liabilities assumed based on their estimated fair values at the acquisition date, while transaction and integration costs related to business combinations are expensed as incurred. Any excess of the purchase consideration in excess of the aggregate fair value of the net tangible and intangible assets acquired, if any, is recorded as goodwill. For material acquisitions, the Company engages independent appraisers to assist with the determination of the fair value of assets acquired, liabilities assumed, noncontrolling interest, if any, and goodwill, based on recognized business valuation methodologies. An income, market or cost valuation method may be utilized to estimate the fair value of the assets acquired, liabilities assumed, and noncontrolling interest, if any, in a business combination. The income valuation method represents the present value of future cash flows over the life of the asset using discrete financial forecasts, long-term growth rates, appropriate discount rates, and expected future capital requirements. The market valuation method uses prices paid for a similar asset by other purchasers in the market, normalized for any differences between the assets. The cost valuation method is based on the replacement cost of a comparable asset at the time of the acquisition adjusted for depreciation and economic and functional obsolescence of the asset. During the measurement period, not to exceed one year from the date of acquisition, the Company may record adjustments to the assets acquired and liabilities assumed, with a corresponding offset to goodwill if new information is obtained related to facts and circumstances that existed as of the acquisition date. After the measurement period, any subsequent adjustments are reflected in the period the adjustment arises.
Assets Held for Sale
The Company classifies long-lived assets, or disposal groups comprising of assets and liabilities, as held for sale in the period in which the following six criteria are met, (i) management, having the authority to approve the action, commits to a plan to sell the property; (ii) the property is available for immediate sale in its present condition, subject only to terms that are usual and customary; (iii) an active program to locate a buyer and other actions required to complete the plan to sell have been initiated; (iv) the sale of the property is probable and is expected to be completed within one year; (v) the property is being actively marketed for sale at a price that is reasonable in relation to its current fair value; and (vi) actions necessary to complete the plan of sale indicate that it is unlikely that significant changes to the plan will be made or that the plan will be withdrawn.
The Company ceases depreciation and amortization on long-lived assets (or disposal groups) classified as held for sale, and measures them at the lower of carrying value or estimated fair value less cost to sell.
In determining the fair value of the assets less costs to sell, the Company considers factors including current sales prices for comparable assets, discounted cash flow projections, third party valuations and indicative offer information, if applicable. The Company’s assumptions about fair value require significant judgment because the current market is sensitive to changes in economic conditions, as well as asset-specific considerations. The fair value of assets held for sale is estimated based on the current market conditions and assumptions made by management, which may differ from actual results and could result in future impairments if market conditions deteriorate.
136

Table of Contents
NEWMONT CORPORATION
NOTES TO CONSOLIDATED FINANCIAL STATEMENTS
(dollars in millions, except per share, per ounce and per pound amounts)
An impairment loss on the initial classification and subsequent measurement of an asset held for sale is recognized as an expense. Any subsequent increase in fair value less costs to sell (not exceeding the accumulated impairment loss that has been previously recognized) is recognized as a reversal of expense. Additional impairments may result as the Company continues to evaluate the fair value of assets held for sale and monitors market conditions and other economic factors.
Cash, Cash Equivalents and Restricted Cash
Cash and cash equivalents consist of all cash balances and highly liquid investments with an original maturity of three months or less. Because of the short maturity of these investments, the carrying amounts approximate their fair value. Cash and cash equivalents are held in overnight bank deposits or are invested in United States Treasury securities and money market securities. Restricted cash is excluded from cash and cash equivalents and is included in other current or non-current assets. Restricted cash is held primarily for the purpose of settling asset retirement obligations.
Stockpiles, Ore on Leach Pads and Inventories
As described below, costs that are incurred in or benefit the productive process are accumulated as stockpiles, ore on leach pads and inventories. Stockpiles, ore on leach pads and inventories are carried at the lower of average cost or net realizable value. Net realizable value represents the estimated future sales price of the product based on current and long-term metals prices, less the estimated costs to complete production and bring the product to sale. Write-downs of stockpiles, ore on leach pads and inventories to net realizable value are reported as a component of Costs applicable to sales and Depreciation and amortization. The current portion of stockpiles, ore on leach pads and inventories is determined based on the expected amounts to be processed within the next 12 months and utilize the short-term metal price assumption in estimating net realizable value. Stockpiles, ore on leach pads and inventories not expected to be processed within the next 12 months are classified as non-current and utilize the long-term metal price assumption in estimating net realizable value. The major classifications are as follows:
Stockpiles
Stockpiles represent ore that has been extracted from the mine and is available for further processing. Mine sequencing may result in mining material at a faster rate than can be processed. The Company generally processes the highest ore grade material first to maximize metal production; however, a blend of metal stockpiles may be processed to balance hardness and/or metallurgy in order to maximize throughput and recovery. Processing of lower grade stockpiled ore may continue after mining operations are completed. Sulfide copper ores are subject to oxidation over time which can reduce expected future recoveries. Stockpiles are measured by estimating the number of tons added and removed from the stockpile, the number of contained ounces or pounds (based on assay data) and the estimated metallurgical recovery rates (based on the expected processing method). Stockpile ore tonnages are verified by periodic surveys. Costs are added to stockpiles based on current mining costs incurred including applicable overhead and depreciation and amortization relating to mining operations and removed at each stockpile’s average cost per recoverable unit as material is processed. Carrying values are evaluated at least quarterly, in accordance with the above.
Ore on Leach Pads
Ore on leach pads represent ore that has been mined and placed on leach pads where a solution is applied to the surface of the heap to dissolve the gold or silver or extract the copper. Costs are added to ore on leach pads based on current mining costs, including applicable depreciation and amortization relating to mining operations. Costs are removed from ore on leach pads as ounces or pounds are recovered based on the average cost per estimated recoverable ounce of gold or silver or pound of copper on the leach pad. Estimates of recoverable ore on the leach pads are calculated from the quantities of ore placed on the leach pads (measured tons added to the leach pads), the grade of ore placed on the leach pads (based on assay data) and a recovery percentage (based on ore type). In general, leach pads recover between 50% and 95% of the recoverable ounces in the first year of leaching, declining each year thereafter until the leaching process is complete.
Although the quantities of recoverable metal placed on the leach pads are reconciled by comparing the grades of ore placed on pads to the quantities of metal actually recovered (metallurgical balancing), the nature of the leaching process inherently limits the ability to precisely monitor inventory levels. As a result, the metallurgical balancing process is constantly monitored and estimates are refined based on actual results over time. Historically, the Company’s operating results have not been materially impacted by variations between the estimated and actual recoverable quantities of metal on its leach pads. Variations between actual and estimated quantities resulting from changes in assumptions and estimates that do not result in write-downs to net realizable value are accounted for on a prospective basis.
In-process Inventory
In-process inventories represent material that is currently in the process of being converted to a saleable product. Conversion processes vary depending on the nature of the ore and the specific processing facility, but include mill in-circuit, flotation, leach and carbon-in-leach. In-process material is measured based on assays of the material fed into the process and the projected recoveries of the respective processing plants. In-process inventories are valued at the lower of the average cost of the material fed into the process attributable to the source material coming from the mines, stockpiles and/or leach pads, plus the in-process conversion costs, including applicable amortization relating to the process facilities incurred to that point in the process or net realizable value.
137

Table of Contents
NEWMONT CORPORATION
NOTES TO CONSOLIDATED FINANCIAL STATEMENTS
(dollars in millions, except per share, per ounce and per pound amounts)
Precious Metals Inventory
Precious metals inventories include gold doré and/or gold bullion. Precious metals that result from the Company’s mining and processing activities are valued at the lower of the average cost of the respective in-process inventories incurred prior to the refining process, plus applicable refining costs or net realizable value.
Concentrate Inventory
Concentrate inventories represent gold, silver, lead, zinc and copper concentrate available for shipment or in transit for further processing when the sales process has not been completed. The Company values concentrate inventory at average cost, including an allocable portion of support costs and amortization. Costs are added and removed to the concentrate inventory based on metal in the concentrate and are valued at the lower of average cost or net realizable value.
Materials and Supplies
Materials and supplies are valued at the lower of average cost or net realizable value. Cost includes applicable taxes and freight.
Property, Plant and Mine Development
Facilities and Equipment
Expenditures for new facilities or equipment and expenditures that extend the useful lives of existing facilities or equipment are capitalized and recorded at cost. Facilities and equipment acquired as a part of a finance lease, build-to-suit or other financing arrangement are capitalized and recorded based on the contractual lease terms. The facilities and equipment are depreciated using the straight-line method at rates sufficient to depreciate such capitalized costs over the estimated productive lives of such facilities. These estimated productive lives do not exceed the related estimated mine lives, which are based on proven and probable reserves.
Mine Development
Mine development costs include engineering and metallurgical studies, drilling and other related costs to delineate an ore body, the removal of overburden to initially expose an ore body at open pit surface mines and the building of access ways, shafts, lateral access, drifts, ramps and other infrastructure at underground mines. Costs incurred before mineralization is classified as proven and probable reserves are expensed and classified as Exploration or Advanced projects, research and development expense. Capitalization of mine development project costs that meet the definition of an asset begins once mineralization is classified as proven and probable reserves.
Drilling and related costs are capitalized for an ore body where proven and probable reserves exist and the activities are directed at obtaining additional information on the ore body or converting measured, indicated and inferred resources to proven and probable reserves. All other drilling and related costs are expensed as incurred. Drilling costs incurred during the production phase for operational ore control are allocated to inventory costs and then included as a component of Costs applicable to sales.
The cost of removing overburden and waste materials to access the ore body at an open pit mine prior to the production phase are referred to as “pre-stripping costs.” Pre-stripping costs are capitalized during the development of an open pit mine. Where multiple open pits exist at a mining complex utilizing common processing facilities, pre-stripping costs are capitalized at each pit. The removal, production, and sale of de minimis saleable materials may occur during the development phase of an open pit mine and are assigned incremental mining costs related to the removal of that material.
The production phase of an open pit mine commences when saleable minerals, beyond a de minimis amount, are produced. Stripping costs incurred during the production phase of a mine are variable production costs that are included as a component of inventory to be recognized in Costs applicable to sales in the same period as the revenue from the sale of inventory.
Mine development costs are amortized using the units-of-production method based on estimated recoverable ounces or pounds in proven and probable reserves. To the extent that these costs benefit an entire ore body, they are amortized over the estimated life of the ore body. Costs incurred to access specific ore blocks or areas that only provide benefit over the life of that area are amortized over the estimated life of that specific ore block or area.
Mineral Interests
Mineral interests include acquired interests in production, development and exploration stage properties. Mineral interests are capitalized at their fair value at the acquisition date, either as an individual asset purchase or as part of a business combination. Mineral interests in the development and exploration stage are not amortized until the underlying property is converted to the production stage, at which point the mineral interests are amortized over the estimated recoverable proven and probable reserves.
The value of such assets is primarily driven by the nature and amount of mineral interests believed to be contained in such properties. Production stage mineral interests represent interests in operating properties that contain proven and probable reserves and
138

Table of Contents
NEWMONT CORPORATION
NOTES TO CONSOLIDATED FINANCIAL STATEMENTS
(dollars in millions, except per share, per ounce and per pound amounts)
are amortized using the units-of-production method based on the estimated recoverable ounces or pounds in proven and probable reserves. Development stage mineral interests represent interests in properties under development that contain proven and probable reserves. Exploration stage mineral interests represent interests in properties that are believed to potentially contain mineral resources consisting of (i) mineral resources within pits; mineral resources with insufficient drill spacing to qualify as proven and probable reserves; and mineral resources in close proximity to proven and probable reserves; (ii) around-mine exploration potential not immediately adjacent to existing reserves and mineralization, but located within the immediate mine area; (iii) other mine-related exploration potential that is not part of current resources and is comprised mainly of material outside of the immediate mine area; (iv) greenfield exploration potential that is not associated with any other production, development or exploration stage property, as described above; or (v) any acquired right to explore or extract a potential mineral deposit. The Company’s mineral rights generally are enforceable regardless of whether proven and probable reserves have been established. In certain limited situations, the nature of a mineral right changes from an exploration right to a mining right upon the establishment of proven and probable reserves. The Company has the ability and intent to renew mineral interests where the existing term is not sufficient to recover all identified and valued proven and probable reserves and/or undeveloped mineral resources.
Goodwill
Goodwill represents the excess of the purchase price over the estimated fair value of the net assets acquired in a business acquisition. Goodwill is allocated to reporting units and tested for impairment annually as of December 31 and when events or changes in circumstances indicate that the carrying value of a reporting unit exceeds its fair value. Each operating mine is considered a distinct reporting unit for purposes of goodwill impairment testing.
The Company may elect to perform a qualitative assessment when it is more likely than not that the fair value of a reporting unit is higher than its carrying value. If the Company determines that it is more likely than not that the fair value is less than the carrying value, a quantitative goodwill impairment test is performed to determine the fair value of the reporting unit. The fair value of a reporting unit is determined using either the income approach utilizing estimates of discounted future cash flows or the market approach utilizing recent transaction activity for comparable properties. These approaches are considered Level 3 fair value measurements. If the carrying amount of the reporting unit exceeds its fair value, an impairment loss is recognized in an amount equal to that excess, limited to the total amount of goodwill allocated to that reporting unit. The Company recognizes its pro rata share of goodwill and any subsequent goodwill impairment losses recorded by entities that are proportionately consolidated.
The estimated cash flows used to assess the fair value of a reporting unit are derived from the Company’s current business plans, which are developed using short-term price forecasts reflective of the current price environment and management’s projections for long-term average metal prices. In addition to short- and long-term metal price assumptions, other assumptions include estimates of commodity-based and other input costs; capital investments; proven and probable mineral reserves estimates, including the timing and cost to develop and produce the reserves; value beyond proven and probable mineral reserve estimates; estimated future closure costs; the use of appropriate discount rates; and applicable U.S. dollar long-term exchange rates.
Impairment of Long-lived Assets
The Company reviews and evaluates its long-lived assets for impairment when events or changes in circumstances indicate that the related carrying amounts may not be recoverable. An impairment loss is measured and recorded based on the estimated fair value of the long-lived assets being tested for impairment, and their carrying amounts. Fair value is typically determined through the use of an income approach utilizing estimates of discounted pre-tax future cash flows or a market approach utilizing recent transaction activity for comparable properties. These approaches are considered Level 3 fair value measurements. Occasionally, such as when an asset is held for sale, market prices are used.
The estimated undiscounted cash flows used to assess recoverability of long-lived assets and to measure the fair value of the Company’s mining operations are derived from current business plans, which are developed using short-term price forecasts reflective of the current price environment and management’s projections for long-term average metal prices. In addition to short- and long-term metal price assumptions, other assumptions include estimates of commodity-based and other input costs; proven and probable mineral reserve estimates, including the timing and cost to develop and produce the reserves; value beyond proven and probable mineral reserve estimates; estimated future closure costs; and the use of appropriate discount rates.
In estimating undiscounted cash flows, assets are grouped at the lowest level for which there are identifiable cash flows that are largely independent of undiscounted cash flows from other asset groups. The Company’s estimates of undiscounted cash flows are based on numerous assumptions and it is possible that actual cash flows may differ significantly from estimates, as actual produced reserves, metal prices, commodity-based and other costs, and closure costs are each subject to significant risks and uncertainties.
Investments
Time Deposits
Time deposits with an original maturity of more than three months but less than one year are included within Investments. These time deposits are carried at amortized cost. Accrued interest is recorded in Other income (loss), net.
139

Table of Contents
NEWMONT CORPORATION
NOTES TO CONSOLIDATED FINANCIAL STATEMENTS
(dollars in millions, except per share, per ounce and per pound amounts)
Equity Method Investments
Management classifies investments at the acquisition date and re-evaluates the classification at each balance sheet date and when events or changes in circumstances indicate that there is a change in the Company’s ability to exercise significant influence. The ability to exercise significant influence is typically presumed when the Company possesses 20% or more of the voting interests in the investee. The Company accounts for its investments in stock of other entities over which the Company has significant influence, but not control, using the equity method of accounting. Under the equity method of accounting, the Company increases its investment for contributions made and records its proportionate share of net earnings, declared dividends and partnership distributions based on the most recently available financial statements of the investee. To the extent that there is a basis difference between the amount invested and the underlying equity in the net assets of an equity investment, the Company allocates such differences between tangible and intangible assets. This basis difference is being amortized into Equity income (loss) of affiliates over the remaining estimated useful lives of the underlying tangible and intangible net assets. The Company from time to time will elect the fair value option to account for its equity method investments if the fair value option better reflects the economics of its investment. Equity method investments accounted for under the fair value option are remeasured periodically with any changes in fair value recorded in Change in fair value of investments and options. Equity method investments are included in Investments and income (loss) from the Company's equity method investments is recognized in Equity income (loss) of affiliates.
Contributions made to equity method investees at times are in the form of loan agreements. Loans provided to equity method investees that are made based on the Company's proportionate ownership percentage are accounted for as “in-substance capital contributions” and are treated as an increase to the investment. Loans provided to equity method investees that are not made on a proportionate basis are accounted for as a loan receivable and do not increase the investment.
Distributions received are assessed under the cumulative earnings approach to determine if the receipt represents a return on capital or a return of capital. Return on capital distributions are recorded as an operating cash flow whereas return of capital distributions are recorded as an investing cash flow. Principal payments received on loans not treated as an in-substance capital contribution are accounted for as a reduction to the loan receivable and interest received is recorded as interest income.
The Company evaluates its equity method investments for potential impairment whenever events or changes in circumstances indicate that there is an other-than-temporary decline in the value of the investment. Declines in fair value that are deemed to be other-than-temporary are charged to Change in fair value of investments and options.
Marketable Equity, Debt, and Other Equity Securities
The Company has certain marketable equity and debt securities and other equity securities. Marketable equity securities are measured primarily at fair value with any changes in fair value recorded in Change in fair value of investments and options. Certain other equity securities are accounted for under the measurement alternative (cost less impairment, adjusted for any qualifying observable price changes) when fair value is not readily determinable. The Company accounts for its restricted marketable debt securities as available-for-sale securities. Unrealized gains and losses on available-for-sale investments, net of taxes, are reported as a component of Accumulated other comprehensive income (loss) in Total equity, unless an impairment is deemed to be credit-related. Credit-related impairment is recognized as an allowance for credit losses on the balance sheet with a corresponding charge to Change in fair value of investments and options.
Derivative Instruments
The Company holds derivatives for risk management purposes rather than for trading. The Company uses derivatives to mitigate uncertainty and volatility caused by underlying exposures to foreign exchange rates and energy prices. The fair values of all derivative instruments are recognized as assets or liabilities at the balance sheet date and are reported gross.
Financial instruments that meet the definition of a derivative, but are not designated for hedge accounting under ASC 815, are accounted for at fair value using derivative pricing models. Valuation models require a variety of inputs, including long term metal prices, life of mine production profiles, discount rates, and inflation assumptions. These instruments are subsequently remeasured to their fair value at each reporting date with the resulting gain or loss recognized in the Consolidated Statement of Operations.
Cash Flow Hedges
The fair value of derivative contracts qualifying as cash flow hedges are reflected as assets or liabilities in the Consolidated Balance Sheets. The changes in fair value of these hedges are deferred in Accumulated other comprehensive income (loss). Amounts deferred in Accumulated other comprehensive income (loss) are reclassified to income when the hedged transaction has occurred in the same income statement line where the earnings effect of the hedged item is presented. Cash transactions related to the Company’s derivative contracts accounted for as hedges are classified in the same category as the item being hedged in the Consolidated Statements of Cash Flows.
When derivative contracts qualifying as cash flow hedges are settled, accelerated or restructured before the maturity date of the contracts, the related amount in Accumulated other comprehensive income (loss) at the settlement date is deferred and reclassified to earnings, when the originally designated hedged transaction impacts earnings and is presented in the same income statement line
140

Table of Contents
NEWMONT CORPORATION
NOTES TO CONSOLIDATED FINANCIAL STATEMENTS
(dollars in millions, except per share, per ounce and per pound amounts)
item as the earnings effect of the hedged item, unless the underlying hedge transaction becomes probable of not occurring, at which time related amounts in Accumulated other comprehensive income (loss) are reclassified to earnings immediately.
Debt
The Company carries its senior notes at amortized cost. Debt issuance costs and debt premiums and discounts, which are included in Debt, are amortized using the effective interest method over the terms of the respective Senior Notes as a component of Interest expense, net of capitalized interest within the Consolidated Statements of Operations.
Gain or loss on extinguishment of debt is recorded as a component of Other income (loss), net upon the extinguishment of a debt instrument and is calculated as the difference between the reacquisition price and net carrying amount of the debt, which includes unamortized debt issuance costs. The Company evaluates all changes to its debt arrangements to determine whether the changes represent a modification or extinguishment to the old debt arrangement. If a debt instrument is deemed to be modified, the Company capitalizes all new lender fees and expenses all third-party fees. If it is determined that an extinguishment of one of the Company's debt instruments has occurred, the unamortized financing fees associated with the extinguished instrument are expensed. For the revolving loans, all lender and third-party fees are capitalized, and in the event an amendment reduces the committed capacity under the revolving loans, the Company will expense a portion of any unamortized fees on a pro-rata basis in proportion to the decrease in the committed capacity.
Indemnification Liabilities
The Company has provided certain indemnifications in connection with divestitures. The indemnifications contingently require the Company, as guarantor, to make payments to the guaranteed party and are initially measured at the greater of fair value or the contingent liability amount to be recognized in accordance with ASC 450 and are included in Other non-current liabilities. For indemnifications provided in sales agreements, a portion of the sale proceeds is allocated to the guarantee, which adjusts the gain or loss that would otherwise result from the transaction. The subsequent accounting for the liability depends on the nature of the underlying guarantee. Indemnification liabilities are reduced as the Company is released from risk under the guarantee. The recognition and measurement provisions of ASC 450 continue to apply to the contingent loss portion of the guarantee unless the guarantee is accounted for as a derivative.
Leases
The Company determines if a contractual arrangement represents or contains a lease at inception. Operating leases are included in Other non-current assets and Other current and non-current liabilities in the Consolidated Balance Sheets. Finance leases are included in Property, plant and mine development, net and current and non-current Lease and other financing obligations in the Consolidated Balance Sheets.
Operating and finance lease right-of-use ("ROU") assets and lease liabilities are recognized at the lease commencement date based on the present value of the future lease payments over the lease term. Leases acquired in a business combination are also measured based on the present value of the remaining leases payments, as if the acquired lease were a new lease at the acquisition date. When the rate implicit to the lease cannot be readily determined, the Company utilizes its incremental borrowing rate in determining the present value of the future lease payments. The incremental borrowing rate is derived from information available at the lease commencement date and represents the rate of interest that the Company would have to pay to borrow on a collateralized basis over a similar term and amount equal to the lease payments in a similar economic environment. The ROU asset includes any lease payments made and lease incentives received prior to the commencement date. Operating lease ROU assets also include any cumulative prepaid or accrued rent when the lease payments are uneven throughout the lease term. The ROU assets and lease liabilities may include options to extend or terminate the lease when it is reasonably certain that the Company will exercise that option.
The Company has lease arrangements that include both lease and non-lease components. The Company accounts for each separate lease component and its associated non-lease components as a single lease component for the majority of its asset classes. Additionally, for certain lease arrangements that involve leases of similar assets, the Company applies a portfolio approach to effectively account for the underlying ROU assets and lease liabilities.
Common Stock
Newmont filed a shelf registration statement on Form S-3 under which it can issue an indeterminate number or amount of common stock, preferred stock, debt securities, guarantees of debt securities and warrants from time to time at indeterminate prices, subject to the limitations of the Delaware General Corporation Law, the Company's certification of incorporation and bylaws. It also includes the ability to resell an indeterminate amount of common stock, preferred stock and debt securities from time to time upon exercise of warrants or conversion of convertible securities.
Treasury Stock
The Company records repurchases of common shares as Treasury stock at cost and records any subsequent retirements of treasury shares at cost. When treasury shares are retired, the Company’s policy is to allocate the excess of the repurchase price over
141

Table of Contents
NEWMONT CORPORATION
NOTES TO CONSOLIDATED FINANCIAL STATEMENTS
(dollars in millions, except per share, per ounce and per pound amounts)
the par value of shares acquired to both Retained earnings and Additional paid-in capital using settlement-date accounting. The portion allocated to Additional paid-in capital is calculated on a pro rata basis of the shares to be retired and the total shares issued and outstanding as of the date of the retirement.
Revenue Recognition
Newmont generates revenue by selling gold, copper, silver, lead, and zinc produced from its mining operations. Refer to Note 4 for further information regarding the Company’s operating segments.
The majority of the Company’s Sales come from the sale of refined gold; however, the end product at the Company’s gold operations is generally doré bars. Doré is an alloy consisting primarily of gold but also containing silver and other metals. Doré is sent to refiners to produce bullion that meets the required market standard of 99.95% gold. Under the terms of the Company’s refining agreements, the doré bars are refined for a fee, and the Company’s share of the refined gold and the separately-recovered silver is credited to its bullion account. Gold from doré bars credited to its bullion account is typically sold to banks or refiners.
A portion of gold sold from certain sites is sold in the form of concentrate. The Company’s Sales also come from the sale of copper, silver, lead, and zinc. Sales from these metals are generally in the form of concentrate, which is sold to smelters for further treatment and refining.
Generally, if a metal expected to be mined represents more than 10% to 20% of the life of mine sales value of all the metal expected to be mined, co-product accounting is applied. When the Company applies co-product accounting at an operation, revenue is recognized for each co-product metal sold, and shared costs applicable to sales are allocated based on the relative sales values of the co-product metals produced. Generally, if metal expected to be mined is less than the 10% to 20% of the life of mine sales value, by-product accounting is applied. Revenues from by-product sales, which are immaterial, are credited to Costs applicable to sales as a by-product credit. Silver, lead, and zinc are produced as co-products at Peñasquito; copper is produced as a co-product at Cadia, Boddington, and Red Chris. Aside from these co-product sales, copper and silver produced at other Newmont sites are by-product metals.
Gold Sales from Doré Production
The Company recognizes revenue for gold from doré production when it satisfies the performance obligation of transferring gold inventory to the customer, which generally occurs upon transfer of gold bullion credits as this is the point at which the customer obtains control and the ability to direct the use and obtains substantially all of the remaining benefits of ownership of the asset.
The Company generally recognizes the sale of gold bullion credits when the credits are delivered to the customer. The transaction price is determined based on the agreed upon market price and the number of ounces delivered. Payment is due upon delivery of gold bullion credits to the customer’s account.
Sales from Concentrate Production
The Company recognizes revenue for gold, copper, silver, lead, and zinc from concentrate production, net of treatment and refining charges, when it satisfies the performance obligation of transferring control of the concentrate to the customer. This generally occurs as material passes over the vessel's rail at the port of loading based on the date from the bill of lading, as the customer has the ability to direct the use of and obtain substantially all of the remaining benefits from the material and the customer has the risk of loss. Newmont has elected to account for shipping and handling costs for concentrate contracts as fulfillment activities and not as promised goods or services; therefore these activities are not considered separate performance obligations.
The Company generally sells metal concentrate based on the monthly average market price for a future month, dependent on the relevant contract, following the month in which the delivery to the customer takes place. The amount of revenue recognized for concentrates is initially recorded on a provisional basis based on the forward prices for the estimated month of settlement and the Company’s estimated metal quantities based on assay data. The Company’s sales based on a provisional price contain an embedded derivative that is required to be separated from the host contract for accounting purposes. The host contract is the receivable from the sale of the concentrates at the forward price at the time of sale. The embedded derivative, which is not designated for hedge accounting, is primarily marked to market through Sales each period prior to final settlement. The Company also adjusts estimated metal quantities used in computing provisional sales using new information and assay data from the smelter as it is received (if any).
A provisional payment is generally due upon delivery of the concentrate to the customer. Final payment is due upon final settlement of price and quantity with the customer.
The principal risks associated with recognition of sales on a provisional basis include metal price fluctuations and updated quantities between the date the sale is recorded and the date of final settlement. If a significant decline in metal prices occurs, or assay data results in a significant change in quantity between the provisional pricing date and the final settlement date, it is reasonably possible that the Company could be required to return a portion of the provisional payment received on the sale. Refer to Note 5 for additional information.
142

Table of Contents
NEWMONT CORPORATION
NOTES TO CONSOLIDATED FINANCIAL STATEMENTS
(dollars in millions, except per share, per ounce and per pound amounts)
Income and Mining Taxes
The Company accounts for income taxes using the liability method, recognizing certain temporary differences between the financial reporting basis of the Company’s liabilities and assets and the related income tax basis for such liabilities and assets. This method generates either a net deferred income tax liability or asset for the Company, as measured by the statutory tax rates in effect. The Company derives its deferred income tax charge or benefit by recording the change in either the net deferred income tax liability or asset balance for the year. The financial statement effects of changes in tax law are recorded as discrete items in the period enacted as part of income tax expense or benefit from continuing operations, regardless of the category of income or loss to which the deferred taxes relate. The Company determines if the assessment of a particular income tax effect is “complete.” Those effects for which the accounting is determined to be complete are reported in the enactment period financial statements. The Company has exposure to the impact of foreign exchange fluctuations on tax positions in certain jurisdictions, such movements are recorded within Income and mining tax benefit (expense) related to deferred income tax assets and liabilities, as well as non-current uncertain tax positions, while foreign exchange fluctuations impacting current tax positions are recorded within Other income (loss), net as foreign currency exchange gains (losses). With respect to the earnings that the Company derives from the operations of its consolidated subsidiaries, in those situations where the earnings are indefinitely reinvested, no deferred taxes have been provided on the unremitted earnings (including the excess of the carrying value of the net equity of such entities for financial reporting purposes over the tax basis of such equity) of these consolidated companies.
Mining taxes represent state and provincial taxes levied on mining operations and are classified as income taxes. As such, taxes are based on a percentage of mining profits.
Newmont’s operations are in multiple jurisdictions where uncertainties arise in the application of complex tax regulations. Some of these tax regimes are defined by contractual agreements with the local government, while others are defined by general tax laws and regulations. Newmont and its subsidiaries are subject to reviews of its income tax filings and other tax payments, and disputes can arise with the taxing authorities over the interpretation of its contracts or laws. The Company recognizes potential liabilities and records tax liabilities for anticipated tax audit issues in the U.S. and other tax jurisdictions based on its estimate of whether it is more likely than not, and the extent to which, additional taxes will be due. The Company adjusts these reserves in light of changing facts and circumstances; however, due to the complexity of some of these uncertainties, the ultimate resolution may result in a payment that is materially different from the Company’s current estimate of the tax liabilities. If the Company’s estimate of tax liabilities proves to be less than the ultimate assessment, an additional charge to expense would result. If the estimate of tax liabilities proves to be greater than the ultimate assessment, a tax benefit would result. The Company recognizes interest and penalties, if any, related to unrecognized tax benefits in Income and mining tax benefit (expense). In certain jurisdictions, Newmont must pay a portion of the disputed amount to the local government in order to formally appeal the assessment. Such payment is recorded as a receivable if Newmont believes the amount is collectible.
Valuation of Deferred Tax Assets
The Company’s deferred income tax assets include certain future tax benefits. The Company records a valuation allowance against any portion of those deferred income tax assets when it believes, based on the weight of available evidence, it is more likely than not that some portion or all of the deferred income tax asset will not be realized. The Company reviews the likelihood that it will realize the benefit of its deferred tax assets and therefore the need for valuation allowances on a quarterly basis, or more frequently if events indicate that a review is required. In determining the requirement for a valuation allowance, the historical and projected financial results of the legal entity or consolidated group recording the net deferred tax asset is considered, along with all other available positive and negative evidence.
Certain categories of evidence carry more weight in the analysis than others based upon the extent to which the evidence may be objectively verified. The Company looks to the nature and severity of cumulative pretax losses (if any) in the current three-year period ending on the evaluation date, recent pretax losses and/or expectations of future pretax losses. Other factors considered in the determination of the probability of the realization of the deferred tax assets include, but are not limited to:
•Earnings history;
•Projected future financial and taxable income based upon existing reserves and long-term estimates of commodity prices;
•The duration of statutory carry forward periods;
•Prudent and feasible tax planning strategies readily available that may alter the timing of reversal of the temporary difference;
•Nature of temporary differences and predictability of reversal patterns of existing temporary differences; and
•The sensitivity of future forecasted results to commodity prices and other factors.
Concluding that a valuation allowance is not required is difficult when there is significant negative evidence which is objective and verifiable, such as cumulative losses in recent years. The Company utilizes a rolling twelve quarters of pre-tax income or loss as a measure of its cumulative results in recent years. However, a cumulative three year loss is not solely determinative of the need for a valuation allowance. The Company also considers all other available positive and negative evidence in its analysis.
143

Table of Contents
NEWMONT CORPORATION
NOTES TO CONSOLIDATED FINANCIAL STATEMENTS
(dollars in millions, except per share, per ounce and per pound amounts)
Reclamation and Remediation Costs
Reclamation obligations associated with operating and non-operating mine sites are recognized when an obligation is incurred and the estimated costs can be reasonably measured. Fair value is measured as the present value of expected cash flow estimates, after considering inflation, the Company's credit-adjusted risk-free rates and a market risk premium appropriate for the Company's operations. The liability is accreted over time through periodic charges to earnings. In addition, the asset retirement cost is capitalized as part of the asset’s carrying value and amortized over the life of the related asset. Reclamation costs are periodically adjusted to reflect changes in the estimated present value resulting from the passage of time and revisions to the estimates of either the timing or amount of the reclamation costs. Changes in reclamation estimates at mines that are not currently operating, as the mine or portion of the mine site has entered the closure phase and has no substantive future economic value, are reflected in earnings in the period an estimate is revised. The estimated reclamation obligation is based on when spending for an existing disturbance is expected to occur. Costs included in estimated asset retirement obligations are discounted to their present value as cash flows are readily estimable over a period of up to fifty years. The Company reviews, on an annual basis, unless otherwise deemed necessary, the reclamation obligation at each mine site in accordance with ASC guidance for asset retirement obligations.
Remediation costs are accrued when it is probable that an obligation has been incurred and the cost can be reasonably estimated. Such cost estimates may include ongoing care, maintenance and monitoring costs. Changes in remediation estimates at operating and non-operating mines are reflected in earnings in the period an estimate is revised. Water treatment costs included in environmental remediation obligations are discounted to their present value as cash flows are readily estimable over a period up to fifty years.
Foreign Currency
The functional currency for the majority of the Company’s operations is the U.S. dollar. Transaction gains and losses related to foreign currency denominated monetary assets and liabilities where the functional currency is the U.S. dollar are remeasured at current exchange rates and the resulting adjustments are included in Other income (loss), net. The financial statements of the Company's foreign entities with functional currencies other than the U.S. dollar are translated into U.S. dollars with the resulting adjustments charged or credited directly to Accumulated other comprehensive income (loss) in Total equity. All assets and liabilities are translated into the U.S. dollar using exchange rates in effect at the balance sheet date, while revenues and expenses are translated at the weighted average exchange rates for the period. The gains or losses on foreign currency rates on cash holdings in foreign currencies are included in Effect of exchange rate changes on cash, cash equivalents and restricted cash in the Company’s Consolidated Statements of Cash Flows.
Stock-Based Compensation
The Company grants stock-based compensation awards to directors, executives and other eligible employees. Stock-based compensation awards currently issued and outstanding include RSUs, PSUs with a market-related condition, and PSUs with performance-related conditions. The market-related condition is based on the Company's total stockholder return relative to its peer group. The performance-related conditions include (i) representation of women on executive team, (ii) Scope 1 and 2 emission reductions related to key milestone projects, and (iii) return on capital employed.
The Company measures stock-based compensation awards at fair value on the date of the grant. The fair value of RSUs and PSUs with performance related conditions are based on the Newmont stock price on the date of grant. The fair value of PSUs with a market-related condition is determined using a Monte Carlo simulation model. Compensation expense related to all stock-based awards, including awards that cliff vest, is generally recognized on a straight-line basis over the requisite service period. For PSUs with performance-related conditions, the expense recognized may increase or decrease based on the probability that the performance conditions will be satisfied. The Company recognizes forfeitures as they occur. The Company's estimates may be impacted by certain variables including, but not limited to, stock price volatility, employee retirement eligibility dates, the Company's performance and related tax impacts.
Net Income (Loss) per Common Share
Basic and diluted income (loss) per share are presented for Net income (loss) attributable to Newmont stockholders. Basic income (loss) per common share is computed by dividing income (loss) available to Newmont common stockholders by the weighted average number of common shares outstanding during the period. Diluted income (loss) per common share is computed similarly except that weighted average common shares is increased to reflect all dilutive instruments, including employee stock awards. Dilutive securities are excluded from the calculation of diluted weighted average common shares outstanding if their effect would be anti-dilutive based on the treasury stock method or due to a net loss from continuing operations.
Discontinued Operations
The Company reports the results of operations of a business as discontinued operations if a disposal represents a strategic shift that has (or will have) a major effect on the Company’s operations and financial results when the business is classified as held for sale, in accordance with ASC 360, Property, Plant and Equipment and ASC 205-20, Presentation of Financial Statements - Discontinued Operations. Under ASC 360, assets may be classified as held for sale even though discontinued operations classification is not met.
144

Table of Contents
NEWMONT CORPORATION
NOTES TO CONSOLIDATED FINANCIAL STATEMENTS
(dollars in millions, except per share, per ounce and per pound amounts)
Equity method investments, which are specifically scoped out of ASC 360, can only be classified as held for sale if discontinued operations classification is also achieved. The results of discontinued operations are reported in Net income (loss) from discontinued operations, net of tax in the accompanying Consolidated Statements of Operations for current and prior periods, including any gain or loss recognized on closing or adjustment of the carrying amount to fair value less cost to sell.
Comprehensive Income (Loss)
In addition to Net income (loss), Comprehensive income (loss) includes all changes in equity during a period, such as adjustments to minimum pension liabilities, foreign currency translation adjustments, changes in fair value of derivative instruments that qualify as cash flow hedges and cumulative unrecognized changes in fair value of marketable debt securities classified as available-for-sale, except those resulting from investments by and distributions to owners.
Care and Maintenance
The Company incurs certain direct operating costs and depreciation and amortization costs when operations are temporarily halted and placed in care and maintenance. Direct operating costs incurred while operations are temporarily placed in care and maintenance are included in Other expense, net as these costs do not benefit the productive process and are not related to sales. Depreciation and amortization costs incurred while operations are temporarily placed in care and maintenance are included in Depreciation and amortization.
Reclassifications
Certain amounts and disclosures in prior years have been reclassified to conform to the 2025 presentation.
Recently Adopted Accounting Pronouncements and Securities and Exchange Commission Rules
Improvement to Income Tax Disclosures
In December 2023, ASU 2023-09 was issued, requiring disaggregated information about the effective tax rate reconciliation and additional information on taxes paid that meet a qualitative threshold. The Company adopted ASU 2023-09 for the year ended December 31, 2025 on a retrospective basis and included the required disclosures in Note 10. As this standard impacts presentation only, the adoption had no impact on the Company's financial position.
Derivatives Scope Refinements and Scope Clarification for Share-Based Noncash Consideration from a Customer in a Revenue Contract
In September 2025, ASU 2025-07 was issued expanding the scope of contracts that are excluded from derivative accounting and clarifying the accounting for share-based noncash consideration in revenue contracts. The new guidance is effective for annual reporting periods beginning after December 15, 2026, with early adoption permitted. The Company early adopted ASU 2025-07 on a modified retrospective basis on December 31, 2025 and applied the derivative accounting amendment in this ASU to certain contingent consideration assets and liabilities; the share-based noncash consideration in revenue contracts amendment had no impact on the Company. The early adoption had no impact on the Company's financial position; refer to Note 14 for further information.
Recently Issued Accounting Pronouncements and Securities and Exchange Commission Rules
Disaggregation of Income Statement Expenses
In November 2024, ASU 2024-03 was issued, requiring additional disclosures in the notes to the financial statements on the nature of certain expense captions presented on the face of the Consolidated Statement of Operations. The new guidance is effective for annual reporting periods beginning after December 15, 2026 and interim reporting periods beginning after December 15, 2027, with early adoption permitted. The Company is currently evaluating the impacts of the guidance on its Consolidated Financial Statements.
NOTE 3     ACQUISITIONS AND DIVESTITURES
Business Acquisition
On November 6, 2023 (the “acquisition date”), Newmont completed its business combination transaction with Newcrest, a public Australian mining company limited by shares, whereby Newmont, through Newmont Sub, acquired all of the ordinary shares of Newcrest, pursuant to a court-approved scheme of arrangement under Part 5.1 of the Australian Corporations Act 2001 (Cth) between Newcrest and its stockholders, as contemplated by a scheme implementation deed, dated as of May 15, 2023, by and among Newmont, Newmont Sub and Newcrest, as amended from time to time. Upon implementation, Newmont completed the business acquisition of Newcrest, in which Newmont was the acquirer and Newcrest became a direct wholly owned subsidiary of Newmont Sub and an indirect wholly owned subsidiary of Newmont (such acquisition, the “Newcrest transaction”). The acquisition of Newcrest increased the Company’s gold and other metal reserves and expanded its operating jurisdictions.
145

Table of Contents
NEWMONT CORPORATION
NOTES TO CONSOLIDATED FINANCIAL STATEMENTS
(dollars in millions, except per share, per ounce and per pound amounts)
The acquisition date fair value of the consideration transferred consisted of the following:
(in millions, except share and per share data)SharesPer SharePurchase Consideration
Stock Consideration
Shares of Newmont exchanged for Newcrest outstanding ordinary shares357,691,627 $37.88 $13,549 
Total Purchase Price$13,549 
The Company retained an independent appraiser to determine the fair value of assets acquired and liabilities assumed. In accordance with the acquisition method of accounting, the purchase price of Newcrest was allocated to the acquired assets and assumed liabilities based on their estimated acquisition date fair values. The fair value estimates were based on income, market and cost valuation methods. The excess of the total consideration over the estimated fair value of the amounts assigned to the identifiable assets acquired and liabilities assumed was recorded as goodwill, which is not deductible for income tax purposes. The goodwill balance is mainly attributable to: (i) the acquisition of existing operating mines with access to an assembled workforce that cannot be duplicated at the same costs by new entrants; (ii) operating synergies anticipated from the integration of the operations of Newmont and Newcrest; and (iii) the application of Newmont’s Full Potential program and potential strategic and financial benefits that include the increase in reserve base and opportunities to identify additional mineralization through exploration activities.
In 2024, the Company completed the analysis to assign fair values to all assets acquired and liabilities assumed. The following table summarizes the final purchase price allocation for the Newcrest transaction:
ASSETS
Cash and cash equivalents$668 
Trade receivables212 
Inventories723 
Stockpiles and ore on leach pads113 
Derivative assets42 
Other current assets193 
Current assets1,951 
Property, plant and mine development, net (1)
13,504 
Investments (2)
990 
Stockpiles and ore on leach pads (3)
219 
Deferred income tax assets (4)
75 
Goodwill (5)
2,401 
Derivative assets362 
Other non-current assets (6)
398 
Total assets19,900 
LIABILITIES
Accounts payable344 
Employee-related benefits143 
Lease and other financing obligations16 
Debt1,923 
Other current liabilities333 
Current liabilities2,759 
Debt (7)
1,373 
Lease and other financing obligations35 
Reclamation and remediation liabilities (8)
745 
Deferred income tax liabilities (4)
1,236 
Employee-related benefits192 
Other non-current liabilities11 
Total liabilities6,351 
Net assets acquired$13,549 
____________________________
(1)The fair value of property, plant and mine development is based on applying income, market, and cost valuation methods. Measurement period adjustments of $321 increased Property, plant and mine development, net, from the preliminary valuation primarily related to the Canadian, Lihir, and Telfer assets.
146

Table of Contents
NEWMONT CORPORATION
NOTES TO CONSOLIDATED FINANCIAL STATEMENTS
(dollars in millions, except per share, per ounce and per pound amounts)
(2)The fair value of the investments was determined by applying the market approach, based on quoted prices for the acquired investments.
(3)The fair value of stockpiles and ore on leach pads is based on applying the income valuation method. Measurement period adjustments of $85 increased Stockpiles and ore on leach pads from the preliminary valuation primarily relating to the valuation of stockpiles at Lihir.
(4)Deferred income tax assets and liabilities represent the future tax benefit or future tax expense associated with the differences between the fair value allocated to assets (excluding the majority of the goodwill balance) and liabilities and a tax basis increase to the fair value of the assets acquired in Australia and the historical carryover tax basis of assets and liabilities in all other jurisdictions. No deferred tax liability is recognized for the basis difference inherent in the fair value allocated to goodwill. Measurement period adjustments resulted in Deferred income tax assets decreasing by $114 and Deferred income tax liabilities decreasing by $95 from the preliminary valuation.
(5)Goodwill is attributable to the following reportable segments: $669 to Brucejack; $539 to Red Chris; $249 to Cadia; and $944 to Lihir. Measurement period adjustments resulted in an overall reduction to Goodwill of $343 from the preliminary valuation.
(6)Measurement period adjustments of $305 increased Other non-current assets from the preliminary valuation primarily due to the recognition of an intangible asset.
(7)The fair value of the Newcrest senior notes was measured using a market approach, based on quoted prices for the acquired debt.
(8)The fair value of reclamation and remediation liabilities is based on the expected amounts and timing of cash flows for closure activities and discounted to present value using a credit-adjusted risk-free rate as of the acquisition date. Key assumptions include the costs and timing of key closure activities based on the life of mine plans, including estimates and timing of monitoring and water management costs (if applicable) after the completion of initial closure activities. Measurement period adjustments of $352 increased Reclamation and remediation liabilities.
Sales and Net income (loss) attributable to Newmont stockholders in the Consolidated Statement of Operations includes Newcrest revenue of $944 and Newcrest net income of $136 from the acquisition date to December 31, 2023.
Pro Forma Financial Information (unaudited)
The following unaudited pro forma financial information presents consolidated results assuming the Newcrest transaction occurred on January 1, 2022.
December 31, 2023
Sales$15,432 
Net income (loss) attributable to Newmont stockholders (1)
$(1,991)
____________________________
(1)Includes $464 of Newcrest transaction and integration costs for the year ended December 31, 2023.
Divestitures
Based on a comprehensive review of the Company’s portfolio of assets following the Newcrest acquisition, the Company’s Board of Directors approved a portfolio optimization program to divest six non-core assets and a development project in February 2024. The non-core assets to be divested included Telfer, CC&V, Musselwhite, Éléonore, Porcupine, Akyem, and the Coffee development project in Canada. The Company presented these assets as held for sale in the first quarter of 2024 and recorded the assets at the lower of their carrying value or fair value, less costs to sell. These assets were periodically valued until sale occurred with any resulting gain or loss recognized in (Gain) loss on sale of assets held for sale.
The Company completed the sale of the assets of Telfer reportable segment in the fourth quarter of 2024, the sale of the CC&V, Musselwhite, and Éléonore reportable segments in the first quarter of 2025, the sale of the Porcupine and Akyem reportable segments in the second quarter 2025, and the sale of the Coffee development project in the fourth quarter of 2025 as part of its portfolio optimization program.
Gains or losses recognized on the completion of the sales are recognized in (Gain) loss on sale of assets held for sale. All sales agreements include transitional services support to be provided by the Company up to a one-year period following close. Gains and losses recognized on the completed sales during the years ended December 31, 2025 and 2024 are summarized in the table below; value of consideration received and indemnifications provided represent the value at the time of close.
147

Table of Contents
NEWMONT CORPORATION
NOTES TO CONSOLIDATED FINANCIAL STATEMENTS
(dollars in millions, except per share, per ounce and per pound amounts)
Telfer (1)
CC&VMusselwhiteÉléonorePorcupineAkyemCoffee ProjectTotal
Cash received, net of working capital adjustments (2)
$217 $109 $799 $784 $201 $888 $10 $3,008 
Deferred consideration received61 154 14 — 107 84 65 485 
Equity consideration242 — — — 233 — 80 555 
Option on equity consideration(67)— — — — — — (67)
Value of consideration received453 263 813 784 541 972 155 3,981 
Less: Carrying value of net assets divested(613)(196)(794)(612)(513)(270)(161)(3,159)
Less: Indemnification provided— (65)— — — (19)— (84)
Gain (loss) on completed sales (3)(4)
$(160)$2 $19 $172 $28 $683 $(6)$738 
____________________________
(1)Closed during the year ended December 31, 2024; all other divestments closed during the year ended December 31, 2025.
(2)Certain working capital adjustments are to be finalized over a defined period from the close of sale. Any resulting revisions will be settled in cash, with an offsetting impact recognized in (Gain) loss on sale of assets held for sale. Adjustments are not expected to be material.
(3)Recognized in (Gain) loss on sale of assets held for sale.
(4)Since designation as held for sale in the first quarter of 2024: CC&V incurred a total net loss of $15, including a gain of $2 for the year ended December 31, 2025; Porcupine incurred a total net loss of $358, including a $76 loss reversal and $28 gain recognized in the first and second quarter of 2025, respectively, resulting in a total gain of $104 recognized for the year ended December 31, 2025; Coffee incurred a total net loss of $161, including a $65 loss reversal and $6 loss recognized in the first and second quarter of 2025, respectively, resulting in a total gain of $59 recognized for the year ended December 31, 2025. Total net losses for CC&V, Porcupine, and Coffee include prior period write-downs; no prior period write-downs were incurred for Musselwhite, Éléonore, or Akyem.
Telfer. Sale of the assets of the Telfer reportable segment, including its 70% interest in the Havieron development project and other related assets, to Greatland Gold plc ("Greatland") closed on December 4, 2024 (the "Telfer Sale"). The deferred consideration consists of deferred payments of up to $100 tied to future Havieron production and gold price over a five-year period. The deferred payments do not meet the definition of a derivative and are considered to be a financial asset and are included in Other non-current assets. The equity consideration consisted of 134 million Greatland Resources Limited ("GRL") shares accounted for as an equity method investment for which the Company elected the fair value option. The equity consideration contains an option in which a third party has the ability to acquire 67 million of the Company's Greatland shares at a set price exercisable for four years, accounted for as a financial liability for which the Company elected the fair value option ("Greatland option"). The fair value option was elected for the equity consideration and related option as the Company believes it best reflects the economics of the underlying transaction.
In the second quarter of 2025, the Company sold 67 million shares for $274, reducing its ownership to 10%, resulting in a gain of $68 recognized in Change in fair value of investments and options for the year ended December 31, 2025. The remaining shares held were accounted for as marketable equity securities at December 31, 2025 and are included in current Investments.
In January 2026, the third party exercised the Greatland option resulting in extinguishment of the financial liability and sale of the remaining shares for $134.
CC&V. Sale of the CC&V reportable segment to SSR Mining Inc. ("SSR") closed on February 28, 2025. The deferred consideration consists of $175 receivable in two installments of $87.5 upon certain regulatory approvals. The deferred payments do not meet the definition of a derivative asset and are considered to be a financial asset and are included in Other non-current assets. The indemnification consists of a guarantee in which the Company will indemnify SSR for 90% of certain closure costs over $500 related to the Company’s historical mining activities with no limitation to the maximum potential future payments. The Company has an opportunity to fully settle the indemnification at certain milestones through a one-time lump sum payment. The indemnification is included in Other non-current liabilities.
Musselwhite. Sale of the Musselwhite reportable segment to Orla Mining Ltd ("Orla") closed on February 28, 2025. The deferred consideration consists of $40 receivable in two installments of $20 on the first and second year anniversary of the close date, dependent on the average spot gold price over the respective period. The deferred payments meet the definition of a derivative asset and are included as contingent consideration in Other current assets and Other non-current assets, respectively.
Éléonore. Sale of the Éléonore reportable segment to Dhilmar Ltd closed on February 28, 2025.
Porcupine. Sale of the Porcupine reportable segment to Discovery Silver Corp. ("Discovery") closed on April 15, 2025. The deferred consideration consists of $150 to be received in four equal annual installments beginning December 31, 2027. The deferred consideration is classified as a note receivable and is included in Other non-current assets. The equity consideration consisted of Discovery shares, which were accounted for as marketable equity securities and fully divested in the third quarter of 2025.
148

Table of Contents
NEWMONT CORPORATION
NOTES TO CONSOLIDATED FINANCIAL STATEMENTS
(dollars in millions, except per share, per ounce and per pound amounts)
Akyem. Sale of the Akyem reportable segment to Zijin Mining Group Co., Ltd ("Zijin") closed on April 15, 2025. The deferred consideration consisted of $100 receivable at the earlier of lease ratification or the fifth year anniversary of the close date. The deferred consideration did not meet the definition of a derivative asset and was considered a financial asset and included in Other non-current assets. The indemnification consisted of a guarantee in which the Company would have indemnified Zijin for losses from non-ratification of the lease by the Ghanaian Parliament, government actions stopping operations, or required renegotiations to secure ratification, with a cap of $200 and a 5-year claim period. In the third quarter of 2025, the lease was ratified resulting in receipt of the deferred consideration and removal of the indemnification obligation resulting in a gain of $35 recognized in (Gain) loss on sale of assets held for sale.
Coffee. Sale of the Coffee development project to Fuerte Metals Corporation ("Fuerte") closed on October 17, 2025. The deferred consideration consists of a royalty equal to 3% of the NSR from Coffee. The deferred consideration does not meet the definition of a derivative and is considered to be a financial asset and is included in Other non-current assets. The equity consideration consisted of 34 million Fuerte shares, which was accounted for as an equity method investment for which the Company elected the fair value option as the Company believed it best reflected the economics of the underlying transaction. In the fourth quarter of 2025, the Company sold a portion of its Fuerte shares reducing its ownership to 19%. The remaining shares held are accounted for as marketable equity securities at December 31, 2025 and are included in Investments.
For the year ended December 31, 2025 and 2024, (Gain) loss on sale of assets held for sale consistent of the following:
Year Ended December 31,
20252024
(Gain) loss on completed sales$(898)$160 
(Reversal of write-downs) write-downs on assets classified as held for sale(141)699 
Tax impact (1)
(46)255 
Other (2)
19 — 
$(1,066)$1,114 
____________________________
(1)In 2024, a tax impact on write-downs of assets held for sale resulted in the establishment of a deferred tax asset, which increased the respective carrying values of the related disposal groups and resulted in an additional loss. In 2025, a tax impact on the reversal of prior write-downs of assets held for sale resulted in the reduction to the deferred tax asset, which decreased the respective carrying values of the related disposal group and resulted in an additional gain.
(2)Primarily consists of the impact of finalization of certain working capital adjustments on completed sales, and certain costs incurred under the transitional services support agreements.
The following table presents the carrying value of the major classes of assets and liabilities held for sale by disposal group as of December 31, 2024, prior to recognition of the write-down of $699 for the year ended December 31, 2024. All disposal groups were divested as of December 31, 2025.
CC&V
Musselwhite
Éléonore
Porcupine
Akyem
Coffee Project (1)
Total
Assets held for sale:
Property, plant and mine development, net$170 $1,063 $785 $1,541 $559 $321 $4,439 
Other assets408 39 70 93 258 1 869 
Carrying value of assets held for sale$578 $1,102 $855 $1,634 $817 $322 $5,308 
Liabilities held for sale:
Reclamation and remediation liabilities$334 $82 $87 $563 $427 $3 $1,496 
Other liabilities37 257 71 223 91 2 681 
Carrying value of liabilities held for sale$371 $339 $158 $786 $518 $5 $2,177 
____________________________
(1)The Coffee Project is included in the non-operating segment Corporate and Other in Note 4.
NOTE 4     SEGMENT INFORMATION
The Company regularly reviews its segment reporting for alignment with its strategic goals and operational structure as well as for evaluation of business performance and allocation of resources by Newmont’s Chief Operating Decision Maker ("CODM"), which is the Chief Executive Officer. The Company's 13 reportable segments consist of each of its 12 mining operations that it manages and its 38.5% proportionate interest in Nevada Gold Mines ("NGM"), which it does not directly manage. The reportable segments at December 31, 2025 exclude reportable segments that have been divested. Refer to Note 3 for further information on the Company's divestitures.
149

Table of Contents
NEWMONT CORPORATION
NOTES TO CONSOLIDATED FINANCIAL STATEMENTS
(dollars in millions, except per share, per ounce and per pound amounts)
With respect to NGM, Newmont has given notice to Barrick and the NGM Board of Managers that it has identified evidence of mismanagement at NGM, including diversion of resources from NGM to the benefit of Barrick’s wholly-owned property Fourmile and Barrick, and that it was exercising its contractual inspection and audit rights.
In October 2025, the Company declared commercial production at its Ahafo North project in Ghana resulting in classification as a reportable segment. Prior to declaration of commercial production, Ahafo North was classified as a development project and all activity was included in the Ahafo South reportable segment up to the date of commercial production. Although not a reportable segment until the fourth quarter of 2025, the amounts related to Ahafo North have been reported separately for comparability purposes.
In the following tables, Income (loss) before income and mining tax and other items from reportable segments does not reflect general corporate expenses, interest (except project-specific interest), or income and mining taxes. Intercompany revenue and expense amounts have been eliminated within each segment in order to report on the basis that management uses internally for evaluating segment performance. The Company's business activities and operating segments that are not considered reportable, including all equity method investments, are reported in the non-operating segment Corporate and Other, which has been provided for reconciliation purposes.
The CODM uses Income (loss) before income and mining tax and other items to evaluate income generated from segment assets in deciding whether to reinvest profits into the mine operation or reallocate for other capital priorities under the Company's capital allocation strategy. Additionally, the CODM primarily uses this metric to assess performance of the segment, plan and forecast future business operations, and benchmark to competitors.
150

Table of Contents
NEWMONT CORPORATION
NOTES TO CONSOLIDATED FINANCIAL STATEMENTS
(dollars in millions, except per share, per ounce and per pound amounts)
The financial information relating to the Company’s segments is as follows:
Year Ended December 31, 2025SalesCosts Applicable to SalesDepreciation and AmortizationReclamation and RemediationAdvanced Projects, Research and Development and Exploration
Other Segment Expenses (Income) (1)
Income (Loss) before Income and Mining Tax and Other ItemsTotal Assets
Capital Expenditures (2)
Managed
Lihir$1,983 $755 $188 $13 $10 $18 $999 $5,805 $148 
Cadia:
Gold1,409 324 125 
Copper885 301 120 
Total Cadia2,294 625 245 5 13 47 1,359 6,646 597 
Tanami1,353 429 124 3 10 26 761 2,734 571 
Boddington:
Gold1,988 685 128 
Copper258 127 24 
Total Boddington2,246 812 152 16 5 27 1,234 2,499 145 
Ahafo South (3)
2,266 825 185 7 48 (9)1,210 1,602 168 
Ahafo North (3)
242 31 10 — 7 (29)223 1,191 321 
Merian846 373 76 5 39 — 353 927 58 
Cerro Negro691 312 124 6 25 24 200 1,868 150 
Yanacocha1,804 411 113 (13)12 784 497 2,322 21 
Peñasquito:
Gold1,492 389 161 
Silver1,080 334 131 
Lead183 116 46 
Zinc664 423 152 
Total Peñasquito3,419 1,262 490 22 17 61 1,567 4,744 123 
Red Chris
Gold218 82 24 
Copper295 169 50 
Total Red Chris513 251 74 9 11 1 167 2,668 157 
Brucejack824 344 182 5 19 7 267 2,630 104 
Non-managed
NGM3,560 1,343 478 12 21 9 1,697 7,486 387 
Total Reportable Segments22,041 7,773 2,441 90 237 966 10,534 43,122 2,950 
Corporate and Other (4)
— — 74 144 169 (48)(339)13,999 23 
Divested (5)
CC&V88 39 2 2 — (3)48 — 5 
Musselwhite94 33 — 1 — (18)78 — 14 
Porcupine177 79 1 6 1 20 70 — 54 
Éléonore138 54 — 1 2 (171)252 — 12 
Akyem131 107 3 5 — (683)699 — 9 
Consolidated$22,669 $8,085 $2,521 $249 $409 $63 $11,342 $57,121 $3,067 
____________________________
(1)Other Segment Expenses (Income) for all reportable segments includes (Gain) loss on sale of assets held for sale, Impairment charges, Other expense, net, and Other income (loss), net. Refer to Notes 3, 7, 8, and 9, respectively, for further information. Additionally, Other Segment Expenses (Income) includes General and administrative, Change in fair value of investments and options, and Interest expense, net of capitalized interest, which are primarily incurred at the non-operating segment Corporate and Other.
(2)Includes an increase in non-cash adjustments of $32, primarily comprised of the change in accrued capital expenditures. Consolidated capital expenditures on a cash basis were $3,035.
(3)In the fourth quarter of 2025, the Ahafo North development project achieved commercial production resulting in designation as a reportable segment. Prior to declaration of commercial production, Ahafo North was classified as a development project and all activity was included in the Ahafo South reportable segment. Although not a reportable segment until the fourth quarter of 2025, the amounts related to Ahafo North have been reported separately for comparability purposes.
(4)Included the Coffee development project, which was divested in the fourth quarter of 2025. Refer to Note 3 for information on the Company's divestitures.
(5)Refer to Note 3 for information on the Company's divestitures.
151

Table of Contents
NEWMONT CORPORATION
NOTES TO CONSOLIDATED FINANCIAL STATEMENTS
(dollars in millions, except per share, per ounce and per pound amounts)
Year Ended December 31, 2024SalesCosts Applicable to SalesDepreciation and Amortization
Reclamation and Remediation
Advanced Projects, Research and Development and Exploration
Other Segment Expenses (Income) (1)
Income (Loss) before Income and Mining Tax and Other ItemsTotal Assets
Capital Expenditures (2)
Managed
Lihir$1,473 $787 $168 $12 $16 $21 $469 $5,625 $193 
Cadia
Gold1,118 297 119 
Copper743 280 123 
Total Cadia1,861 577 242 5 19 (23)1,041 6,208 537 
Tanami988 390 123 2 28 (19)464 2,236 437 
Boddington:
Gold1,417 613 112 
Copper329 204 39 
Total Boddington1,746 817 151 13 4 (23)784 2,420 129 
Ahafo South (3)
1,923 722 215 8 32 (38)984 2,674 127 
Ahafo North (3)
— — — — 9 — (9)751 255 
Merian660 401 84 4 21 (1)151 943 81 
Cerro Negro566 312 123 5 19 13 94 1,787 186 
Yanacocha841 353 98 55 9 2 324 1,932 61 
Peñasquito:
Gold713 225 103 
Silver792 360 159 
Lead195 116 52 
Zinc622 427 162 
Total Peñasquito2,322 1,128 476 20 13 43 642 4,879 129 
Red Chris
Gold96 47 14 
Copper229 172 52 
Total Red Chris325 219 66 7 13 (2)22 2,580 150 
Brucejack610 312 172 5 13 — 108 2,660 70 
Non-managed
NGM2,485 1,263 428 11 23 32 728 7,430 448 
Held for sale (4)
CC&V347 200 13 11 7 19 97 561 26 
Musselwhite516 224 18 3 6 — 265 1,102 97 
Porcupine673 310 36 27 6 633 (339)1,172 201 
Éléonore583 325 21 4 11 (2)224 855 100 
Akyem495 338 57 14 5 (5)86 817 24 
Total Reportable Segments18,414 8,678 2,491 206 254 650 6,135 46,632 3,251 
Corporate and Other— — 68 109 195 967 (1,339)9,717 22 
Divested (4)
Telfer
Gold242 245 14 
Copper26 40 3 
Total Telfer268 285 17 13 14 158 (219)— 51 
Consolidated$18,682 $8,963 $2,576 $328 $463 $1,775 $4,577 $56,349 $3,324 
____________________________
(1)Other Segment Expenses (Income) for all reportable segments includes (Gain) loss on sale of assets held for sale, Impairment charges, Other expense, net, and Other income (loss), net. Refer to Notes 3, 7, 8, and 9, respectively, for further information. Additionally, Other Segment Expenses (Income) includes General and administrative, Change in fair value of investments and options, and Interest expense, net of capitalized interest which are primarily incurred at the non-operating segment Corporate and Other.
(2)Includes a decrease in non-cash adjustments of $78, primarily comprised of the change in accrued capital expenditures. Consolidated capital expenditures on a cash basis were $3,402.
(3)In the fourth quarter of 2025, the Ahafo North development project achieved commercial production resulting in designation as a reportable segment. Prior to declaration of commercial production, Ahafo North was classified as a development project and all activity was included in the Ahafo South reportable segment. Although not a reportable segment until the fourth quarter of 2025, the amounts related to Ahafo North have been reported separately for comparability purposes.
152

Table of Contents
NEWMONT CORPORATION
NOTES TO CONSOLIDATED FINANCIAL STATEMENTS
(dollars in millions, except per share, per ounce and per pound amounts)
(4)Refer to Note 3 for information on the Company's divestitures.
Year Ended December 31, 2023SalesCosts Applicable to SalesDepreciation and Amortization
Reclamation and Remediation
Advanced Projects, Research and Development and Exploration
Other Segment Expenses (Income) (1)
Income (Loss) before Income and Mining Tax and Other ItemsTotal Assets
Capital Expenditures (2)
Managed
Lihir (3)
$266 $146 $20 $— $2 $5 $93 $3,909 $53 
Cadia: (3)
Gold250 129 16 
Copper172 116 14 
Total Cadia422 245 30 — 2 (13)158 6,351 75 
Tanami867 337 110 2 30 (19)407 1,896 413 
Boddington:
Gold1,451 634 108 
Copper363 204 35 
Total Boddington1,814 838 143 12 6 4 811 2,376 164 
Telfer: (3)
Gold135 126 6 
Copper17 22 1 
Total Telfer152 148 7 1 4 2 (10)574 9 
Ahafo South (4)
1,130 547 181 7 31 (14)378 2,307 139 
Ahafo North (4)
— — — — 9 — (9)516 171 
Akyem574 275 122 12 19 (5)151 1,069 40 
Merian625 385 82 3 23 10 122 927 84 
Cerro Negro510 328 137 4 10 16 15 1,646 162 
Porcupine503 301 117 18 17 5 45 1,473 166 
Éléonore453 295 101 3 10 247 (203)777 106 
Yanacocha537 294 85 1,232 11 (15)(1,070)2,117 312 
Musselwhite351 214 80 3 10 298 (254)1,018 104 
Peñasquito: (5)
Gold257 158 67 
Silver335 300 134 
Lead96 98 45 
Zinc213 253 105 
Total Peñasquito901 809 351 18 11 1,523 (1,811)4,738 113 
CC&V332 198 23 12 13 4 82 383 64 
Red Chris: (3)
Gold9 4 1 
Copper23 17 3 
Total Red Chris32 21 4 — — (1)8 2,178 25 
Brucejack (3)
72 69 22 — 7 — (26)4,006 22 
Non-managed
NGM2,271 1,249 452 11 29 98 432 7,401 472 
Total Reportable Segments11,812 6,699 2,067 1,338 244 2,145 (681)45,662 2,694 
Corporate and Other— — 41 195 221 893 (1,350)9,844 51 
Consolidated$11,812 $6,699 $2,108 $1,533 $465 $3,038 $(2,031)$55,506 $2,745 
____________________________
(1)Other Segment Expenses (Income) for all reportable segments includes Impairment charges, Other expense, net, and Other income (loss), net. Refer to Notes 7, 8, and 9, respectively, for more information. Additionally, Other Segment Expenses (Income) includes General and administrative, Change in fair value of investments and options, and Interest expense, net of capitalized interest which are primarily incurred at the non-operating segment Corporate and Other.
(2)Includes an increase in non-cash adjustments of $79, primarily comprised of the change in accrued capital expenditures. Consolidated capital expenditures on a cash basis were $2,666.
(3)Sites acquired through the Newcrest transaction. Refer to Note 3 for further information.
(4)In the fourth quarter of 2025, the Ahafo North development project achieved commercial production resulting in designation as a reportable segment. Prior to declaration of commercial production, Ahafo North was classified as a development project and all activity was included in the
153

Table of Contents
NEWMONT CORPORATION
NOTES TO CONSOLIDATED FINANCIAL STATEMENTS
(dollars in millions, except per share, per ounce and per pound amounts)
Ahafo South reportable segment. Although not a reportable segment until the fourth quarter of 2025, the amounts related to Ahafo North have been reported separately for comparability purposes.
(5)In June 2023, the National Union of Mine and Metal Workers of the Mexican Republic (the "Union") notified the Company of a strike action. In response to the strike notice, the Company suspended operations at Peñasquito. The Company reached an agreement with the Union and operations at Peñasquito resumed in the fourth quarter of 2023.
Long-lived assets, which consist of Property, plant and mine development, net, non-current Stockpiles and ore on leach pads, and non-current right-of-use assets, included in Other non-current assets, were as follows:
At December 31,
20252024
Australia$10,393 $9,490 
United States (1)
6,566 7,125 
Canada (1)
4,625 8,358 
Papua New Guinea4,614 4,514 
Mexico3,606 3,822 
Ghana (1)
2,406 2,755 
Argentina1,604 1,582 
Peru1,269 2,203 
Suriname702 726 
Other18 27 
$35,803 $40,602 
____________________________
(1)Canada, United States, and Ghana include $3,723, $434, and $565, respectively, of long-lived assets included in Assets held for sale at December 31, 2024. Refer to Note 3 for additional information.
154

Table of Contents
NEWMONT CORPORATION
NOTES TO CONSOLIDATED FINANCIAL STATEMENTS
(dollars in millions, except per share, per ounce and per pound amounts)
NOTE 5     SALES
The following tables present the Company’s Sales by mining operation, product and inventory type:
Year Ended December 31, 2025Year Ended December 31, 2024Year Ended December 31, 2023
Gold Doré
Concentrate and Other
Total Sales
Gold Doré
Concentrate and Other
Total Sales
Gold Doré
Concentrate and Other
Total Sales
Managed
Lihir (1)
$1,983 $— $1,983 $1,473 $— $1,473 $266 $— $266 
Cadia: (1)
Gold150 1,259 1,409 126 992 1,118 28 222 250 
Copper— 885 885 — 743 743 — 172 172 
Total Cadia150 2,144 2,294 126 1,735 1,861 28 394 422 
Tanami1,353 — 1,353 988 — 988 867 — 867 
Boddington:
Gold488 1,500 1,988 353 1,064 1,417 359 1,092 1,451 
Copper— 258 258 — 329 329 — 363 363 
Total Boddington488 1,758 2,246 353 1,393 1,746 359 1,455 1,814 
Ahafo South
2,266 — 2,266 1,923 — 1,923 1,130 — 1,130 
Ahafo North (2)
242 — 242 — — — — — — 
Merian821 25 846 638 22 660 600 25 625 
Cerro Negro 691 — 691 566 — 566 510 — 510 
Yanacocha1,781 23 1,804 833 8 841 526 11 537 
Peñasquito:
Gold— 1,492 1,492 — 713 713 36 221 257 
Silver (3)
— 1,080 1,080 — 792 792 — 335 335 
Lead— 183 183 — 195 195 — 96 96 
Zinc— 664 664 — 622 622 — 213 213 
Total Peñasquito— 3,419 3,419 — 2,322 2,322 36 865 901 
Red Chris: (1)
Gold— 218 218 — 96 96 — 9 9 
Copper— 295 295 — 229 229 — 23 23 
Total Red Chris— 513 513 — 325 325 — 32 32 
Brucejack (1)
540 284 824 415 195 610 48 24 72 
Non-managed
NGM (4)
3,387 173 3,560 2,336 149 2,485 2,178 93 2,271 
Divested (5)
CC&V88 — 88 347 — 347 332 — 332 
Musselwhite 94 — 94 516 — 516 351 — 351 
Porcupine 177 — 177 673 — 673 503 — 503 
Éléonore 138 — 138 583 — 583 453 — 453 
Akyem131 — 131 495 — 495 574 — 574 
Telfer: (1)
Gold— — — 47 195 242 20 115 135 
Copper— — — — 26 26 — 17 17 
Total Telfer— — — 47 221 268 20 132 152 
Consolidated$14,330 $8,339 $22,669 $12,312 $6,370 $18,682 $8,781 $3,031 $11,812 
____________________________
(1)Sites acquired through the Newcrest transaction. Refer to Note 3 for further information.
(2)In October 2025, the Company declared commercial production at its Ahafo North project in Ghana resulting in classification as a reportable segment.
(3)Silver sales from concentrate includes $84, $91, and $42 related to non-cash amortization of the silver streaming agreement liability for the years ended December 31, 2025, 2024, and 2023, respectively.
(4)The Company purchases its proportionate share of gold doré from NGM for resale to third parties. Gold doré purchases from NGM totaled $3,410, $2,338, and $2,174 for the years ended December 31, 2025, 2024, and 2023, respectively.
155

Table of Contents
NEWMONT CORPORATION
NOTES TO CONSOLIDATED FINANCIAL STATEMENTS
(dollars in millions, except per share, per ounce and per pound amounts)
(5)The Company completed the sale of Telfer in the fourth quarter of 2024, CC&V, Musselwhite, and Éléonore in the first quarter of 2025, and Porcupine and Akyem in the second quarter of 2025. Refer to Note 3 for information on the Company's divestitures.
Trade Receivables and Provisional Sales
At December 31, 2025 and December 31, 2024, Trade receivables primarily consisted of sales from provisionally priced concentrate and other production. Changes in pricing on provisional sales resulted in an increase to Sales of $572, $125, and $37 for the years ended December 31, 2025, 2024, and 2023, respectively.
At December 31, 2025, Newmont had the following provisionally priced concentrate sales subject to final pricing over the next several months:
Provisionally Priced Sales
Subject to Final Pricing (1)
Average Provisional
Price (per ounce/pound)
Gold (ounces, in thousands)141 $4,332 
Copper (pounds, in millions)66 $5.65 
Silver (ounces, in millions)7 $70.31 
Lead (pounds, in millions)48 $0.90 
Zinc (pounds, in millions)84 $1.41 
____________________________
(1)Includes provisionally priced by-product sales subject to final pricing, which are recognized in Costs applicable to sales.
Silver Streaming Agreement
The Company is obligated to sell 25% of silver production from the Peñasquito mine to Wheaton Precious Metals Corporation at the lesser of market price or a fixed contract price, subject to an annual inflation adjustment of up to 1.65%. This agreement contains off-market terms and was initially recognized at its acquisition date fair value as a finite-lived intangible liability. The current and non-current portion are recorded to Other current liabilities and Silver streaming agreement, respectively. The Company’s policy is to amortize the liability into Sales each period using the units-of-production method. During the years ended December 31, 2025, 2024, and 2023, the Company amortized $84, $91, and $42, respectively, of the liability into revenue. At December 31, 2025 and 2024, the value of the liability included in the Consolidated Balance Sheet was $691 and $775, respectively.
Revenue by Geographic Area
Newmont primarily conducts metal sales in U.S. dollars, and therefore Sales are not exposed to fluctuations in foreign currencies. Revenues from sales attributed to countries based on the location of the customer were as follows:
Year Ended December 31,
202520242023
United Kingdom (1)
$13,068 $10,966 $7,637 
South Korea3,196 1,956 975 
Japan2,002 1,920 512 
China1,411 318 102 
Australia803 409 376 
Mexico
639 600 240 
Switzerland89 638 600 
Philippines82 709 451 
United States— 2 48 
Other1,379 1,164 871 
$22,669 $18,682 $11,812 
____________________________
(1)Includes $84, $91, and $42 related to non-cash amortization of the silver streaming agreement liability for the years ended December 31, 2025, 2024, and 2023, respectively.
Revenue by Major Customer
As gold can be sold through numerous gold market traders worldwide, the Company is not economically dependent on a limited number of customers for the sale of its product. The Company sells copper, silver, lead, and zinc predominantly in the form of concentrates. The concentrates are sold under a combination of short-term and long-term supply contracts with processing fees based on the demand for these concentrates in the global marketplace.
156

Table of Contents
NEWMONT CORPORATION
NOTES TO CONSOLIDATED FINANCIAL STATEMENTS
(dollars in millions, except per share, per ounce and per pound amounts)
Customers with revenue in excess of 10% of total Sales consisted of the following:
Year Ended December 31,
202520242023
Standard Chartered
$6,009 27 %$4,833 26 %$1,659 14 %
JPMorgan Chase
$2,499 11 %$2,317 12 %$2,583 22 %
Royal Bank of Canada
*
*$1,897 10 %$1,765 15 %
Toronto Dominion Bank
****$1,630 14 %
____________________________
*Sales during the year did not meet the 10% disaggregation threshold.
NOTE 6     RECLAMATION AND REMEDIATION
The Company’s mining and exploration activities are subject to various domestic and international laws and regulations governing the protection of the environment. These laws and regulations are continually changing and are generally becoming more restrictive. The Company conducts its operations to protect public health and the environment and believes its operations are in compliance with applicable laws and regulations in all material respects. The Company has made, and expects to make in the future, expenditures to comply with such laws and regulations, but cannot predict the full amount of such future expenditures. Estimated future reclamation and remediation costs are based principally on current legal and regulatory requirements.
The Company’s Reclamation and remediation expense consisted of:
Year Ended December 31,
202520242023
Reclamation adjustments and other$(172)$(108)$1,207 
Reclamation accretion307 365 238 
Reclamation expense135 257 1,445 
Remediation adjustments and other107 64 81 
Remediation accretion7 7 7 
Remediation expense114 71 88 
Reclamation and remediation$249 $328 $1,533 
In 2025 and 2024, reclamation adjustments were primarily due to a $192 and a $136 decrease, respectively, at portions of the Yanacocha site that are no longer in production and with no expected substantive economic value (i.e., non-operating) as a result of updated cost estimates. In 2023, reclamation adjustments were primarily due to increased water management costs at non-operating portions of the Yanacocha site, which resulted in an increase of $1,101.
In 2025, remediation adjustments were primarily related to higher water management costs and project execution delays at the Midnite Mine, updated regulatory compliance requirements at Mt. Leyshon, and various other environmental projects at non-operating sites, all of which are included in the non-operating segment Corporate and Other. In 2024, remediation adjustments were primarily due to the completion of haul road safety enhancements, continued clean up of contaminated materials, and closure of the three mine portals at the Ross Adams mine, included in the non-operating segment Corporate and Other. In 2023, remediation adjustments are primarily due to higher water management costs and project execution delays at the Midnite mine and Dawn mill sites, included in the non-operating segment Corporate and Other.
157

Table of Contents
NEWMONT CORPORATION
NOTES TO CONSOLIDATED FINANCIAL STATEMENTS
(dollars in millions, except per share, per ounce and per pound amounts)
The following are reconciliations of Reclamation and remediation liabilities:
ReclamationRemediationTotal
Balance at January 1, 2024
$8,385 $401 $8,786 
Additions, changes in estimates and other41 44 85 
Acquisitions and divestitures (1)
71 — 71 
Payments, net(351)(82)(433)
Accretion expense365 7 372 
Reclassification to Liabilities held for sale
(1,496)— (1,496)
Balance at December 31, 2024
7,015 370 7,385 
Additions, changes in estimates and other (2)
223 84 307 
Acquisitions and divestitures(13)— (13)
Payments, net(732)(71)(803)
Accretion expense307 7 314 
Balance at December 31, 2025
$6,800 $390 $7,190 
At December 31,
20252024
ReclamationRemediationTotalReclamationRemediationTotal
Current (3)
$829 $64 $893 $928 $63 $991 
Non-current (4)
5,971 326 6,297 6,087 307 6,394 
Total (5)
$6,800 $390 $7,190 $7,015 $370 $7,385 
____________________________
(1)During 2024, measurement period adjustments of $349 increased Reclamation and remediation liabilities from refinements to the preliminary valuation of the Newcrest sites. These adjustments were partially offset by $278 as a result of the sale of the assets of the Telfer reportable segment in the fourth quarter of 2024.
(2)Reclamation adjustments during 2025 primarily relate to increased cost estimates at Peñasquito resulting from updated risk assessments and the identification of additional uncertainties regarding long-term tailings storage facility embankment stability, partially offset by a reduction in cost estimates at Yanacocha following the completion of several closure related studies.
(3)The current portion of reclamation and remediation liabilities are included in Other current liabilities; refer to Note 22 for further information.
(4)The non-current portion of reclamation and remediation liabilities are included in Reclamation and remediation liabilities.
(5)Total reclamation liabilities includes $3,906 and $4,546 related to Yanacocha at December 31, 2025 and 2024, respectively.
The Company is also involved in several matters concerning environmental remediation obligations associated with former, primarily historic, mining activities. Generally, these matters concern developing and implementing remediation plans at the various sites involved. Depending upon the ultimate resolution of these matters, the Company believes that it is reasonably possible that the liability for these matters could be as much as 50% greater or 10% lower than the amount accrued at December 31, 2025. The amounts accrued are reviewed periodically based upon facts and circumstances available at the time. Changes in estimates are included in Other current liabilities and Reclamation and remediation liabilities in the period estimates are revised.
Included in Assets held for sale at December 31, 2024 is $93 of restricted cash held for purposes of settling reclamation and remediation obligations at Akyem.
Included in Other non-current assets at December 31, 2025 and 2024 are $33 and $29 respectively, of non-current restricted cash held for purposes of settling reclamation and remediation obligations. The amounts at December 31, 2025 and 2024 primarily relate to Ahafo South and San Jose Reservoir at Yanacocha.
Included in Other non-current assets at December 31, 2025 and 2024 was $13 and $15, respectively, of non-current restricted investments, which are legally pledged for purposes of settling reclamation and remediation obligations. The amounts at December 31, 2025 and 2024 primarily relate to the San Jose Reservoir at Yanacocha.
Refer to Note 24 for further discussion of reclamation and remediation matters.
158

Table of Contents
NEWMONT CORPORATION
NOTES TO CONSOLIDATED FINANCIAL STATEMENTS
(dollars in millions, except per share, per ounce and per pound amounts)
NOTE 7     IMPAIRMENT CHARGES
Year Ended December 31,
202520242023
Long-lived and other assets (1)
Goodwill
Total
Yanacocha$770 $2 $— $— $— 
NGM (2)
4 25 75 11 86 
Peñasquito1 19 21 1,210 1,231 
Other (3)
67 32 35 539 574 
Impairment charges
$842 $78 $131 $1,760 $1,891 
____________________________
(1)Primarily relates to non-cash write-downs of materials and supplies inventory and various assets that are no longer in use, except for certain impairment charges described below.
(2)At December 31, 2024 and 2023, the Company recognized its proportionate share of the non-cash impairment charge on long-lived assets at NGM. The impairment charge resulted in a remaining balance of $2 and $22 within Property, plant and mine development, net at December 31, 2024 and 2023, respectively. The remaining balances were estimated based on observable market values for comparable assets for the individual assets that were determined to have residual market value.
(3)Consists of impairment on goodwill at Musselwhite and Éléonore for the year ended December 31, 2023; refer below for further information.
The estimated cash flows utilized in both the long-lived asset and goodwill impairment evaluations are derived from the Company's current business plans. The Company completed its annual business plan update which reflected updated mine plans, certain adverse changes in market conditions, including inflationary pressures to costs and capital, strategic evaluation regarding the use of capital, and updates to asset retirement costs.
Impairment of Long-lived and Other Assets
The Company reviews and evaluates its long-lived assets, including development projects, for impairment when events or changes in circumstances indicate that the related carrying amounts may not be recoverable. During the fourth quarter of 2025, the Company (i) removed the Yanacocha Sulfides development project from its updated life of mine business plan based on the ongoing evaluation of its global portfolio of development projects and prioritization of project sequencing, (ii) downgraded the Yanacocha Sulfides project reserves to resources as a result of dated technical and capital estimates for the tailings storage solution and other design considerations for the project, (iii) executed sales transactions as part of an ongoing plan to market and sell the project equipment to third-party buyers, (iv) initiated a Company severance program with its employees at the Yanacocha operations that contemplates a wind-down of mining operations as oxide ore mining is depleted, and (v) is progressing mine closure activities for the non-operating areas of the Yanacocha operation, as well as prioritizing other future development opportunities at Yanacocha ahead of any future re-evaluation of the Yanacocha Sulfides development project, among other considerations. These actions, taken as a result of a change in strategic direction for the Company's operations in Peru and at Yanacocha, have resulted in an indefinite deferral of the future development of this project, and accordingly, the Company considers the project, as previously contemplated, no longer temporarily idled and that an impairment indicator existed for the project. As a result, a recoverability test was performed and the Company concluded the assets related to the project were impaired resulting in a non-cash impairment charge of $770, inclusive of working capital assets related to the project. The remaining balance of $78 within Property, plant and mine development, net at December 31, 2025 represents the expected salvage value of the equipment to be sold.
The Company measured the impairment by estimating the fair value of the Yanacocha Sulfides project equipment available for sale compared to the carrying value of the project assets, which included assets under construction and deferred mine development related to an underground deposit that was part of the project expenditures. The estimated fair value was determined using a market-based approach and is considered a non-recurring level 3 fair value measurement. The significant input to the fair value measurement included an estimated recoverability percentage of the original purchase order value of the equipment expected to be realized upon sale, which was based on completed sales to date.
Impairment of Goodwill
The Company evaluates its goodwill for impairment annually at December 31 or when events or changes in circumstances indicate that the fair value of a reporting unit is less than its carrying value. Each operating mine is considered a distinct reporting unit for purposes of goodwill impairment testing. Based on the December 31, 2025 and December 31, 2024 reviews, the Company concluded that Goodwill was not impaired at any of the reporting units.
Based on the December 31, 2023 review, the Company concluded that Goodwill was impaired at the Musselwhite, Éléonore and Peñasquito reporting units. The goodwill impairments at Musselwhite and Éléonore were driven by a deterioration in underlying cash flows from higher costs due to inflationary pressures, and resulted in non-cash impairment charges of $293 and $246, respectively, which represented the full goodwill balance of the reporting units prior to impairment. The goodwill impairment at Peñasquito was also driven by lower expected cash flows, primarily due to an update to the geological model that impacted expected metal grade and recoveries, as well as higher costs due to inflationary pressures, and resulted in a non-cash impairment charge of
159

Table of Contents
NEWMONT CORPORATION
NOTES TO CONSOLIDATED FINANCIAL STATEMENTS
(dollars in millions, except per share, per ounce and per pound amounts)
$1,210, which represented the full goodwill balance of the reporting unit prior to impairment. The long-lived assets of Musselwhite, Éléonore and Peñasquito were evaluated for impairment prior to the quantitative goodwill assessment and no impairment was identified.
In addition, the Company recorded a non-cash impairment charge of $11 at NGM as a result of the decision to not pursue permitting for Phase 2 mining at Long Canyon. As a result, NGM placed Long Canyon on long-term care and maintenance and revised their business plan. The impairment represented the full goodwill balance at Long Canyon based on the Company's proportionate interest in NGM.
The Company measured the impairments by comparing the total fair value of the operations to the corresponding reporting unit carrying value. The estimated fair value was determined using the income approach and is considered a non-recurring level 3 fair value measurement. Significant inputs to the fair value measured included (i) updated cash flow information from the Company's current business and closure plans, (ii) a short-term gold price of $1,950, (iii) a long-term gold price of $1,700, (iv) current estimates of reserves, resources, and exploration potential, and (v) a reporting unit specific discount rate of 10.00% at Musselwhite, 17.50% at Éléonore, and 6.75% at Peñasquito. The selected discount rates for Musselwhite and Éléonore incorporate additional premium related to operational risk at these sites.
NOTE 8     OTHER EXPENSE, NET
Year Ended December 31,
202520242023
Restructuring and severance$186 $38 $24 
Settlement costs2 44 7 
Newcrest transaction and integration costs— 72 464 
Other98 37 22 
Other expense, net$286 $191 $517 
Restructuring and severance
Beginning in the third quarter of 2025, management committed to a strategic plan designed to reduce operating costs and advance the Company’s ongoing commitment to profitability, which included streamlining its organizational structure and a reduction of the Company’s workforce and office space in certain markets.
During the year ended December 31, 2025, restructuring and severance primarily consists of expenditures for severance related to workforce reductions, costs related to closing certain office locations, and related consulting charges. The majority of the cash expenditures related to the plan were made in the fourth quarter or are expected to be paid in early 2026, with the remainder to be paid by the first quarter of 2027. Estimates are based on a number of assumptions, including compliance with local legal requirements across jurisdictions. Actual costs and timing may vary from current estimates as the Company continues to assess the full scope of the impact arising from, or related to, the workforce reduction and operating model changes.
NOTE 9     OTHER INCOME (LOSS), NET
Year Ended December 31,
202520242023
Interest income$214 $152 $148 
Foreign currency exchange(137)101 (56)
(Loss) gain on debt extinguishment (Note 20)
(101)32 — 
(Loss) gain on asset and investment sales (1)
(20)35 (197)
Pension settlements and curtailments (Note 11)
— (1)(9)
Other50 44 73 
Other income (loss), net$6 $363 $(41)
____________________________
(1)Primarily consists of the loss of $235 related to the abandonment of the pyrite leach plant at Peñasquito for the year ended December 31, 2023.
160

Table of Contents
NEWMONT CORPORATION
NOTES TO CONSOLIDATED FINANCIAL STATEMENTS
(dollars in millions, except per share, per ounce and per pound amounts)
NOTE 10     INCOME AND MINING TAXES
The Company’s Income and mining tax benefit (expense) consisted of:
Year Ended December 31,
202520242023
Current:
United States$(157)$(93)$(20)
Foreign(3,048)(1,224)(610)
(3,205)(1,317)(630)
Deferred:
United States(96)(157)62 
Foreign(1,295)77 42 
(1,391)(80)104 
Income and mining tax benefit (expense)$(4,596)$(1,397)$(526)
The Company’s Income (loss) before income and mining tax and other items is attributable to the following jurisdictions:
Year Ended December 31,
202520242023
United States$1,527 $536 $111 
Foreign9,815 4,041 (2,142)
Income (loss) before income and mining tax and other items$11,342 $4,577 $(2,031)
The Company’s Income and mining tax benefit (expense) differed from the amounts computed by applying the United States statutory corporate income tax rate for the following reasons:
Year Ended December 31, (1)
202520242023
Income (loss) before income and mining tax and other items$11,342 $4,577 $(2,031)
U.S. Federal statutory tax rate21 %$(2,382)21 %$(961)21 %$427 
Reconciling items:
Domestic state and local income taxes, net of federal income tax effect (2)
1 %(78)1 %(35)(1)%(25)
Domestic federal:
Tax Credits— %— (1)%37 1 %19 
Nontaxable and nondeductible items:
Percentage depletion(1)%83 (1)%63 4 %72 
Other nontaxable and nondeductible items1 %(76)— %(3)(1)%(14)
Cross-border tax laws— %(17)— %(21)— %(10)
Changes in valuation allowance— %18 (1)%34 9 %192 
Impact of Transactions
(2)%278 3 %(157)— %— 
Impact of Foreign Tax Credit and U.S. Capital Losses Expiration— %— — %— (10)%(195)
Other— %9 1 %(53)— %— 
Worldwide changes in unrecognized tax benefits— %(1)(1)%63 1 %28 
Foreign tax effects:
Argentina:
Tax impact of foreign exchange(1)%65 2 %(93)2 %34 
Changes in valuation allowance— %(28)(2)%94 (3)%(56)
Other— %(15)1 %(36)— %7 
Australia:
Northern Territory Mineral Royalty1 %(127)2 %(79)(3)%(62)
Changes in valuation allowance(1)%60 1 %(24)1 %30 
Other— %(19)(1)%30 — %(4)
Rate differential for foreign earnings indefinitely reinvested4 %(304)3 %(157)(10)%(195)
Canada:
Mining and other taxes (net of associated federal benefit)— %(46)2 %(92)— %(2)
161

Table of Contents
NEWMONT CORPORATION
NOTES TO CONSOLIDATED FINANCIAL STATEMENTS
(dollars in millions, except per share, per ounce and per pound amounts)
Tax impact of foreign exchange— %(25)(2)%73 (2)%(36)
Rate differential for foreign earnings indefinitely reinvested— %(51)— %9 1 %27 
Changes in valuation allowance1 %(69)(4)%182 (1)%(26)
Goodwill impairment— %— — %— (7)%(135)
Other1 %(91)(1)%39 — %— 
Ghana: (3)
Rate differential for foreign earnings indefinitely reinvested1 %(158)3 %(115)(3)%(55)
Transactions1 %(168)— %— — %— 
Permanent Assertion Removal1 %(165)— %— — %— 
Other1 %(74)1 %(27)(1)%(11)
Mexico:
Tax impact of foreign exchange— %52 (1)%57 — %(1)
Mining Tax1 %(126)— %(12)— %8 
Rate differential for foreign earnings indefinitely reinvested1 %(135)1 %(54)8 %162 
Changes in valuation allowance1 %(57)— %18 (2)%(34)
Goodwill impairment— %— — %— (18)%(363)
Prior period adjustment— %— — %— (1)%(27)
Other— %(10)1 %(37)1 %(11)
PNG:
Permanent Assertion Removal4 %(384)— %— — %— 
Other1 %(134)1 %(48)— %(8)
Peru:
Rate differential for foreign earnings indefinitely reinvested— %(40)1 %(30)4 %91 
Changes in valuation allowance2 %(282)— %13 (16)%(329)
Other1 %(64)1 %(37)— %(4)
Other foreign jurisdictions:
Rate differential for foreign earnings indefinitely reinvested— %— — %1 — %2 
Other— %(35)— %(39)— %(22)
Income and mining tax benefit (expense)40 %$(4,596)31 %$(1,397)(26)%$(526)
____________________________
(1)Percentages presented may not recalculate due to rounding.
(2)State taxes are comprised entirely of Nevada Net Proceeds Tax, net of federal benefit.
(3)Pursuant to the expiration of the Financial and Tax Stability Periods established by the Revised Investment Agreement in Ghana on December 31, 2025, the statutory tax rate for the Ahafo operations increased to 35% from 32.5%. The deferred balances were adjusted for the change to the tax rate and a $20 tax expense was recorded.
Factors that Significantly Impact Effective Tax Rate (Other than Factors Described Separately Below)
Percentage depletion allowances (tax deductions for depletion that may exceed the tax basis in the mineral reserves) are available to the Company under the income tax laws of the United States for operations conducted in the United States or through branches and partnerships owned by U.S. subsidiaries included in the consolidated United States income tax return. These deductions are highly sensitive to the price of gold and other metals produced by the Company.
The Company operates in various jurisdictions around the world that have statutory tax rates that are significantly different than those of the U.S. These differences combine to move the overall effective tax rate higher than the U.S. statutory rate.
Mining taxes in Nevada, Mexico, Canada, Peru, and Australia represent state and provincial taxes levied on mining operations and are classified as income taxes as such taxes are based on a percentage of mining profits.
In the U.S., capital losses may be carried forward five years to offset capital gains. Capital loss carryforwards of $—, $222, and $—, expired in 2025, 2024 and 2023, respectively. The Company carries a full valuation allowance on U.S. capital losses.
In 2025, 2024, and 2023, the U.S. had foreign tax credits of $—, $—, and $193, respectively, expire.
162

Table of Contents
NEWMONT CORPORATION
NOTES TO CONSOLIDATED FINANCIAL STATEMENTS
(dollars in millions, except per share, per ounce and per pound amounts)
Components of the Company's deferred income tax assets (liabilities) are as follows:
At December 31,
20252024
Deferred income tax assets:
Property, plant and mine development$1,257 $887 
Inventory100 132 
Reclamation and remediation2,246 2,077 
Net operating losses, capital losses and tax credits 2,217 2,297 
Employee-related benefits50 24 
Derivative instruments and unrealized loss on investments10 79 
Foreign exchange and financing obligations90 58 
Silver streaming agreement203 253 
Other546 555 
6,719 6,362 
Valuation allowances(4,782)(4,363)
1,937 1,999 
Deferred income tax liabilities:
Property, plant and mine development(4,320)(3,749)
Inventory(228)(132)
Investment in partnerships and subsidiaries (1,192)(582)
Other(197)(232)
(5,937)(4,695)
Net deferred income tax assets (liabilities)$(4,000)$(2,696)
These amounts reflect the classification and presentation that is reported for each tax jurisdiction in which the Company operates.
Valuation of Deferred Tax Assets
The Company assesses the available positive and negative evidence to estimate if sufficient future taxable income will be generated to utilize the existing deferred tax assets. A significant piece of objective negative evidence evaluated was the recent pretax losses and/or expectations of future pretax losses. Such objective evidence limits the ability to consider other subjective evidence such as the Company's projections for future growth. However, the amount of the deferred tax asset considered realizable could be adjusted if estimates of future taxable income during the carryforward period are increased, if objective negative evidence in the form of cumulative losses is no longer present or if additional weight were given to subjective evidence such as the Company's projections for growth.
During 2025, the Company recorded an increase to the valuation allowance of $295 and a corresponding tax expense, primarily driven by increases in the net deferred tax assets in Argentina and Peru, the valuation allowance on Canada's capital loss, offset by the release associated with the utilization of capital loss carryforwards in the U.S. and Australia.
Refer to Note 2 for additional risk factors that could impact the Company’s ability to realize the deferred tax assets.
Tax Loss Carryforwards, Foreign Tax Credits, and Canadian Tax Credits
At December 31, 2025 and 2024, the Company had (i) $1,524 and $2,005 of net operating loss carry forwards, respectively; and (ii) $563 and $414 of tax credit carry forwards, respectively. At December 31, 2025 and 2024, $429 and $760, respectively, of net operating loss carry forwards are attributable to the U.S., Australia, and France for which current tax law provides no expiration period. The net operating loss carry forward in Canada of $577 will expire by 2044. The net operating loss carryforward in Mexico of $187 will expire by 2034. The net operating loss carry forward in other countries is $331.
The U.S. tax credit carry forwards for 2025 and 2024, were $369 and $337, respectively. The foreign tax credits will substantially all expire at the end of 2035, and the solar tax credit for 2024 of $28 will expire by 2046. Canadian tax credits for 2025 and 2024 of $194 and $77, respectively, consist of investment tax credits and minimum mining tax credits. Canadian investment tax credits for 2025 consisted of $93 which will substantially expire by 2044.
163

Table of Contents
NEWMONT CORPORATION
NOTES TO CONSOLIDATED FINANCIAL STATEMENTS
(dollars in millions, except per share, per ounce and per pound amounts)
Income and Mining Taxes Paid, Net of Refunds
The amounts of income and mining taxes paid, net of refunds, by the Company are as follows:
Year Ended December 31,
202520242023
U.S. Federal$17 $1 $(1)
U.S. State and local:
Nevada50 40 19 
Foreign:
Australia737 341 414 
Canada*64 *
Ghana675 418 223 
Mexico315 *93 
PNG
158 **
Peru
341 **
Other165 102 46 
Total income and mining taxes paid, net of refunds$2,458 $966 $794 
____________________________
*The amount of income and mining taxes paid, net of refunds during the year does not meet the 5% disaggregation threshold.
Company’s Unrecognized Tax Benefits
A reconciliation of the beginning and ending amount of gross unrecognized tax benefits, exclusive of interest and penalties, is as follows:
202520242023
Total amount of gross unrecognized tax benefits at beginning of year$111 $144 $190 
Additions (reductions) for tax positions of prior years 10 (8)13 
Additions for tax positions of current year — — 2 
Reductions due to settlements with taxing authorities (12)(2)(18)
Reductions due to lapse of statute of limitations (5)(23)(43)
Total amount of gross unrecognized tax benefits at end of year$104 $111 $144 
At December 31, 2025, 2024, and 2023, $128, $125, and $190, respectively, represent the amount of unrecognized tax benefits, inclusive of interest and penalties that, if recognized, would impact the Company’s effective income tax rate.
The Company operates in numerous countries around the world and is subject to, and pays annual income taxes under, the various income tax regimes in the countries in which it operates. Some of these tax regimes are defined by contractual agreements with the local government, and others are defined by the general corporate income tax laws of the country. The Company has historically filed, and continues to file, all required income tax returns and paid the taxes reasonably determined to be due. The tax rules and regulations in many countries are highly complex and subject to interpretation. From time to time, the Company is subject to a review of its historic income tax filings and in connection with such reviews, disputes can arise with the taxing authorities over the interpretation or application of certain rules to the Company’s business conducted within the country involved.
The Company and/or subsidiaries file income tax returns in the U.S. Federal jurisdiction, and various state and foreign jurisdictions. With few exceptions, the Company is no longer subject to U.S. Federal, state and local, and non-U.S. income tax examinations by tax authorities for years before 2016.
The Company’s practice is to recognize interest and/or penalties related to unrecognized tax benefits as part of Income and mining tax benefit (expense). At December 31, 2025 and 2024, the total amount of accrued income-tax-related interest and penalties included in the Consolidated Balance Sheets was $55 and $47, respectively. During 2025, 2024, and 2023 the Company increased $8 and $31, and released $1 of interest and penalties, respectively, through the Consolidated Statements of Operations.
Refer to Note 24 for further discussion of tax matters.
Other
In the fourth quarter of 2025, the Company has provided additional income taxes for the remaining undistributed foreign earnings in Ghana and Papua New Guinea, $165 and $384, respectively, as it was determined excess cash flow could not be remitted on a tax free basis for the foreseeable future. No additional income taxes have been provided in other jurisdictions for any additional outside basis difference inherent at these entities, as these amounts continue to be indefinitely reinvested in foreign operations.
164

Table of Contents
NEWMONT CORPORATION
NOTES TO CONSOLIDATED FINANCIAL STATEMENTS
(dollars in millions, except per share, per ounce and per pound amounts)
NOTE 11 EMPLOYEE-RELATED BENEFITS
At December 31,
20252024
Current:
Accrued payroll and withholding taxes $534 $461 
Workers’ participation and other bonuses288 108 
Accrued severance (1)
38 19 
Other post-retirement benefit plans12 11 
Employee pension benefits 2 5 
Other employee-related payables 24 26 
$898 $630 
Non-current:
Accrued severance (1)
$466 $386 
Other post-retirement benefit plans 58 55 
Employee pension benefits 33 29 
Other employee-related payables 77 85 
$634 $555 
____________________________
(1)In the third quarter of 2025, management commenced a strategic plan to reduce operating costs and enhance profitability through organizational streamlining and reductions in workforce and office space in certain markets, resulting in accruals for severance and related restructuring charges recognized for the year ended December 31, 2025. Refer to Note 8 for further information.
Pension and Other Benefit Plans
The Company provides a defined benefit pension plan to eligible employees, with benefits generally based on years of service and annual compensation. Various international pension plans operate in accordance with local laws and requirements. Pension costs are determined annually by independent actuaries. The Company funds its qualified pension plan through cash contributions in compliance with employee Retirement Income Security Act of 1974, as amended. Non-qualified and other benefit plans are unfunded and represent general corporate obligations. The tables below present the combined funded status of both qualified and non-qualified plans. The Company reviews its retirement benefit programs on a regular basis and will evaluate market conditions and the funded status of its qualified plans in 2026 in order to determine if additional contributions are necessary.
165

Table of Contents
NEWMONT CORPORATION
NOTES TO CONSOLIDATED FINANCIAL STATEMENTS
(dollars in millions, except per share, per ounce and per pound amounts)
The following table provides a reconciliation of changes in the plans’ benefit obligations and assets’ fair values:
Pension BenefitsOther Benefits
2025202420252024
Change in benefit obligation:
Benefit obligation at beginning of year$313 $325 $60 $71 
Service cost12 14 1 1 
Interest cost16 17 4 4 
Actuarial loss (gain)
6 (14)12 (10)
Foreign currency exchange loss (gain)
1 (6)1 (2)
Benefits paid(26)(20)(15)(4)
Curtailment gain(6)— — — 
Settlement payments(5)(3)— — 
Divestitures (1)
(39)— — — 
Projected benefit obligation at end of year$272 $313 $63 $60 
Accumulated benefit obligation$253 $294 $63 $60 
Change in fair value of assets:
Fair value of assets at beginning of year$313 $322 $— $— 
Actual return on plan assets
33 11 — — 
Foreign currency exchange loss
— (4)— — 
Employer contributions6 7 15 4 
Benefits paid(26)(20)(15)(4)
Settlement payments(5)(3)— — 
Divestitures (1)
(39)— — — 
Fair value of assets at end of year$282 $313 $— $— 
(Unfunded) funded status, net:$10 $— $(63)$(60)
Amounts recognized in the Consolidated Balance Sheets:
Other non-current assets (2)
$45 $37 $— $— 
Employee-related benefits, current(2)(5)(5)(5)
Employee-related benefits, non-current (2)
(33)(32)(58)(55)
Net amounts recognized$10 $— $(63)$(60)
____________________________
(1)The Company divested the projected benefit obligation and plan assets related to the defined benefit pension plan at Porcupine as a result of the divestment on February 28, 2025. Refer to Note 3 for additional information.
(2)Includes $4 of non-current assets and $3 of non-current liabilities related to the pension plan at Porcupine that were reclassified to Assets held for sale and Liabilities held for sale as of December 31, 2024; no amounts remained in Assets held for sale or Liabilities held for sale as of December 31, 2025. Refer to Note 3 for additional information.
The following table provides information for the Company's defined benefit pension plans that had aggregate accumulated benefit obligations and projected benefit obligations in excess of plan assets at December 31:
Pension Benefits (1)
20252024
Projected benefit obligation$37 $39 
Accumulated benefit obligation$28 $32 
Fair value of plan assets$1 $2 
____________________________
(1)Information for other benefit plans with accumulated benefit obligations in excess of plan assets has not been included as all of the other benefit plans are unfunded.
166

Table of Contents
NEWMONT CORPORATION
NOTES TO CONSOLIDATED FINANCIAL STATEMENTS
(dollars in millions, except per share, per ounce and per pound amounts)
The following table provides the net pension and other benefits amounts recognized in Accumulated other comprehensive income (loss):
Pension BenefitsOther Benefits
At December 31,At December 31,
2025202420252024
Accumulated other comprehensive income (loss):
Net actuarial (loss) gain$(57)$(71)$29 $33 
Prior service credit2 2 — — 
(55)(69)29 33 
Less: Income taxes13 15 (6)(7)
Total$(42)$(54)$23 $26 
The following table provides components of the total benefit cost (income), inclusive of the net periodic pension and other benefits costs (credits):
Pension Benefit Costs (Credits)Other Benefit Costs (Credits)
Year Ended December 31,Year Ended December 31,
202520242023202520242023
Pension benefit cost (income), net: (1)
Service cost $12 $14 $12 $1 $1 $1 
Interest cost 16 17 17 4 4 4 
Expected return on plan assets (20)(24)(23)— — — 
Amortization, net3 1 (7)8 (2)(2)
Net periodic benefit cost (income)11 8 (1)13 3 3 
Settlement cost
1 1 9 — — — 
Gain on curtailment
(1)— — — — — 
Total benefit cost$11 $9 $8 $13 $3 $3 
____________________________
(1)Service costs are included in Costs applicable to sales or General and administrative and the other components of benefit costs are included in Other income (loss), net.
The following table summarizes the significant assumptions used to determine the benefit obligations at December 31, and net periodic benefit costs for the year then ended:
Pension BenefitsOther Benefits
202520242023202520242023
Benefit obligation:
Discount rate5.98 %5.77 %5.33 %6.48 %6.54 %6.09 %
Net periodic benefit cost:
Discount rate5.77 %5.33 %5.63 %6.54 %6.09 %6.10 %
Expected return on plan assets7.20 %7.09 %6.38 %N/AN/AN/A
The expected long-term return on plan assets used for each period in the three years ended December 31, 2025 was determined based on an analysis of the asset returns over multiple time horizons for the Company’s actual plan and for other comparable U.S. corporations. The Company determines the long-term return on plan assets by considering the most recent capital market forecasts, the plans’ current asset allocation and the actual return on plan assets in comparison to the expected return on assets.
The assumed health care trend rate used to measure the expected cost of benefits is 6.75% in 2026 and decreases gradually each year to 5.00% in 2033, which is used thereafter.
The qualified pension plan employs an independent investment firm which invests the assets of the plans in certain approved funds that correspond to specific asset classes with associated target allocations. The goal of the pension fund investment program is to achieve prudent actuarial funding ratios while maintaining acceptable risk levels. The investment performance of the plans and that of the individual investment firms is measured against recognized market indices. The performance of the pension funds is monitored by an investment committee comprised of members of the Company’s management, which is advised by an independent investment consultant. With the exception of global capital market economic risks, the Company has identified no significant portfolio risks related to asset classes.
167

Table of Contents
NEWMONT CORPORATION
NOTES TO CONSOLIDATED FINANCIAL STATEMENTS
(dollars in millions, except per share, per ounce and per pound amounts)
The following table sets forth the Company’s target asset allocation and pension plan assets measured at fair value:
At December 31,
Target Allocation20252024
Commingled Funds: (1)
Fixed income investments45 %$123 $143 
World equity fund (U.S. and International equity investments)20 %55 54 
International equity investments12 %34 45 
U.S. equity investments11 %33 34 
Real estate8 %25 25 
High yield fixed income investments4 %11 11 
281 312 
Cash equivalents (2)
— %1 1 
Total$282 $313 
____________________________
(1)Commingled fund investments are managed by several fund managers and are valued at the net asset value per share for each fund. Although the majority of the underlying assets in the funds consist of actively traded equity securities and bonds, the unit of account is considered to be at the fund level. These funds require less than a month’s notice for redemptions and can be redeemed at the net asset value per share.
(2)Cash equivalent instruments are classified within Level 1 of the fair value hierarchy because they are valued using quoted market prices in active markets and are primarily invested in money market securities and U.S. Treasury securities.
Cash Flows
Expected benefit payments to plan participants are as follows:
Pension PlanOther Benefits Plan
2026$15 $6 
2027$16 $6 
2028$19 $6 
2029$20 $5 
2030$19 $5 
Thereafter$114 $27 
Savings Plans
The Company has one qualified defined contribution savings plan in the U.S. that covers salaried and hourly employees. When an employee meets eligibility requirements, the Company matches 100% of employee contributions of up to 6% of eligible earnings. Hourly employees receive an additional retirement contribution to the participant’s retirement contribution account equal to an amount which is paid and determined by the Company. Currently, the additional retirement contribution is 5% of eligible earnings. Matching contributions are made in cash. In addition, the Company has one non-qualified supplemental savings plan for executive-level employees whose benefits under the qualified plan are limited by federal regulations.
NOTE 12 STOCK-BASED COMPENSATION
The Company grants stock-based incentive awards to directors, executives and eligible employees. Stock incentive awards include RSUs and PSUs and are determined as a target percentage of base salary. All RSU awards generally vest on a straight-line basis over three years. All PSU awards generally cliff vest after three years and the number of awards that vest is based on the achievement of the market and performance metrics. For employees who are retirement eligible or who become retirement eligible during the term of the award, the vesting period may be reduced based on the retirement eligibility date.
Prior to vesting, holders of stock incentive awards do not have the right to vote the underlying shares; however, directors, executives and eligible employees accrue dividend equivalents on their stock incentive awards, which are paid at the time the awards vest. The accrued dividend equivalents are not paid if awards are forfeited. Upon vesting, the employee is entitled to receive one share of the Company’s common stock for each RSU or PSU. The Company issues new shares of common stock to satisfy vesting under all of its stock incentive awards. At December 31, 2025, 18,214,007 shares were authorized for issuance for future vesting of stock incentive awards.
Total stock-based compensation was $99, $89, and $80 (including $20, $6, and $4 related to the Company's proportionate share of NGM stock-based compensation) for the years ended December 31, 2025, 2024, and 2023, respectively. At December 31, 2025, there was $92 of unrecognized compensation costs related to the unvested stock incentive awards. This cost is expected to be recognized over a weighted average period of approximately two years.
168

Table of Contents
NEWMONT CORPORATION
NOTES TO CONSOLIDATED FINANCIAL STATEMENTS
(dollars in millions, except per share, per ounce and per pound amounts)
A summary of the status and activity of non-vested RSUs and PSUs for the year ended December 31, 2025 is as follows:
RSUPSU
Number of UnitsWeighted Average Grant-Date Fair ValueNumber of UnitsWeighted Average Grant-Date Fair Value
Non-vested at beginning of year3,278,470 $36.13 1,641,713 $44.58 
Granted1,782,952 $46.11 419,290 $31.24 
Vested(1,453,507)$39.88 — $— 
Forfeited(674,378)$38.04 (332,854)$41.35 
Non-vested at end of year2,933,537 $39.90 1,728,149 $41.96 
The total intrinsic value and fair value of RSUs that vested in 2025, 2024, and 2023 was $68, $37, and $36, respectively. The total intrinsic value and fair value of PSUs that vested in 2025, 2024, and 2023 was $—, $6, and $35, respectively.
NOTE 13 FAIR VALUE ACCOUNTING
Fair value accounting establishes a fair value hierarchy that prioritizes the inputs to valuation techniques used to measure fair value. The hierarchy gives the highest priority to unadjusted quoted prices in active markets for identical assets or liabilities (Level 1 measurements) and the lowest priority to unobservable inputs (Level 3 measurements). The three levels of the fair value hierarchy are described below:
Level 1    Unadjusted quoted prices in active markets that are accessible at the measurement date for identical, unrestricted assets or liabilities;
Level 2    Quoted prices in markets that are not active, quoted prices for similar assets or liabilities in active markets, quoted prices or inputs that are observable, either directly or indirectly, for substantially the full term of the asset or liability and model-based valuation techniques (e.g. the Black-Scholes model) for which all significant inputs are observable in the market or can be corroborated by observable market data for substantially the full term of the assets or liabilities; and
Level 3    Prices or valuation techniques that require inputs that are both significant to the fair value measurement and unobservable (supported by little or no market activity).
The following tables set forth the Company’s assets and liabilities measured at fair value on a recurring (at least annually) and nonrecurring basis by level within the fair value hierarchy. As required by accounting guidance, assets and liabilities are classified in their entirety based on the lowest level of input that is significant to the fair value measurement.
Fair Value at December 31, 2025
TotalLevel 1Level 2Level 3
Assets:
Cash and cash equivalents (1)
$7,647 $7,647 $— $— 
Restricted cash37 37 — — 
Trade receivables from provisional concentrate sales1,064 — 1,064 — 
Long-lived assets (Note 7)
78 — — 78 
Marketable equity and other securities (Note 15)
740 740 — — 
Restricted marketable debt and other securities (Note 6)
13 13 — — 
Derivative assets (Note 14)
262 — 60 202 
$9,841 $8,437 $1,124 $280 
Liabilities:
Debt (Note 20) (2)
$5,283 $— $5,283 $— 
Derivative liabilities (Note 14)
1 — 1 — 
Other liabilities339 — 339 — 
$5,623 $— $5,623 $— 
169

Table of Contents
NEWMONT CORPORATION
NOTES TO CONSOLIDATED FINANCIAL STATEMENTS
(dollars in millions, except per share, per ounce and per pound amounts)
Fair Value at December 31, 2024
TotalLevel 1Level 2Level 3
Assets:
Cash and cash equivalents (1)
$3,619 $3,619 $— $— 
Restricted cash31 31 — — 
Trade receivables from provisional concentrate sales993 — 993 — 
Assets held for sale (Note 3) (3)
1,840 — 1,168 672 
Equity method investment
212 212 — — 
Marketable equity and other securities (Note 15)
305 305 — — 
Restricted marketable debt and other securities (Note 6)
15 15 — — 
Derivative assets (Note 14)
142 — — 142 
$7,157 $4,182 $2,161 $814 
Liabilities:
Debt (Note 20) (2)
$8,400 $— $8,400 $— 
Derivative liabilities (Note 14)
143 — 137 6 
Other liabilities51 — 51 — 
$8,594 $— $8,588 $6 
____________________________
(1)Cash and cash equivalents include short-term deposits that have an original maturity of three months or less.
(2)Debt is carried at amortized cost. The outstanding carrying value was $5,115 and $8,476 at December 31, 2025 and December 31, 2024, respectively. The fair value measurement of debt was based on an independent third-party pricing source.
(3)Includes assets held for sale that were written down to their fair value, excluding costs to sell, of $1,840 and the aggregate fair value, excluding costs to sell, of net assets held for sale subject to fair value remeasurement was $679.
The Company’s cash and cash equivalents and restricted cash are classified within Level 1 of the fair value hierarchy because they are valued using quoted market prices in active markets and are primarily money market securities and U.S. Treasury securities.
The Company’s trade receivables from provisional concentrate sales, which contain an embedded derivative and are subject to final pricing, are valued using quoted market prices based on forward curves for the particular metal. As the contracts themselves are not traded on an exchange, these receivables are classified within Level 2 of the fair value hierarchy.
The Company's long-lived assets consist of long-lived assets at Yanacocha that were subject to a non-recurring fair value measurement as a result of impairment tests performed for the year ended December 31, 2025. The Company performed a non-recurring fair value measurement, classified as Level 3 of the fair value hierarchy, in connection with recoverability and impairment tests performed over long-lived assets. Refer to Note 7 for further information regarding management’s assessment of these long-lived assets, including the assumptions utilized in determining the fair value.
The Company's assets held for sale consisted of the six non-core assets and a development project that met the accounting requirements to be presented as held for sale as of December 31, 2024, which were all divested as of December 31, 2025. The estimated fair values of assets held for sale are considered a non-recurring level 2 or 3 fair value measurements and were determined using (i) the market-based approach for disposal groups in which a binding sales agreement was in place but close had not yet occurred, or (ii) the income approach in the absence of a binding sales agreement. Refer to Note 3 for further information.
The Company's equity method investment consisted of the Greatland equity method investment which was accounted for under the fair value option at December 31, 2024 and classified as Level 1 within the fair value hierarchy as it was valued using published market prices of actively traded securities. At December 31, 2025, the remaining shares in Greatland were accounted for as a marketable equity security. Refer to Note 3 for further information.
The Company’s marketable equity and other securities with readily determinable fair values are valued using quoted market prices in active markets and as such are classified within Level 1 of the fair value hierarchy. The fair value of the marketable equity securities are calculated as the quoted market price of the marketable equity security multiplied by the quantity of shares held by the Company.
The Company’s restricted marketable debt and other securities are primarily U.S. government issued bonds and international bonds. The Company’s debt securities held at Yanacocha are classified within Level 1 of the fair value hierarchy, using published market prices of actively traded securities. The Company’s debt securities held at Corporate and Other are classified within Level 1 and Level 2 of the fair value hierarchy. The Level 1 debt securities are valued using published market prices of actively traded securities and the Level 2 debt securities are valued using pricing models which are based on published market inputs for similar, actively traded securities.
The Company’s derivative instruments consist of the Cadia PPA, foreign currency fixed forward contracts, and contingent consideration assets that are accounted for as derivatives.
170

Table of Contents
NEWMONT CORPORATION
NOTES TO CONSOLIDATED FINANCIAL STATEMENTS
(dollars in millions, except per share, per ounce and per pound amounts)
The Cadia PPA is accounted for at fair value using probability-weighted discounted cash flow models and is classified within Level 3 of the fair value hierarchy. The valuation model requires a variety of inputs including life of mine production profiles, forward power prices, forecasted power generation volume, discount rates, and inflation assumptions. Refer to Note 14 for further information.
The foreign currency fixed forward contracts are valued using pricing models based on forward curves. The Company’s foreign currency fixed forward derivatives trade in liquid markets, and as such, model inputs can generally be verified and do not involve significant management judgment. Such instruments are classified within Level 2 of the fair value hierarchy. Refer to Note 14 for further information.
The contingent consideration asset, accounted for as a derivative, is classified within Level 3 of the fair value hierarchy. The contingent consideration is dependent on the average gold price over a defined period. As a result, changes in the future gold prices could result in an impact to the estimated fair value of the contingent consideration asset.
The Company's other liabilities recognized at fair value consist of the Greatland Option, which was acquired through the sale of Telfer in the fourth quarter of 2024. The Greatland Option is accounted for under the fair value option and is classified as Level 2 within the fair value hierarchy and is valued using pricing models which are based on published market inputs for similar, actively traded securities. Refer to Note 3 for further information.
The following tables set forth a summary of the quantitative and qualitative information related to the significant observable and unobservable inputs used in the calculation of the Company’s Level 3 financial assets and liabilities at December 31, 2025 and December 31, 2024:
DescriptionAt December 31, 2025Valuation techniqueSignificant inputRange, point estimate or averageWeighted Average Discount Rate
Long-lived assets$78 
Market-based approach
Various (1)
Various (1)
Derivative assets:
Hedging instruments
$162 Income approachForward power prices
A$37 - A$703
7.00%
Contingent consideration assets$40 Income approach
Forward gold prices
$4,254—%

DescriptionAt December 31, 2024Valuation techniqueSignificant inputRange, point estimate or average
Weighted Average Discount Rate
Assets held for sale (2)
$672 Income approach
Various (2)
Various (2)
9.75%
Derivative assets
Hedging instruments (3)
$94 Income approachForward power prices
A$43 - A$321
6.75%
Contingent consideration assets$47 Income approachDiscount rate
6.37% - 16.38%
10.67%
Derivative liabilities (3)
$5 Income approachDiscount rate
5.22% - 5.95%
5.66%
____________________________
(1)Refer to Note 7 for information on the assumptions and inputs specific to the non-recurring fair value measurement performed in connection with recoverability and impairment tests incurred for certain long-lived assets.
(2)Significant inputs at December 31, 2024 included: (i) cash flow estimates, (ii) a long-term gold price of $1,900, (iii) current estimates of resources and exploration potential, and (iv) a reporting unit specific discount rate of 9.75%.
(3)Hedging instruments consists of the net position of the Cadia PPA which is comprised of $1 is in a liability position and the non-current portion of $95 is in an asset position. The current liability portion is included in Derivative liabilities within the fair value hierarchy table and the non-current asset portion is included in Derivative assets within the fair value hierarchy table.
The following tables set forth a summary of changes in the fair value of the Company’s recurring Level 3 financial assets and liabilities:
171

Table of Contents
NEWMONT CORPORATION
NOTES TO CONSOLIDATED FINANCIAL STATEMENTS
(dollars in millions, except per share, per ounce and per pound amounts)
Derivative Assets
Total Assets
Derivative Liabilities
Total Liabilities
Fair value at December 31, 2023$635 $635 $5 $5 
Sales and settlements (1)
(377)(377)— — 
Transfers out of Level 3 (2)
(76)(76)— — 
Fair value changes in Other comprehensive income (loss):
(53)(53)1 1 
Fair value changes in Change in fair value of investments and options
2 2 — — 
Fair value changes in Net income (loss) from discontinued operations
11 11 — — 
Fair value at December 31, 2024142 142 6 6 
Acquired through divestments (3)
14 14 — — 
Transfers out of Level 3 (4)
(47)(47)(5)(5)
Fair value changes in Other comprehensive income (loss):
67 67 (1)(1)
Fair value changes in Change in fair value of investments and options
26 26 — — 
Fair value at December 31, 2025$202 $202 $— $— 
____________________________
(1)In the second quarter of 2024, the Company sold the Stream Credit Facility Agreement which was a non-revolving credit facility for the Fruta del Norte mine operated by Lundin Gold Inc. (“Lundin Gold”), in which the Company holds a 32% interest; refer to Note 14 for further information. In the third quarter of 2024, the company sold the Batu and Elang Contingent consideration assets; refer to Note 1 for further information.
(2)In the first quarter of 2024, certain amounts relating to the Batu Hijau contingent consideration asset were reclassified from a derivative to a receivable as a result of achieving certain contractual milestones.
(3)The Company acquired contingent consideration assets as part of the divestitures that occurred in 2025. Refer to Note 3 for further information.
(4)The Company early adopted ASU 2025-07 on December 31, 2025 resulting in the reclassification of certain derivatives assets and liabilities. Refer to Note 14 for further information.
NOTE 14 DERIVATIVE INSTRUMENTS
At December 31,
20252024
Current derivative assets: (1)
Hedging instruments:
Foreign currency cash flow hedges
$60 $— 
Cadia PPA cash flow hedge
7 — 
67 — 
Contingent consideration assets (2)
20 — 
$87 $— 
Non-current derivative assets: (3)
Hedging instruments:
Cadia PPA cash flow hedge
$155 $95 
Contingent consideration assets (2)
20 47 
$175 $142 
Current derivative liabilities: (4)
Hedging instruments:
Foreign currency cash flow hedges
$1 $135 
Cadia PPA cash flow hedge
— 1 
1 136 
Contingent consideration liabilities (2)
— 2 
$1 $138 
Non-current derivative liabilities: (5)
Contingent consideration liabilities (2)
$— $5 
$— $5 
____________________________
(1)Included in Other current assets.
(2)The Company early adopted ASU 2025-07 on December 31, 2025 resulting in the reclassification of certain contingent consideration assets and liabilities. Refer below for further information.
(3)Included in Other non-current assets.
(4)Included in Other current liabilities.
(5)Included in Other non-current liabilities.
172

Table of Contents
NEWMONT CORPORATION
NOTES TO CONSOLIDATED FINANCIAL STATEMENTS
(dollars in millions, except per share, per ounce and per pound amounts)
ASU 2025-07 Adoption
The Company early adopted ASU 2025-07 on December 31, 2025. The ASU refines the scope of Topic 815 (Derivatives and Hedging) by adding a scope exception from derivative accounting for non-exchange-traded contracts with underlyings that are based on operations or activities specific to one of the parties to the contract. As a result, contingent consideration assets and liabilities from prior transactions that met this criterion no longer qualified as derivatives and were reclassified to other assets and liabilities.
Hedging Instruments
Hedging instruments consisted of the foreign currency cash flow hedges and the Cadia PPA at December 31, 2025.
To minimize credit risk, the Company only enters into transactions with counterparties that meet certain credit requirements and periodically reviews the creditworthiness of these counterparties. The Company believes that the risk of counterparty default is low and its exposure to credit risk is minimal.
Foreign Currency Cash Flow Hedges
The Company has implemented various hedge programs in which fixed forward contracts have been entered into to mitigate variability in the USD-functional cash flows associated with specific expenditures. These fixed forward contracts have been designated as foreign currency cash flow hedges for the related forecasted expenditures and were transacted for risk management purposes. Refer to the table below for a summary of these programs at December 31, 2025:
AUD-denominated capital expendituresAUD-denominated operating expendituresCAD-denominated operating expenditures
AUD-denominated capital expenditures
Status:ActiveActiveActive
Matured (1)
Amount entered into:A$1,734A$4,002C$1,088A$574
Cash flow type:Capital expenditures for construction and developmentOperating expendituresOperating expendituresCapital expenditures for construction and development
Incurred in the periods of:October 2024 through December 2026October 2024 through December 2026October 2024 through December 20262023 through 2024
Related to:Tanami Expansion 2 project; Cadia PC1-2 and PC2-3 ("Cadia Panel Caves"); and Cadia Tailings Project ("Cadia Tails")Boddington, Tanami, and Cadia operating mines located in AustraliaBrucejack and Red Chris operating mines located in CanadaTanami Expansion 2 project
____________________________
(1)The hedge program matured in 2024 and a gain of $7 remains in Accumulated other comprehensive income (loss) as of December 31, 2025.
The unrealized changes in fair value have been recorded in Accumulated other comprehensive income (loss) and are reclassified to earnings during the period in which the hedged transaction impacts earnings and is presented in the same statement of operations line item as the earnings effect of the hedged item. If the underlying hedge transaction becomes probable of not occurring, the related amounts will be reclassified to earnings immediately. Amounts related to capital expenditures recorded in Accumulated other comprehensive income (loss) are reclassified to earnings through Depreciation and amortization after the respective project reaches commercial production. Amounts related to operating expenditures recorded in Accumulated other comprehensive income (loss) are reclassified to earnings through Costs applicable to sales in the period that the operating expenditures are incurred.
Cadia PPA
The Cadia PPA is a 15-year renewable power purchase agreement acquired by the Company through the Newcrest transaction. The Company has designated the Cadia PPA as a cash flow hedge to mitigate the variability in cash flows related to approximately 40 percent of forecasted purchases of power at the Cadia mine for a 15 year period beginning in July 2024. Additionally, the Cadia PPA will provide the Company with access to large scale generation certificates which the Company intends to surrender to achieve a reduction in its greenhouse gas emissions.
The unrealized changes in fair value have been recorded in Accumulated other comprehensive income (loss) and will be reclassified to earnings during the period in which the hedged transaction impacts earnings and is presented in the same statement of operations line item as the earnings effect of the hedged item. If the underlying hedge transaction becomes probable of not occurring, the related amounts in Accumulated other comprehensive income (loss) will be reclassified to earnings immediately. Amounts recorded in Accumulated other comprehensive income (loss) will be reclassified to earnings through Costs applicable to sales in the period in which the related hedged electricity is purchased, which began in July 2024.
173

Table of Contents
NEWMONT CORPORATION
NOTES TO CONSOLIDATED FINANCIAL STATEMENTS
(dollars in millions, except per share, per ounce and per pound amounts)
The following table provides the losses (gains) recognized in earnings related to the Company's derivative instruments designated for hedging:
Year Ended December 31,
202520242023
Loss on cash flow hedges:
Interest rate contracts (1)
$57 $10 $5 
Foreign currency cash flow hedges (2)
30 7 19 
Cadia PPA cash flow hedge (3)
7 5 — 
$94 $22 $24 
____________________________
(1)As of December 31, 2025, amounts remaining in Accumulated other comprehensive income (loss) fully relate to the interest rate contracts on the 2042 Senior Notes with the related losses to be reclassified from Accumulated other comprehensive income (loss) and amortized to Interest expense, net of capitalized interest over the term of the notes. A loss of $3 is expected to be reclassified into earnings over the next 12 months. The actual amounts that will be reclassified to earnings could vary upon repurchase or exchange of the related long-term debt prior to maturity.
(2)As of December 31, 2025, a gain of $45 is expected to be reclassified out of Accumulated other comprehensive income (loss) into earnings over the next 12 months. The actual amounts that will be reclassified to earnings will vary due to future foreign currency exchange rates.
(3)As of December 31, 2025, a loss of $10 is expected to be reclassified out of Accumulated other comprehensive income (loss) into earnings over the next 12 months, which includes the amounts related to the initial fair value that are reclassified from Accumulated other comprehensive income (loss) to earnings on a systematic basis over the 15-year term. The actual amounts that will be reclassified to earnings will vary due to future power prices and power generation volumes.
Derivative Assets, Not Designated for Hedging
Stream Credit Facility Agreement ("SCFA")
The SCFA was a non-revolving credit facility in relation to the Fruta del Norte mine, which is wholly owned and operated by Lundin Gold in which the Company holds a 32% equity interest. The SCFA was a financial instrument that met the definition of a derivative and was accounted for at fair value using a probability weighted discounted cash flow model, but was not designated for hedge accounting under ASC 815. In the second quarter of 2024, the Company completed the sale of the SCFA and Offtake agreement in which Lundin Gold repurchased the SCFA and settled the rights under the Offtake agreement for cash consideration of $330, of which $180 and $150 was received in the second quarter and third quarter of 2024, respectively. The sale resulted in a gain of $49 recognized in Other income (loss), net.
NOTE 15 INVESTMENTS
At December 31,
20252024
Current investments:
Marketable equity securities$594 $21 
Non-current investments:
Marketable equity and other securities (1)
$171 $309 
Equity method investments (% ownership): 
Pueblo Viejo Mine (40%)
1,584 1,516 
NuevaUnión Project (50%)
973 961 
Lundin Gold (32%)
905 941 
Norte Abierto Project (50%)
553 532 
Greatland (20% at December 31, 2024) (2)
— 212 
4,015 4,162 
$4,186 $4,471 
____________________________
(1)Includes $25 accounted for under the measurement alternative.
(2)The Company's investment in Greatland, acquired through the sale of Telfer in the fourth quarter of 2024, is included in equity method investments under the fair value option at December 31, 2024 and in current marketable equity and other securities at December 31, 2025 as it no longer qualifies as an equity method investment with an ownership of 10% and loss of significance influence. Refer to Note 3 for further information.
174

Table of Contents
NEWMONT CORPORATION
NOTES TO CONSOLIDATED FINANCIAL STATEMENTS
(dollars in millions, except per share, per ounce and per pound amounts)
Equity Method Investments
The following table provides the income (loss) from the Company's equity method investments, recognized in Equity income (loss) of affiliates:
Year Ended December 31,
202520242023
Pueblo Viejo (40%)
$245 $91 $63 
Lundin Gold (32%)
169 45 — 
Other7 (3)— 
$421 $133 $63 
Pueblo Viejo
The Pueblo Viejo mine is located in the Dominican Republic and commenced operations in September 2014. Barrick operates and holds the remaining interest in the mine. At acquisition, the fair value of Newmont’s equity investment in Pueblo Viejo was lower than the underlying net assets of its investment resulting in a basis difference, which is being amortized into Equity income (loss) of affiliates over the remaining estimated useful life of the mine. As of December 31, 2025 the net basis difference was $290.
In November 2020, the Company and Barrick entered into an agreement with Pueblo Viejo to provide funding for the expansion of Pueblo Viejo's operations of up to $1,300 ($520 attributable to Newmont's 40% ownership interest) through a loan facility bearing interest at 95% of the 6-month SOFR plus 4.25% which is compounded semi-annually in arrears on February 28 and August 31 of each year (“Loan Facility”). The Loan Facility was provided in two tranches of $800 and $500, respectively. Unused proceeds under the first tranche are available for use under the second tranche. The tranches mature February 28, 2032 and February 28, 2035, respectively. In October 2024, the Company and Barrick agreed to provide additional funding of up to $800 ($320 attributable to Newmont's 40% ownership interest) through an additional loan facility bearing interest at the 6-month SOFR plus 3.81% which is compounded semi-annually in arrears on February 15 and August 15 of each year and matures on February 15, 2039 (“Loan Facility II”). Under the terms of the respective agreements, the Company and Barrick distribute funds based on their respective proportionate ownership interest in Pueblo Viejo.
As of December 31, 2025 and December 31, 2024, the Company had outstanding stockholder loans to Pueblo Viejo of $518 and $486, which includes accrued interest of $60 and $19, respectively. All loans receivable and accrued interest are included in the Pueblo Viejo equity method investment balance.
The Company purchases its portion (40%) of gold and silver produced from Pueblo Viejo at market price and resells those ounces to third parties. Total payments made to Pueblo Viejo for gold and silver purchased were $934 and $580 for the years ended December 31, 2025 and December 31, 2024, respectively. These purchases, net of subsequent sales, were included in Other income (loss), net and the net amount is immaterial. There were no amounts due to or due from Pueblo Viejo for gold and silver purchases as of December 31, 2025 or December 31, 2024.
NuevaUnión
The NuevaUnión project is located in Chile and is currently in the Company’s development project pipeline. The project is jointly managed by Newmont and Teck Resources Limited, who holds the remaining 50% interest. At acquisition, the carrying value of Newmont’s equity investment in NuevaUnión was lower than the underlying net assets of its investment resulting in a basis difference.
At December 31, 2025 the carrying value of Newmont’s equity investment in NuevaUnión was lower than the underlying net assets of its investment by $67. This basis difference will be amortized into Equity income (loss) of affiliates over the remaining estimated useful life of the mine beginning when commercial production is declared, which had not yet occurred as of December 31, 2025.
Lundin Gold Inc.
Lundin Gold is a Canadian based mine development and operating company which wholly owns and operates the Fruta del Norte gold mine in Ecuador. On November 6, 2023, as a part of the Newcrest transaction, the Company acquired 32% interest in Lundin Gold. The Company accounts for Lundin Gold as an equity method investment on a quarter lag. At acquisition, the fair value of Newmont’s equity investment in Lundin Gold was higher than the underlying net assets of its investment resulting in a basis difference. This basis difference is being amortized into Equity income (loss) of affiliates over the remaining estimated useful life of the mine. As of December 31, 2025 the net basis difference was $536. At December 31, 2025, the calculated fair value, based on quoted closing prices of publicly traded shares, of the Company's investment in Lundin Gold was $6,404.
The Company had the right to purchase 50% of gold produced from Lundin Gold at a price determined based on delivery dates and a defined quotational period and resold the ounces purchased to third parties under an offtake agreement acquired through the Newcrest transaction (the "Offtake agreement"). In the second quarter of 2024, the Company completed the sale of the SCFA and Offtake agreement in which Lundin Gold repurchased the SCFA and settled the rights under the Offtake agreement.
175

Table of Contents
NEWMONT CORPORATION
NOTES TO CONSOLIDATED FINANCIAL STATEMENTS
(dollars in millions, except per share, per ounce and per pound amounts)
Total payments made to Lundin Gold under the Offtake agreement for gold purchased were $189 for the year ended December 31, 2024. These purchases, net of subsequent sales, were included in Other income (loss), net and the net amount was immaterial. There were no payables due to Lundin Gold for gold purchases as of December 31, 2024.
Norte Abierto
The Norte Abierto project is located in Chile and is currently in the Company’s development project pipeline. The project is jointly managed by Newmont and Barrick, who holds the remaining 50% interest.
At December 31, 2025 the carrying value of Newmont’s equity investment in Norte Abierto was lower than the underlying net assets of its investment by $209. This basis difference will be amortized into Equity income (loss) of affiliates over the remaining estimated useful life of the mine beginning when commercial production is declared, which had not yet occurred as of December 31, 2025.
NOTE 16     INVENTORIES
At December 31,
20252024
Materials and supplies$1,060 $1,081 
In-process199 118 
Concentrate162 148 
Precious metals91 76 
Inventories (1)
$1,512 $1,423 
____________________________
(1)During the first quarter of 2024, certain non-core assets were determined to meet the criteria for held for sale. As a result, the related assets, including Inventories of $185, were reclassified to Assets held for sale at December 31, 2024; no amounts related to Inventories were reclassified to Assets held for sale at December 31, 2025. Refer to Note 3 for additional information.
The Company recorded write-downs classified as components of Costs applicable to sales and Depreciation and amortization to reduce the carrying value of inventories to net realizable value as follows:
Year Ended December 31,
2025 (1)
2024 (2)
2023 (3)
Costs applicable to sales$2 $44 $37 
Depreciation and amortization1 5 15 
$3 $49 $52 
____________________________
(1)For the year ended December 31, 2025, write-downs were not material.
(2)For the year ended December 31, 2024, write-downs primarily related to Telfer and Cerro Negro.
(3)For the year ended December 31, 2023, write-downs primarily related to Peñasquito.
NOTE 17     STOCKPILES AND ORE ON LEACH PADS
At December 31, 2025
At December 31, 2024 (1)
StockpilesOre on Leach PadsTotalStockpilesOre on Leach PadsTotal
Current$893 $284 $1,177 $624 $137 $761 
Non-current2,284 126 2,410 2,072 194 2,266 
Total$3,177 $410 $3,587 $2,696 $331 $3,027 
____________________________
(1)During the first quarter of 2024, certain non-core assets were determined to meet the criteria for held for sale. As a result, the related assets, including Stockpiles and ore on leach pads of $374, were reclassified to Assets held for sale at December 31, 2024; no amounts related to Stockpiles and ore on leach pads were reclassified to Assets held for sale at December 31, 2025. Refer to Note 3 for additional information.
176

Table of Contents
NEWMONT CORPORATION
NOTES TO CONSOLIDATED FINANCIAL STATEMENTS
(dollars in millions, except per share, per ounce and per pound amounts)
The Company recorded write-downs classified as components of Costs applicable to sales and Depreciation and amortization to reduce the carrying value of stockpiles and ore on leach pads to net realizable value as follows:
Year Ended December 31,
2025 (1)
2024 (2)
2023 (3)
Costs applicable to sales$25 $48 $60 
Depreciation and amortization10 16 15 
$35 $64 $75 
____________________________
(1)For the year ended December 31, 2025, write-downs primarily related to NGM.
(2)For the year ended December 31, 2024, write-downs primarily related to Red Chris and NGM.
(3)For the year ended December 31, 2023, write-downs primarily related to NGM.
NOTE 18     PROPERTY, PLANT AND MINE DEVELOPMENT
Depreciable Life
(in years)
At December 31, 2025
At December 31, 2024
CostAccumulated
Depreciation
Net Book
Value
CostAccumulated
Depreciation
Net Book
Value (1)
Land $297 $— $297 $253 $— $253 
Facilities and equipment (2)
1-32
24,337 (12,424)11,913 23,362 (11,761)11,601 
Mine development 
1-32
7,329 (3,440)3,889 6,562 (3,533)3,029 
Mineral interests 
1-32
16,997 (4,363)12,634 17,050 (3,569)13,481 
Construction-in-progress 4,577 — 4,577 5,183 — 5,183 
$53,537 $(20,227)$33,310 $52,410 $(18,863)$33,547 
____________________________
(1)During the first quarter of 2024, certain non-core assets were determined to meet the criteria for held for sale. As a result, the related assets, including Property, plant and mine development, net of $4,439, were reclassified to Assets held for sale at December 31, 2024; no amounts related to Property, plant and mine development, net were reclassified to Assets held for sale at December 31, 2025. Refer to Note 3 for additional information.
(2)At December 31, 2025 and 2024, Facilities and equipment includes finance lease right of use assets of $432 and $482, respectively.
Depreciable Life
(in years)
At December 31, 2025At December 31, 2024
Mineral InterestsCostAccumulated
Depreciation
Net Book
Value
CostAccumulated
Depreciation
Net Book
Value (1)
Production stage 
1-32
$12,343 $(4,363)$7,980 $12,191 $(3,569)$8,622 
Development stage 
(2)
1,329 — 1,329 1,386 — 1,386 
Exploration stage 
(2)
3,325 — 3,325 3,473 — 3,473 
$16,997 $(4,363)$12,634 $17,050 $(3,569)$13,481 
____________________________
(1)During the first quarter of 2024, certain non-core assets were determined to meet the criteria for held for sale. As a result, the related assets, including $1,885 of mineral interests included in Property, plant and mine development, net, were reclassified to Assets held for sale. No amounts related to Property, plant and mine development, net were reclassified to Assets held for sale at December 31, 2025. Refer to Note 3 for additional information.
(2)These amounts are currently non-depreciable as these mineral interests have not reached production stage.
NOTE 19     GOODWILL
Changes in the carrying amount of goodwill by reportable segment were as follows:
Balance at December 31, 2023
Acquisitions (1)
Balance at December 31, 2024
Balance at December 31, 2025
Lihir$695 $249 $944 $944 
Cadia565 (316)249 249 
Red Chris397 142 539 539 
Brucejack1,087 (418)669 669 
NGM257 — 257 257 
$3,001 $(343)$2,658 $2,658 
____________________________
(1)Amounts relate to goodwill recognized through the Newcrest transaction on November 6, 2023. During 2024, goodwill was subject to measurement period adjustments to the purchase price allocation. Refer to Note 3 for further information.
177

Table of Contents
NEWMONT CORPORATION
NOTES TO CONSOLIDATED FINANCIAL STATEMENTS
(dollars in millions, except per share, per ounce and per pound amounts)
NOTE 20     DEBT
At December 31, 2025 (1)
At December 31, 2024 (1)
Non-Current
Fair Value (2)
CurrentNon-Current
Fair Value (2)
5.30% Senior Notes due March 2026
$— $— $924 $— $948 
2.80% Senior Notes due October 2029
265 257 — 633 587 
3.25% Senior Notes due May 2030
379 411 — 554 583 
2.25% Senior Notes due October 2030
246 230 — 872 765 
2.60% Senior Notes due July 2032
785 728 — 821 713 
5.35% Senior Notes due March 2034
987 1,061 — 987 1,012 
5.875% Senior Notes due April 2035
502 567 — 581 625 
6.25% Senior Notes due October 2039
275 308 — 861 934 
5.75% Senior Notes due November 2041
292 326 — 457 500 
4.875% Senior Notes due March 2042
562 553 — 949 891 
5.45% Senior Notes due June 2044
460 433 — 479 435 
4.20% Senior Notes due May 2050
365 409 — 363 407 
Debt issuance costs on Corporate Revolving Credit Facilities(3)— — (5)— 
$5,115 $5,283 $924 $7,552 $8,400 
____________________________
(1)All outstanding senior notes are unsecured and rank equally with one another.
(2)The estimated fair value of the senior notes was determined by an independent third-party pricing source and may or may not reflect the actual trading value of this debt.
Maturities for the next five years, and thereafter, are as follows:
Year Ending December 31,
2026$— 
2027— 
2028— 
2029267 
2030671 
Thereafter4,405 
Total face value of debt5,343 
Unamortized premiums, discounts, and issuance costs(228)
Debt$5,115 
Corporate Revolving Credit Facilities and Letters of Credit Facilities
In connection with the Newcrest transaction on November 6, 2023, the Company assumed bilateral bank debt facilities totaling $2,000, of which $1,923 was outstanding at December 31, 2023. In February 2024, the Company repaid the full amount outstanding and terminated the facilities.
On February 15, 2024, the Company amended and restated its $3,000 revolving credit agreement dated as of April 4, 2019 (the “Existing Credit Agreement”) to $4,000 and extended the maturity date from March 30, 2026 to February 15, 2029. The amended facility was entered into with a syndicate of financial institutions and provides for borrowings in U.S. dollars and contains a letter of credit sub-facility.
Interest is based on Term SOFR plus a credit spread adjustment and margin. Facility fees vary based on the credit ratings of the Company’s senior, uncollateralized, non-current debt. Debt covenants under the amendment are substantially the same as the Existing Credit Agreement and the letter of credit sub-facility on the Existing Credit Agreement was retained.
On February 20, 2024, the Company drew $1,461 on the amended facility and used the proceeds, along with existing cash balances, to repay the bilateral bank debt facilities. In March 2024, the Company repaid the full amount drawn on the amended facility as described below under 2026 and 2034 Senior Notes. As a result, the Company had no borrowings outstanding under the amended facility at December 31, 2025 and 2024. There were also no amounts outstanding on the letters of credit sub-facility at December 31, 2025 and 2024.
At December 31, 2025 and 2024 the Company had letters of credit outstanding in the amounts of $1,139 and $1,034, respectively, of which $1,005 and $900 represented guarantees for reclamation obligations, respectively. None of these letters of credit have been drawn on for reclamation obligations as of December 31, 2025 and 2024.
178

Table of Contents
NEWMONT CORPORATION
NOTES TO CONSOLIDATED FINANCIAL STATEMENTS
(dollars in millions, except per share, per ounce and per pound amounts)
2026 and 2034 Senior Notes
On March 7, 2024, the Company issued $2,000 unsecured Senior Notes comprised of $1,000 due March 15, 2026 (“2026 Senior Notes”) and $1,000 due March 15, 2034 ("2034 Senior Notes"). Net proceeds from the 2026 and 2034 Senior Notes were $1,980. Interest will be paid semi-annually at a rate of 5.30% and 5.35% per annum for the 2026 and the 2034 Senior Notes, respectively. The proceeds from this issuance were used to repay the drawdown on the revolving credit facility. The 2026 Senior Notes were fully redeemed in the first quarter of 2025; see below for further information.
Debt Extinguishments
For the year ended December 31, 2025, the Company redeemed senior notes through full and partial redemptions, totaling $3,448 and $51 in principal and accrued interest, respectively. These transactions resulted in a total loss on extinguishment for the year ended December 31, 2025 of $101, recognized in Other income (loss), net, including the acceleration of $54 loss from Accumulated other comprehensive income (loss) related to previously terminated interest rate cash flow hedges.
For the year ended December 31, 2024, the Company redeemed senior notes through partial redemptions, totaling $483 and $4 in principal and accrued interest, respectively. These transactions resulted in a total gain on extinguishment for the year ended December 31, 2024 of $32, recognized in Other income (loss), net, including the acceleration of $6 loss from Accumulated other comprehensive income (loss) related to previously terminated interest rate cash flow hedges.
The following table summarizes the redemptions by senior note:
Year Ended December 31,
2025
2024 (1)
Settled Principal AmountTotal Repurchase AmountSettled Principal AmountTotal Repurchase Amount
5.30% Senior Notes due March 2026 (2)
$928 $957 $72 $74 
2.80% Senior Notes due October 2029
371 357 62 58 
3.25% Senior Notes due May 2030
210 202 17 16 
2.25% Senior Notes due October 2030
631 583 120 107 
2.60% Senior Notes due July 2032
38 32 174 150 
5.35% Senior Noted due March 2034
1 1 — — 
5.875% Senior Notes due April 2035
83 87 — — 
6.25% Senior Notes due October 2039
595 666 — — 
5.75% Senior Notes due November 2041
182 192 — — 
4.875% Senior Notes due March 2042
392 384 38 36 
5.45% Senior Notes due June 2044
17 17 — — 
$3,448 $3,478 $483 $441 
____________________________
(1)Excludes activity related to the bilateral bank debt facilities and the revolving credit facility.
(2)The repurchase amount of the 2026 Senior Notes during 2025 included a make-whole provision of $10.
Debt Covenants
The Company’s senior notes and revolving credit facility contain various covenants and default provisions including payment defaults, limitations on liens, leases, sales and leaseback agreements, merger restrictions, limiting the sale of all or substantially all of the Company’s assets, certain change of control provisions, and a negative pledge on certain assets. Additionally, the corporate revolving credit facility contains a financial ratio covenant requiring the Company to maintain a net debt (total debt net of cash and cash equivalents) to total capitalization ratio of less than or equal to 62.50%. At December 31, 2025, the Company was in compliance with all existing debt covenants.
NOTE 21     LEASE AND OTHER FINANCING OBLIGATIONS
The Company primarily has operating and finance leases for corporate and regional offices, mining equipment, power generation, and transportation. These leases have a remaining lease term of less than 1 year to 32 years, some of which may include options to extend the lease for up to 15 years, and some of which may include options to terminate the lease within 1 year. Some of the Company's leases include payments that vary based on the Company’s level of usage and operations. These variable payments are not included within ROU assets and lease liabilities in the Consolidated Balance Sheets. Additionally, short-term leases, which have an initial term of 12 months or less, are not recorded in the Consolidated Balance Sheets.
179

Table of Contents
NEWMONT CORPORATION
NOTES TO CONSOLIDATED FINANCIAL STATEMENTS
(dollars in millions, except per share, per ounce and per pound amounts)
Total lease cost includes the following components:
Year Ended December 31,
20252024
Operating lease cost$26 $27 
Finance lease cost:
Amortization of ROU assets93 91 
Interest on lease liabilities30 35 
123 126 
Variable lease cost302 509 
Short-term lease cost84 76 
$535 $738 
Supplemental cash flow information related to leases includes the following:
Year Ended December 31,
20252024
Cash paid for amounts included in the measurement of lease liabilities:
Operating cash flows relating to operating leases$24 $20 
Operating cash flows relating to finance leases$30 $34 
Financing cash flows relating to finance leases$95 $87 
Non-cash lease obligations arising from obtaining ROU assets:
Operating leases$45 $10 
Finance leases$54 $59 
Information related to lease terms and discount rates is as follows:
Operating LeasesFinance Leases
Weighted average remaining lease term (years)68
Weighted average discount rate4.39 %6.16 %
Future minimum lease payments under non-cancellable leases as of December 31, 2025, were as follows:
Operating
Leases (1)
Finance Leases
2026$33 $119 
202721 88 
202815 78 
202915 53 
203013 45 
Thereafter26 225 
Total future minimum lease payments123 608 
Less: Imputed interest(14)(134)
Total$109 $474 
____________________________
(1)The current and non-current portion of operating lease liabilities are included in Other current liabilities and Other non-current liabilities, respectively, on the Consolidated Balance Sheets.
As of December 31, 2025, the Company has no additional leases that have not yet commenced.
180

Table of Contents
NEWMONT CORPORATION
NOTES TO CONSOLIDATED FINANCIAL STATEMENTS
(dollars in millions, except per share, per ounce and per pound amounts)
NOTE 22     OTHER LIABILITIES
At December 31,
20252024
Other current liabilities:
Reclamation and remediation liabilities$893 $991 
Accrued operating costs (1)
421 468 
Greatland Option (2)
339 — 
Accrued capital expenditures254 208 
Payables to NGM (3)
227 115 
Accrued royalties181 165 
Silver streaming agreement93 76 
Accrued interest57 97 
Hedging instruments (Note 14)
1 136 
Other (4)
226 225 
$2,692 $2,481 
Other non-current liabilities:
Income and mining taxes (5)
$133 $125 
Indemnification liabilities63 17 
Other (6)
126 146 
$322 $288 
____________________________
(1)In the first quarter of 2025, the Company paid $116 to the Worsley JV related to the waiver of certain rights within the cross-operation agreement that confers priority to the bauxite operations at the Boddington mine. This payment is included in other investing activities in the Consolidated Statement of Cash Flows.
(2)The Greatland Option was acquired through the sale of Telfer in the fourth quarter of 2024 and accounted for under the fair value option with changes in the fair value recognized through earnings each reporting period in Change in fair value of investments and options. The option was included in Other non-current liabilities at December 31, 2024 for $51. In January 2026, the option was exercised resulting in extinguishment. Refer to Note 3 for further information.
(3)Payables to NGM at December 31, 2025 and December 31, 2024 consist of amounts due to NGM representing Barrick's 61.5% proportionate share of the amount owed to NGM for gold and silver purchased by Newmont. Newmont’s 38.5% share of such amounts is eliminated upon proportionate consolidation of its interest in NGM. Receivables for Newmont's 38.5% proportionate share related to NGM's activities with Barrick are presented within Other current assets.
(4)Primarily consists of the taxes other than income and mining taxes and current portion of operating lease liabilities.
(5)Primarily consists of unrecognized tax benefits, including penalties and interest.
(6)Primarily consists of the non-current portion of operating lease liabilities.
NOTE 23     ACCUMULATED OTHER COMPREHENSIVE INCOME (LOSS)
Unrealized Gain (Loss) on Hedge InstrumentsOther AdjustmentsTotal
Balance at December 31, 2023$(70)$84 $14 
Net current-period other comprehensive income (loss):
(Loss) gain in other comprehensive income (loss) before reclassifications(140)13 (127)
Loss (gain) reclassified from accumulated other comprehensive income (loss)17 1 18 
Other comprehensive income (loss)(123)14 (109)
Balance at December 31, 2024(193)98 (95)
Net current-period other comprehensive income (loss):
Gain (loss) in other comprehensive income (loss) before reclassifications140 (9)131 
Loss (gain) reclassified from accumulated other comprehensive income (loss)94 7 101 
Other comprehensive income (loss)234 (2)232 
Balance at December 31, 2025$41 $96 $137 
181

Table of Contents
NEWMONT CORPORATION
NOTES TO CONSOLIDATED FINANCIAL STATEMENTS
(dollars in millions, except per share, per ounce and per pound amounts)
Details about Accumulated Other Comprehensive Income (Loss) ComponentsAmount Reclassified from Accumulated Other Comprehensive 
Income (Loss)
Affected Line Item in the Consolidated Statements of Operations
Year Ended December 31,
202520242023
Hedge instruments adjustments:
Interest rate contracts (1)
$72 $10 $5 
Interest expense, net of capitalized interest
Foreign currency cash flow hedges44 7 19 Costs applicable to sales
Amortization10 5 — Costs applicable to sales
Total before tax126 22 24 
Tax(32)(5)(6)
Net of tax94 17 18 
Other adjustments:
Amortization, Settlements, and Curtailments (2)
11 — — 
Other income (loss), net
Divestitures (3)
(3)— — 
(Gain) loss on sale of assets held for sale
Other— 1 — 
Other income (loss), net
Total before tax8 1 — 
Tax(1)— — 
Net of tax7 1 — 
Total reclassifications for the period, net of tax$101 $18 $18 
____________________________
(1)For the year ended December 31, 2025, includes acceleration of losses related to previously terminated interest rate cash flow hedges resulting from the extinguishment of certain senior notes. The acceleration of loss was recognized in Other income (loss), net. Refer to Note 20 for further information.
(2)Relates to pension and other post-retirement benefits. Refer to Note 11 for more information.
(3)The Company divested the defined benefit pension plan at Porcupine as a result of the divestment on February 28, 2025. As a result, the related amounts held in Accumulated other comprehensive income (loss) were reclassified to (Gain) loss on sale of assets held for sale.
NOTE 24     COMMITMENTS AND CONTINGENCIES
General
Estimated losses from contingencies are accrued by a charge to income when information available prior to issuance of the financial statements indicates that it is probable that a liability could be incurred and the amount of the loss can be reasonably estimated. Legal expenses associated with the contingency are expensed as incurred. If a loss contingency is not probable or reasonably estimable, disclosure of the contingency and estimated range of loss, if determinable, is made in the financial statements when it is at least reasonably possible that a material loss could be incurred.
Operating Segments
The Company’s operating and reportable segments are identified in Note 4. Except as noted in this paragraph, all of the Company’s commitments and contingencies specifically described herein are included in the non-operating segment Corporate and Other. The Yanacocha matters relate to the Yanacocha reportable segment. The Cadia matter relates to the Cadia reportable segment. The CC&V matter relates to CC&V, which was divested in the first quarter of 2025. The Newmont Ghana Gold and Newmont Golden Ridge matters relate to the Ahafo South reportable segment and Akyem, which was divested in the second quarter of 2025, respectively.
Environmental Matters
Refer to Note 6 for further information regarding reclamation and remediation. Details about certain significant matters are discussed below.
Minera Yanacocha S.R.L. - 100% Newmont Owned
In early 2015 and again in June 2017, the Peruvian government agency responsible for certain environmental regulations, MINAM, issued proposed modifications to water quality criteria for designated beneficial uses which apply to mining companies, including Yanacocha. These criteria modified the in-stream water quality criteria pursuant to which Yanacocha has been designing water treatment processes and infrastructure. In December 2015, MINAM issued the final regulation that modified the water quality standards. These Peruvian regulations allow time to formulate a compliance plan and make any necessary changes to achieve compliance.
182

Table of Contents
NEWMONT CORPORATION
NOTES TO CONSOLIDATED FINANCIAL STATEMENTS
(dollars in millions, except per share, per ounce and per pound amounts)
In February 2017, Yanacocha submitted a modification to its previously approved compliance achievement plan to MINEM. In May 2022, Yanacocha submitted a proposed modification to this plan requesting an extension of time for coming into full compliance with the new regulations to 2027. In June 2023, Yanacocha received approval of its updated compliance plan from MINEM and was granted an extension to June 2026 to achieve compliance. The Company appealed this approval to the Mining Council requesting the regulatory extension until 2027, and in April 2024, MINEM approved the compliance schedule.
The Company currently operates five water treatment plants at Yanacocha that have been and currently meet all applicable water discharge requirements. The Company’s current asset retirement obligation includes the cost of the construction of two new water treatment plants expected to be in operation during 2027 and cost associated with post-closure management.
The Company is conducting detailed studies to better estimate water management and other closure activities that will ensure water quality and quantity discharge meet requirements, including the modifications promulgated by MINAM, as referenced above, will be met. This also includes performing a comprehensive update to the Yanacocha reclamation plan to address changes in closure activities and estimated closure costs while preserving optionality for potential future projects at Yanacocha. These ongoing studies, which will extend beyond the current year, continue to evaluate and revise assumptions and estimated costs of changes to the reclamation plan. The ultimate water treatment costs remain uncertain as studies and opportunity assessments continue. These and other additional risks and contingencies that are the subject of ongoing studies, including, but not limited to, a comprehensive review of the Company's tailings storage facility management, review of Yanacocha’s water balance and water management system, and review of post-closure management costs, could result in future material increases to the reclamation obligation at Yanacocha.
Dawn Mining Company LLC (“Dawn”) - 58.19% Newmont Owned
Midnite mine site and Dawn mill site. Dawn previously leased an open pit uranium mine, currently inactive, on the Spokane Indian Reservation in the State of Washington. The mine site is subject to regulation by agencies of the U.S. Department of Interior (the Bureau of Indian Affairs and the Bureau of Land Management), as well as the EPA.
As per the Consent Decree approved by the U.S. District Court for the Eastern District of Washington on January 17, 2012, the following actions were required of Newmont, Dawn, the Department of the Interior and the EPA: (i) Newmont and Dawn would design, construct and implement the cleanup plan selected by the EPA in 2006 for the Midnite mine site; (ii) Newmont and Dawn would reimburse the EPA for its past costs associated with overseeing the work; (iii) the Department of the Interior would contribute a lump sum amount toward past EPA costs and future costs related to the cleanup of the Midnite mine site; (iv) Newmont and Dawn would be responsible for all future EPA oversight costs and Midnite mine site cleanup costs; and (v) Newmont would post a surety bond for work at the site.
During 2012, the Department of Interior contributed its share of past EPA costs and future costs related to the cleanup of the Midnite mine site. In 2016, Newmont completed the remedial design process, with the exception of the new WTP design which was awaiting the approval of the new NPDES permit. Subsequently, the new NPDES permit was received in 2017 and the WTP design commenced in 2018. The EPA approved the WTP design in 2021. Construction of the effluent pipeline began in 2021, and construction of the new WTP began in 2022. The WTP and effluent pipeline are expected to be operating in 2026.
The Dawn mill site is regulated by the Washington Department of Health (the "WDOH") and is in the process of being closed in accordance with the federal Uranium Mill Tailings Radiation Control Act, and associated Washington state regulations. Remediation at the Dawn mill site began in 2013. The Tailing Disposal Area 1-4 reclamation earthworks component was completed during 2017 with the embankment erosion protection completed in the second quarter of 2018. The remaining closure activities consist primarily of finalizing an Alternative Concentration Limit application (the "ACL application") submitted in 2020 to the WDOH to address groundwater issues, and also evaporating the remaining balance of process water at the site. In the fourth quarter of 2022, the WDOH provided comments on the ACL application, which Newmont is evaluating and conducting studies to better understand and respond to the comments provided by the WDOH. These studies and the related comment process will extend beyond the current year and could result in future material increases to the remediation obligation.
The remediation liability for the Midnite mine site and Dawn mill site is approximately $164, assumed 100% by Newmont, at December 31, 2025.
Cadia Holdings Pty Ltd. - 100% Newmont Owned
Cadia Holdings Pty Ltd. (“Cadia Holdings”) is a wholly owned subsidiary of Newcrest, which was acquired by Newmont in November 2023. The mine site is subject to regulations by the New South Wales Environment Protection Authority (the “NSW EPA”). In October 2023, the NSW EPA commenced proceedings in the NSW Land and Environment Court against Cadia Holdings, alleging two contraventions related to alleged air pollution from tailings storage facilities on October 13 and 31, 2022. In 2024, Cadia Holdings entered a plea of not guilty to the charges related to the allegations. On December 19, 2025, the NSW EPA withdrew and discontinued these proceedings. Cadia Holdings and the NSW EPA entered into an enforceable undertaking where Cadia Holdings agreed to pay an amount less than $1 to the NSW Department of Climate Change, Energy, the Environment and Water ("NSW DCCEEW") to support the Rural Dust Monitoring Network managed by Climate and Atmospheric Science and the NSW DCCEEW. Cadia Holdings will also pay an amount less than $1 to the NSW EPA for the costs incurred by the NSW EPA in connection with the incidents and with respect to negotiating and entering into the enforceable undertaking.
183

Table of Contents
NEWMONT CORPORATION
NOTES TO CONSOLIDATED FINANCIAL STATEMENTS
(dollars in millions, except per share, per ounce and per pound amounts)
Additionally, on February 2, 2026, a class action proceeding was commenced in the Supreme Court of New South Wales against Cadia Holdings. The proceeding has been brought on behalf of the named plaintiffs and other persons who fall within a defined class of persons who owned, leased, or occupied land located within a specified area surrounding the Cadia mine during the period from February 2, 2020 to February 3, 2026, and who allege that they have suffered loss or damage as a result of alleged injury to, or interference with, that land. The plaintiffs allege that such loss or damage arose from alleged contamination associated with Cadia Holdings, including alleged contamination of land, public waterways, groundwater, and/or air. The claims assert that the alleged impacts are attributable to dust and fluid emissions from Cadia Holdings’ operations. Plaintiffs seek unspecified monetary damages and other relief. Newmont intends to vigorously defend this matter but cannot reasonably predict the outcome.
Cripple Creek & Victor Gold Mining Company LLC - 100% Newmont Owned through February 28, 2025
On February 28, 2025, the Company completed the sale of the Cripple Creek & Victor Gold Mining Company LLC (“CC&V”) reportable segment to SSR. Under the terms of the agreement with SSR, Newmont expects to receive deferred cash contingent consideration upon certain regulatory approvals, including the resolution of regulatory applications relating to the Carlton Tunnel. In addition, upon completion of an updated regulator-approved closure plan and in the event aggregate closure costs at CC&V exceed $500, Newmont will be responsible for funding 90% of the incremental closure costs exceeding $500 in such updated closure plan, either on an as-incurred basis or pursuant to a net present value lump sum payment option.
The Carlton Tunnel was a historic tunnel completed in 1941 with the purpose of draining the southern portion of the mining district, subsequently consolidated by CC&V. CC&V has held discharge permits for the Carlton Tunnel since 1983, primarily to focus on monitoring. The monitoring data accumulated since the mid-1970s have indicated consistency in the water quality discharged from the Carlton Tunnel over time. In 2006, legal proceedings and work with the regulator confirmed that the water flowing out of the Carlton Tunnel portal is akin to natural spring water and did not constitute mine drainage. However, when the Water Quality Control Division of the Colorado Department of Public Health and Environment (the “Division”) issued new discharge permits in January 2021, the Division imposed new water quality limits. A Settlement Agreement entered into by CC&V and the Division in December 2021 extended the timeframe for full permit compliance to November 2027, and CC&V expressly reserved the right to challenge the need for a discharge permit in the first place. In 2022, the Company studied various interim passive water treatment options, reported the study results to the Division, and based on an evaluation of additional semi-passive options that involve the usage of power at the portal, updated the remediation liability to $20 in 2022. CC&V continues to study alternative long-term remediation plans for water discharged from the Carlton Tunnel, while also continuing to work with regulators to identify and implement the highest feasible alternative treatments. In June 2025, the Water Quality Control Commission agreed to site specific standards for CC&V and a Discharger Specific Variance ("DSV") for certain water quality standards. In January 2026, the Division issued a modification to CC&V's discharge permit to implement site specific standards for certain water quality standards, and a DSV and compliance extension for certain other standards. Depending on the plans that may ultimately be agreed with regulators, a material adjustment to the remediation liability may be required.
Other Legal Matters
Newmont Corporation, as well as Newmont Canada Corporation, and Newmont Canada FN Holdings ULC – 100% Newmont Owned
Kirkland Lake Gold Inc., which was acquired by Agnico Eagle Mines Limited in 2022 (still referred to herein as “Kirkland” for ease of reference), owns certain mining and mineral rights in northeastern Ontario, Canada, referred to here as the Holt-McDermott property, on which it suspended operations in April 2020. A subsidiary of the Company has a retained royalty obligation (“Holt royalty obligation”) to Royal Gold, Inc. (“Royal Gold”) for production on the Holt-McDermott property. In August 2020, the Company and Kirkland signed a Strategic Alliance Agreement (the “Kirkland Agreement”). As part of the Kirkland Agreement, the Company purchased an option (the “Holt option”) for $75 from Kirkland for the mining and mineral rights subject to the Holt royalty obligation. The Company has the right to exercise the Holt option and acquire ownership to the mineral interests subject to the Holt royalty obligation in the event Kirkland intends to resume operations and process material subject to the obligation. Kirkland has the right to assume the Company’s Holt royalty obligation at any time, in which case the Holt option would terminate.
On August 16, 2021, International Royalty Corporation (“IRC”), a wholly-owned subsidiary of Royal Gold, filed an action in the Supreme Court of Nova Scotia against Newmont Corporation, Newmont Canada Corporation, Newmont Canada FN Holdings ULC (collectively "Newmont"), and certain Kirkland defendants (collectively "Kirkland"). IRC alleges the Kirkland Agreement is oppressive to the interests of Royal Gold under the Nova Scotia Companies Act and the Canada Business Corporations Act, and that, by entering into the Kirkland Agreement, Newmont breached its contractual obligations to Royal Gold. IRC seeks declaratory relief, and $350 in alleged royalty payments that it claims Newmont expected to pay under the Holt royalty obligation, but for the Kirkland Agreement. Kirkland filed a motion seeking dismissal of the case against it, which the court granted in October 2022. Newmont submitted its statement of defense on February 27, 2023, and a motion for summary judgment on January 12, 2024. The motion for summary judgment was denied on May 27, 2024, and the parties are now engaged in the discovery phase of the case. Newmont intends to vigorously defend this matter but cannot reasonably predict the outcome.
184

Table of Contents
NEWMONT CORPORATION
NOTES TO CONSOLIDATED FINANCIAL STATEMENTS
(dollars in millions, except per share, per ounce and per pound amounts)
Newmont Ghana Gold Limited - 100% Newmont Owned (and Newmont Golden Ridge Limited owned by Newmont through April 15, 2025)
On December 24, 2018, two individual plaintiffs, who were members of the Ghana Parliament (“Plaintiffs”), filed a writ to invoke the original jurisdiction of the Supreme Court of Ghana. On January 16, 2019, Plaintiffs filed the Statement of Plaintiff’s Case outlining the details of the Plaintiff’s case and subsequently served Newmont Ghana Gold Limited (“NGGL”) and Newmont Golden Ridge Limited (“NGRL”), now Zijin Golden Ridge Limited ("ZGRL"), along with the other named defendants, the Attorney General of Ghana, the Minerals Commission of Ghana and 33 other mining companies with interests in Ghana. The Plaintiffs allege that under article 268 of the 1992 Constitution of Ghana, the mining company defendants are not entitled to carry out any exploitation of minerals or other natural resources in Ghana, unless their respective transactions, contracts or concessions are ratified or exempted from ratification by the Parliament of Ghana. Newmont’s mining leases were both ratified by Parliament; the NGGL June 13, 2001 mining lease, ratified by Parliament on October 21, 2008, and the renewed NGRL September 4, 2024 mining lease, ratified by Parliament on July 24, 2025. The writ alleges that any mineral exploitation prior to Parliamentary ratification is unconstitutional. The Plaintiffs seek several remedies including: (i) a declaration as to the meaning of constitutional language at issue; (ii) an injunction precluding exploitation of minerals for any mining company without prior Parliamentary ratification; (iii) a declaration that all revenue as a result of violation of the Constitution shall be accounted for and recovered via cash equivalent; and (iv) an order that the Attorney General and Minerals Commission submit all unratified mining leases, undertakings or contracts to Parliament for ratification. Newmont intends to vigorously defend this matter but cannot reasonably predict the outcome. On April 15, 2025, the Company completed the sale of the Akyem reportable segment, including NGRL. In the case of an adverse final judgment against NGRL pursuant to a non-appealable governmental order, if any, the Company would be required to indemnify the buyer for certain fines, penalties and disgorgements attributable to the period from the date of the Company’s commencement of commercial production under the mining leases in October 2013 to the date on which the mining leases were ratified by Parliament on December 3, 2015.
Newmont Capital Limited and Newmont Canada FN Holdings ULC – 100% Newmont Owned
The ATO is conducting a limited review of the Company’s prior tax returns. The ATO is reviewing an internal reorganization executed in 2011 when Newmont completed a restructure of the shareholding in the Company’s Australian subsidiaries. To date, the Company has responded to inquiries from the ATO and provided them with supporting documentation for the transaction and the Company’s associated tax positions. One aspect of the ATO review relates to an Australian capital gains tax that applies to sales or transfers of stock in certain types of entities. In the fourth quarter of 2017, the ATO notified the Company that it believes the 2011 reorganization is subject to capital gains tax of approximately $85 (including interest and penalties). The Company disputes this conclusion and is vigorously defending its position that the transaction is not subject to this tax. In the fourth quarter of 2017, the Company made a $24 payment to the ATO and lodged an Appeal with the Australian Federal Court. The court proceedings were held during the third quarter of 2024 and on November 10, 2025, the Company received the judgment. A number of matters were decided, however, no final orders were made and an independent referee was appointed to complete the remaining valuation tasks assigned by the Court. The final orders are expected to be received in the second quarter of 2026. The Company cannot reasonably predict the outcome.
Newmont Corporation
Karas v. Newmont Corp., et al. On January 31, 2025, a putative class action lawsuit was filed against Newmont and Newmont’s, at the time, Chief Executive Officer, Chief Operating Officer, and Chief Financial Officer in the United States District Court for the District of Colorado. The action was brought on behalf of an alleged class of Newmont stockholders who owned stock between February 22, 2024 and October 23, 2024 (the alleged class period). The Court appointed Lead Plaintiffs on May 6, 2025 who filed an amended complaint on July 14, 2025 adding Newmont's Chief Development Officer as a defendant and shortening the alleged class period to July 24, 2024 through October 23, 2024. Plaintiffs allege that the defendants made a series of materially false and misleading statements and/or omissions during the alleged class period regarding the Company’s operations, production, and costs in violation of federal securities laws. Plaintiffs further allege that the purported class members suffered losses and damages resulting from declines in the market value of Newmont’s common stock after the Company announced its third quarter 2024 results and updated guidance on October 23, 2024. Plaintiffs seek unspecified monetary damages and other relief. Defendants filed a motion to dismiss the amended complaint on September 12, 2025. Plaintiffs filed an opposition to that motion on November 4, 2025 and defendants filed a reply brief on December 4, 2025. On November 4, 2025, plaintiffs also filed a motion to strike or to convert defendants' motion to dismiss to a motion for summary judgment and for full discovery. Defendants filed an opposition to that motion on November 12, 2025 and plaintiffs filed a reply brief on November 26, 2025.
Gunderson v. Palmer et al.; Levin v. Palmer et al.; Chin v. Palmer et al.; and Harris v. Palmer et al. On February 21, February 28, March 20, and April 4, 2025, respectively, purported Newmont stockholders filed putative derivative complaints nominally on behalf of Newmont against Newmont’s, at the time, Chief Executive Officer, Chief Operating Officer, Chief Financial Officer, and members of Newmont’s Board of Directors, naming Newmont as a nominal defendant, in the United States District Court for the District of Colorado. While the allegations and asserted claims vary among the actions, the complaints, taken collectively, generally raise similar allegations as the complaint in Karas. The complaints allege, among other things, that: the defendants made a series of materially false and misleading statements and/or omissions beginning on February 22, 2024 regarding the Company's operations, production, and costs; the Company lacked adequate internal controls and oversight over risk management; the defendants made materially false and misleading statements in the Company’s 2024 proxy statement, and there were improper share repurchases by the Company and stock
185

Table of Contents
NEWMONT CORPORATION
NOTES TO CONSOLIDATED FINANCIAL STATEMENTS
(dollars in millions, except per share, per ounce and per pound amounts)
sales by the Company’s Chief Executive Officer during the period February 22, 2024 to October 23, 2024; and assert claims under federal securities law (other than in the Chin case) and Delaware state law. Plaintiffs seek unspecified monetary damages, restitution, disgorgement and other relief, including reforms to the Company’s corporate governance. On March 19, 2025, on motion from plaintiffs in Gunderson and Levin, the court consolidated Levin into Gunderson, and appointed lead plaintiffs in the consolidated case. On May 1, 2025, on motion from plaintiffs in Gunderson, Levin, Chin, and Harris, the court consolidated Chin and Harris into Gunderson. On May 7, 2025, upon joint motion from the parties in Gunderson, the court stayed the consolidated action pending the resolutions of all motions to dismiss the operative complaint in Karas.
Willis v. Palmer et al. On May 9, 2025, a purported Newmont stockholder filed a putative derivative complaint nominally on behalf of Newmont against Newmont’s, at the time, Chief Executive Officer, Chief Operating Officer, Chief Financial Officer, and members of Newmont’s Board of Directors, naming Newmont as a nominal defendant, in the United States District Court for the District of Delaware. The complaint generally raises similar allegations and requests similar relief as the complaints in the District of Colorado consolidated derivative actions, described above. On May 28, 2025, upon stipulation and agreement by the parties, the court stayed the action pending the resolution of all motions to dismiss the operative complaint in Karas.
Newmont intends to vigorously defend these matters, but cannot reasonably predict the outcome of any matter.
Other Commitments and Contingencies
As part of its ongoing business and operations, the Company and its affiliates are required to provide surety bonds, bank letters of credit, and bank guarantees as financial support for various purposes, including environmental remediation, reclamation, exploration permitting, workers compensation programs, and other general corporate purposes. At December 31, 2025 and 2024, there were $1,943 and $2,086, respectively, of outstanding letters of credit, surety bonds, and bank guarantees. The obligations associated with these instruments are generally related to performance requirements that the Company addresses through its ongoing operations. As the specific requirements are met, the beneficiary of the associated instrument cancels and/or returns the instrument to the issuing entity. Certain of these instruments are associated with operating sites with long-lived assets and will remain outstanding until closure. Generally, bonding requirements associated with environmental regulation are becoming more restrictive. However, the Company believes it is in compliance with all applicable bonding obligations and will be able to satisfy future bonding requirements through existing or alternative means, as they arise.
Newmont is from time to time involved in various legal proceedings related to its business. Except in the above described proceedings, management does not believe that adverse decisions in any pending or threatened proceeding or that amounts that may be required to be paid by reason thereof will have a material adverse effect on the Company’s financial condition or results of operations.
In connection with the Company's investment in Galore Creek, Newmont will owe NovaGold Resources Inc. $75 upon the earlier of approval to construct a mine, mill and all related infrastructure for the Galore Creek project or the initiation of construction of a mine, mill or related infrastructure. The amount due is non-interest bearing. The decision for an approval and commencement of construction is contingent on the results of a prefeasibility study which is currently under way and feasibility study which has not yet occurred.
186

Table of Contents
ITEM 9.       CHANGES IN AND DISAGREEMENTS WITH ACCOUNTANTS ON ACCOUNTING AND FINANCIAL DISCLOSURE
None.
ITEM 9A.       CONTROLS AND PROCEDURES
Evaluation of Disclosure Controls and Procedures
The Company’s management, with the participation of the Chief Executive Officer and Chief Financial Officer of the Company, carried out an evaluation of the effectiveness of the design and operation of the Company’s disclosure controls and procedures (as defined in Rules 13a-15(e) and 15d-15(e) of the Securities Exchange Act of 1934, as amended (the “Exchange Act”)) as of December 31, 2025, the end of the period covered by this report. Based on such evaluation, the Company’s Chief Executive Officer and Chief Financial Officer have concluded that, as of December 31, 2025, the Company’s disclosure controls and procedures are effective to ensure information required to be disclosed by the Company in reports it files or submits under the Exchange Act is recorded, processed, summarized and reported within the required time periods and are designed to ensure that information required to be disclosed in its reports is accumulated and communicated to the Company’s management, including the Chief Executive Officer and Chief Financial Officer, as appropriate to allow timely decisions regarding required disclosure.
Management’s Report on Internal Control over Financial Reporting
The management of the Company is responsible for establishing and maintaining adequate internal control over financial reporting. Internal control over financial reporting is a process designed by, or under the supervision of, the Company’s principal executive and principal financial officers and effected by the Company’s Board of Directors, management and other personnel, to provide reasonable assurance regarding the reliability of financial reporting and the preparation of financial statements for external purposes in accordance with GAAP. Because of its inherent limitations, internal control over financial reporting may not prevent or detect misstatements. Also, projections of any evaluation of effectiveness to future periods are subject to risk that controls may become inadequate because of changes in conditions, or that the degree of compliance with the policies or procedures may deteriorate.
The Company’s management assessed the effectiveness of the Company’s internal control over financial reporting at December 31, 2025. In making this assessment, the Company’s management used the criteria set forth by the Committee of Sponsoring Organizations of the Treadway Commission (COSO) in Internal Control-Integrated Framework 2013. Based upon its assessment, management concluded that, at December 31, 2025, the Company’s internal control over financial reporting was effective.
As permitted by the SEC Staff interpretive guidance for proportionately consolidated entities, the Company’s management excluded NGM from its assessment of internal control over financial reporting at December 31, 2025, as management does not have the ability to dictate, modify or assess the controls at NGM. The Company has implemented internal controls over financial reporting for recognizing its proportionate share of the assets, liabilities, and operations of NGM. Refer to Item 8 "Financial Statements and Supplementary Data" for NGM's "Report of Independent Registered Public Accounting Firm" for Opinion on the Financial Statements and Internal Controls over Financial Reporting.
NGM represented 13% of the Company’s consolidated Total assets at December 31, 2025, while its Sales comprised 16% of the Company’s consolidated sales and its Net income attributable to Newmont stockholders comprised 22% of the Company's net income for the year ended December 31, 2025.
Ernst & Young LLP, an independent registered public accounting firm that audited the consolidated financial statements of the Company included in this Annual Report on Form 10-K, has issued an attestation report on the effectiveness of the Company's internal control over financial reporting as of December 31, 2025. The report, which expresses an unqualified opinion on the effectiveness of the Company's internal control over financial reporting as of December 31, 2025, is included in this Item under the heading "Report of Independent Registered Public Accounting Firm."
Changes in Internal Controls
Subject to the above, there were no changes in the Company’s internal control over financial reporting that occurred during the three months ended December 31, 2025, that have materially affected, or are reasonably likely to materially affect, our internal controls over financial reporting.
187

Table of Contents
REPORT OF INDEPENDENT REGISTERED PUBLIC ACCOUNTING FIRM
To the Stockholders and Board of Directors of Newmont Corporation
Opinion on Internal Control Over Financial Reporting
We have audited Newmont Corporation’s internal control over financial reporting as of December 31, 2025, based on criteria established in Internal Control—Integrated Framework issued by the Committee of Sponsoring Organizations of the Treadway Commission (2013 framework) (the COSO criteria). In our opinion, Newmont Corporation (the Company), based on our audit and the report of PricewaterhouseCoopers LLP, maintained, in all material respects, effective internal control over financial reporting as of December 31, 2025, based on the COSO criteria.
We did not audit the effectiveness of internal control over financial reporting of Nevada Gold Mines LLC, a 38.5% owned investment which is proportionately consolidated, whose financial statements reflect total assets constituting 13% of consolidated assets as of December 31, 2025 and sales constituting 16% of consolidated sales for the year ended December 31, 2025. The effectiveness of Nevada Gold Mines LLC’s internal control over financial reporting was audited by PricewaterhouseCoopers LLP, whose report has been furnished to us, and our opinion, insofar as it relates to the effectiveness of Nevada Gold Mines LLC’s internal control over financial reporting, is based solely on the report of PricewaterhouseCoopers LLP.
We also have audited, in accordance with the standards of the Public Company Accounting Oversight Board (United States), the consolidated balance sheets of the Company as of December 31, 2025 and 2024, the related consolidated statements of operations, comprehensive income (loss), changes in equity and cash flows for each of the three years in the period ended December 31, 2025, the related notes and financial statement schedule in Item 15, and our report dated February 19, 2026 expressed an unqualified opinion thereon, based on our audit and the report of PricewaterhouseCoopers LLP.
Basis for Opinion
The Company’s management is responsible for maintaining effective internal control over financial reporting and for its assessment of the effectiveness of internal control over financial reporting included in the accompanying Management’s Report on Internal Control over Financial Reporting. Our responsibility is to express an opinion on the Company’s internal control over financial reporting based on our audit. We are a public accounting firm registered with the PCAOB and are required to be independent with respect to the Company in accordance with the U.S. federal securities laws and the applicable rules and regulations of the Securities and Exchange Commission and the PCAOB.
We conducted our audit in accordance with the standards of the PCAOB. Those standards require that we plan and perform the audit to obtain reasonable assurance about whether effective internal control over financial reporting was maintained in all material respects.
Our audit included obtaining an understanding of internal control over financial reporting, assessing the risk that a material weakness exists, testing and evaluating the design and operating effectiveness of internal control based on the assessed risk, and performing such other procedures as we considered necessary in the circumstances. We believe that our audit and the report of PricewaterhouseCoopers LLP provide a reasonable basis for our opinion.
Definition and Limitations of Internal Control Over Financial Reporting
A company’s internal control over financial reporting is a process designed to provide reasonable assurance regarding the reliability of financial reporting and the preparation of financial statements for external purposes in accordance with generally accepted accounting principles. A company’s internal control over financial reporting includes those policies and procedures that (1) pertain to the maintenance of records that, in reasonable detail, accurately and fairly reflect the transactions and dispositions of the assets of the company; (2) provide reasonable assurance that transactions are recorded as necessary to permit preparation of financial statements in accordance with generally accepted accounting principles, and that receipts and expenditures of the company are being made only in accordance with authorizations of management and directors of the company; and (3) provide reasonable assurance regarding prevention or timely detection of unauthorized acquisition, use, or disposition of the company’s assets that could have a material effect on the financial statements.
Because of its inherent limitations, internal control over financial reporting may not prevent or detect misstatements. Also, projections of any evaluation of effectiveness to future periods are subject to the risk that controls may become inadequate because of changes in conditions, or that the degree of compliance with the policies or procedures may deteriorate.
/s/ Ernst & Young LLP
Denver, Colorado
February 19, 2026
188

Table of Contents
ITEM 9B.       OTHER INFORMATION
Rule 10b5-1 Trading Plans
Our directors and executive officers may purchase or sell shares of our common stock in the market from time to time, including pursuant to equity trading plans adopted in accordance with Rule 10b5-1 under the Exchange Act and in compliance with guidelines specified by the Company’s stock trading standard, which has been filed and incorporated by reference as Exhibit 19 to this annual report. In accordance with Rule 10b5-1 and the Company’s stock trading standard, directors, officers and certain employees who, at such time, are not in possession of material non-public information about the Company are permitted to enter into written plans that pre-establish amounts, prices and dates (or formula for determining the amounts, prices and dates) of future purchases or sales of the Company’s stock, including shares acquired pursuant to the Company’s employee and director equity plans (a “Rule 10b5-1 Trading Plan”). Under the Company’s stock trading standard, the first trade made pursuant to a Rule 10b5-1 trading plan may take place no earlier than 90 days after adoption of the trading plan. Under a Rule 10b5-1 trading plan, a broker executes trades pursuant to parameters established by the director or executive officer when entering into the plan, without further direction from them. The use of these trading plans permits asset diversification as well as financial and tax planning. Our directors and executive officers also may buy or sell additional shares outside of a Rule 10b5-1 plan when they are not in possession of material nonpublic information, subject to compliance with SEC rules, the terms of our stock trading standard and holding requirements. During the three months ended December 31, 2025, the following directors and executive officers adopted Rule 10b5-1 trading plans intended to satisfy the affirmative defense conditions of Rule 10b5-1(c):
On October 30, 2025, Tom Palmer, Chief Executive Officer and Director, adopted a 10b5-1 Trading Plan with a term of 12 months, and provided for the sale of up to 240,000 shares of common stock pursuant to the terms of the plan. The adoption of such 10b5-1 Trading Plan occurred during an open insider trading window and complied with the Company’s standards on insider trading. Mr. Palmer retired on December 31, 2025 and is no longer a Section 16 officer.
On December 1, 2025, Peter Wexler, Executive Vice President, Chief Legal Officer and Interim Chief Financial Officer, adopted a 10b5-1 Trading Plan with a term of 9 months, and provided for the sale of up to 13,378 shares of common stock pursuant to the terms of the plan. The adoption of such 10b5-1 Trading Plan occurred during an open insider trading window and complied with the Company’s standards on insider trading.
On December 17, 2025, Peter Toth, Executive Vice President, Chief Sustainability and Development Officer, adopted a 10b5-1 Trading Plan with a term of 12 months, and provided for the sale of up to 36,000 shares of common stock pursuant to the terms of the plan. The adoption of such 10b5-1 Trading Plan occurred during an open insider trading window and complied with the Company’s standards on insider trading.
On November 24, 2025, Mark Rodgers, Managing Director, Africa-Asia Pacific, adopted a 10b5-1 Trading Plan with a term of approximately 4 months, and provided for the sale of up to 38,845 shares of common stock pursuant to the terms of the plan. The adoption of such 10b5-1 Trading Plan occurred during an open insider trading window and complied with the Company’s standards on insider trading. Mr. Rogers was not a Section 16 officer at the time of execution of the listed 10b5-1 plan and was subsequently designated a Section 16 officer effective as of January 1, 2026.
On December 1, 2025, David Thornton, Managing Director, Americas, adopted a 10b5-1 Trading Plan with a term of 9 months, and provided for the sale of up to 43,964 shares of common stock pursuant to the terms of the plan. The adoption of such 10b5-1 Trading Plan occurred during an open insider trading window and complied with the Company’s standards on insider trading. Mr. Thornton was not a Section 16 officer at the time of execution of the listed 10b5-1 plan and was subsequently designated a Section 16 officer effective as of January 1, 2026.
During the three months ended December 31, 2025, no Section 16 directors and officers amended or terminated existing Rule 10b5-1 trading plans.
ITEM 9C.       DISCLOSURE REGARDING FOREIGN JURISDICTIONS THAT PREVENT INSPECTIONS
Not applicable.
189

Table of Contents
PART III
ITEM 10.       DIRECTORS, EXECUTIVE OFFICERS AND CORPORATE GOVERNANCE
Information concerning Newmont’s executive officers, as of January 1, 2026, is set forth below:
NameAgeOffice
Natascha Viljoen (1)
55
President and Chief Executive Officer
Peter Wexler
58
Executive Vice President, Chief Legal Officer, and Interim Chief Financial Officer
Peter Toth56
Executive Vice President and Chief Sustainability and Development Officer
Francois Hardy
54
Executive Vice President and Chief Technical Officer
Jennifer Cmil55Executive Vice President and Chief People Officer
Brian Tabolt
44Senior Vice President, Global Finance and Chief Accounting Officer
Mark Rodgers (2)
61
Managing Director, Africa Asia Pacific
David Thornton (2)
45
Managing Director, Americas
David Fry (2)
46
Group Head, Projects and Studies
____________________________
(1)Tom Palmer stepped down from his role as Chief Executive Officer and as a member of the Board of Directors (the “Board”) on December 31, 2025 in connection with a planful leadership transition process. Natascha Viljoen was promoted from the role of President and Chief Operating Officer to President and Chief Executive Officer, effective January 1, 2026 and joined the Board as a non-independent director, effective as of the same date.
(2)Messrs. Rodgers, Thornton and Fry were each designated as Section 16 officers effective as of January 1, 2026, in coordination with Ms. Viljoen's appointment.
There are no family relationships by blood, marriage or adoption among any of the above executive officers or members of the Board of Directors of Newmont. Each executive officer is elected annually by the Board of Directors of Newmont to serve for one year or until his or her respective successor is elected and qualified. There is no arrangement or understanding between any of the above executive officers and any other person pursuant to which he or she was selected as an executive officer.
Ms. Viljoen was elected as President and Chief Executive Officer and as a member of the Board of Directors effective January 1, 2026. Ms. Viljoen joined Newmont’s Executive Leadership Team in October 2023 as Executive Vice President and Chief Operating Officer and was promoted to President and Chief Operating Officer in July 2025. Prior to joining Newmont, Ms. Viljoen served as Chief Executive Officer of Anglo American’s platinum business in South Africa since 2020, having previously held a series of operating and technical positions within the organization, including as Group Head of Processing. Prior to joining Anglo American, she spent six years at Lonmin, where she served on the executive committee as Executive Vice President of Processing, also with responsibility for several wider corporate functions, including sustainability. Ms. Viljoen holds an EMBA from the University of Cape Town and a Bachelor of Engineering from North West University.
Mr. Wexler joined Newmont in March 2024 as Executive Vice President and Chief Legal Officer. Effective July 11, 2025, Mr. Wexler was appointed interim Chief Financial Officer, and he will serve in the dual CLO / CFO role until a permanent CFO successor is elected. Mr. Wexler is a seasoned legal and risk management leader with more than three decades of international experience, including managing legal, risk, compliance, M&A, antitrust, litigation and corporate governance affairs within the industrial, technology, energy management, engineering, manufacturing and construction sectors. Before joining Newmont, he served as Chief Legal Officer at Schneider Electric, a Fortune Global 500 business, for 15 years. Prior to that, Mr. Wexler served as in-house counsel overseeing legal, risk and compliance at various companies, including American Power Conversion Corporation. Mr. Wexler holds a J.D. from American University Washington College of Law and a B.A. in History and Political Science from the University of Vermont.
Mr. Toth has served as Executive Vice President and Chief Sustainability and Development Officer since March 2025, after previously serving as Executive Vice President and Chief Development Officer since June 2023. Mr. Toth joined Newmont in July 2022 as Executive Vice President, Strategic Development and his role was expanded to include Sustainability in September of 2022 to become Executive Vice President and Chief Strategy and Sustainability Officer. Prior to joining Newmont, Mr. Toth worked at Rio Tinto from April 2014, with his last role being Group Executive, Strategy and Development, with accountability for business development/M&A, strategic partnerships, climate and sustainability strategy, closure, and exploration. Mr. Toth has more than 25 years of leadership experience working in the resources industry across various commodities. Mr. Toth has held senior strategic, commercial, and operational roles across Europe, Singapore, Australia and the United Kingdom with Rio Tinto, BHP, and OM Holdings. Mr. Toth holds a Bachelor of Business degree from Monash University, a Graduate Certificate in Management from Deakin University, and a Master of International Business degree from the University of Melbourne, in addition to executive development programs at INSEAD, Stanford and Oxford University.
Mr. Hardy has served as Executive Vice President and Chief Technical Officer since January 20206, having served as Chief Technology Officer from May 2024 to December 2025 and as Senior Vice President, Exploration from February 2022 to April 2024. Prior to this role he served as Regional Senior Vice President, Africa since April 2019. Prior to that he served as Regional Project Director for Newmont Australia and as the General Manager of Tanami gold mine where he led a team responsible for improving the operation into a world class asset. He joined Newmont in May 2002 and over his tenure has held a number of roles in Global Program Management,
190

Table of Contents
Business Excellence, Technical Services and Senior Site Leadership roles at several Newmont assets in Australia. Prior to Newmont, Mr. Hardy held positions at Avmin Ltd, De Beers Consolidated Mines and Anglovaal Ltd. Mr. Hardy holds a Bachelor's degree in Mine Engineering from Technikon Witwatersrand, a National Higher Diploma in Metalliferous Mining from the University of Johannesburg as well as Management Certificate of Competencies for Western Australia and South Africa.
Ms. Cmil is Executive Vice President and Chief People Officer of Newmont, positions she has held since October 2019. Prior to that, Ms. Cmil served as Senior Vice President, Human Resources since June 2019 and as Vice President, Talent Management since February 2018. Ms. Cmil first joined Newmont in 2010 as Senior Director, Human Resources. Prior to joining Newmont, Ms. Cmil held leadership positions in human resources across multiple industries, including Vice President of Human Resources at Level 3 Telecommunications, Senior Human Resources Director at KB Home and Human Resources Partner at Sun Microsystems, where she began her career in 1994. Ms. Cmil holds a Bachelor of Science degree from Syracuse University and a Master of Industrial and Labor Relations from Cornell University.
Mr. Tabolt was appointed to Senior Vice President, Global Finance and Chief Accounting Officer in December 2024. Mr. Tabolt held a strategic leadership role as Group Head, Financial Planning and Analysis since May 2023. Prior to that, Mr. Tabolt was elected Interim Chief Financial Officer in November 2022 after having served as Vice President, Controller and Chief Accounting Officer since May 2021. Before joining Newmont Corporation, Mr. Tabolt served as Molson Coors Beverage Company’s Vice President, Controller and Chief Accounting Officer since 2014 and held other senior management roles within Molson Coors’ Accounting function, including as Senior Director of SEC Reporting and Technical Accounting and Senior Manager Technical Accounting. Mr. Tabolt began his career in public accounting with Deloitte, holds Bachelor and Master of Science degrees in Accounting from Pennsylvania State University and is a Certified Public Accountant.
Mr. Rodgers is Managing Director of Newmont's Africa, Asia Pacific Business Unit. Prior to that role, he served as Managing Director, APAC beginning in December 2024 until October 2025, and Managing Director, LATAC (Senior Vice President, South America) from October 2022 to August 2024. Mr. Rodgers also served as Senior Vice President, North America from August 2021 to October 2022 and Vice President, Productivity Australia from April 2020 to August 2021. Before joining Newmont, he held a number of senior leadership positions with Rio Tinto and BHP, building a career spanning more than 30 years in the resources sector. Mr. Rodgers holds a Bachelor of Science degree in Mineral Processing (Extractive Metallurgy) from Murdoch University and a Post‑graduate qualification in Mineral Economics from Curtin University, Western Australia School of Mines.
Mr. Thornton is Managing Director of Newmont's Americas Business Unit. Prior to that role, he served as Managing Director, Latin America and Caribbean from August 2024 to October 2025, having previously served as Managing Director, Africa from August 2024 to February 2022 and Vice President, Productivity North America from March 2020 to February 2022. Prior to that he held several operational management roles including Vice President, Operations for USA & Canada; General Manager, Carlin Mine; and Mine Manager, Leeville Mine. Before joining Newmont in 2013, Mr. Thornton held operational and technical leadership roles with Gold Fields and Barrick. He holds a Bachelor’s Degree in Mining Engineering from Curtin University, Western Australia School of Mines, and an Executive MBA from the University of Utah.
Mr. Fry joined Newmont in December 2022 as Senior Vice President, Projects, and was appointed Group Head, Projects in May 2023 and to Group Head, Projects and Studies in January 2026. Prior to joining Newmont, Mr. Fry served in several senior leadership roles at Rio Tinto, including Managing Director, Projects for four years and Managing Director, Project Services prior to that. He also held leadership positions at UGL, Origin Energy, and Energex, bringing extensive experience across major capital projects, engineering, and energy operations. Mr. Fry holds a Master’s Degree in Project Management from the University of Southern Queensland and a Master’s Degree in Finance from the Queensland University of Technology.
The information about directors required by Item 401(a), (d), (e) and (f) of Regulation S-K and contained under the heading “Election of Directors” in the Notice of the 2026 Annual Meeting of Stockholders and 2026 Proxy Statement, to be filed pursuant to Regulation 14A promulgated under the Securities Exchange Act of 1934 for the 2026 Annual Stockholders Meeting (the “2026 Proxy Statement”), is incorporated by reference into this annual report on Form 10-K.
The information required by Item 405 of Regulation S-K and contained under the heading “Delinquent Section 16(a) Reports” in the 2026 Proxy Statement is incorporated by reference into this annual report on Form 10-K.
The information required by Item 406 of Regulation S-K and contained under the heading “Corporate Governance—Code of Conduct” in the 2026 Proxy Statement is incorporated by reference into this annual report on Form 10-K.
The information required by Item 407(d)(4) and (5) of Regulation S-K and contained under the heading “Committees of the Board of Directors and Attendance—Committee Memberships” in the 2026 Proxy Statement is incorporated by reference into this annual report on Form 10-K.
The information required by Item 408(b) of Regulation S-K and contained under the heading “Executive Compensation Policies and Practices — Restrictions on Trading Stock” in the 2026 Proxy Statement is incorporated by reference into this annual report on Form 10-K.
191

Table of Contents
ITEM 11.       EXECUTIVE COMPENSATION
The information required by Item 402 of Regulation S-K and contained under the headings “Compensation Discussion and Analysis,” “2025 Executive Compensation Tables,” “Additional Benefits and Tables,” and “Corporate Governance — Director Compensation” in the 2026 Proxy Statement is incorporated by reference into this annual report on Form 10-K.
The information required by Item 407(e)(5) of Regulation S-K and contained under the heading “Report of the Leadership Development and Compensation Committee on Executive Compensation” in the 2026 Proxy Statement is incorporated by reference into this annual report on Form 10-K.
ITEM 12.       SECURITY OWNERSHIP OF CERTAIN BENEFICIAL OWNERS AND MANAGEMENT AND RELATED STOCKHOLDER MATTERS
Equity Compensation Plan Information
The following table sets forth at December 31, 2025 information regarding Newmont’s Common Stock that may be issued under Newmont’s equity compensation plans:
Number of Securities to be issued upon exercise of outstanding options, warrants and rightsWeighted average exercise price of outstanding options, warrants and rightsNumber of securities remaining available for future issuance under equity compensation plans (excluding securities reflected in column (a))
Plan Category(a)
(b) (1)
(c)
Equity compensation plans approved by security holders (2)
4,661,686 N/A18,214,007 
(3)
Equity compensation plans not approved by security holders— N/A— 
____________________________
(1)The weighted average exercise price does not take into account the shares issuable upon vesting of restricted stock units, performance leveraged stock units.
(2)Newmont’s 2020 Stock Incentive Plan was approved by the stockholders on April 21, 2020. A maximum of 20,000,000 shares of Newmont's Common Stock, plus up to 3,644,782 shares available for grant under the 2013 Incentive Plan as of May 1, 2020, were authorized to be issued under the 2013 Stock Incentive Plan at that time. There are currently 18,214,007 shares registered and available to grant under the 2020 Stock Incentive Plan. There are no equity compensation plans not approved by stockholders.
(3)Securities remaining available for future issuance under the 2020 Stock Incentive Plan. No additional grants or awards will be made under any of the Company’s other plans.
The information required by Item 403 of Regulation S-K and contained under the heading “Beneficial Ownership of Common Stock” in the 2026 Proxy Statement is incorporated by reference into this annual report on Form 10-K.
ITEM 13.       CERTAIN RELATIONSHIPS AND RELATED TRANSACTIONS, AND DIRECTOR INDEPENDENCE
The information required by Item 404 of Regulation S-K and contained under the heading “Corporate Governance—Related Person Transactions” in the 2026 Proxy Statement is incorporated by reference into this annual report on Form 10-K.
The information required by Item 407(a) of Regulation S-K and contained under the heading “Proposal One—Election of Directors—Independence of Directors” in the 2026 Proxy Statement is incorporated by reference into this annual report on Form 10-K.
ITEM 14.       PRINCIPAL ACCOUNTANT FEES AND SERVICES
The information required by Item 9(e) of Schedule 14A and contained under the heading “Proposal Three — Ratification of Appointment of Independent Registered Public Accounting Firm” and “Independent Auditors Fees” in the 2026 Proxy Statement is incorporated by reference into this annual report on Form 10-K.
192

Table of Contents
PART IV
ITEM 15.       EXHIBITS, FINANCIAL STATEMENT SCHEDULES
The following documents are filed as a part of this report:
Financial Statements
The Consolidated Financial Statements, together with the reports of the independent auditors thereon dated February 19, 2026, are included as part of Item 8, Financial Statements and Supplementary Data.
Page
Financial Statement Schedules:
Included on page SCH-2 is Schedule II - Valuation and Qualifying Accounts.
Exhibits:
Exhibit
Number
Description
3.1-
3.2-
4.1-
4.2-
4.3-
4.4-
4.5-
4.6-
4.7-
4.8-
193

Table of Contents
4.9-
4.10-
4.11-
4.12-
4.13-
4.14-
4.15-
4.16-
4.17-
4.18-
4.19-
4.20-
4.21-
4.22-
4.23-
Pursuant to Item 601(b)(4)(iii) of Regulation S-K, copies of instruments defining the rights of holders of certain long-term debt are not filed. The Registrant agrees to furnish copies thereof to the Securities and Exchange Commission upon request.
4.24-
10.1*-
10.2*-
10.3*-
10.4*-
194

Table of Contents
10.5*-
10.6*-
10.7*-
10.8*-
10.9*-
10.10*-
10.11*-
10.12*-
10.13*-
10.14*-
10.15*-
10.16*-
10.17*-
10.18*-
10.19*-
10.20*-
10.21*-
195

Table of Contents
10.22*-
10.23*-


10.24*-
10.25*-
10.26*-
10.27*-
10.28*-
10.29*-
10.30*-
10.31*-
10.32*-
10.33-
10.34-
10.35-
10.36-
10.37-
10.38-
19-
21-
196

Table of Contents
22-
23.1-
23.2-
23.3-
23.4-
24-
31.1-
31.2-
32.1-
32.2-
95-
96.1-
96.2-
96.3-
96.4-
96.5-
97.1-
101-101.INSXBRL Instance - the instance document does not appear in the Interactive Data File because its XBRL tags are embedded within the Inline XBRL document.
101.SCHXBRL Taxonomy Extension Schema
101.CALXBRL Taxonomy Extension Calculation
101.DEFXBRL Taxonomy Extension Definition
101.LABXBRL Taxonomy Extension Labels
101.PREXBRL Taxonomy Extension Presentation
104-Cover Page Interactive Data File (embedded within the XBRL document)
____________________________

*These exhibits relate to executive compensation plans and arrangements.

ITEM 16.       FORM 10-K SUMMARY
None.
197

Table of Contents
SIGNATURES
Pursuant to the requirements of Section 13 or 15(d) of the Securities Exchange Act of 1934, the registrant has duly caused this Annual Report on Form 10-K to be signed on its behalf by the undersigned, thereunto duly authorized.
NEWMONT CORPORATION
By:
/s/ PETER I. WEXLER
Executive Vice President, Chief Legal Officer, and Interim Chief Financial Officer
February 19, 2026
Pursuant to the requirements of the Securities Exchange Act of 1934, this report has been signed below by the following persons on behalf of the registrant and in the capacities indicated on February 19, 2026.
SignatureTitle
 *
President, Chief Executive Officer and Director
Natascha Viljoen(Principal Executive Officer)
*
Executive Vice President, Chief Legal Officer, and Interim Chief Financial Officer
Peter I. Wexler
(Principal Financial Officer)
*
Senior Vice President, Global Finance and Chief Accounting Officer
Brian C. Tabolt(Principal Accounting Officer)
Gregory H. Boyce*Non-Executive Chair
Bruce R. Brook*Director
Maura J. Clark*Director
Harry M. Conger, IV*
Director
Emma FitzGerald*Director
Sally-Anne Layman*
Director
José Manuel Madero Garza*
Director
René Médori*Director
Jane Nelson*Director
Julio M. Quintana*Director
David Seaton*
Director
*By:
/s/ PETER I. WEXLER
Peter I. Wexler
Attorney-in-Fact

SCH- 1

Table of Contents
SCHEDULE II-VALUATION AND QUALIFYING ACCOUNTS
(dollars in millions except per share)
Year Ended December 31,
202520242023
Deferred Income Tax Valuation Allowance
Balance at beginning of year$4,363 $4,652 $3,994 
Additions due to acquisition of Newcrest— 168 300 
Additions to deferred income tax expense498 80 565 
Reduction of deferred income tax expense(203)(382)(207)
Additions and reductions reflected in other components of the financial statements124 (155)— 
Balance at end of year$4,782 $4,363 $4,652 
Refer to Note 10 to the Consolidated Financial Statements for additional information.
SCH- 2

Exhibit 4.24

DESCRIPTION OF THE REGISTRANT’S SECURITIES
REGISTERED PURSUANT TO SECTION 12
OF THE SECURITIES EXCHANGE ACT OF 1934

As of the date of the Annual Report on Form 10-K of which this exhibit is part, Newmont Corporation (“we”, “Newmont” or the “Company”) has one class of securities registered under Section 12 of the Securities Exchange Act of 1934, as amended (the “Exchange Act”): our common stock, $1.60 par value per share (“Common Stock”).

DESCRIPTION OF CAPITAL STOCK

The rights of our stockholders are governed by the applicable provisions of the Delaware General Corporation Law (the "DGCL"), our Certificate of Incorporation and our By-Laws. The following is a summary of the material terms of our capital stock. For additional information regarding our capital stock, please refer to the applicable provisions of the DGCL, our Certificate of Incorporation and our By-Laws.

At December 31, 2025, we had 2,555,000,000 shares of authorized capital stock. Those shares consisted of:

•2,550,000,000 shares of Common Stock, par value $1.60 per share, of which 1,088,530,848 shares were outstanding; and
•5,000,000 shares of preferred stock, par value $5.00 per share, none of which is outstanding.

Common Stock

The following is a summary of the terms of our Common Stock. For additional information regarding our Common Stock, please refer to our Certificate of Incorporation, our By-Laws and the applicable provisions of the DGCL.

Dividend Rights

Holders of our Common Stock may receive dividends when, as and if declared by our Board of Directors out of funds of Newmont legally available for the payment of dividends. Subject to the terms of any outstanding preferred stock, holders of our Common Stock may not receive dividends until we have satisfied our obligations to any holders of our preferred stock.

As a Delaware corporation, we may pay dividends out of our surplus capital or, if there is no surplus capital, out of our net profits for the fiscal year in which a dividend is declared and/or the preceding fiscal year. Section 170 of the DGCL also provides that dividends may not be paid out of net profits if, after the payment of the dividend, capital is less than the capital represented by the outstanding stock of all classes having a preference upon the distribution of assets.

Currently, we pay dividends on our Common Stock each quarter. The declaration and payment of future dividends remains at the discretion of the Board of Directors and will depend on the Company's financial results, cash requirements, future prospects and other factors deemed relevant by the Board of Directors.

Voting and Other Rights

Holders of our Common Stock are entitled to one vote per share and, in general, a majority of votes cast with respect to a matter will be sufficient to authorize action upon routine matters.

The holders of record of a majority of the outstanding shares of our capital stock entitled to vote at the meeting of our stockholders must be present in person or represented by proxy at the meeting in order to constitute a quorum for all matters to come before the meeting.

Special meetings of our stockholders may be called by our Board of Directors or by the Chair of the Board or by our President, and will be called by the Chair of the Board or by our President or Secretary upon a written request stating the purposes of the proposed meeting and signed by a majority of our Board of Directors or stockholders owning at least 25% of our outstanding capital stock entitled to vote at the meeting.
Written notice of a meeting of our stockholders is given personally, by mail, or other means of electronic transmission not less than 10 days nor more than 60 days before the date on which the meeting is held, to each stockholder of record entitled to vote at the meeting. The notice must state the time, place and purposes of the meeting. In the event of a special meeting called upon the written request of our stockholders, the notice will describe any business set forth in the statement of purpose in the written stockholder request, as well as any additional business that our Board of Directors proposes to be conducted at the meeting. If mailed, the notice will be sent to our stockholders at their respective addresses appearing on our stock records or to such other addresses as they may designate in writing, and will be deemed given when mailed. A waiver of any notice, in writing by a stockholder or by electronic transmission given by the person or persons entitled to such notice before or after the time for the meeting, will be deemed equivalent to that stockholder having received the notice.

Our Board of Directors is not classified. Directors are to be elected by a majority of the votes cast by stockholders entitled to vote thereon at a duly held meeting of stockholders at which a quorum is present, and our stockholders do not have the right to cumulate their votes in the election of directors.

1


Liquidation

In the event of any liquidation, dissolution or winding up of Newmont, holders of our Common Stock would be entitled to receive proportionately any assets legally available for distribution to our stockholders with respect to shares held by them, subject to any prior rights of the holders of any of our preferred stock then outstanding.

Redemption

Our Common Stock is not redeemable or convertible.

Other Provisions

All of the issued and outstanding shares of our Common Stock are validly issued, fully paid and nonassessable. Holders of our Common Stock have no preemptive rights with respect to any of our securities.

Listing

Our Common Stock trades on the New York Stock Exchange under the symbol “NEM.” Computershare Investor Service Inc. is the registrar, transfer agent and dividend disbursing agent for our Common Stock.

Our CHESS Depositary Interests (“CDIs”), each one representing a unit of beneficial ownership in our common stock, trade on the Australian Securities Exchange (“ASX”) and our PETS Depositary Interests (“PDIs”), each one representing a unit of beneficial ownership in our common stock, trade on the Papua New Guinea Stock Exchange (“PNGX”), in each case under the symbol “NEM.”

Australian CHESS Depositary Interests

CDIs are an instrument through which shares of Newmont common stock can be traded on the ASX. Each CDI represents a beneficial interest in one share of Newmont common stock. The holders of CDIs are not registered Newmont stockholders; rather, a depository nominee, CHESS Depositary Nominees Pty Ltd., a wholly owned subsidiary of the Australian Securities Exchange Limited, holds the underlying shares of Newmont common stock on behalf of CDI holders. The CDIs entitle holders to dividends and other rights economically equivalent to our common stock on a one-for-one basis, including the right to attend meetings of our stockholders. The CDIs may be exchanged, at the option of the holders, for shares of our common stock held by CHESS Depositary Nominees Pty Ltd. on a one-for-one basis. CHESS Depositary Nominees Pty Ltd., as the stockholder of record, will vote the underlying shares of our common stock in accordance with the directions of the CDI holders.

Papua New Guinea PETS Depositary Interests

PDIs are a type of depository receipt, used to enable trading on the PNGX of Newmont common stock through the Port Moresby Electronic Trading System. Each PDI represents a beneficial interest in one share of Newmont common stock. The holders of PDIs are not registered Newmont stockholders; rather, a depositary nominee appointed under the PNGX Business Rules, PNGCSD Nominee Limited, holds the underlying shares of Newmont common stock on behalf of PDI holders. The PDIs entitle holders to dividends and other rights economically equivalent to our common stock on a one-for-one basis, including the right to attend meetings of our stockholders. The PDIs may be exchanged, at the option of the holders, for shares of our common stock held by PNGCSD Nominee Limited on a one-for-one basis. PNGCSD Nominee Limited, as the stockholder of record, will vote the underlying shares of our common stock in accordance with the directions of the PDI holders.

Preferred Stock—General

The applicable prospectus supplement relating to the particular series of preferred stock and any related depositary shares to be offered will describe the specific terms of that series as fixed by our Board of Directors, including, as applicable:

•voting rights,
•designations,
•dividend rate,
•redemption rights,
•liquidation rights,
•sinking fund or purchase fund provisions,
•conversion or exchange rights,
•any other preferences, relative participating and option or other special rights, and qualifications, limitations and restrictions that are not inconsistent with the terms of our restated certificate of incorporation, including any restriction on the repurchase or redemption while we are in arrears in the payment of dividends or sinking fund installments.
Anti-Takeover Provisions

Article Ninth of our Certificate of Incorporation may make it more difficult for various corporations, entities or persons to acquire control of us or to remove management.
Article Ninth of our Certificate of Incorporation requires us to get the approval of the holders of 80% of all classes of our capital stock who are entitled to vote in elections of directors, voting together as one class, to enter into the following types of transactions:
2


•a merger or consolidation between us and another corporation that holds 10% or more of our outstanding shares;
•the sale or lease of all or a substantial part of our assets to another corporation or entity that holds 10% or more of our outstanding shares; or
•any sale or lease to us of assets worth more than $10 million in exchange for our securities by another corporation or entity that holds 10% or more of our outstanding shares.
However, Article Ninth does not apply to any transaction if:

•our Board of Directors approves the transaction before the other corporation, person or entity becomes a holder of 10% or more of our outstanding shares; or
•we or our subsidiaries own a majority of the outstanding voting shares of the other corporation.
Article Ninth can be altered or repealed only with the approval of the holders of 80% of all classes of our capital stock who are entitled to vote in elections of directors, voting together as one class.

3

EXHIBIT 10.18 NEWMONT CORPORATION 2020 STOCK INCENTIVE COMPENSATION PLAN 2026 PERFORMANCE STOCK UNIT AGREEMENT This Performance Stock Unit Agreement, including any country-specific terms and conditions set forth in Appendix 1 hereto and the performance terms and conditions set forth in Appendix 2 hereto (the “Agreement”), dated February 23, 2026 is made between Newmont Corporation (“Newmont”) and the “Employee,” as specified in the Employee’s Grant Summary and Grant Acknowledgment (collectively, the “Grant Acknowledgment”). The Grant Acknowledgment is set forth on the Fidelity online employee portal. The Grant Acknowledgment is incorporated by reference herein. This Agreement shall be deemed executed by the Employee upon their electronic execution of the Grant Acknowledgment. All capitalized terms shall have the meaning set forth in Section 10 of the Agreement. 1. Award of Performance Stock Units. Newmont grants the Employee the right to vest in the number of Performance Stock Units (the “PSUs”) specified in the Grant Acknowledgment. These PSUs are granted pursuant to the terms and subject to the conditions and restrictions set forth in this Agreement, the Grant Acknowledgment, the Plan, and any applicable LTIP Program related hereto. Each such PSU granted represents an unfunded right to receive one Share. 2. Target Grant Setting Date, Performance Periods, Performance Metrics, and Payout Determination. The Target Grant Setting Date for the PSUs is February 23, 2026. The Performance Metrics and Performance Periods shall be specified in Appendix 2. The Committee shall determine the number of Eligible PSUs that become eligible for vesting under this Agreement. The number of Eligible PSUs, if any, that vest shall be payable in the form of Shares, in accordance with Section 6. 3. Vesting Date; Termination of Service. The Eligible PSUs shall vest on the date(s) that the Committee determines the attainment level of the Performance Metrics in accordance with Appendix 2 (the “Vesting Date”), provided a Termination of Service does not occur prior to the applicable Vesting Date, unless otherwise provided in this Agreement. A. Termination of Service for death, disability, and following a Change in Control. If the Employee either (1) dies or (2) experiences a Termination of Service (a) by reason of disability (as determined under the terms of any applicable long-term disability plan of Newmont), or (b) that entitles the Employee to benefits under a Change in Control Plan, the Eligible PSUs shall remain outstanding and nonforfeitable until, and shall be eligible to vest on, the Vesting Date. Any PSUs that do not remain outstanding and nonforfeitable pursuant to this provision shall immediately terminate upon the Termination of Service and be automatically and unconditionally forfeited. B. Termination of Service under a Severance Plan of Newmont or Upon Entitlement to Severance Benefits. Upon a Termination of Service without Cause (or circumstances constituting Cause as determined in the sole discretion of the Company) entitling the Employee to: (1) severance benefits under a Severance Plan or (2) separation benefits for an - 2 - involuntary termination, a pro-rata percentage of the Eligible PSUs, as determined in Section 3.B.(i) and (ii) below, as applicable, shall remain outstanding and nonforfeitable until, and shall be eligible to vest on, the Vesting Date, subject in each case, to the Employee’s delivery of an effective (non-revoked, if applicable) waiver and release agreement. Any PSUs that do not remain outstanding and nonforfeitable pursuant to this provision shall immediately terminate upon the Termination of Service and be automatically and unconditionally forfeited. (i) If clause (1) of Section 3.B. applies, the pro-rata percentage shall be based on the formula set forth in the Severance Plan (which may be identical to the formula set forth in Section 3.B.(ii) below). (ii) If clause (2) of Section 3.B. applies, the pro-rate percentage shall be determined in accordance with the following formula: PSUs outstanding = Total PSUs Covered by This Agreement X Days Elapsed From Date of Grant to Date of Termination of Service 10951 (iii) If the Employee is entitled to vesting benefits under clause (1) of Section 3.B., and also satisfies the definitional requirements of Retirement, the Eligible PSUs shall remain outstanding and nonforfeitable until, and vest on, the Vesting Date in accordance with this Section 3.B. and not under 3.C. below. C. Retirement. If the Employee’s Termination of Service is due to Retirement, a pro-rata percentage of the total number of Eligible PSUs subject to this Agreement shall remain outstanding and nonforfeitable until, and vest on, the Vesting Date in accordance with the formula described in Section 3.B.(ii) above. Any PSUs that do not remain outstanding and nonforfeitable pursuant to this provision shall immediately terminate upon the Termination of Service and be automatically and unconditionally forfeited. D. Other Terminations. Upon a Termination of Service under any other circumstances not outlined in Sections 3.A. through 3.C., including a voluntary resignation that is not a Retirement, any unvested PSUs shall immediately terminate and be automatically and unconditionally forfeited as of the Termination of Service date. E. Discretion to Apply Termination Vesting Provisions. If Newmont determines that any provision in this Section 3 may be found to be unlawful, discriminatory or against public policy in any relevant jurisdiction, then Newmont, in its sole discretion, may choose not to apply such provision to the PSUs. 4. No Stockholder Rights Prior to Issuance of Shares; Dividend Equivalents. 1 For leap years, the denominator is 1096. - 3 - A. No Stockholder Rights. The Employee shall not have any rights as a stockholder of Newmont with respect to the Shares underlying the PSUs, including but not limited to, the right to vote with respect to such Shares, until the Shares have been issued to the Employee and transferred on the books and records of Newmont. B. Dividend Equivalents. Upon the issuance of Shares to the Employee in settlement of the vested PSUs, the Employee shall also be entitled to a cash payment equal to any dividends paid from the Grant Date until the settlement date with respect to any Shares underlying the PSUs that are issued. 5. Withholding Taxes. A. The Employee acknowledges that, the ultimate liability for all Tax-Related Items is and remains the Employee’s responsibility, regardless of any action taken by Newmont or, if different, the Employer. B. The Employee further acknowledges that Newmont and/or the Employer (1) make no representations or undertakings regarding the treatment of any Tax-Related Items in connection with any aspect of the PSUs or the underlying Shares, including but not limited to, the grant, vesting or settlement of the PSUs, the subsequent sale of Shares acquired pursuant to such settlement and the receipt of any dividends and/or any dividend equivalents; and (2) do not commit to and is not obligated to structure the terms of the grant or any aspect of the PSUs to reduce or eliminate the Employee’s liability for Tax-Related Items or achieve any particular tax result for the Employee. Further, if the Employee is subject to Tax-Related Items in more than one jurisdiction, the Employee acknowledges that Newmont and/or the Employer (or former employer, as applicable) may be required to withhold or account for Tax-Related Items in more than one jurisdiction. C. Prior to any relevant taxable or tax withholding event, as applicable, the Employee agrees to make adequate arrangements satisfactory to Newmont and/or the Employer to satisfy all Tax-Related Items. D. The Employee authorizes Newmont or its agent to satisfy any applicable withholding obligations with regard to all Tax-Related Items by withholding a number of whole Shares from the Shares that are issued upon settlement of the PSUs. If Newmont determines in its sole discretion that withholding in Shares is not permissible or advisable under applicable local law or due to adverse accounting consequences, Newmont may satisfy its obligations for Tax- Related Items by one or a combination of the following: (i) withholding from the Employee’s wages or other cash compensation paid to the Employee by Newmont and/or the Employer; (ii) withholding from proceeds of the sale of Shares acquired upon vesting/settlement of the PSUs, either through a voluntary sale or through a mandatory sale arranged by Newmont (on the Employee’s behalf pursuant to this authorization); or (iii) any other method of withholding determined by the Committee and permitted under the Plan and applicable laws. - 4 - E. Newmont may withhold or account for Tax-Related Items by considering applicable minimum statutory withholding rates or other applicable withholding rates in the Employee’s jurisdiction(s), including maximum applicable rates, to the extent permitted by the Plan. In the event of over-withholding, the Employee may receive a refund of any over-withheld amount in cash (with no entitlement to the equivalent in Common Stock) or if not refunded, the Employee may need to seek a refund from the local tax authorities. In the event of under- withholding, the Employee may be required to pay any additional Tax-Related Items directly to the applicable tax authority or to Newmont and/or the Employer. If the obligation for Tax-Related Items is satisfied by withholding in Shares, for tax purposes, the Employee is deemed to have been issued the full number of Shares subject to the vested PSUs, notwithstanding that a number of the Shares are held back solely for the purpose of paying the Tax-Related Items. F. Finally, the Employee agrees to pay to Newmont or the Employer, any amount of Tax-Related Items that Newmont or the Employer may be required to withhold or account for as a result of their participation in the Plan that cannot be satisfied by the means previously described. Newmont may refuse to issue or deliver the Shares or the proceeds of the sale of Shares, if the Employee fails to comply with their obligations in connection with the Tax- Related Items. 6. Delivery of Shares; Payment of Dividend Equivalents. As soon as reasonably practicable after the Vesting Date, but in any event, no later than a date that is within two and one- half months following the calendar year that contains the last day of the Performance Period, the number of PSUs that become vested shall be settled in Shares. In addition, Dividend Equivalents, if any, shall be settled within 30 days of the date that the PSUs are settled. 7. Nontransferability. The Employee’s interest in the PSUs and any Shares relating thereto may not be sold, transferred, pledged, assigned, encumbered or otherwise alienated or hypothecated otherwise than by will or by the laws of descent and distribution, prior to such time as the Shares have actually been issued and delivered to the Employee. The Agreement shall be binding upon and shall inure to the benefit of the parties hereto and their respective successors and permitted assigns, including, in the case of the Employee, their estate, heirs, executors, legatees, administrators, designated beneficiary and personal representatives. Nothing contained in this Agreement shall be deemed to prevent transfer of the PSUs in the event of the Employee’s death in accordance with Section 12(b) of the Plan. 8. Acknowledgements. The Employee acknowledges receipt of and understands and agrees to the terms of this Agreement and the Plan. The Employee further understands, acknowledges and agrees to the following: A. The Plan and the Plan prospectus are available for review on Fidelity.com and the Employee agrees to be bound by all of the terms and provisions in this Agreement, including any terms and provisions of the Plan adopted after the date of this Agreement but prior to the completion of the Performance Periods. If and to the extent that any provision contained in this Agreement is inconsistent with the Plan, the Plan shall govern. B. The grant of PSUs under the Plan at one time does not in any way obligate Newmont or its Affiliates to grant additional PSUs in any future year or in any given amount.


 
- 5 - C. The grant of PSUs and the Employee’s participation in the Plan shall not create a right to employment or be interpreted as forming or amending an employment or service contract with Newmont and shall not interfere with the ability of the Employer to terminate the Employee’s employment or service relationship (if any). D. The PSUs should in no event be considered as compensation for, or relating in any way to, past services for Newmont, the Employer or any Affiliate. E. The Employee further acknowledges and understands that the Employee’s participation in the Plan is voluntary and that the PSUs and any future PSUs under the Plan are wholly discretionary in nature, the value of which do not form part of any normal or expected compensation for any purposes, including but not limited to, calculating any termination, severance, resignation, redundancy, end of service payments, bonuses, holiday pay, long-service awards, pension or retirement benefits or similar mandatory payments, other than to the extent required by local law. F. The Employee acknowledges and understands that the future value of the Shares acquired by the Employee under the Plan is unknown and cannot be predicted with certainty and that no claim or entitlement to compensation or damages arises from the (1) forfeiture of the PSUs resulting from termination of service (for any reason whatsoever and whether or not in breach of local labor laws and whether or not later found to be invalid) or (2) forfeiture of the PSUs or recoupment of any Shares, cash or other benefits acquired, pursuant to the PSUs resulting from the application of the “Clawback/Recoupment/Disgorgement” provision of the Agreement. G. The Employee acknowledges and understands that the PSUs and the Shares subject to the PSUs, and the income and value of the same, are not intended to replace any pension rights or compensation. H. The Employee acknowledges for the purposes of the PSUs: (1) their employment shall be considered terminated as of the date they are no longer actively providing services to Newmont, the Employer or any Affiliate (regardless of the reason for such termination and whether or not later found to be invalid or in breach of employment laws in the jurisdiction where the Employee is employed or the terms of their employment agreement, if any) and (2) unless otherwise expressly provided in this Agreement or determined by Newmont, the Employee’s period of employment shall not be extended by any notice period (e.g., the Employee’s period of service would not include any contractual notice period or any period of “garden leave” or similar period mandated under employment laws in the jurisdiction where the Employee is employed or the terms of their employment agreement, if any). The Committee shall have the exclusive discretion to determine when the Employee is no longer actively providing services for purposes of their PSU grant (including whether the Employee may still be considered to be providing services while on a leave of absence). I. The Employee acknowledges and understands that unless otherwise agreed with Newmont, the PSUs and the Shares subject to the PSUs, and the income and value of the same, are not granted as consideration for, or in connection with the service they may provide as a director of an Affiliate of Newmont. - 6 - J. As of the date of this Agreement, the Grant Acknowledgement, this Agreement, and the Plan set forth the entire understanding between the Employee and Newmont regarding the acquisition of Shares underlying the PSUs in Newmont and supersede all prior oral and written agreements pertaining to the PSUs. K. Newmont has reserved the right to amend or terminate the Plan at any time. L. If the Employee is employed outside the United States: (i) The Employee acknowledges and understands that the PSUs and the Shares subject to the PSUs and the income and value of the same, are not part of normal or expected compensation salary for any purpose. (ii) The Employee acknowledges and understands that neither Newmont, the Employer nor any other Affiliate of Newmont shall be liable for any foreign exchange rate fluctuation between their local currency and the United States Dollar that may affect the value of the PSU or of any amounts due to the Employee pursuant to the settlement of the PSU or the subsequent sale of any Shares acquired upon settlement. 9. Miscellaneous A. No Right to Continued Employment. Neither the grant of the PSUs nor any terms contained in this Agreement, Grant Acknowledgement, or the Plan shall confer upon the Employee any express or implied right to continued employment by Newmont or any Affiliate, nor restrict in any way the right of Newmont or any Affiliate to terminate the employment of the Employee at any time with or without Cause. The Employee acknowledges and agrees that any right to receive delivery of Shares is earned only by continuing as an employee, and satisfaction of any other applicable terms and conditions contained in this Agreement, the Grant Acknowledgement, and the Plan. B. Compliance with Laws and Regulations. The award of the PSUs to the Employee and the obligation of Newmont to deliver Shares hereunder shall be subject to (1) all applicable federal, state, local and non-U.S. laws, rules and regulations, and (2) any registration, qualification, approvals or other requirements imposed by any government or regulatory agency or body which Newmont shall, in its sole discretion, determine to be necessary or applicable. Moreover, Shares shall not be delivered if such delivery would be contrary to applicable law or the rules of any stock exchange, as determined in the sole discretion of Newmont. C. Notices. Any notice or other important information Newmont sends to the Employee shall be in writing and delivered in person, by electronic means or by mail or courier at the last known address or email address in Newmont’s records. D. Severability. If any of the provisions of this Agreement should be deemed unenforceable, the remaining provisions shall remain in full force and effect. E. Governing Law and Venue. Except as to matters concerning the issuance of Shares or other matters of corporate governance, which shall be determined, and related PSU provisions construed, under the General Corporation Law of the State of Delaware, this Agreement - 7 - shall be governed by the laws of the State of Colorado without giving effect to any conflict or choice of law rule or principle that might otherwise refer construction or interpretation of the Agreement to the substantive law of another jurisdiction. The parties hereto submit to the exclusive jurisdiction and venue of the federal or state courts of Colorado to resolve any and all issues that may arise out of or relate to this Agreement or the Plan, and the Employee waives any defense to such governing law and venue, including but not limited to, any defense based on subject matter or personal jurisdiction. F. Section 409A. This Section 9.F. applies if the Employee is a U.S. Taxpayer. The terms of the PSUs and payments made pursuant to this Agreement are intended to qualify for an exemption from or comply with the provisions of Section 409A and the Agreement and the Plan shall be interpreted, operated, and administered in a manner that is consistent with this intent. In furtherance of this intent, the Committee may, but is not required, adopt amendments to this Agreement and/or Plan or adopt other policies, and procedures (including amendments, policies, and procedures with retroactive effect), or take any other actions, in each case, without the consent of the Employee, that the Committee determines are reasonably necessary or appropriate to comply with the requirements of Section 409A. In that light, Newmont and Employer, if different, make no representation or covenant to ensure that the PSUs that are intended to be exempt from, or compliant with, Section 409A or that the Committee shall take any action with respect thereto. Nothing in the Agreement shall provide a basis for any person to take action against Newmont or any affiliate, based on matters covered by Section 409A, including the tax treatment of any Shares or other payments made under the PSUs granted under this Agreement, and neither Newmont nor any of its Affiliates shall have any liability to the Employee or their estate or any other party for any taxes, penalties or interest due on amounts paid or payable under the Agreement including any taxes, penalties or interest imposed under Section 409A. G. No Advice Regarding PSUs. Neither Newmont nor any Affiliate is providing any tax, legal, or financial advice, nor are they making any recommendations regarding the Employee’s participation in the Plan, or their acquisition or sale of the underlying Shares. The Employee should consult with their own personal tax, legal and financial advisors regarding their participation in the Plan before taking any action related to the Plan. H. Appendix 1. Notwithstanding any provisions in this Agreement, the award of PSUs shall be subject to any terms and conditions set forth in Appendix 1 to this Agreement for the Employee’s country. Moreover, if the Employee relocates to, or becomes a resident of, one of the countries included in Appendix 1, the terms and conditions for such country shall apply to the Employee, to the extent Newmont determines that the application of such terms and conditions is necessary or advisable for legal or administrative reasons. Appendix 1 constitutes part of this Agreement. I. Imposition of Other Requirements. Newmont reserves the right to impose other requirements on the Employee’s participation in the Plan, on the PSUs and on any Shares acquired under the Plan, to the extent Newmont determines that it is necessary or advisable for legal or administrative reasons, and to require the Employee to sign any additional agreements or undertakings that may be necessary to accomplish these additional requirements. - 8 - J. Clawback/Recoupment/Disgorgement. As an additional condition of receiving the PSUs, the Employee agrees that the PSUs, whether vested or unvested, the Shares, cash, or other benefits acquired pursuant to the PSUs (and any proceeds therefrom), or a combination of all of the foregoing, may be subject to clawback, recoupment, and/or disgorgement to the extent required (1) under any and all of Newmont’s clawback, recoupment, and/or disgorgement policies, including but not limited to, the Newmont Corporation Clawback Policy, as they may be unilaterally amended or adopted from time to time or (2) under applicable laws, regulations, or stock exchange listing standards (collectively, the “Clawback/Recoupment/Disgorgement Requirement”). To satisfy any obligation arising under the Clawback/Recoupment/Disgorgement Requirement, among other things, the Employee expressly and explicitly authorizes Newmont to issue instructions, on the Employee’s behalf, to any brokerage firm and/or third party administrator engaged by Newmont to hold any Shares or other amounts acquired pursuant to the PSUs to re- convey, transfer, or otherwise return such Shares and/or other amounts to Newmont upon Newmont’s enforcement of the Clawback/Recoupment/Disgorgement Requirement. No recovery of compensation as described in this Section 9.J. shall be an event giving rise to the Employee’s right to resign for “good reason” or “constructive termination” (or similar term) under any plan of, or agreement with, Newmont or any Affiliate. This Clawback/Recoupment/Disgorgement Requirement includes, but is not limited to, Newmont’s right to require reimbursement of any PSUs from the Employee if the Employee is terminated (or could have been terminated) for Cause. K. Right of Offset. To the extent permitted by applicable law, Newmont or an Employer may, in its sole discretion, apply any PSUs otherwise due and payable under this Agreement against debts of the Employee to Newmont or an Affiliate. The Employee hereby consents to the reduction of any compensation paid to the Employee by Newmont or an Employer to the extent the Employee receives an overpayment from this Agreement. L. Waiver. The Employee acknowledges that a waiver by Newmont of breach of any provision of this Agreement shall not operate or be construed as a waiver of any other provision of this Agreement, or of any subsequent breach of this Agreement. M. Electronic Delivery and Acceptance. Newmont may, in its sole discretion, decide to deliver any documents related to current or future participation in the Plan by electronic means. The Employee consents to receive such documents by electronic delivery and agrees to participate in the Plan through an online or electronic system established and maintained by Newmont or a third party designated by Newmont. 10. Definitions. As a general principle, any terms defined below that are also defined in the Plan or any applicable LTIP Program shall have the same general meaning as set forth in the Plan or LTIP Program except that they may have been modified to remove terms and concepts not applicable under the Agreement and/or refined to reflect specific terms applicable to the Agreement. Please refer to the applicable term in the Plan or the LTIP Program for the complete definition. Any term used solely in Appendix 2 is defined therein and is not listed below.


 
- 9 - A. “Affiliate” means (1) any Subsidiary; (2) any person that directly or indirectly controls, is controlled by or is under common control with Newmont; and/or (3) to the extent provided by the Committee, any person in which Newmont has a significant interest. The term “control” (including, with correlative meaning, the terms “controlled by” and “under common control with”), as applied to any person, means the possession, directly or indirectly, of the power to direct or cause the direction of the management and policies of such person, whether through the ownership of voting or other securities, by contract or otherwise. For purposes of this definition, “Subsidiary” means any present or future corporation which is or would be a “subsidiary corporation” of Newmont as the term is defined in Section 424(f) of the Code. B. “Agreement” shall have the meaning assigned to it in the first paragraph of the Agreement. C. “Cause” shall have the meaning assigned to it in the Plan and is determined by the Committee in its sole discretion; however, for the convenience of the Employee, the salient terms are described below: (i) the willful and continued failure of the Employee to perform substantially the Employee’s duties with Newmont or any Affiliate (other than any such failure resulting from incapacity due to physical or mental illness) or the Employee’s failure to follow policies, directions or Newmont’s or an Affiliate’s code of conduct, after a written demand for substantial performance is delivered to the Employee by Newmont; or (ii) the Employee engaging in illegal conduct or gross negligence or willful misconduct which is potentially injurious to Newmont or any Affiliate; provided that if the Employee acts in accordance with an authorized written opinion of Newmont’s or an Affiliate’s legal counsel, such action shall not constitute “Cause” under this definition; or (iii) any dishonest or fraudulent activity by the Employee or the reasonable belief by Newmont of the Employee’s breach of any contract, agreement, or representation with Newmont or an Affiliate. The Committee has up six (6) months following the Employee’s Termination of Service to determine if such Termination of Service could have been for Cause and, if such a determination is made after the Employee’s Termination of Service, the Employee shall be required to disgorge to Newmont all amounts received under the Plan, this Agreement or otherwise that would not have been payable to such Employee had initial Termination of Service been for Cause. D. “Change in Control Plan” shall mean the Executive Change of Control Plan of Newmont or the Change of Control Plan of Newmont. E. “Clawback/Recoupment/Disgorgement Requirement” shall have the meaning assigned to it in Section 9.J. - 10 - F. “Code” shall mean the U.S. Internal Revenue Code of 1986, as it may be amended from time to time, including rules and regulations promulgated thereunder and successor provisions and rules and regulations thereto. G. “Committee” shall mean the Leadership Development and Compensation Committee of the Board of Directors or a subcommittee thereof, or such other committee designated by the Board to administer the Plan. H. “Dividend Equivalent” shall mean a right to receive the equivalent value (in cash or Shares) of ordinary dividends that would otherwise be paid on the Shares subject to an PSU but that have not been issued or delivered. I. “Grant Acknowledgement” shall have the meaning assigned to it in the first paragraph of the Agreement. J. “Grant Date” shall mean the later of (1) the date on which the Committee (or its designee) by resolution, written consent or other appropriate action selects the Employee to receive a grant of PSUs, determines the number of Shares or other amount to be subject to such PSUs or (2) the date designated as the “Grant Date” by the Committee by resolution, written consent or other appropriate action in connection with the approval of PSUs. K. “Eligible PSU” shall mean the PSUs that become eligible to vest upon the satisfaction of the employment and other conditions of the Agreement and which number of Eligible PSUs shall be determined in accordance with Section 3 based upon the attainment level of the Performance Metrics during the Performance Periods and the resulting payout percentage of the PSUs determined by the Committee in accordance with Appendix 2. L. “Employee” shall have the meaning assigned to it in the first paragraph of the Agreement. M. “Employer” shall mean the Affiliate that employs the Employee. N. “LTIP Program” shall mean a Newmont long-term incentive program or plan. O. “Newmont” shall have the meaning assigned to it in the first paragraph of the Agreement. P. “Performance Metrics” shall have the meaning specified in Appendix 2. Q. “Performance Period” shall have the meaning specified in Appendix 2. R. “Performance Stock Unit” or “PSU” shall mean an unfunded and unsecured promise to deliver Shares or cash, subject to the vesting conditions in Section 3 and other conditions described in Appendix 2. - 11 - S. “Plan” shall mean the Newmont Corporation 2020 Stock Incentive Compensation Plan, as amended from time to time. T. “Retirement” shall mean a Termination of Service after: (1) attaining at least age 55; (2) having at least 5 years of Continuous Employment; and (3) reaching a total of at least 65 when adding the Employee’s age plus years of Continuous Employment. This definition may differ from the definition of “retirement” in other benefit plans, such as pension plans of Newmont, and this definition shall not alter those definitions. For purposes of this definition, “Continuous Employment” means continuous employment with Newmont and/or any Affiliate as reflected in the records of Newmont or an Affiliate. For the avoidance of doubt, a period of Continuous Employment does not need to correspond to the Employee’s most recent period of employment with Newmont or an Affiliate since the last rehire date. U. “Section 409A” shall mean Code Section 409A and the guidance promulgated thereunder. V. “Severance Plan” shall mean the Severance Plan for Salaried Employees of Newmont or the Severance Plan for Section 16 Officers of Newmont. W. “Share” shall mean the $1.60 par value common stock of Newmont. In the event of any adjustment pursuant to Section 4(c) of the Plan, the stock or security resulting from such adjustment shall be deemed to be a Share within the meaning of the Plan. X. “Target Grant Setting Date” shall have the meaning specified in Section 2. Y. “Target PSU Award” shall mean the target number of PSUs granted to the Employee on the Target Grant Setting Date. Z. “Tax-Related Items” shall mean any income tax, social insurance, payroll tax, fringe benefits tax, payment on account, or other tax-related items arising from the Employee’s participation in the Plan that are legally required and may also include any other charges that Newmont or the Employer, in its sole discretion, consider appropriate to pass on to the Employee even if legally applicable to Newmont or the Employer. AA. “Termination of Service” shall have the meaning assigned to it in the Plan and generally means the termination of the Employee’s employment with, or performance of services for, the Company or any Affiliate under any circumstances, as determined by the Committee, but also address the treatment of leaves of absence, change in service status and transfers of employment between the Company and Affiliates (and between Affiliates) on the status of the Employee’s employment with the Company and/or Affiliates. BB. “Vesting Date” shall have the meaning assigned to it in Section 3 of this Agreement. IN WITNESS WHEREOF, pursuant to the Employee’s Grant Acknowledgement (including, without limitation, the Terms and Conditions section hereof), incorporated herein by - 12 - reference, and electronically executed by the Employee, the Employee agrees to the terms and conditions of this Agreement.


 
- 13 - APPENDIX 1 NEWMONT CORPORATION 2020 STOCK INCENTIVE COMPENSATION PLAN 2026 PERFORMANCE STOCK UNIT AGREEMENT Unless otherwise provided below, capitalized terms used but not explicitly defined in this Appendix 1 shall have the same definitions as in the Plan and/or the Agreement (as applicable). The terms and conditions in Part A apply to all Employees outside the United States. The country- specific terms and conditions in Part B shall also apply to the Employee if they reside in one of the countries listed below. Terms and Conditions This Appendix 1 includes additional country-specific terms and conditions that govern the Employee’s PSUs if they reside and/or work in one of the countries listed herein. If the Employee is a resident of a country other than the one in which they currently reside and/or work, or if the Employee relocates to another country after the PSUs are granted, or if the Employee is considered a resident of another country for local law purposes, the terms and conditions of the PSUs contained herein may not be applicable to the Employee, and Newmont shall, in its discretion, determine to what extent the terms and conditions contained herein shall apply to the Employee. Notifications This Appendix 1 also includes information regarding certain issues of which the Employee should be aware with respect to their participation in the Plan. The information is based on the securities, exchange control and other laws in effect in the respective countries as of February 2026. Such laws are often complex and change frequently. As a result, the Employee should not rely on the information in this Appendix 1 as the only source of information relating to the consequences of their participation in the Plan because the information may be out of date at the time that the Employee’s PSUs vest or they sell Shares acquired under the Plan. In addition, the information contained herein is general in nature and may not apply to the Employee’s particular situation, and Newmont is not in a position to assure the Employee of a particular result. Accordingly, the Employee should seek appropriate professional advice as to how the relevant laws in their country may apply to their situation. Finally, if the Employee (1) is a resident of a country other than the one in which they currently reside and/or work, (2) transfers employment after the PSUs are granted, or (3) is considered a resident of another country for local law purposes, the information contained herein may not apply to the Employee. - 14 - A. ALL NON-U.S. COUNTRIES TERMS AND CONDITIONS The following additional terms and conditions shall apply to the Employee if they reside in any country outside the United States. 1. Data Privacy Information and Consent. Newmont headquarters is located at 6900 E. Layton Ave., Suite 700, Denver, Colorado 80237, U.S.A., and grants awards to employees of Newmont and its Affiliates, at Newmont’s sole discretion. If the Employee would like to participate in the Plan, please review the following information about Newmont’s data processing practices and declare the Employee’s consent. (a) Data Collection and Usage. Newmont collects, processes and uses personal data of the Employees, including name, home address, email address and telephone number, date of birth, social insurance number or other identification number, salary, citizenship, job title, any Shares or directorships held in Newmont, and details of all awards or other entitlements to Shares, granted, canceled, exercised, vested, unvested or outstanding in the Employee’s favor (“Data”), which Newmont receives from the Employee or the Employer. In connection with the grant of the PSU, Newmont shall collect the Employee’s Data for purposes of administering the Employee’s participation in the Plan. Newmont’s legal basis for the processing of the Employee’s Data, where required, is the Employee’s consent. (b) Stock Plan Administration Service Providers. Newmont transfers Data to Fidelity Investments, an independent service provider based in the United States, which assists Newmont with the implementation, administration and management of the Plan. In the future, Newmont may select a different service provider and share the Employee’s Data with another company that serves in a similar manner. Newmont’s service provider shall open an account for the Employee to receive Shares. The Employee may be asked to agree on separate terms and data processing practices with the service provider, which is a condition to the Employee’s ability to participate in the Plan. (c) International Data Transfers. Newmont and its service providers are based in the United States. If the Employee is outside the United States, the Employee should note that their country has enacted data privacy laws that are different from those in the United States. Newmont’s legal basis for the transfer of the Employee’s Data is their consent. (d) Data Retention. Newmont shall use the Employee’s Data only as long as is necessary to implement, administer and manage the Employee’s participation in the Plan or as required to comply with legal or regulatory obligations, including under tax, exchange control, labor and security laws. This period may extend beyond the Employee’s period of employment with the Employer. When Newmont or the Employer no longer need Data for any of the above purposes, they shall cease processing it in this context and remove it from all of their systems used for such purposes to the fullest extent practicable. (e) Voluntariness and Consequences of Denial or Withdrawal. The Employee’s participation in the Plan and the Employee’s grant of consent are purely voluntary. The Employee may deny or withdraw their consent at any time. If the Employee does not consent, or if the Employee withdraws their consent, the Employee cannot participate in the - 15 - Plan. This would not affect the Employee’s salary as an employee or their career; the Employee would merely forfeit the opportunities associated with the Plan. (f) Data Subject Rights. The Employee has a number of rights under data privacy laws in their country. Depending on where the Employee is based, the Employee’s rights may include the right to (1) request access or copies of Data Newmont processes, (2) rectification of incorrect Data, (3) deletion of Data, (4) restrict the processing of Data, (5) restrict the portability of Data, (6) lodge complaints with the competent tax authorities in the Employee’s country, and/or (7) receive a list with the names and addresses of any potential recipients of Data. To receive clarification regarding the Employee’s rights or to exercise the Employee’s rights, please contact Newmont at Newmont Corporation, 6900 E. Layton Ave., Suite 700, Denver, Colorado 80237, U.S.A., attention: Director of Compensation, Newmont Corporate. If the Employee agrees with the data processing practices as described in this notice, please declare the Employee’s consent by clicking “Accept” on the Fidelity award acceptance page. 2. Language. The Employee acknowledges that they are sufficiently proficient in English, or, alternatively, the Employee acknowledges that they shall seek appropriate assistance, to understand the terms and conditions in the Agreement. Furthermore, if the Employee received this Agreement or any other document related to the Plan translated into a language other than English and if the meaning of the translated versions is different than the English version, the English version shall control, unless otherwise required by applicable law. 3. Insider-Trading/Market-Abuse Laws. The Employee acknowledges that, depending on their country or broker’s country, or the country in which Common Stock is listed, they may be subject to insider trading restrictions and/or market abuse laws in applicable jurisdictions, which may affect their ability to accept, acquire, sell or attempt to sell, or otherwise dispose of the Shares, rights to Shares (e.g., PSUs) or rights linked to the value of Common Stock, during such times as the Employee is considered to have “inside information” regarding Newmont (as defined by the laws or regulations in applicable jurisdictions, including the United States and the Employee’s country). Local insider trading laws and regulations may prohibit the cancellation or amendment of orders that the Employee placed before possessing inside information. Furthermore, the Employee may be prohibited from (1) disclosing insider information to any third party, including fellow employees and (2) “tipping” third parties or causing them to otherwise buy or sell securities. Any restrictions under these laws or regulations are separate from and in addition to any restrictions that may be imposed under any applicable Newmont insider trading policy. The Employee acknowledges that it is their responsibility to comply with any applicable restrictions, and the Employee should speak to their personal advisor on this matter. 4. Foreign Asset/Account Reporting Requirements. The Employee acknowledges that there may be certain foreign asset and/or account reporting requirements that may affect their ability to acquire or hold the Shares acquired under the Plan or cash received from participating in the Plan (including from any dividends paid on the Shares acquired under the Plan) in a brokerage or bank account outside their country. The Employee may be required to report such accounts, assets or transactions to the tax or other authorities in their country. The Employee also may be required to repatriate sale proceeds or other funds received as a result of participating in the Plan to their country through a designated bank or broker within a certain time after receipt. The - 16 - Employee acknowledges that it is their responsibility to be compliant with such regulations, and they should speak to their personal advisor on this matter. 5. General. Notwithstanding the provisions of the Agreement, if Newmont or the Employer develops a good faith belief that any provision may be found to be unlawful, discriminatory or against public policy in any relevant jurisdiction, then Newmont in its sole discretion may choose not to apply such provision to the PSU, nor any PSU grant in the Employee’s jurisdiction. B. COUNTRY-SPECIFIC ADDITIONAL TERMS AND CONDITIONS ARGENTINA Notifications Securities Law Information. Neither the PSUs nor the underlying Shares are publicly issued, placed, distributed, offered, registered or listed on any stock exchange or capital market in Argentina and, as a result, have not been and shall not be registered with the Argentine Securities Commission (Comisión Nacional de Valores). Neither this Agreement nor any other offering material related to the PSUs nor the underlying Shares shall be utilized in connection with any general offering to the public in Argentina. Argentine residents who acquire PSUs under the Plan do so under their own responsibility according to the terms of a private offering made from outside Argentina. Any Argentine resident who acquires Shares shall not transfer such Shares to any person within six (6) months of acquiring the Shares, unless the transaction is concluded outside Argentina and the Shares are not sold back to the Company. Accordingly, the transfer restriction should not apply if Shares are sold on the New York Stock Exchange. Exchange Control Information. It is the Employee’s responsibility to comply with any and all Argentinian currency exchange restrictions, approvals, and reporting requirements in connection with the PSUs. Foreign Asset / Account Reporting Notification. If the Employee is an Argentinian tax resident, the Employee must report any Shares acquired under the Plan and held by the Employee on December 31st of each year on their annual tax return for that year. AUSTRALIA Notifications Securities Law Information. The offer of PSUs is being made under Division 1A, Part 7.12 of the Australian Corporations Act 2001 (Cth). Tax Information. The Plan is a plan to which Subdivision 83A-C of the Income Tax Assessment Act 1997 (Cth) applies (subject to the conditions in the Act). Exchange Control Information. Exchange control reporting is required for cash transactions exceeding A$10,000 and international fund transfers. The Australian bank assisting with the transaction shall file the report. If there is no Australian bank involved in the transfer, the Employee shall be required to file the report.


- 17 - CANADA Terms and Conditions Acknowledgements. Sections 8.E. and 8.F. of the Agreement apply, except as explicitly and minimally required under applicable legislation. Vesting/Termination. The following provision supplements Section 3 of the Agreement and replaces Section 8.H. of the Agreement: For purposes of the Agreement, except as otherwise provided for in Section 3 of the Agreement or to the extent explicitly and minimally required under applicable legislation, in the event the Employee ceases their employment or service relationship with Newmont or Employer (for any reason whatsoever and whether or not later found to be invalid or in breach of local labor laws), the Employee’s right to vest in the PSUs shall terminate as of the date that is the earliest of: (a) the date the Employee’s employment with the Employer is terminated for any reason; and (b) the date the Employee receives written notice of termination from the Employer; regardless of any period during which notice, pay in lieu of notice or related payments or damages are provided or required to be provided under local law. For greater certainty, the Employee shall not earn or be entitled to any pro-rated vesting for that portion of time before the date on which their right to vest terminates, nor shall the Employee be entitled to any compensation for lost vesting. Notwithstanding the foregoing, if applicable employment standards legislation explicitly requires continued vesting or other participation during a statutory notice period, the Employee’s right to vest in the PSUs, if any, or otherwise participate in or benefit from the PSUs, shall terminate effective as of the last date of the minimum statutory notice period. For clarity, the Employee shall not earn or be entitled to pro-rated vesting or other participation if the Vesting Date falls after the end of the statutory notice period, nor shall the Employee be entitled to any compensation for lost vesting or other participation. The following provisions apply if the Employee is a resident of Quebec: French Language Documents. A French translation of certain documents related to the Plan shall be made available to the Employee as soon as reasonably practicable. Notwithstanding the provisions of Section 3 of Part A of this Appendix, to the extent required by applicable law and unless the Employee indicates otherwise, the French translation of such documents shall govern the Employee’s participation in the Plan. Documents en Langue Française. Une traduction française de certains documents relatifs au Plan sera mise à la disposition du Employee dès que cela sera raisonnablement possible. Nonobstant les dispositions de l’article 3 de la Partie A de la présente Annexe, dans la mesure requise par la loi applicable et à moins que l’Employee n’indique le contraire, la traduction française de ces documents régira la participation du Employee au Plan. Data Privacy. The following provision supplements Section 1 of Part A of this Appendix: The Employee hereby authorizes Newmont and its representatives to discuss with and obtain all relevant information from all personnel, professional or not, involved in the administration and - 18 - operation of the Plan. The Employee further authorizes Newmont, any parent or Affiliate, and any stock plan service provider that may be selected by Newmont to assist with the Plan to disclose and discuss the Plan with their respective advisors. The Employee further authorizes Newmont and any parent or Affiliate to record such information and to keep such information in the Employee’s employee file. The Employee acknowledges and agrees that their personal information, including sensitive personal information, may be transferred or disclosed outside of the province of Quebec, including to the United States. Finally, the Employee acknowledges and authorizes Newmont and other parties involved in the administration of the Plan to use technology for profiling purposes and to make automated decisions that may have an impact on the Employee or the administration of the Plan. Notifications Securities Law Information. The Employee is permitted to sell Shares acquired through the Plan through the designated broker appointed under the Plan, if any, provided the resale of Shares acquired under the Plan takes place outside Canada through the facilities of a stock exchange on which the Shares are listed on the New York Stock Exchange. Foreign Asset/Account Reporting Information. Canadian residents are required to report foreign specified property, including Shares and rights to receive Shares (e.g., PSUs), on form T1135 (Foreign Income Verification Statement) if the total cost of the foreign specified property exceeds C$100,000 at any time during the year. PSUs must be reported (generally, at a nil cost) if the C$100,000 cost threshold is exceeded because of other foreign specified property held by the Employee. When Shares are acquired, their cost generally is the adjusted cost base (“ACB”) of the Shares. The ACB would ordinarily equal the fair market value of the Shares at the time of acquisition, but if the Employee owns other Shares, this ACB may have to be averaged with the ACB of the other Shares. CHILE Notifications Securities Law Information. The award of PSUs constitutes a private offering of securities in Chile effective as of the date of grant, and is expressly subject to general ruling N° 336 of the Chilean Commission for the Financial Market (“CMF”). The award of PSUs refers to securities not registered at the securities registry or at the foreign securities registry of the CMF, and, therefore, such securities are not subject to oversight of the CMF. Given that the Shares underlying the PSUs are not registered in Chile, Newmont is not required to provide public information about the PSUs or the Shares in Chile. Unless the PSUs and/or the Shares are registered with the CMF, a public offering of such securities cannot be made in Chile. Foreign Asset/Account Reporting Information. The CIRS requires all taxpayers to provide information annually regarding (1) the results of investments held abroad and (2) any taxes paid abroad which the taxpayers shall use as credit against Chilean income tax. The sworn statements disclosing this information (or Formularios) must be reported on Form 1929 and submitted electronically through the CIRS website (www.sii.cl) before July 1 of each year, depending on the assets and/or taxes being reported. If the Employee fails to meet the above requirements, the - 19 - Employee may be ineligible to receive certain foreign tax credits. Given that these requirements are subject to change, the Employee should consult with their personal tax advisor to determine the Employee’s reporting obligations to the CIRS. Exchange Control Information. The Employee may receive foreign currency abroad as a result of the acquisition of Shares and freely decide whether to repatriate such currency to Chile or keep it abroad. However, if the Employee repatriates currency, and such amounts exceed USD 10,000, the proceeds must be remitted using the formal exchange market. It is not necessary to convert the repatriated funds into Chilean currency. Given that these requirements are subject to change, the Employee should consult with their personal advisor to determine the Employee’s obligations. COSTA RICA There are no country-specific provisions. FIJI There are no country-specific provisions. GHANA There are no country-specific provisions. INDONESIA Language Consent. By accepting the PSUs, the Employee (1) confirms having read and understood the documents relating to this grant (i.e., the Plan and the Agreement) which were provided in the English language, (2) accepts the terms of those documents accordingly, and (3) agrees not to challenge the validity of this document based on Law No. 24 of 2009 on National Flag, Language, Coat of Arms and National Anthem or the implementing Presidential Regulation (when issued). Persetujuan Bahasa. Dengan menerima pemberian Unit Saham Terbatas (PSUs) ini, Karyawan (1) memberikan konfirmasi bahwa dirinya telah membaca dan memahami dokumen-dokumen berkaitan dengan pemberian ini (yaitu, Perjanjian Penghargaan dan Program) yang disediakan dalam Bahasa Inggris, (2) menerima persyaratan di dalam dokumen-dokumen tersebut, dan (3) setuju untuk tidak mengajukan keberatan atas keberlakuan dari dokumen ini berdasarkan Undang-Undang No. 24 Tahun 2009 tentang Bendera, Bahasa dan Lambang Negara serta Lagu Kebangsaan ataupun Peraturan Presiden sebagai pelaksanaannya (ketika diterbitkan) Exchange Control Information. If the Employee remits funds (including proceeds from the sale of Shares) into Indonesia, the Indonesian bank through which the transaction is made shall submit a report of the transaction to Bank Indonesia for statistical reporting purposes. For transactions in excess of a certain threshold, a more detailed description of the transaction must be included in the report and the Employee may be required to provide information about the transaction (e.g., the Employee’s relationship with the transferor of the funds, the source of the funds, etc.) to the bank in order for the bank to complete the report. In addition, the Employee may be required to provide the Bank Indonesia with information on foreign exchange activities, which may include Shares held outside Indonesia, on a monthly basis. The reporting should be completed online through - 20 - Bank Indonesia’s website, by no later than the 15th day of the following month. MEXICO Terms and Conditions Plan Document Acknowledgement. By accepting the PSUs, the Employee acknowledges that they have received a copy of the Plan, the Grant Acknowledgement, and the Agreement, including this Appendix 1, which the Employee has reviewed. The Employee acknowledges further that they accept all the provisions of the Plan, the Grant Acknowledgement, and the Agreement, including this Appendix 1. The Employee also acknowledges that they have read and specifically and expressly approve the terms and conditions set forth in Section 8 of the Agreement, which clearly provides as follows: (1) the Employee’s participation in the Plan does not constitute an acquired right; (2) The Plan and the Employee’s participation in it are offered by Newmont on a wholly discretionary basis; (3) the Employee’s participation in the Plan is voluntary; and (4) Newmont and its Affiliates are not responsible for any decrease in the value of any Shares acquired at vesting and settlement of the PSUs. Labor Law Policy and Acknowledgment. By accepting the PSUs, the Employee expressly recognizes that Newmont, with registered offices at 6900 E. Layton Ave., Suite 700, Denver, Colorado 80237, U.S.A., is solely responsible for the administration of the Plan and that the Employee’s participation in the Plan and acquisition of Shares do not constitute an employment relationship between the Employee and Newmont since the Employee is participating in the Plan on a wholly commercial basis and their sole employer is Newmont’s Affiliate in Mexico (“Newmont Mexico”). Based on the foregoing, the Employee expressly recognizes that the Plan and the benefits that they may derive from participating in the Plan do not establish any rights between the Employee and the employer, Newmont Mexico, and do not form part of the employment conditions and/or benefits provided by Newmont Mexico, and any modification of the Plan or its termination shall not constitute a change or impairment of the terms and conditions of the Employee’s employment. The Employee further understands that their participation in the Plan is as a result of a unilateral and discretionary decision of Newmont; therefore, Newmont reserves the absolute right to amend and/or discontinue the Employee’s participation at any time without any liability to the Employee. Finally, the Employee hereby declares that they do not reserve to themself any action or right to bring any claim against Newmont for any compensation or damages regarding any provision of the Plan or the benefits derived under the Plan, and the Employee therefore grants a full and broad release to Newmont, and its subsidiaries, branches, representative offices, stockholders, directors, officers, employees, agents, or legal representatives with respect to any claim that may arise. Spanish Translation


- 21 - Reconocimiento del Documento del Plan Al aceptar el Premio de Desempeño (“PSUs”), el Empleado reconoce que ha recibido una copia del Plan, el Reconocimiento de la Subvención y en los términos del Acuerdo de PSUs, con inclusión de este Apéndice, que el Empleado ha revisado. El Empleado reconoce, además, que acepta todas las disposiciones del Plan, el Reconocimiento de la Subvención, y en los términos del Acuerdo de PSUs, incluyendo este Apéndice. El Empleado también reconoce que ha leído y que concretamente aprueba de forma expresa los términos y condiciones establecidos en la Sección 8 del Acuerdo, que claramente dispone lo siguiente: (1) La participación del Empleado en el Plan no constituye un derecho adquirido; (2) El Plan y la participación del Empleado en el Plan se ofrecen por Newmont en su discrecionalidad total; (3) Que la participación del Empleado en el Plan es voluntaria; y (4) Newmont y sus Subsidiarias no son responsables de ninguna disminución en el valor de las acciones adquiridas al conferir los PSUs. Política Laboral y Reconocimiento Al aceptar las PSUs, el Empleado expresamente reconoce que Newmont, con sus oficinas registradas y ubicadas en 6900 E. Layton Ave., Suite 700, Denver, Colorado 80237, U.S.A., es la única responsable por la administración del Plan y que la participación del Empleado en el Plan y en su caso la adquisición de Acciones no constituyen una relación de trabajo entre el Empleado y Newmont, ya que el Empleado participa en el Plan en un marco totalmente comercial y su único patrón es el Subsidiario de Newmont en Mexico (“Newmont Mexico”). Derivado de lo anterior, el Empleado expresamente reconoce que el Plan y los beneficios que pudieran derivar de la participación en el Plan no establecen derecho alguno entre el Empleado y el patrón, Newmont Mexico, y no forma parte de las condiciones de trabajo y/o las prestaciones otorgadas por Newmont Mexico, y que cualquier modificación al Plan o su terminación no constituye un cambio o desmejora de los términos y condiciones de la relación de trabajo del Empleado. Asimismo, el Empleado reconoce que su participación en el Plan se ha resultado de una decisión unilateral y discrecional de Newmont; por lo tanto, Newmont se reserva el derecho absoluto de modificar y/o terminar la participación del Empleado en cualquier momento y sin responsabilidad alguna frente el Empleado. Finalmente, el Empleado por este medio declara que no se reserva ninguna derecho o acción en contra de Newmont por cualquier compensación o daños y perjuicios en relación de las disposiciones del Plan o de los beneficios derivados del Plan, y por lo tanto, el Empleado otorga el más amplio finiquito que en derecho proceda a Newmont, y sus Subsidiarias, oficinas de representación, accionistas, directores, autoridades, empleados, agentes, o representantes legales en relación con cualquier demanda que pudiera surgir. - 22 - Notifications Securities Law Information. The PSUs and the Shares offered under the Plan have not been registered with the National Register of Securities maintained by the Mexican National Banking and Securities Commission and cannot be offered or sold publicly in Mexico. In addition, the Plan, the Agreement and any other document relating to the PSUs may not be publicly distributed in Mexico. These materials are addressed to the Employee only because of their existing relationship with Newmont and these materials should not be reproduced or copied in any form. The offer contained in these materials does not constitute a public offering of securities but rather constitutes a private placement of securities addressed specifically to individuals who are present employees of the Employer made in accordance with the provisions of the Mexican Securities Market Law, and any rights under such offering shall not be assigned or transferred. PAPUA NEW GUINEA Terms and Conditions Award Settlement. Notwithstanding any provision in the Agreement to the contrary, if deemed by Newmont to be necessary for regulatory reasons, Newmont reserves the right to settle PSUs by payment in cash or its equivalent of an amount equal in value to the Shares subject to the vested PSUs. Notifications Exchange Control Information. Before receiving funds from the sale of any securities abroad, the Employee shall need to apply for and receive an Income Tax Clearance Certificate from the taxation authorities in Papua New Guinea, which the Employee must then lodge with the appropriate Bank of Papua New Guinea notification form with the commercial bank in which the transaction takes place. PERU Terms and Conditions Labor Law Acknowledgement. The following provision supplements Sections 8 and 9 of the Agreement: In accepting this Agreement, the Employee acknowledges that the PSUs are being granted ex gratia to the Employee with the purpose of rewarding them. Notifications Securities Law Information. The offer of the PSUs is considered a private offering in Peru; therefore, it is not subject to registration. For more information concerning this offer, please refer to the Plan, the Agreement and any other grant documents made available by Newmont. - 23 - SOUTH AFRICA Terms and Conditions Taxes. The following provision supplements Section 5 of the Agreement: By accepting the PSUs, the Employee agrees that, immediately upon settlement of the PSUs, the Employee will notify the Employer of the amount of any gain realized at vesting. The Employee will be solely responsible for paying any difference between the actual liability for Tax-Related Items and the amount withheld. Deemed Acceptance of PSUs. Pursuant to Section 96 of Companies Act 71 of 2008 (the "Companies Act"), the PSU offer must be finalized within six months following the date the offer is communicated to the Employee. If the Employee does not want to accept the PSUs, the Employee is required to decline the award no later than six months following the date the offer is communicated to the Employee. If the Employee does not reject the RSUs within six months following the date the offer is communicated to the Employee, the Employee will be deemed to accept the PSUs. Notifications Securities Law Information. Neither the PSUs nor the underlying Shares shall be publicly offered or listed on any stock exchange in South Africa. The offer is intended to be private pursuant to Section 96 of the Companies Act and is not subject to the supervision of any South African governmental authority. Exchange Control Notification. Because exchange control regulations are subject to frequent change, sometimes without notice, the Employee should consult their personal legal advisor prior to the settlement of the PSUs to ensure compliance with current regulations. The Employee is solely responsible for ensuring compliance with all exchange control laws in South Africa. SURINAME Terms and Conditions Award Settlement. Notwithstanding any provision in the Agreement to the contrary, if deemed by Newmont to be necessary for regulatory reasons, Newmont reserves the right to settle PSUs by payment in cash or its equivalent of an amount equal in value to the Shares subject to the vested PSUs. - 24 - APPENDIX 2 NEWMONT CORPORATION 2020 STOCK INCENTIVE COMPENSATION PLAN 2026 PERFORMANCE STOCK UNIT AGREEMENT Performance Metrics and Payout Factor Schedule 1. Performance Metrics Overview. This Appendix 2 contains the three Performance Metrics, the Performance Periods and applicable methodology used by the Committee to determine the number, if any, of Eligible PSUs that become eligible to vest on the Vesting Date. The number of PSUs, if any, subject to the Target PSU Award that become Eligible PSUs during the Performance Period shall be determined by the Committee in its sole discretion, in accordance with this Appendix 2. Capitalized terms used but not defined herein shall have the same meaning as is ascribed thereto in the Agreement. The Performance Metrics were established in accordance with the requirements for setting “Performance Goals” under the Plan. 2. Vesting of PSUs. Upon the Committee’s determination of the attainment level of the applicable Performance Metric, the PSUs shall vest in accordance with vesting schedule(s) set forth below. The number of PSUs that shall vest and become Eligible PSUs shall be equal to the product of (A) the Target PSU Award, multiplied by (B) the PSU Vesting Percentage, multiplied by (C) the applicable Performance Metric Vesting Percentage. PSU Metric Vesting Percentage Performance Metric Performance Period 60% Relative Total Shareholder Return (“rTSR”) February 23, 2026 - February 23, 2029 30% Return on Capital Employed January 1, 2026 - December 31, 2028 10% Sustainability Emission Reduction Milestones January 1, 2026 - December 31, 2028


- 25 - 3. Performance Metrics A. Relative Total Shareholder Return (i) Performance Metric. “Relative Total Shareholder Return” (rTSR) measures Newmont’s stock price appreciation plus dividends reinvested over a three- year performance period compared to the TSR of the Index Group, indicating performance on a relative basis to peers. Any company in the Index Group that goes bankrupt shall have a TSR of -100%, while acquired companies shall be excluded from the Index Group. The Index Group is the VanEck Vectors Gold Miners (GDX) plus the S&P 500 as a single constituent. (ii) Performance Metric Vesting Percentage. The Performance Metric Vesting Percentage for rTSR shall be based on the following payout factor schedule: Percentile Payout 80th percentile 200% 55th percentile 100% 25th percentile 40% Below 25th percentile 0%  The payout is calculated by interpolating between the performance and payout points. B. Return on Capital Employed (i) Performance Metric “Return on Capital Employed” is a measure of how efficiently Newmont converts invested capital into operating profit, calculated as (and shown below as) Adjusted EBIT divided by Total Assets minus Non-Debt Liabilities minus Cash: Adjusted EBIT Total Assets – Non-Debt Liabilities – Cash - 26 - (ii) Non-cash impairment charges, if any, shall be excluded from actual performance calculations for both the numerator and denominator. Targets to be adjusted for M&A, divestments and project portfolio resequencing. Target adjustments to be considered for other events including material changes to Life of Mine (LOM) and purchase price allocation. Reclamation and remediation included as debt-like, excluded from Capital Employed. (iii) The terms used in the Return on Capital Employed formula are defined as follows, in each case based on the Company’s consolidated financial statements prepared in accordance with U.S. generally accepted accounting principles (“GAAP”) and, where applicable, as reported in the Company’s Annual Report on Form 10‑K: (i) Capital Employed shall mean Total Assets minus Non‑Debt Liabilities minus Cash, excluding reclamation and remediation liabilities; (ii) Adjusted EBIT shall mean Adjusted EBITDA, as reported by the Company in its Annual Report on Form 10‑K, less depreciation and amortization; (iii) Total Assets shall mean total assets; (iv) Non‑Debt Liabilities shall mean current liabilities, deferred tax liabilities and other non‑current liabilities, excluding reclamation and remediation liabilities; and (v) Cash shall mean cash and cash equivalents. (iv) Performance Metric Vesting Percentage. The Performance Metric Vesting Percentage for Return on Capital Employed shall be based on the “payout” percentages set forth below. If the Threshold is not met, the Performance Condition Vesting Percentage shall be zero. Threshold (50% payout) Target (100% payout) Maximum (200% payout) 10% 26% 34%  The payout is calculated by interpolating between the performance and payout points. C. Emission Reduction Milestones (i) Performance Metric Vesting Percentage. The Performance Metric Vesting Percentage for Emission Reduction Key Milestones shall be based on the corresponding “payout” schedule set forth below. If the Threshold is not met, the Performance Condition Vesting Percentage shall be zero. Threshold (50% payout) Target (100% payout) Maximum (200% payout)  Advance energy management system (“EMS”) feasibility  Threshold AND  Pilot EMS at one operation  Target AND  Pilot EMS at multiple locations  The payout is calculated by interpolating between the performance and payout points. D. Performance Metric Adjustments (i) In the event that Absolute Total Shareholder Return over the rTSR Performance Period is negative, the PSU payout factor shall be capped at 100% for all metrics. - 27 - (ii) The total value of any calculated PSU award shall not exceed four times the dollar value of the Target PSU Award. In the event this maximum amount is exceeded, the PSU award shall be reduced to a number of Shares equaling four times the dollar value of the Target PSU Award divided by the average closing price of a Share for the last 30 trading days, excluding the final 5 trading days, on the New York Stock Exchange of the TSR Performance Period, rounded down to the nearest whole Share.


EXHIBIT 10.24 NEWMONT CORPORATION 2020 STOCK INCENTIVE COMPENSATION PLAN 2026 RESTRICTED STOCK UNIT AGREEMENT This Restricted Stock Unit Agreement, including any country-specific terms and conditions set forth in Appendix 1 hereto (the “Agreement”), dated February 23, 2026 is made between Newmont Corporation (“Newmont”) and the “Employee,” as specified in the Employee’s Grant Summary and Grant Acknowledgment (collectively, the “Grant Acknowledgment”). The Grant Acknowledgment is set forth on the Fidelity online employee portal. The Grant Acknowledgment is incorporated by reference herein. This Agreement shall be deemed executed by the Employee upon their electronic execution of the Grant Acknowledgment. All capitalized terms shall have the meaning set forth in Section 10 of the Agreement. 1. Award of Restricted Stock Units. Newmont grants the Employee the right to vest in the number of Restricted Stock Units (the “RSUs”) specified in the Grant Acknowledgment (as restated in Appendix 2). These RSUs are granted pursuant to the terms and subject to the conditions and restrictions set forth in this Agreement, the Grant Acknowledgment, and the Plan and each such RSU granted represents an unfunded right to receive one Share. 2. Vesting Period. The RSUs shall vest on the dates specified in the vesting schedule in the Grant Acknowledgement (as restated in Appendix 2) (each, a “Vesting Date”), provided a Termination of Service does not occur prior to the applicable Vesting Date, unless otherwise provided in this Agreement. 3. Termination of Service. The RSUs shall vest as stated below, instead of according to the vesting provisions in Section 2, upon a Termination of Service prior to a Vesting Date under the specific circumstances described in Sections 3.A. through 3.C. A. Termination of Service for death, disability, and following a Change in Control. If the Employee either (1) dies or (2) experiences a Termination of Service (a) by reason of disability (as determined under the terms of any applicable long-term disability plan of Newmont) or (b) that entitles the Employee to benefits under a Change in Control Plan, the outstanding RSUs subject to this Agreement shall become fully vested and nonforfeitable, as of the date of the Employee’s death or Termination of Service. B. Termination of Service under a Severance Plan of Newmont or Upon Entitlement to Severance Benefits. Upon a Termination of Service without Cause (or circumstances constituting Cause as determined in the sole discretion of the Company) entitling the Employee to: (1) severance benefits under a Severance Plan, or (2) separation benefits for an involuntary termination, the Employee shall vest in a pro-rata percentage of the RSUs as determined in Section 3.B.(i) and (ii) below, as applicable, subject, in each case, to the Employee’s delivery of an effective (non-revoked, if applicable) waiver and release agreement. Any RSUs that do not vest pursuant to this provision shall immediately terminate upon the Termination of Service and be automatically and unconditionally forfeited. (i) If clause (1) of Section 3.B. applies, the pro-rata percentage shall be based on the formula set forth in the Severance Plan (which may be identical to the formula set forth in Section 3.B.(ii) below). (ii) If clause (2) of Section 3.B. applies, the pro-rate percentage shall be determined in accordance with the following formula: - 2 - RSUs vested = Total RSUs Covered by This Agreement X Days Elapsed From Date of Grant to Date of Termination of Service - Prior Vestings 10951 (iii) If the Employee is entitled to vesting acceleration under Section 3.B., and also satisfies the definitional requirements of Retirement, the RSUs shall vest in accordance with Section 3.C. below and not under Section 3.B. C. Retirement. If the Employee’s Termination of Service is due to Retirement, the RSUs shall vest as set forth below. (i) If the Employee retires within 365 days from the Grant Date, a pro-rata percentage of the RSUs shall vest as of the date of the Termination of Service in accordance with the following formula, and the RSUs that do not vest shall immediately terminate and be automatically and unconditionally forfeited. RSUs vested = Total RSUs Covered by This Agreement X Days Elapsed From Date of Grant to Date of Termination of Service 10951 (ii) If the Employee retires more than 365 days after the Grant Date, the RSUs shall continue to vest in accordance with the schedule set forth in Section 2 above, despite the Employee’s Termination of Service. D. Other Terminations. Upon a Termination of Service under any other circumstances not outlined in Sections 3.A. through 3.C., including a voluntary resignation that is not a Retirement, any unvested RSUs shall immediately terminate and be automatically and unconditionally forfeited as of the Termination of Service date. E. Discretion to Apply Termination Vesting Provisions. If Newmont determines that any provision in this Section 3 may be found to be unlawful, discriminatory or against public policy in any relevant jurisdiction, then Newmont, in its sole discretion, may choose not to apply such provision to the RSUs. 1 For leap years, the denominator is 1096. - 3 - 4. No Stockholder Rights Prior to Issuance of Shares; Dividend Equivalents. A. No Stockholder Rights. The Employee shall not have any rights as a stockholder of Newmont with respect to the Shares underlying the RSUs, including but not limited to, the right to vote with respect to such Shares, until the Shares have been issued to the Employee and transferred on the books and records of Newmont. B. Dividend Equivalents. Upon the issuance of Shares to the Employee in settlement of the vested RSUs, the Employee shall also be entitled to a cash payment equal to any dividends paid from the Grant Date until the settlement date with respect to any Shares underlying the RSUs that are issued. 5. Withholding Taxes. A. The Employee acknowledges that the ultimate liability for all Tax-Related Items is and remains the Employee’s responsibility, regardless of any action taken by Newmont or, if different, the Employer. B. The Employee further acknowledges that Newmont and/or the Employer (1) make no representations or undertakings regarding the treatment of any Tax-Related Items in connection with any aspect of the RSUs or the underlying Shares, including but not limited to, the grant, vesting or settlement of the RSUs, the subsequent sale of Shares acquired pursuant to such settlement and the receipt of any dividends and/or any dividend equivalents; and (2) do not commit to and is not obligated to structure the terms of the grant or any aspect of the RSUs to reduce or eliminate the Employee’s liability for Tax- Related Items or achieve any particular tax result for the Employee. Further, if the Employee is subject to Tax-Related Items in more than one jurisdiction, the Employee acknowledges that Newmont and/or the Employer (or former employer, as applicable) may be required to withhold or account for Tax-Related Items in more than one jurisdiction. C. Prior to any relevant taxable or tax withholding event, as applicable, the Employee agrees to make adequate arrangements satisfactory to Newmont and/or the Employer to satisfy all Tax- Related Items. D. The Employee authorizes Newmont or its agent to satisfy any applicable withholding obligations with regard to all Tax-Related Items by withholding a number of whole Shares from the Shares that are issued upon settlement of the RSUs. If Newmont determines in its sole discretion that withholding in Shares is not permissible or advisable under applicable local law or due to adverse accounting consequences, Newmont may satisfy its obligations for Tax-Related Items by one or a combination of the following: (i) withholding from the Employee’s wages or other cash compensation paid to the Employee by Newmont and/or the Employer; (ii) withholding from proceeds of the sale of Shares acquired upon vesting/settlement of the RSUs, either through a voluntary sale or through a mandatory sale arranged by Newmont (on the Employee’s behalf pursuant to this authorization); or (iii) any other method of withholding determined by the Committee and permitted under the Plan and applicable laws. - 4 - E. Newmont may withhold or account for Tax-Related Items by considering applicable minimum statutory withholding rates or other applicable withholding rates in the Employee’s jurisdiction(s), including maximum applicable rates, to the extent permitted by the Plan. In the event of over-withholding, the Employee may receive a refund of any over-withheld amount in cash (with no entitlement to the equivalent in Common Stock) or if not refunded, the Employee may need to seek a refund from the local tax authorities. In the event of under-withholding, the Employee may be required to pay any additional Tax-Related Items directly to the applicable tax authority or to Newmont and/or the Employer. If the obligation for Tax-Related Items is satisfied by withholding in Shares, for tax purposes, the Employee is deemed to have been issued the full number of Shares subject to the vested RSUs, notwithstanding that a number of the Shares are held back solely for the purpose of paying the Tax-Related Items. F. Finally, the Employee agrees to pay to Newmont or the Employer, any amount of Tax-Related Items that Newmont or the Employer may be required to withhold or account for as a result of their participation in the Plan that cannot be satisfied by the means previously described. Newmont may refuse to issue or deliver the Shares or the proceeds of the sale of Shares, if the Employee fails to comply with their obligations in connection with the Tax-Related Items. 6. Delivery of Shares; Payment of Dividend Equivalents. A. As soon as reasonably practicable, but in any event within 60 days, following the Vesting Date or vesting event, as applicable, pursuant to Section 2 or 3, the number of RSUs that become vested shall be settled in Shares. In addition, Dividend Equivalents, if any, shall be settled within 30 days of the date that the RSUs are settled. B. Notwithstanding the foregoing, if the Employee is a U.S. taxpayer and the RSUs are considered non-qualified deferred compensation subject to Section 409A as determined in the sole discretion of Newmont, RSUs that are no longer subject to a substantial risk of forfeiture, as determined in accordance with Section 409A, shall be settled on the earliest to occur of (1) the Vesting Date described in Section 2 or 3, (2) the Employee’s “Disability” meeting the definitional requirements of Section 409A, (3) the Employee’s death, (4) “change in control event” within the meaning of U.S. Treas. Reg. § 1.409A- 3(i)(5) (a “Change in Control Event”), and (5) a “separation from service” within the meaning of Section 409A of the Code (a “Separation from Service”) that occurs following a Change in Control Event. Notwithstanding the foregoing to the contrary, if the settlement of the RSUs is contingent on the Employee’s delivery of an effective (non-revoked, if appliable) waiver and release agreement, and the permitted time period for the Employee to deliver such effective (and non-revoked) waiver and release agreement spans two calendar years, the RSUs shall be settled in the second of the two calendar years. If, however, the Employee is a “specified employee” within the meaning of Section 409A on the date the Employee experiences a Separation from Service, then the RSUs shall instead be settled on the first business day of the seventh month following the Employee’s Separation from Service, to the extent such delayed payment is required to avoid a prohibited distribution under Section 409A. Each issuance upon settlement of the RSUs under this Agreement is intended to constitute a separate payment for purposes of Treasury Regulation Section 1.409A-2(b)(2). 7. Nontransferability. The Employee’s interest in the RSUs and any Shares relating thereto may not be sold, transferred, pledged, assigned, encumbered or otherwise alienated or hypothecated otherwise than by will or by the laws of descent and distribution, prior to such time as the Shares have actually been issued and delivered to the Employee. The Agreement shall be binding upon and shall inure




 
- 5 - to the benefit of the parties hereto and their respective successors and permitted assigns, including, in the case of the Employee, their estate, heirs, executors, legatees, administrators, designated beneficiary and personal representatives. Nothing contained in this Agreement shall be deemed to prevent transfer of the RSUs in the event of the Employee’s death in accordance with Section 12(b) of the Plan. 8. Acknowledgements. The Employee acknowledges receipt of and understands and agrees to the terms of this Agreement and the Plan. The Employee further understands, acknowledges and agrees to the following: A. The Plan and the Plan prospectus are available for review on Fidelity.com, and the Employee agrees to be bound by all of the terms and provisions in this Agreement, including any terms and provisions of the Plan adopted after the date of this Agreement but prior to the completion of the vesting period. If and to the extent that any provision contained in this Agreement is inconsistent with the Plan, the Plan shall govern. B. The grant of RSUs under the Plan at one time does not in any way obligate Newmont or its Affiliates to grant additional RSUs in any future year or in any given amount. C. The grant of RSUs and the Employee’s participation in the Plan shall not create a right to employment or be interpreted as forming or amending an employment or service contract with Newmont and shall not interfere with the ability of the Employer to terminate the Employee’s employment or service relationship (if any). D. The RSUs should in no event be considered as compensation for, or relating in any way to, past services for Newmont, the Employer or any Affiliate. E. The Employee further acknowledges and understands that the Employee’s participation in the Plan is voluntary and that the RSUs and any future RSUs under the Plan are wholly discretionary in nature, the value of which do not form part of any normal or expected compensation for any purposes, including but not limited to, calculating any termination, severance, resignation, redundancy, end of service payments, bonuses, holiday pay, long-service awards, pension or retirement benefits or similar mandatory payments, other than to the extent required by local law. F. The Employee acknowledges and understands that the future value of the Shares acquired by the Employee under the Plan is unknown and cannot be predicted with certainty and that no claim or entitlement to compensation or damages arises from the (1) forfeiture of the RSUs resulting from termination of service (for any reason whatsoever and whether or not in breach of local labor laws and whether or not later found to be invalid) or (2) forfeiture of the RSUs or recoupment of any Shares, cash or other benefits acquired pursuant to the RSUs resulting from the application of the “Clawback/Recoupment/Disgorgement” provision of the Agreement. G. The Employee acknowledges and understands that the RSUs and the Shares subject to the RSUs, and the income and value of the same, are not intended to replace any pension rights or compensation. H. The Employee acknowledges for the purposes of the RSUs: (1) their employment shall be considered terminated as of the date they are no longer actively providing services to Newmont, the Employer or any Affiliate (regardless of the reason for such termination and whether or not later found to be invalid or in breach of employment laws in the jurisdiction where the Employee is employed or the terms of their employment agreement, if any) and (2) unless otherwise expressly provided in this - 6 - Agreement or determined by Newmont, the Employee’s period of employment shall not be extended by any notice period (e.g., the Employee’s period of service would not include any contractual notice period or any period of “garden leave” or similar period mandated under employment laws in the jurisdiction where the Employee is employed or the terms of their employment agreement, if any). The Committee shall have the exclusive discretion to determine when the Employee is no longer actively providing services for purposes of their RSU grant (including whether the Employee may still be considered to be providing services while on a leave of absence). I. The Employee acknowledges and understands that unless otherwise agreed with Newmont, the RSUs and the Shares subject to the RSUs, and the income and value of the same, are not granted as consideration for, or in connection with the service they may provide as a director of an Affiliate of Newmont. J. As of the date of this Agreement, the Grant Acknowledgement, this Agreement, and the Plan set forth the entire understanding between the Employee and Newmont regarding the acquisition of Shares underlying the RSUs in Newmont and supersede all prior oral and written agreements pertaining to the RSUs. K. Newmont has reserved the right to amend or terminate the Plan at any time. L. If the Employee is employed outside the United States: (i) The Employee acknowledges and understands that the RSUs and the Shares subject to the RSUs and the income and value of the same, are not part of normal or expected compensation salary for any purpose. (ii) The Employee acknowledges and understands that neither Newmont, the Employer nor any other Affiliate of Newmont shall be liable for any foreign exchange rate fluctuation between their local currency and the United States Dollar that may affect the value of the RSUs or of any amounts due to the Employee pursuant to the settlement of the RSUs or the subsequent sale of any Shares acquired upon settlement. 9. Miscellaneous. A. No Right to Continued Employment. Neither the grant of the RSUs nor any terms contained in this Agreement, Grant Acknowledgement or the Plan shall confer upon the Employee any express or implied right to continued employment by Newmont or any Affiliate, nor restrict in any way the right of Newmont or any Affiliate to terminate the employment of the Employee at any time with or without Cause. The Employee acknowledges and agrees that any right to receive delivery of Shares is earned only by continuing as an employee, and satisfaction of any other applicable terms and conditions contained in this Agreement, the Grant Acknowledgement, and the Plan. B. Compliance with Laws and Regulations. The award of the RSUs to the Employee and the obligation of Newmont to deliver Shares hereunder shall be subject to (1) all applicable federal, state, local and non-U.S. laws, rules and regulations, and (2) any registration, qualification, approvals or other requirements imposed by any government or regulatory agency or body which Newmont shall, in its sole discretion, determine to be necessary or applicable. Moreover, Shares shall not be delivered if such delivery would be contrary to applicable law or the rules of any stock exchange, as determined in the sole discretion of Newmont. - 7 - C. Notices. Any notice or other important information Newmont sends to the Employee shall be in writing and delivered in person, by electronic means or by mail or courier at the last known address or email address in Newmont’s records. D. Severability. If any of the provisions of this Agreement should be deemed unenforceable, the remaining provisions shall remain in full force and effect. E. Governing Law and Venue. Except as to matters concerning the issuance of Shares or other matters of corporate governance, which shall be determined, and related RSU provisions construed, under the General Corporation Law of the State of Delaware, this Agreement shall be governed by the laws of the State of Colorado without giving effect to any conflict or choice of law rule or principle that might otherwise refer construction or interpretation of the Agreement to the substantive law of another jurisdiction. The parties hereto submit to the exclusive jurisdiction and venue of the federal or state courts of Colorado to resolve any and all issues that may arise out of or relate to this Agreement or the Plan, and the Employee waives any defense to such governing law and venue, including but not limited to, any defense based on subject matter or personal jurisdiction. F. Section 409A. This Section 9.F. applies if the Employee is a U.S. Taxpayer. The terms of the RSUs and payments made pursuant to this Agreement are intended to qualify for an exemption from or comply with the provisions of Section 409A, and the Agreement and the Plan shall be interpreted, operated, and administered in a manner that is consistent with this intent. In furtherance of this intent, the Committee may, but is not required, adopt amendments to this Agreement and/or Plan or adopt other policies and procedures (including amendments, policies, and procedures with retroactive effect), or take any other actions, in each case, without the consent of the Employee, that the Committee determines are reasonably necessary or appropriate to comply with the requirements of Section 409A. In that light, Newmont and Employer, if different, make no representation or covenant to ensure that the RSUs that are intended to be exempt from, or compliant with, Section 409A or that the Committee shall take any action with respect thereto. Nothing in the Agreement shall provide a basis for any person to take action against Newmont or any affiliate, based on matters covered by Section 409A, including the tax treatment of any Shares or other payments made under the RSUs granted under this Agreement, and neither Newmont nor any of its Affiliates shall have any liability to the Employee or their estate or any other party for any taxes, penalties or interest due on amounts paid or payable under the Agreement including any taxes, penalties or interest imposed under Section 409A. G. No Advice Regarding RSUs. Neither Newmont, nor any Affiliate, is providing any tax, legal, or financial advice, nor are they making any recommendations regarding the Employee’s participation in the Plan, or their acquisition or sale of the underlying Shares. The Employee should consult with their own personal tax, legal, and financial advisors regarding their participation in the Plan before taking any action related to the Plan. H. Appendix 1. Notwithstanding any provisions in this Agreement, the award of RSUs shall be subject to any terms and conditions set forth in Appendix 1 to this Agreement for the Employee’s country. Moreover, if the Employee relocates to, or becomes a resident of, one of the countries included in Appendix 1, the terms and conditions for such country shall apply to the Employee, to the extent Newmont determines that the application of such terms and conditions is necessary or advisable for legal or administrative reasons. Appendix 1 constitutes part of this Agreement. I. Imposition of Other Requirements. Newmont reserves the right to impose other requirements on the Employee’s participation in the Plan, on the RSUs and on any Shares acquired under - 8 - the Plan, to the extent Newmont determines that it is necessary or advisable for legal or administrative reasons, and to require the Employee to sign any additional agreements or undertakings that may be necessary to accomplish these additional requirements. J. Clawback/Recoupment/Disgorgement. As an additional condition of receiving the RSUs, the Employee agrees that the RSUs, whether vested or unvested, the Shares, cash, or other benefits acquired pursuant to the RSUs (and any proceeds therefrom), or a combination of or all of the foregoing, may be subject to clawback, recoupment, and/or disgorgement to the extent required (1) under any and all of Newmont’s clawback, recoupment, and/or disgorgement policies, including but not limited to, the Newmont Corporation Clawback Policy, as they may be unilaterally amended or adopted from time to time or (2) under applicable laws, regulations or stock exchange listing standards (collectively, the “Clawback/Recoupment/Disgorgement Requirement”). To satisfy any obligation arising under the Clawback/Recoupment/Disgorgement Requirement, among other things, the Employee expressly and explicitly authorizes Newmont to issue instructions, on the Employee’s behalf, to any brokerage firm and/or third party administrator engaged by Newmont to hold any Shares or other amounts acquired pursuant to the RSUs to re-convey, transfer, or otherwise return such Shares and/or other amounts to Newmont upon Newmont’s enforcement of the Clawback/Recoupment/Disgorgement Requirement. No recovery of compensation as described in this Section 9.J. shall be an event giving rise to the Employee’s right to resign for “good reason” or “constructive termination” (or similar term) under any plan of, or agreement with, Newmont or any Affiliate. This Clawback/Recoupment/Disgorgement Requirement includes, but is not limited to, Newmont’s right to require reimbursement of any RSUs from the Employee if the Employee is terminated (or could have been terminated) for Cause. K. Right of Offset. To the extent permitted by applicable law, Newmont or an Employer may, in its sole discretion, apply any RSUs otherwise due and payable under this Agreement against debts of the Employee to Newmont or an Affiliate. The Employee hereby consents to the reduction of any compensation paid to the Employee by Newmont or an Employer to the extent the Employee receives an overpayment from this Agreement. L. Waiver. The Employee acknowledges that a waiver by Newmont of breach of any provision of this Agreement shall not operate or be construed as a waiver of any other provision of this Agreement, or of any subsequent breach of this Agreement. M. Electronic Delivery and Acceptance. Newmont may, in its sole discretion, decide to deliver any documents related to current or future participation in the Plan by electronic means. The Employee consents to receive such documents by electronic delivery and agrees to participate in the Plan through an online or electronic system established and maintained by Newmont or a third party designated by Newmont. 10. Definitions. As a general principle, any terms defined below that are also defined in the Plan shall have the same general meaning as set forth in the Plan except that they may have been modified to remove terms and concepts not applicable under the Agreement and/or refined to reflect specific terms applicable to the Agreement. Please refer to the applicable term in the Plan for the complete definition.


- 9 - A. “Affiliate” means (1) any Subsidiary; (2) any person that directly or indirectly controls, is controlled by or is under common control with Newmont; and/or (3) to the extent provided by the Committee, any person in which Newmont has a significant interest. The term “control” (including, with correlative meaning, the terms “controlled by” and “under common control with”), as applied to any person, means the possession, directly or indirectly, of the power to direct or cause the direction of the management and policies of such person, whether through the ownership of voting or other securities, by contract or otherwise. For purposes of this definition, “Subsidiary” means any present or future corporation which is or would be a “subsidiary corporation” of Newmont as the term is defined in Section 424(f) of the Code. B. “Agreement” shall have the meaning assigned to it in the first paragraph of the Agreement. C. “Cause” shall have the meaning assigned to it in the Plan and is determined by the Committee in its sole discretion; however, for the convenience of the Employee the salient terms are described below: (i) the willful and continued failure of the Employee to perform substantially the Employee’s duties with Newmont or any Affiliate (other than any such failure resulting from incapacity due to physical or mental illness) or the Employee’s failure to follow policies, directions or Newmont’s or an Affiliate’s code of conduct, after a written demand for substantial performance is delivered to the Employee by Newmont; or (ii) the Employee engaging in illegal conduct or gross negligence or willful misconduct which is potentially injurious to Newmont or any Affiliate; provided that if the Employee acts in accordance with an authorized written opinion of Newmont’s or an Affiliate’s legal counsel, such action shall not constitute “Cause” under this definition; or (iii) any dishonest or fraudulent activity by the Employee or the reasonable belief by Newmont of the Employee’s breach of any contract, agreement, or representation with Newmont or an Affiliate. The Committee has up six (6) months following the Employee’s Termination of Service to determine if such Termination of Service could have been for Cause and, if such a determination is made after the Employee’s Termination of Service, the Employee shall be required to disgorge to Newmont all amounts received under the Plan, this Agreement or otherwise that would not have been payable to such Employee had initial Termination of Service been for Cause. D. “Change in Control Plan” shall mean the Executive Change of Control Plan of Newmont or the Change of Control Plan of Newmont. E. “Change in Control Event” shall have the meaning assigned to it in Section 6.B. F. “Clawback/Recoupment/Disgorgement Requirement” shall have the meaning assigned to it in Section 9.J. - 10 - G. “Code” shall mean the U.S. Internal Revenue Code of 1986, as it may be amended from time to time, including rules and regulations promulgated thereunder and successor provisions and rules and regulations thereto. H. “Committee” shall mean the Leadership Development and Compensation Committee of the Board of Directors or a subcommittee thereof, or such other committee designated by the Board to administer the Plan. I. “Dividend Equivalent” shall mean a right to receive the equivalent value (in cash or Shares) of ordinary dividends that would otherwise be paid on the Shares subject to an RSU but that have not been issued or delivered. J. “Grant Acknowledgement” shall have the meaning assigned to it in the first paragraph of the Agreement. K. “Grant Date” shall mean the later of (1) the date on which the Committee (or its designee) by resolution, written consent or other appropriate action selects the Employee to receive a grant of RSUs, determines the number of Shares or other amount to be subject to such RSUs or (2) the date designated as the “Grant Date” by the Committee by resolution, written consent or other appropriate action in connection with the approval of RSUs. L. “Employee” shall have the meaning assigned to it in the first paragraph of the Agreement. M. “Employer” shall mean the Affiliate that employs the Employee. N. “Newmont” shall have the meaning assigned to it in the first paragraph of the Agreement. O. “Plan” shall mean the Newmont Corporation 2020 Stock Incentive Compensation Plan, as amended from time to time. P. “Restricted Stock Units” or “RSUs” shall mean an unfunded and unsecured promise to deliver Shares or cash, subject to the applicable vesting schedule. Q. “Retirement” shall mean a Termination of Service after: (1) attaining at least age 55; (2) having at least 5 years of Continuous Employment; and (3) reaching a total of at least 65 when adding the Employee’s age plus years of Continuous Employment. This definition may differ from the definition of “retirement” in other benefit plans, such as pension plans of Newmont, and this definition shall not alter those definitions. For purposes of this definition, “Continuous Employment” means continuous employment with Newmont and/or any Affiliate as reflected in the records of Newmont or an Affiliate. For the avoidance of doubt, a period of Continuous Employment does not need to correspond to the Employee’s most recent period of employment with Newmont or an Affiliate since the last rehire date. R. “Section 409A” shall mean Code Section 409A and the guidance promulgated thereunder. - 11 - S. “Separation from Service” shall have the meaning assigned to it in Section 6.B. T. “Severance Plan” shall mean the Severance Plan for Salaried Employees of Newmont or the Severance Plan for Section 16 Officers of Newmont. U. “Share” shall mean the $1.60 par value common stock of Newmont. In the event of any adjustment pursuant to Section 4(c) of the Plan, the stock or security resulting from such adjustment shall be deemed to be a Share within the meaning of the Plan. V. “Tax-Related Items” shall mean any income tax, social insurance, payroll tax, fringe benefits tax, payment on account, or other tax-related items arising from the Employee’s participation in the Plan that are legally required and may also include any other charges that Newmont or the Employer, in its sole discretion, consider appropriate to pass on to the Employee even if legally applicable to Newmont or the Employer. W. “Termination of Service” shall have the meaning assigned to it in the Plan and generally means the termination of the Employee’s employment with, or performance of services for, the Company or any Affiliate under any circumstances, as determined by the Committee, but also address the treatment of leaves of absence, change in service status and transfers of employment between the Company and Affiliates (and between Affiliates) on the status of the Employee’s employment with the Company and/or Affiliates. X. “Vesting Date” shall have the meaning assigned to it in Section 2 of this Agreement. IN WITNESS WHEREOF, pursuant to the Employee’s Grant Acknowledgement (including without limitation, the Terms and Conditions section hereof), incorporated herein by reference, and electronically executed by the Employee, the Employee agrees to the terms and conditions of this Agreement. - 12 - APPENDIX 1 NEWMONT CORPORATION 2020 STOCK INCENTIVE COMPENSATION PLAN 2026 RESTRICTED STOCK UNIT AGREEMENT Unless otherwise provided below, capitalized terms used but not explicitly defined in this Appendix 1 shall have the same definitions as in the Plan and/or the Agreement (as applicable). The terms and conditions in Part A apply to all Employees outside the United States. The country-specific terms and conditions in Part B shall also apply to the Employee if they reside in one of the countries listed below. Terms and Conditions This Appendix 1 includes additional country-specific terms and conditions that govern the Employee’s RSUs if they reside and/or work in one of the countries listed herein. If the Employee is a resident of a country other than the one in which they currently reside and/or work, or if the Employee relocate to another country after the RSUs are granted, or if the Employee is considered a resident of another country for local law purposes, the terms and conditions of the RSUs contained herein may not be applicable to the Employee, and Newmont shall, in its discretion, determine to what extent the terms and conditions contained herein shall apply to the Employee. Notifications This Appendix 1 also includes information regarding certain issues of which the Employee should be aware with respect to their participation in the Plan. The information is based on the securities, exchange control and other laws in effect in the respective countries as of February 2026. Such laws are often complex and change frequently. As a result, the Employee should not rely on the information in this Appendix 1 as the only source of information relating to the consequences of their participation in the Plan because the information may be out of date at the time that the Employee’s RSUs vest or they sell Shares acquired under the Plan. In addition, the information contained herein is general in nature and may not apply to the Employee’s particular situation, and Newmont is not in a position to assure the Employee of a particular result. Accordingly, the Employee should seek appropriate professional advice as to how the relevant laws in their country may apply to their situation. Finally, if the Employee (1) is a resident of a country other than the one in which they currently reside and/or work, (2) transfers employment after the RSUs are granted, or (3) is considered a resident of another country for local law purposes, the information contained herein may not apply to the Employee.


- 13 - A. ALL NON-U.S. COUNTRIES TERMS AND CONDITIONS The following additional terms and conditions shall apply to the Employee if they reside in any country outside the United States. 1. Data Privacy Information and Consent. Newmont headquarters is located at 6900 E. Layton Ave., Suite 700, Denver, Colorado 80237, U.S.A., and grants awards to employees of Newmont and its Affiliates, at Newmont’s sole discretion. If the Employee would like to participate in the Plan, please review the following information about Newmont’s data processing practices and declare the Employee’s consent. (a) Data Collection and Usage. Newmont collects, processes and uses personal data of the Employees, including name, home address, email address and telephone number, date of birth, social insurance number or other identification number, salary, citizenship, job title, any Shares or directorships held in Newmont, and details of all awards or other entitlements to Shares, granted, canceled, exercised, vested, unvested or outstanding in the Employee’s favor (“Data”), which Newmont receives from the Employee or the Employer. In connection with the grant of the RSU, Newmont shall collect the Employee’s Data for purposes of administering the Employee’s participation in the Plan. Newmont’s legal basis for the processing of the Employee’s Data, where required, is the Employee’s consent. (b) Stock Plan Administration Service Providers. Newmont transfers Data to Fidelity Investments, an independent service provider based in the United States, which assists Newmont with the implementation, administration and management of the Plan. In the future, Newmont may select a different service provider and share the Employee’s Data with another company that serves in a similar manner. Newmont’s service provider shall open an account for the Employee to receive Shares. The Employee may be asked to agree on separate terms and data processing practices with the service provider, which is a condition to the Employee’s ability to participate in the Plan. (c) International Data Transfers. Newmont and its service providers are based in the United States. If the Employee is outside the United States, the Employee should note that their country has enacted data privacy laws that are different from those in the United States. Newmont’s legal basis for the transfer of the Employee’s Data is their consent. (d) Data Retention. Newmont shall use the Employee’s Data only as long as is necessary to implement, administer and manage the Employee’s participation in the Plan or as required to comply with legal or regulatory obligations, including under tax, exchange control, labor and security laws. This period may extend beyond the Employee’s period of employment with the Employer. When Newmont or the Employer no longer need Data for any of the above purposes, they shall cease processing it in this context and remove it from all of their systems used for such purposes to the fullest extent practicable. (e) Voluntariness and Consequences of Denial or Withdrawal. The Employee’s participation in the Plan and the Employee’s grant of consent are purely voluntary. The Employee may deny or withdraw their consent at any time. If the Employee does not consent, or if the Employee withdraws their consent, the Employee cannot participate in the Plan. This would not affect the Employee’s salary as an employee or their career; the Employee would merely forfeit the opportunities associated with the Plan. - 14 - (f) Data Subject Rights. The Employee has a number of rights under data privacy laws in their country. Depending on where the Employee is based, the Employee’s rights may include the right to (1) request access or copies of Data Newmont processes, (2) rectification of incorrect Data, (3) deletion of Data, (4) restrict the processing of Data, (5) restrict the portability of Data, (6) lodge complaints with the competent tax authorities in the Employee’s country, and/or (7) receive a list with the names and addresses of any potential recipients of Data. To receive clarification regarding the Employee’s rights or to exercise the Employee’s rights please contact Newmont at Newmont Corporation, 6900 E. Layton Ave., Suite 700, Denver, Colorado 80237 U.S.A., attention: Director of Compensation, Newmont Corporate. If the Employee agrees with the data processing practices as described in this notice, please declare the Employee’s consent by clicking “Accept” on the Fidelity award acceptance page. 2. Language. The Employee acknowledges that they are sufficiently proficient in English, or, alternatively, the Employee acknowledges that they shall seek appropriate assistance, to understand the terms and conditions in the Agreement. Furthermore, if the Employee received this Agreement or any other document related to the Plan translated into a language other than English and if the meaning of the translated versions is different than the English version, the English version shall control unless otherwise required by applicable law. 3. Insider-Trading/Market-Abuse Laws. The Employee acknowledges that, depending on their country or broker’s country, or the country in which Common Stock is listed, they may be subject to insider trading restrictions and/or market abuse laws in applicable jurisdictions, which may affect their ability to accept, acquire, sell or attempt to sell, or otherwise dispose of the Shares, rights to Shares (e.g., RSUs) or rights linked to the value of Common Stock, during such times as the Employee is considered to have “inside information” regarding Newmont (as defined by the laws or regulations in applicable jurisdictions, including the United States and the Employee’s country). Local insider trading laws and regulations may prohibit the cancellation or amendment of orders that the Employee placed before possessing inside information. Furthermore, the Employee may be prohibited from (1) disclosing insider information to any third party, including fellow employees and (2) “tipping” third parties or causing them to otherwise buy or sell securities. Any restrictions under these laws or regulations are separate from and in addition to any restrictions that may be imposed under any applicable Newmont insider trading policy. The Employee acknowledges that it is their responsibility to comply with any applicable restrictions, and the Employee should speak to their personal advisor on this matter. 4. Foreign Asset/Account Reporting Requirements. The Employee acknowledges that there may be certain foreign asset and/or account reporting requirements that may affect their ability to acquire or hold the Shares acquired under the Plan or cash received from participating in the Plan (including from any dividends paid on the Shares acquired under the Plan) in a brokerage or bank account outside their country. The Employee may be required to report such accounts, assets or transactions to the tax or other authorities in their country. The Employee also may be required to repatriate sale proceeds or other funds received as a result of participating in the Plan to their country through a designated bank or broker within a certain time after receipt. The Employee acknowledges that it is their responsibility to be compliant with such regulations, and they should speak to their personal advisor on this matter. - 15 - 5. General. Notwithstanding the provisions of the Agreement, if Newmont or the Employer develops a good faith belief that any provision may be found to be unlawful, discriminatory or against public policy in any relevant jurisdiction, then Newmont in its sole discretion may choose not to apply such provision to the RSU, nor any RSU grant in the Employee’s jurisdiction. B. COUNTRY-SPECIFIC ADDITIONAL TERMS AND CONDITIONS ARGENTINA Notifications Securities Law Information. Neither the RSUs nor the underlying Shares are publicly issued, placed, distributed, offered, registered or listed on any stock exchange or capital market in Argentina and, as a result, have not been and shall not be registered with the Argentine Securities Commission (Comisión Nacional de Valores). Neither this Agreement nor any other offering material related to the RSUs nor the underlying Shares shall be utilized in connection with any general offering to the public in Argentina. Argentine residents who acquire RSUs under the Plan do so under their own responsibility according to the terms of a private offering made from outside Argentina. Any Argentine resident who acquires Shares shall not transfer such Shares to any person within six (6) months of acquiring the Shares, unless the transaction is concluded outside Argentina and the Shares are not sold back to the Company. Accordingly, the transfer restriction should not apply if Shares are sold on the New York Stock Exchange. Exchange Control Information. It is the Employee’s responsibility to comply with any and all Argentinian currency exchange restrictions, approvals, and reporting requirements in connection with the RSUs. Foreign Asset / Account Reporting Notification. If the Employee is an Argentinian tax resident, the Employee must report any Shares acquired under the Plan and held by the Employee on December 31st of each year on their annual tax return for that year. AUSTRALIA Notifications Securities Law Information. The offer of RSUs is being made under Division 1A, Part 7.12 of the Australian Corporations Act 2001 (Cth). Tax Information. The Plan is a plan to which Subdivision 83A-C of the Income Tax Assessment Act 1997 (Cth) applies (subject to the conditions in the Act). Exchange Control Information. Exchange control reporting is required for cash transactions exceeding A$10,000 and international fund transfers. The Australian bank assisting with the transaction shall file the report. If there is no Australian bank involved in the transfer, the Employee shall be required to file the report. CANADA Terms and Conditions Acknowledgements. Sections 8.E and 8.F of the Agreement apply, except as explicitly and minimally required under applicable legislation. - 16 - Vesting/Termination. The following provision supplements Section 3 of the Agreement and replaces Section 8.H of the Agreement: For purposes of the Agreement, except as otherwise provided for in Section 3 of the Agreement or to the extent explicitly and minimally required under applicable legislation, in the event the Employee ceases their employment or service relationship with Newmont or Employer (for any reason whatsoever and whether or not later found to be invalid or in breach of local labor laws), the Employee’s right to vest in the RSUs shall terminate as of the date that is the earliest of: (a) the date the Employee’s employment with the Employer is terminated for any reason; and (b) the date the Employee receives written notice of termination from the Employer; regardless of any period during which notice, pay in lieu of notice or related payments or damages are provided or required to be provided under local law. For greater certainty, the Employee shall not earn or be entitled to any pro-rated vesting for that portion of time before the date on which their right to vest terminates, nor shall the Employee be entitled to any compensation for lost vesting. Notwithstanding the foregoing, if applicable employment standards legislation explicitly requires continued vesting or other participation during a statutory notice period, the Employee’s right to vest in the RSUs, if any, or otherwise participate in or benefit from the RSUs, shall terminate effective as of the last date of the minimum statutory notice period. For clarity, the Employee shall not earn or be entitled to pro-rated vesting or other participation if the Vesting Date or vesting event falls after the end of the statutory notice period, nor shall the Employee be entitled to any compensation for lost vesting or other participation. The following provisions apply if the Employee is a resident of Quebec: French Language Documents. A French translation of certain documents related to the Plan shall be made available to the Employee as soon as reasonably practicable. Notwithstanding the provisions of Section 3 of Part A of this Appendix 1, to the extent required by applicable law and unless the Employee indicates otherwise, the French translation of such documents shall govern the Employee’s participation in the Plan. Documents en Langue Française. Une traduction française de certains documents relatifs au Plan sera mise à la disposition du Employee dès que cela sera raisonnablement possible. Nonobstant les dispositions de l’article 3 de la Partie A de la présente Annexe, dans la mesure requise par la loi applicable et à moins que l’Employee n’indique le contraire, la traduction française de ces documents régira la participation du Employee au Plan. Data Privacy. The following provision supplements Section 1 of Part A of this Appendix 1: The Employee hereby authorizes Newmont and its representatives to discuss with and obtain all relevant information from all personnel, professional or not, involved in the administration and operation of the Plan. The Employee further authorizes Newmont, any parent or Affiliate and any stock plan service provider that may be selected by Newmont to assist with the Plan to disclose and discuss the Plan with their respective advisors. The Employee further authorizes Newmont and any parent or Affiliate to record such information and to keep such information in the Employee’s employee file. The Employee acknowledges and agrees that their personal information, including sensitive personal information, may be transferred or disclosed outside of the province of Quebec, including to the United States. Finally, the Employee acknowledges and authorizes Newmont and other parties involved in the administration of the


- 17 - Plan to use technology for profiling purposes and to make automated decisions that may have an impact on the Employee or the administration of the Plan. Notifications Securities Law Information. The Employee is permitted to sell Shares acquired through the Plan through the designated broker appointed under the Plan, if any, provided the resale of Shares acquired under the Plan takes place outside Canada through the facilities of a stock exchange on which the Shares are listed on the New York Stock Exchange. Foreign Asset/Account Reporting Information. Canadian residents are required to report foreign specified property, including Shares and rights to receive Shares (e.g., RSUs), on form T1135 (Foreign Income Verification Statement) if the total cost of the foreign specified property exceeds C$100,000 at any time during the year. RSUs must be reported (generally, at a nil cost) if the C$100,000 cost threshold is exceeded because of other foreign specified property held by the Employee. When Shares are acquired, their cost generally is the adjusted cost base (“ACB”) of the Shares. The ACB would ordinarily equal the fair market value of the Shares at the time of acquisition, but if the Employee owns other Shares, this ACB may have to be averaged with the ACB of the other Shares. CHILE Notifications Securities Law Information. The award of RSUs constitutes a private offering of securities in Chile effective as of the date of grant, and is expressly subject to general ruling N° 336 of the Chilean Commission for the Financial Market (“CMF”). The award of RSUs refers to securities not registered at the securities registry or at the foreign securities registry of the CMF, and, therefore, such securities are not subject to oversight of the CMF. Given that the Shares underlying the RSUs are not registered in Chile, Newmont is not required to provide public information about the RSUs or the Shares in Chile. Unless the RSUs and/or the Shares are registered with the CMF, a public offering of such securities cannot be made in Chile. Foreign Asset/Account Reporting Information. The CIRS requires all taxpayers to provide information annually regarding (1) the results of investments held abroad and (2) any taxes paid abroad which the taxpayers shall use as credit against Chilean income tax. The sworn statements disclosing this information (or Formularios) must be reported on Form 1929 and submitted electronically through the CIRS website (www.sii.cl) before July 1 of each year, depending on the assets and/or taxes being reported. If the Employee fails to meet the above requirements, the Employee may be ineligible to receive certain foreign tax credits. Given that these requirements are subject to change, the Employee should consult with their personal tax advisor to determine the Employee’s reporting obligations to the CIRS. Exchange Control Information. The Employee may receive foreign currency abroad as a result of the acquisition of Shares and freely decide whether to repatriate such currency to Chile or keep it abroad. However, if the Employee repatriates currency, and such amounts exceed USD 10,000, the proceeds must be remitted using the formal exchange market. It is not necessary to convert the repatriated funds into Chilean currency. Given that these requirements are subject to change, the Employee should consult with their personal advisor to determine the Employee’s obligations. - 18 - COSTA RICA There are no country-specific provisions. FIJI There are no country-specific provisions. GHANA There are no country-specific provisions. INDONESIA Language Consent. By accepting the RSUs, the Employee (1) confirms having read and understood the documents relating to this grant (i.e., the Plan and the Agreement) which were provided in the English language, (2) accepts the terms of those documents accordingly, and (3) agrees not to challenge the validity of this document based on Law No. 24 of 2009 on National Flag, Language, Coat of Arms and National Anthem or the implementing Presidential Regulation (when issued). Persetujuan Bahasa. Dengan menerima pemberian Unit Saham Terbatas (RSUs) ini, Karyawan (1) memberikan konfirmasi bahwa dirinya telah membaca dan memahami dokumen-dokumen berkaitan dengan pemberian ini (yaitu, Perjanjian Penghargaan dan Program) yang disediakan dalam Bahasa Inggris, (2) menerima persyaratan di dalam dokumen-dokumen tersebut, dan (3) setuju untuk tidak mengajukan keberatan atas keberlakuan dari dokumen ini berdasarkan Undang-Undang No. 24 Tahun 2009 tentang Bendera, Bahasa dan Lambang Negara serta Lagu Kebangsaan ataupun Peraturan Presiden sebagai pelaksanaannya (ketika diterbitkan) Exchange Control Information. If the Employee remits funds (including proceeds from the sale of Shares) into Indonesia, the Indonesian bank through which the transaction is made shall submit a report of the transaction to Bank Indonesia for statistical reporting purposes. For transactions in excess of a certain threshold, a more detailed description of the transaction must be included in the report and the Employee may be required to provide information about the transaction (e.g., the Employee’s relationship with the transferor of the funds, the source of the funds, etc.) to the bank in order for the bank to complete the report. In addition, the Employee may be required to provide the Bank Indonesia with information on foreign exchange activities, which may include Shares held outside Indonesia, on a monthly basis. The reporting should be completed online through Bank Indonesia’s website, by no later than the 15th day of the following month. MEXICO Terms and Conditions Plan Document Acknowledgement. By accepting the RSUs, the Employee acknowledges that they have received a copy of the Plan, the Grant Acknowledgement, and the Agreement, including this Appendix 1, which the Employee has reviewed. The Employee acknowledges further that they accept all the provisions of the Plan, the Grant Acknowledgement, and the Agreement, including this Appendix 1. The Employee also acknowledges that they have read and specifically and expressly approve the terms and conditions set forth in Section 8 of the Agreement, which clearly provides as follows: - 19 - (1) the Employee’s participation in the Plan does not constitute an acquired right; (2) The Plan and the Employee’s participation in it are offered by Newmont on a wholly discretionary basis; (3) the Employee’s participation in the Plan is voluntary; and (4) Newmont and its Affiliates are not responsible for any decrease in the value of any Shares acquired at vesting and settlement of the RSUs. Labor Law Policy and Acknowledgment. By accepting the RSUs, the Employee expressly recognizes that Newmont, with registered offices at 6900 E. Layton Ave., Suite 700, Denver, Colorado 80237, U.S.A., is solely responsible for the administration of the Plan and that the Employee’s participation in the Plan and acquisition of Shares do not constitute an employment relationship between the Employee and Newmont since the Employee is participating in the Plan on a wholly commercial basis and their sole employer is Newmont’s Affiliate in Mexico (“Newmont Mexico”). Based on the foregoing, the Employee expressly recognizes that the Plan and the benefits that they may derive from participating in the Plan do not establish any rights between the Employee and the employer, Newmont Mexico, and do not form part of the employment conditions and/or benefits provided by Newmont Mexico, and any modification of the Plan or its termination shall not constitute a change or impairment of the terms and conditions of the Employee’s employment. The Employee further understands that their participation in the Plan is as a result of a unilateral and discretionary decision of Newmont; therefore, Newmont reserves the absolute right to amend and/or discontinue the Employee’s participation at any time without any liability to the Employee. Finally, the Employee hereby declares that they do not reserve to themself any action or right to bring any claim against Newmont for any compensation or damages regarding any provision of the Plan or the benefits derived under the Plan, and the Employee therefore grants a full and broad release to Newmont, and its subsidiaries, branches, representative offices, stockholders, directors, officers, employees, agents, or legal representatives with respect to any claim that may arise. Spanish Translation Reconocimiento del Documento del Plan Al aceptar las Unidades de Acciones Restringidas (RSUs, por sus siglas en inglés), el Empleado reconoce que ha recibido una copia del Plan, el Reconocimiento de la Subvención y el Acuerdo, con inclusión de este Apéndice, que el Empleado ha revisado. El Empleado reconoce, además, que acepta todas las disposiciones del Plan, el Reconocimiento de la Subvención, y en el Acuerdo, incluyendo este Apéndice. El Empleado también reconoce que ha leído y que concretamente aprueba de forma expresa los términos y condiciones establecidos la Sección 8 del Acuerdo, que claramente dispone lo siguiente: (1) La participación del Empleado en el Plan no constituye un derecho adquirido; (2) El Plan y la participación del Empleado en el Plan se ofrecen por Newmont en su discrecionalidad total; - 20 - (3) Que la participación del Empleado en el Plan es voluntaria; y (4) Newmont y sus Subsidiarias no son responsables de ninguna disminución en el valor de las acciones adquiridas al conferir las RSUs. Política Laboral y Reconocimiento Al aceptar las RSUs, el Empleado expresamente reconoce que Newmont, con sus oficinas registradas y ubicadas en 6900 E. Layton Ave., Suite 700, Denver, Colorado 80237, U.S.A., es la única responsable por la administración del Plan y que la participación del Empleado en el Plan y en su caso la adquisición de Acciones no constituyen una relación de trabajo entre el Empleado y Newmont, ya que el Empleado participa en el Plan en un marco totalmente comercial y su único patrón es el Subsidiario de Newmont en Mexico (“Newmont Mexico”). Derivado de lo anterior, el Empleado expresamente reconoce que el Plan y los beneficios que pudieran derivar de la participación en el Plan no establecen derecho alguno entre el Empleado y el patrón, Newmont Mexico, y no forma parte de las condiciones de trabajo y/o las prestaciones otorgadas por Newmont Mexico, y que cualquier modificación al Plan o su terminación no constituye un cambio o desmejora de los términos y condiciones de la relación de trabajo del Empleado. Asimismo, el Empleado reconoce que su participación en el Plan se ha resultado de una decisión unilateral y discrecional de Newmont; por lo tanto, Newmont se reserva el derecho absoluto de modificar y/o terminar la participación del Empleado en cualquier momento y sin responsabilidad alguna frente el Empleado. Finalmente, el Empleado por este medio declara que no se reserva ninguna derecho o acción en contra de Newmont por cualquier compensación o daños y perjuicios en relación de las disposiciones del Plan o de los beneficios derivados del Plan, y por lo tanto, el Empleado otorga el más amplio finiquito que en derecho proceda a Newmont, y sus Subsidiarias, oficinas de representación, accionistas, directores, autoridades, empleados, agentes, o representantes legales en relación con cualquier demanda que pudiera surgir. Notifications Securities Law Information. The RSUs and the Shares offered under the Plan have not been registered with the National Register of Securities maintained by the Mexican National Banking and Securities Commission and cannot be offered or sold publicly in Mexico. In addition, the Plan, the Agreement and any other document relating to the RSUs may not be publicly distributed in Mexico. These materials are addressed to the Employee only because of their existing relationship with Newmont and these materials should not be reproduced or copied in any form. The offer contained in these materials does not constitute a public offering of securities but rather constitutes a private placement of securities addressed specifically to individuals who are present employees of the Employer made in accordance with the provisions of the Mexican Securities Market Law, and any rights under such offering shall not be assigned or transferred. PAPUA NEW GUINEA Terms and Conditions Award Settlement. Notwithstanding any provision in the Agreement to the contrary, if deemed by Newmont to be necessary for regulatory reasons, Newmont reserves the right to settle RSUs by payment in cash or its equivalent of an amount equal in value to the Shares subject to the vested RSUs.


- 21 - Notifications Exchange Control Information. Before receiving funds from the sale of any securities abroad, the Employee shall need to apply for and receive an Income Tax Clearance Certificate from the taxation authorities in Papua New Guinea, which the Employee must then lodge with the appropriate Bank of Papua New Guinea notification form with the commercial bank in which the transaction takes place. PERU Terms and Conditions Labor Law Acknowledgement. The following provision supplements Sections 8 and 9 of the Agreement: the Employee acknowledges that the RSUs are being granted ex gratia to the Employee with the purpose of rewarding them. Notifications Securities Law Information. The offer of the RSUs is considered a private offering in Peru; therefore, it is not subject to registration. For more information concerning this offer, please refer to the Plan, the Agreement and any other grant documents made available by Newmont. SOUTH AFRICA Terms and Conditions Taxes. The following provision supplements Section 5 of the Agreement: By accepting the RSUs, the Employee agrees that, immediately upon settlement of the RSUs, the Employee will notify the Employer of the amount of any gain realized at vesting. The Employee will be solely responsible for paying any difference between the actual liability for Tax-Related Items and the amount withheld. Deemed Acceptance of RSUs. Pursuant to Section 96 of Companies Act 71 of 2008 (the "Companies Act"), the RSU offer must be finalized within six months following the date the offer is communicated to the Employee. If the Employee does not want to accept the RSUs, the Employee is required to decline the award no later than six months following the date the offer is communicated to the Employee. If the Employee does not reject the RSUs within six months following the date the offer is communicated to the Employee, the Employee will be deemed to accept the RSUs. Notifications Securities Law Information. Neither the RSUs nor the underlying Shares shall be publicly offered or listed on any stock exchange in South Africa. The offer is intended to be private pursuant to Section 96 of the Companies Act and is not subject to the supervision of any South African governmental authority. Exchange Control Notification. Because exchange control regulations are subject to frequent change, sometimes without notice, the Employee should consult their personal legal advisor prior to the settlement of the RSUs to ensure compliance with current regulations. The Employee is solely responsible for ensuring compliance with all exchange control laws in South Africa. - 22 - SURINAME Terms and Conditions Award Settlement. Notwithstanding any provision in the Agreement to the contrary, if deemed by Newmont to be necessary for regulatory reasons, Newmont reserves the right to settle RSUs by payment in cash or its equivalent of an amount equal in value to the Shares subject to the vested RSUs. - 23 - Appendix 2: Vesting Schedule Date Quantity February 23, 2026 # of shares February 23, 2027 # of shares February 23, 2028 # of shares


EXHIBIT 21
NEWMONT CORPORATION AND SUBSIDIARIES
As of December 31, 2025
NameIncorporationOwnership*
Newmont CorporationDelaware, USA
Goldcorp Inc.Delaware, USA100.0000%
1144963 B.C. Ltd.British Columbia100.0000%
North American Metals Corp.British Columbia52.9083%
Administradora de Negocios Mineros S.A. de C.V.Mexico>99.9999%
Goldcorp S.A. de C.V.Mexico27.8573%
Administradora de Negocios Mineros S.A. de C.V.Mexico<0.0001%
Minera Peñasquito S.A. de C.V.Mexico99.9867%
Goldcorp S.A. de C.V.Mexico<0.0013%
Servicios Administrativos Goldcorp, S.A. de C.V.Mexico>99.9999%
Servicios Administrativos Goldcorp, S.A. de C.V.Mexico<0.0001%
Goldcorp Canada ULCAlberta100.0000%
1516847 B.C. Ltd.British Columbia100.0000%
Goldcorp (Barbados) Inc.Barbados100.0000%
Goldcorp Aureus Inc.Barbados100.0000%
Pueblo Viejo (Jersey) 1 LimitedJersey40.0000%
Pueblo Viejo (Jersey) 2 LimitedJersey100.0000%
Goldcorp Tesoro Inc.Barbados100.0000%
Datawave Sciences Inc.British Virgin Islands100.0000%
Minera Goldcorp Chile S.p.A.Chile0.1600%
NuevaUnion S.p.A.Chile11.9086%
El Morro S.p.A.Chile100.0000%
Minera Goldcorp Chile S.p.A.Chile99.8400%
NuevaUnion S.p.A.Chile38.0914%
Newmont Servicios Chile S.p.A.Chile0.0077%
Goldcorp Global Services Inc.British Columbia100.0000%
Newmont Goldcorp Integrated Services Inc.Ontario100.0000%
Newmont Goldcorp Red Lake Holdings Ltd.British Columbia100.0000%
Goldcorp Exeter Ltd.British Columbia100.0000%
Goldcorp MC Holding S.p.A.Chile100.0000%
Norte Abierto S.p.A.Chile34.1615%
Goldcorp Stratum Holdings (Canada) ULCBritish Collumbia100.0000%
Newmont Servicios Chile S.p.A.Chile99.9923%
Norte Abierto Holdings (Canada) ULCBritish Columbia50.0000%
Norte Abierto S.p.A.Chile31.6770%
Goldcorp General Holdings Ltd.British Columbia100.0000%
Goldcorp S.A. de C.V.Mexico72.1414%
Goldcorp USA Holdings Ltd.Delaware, USA100.0000%
Goldcorp America Holdings Inc.Nevada, USA100.0000%
Goldcorp USA Inc.Nevada, USA100.0000%
Glamis Rand Mining CompanyNevada, USA100.0000%
Honduras Holdings Ltd.Cayman Islands100.0000%
Prestadora de Servicios Generales, S.A. de C.V. Honduras99.6000%
International Mineral Finance B.V.Netherlands100.0000%
Goldcorp Holdings B.V.Netherlands100.0000%
Goldcorp Trading B.V.Netherlands100.0000%
Oroplata S.A.Argentina99.7450%
Mexicana Resources Inc.British Columbia100.0000%
Minera Peñasquito S.A. de C.V. Mexico<0.0133%
Montana Exploradora de Guatemala S.A. Guatemala1.0000%


Peridot S.A.Guatemala2.0000%
Sermineros de Mexico S.A. de C.V.Mexico<0.0001%
Montana Exploradora de Guatemala S.A.Guatemala99.0000%
Newmont Goldcorp Insurance Company Inc.Barbados100.0000%
Newmont Saddle Minerals Ltd.British Columbia100.0000%
North American Metals Corp.British Columbia47.0917%
Oroplata S.A.Argentina0.2550%
Peridot S.A.Guatemala98.0000%
Sermineros de Mexico S.A. de C.V.Mexico>99.9999%
Newcrest Resources, Inc.Delaware, USA100.0000%
Newcrest USA Finance LLCDelaware, USA100.0000%
Newroyal Resources Inc.Delaware, USA100.0000%
Newmont Australia Pty LtdVictoria, Australia100.0000%
Hotham Wind Farm Pty LtdWestern Australia100.0000%
Newmont AP Power Pty LtdWestern Australia100.0000%
Newmont Boddington Pty LtdWestern Australia100.0000%
Newmont Boddington Gold Pty LtdWestern Australia100.0000%
Newmont Capital Pty LtdNew South Wales, Australia100.0000%
Newmont Exploration Holdings Pty LtdQueensland, Australia100.0000%
Newmont Exploration Pty LtdVictoria, Australia100.0000%
Newmont Landco Pty LtdWestern Australia100.0000%
Newmont Mining Finance Pty LtdAustralian Capital Territory100.0000%
Newmont Mining Holdings Pty LtdSouth Australia100.0000%
Newmont Gold Pty LtdWestern Australia100.0000%
Newmont Mining Services Pty LtdWestern Australia100.0000%
Newmont Tanami Pty LtdWestern Australia100.0000%
Newmont Woodcutters Pty LtdNew South Wales, Australia100.0000%
Newmont Yandal Operations Pty LtdVictoria, Australia100.0000%
Newmont Canada FN Holdings ULCBritish Columbia<.0001%
Newmont Capital LimitedNevada, USA100.0000%
Miramar Gold CorporationNevada, USA100.0000%
Talapoosa Mining Inc.Nevada, USA100.0000%
Newmont FH B.V.Netherlands100.0000%
Newmont Canada Holdings ULCBritish Columbia100.0000%
Newmont Holdings ULCNova Scotia100.0000%
Newmont Canada FN Holdings ULCBritish Columbia99.9846%
Miramar Northern Mining Ltd.British Columbia100.0000%
Con Exploration Ltd.British Columbia100.0000%
Miramar HBG Inc.Quebec100.0000%
Newmont Canada CorporationNova Scotia100.0000%
Hemlo Gold Mines (Ghana) LimitedGhana100.0000%
Newmont Canada FN Holdings ULCBritish Columbia0.0154%
PT Newmont Minahasa RayaIndonesia80.0000%
Newmont Galore Creek Holdings CorporationBritish Columbia100.0000%
Galore Creek PartnershipBritish Columbia50.0000%
Galore Creek Mining CorporationBritish Columbia100.0000%
Newmont International Holdings Pty Ltd.Australia100.0000%
Newmont Overseas Holdings Pty LtdAustralia100.0000%
Newcrest Mining Limited Australia100.0000%
Cadia Holdings Pty LimitedAustralia100.0000%
Contango Agricultural Company Pty LtdAustralia100.0000%
Lihir Gold LimitedPapua New Guinea100.0000%
Lihir Management Company LimitedPapua New Guinea100.0000%
Newcrest Finance Pty LimitedAustralia100.0000%
Newcrest Holdings (Investments) Pty LimitedAustralia100.0000%
Newcrest Insurance Pte. Ltd.Singapore100.0000%
Newcrest International Pty LtdAustralia100.0000%


600 Holdings IncUSA100.0000%
Newcrest USA, Inc.USA100.0000%
Newcrest British Columbia 2 Mining Ltd.Canada, British Columbia100.0000%
Newcrest Canada Holdings Inc.Canada100.0000%
Newcrest Canada Inc.Canada100.0000%
Lundin Gold Inc.Canada32.0000%
Newcrest Canada Services Inc.Canada100.0000%
Newcrest Chile Holdings 1 LimitedBermuda100.0000%
Newcrest Chile Holdings 2 LimitedBermuda100.0000%
NewcrestEcuador S.A.Ecuador99.0000%
Newcrest Exploration Holdings Pty LtdAustralia100.0000%
NewcrestEcuador S.A.Ecuador1.0000%
Newcrest Fiji Exploration Holdings 1 Pte. Ltd.Singapore100.0000%
Newcrest Exploration (Fiji) Pte. LimitedFiji50.0000%
Newcrest Fiji Exploration Holdings 2 Pte. Ltd.Singapore100.0000%
Newcrest Exploration (Fiji) Pte. LimitedFiji50.0000%
Newcrest (Fiji) Pte LimitedFiji100.0000%
Newcrest PNG 2 LimitedPapua New Guinea100.0000%
Wafi-Golpu Services LimitedPapua New Guinea50.0000%
Newcrest PNG 3 LimitedPapua New Guinea100.0000%
Morobe Exploration Services LimitedPapua New Guinea50.0000%
Newcrest PNG Exploration LimitedPapua New Guinea100.0000%
Newcrest PNG Wamum Limited (PNG)Papua New Guinea100.0000%
Newcrest Peru Holdings 1 LimitedBermuda100.0000%
Minera Newcrest Peru SACPeru50.0000%
Newcrest Peru Holdings 2 LimitedBermuda100.0000%
Minera Newcrest Peru SACPeru50.0000%
Newcrest Red Chris Mining LimitedCanada, British Columbia100.0000%
Pretium Resources Inc.Canada, British Columbia100.0000%
0890696 B.C. Ltd.Canada, British Columbia100.0000%
PT Nusantara Bintang ManagementIndonesia95.0000%
Sulawesi Investments Pty LimitedAustralia100.0000%
PT Nusantara Bintang ManagementIndonesia5.0000%
Surnorte Ventures Pte. Ltd.Singapore50.0000%
Surnorte Holdings I Pte. Ltd.Singapore100.0000%
Surnorte S.AEcuador50.0000%
Surnorte Holdings II Pte. Ltd.Singapore100.0000%
Surnorte S.AEcuador50.0000%
Wafi Golpu Australia Services Pty LtdAustralia50.0000%
Newcrest Services Pty LimitedAustralia100.0000%
Newcrest Technology Pty LtdAustralia100.0000%
Newgen Pty LtdAustralia100.0000%
Newmont NOL Pty LimitedAustralia100.0000%
Niugini Mining (Australia) Pty LtdAustralia100.0000%
Newcrest West Africa Holdings Pty LtdAustralia100.0000%
LGL Holdings CI SAIvory Coast98.0000%
LGL Development CI SAIvory Coast98.0000%
LGL Mount Rawdon Operations Pty LtdAustralia100.0000%
LGL CDI Investments Pty LtdAustralia100.0000%
Newcrest Dougbafla Holdings Pte. Ltd.Singapore100.0000%
Newcrest Dougbafla CI SAIvory Coast89.8900%
Newmont LaSource SASFrance100.0000%
Newmont Ghana Gold LimitedGhana100.0000%
Newmont Services Costa Rica Sociedad de Responsabilidad LimitadaCosta Rica100.0000%
Newmont Suriname, LLCDelaware, USA100.0000%
Suriname Gold Project CVSuriname75.0000%
Newmont USA LimitedDelaware, USA100.0000%


Battle Mountain Resources Inc.Nevada, USA100.0000%
Dawn Mining Company LLCDelaware, USA58.1855%
Elko Land and Livestock CompanyNevada, USA100.0000%
ELLC Grazing Membership LLCNevada, USA100.0000%
Empresa Minera Maria SRLBolivia75.4286%
Fronteer Development (USA) LLCDelaware, USA100.0000%
Fronteer Development LLCDelaware, USA100.0000%
Fronteer Royalty LLCDelaware, USA100.0000%
Nevada Eagle Resources LLCNevada, USA100.0000%
Hospah Holdings CompanyDelaware, USA100.0000%
Idarado Mining CompanyDelaware, USA80.1674%
Minera BMGNevada, USA100.0000%
Minera Choluteca S.A. de C.V.Honduras48.0000%
Minera Newmont (Chile) LimitadaChile99.3827%
Nevada Gold Mines LLCDelaware, USA38.5000%
Newmont Bolivia LimitedNevada, USA100.0000%
Newmont de Mexico, S.A. de C.V.Mexico>99.9999%
Newmont Global Employment Limited PartnershipBermuda99.0000%
Newmont Gold CompanyDelaware, USA100.0000%
Newmont Indonesia Investment LimitedDelaware, USA100.0000%
Newmont International Services LimitedDelaware, USA100.0000%
Newmont Global Employment Limited PartnershipBermuda1.0000%
PT Newmont Pacific NusantaraIndonesia1.0000%
Newmont Latin America LimitedDelaware, USA100.0000%
Minera Los Tapados S.A.Peru0.0134%
Minera Newmont (Chile) LimitadaChile0.6173%
Newmont de Mexico S.A. de C.V.Mexico<0.0001%
Newmont McCoy Cove LimitedNevada, USA100.0000%
Newmont North America Exploration LimitedDelaware, USA100.0000%
Newmont Overseas Exploration LimitedDelaware, USA100.0000%
Newmont Exploration Limited Cote D'IvoreCote D'Ivore100.0000%
PT Newmont Pacific NusantaraIndonesia99.0000%
Yamagano JV GKJapan60.0000%
Newmont Peru LimitedDelaware, USA100.0000%
Minera Los Tapados S.A.Peru99.9866%
Newmont Investment Holdings LLCDelaware, USA100.0000%
Newmont Peru S.R.L.Peru<.0001%
Newmont Peru S.R.L.Peru>99.9999%
Minera Yanacocha S.R.L.Peru<.0001%
Newmont Peru Royalty S.R.L.Peru99.9999%
Newmont Realty CompanyDelaware, USA100.0000%
Newmont Second Capital CorporationDelaware, USA100.0000%
Minera Yanacocha S.R.L.Peru>99.9999%
Newmont Mines LimitedDelaware, USA100.0000%
Newmont Technologies LimitedNevada, USA100.0000%
New Verde Mines LLCDelaware, USA100.0000%
Resurrection Mining CompanyDelaware, USA100.0000%
San Juan Basin Holdings CompanyDelaware, USA100.0000%
Santa Fe Pacific Gold CorporationDelaware, USA100.0000%
Newmont Ventures LimitedDelaware, USA100.0000%
Newmont (Guyana) IncorporatedGuyana100.0000%
NVL Argentina S.R.L.Argentina90.0344%
NVL PNG LimitedPapua New Guinea100.0000%
NVL Solomon Islands LimitedSolomon Islands100.0000%
Saddleback Investments Pty LtdWestern Australia100.0000%
Normandy Overseas Holding Company Sdn BhdMalaysia100.0000%
Normandy Company (Malaysia) Sdn BhdMalaysia100.0000%


NVL Argentina S.R.L.Argentina9.9656%
Pittston Nevada Gold Company, Ltd.Nevada, USA100.0000%
West Pequop Project LLCNevada, USA100.0000%
Prestadora de Servicios Generales, S.A. de C.V. Honduras0.4000%

* Ownership percentages relate to that of the entity directly above, with indentation used to reflect intermediary levels of ownership.


Exhibit 22
Subsidiary Co-Issuer and Subsidiary Guarantor

The following subsidiary of Newmont Corporation (the "Company") was, as of December 31, 2025, guarantor of the Company's (i) 2.800% Senior Notes due 2029, (ii) 2.250% Senior Notes due 2030, (iii) 2.6% Sustainability-Linked Senior Notes due 2032, (iv) 5.875% Senior Notes due 2035, (v) 6.250% Senior Notes due 2039, (vi) 4.875% Senior Notes due 2042, (vii) 5.450% Senior Notes due 2044, (viii) 3.25% Senior Notes due 2030, (ix) 5.75% Senior Notes due 2041, (x) 4.20% Senior Notes due 2050, and (xi) 5.35% Senior Notes due 2034:

Name Incorporation
Newmont USA Limited Delaware

The following subsidiary of Newmont Corporation (the "Company") was, as of December 31, 2025, co-issuer of the Company's (i) 3.25% Senior Notes due 2030, (ii) 5.75% Senior Notes due 2041, (iii) 4.20% Senior Notes due 2050, and (iv) 5.35% Senior Notes due 2034:
Name Incorporation
Newcrest Finance Pty Limited Australia
1

Exhibit 23.1
Consent of Independent Registered Public Accounting Firm

We consent to the incorporation by reference in the following Registration Statements:   

1)Registration Statements (Form S-8 Nos. 333-124653 and 333-171298), pertaining to the Newmont Mining Corporation 2005 Stock Incentive Plan;
2)Registration Statements (Form S-8 Nos. 333-188128 and 333-214662), pertaining to the Newmont Mining Corporation 2013 Stock Incentive Plan;
3)Registration Statement (Form S-8 No. 333-238048), pertaining to the Newmont Corporation 2020 Stock Incentive Compensation Plan;
4)Registration Statement (Form S-3 No. 333-281026), pertaining to the Newmont Corporation 2024 Automatic Shelf Registration Statement; and
5)Registration Statement (Form S-4 No. 333-281025), of Newmont Corporation;

of our reports dated February 19, 2026, with respect to the consolidated financial statements and schedule of Newmont Corporation and the effectiveness of internal control over financial reporting of Newmont Corporation included in this Annual Report (Form 10-K) of Newmont Corporation for the year ended December 31, 2025.

/s/ Ernst & Young LLP

Denver, Colorado
February 19, 2026


Exhibit 23.2
Consent of independent registered public accounting firm
We hereby consent to the incorporation by reference in the Registration Statements on Form S-8 (Nos. 333-238048, 333-124653, 333-171298, 333-188128, 333-214662) and Form S-3 (No. 333-281026) and Form S-4 (No. 333-281025) of Newmont Corporation of our report dated February 19, 2026 relating to the financial statements and the effectiveness of internal control over financial reporting of Nevada Gold Mines LLC , which appears in this Form 10-K.

/s/ PricewaterhouseCoopers LLP


Chartered Professional Accountants, Licensed Public Accountants
Toronto, Canada
February 19, 2026


Exhibit 23.3

CONSENT OF QUALIFIED PERSON

I, Mr. Shaun Chanter, in connection with the Annual Report on Form 10-K for the year ended December 31, 2025 and exhibits thereto (collectively, the Form 10-K), consent to:

•the filing and use of the Technical Report Summary for the Boddington, Cadia, Lihir, and Ahafo South and Ahafo North (together, the “Ahafo Complex”) operations with an effective date of December 31, 2025, as exhibits 96.1, 96.2, 96.3, and 96.4, respectively, (each a “Technical Report Summary” and collectively, the “Technical Report Summaries”) to and referenced in the Form 10-K;
•the use of and references to my name, including my status as an expert or “qualified person” (as defined in Subpart 1300 of Regulation S-K promulgated by the U.S. Securities and Exchange Commission), in connection with the Form 10-K and the Technical Report Summaries; and
•the use of information derived, summarized, quoted or referenced from the Technical Report Summaries, or portions thereof, that was prepared by me, that I supervised the preparation of and/or that was reviewed and approved by me, that is included or incorporated by reference in the Form 10-K.

I am the qualified person responsible for authoring for the Technical Report Summaries.

I also consent to the incorporation by reference in Registration Statements on Form S-8 (Nos. 333-238048, 333-124653, 333-171298, 333-188128, 333-214662), Form S-3 (No.333-281026), and Form S-4 (No.333-281025) of Newmont Corporation of the above items as included in the Form 10-K.

Dated February 19, 2026

/s/ Shaun Chanter
Name:
Shaun Chanter, RM SME
Title:
Head, Reserves
Newmont Corporation


Exhibit 23.4

CONSENT OF QUALIFIED PERSON

I, Mr. Donald Doe, in connection with the Annual Report on Form 10-K for the year ended December 31, 2025 and exhibits thereto (collectively, the Form 10-K), consent to:

•the incorporation by reference and use of the Technical Report Summary for the Nevada Gold Mines operation (the “Incorporated by Reference Technical Report Summary” );
•the use of and references to my name, including my status as an expert or “qualified person” (as defined in Subpart 1300 of Regulation S-K promulgated by the U.S. Securities and Exchange Commission), in connection with the Form 10-K and the Technical Report Summary; and
•the use of information derived, summarized, quoted or referenced from the Technical Report Summary, or portions thereof, that was prepared by me, that I supervised the preparation of and/or that was reviewed and approved by me, that is included or incorporated by reference in the Form 10-K.

I am the qualified person responsible for authoring for the Incorporated by Reference Technical Report Summary.

I also consent to the incorporation by reference in Registration Statements on Form S-8 (Nos. 333-238048, 333-124653, 333-171298, 333-188128, 333-214662), Form S-3 (No.333-281026), and Form S-4 (No.333-281025) of Newmont Corporation of the above items as included in the Form 10-K.

Dated February 19, 2026

/s/ Donald Doe
Name:
Donald Doe, RM SME
Title:
Reserves Contractor
Newmont Corporation


Exhibit 24

POWER OF ATTORNEY

KNOW ALL PERSONS BY THESE PRESENT, that each person whose signature appears below hereby constitutes and appoints Peter I. Wexler and Logan H. Hennessey, each of them acting individually, his or her true and lawful attorney-in-fact and agent, with full power of substitution and revocation, in his or her name and on his or her behalf, to do any and all acts and things and to execute any and all instruments which said attorney-in-fact and agent may deem necessary or advisable to enable Newmont Corporation to comply with the Securities Exchange Act of 1934, as amended (the “Act”), and any rules, regulations or requirements of the Securities and Exchange Commission in respect thereof, including, without limitation, the power and authority to sign his or her name in any and all capacities (including his or her capacity as an Officer of Newmont Corporation) to the Annual Report on Form 10-K of Newmont Corporation for the fiscal year ended December 31, 2025 and any amendments thereto and the undersigned hereby ratifies and confirms all that said attorney-in-fact and agent shall lawfully do or cause to be done by virtue hereof.

IN WITNESS WHEREOF, the undersigned have subscribed these presents as of the 19th day of February 2026.

Signature    Title
/s/ Natascha Viljoen
Director and Chief Executive Officer
Natascha Viljoen(Principal Executive Officer)
/s/ Peter I. Wexler
Executive Vice President, Chief Legal Officer, and Interim Chief Financial Officer
Peter I. Wexler(Principal Financial Officer)
/s/ Brian C. Tabolt
Senior Vice President, Global Finance and Chief Accounting Officer
Brian C. Tabolt(Principal Accounting Officer)
/s/ Gregory H. BoyceNon-Executive Chair
Gregory H. Boyce
/s/ Bruce R. BrookDirector
Bruce R. Brook
/s/ Maura J. ClarkDirector
Maura J. Clark
/s/ Harry M. Conger, IVDirector
Harry M. Conger, IV
/s/ Emma FitzGeraldDirector
Emma FitzGerald
/s/ Sally-Anne LaymanDirector
Sally-Anne Layman
/s/ José Manuel MaderoDirector
José Manuel Madero
/s/ René MédoriDirector
René Médori
/s/ Jane NelsonDirector
Jane Nelson
/s/ Julio M. QuintanaDirector
Julio M. Quintana
/s/ David T. SeatonDirector
David T. Seaton


Exhibit 31.1
CERTIFICATION OF PRINCIPAL EXECUTIVE OFFICER
(Pursuant to Section 302 of the Sarbanes-Oxley Act of 2002)
I, Natascha Viljoen, certify that:
1.I have reviewed this Annual Report on Form 10-K of Newmont Corporation;
2.Based on my knowledge, this report does not contain any untrue statement of a material fact or omit to state a material fact necessary to make the statements made, in light of the circumstances under which such statements were made, not misleading with respect to the period covered by this report;
3.Based on my knowledge, the financial statements, and other financial information included in this report, fairly present in all material respects the financial condition, results of operations and cash flows of the registrant as of, and for, the periods presented in this report;
4.The registrant’s other certifying officer(s) and I are responsible for establishing and maintaining disclosure controls and procedures (as defined in Exchange Act Rules 13a-15(e) and 15d-15(e)) and internal control over financial reporting (as defined in Exchange Act Rules 13a-15(f) and 15d-15(f)) for the registrant and have:
(a)Designed such disclosure controls and procedures, or caused such disclosure controls and procedures to be designed under our supervision, to ensure that material information relating to the registrant, including its consolidated subsidiaries, is made known to us by others within those entities, particularly during the period in which this report is being prepared;
(b)Designed such internal control over financial reporting, or caused such internal control over financial reporting to be designed under our supervision, to provide reasonable assurance regarding the reliability of financial reporting and the preparation of financial statements for external purposes in accordance with generally accepted accounting principles;
(c)Evaluated the effectiveness of the registrant’s disclosure controls and procedures and presented in this report our conclusions about the effectiveness of the disclosure controls and procedures, as of the end of the period covered by this report based on such evaluation; and
(d)Disclosed in this report any change in the registrant’s internal control over financial reporting that occurred during the registrant’s most recent fiscal quarter (the registrant’s fourth fiscal quarter in the case of an annual report) that has materially affected, or is reasonably likely to materially affect, the registrant’s internal control over financial reporting; and
5.The registrant’s other certifying officer(s) and I have disclosed, based on our most recent evaluation of internal control over financial reporting, to the registrant’s auditors and the audit committee of the registrant’s board of directors (or persons performing the equivalent functions):
(a)All significant deficiencies and material weaknesses in the design or operation of internal control over financial reporting which are reasonably likely to adversely affect the registrant’s ability to record, process, summarize and report financial information; and
(b)Any fraud, whether or not material, that involves management or other employees who have a significant role in the registrant’s internal control over financial reporting.
/s/ NATASCHA VILJOEN
Natascha Viljoen
Chief Executive Officer
(Principal Executive Officer)
February 19, 2026

Exhibit 31.2
CERTIFICATION OF PRINCIPAL FINANCIAL OFFICER
(Pursuant to Section 302 of the Sarbanes-Oxley Act of 2002)
I, Peter I. Wexler, certify that:
1.I have reviewed this Annual Report on Form 10-K of Newmont Corporation;
2.Based on my knowledge, this report does not contain any untrue statement of a material fact or omit to state a material fact necessary to make the statements made, in light of the circumstances under which such statements were made, not misleading with respect to the period covered by this report;
3.Based on my knowledge, the financial statements, and other financial information included in this report, fairly present in all material respects the financial condition, results of operations and cash flows of the registrant as of, and for, the periods presented in this report;
4.The registrant’s other certifying officer(s) and I are responsible for establishing and maintaining disclosure controls and procedures (as defined in Exchange Act Rules 13a-15(e) and 15d-15(e)) and internal control over financial reporting (as defined in Exchange Act Rules 13a-15(f) and 15d-15(f)) for the registrant and have:
(a)Designed such disclosure controls and procedures, or caused such disclosure controls and procedures to be designed under our supervision, to ensure that material information relating to the registrant, including its consolidated subsidiaries, is made known to us by others within those entities, particularly during the period in which this report is being prepared;
(b)Designed such internal control over financial reporting, or caused such internal control over financial reporting to be designed under our supervision, to provide reasonable assurance regarding the reliability of financial reporting and the preparation of financial statements for external purposes in accordance with generally accepted accounting principles;
(c)Evaluated the effectiveness of the registrant’s disclosure controls and procedures and presented in this report our conclusions about the effectiveness of the disclosure controls and procedures, as of the end of the period covered by this report based on such evaluation; and
(d)Disclosed in this report any change in the registrant’s internal control over financial reporting that occurred during the registrant’s most recent fiscal quarter (the registrant’s fourth fiscal quarter in the case of an annual report) that has materially affected, or is reasonably likely to materially affect, the registrant’s internal control over financial reporting; and
5.The registrant’s other certifying officer(s) and I have disclosed, based on our most recent evaluation of internal control over financial reporting, to the registrant’s auditors and the audit committee of the registrant’s board of directors (or persons performing the equivalent functions):
(a)All significant deficiencies and material weaknesses in the design or operation of internal control over financial reporting which are reasonably likely to adversely affect the registrant’s ability to record, process, summarize and report financial information; and
(b)Any fraud, whether or not material, that involves management or other employees who have a significant role in the registrant’s internal control over financial reporting.
/s/ PETER I. WEXLER
Peter I. Wexler
Executive Vice President, Chief Legal Officer, and Interim Chief Financial Officer
(Principal Financial Officer)
February 19, 2026

Exhibit 32.1
CERTIFICATION PURSUANT TO 18 U.S.C. SECTION 1350
(Pursuant to Section 906 of the Sarbanes-Oxley Act of 2002)
In connection with the Annual Report on Form 10-K for the year ended December 31, 2025 of Newmont Corporation (the “Company”) as filed with the Securities and Exchange Commission on the date hereof (the “Report”) and pursuant to 18. U.S.C. Section 1350, as adopted pursuant to Section 906 of the Sarbanes-Oxley Act of 2002, I, Natascha Viljoen, Chief Executive Officer of the Company, certify, that to my knowledge:
1.The Report fully complies with the requirements of Section 13(a) or 15(d) of the Securities Exchange Act of 1934, as amended; and
2.The information contained in the Report fairly presents, in all material respects, the financial condition and results of operations of the Company.
/s/ NATASCHA VILJOEN
Natascha Viljoen
Chief Executive Officer
(Principal Executive Officer)
February 19, 2026
Note: A signed original of this written statement required by Section 906 has been provided to the Company and will be retained by the Company and furnished to the Securities and Exchange Commission or its staff upon request.

Exhibit 32.2
CERTIFICATION PURSUANT TO 18 U.S.C. SECTION 1350
(Pursuant to Section 906 of the Sarbanes-Oxley Act of 2002)
In connection with the Annual Report on Form 10-K for the year ended December 31, 2025 of Newmont Corporation (the “Company”) as filed with the Securities and Exchange Commission on the date hereof (the “Report”) and pursuant to 18. U.S.C. Section 1350, as adopted pursuant to Section 906 of the Sarbanes-Oxley Act of 2002, I, Peter I. Wexler, Executive Vice President, Chief Legal Officer, and Interim Chief Financial Officer of the Company, certify, that to my knowledge:
1.The Report fully complies with the requirements of Section 13(a) or 15(d) of the Securities Exchange Act of 1934, as amended; and
2.The information contained in the Report fairly presents, in all material respects, the financial condition and results of operations of the Company.
/s/ PETER I. WEXLER
Peter I. Wexler
Executive Vice President, Chief Legal Officer, and Interim Chief Financial Officer
(Principal Financial Officer)
February 19, 2026
Note: A signed original of this written statement required by Section 906 has been provided to the Company and will be retained by the Company and furnished to the Securities and Exchange Commission or its staff upon request.

Boddington Operations Western Australia Technical Report Summary Report current as at: December 31, 2025 Qualified Person: Mr. Shaun Chanter, RM SME. Boddington Operations Western Australia Technical Report Summary Date: February 2026 a NOTE REGARDING FORWARD-LOOKING INFORMATION This Technical Report Summary contains forward-looking statements within the meaning of the U.S. Securities Act of 1933 and the U.S. Securities Exchange Act of 1934 (and the equivalent under Canadian securities laws), that are intended to be covered by the safe harbor created by such sections. Such forward-looking statements include, without limitation, statements regarding Newmont’s expectation for its mines and any related development or expansions, including estimated cash flows, production, revenue, EBITDA, costs, taxes, capital, rates of return, mine plans, material mined and processed, recoveries and grade, future mineralization, future adjustments and sensitivities and other statements that are not historical facts. Forward-looking statements address activities, events, or developments that Newmont expects or anticipates will or may occur in the future and are based on current expectations and assumptions. Although Newmont’s management believes that its expectations are based on reasonable assumptions, it can give no assurance that these expectations will prove correct. Such assumptions, include, but are not limited to: (i) there being no significant change to current geotechnical, metallurgical, hydrological and other physical conditions; (ii) permitting, development, operations and expansion of operations and projects being consistent with current expectations and mine plans, including, without limitation, receipt of export approvals; (iii) political developments in any jurisdiction in which Newmont operates being consistent with its current expectations; (iv) certain exchange rate assumptions being approximately consistent with current levels; (v) certain price assumptions for gold, copper, silver, zinc, lead and oil; (vi) prices for key supplies being approximately consistent with current levels; and (vii) other planning assumptions. Important factors that could cause actual results to differ materially from those in the forward- looking statements include, among others, risks that estimates of mineral reserves and mineral resources are uncertain and the volume and grade of ore actually recovered may vary from our estimates, risks relating to fluctuations in metal prices; risks due to the inherently hazardous nature of mining-related activities; risks related to the jurisdictions in which we operate, uncertainties due to health and safety considerations, uncertainties related to environmental considerations, including, without limitation, climate change, uncertainties relating to obtaining approvals and permits, including renewals, from governmental regulatory authorities; and uncertainties related to changes in law; as well as those factors discussed in Newmont’s filings with the U.S. Securities and Exchange Commission, including Newmont’s latest Annual Report on Form 10-K for the period ended December 31, 2025, which is available on newmont.com. Newmont does not undertake any obligation to release publicly revisions to any “forward-looking statement,” including, without limitation, outlook, to reflect events or circumstances after the date of this document, or to reflect the occurrence of unanticipated events, except as may be required under applicable securities laws. Investors should not assume that any lack of update to a previously issued “forward-looking statement” constitutes a reaffirmation of that statement. Continued reliance on “forward-looking statements” is at investors’ own risk. Boddington Operations Western Australia Technical Report Summary Date: February 2026 i CONTENTS 1.0 EXECUTIVE SUMMARY ........................................................................................................... 1-1 1.1 Introduction ................................................................................................................................. 1-1 1.2 Terms of Reference ................................................................................................................... 1-1 1.3 Property Setting.......................................................................................................................... 1-1 1.4 Ownership .................................................................................................................................. 1-2 1.5 Mineral Tenure, Surface Rights, Water Rights, Royalties and Agreements .............................. 1-2 1.6 Geology and Mineralization ........................................................................................................ 1-3 1.7 History and Exploration .............................................................................................................. 1-4 1.8 Drilling and Sampling ................................................................................................................. 1-4 1.8.1 Drilling .................................................................................................................................... 1-4 1.8.2 Hydrogeology ......................................................................................................................... 1-5 1.8.3 Geotechnical .......................................................................................................................... 1-5 1.8.4 Sampling and Assay .............................................................................................................. 1-5 1.8.5 Quality Assurance and Quality Control .................................................................................. 1-6 1.9 Data Verification ......................................................................................................................... 1-6 1.10 Metallurgical Testwork ............................................................................................................... 1-7 1.11 Mineral Resource Estimation ..................................................................................................... 1-8 1.11.1 Estimation Methodology ......................................................................................................... 1-8 1.11.2 Mineral Resource Statement .................................................................................................. 1-9 1.11.3 Factors That May Affect the Mineral Resource Estimate .................................................... 1-12 1.12 Mineral Reserve Estimation ..................................................................................................... 1-12 1.12.1 Estimation Methodology ....................................................................................................... 1-12 1.12.2 Mineral Reserve Statement .................................................................................................. 1-13 1.12.3 Factors That May Affect the Mineral Reserve Estimate ...................................................... 1-16 1.13 Mining Methods ........................................................................................................................ 1-16 1.14 Recovery Methods ................................................................................................................... 1-16 1.15 Infrastructure ............................................................................................................................ 1-17 1.16 Markets and Contracts ............................................................................................................. 1-17 1.17 Environmental, Permitting and Social Considerations ............................................................. 1-18 1.17.1 Environmental Studies and Monitoring ................................................................................ 1-18 1.17.2 Closure and Reclamation Considerations ............................................................................ 1-18 1.17.3 Permitting ............................................................................................................................. 1-19 1.17.4 Social Considerations, Plans, Negotiations and Agreements .............................................. 1-19 1.18 Capital Cost Estimates ............................................................................................................. 1-19 1.19 Operating Cost Estimates ........................................................................................................ 1-20 1.20 Economic Analysis ................................................................................................................... 1-21 1.20.1 Economic Analysis ............................................................................................................... 1-21 1.20.2 Sensitivity Analysis ............................................................................................................... 1-23 1.21 Risks and Opportunities ........................................................................................................... 1-24 1.21.1 Risks ..................................................................................................................................... 1-24 1.21.2 Opportunities ........................................................................................................................ 1-25 1.22 Conclusions .............................................................................................................................. 1-25 1.23 Recommendations ................................................................................................................... 1-25 2.0 INTRODUCTION ........................................................................................................................ 2-1 2.1 Registrant ................................................................................................................................... 2-1 2.2 Terms of Reference ................................................................................................................... 2-1 Boddington Operations Western Australia Technical Report Summary Date: February 2026 ii 2.2.1 Report Purpose ...................................................................................................................... 2-1 2.2.2 Terms of Reference ............................................................................................................... 2-1 2.3 Qualified Persons ....................................................................................................................... 2-4 2.4 Site Visits and Scope of Personal Inspection ............................................................................ 2-4 2.5 Report Date ................................................................................................................................ 2-4 2.6 Information Sources and References ........................................................................................ 2-4 2.7 Previous Technical Report Summaries ...................................................................................... 2-4 3.0 PROPERTY DESCRIPTION ...................................................................................................... 3-1 3.1 Introduction ................................................................................................................................. 3-1 3.2 Property and Title in Western Australia ..................................................................................... 3-1 3.2.1 Mineral Title ............................................................................................................................ 3-1 3.2.2 Surface Rights ........................................................................................................................ 3-2 3.2.3 Native Title and Heritage Protection ...................................................................................... 3-3 3.2.4 Government Mining Taxes, Levies or Royalties .................................................................... 3-3 3.3 Ownership .................................................................................................................................. 3-4 3.3.1 Ownership History .................................................................................................................. 3-4 3.3.2 Current Ownership ................................................................................................................. 3-5 3.4 Property Agreements ................................................................................................................. 3-5 3.4.1 Background ............................................................................................................................ 3-5 3.4.2 Cross-Operation Agreement .................................................................................................. 3-5 3.5 Mineral Title ................................................................................................................................ 3-6 3.6 Surface Rights ............................................................................................................................ 3-6 3.7 Native Title ................................................................................................................................. 3-3 3.8 Water Rights ............................................................................................................................... 3-3 3.9 Royalties ..................................................................................................................................... 3-3 3.10 Encumbrances ........................................................................................................................... 3-3 3.11 Permitting Requirements ............................................................................................................ 3-4 3.12 Significant Factors and Risks That May Affect Access, Title or Work Programs ...................... 3-4 4.0 ACCESSIBILITY, CLIMATE, LOCAL RESOURCES, INFRASTRUCTURE AND PHYSIOGRAPHY ...................................................................................................................................... 4-1 4.1 Physiography .............................................................................................................................. 4-1 4.2 Accessibility ................................................................................................................................ 4-1 4.3 Climate ....................................................................................................................................... 4-1 4.4 Infrastructure .............................................................................................................................. 4-1 5.0 HISTORY ................................................................................................................................... 5-1 6.0 GEOLOGICAL SETTING, MINERALIZATION, AND DEPOSIT ............................................... 6-1 6.1 Deposit Type .............................................................................................................................. 6-1 6.2 Regional Geology ....................................................................................................................... 6-1 6.3 Local Geology ............................................................................................................................ 6-4 6.4 Deposit Geology ......................................................................................................................... 6-6 6.4.1 Lithologies ............................................................................................................................ 6-10 6.4.2 Structure and Alteration ....................................................................................................... 6-11 6.4.3 Weathering ........................................................................................................................... 6-11 6.4.4 Mineralization ....................................................................................................................... 6-11 7.0 EXPLORATION ......................................................................................................................... 7-1 7.1 Exploration ................................................................................................................................. 7-1 7.1.1 Grids and Surveys .................................................................................................................. 7-1 7.1.2 Geological Mapping ............................................................................................................... 7-1 7.1.3 Geochemistry ......................................................................................................................... 7-2 7.1.4 Geophysics ............................................................................................................................. 7-2


Boddington Operations Western Australia Technical Report Summary Date: February 2026 iii 7.1.5 Petrology, Mineralogy, and Research Studies ....................................................................... 7-5 7.1.6 Qualified Person’s Interpretation of the Exploration Information ........................................... 7-6 7.1.7 Exploration Potential .............................................................................................................. 7-6 7.2 Drilling ........................................................................................................................................ 7-7 7.2.1 Overview ................................................................................................................................ 7-7 7.2.1.1 Drilling on Property ............................................................................................................. 7-7 7.2.1.2 Drilling Excluded For Estimation Purposes ...................................................................... 7-11 7.2.1.3 Drilling Since Database Close Out Date .......................................................................... 7-11 7.2.2 Drill Methods ........................................................................................................................ 7-13 7.2.3 Logging ................................................................................................................................. 7-13 7.2.4 Recovery .............................................................................................................................. 7-13 7.2.5 Collar Surveys ...................................................................................................................... 7-13 7.2.6 Down Hole Surveys .............................................................................................................. 7-14 7.2.7 Blast Hole Drilling ................................................................................................................. 7-14 7.2.8 Comment on Material Results and Interpretation ................................................................ 7-14 7.3 Hydrogeology ........................................................................................................................... 7-15 7.3.1 Sampling Methods and Laboratory Determinations ............................................................. 7-15 7.3.2 Comment on Results ............................................................................................................ 7-15 7.3.3 Groundwater Models ............................................................................................................ 7-15 7.3.4 Water Balance ...................................................................................................................... 7-16 7.4 Geotechnical ............................................................................................................................ 7-16 7.4.1 Sampling Methods and Laboratory Determinations ............................................................. 7-16 7.4.2 Monitoring ............................................................................................................................. 7-16 7.4.3 Comment on Results ............................................................................................................ 7-17 8.0 SAMPLE PREPARATION, ANALYSES, AND SECURITY ...................................................... 8-1 8.1 Sampling Methods ..................................................................................................................... 8-1 8.2 Sample Security Methods .......................................................................................................... 8-1 8.3 Density Determinations .............................................................................................................. 8-2 8.4 Analytical and Test Laboratories ................................................................................................ 8-2 8.5 Sample Preparation ................................................................................................................... 8-3 8.6 Analysis ...................................................................................................................................... 8-3 8.7 Quality Assurance and Quality Control ...................................................................................... 8-4 8.8 Database .................................................................................................................................... 8-5 8.9 Qualified Person’s Opinion on Sample Preparation, Security, and Analytical Procedures ....... 8-5 9.0 DATA VERIFICATION ............................................................................................................... 9-1 9.1 Internal Data Verification ............................................................................................................ 9-1 9.1.1 Data Validation ....................................................................................................................... 9-1 9.1.2 Reviews and Audits ................................................................................................................ 9-1 9.1.3 Mineral Resource and Mineral Reserve Estimates ................................................................ 9-2 9.1.4 Reconciliation ......................................................................................................................... 9-2 9.1.5 Subject Matter Expert Reviews .............................................................................................. 9-2 9.2 External Data Verification ........................................................................................................... 9-3 9.3 Data Verification by Qualified Person ........................................................................................ 9-4 9.4 Qualified Person’s Opinion on Data Adequacy .......................................................................... 9-4 10.0 MINERAL PROCESSING AND METALLURGICAL TESTING .............................................. 10-1 10.1 Introduction ............................................................................................................................... 10-1 10.2 Test Laboratories ..................................................................................................................... 10-1 10.3 Metallurgical Testwork ............................................................................................................. 10-1 10.4 Recovery Estimates ................................................................................................................. 10-2 10.5 Metallurgical Variability ............................................................................................................ 10-2 Boddington Operations Western Australia Technical Report Summary Date: February 2026 iv 10.6 Deleterious Elements ............................................................................................................... 10-3 10.7 Qualified Person’s Opinion on Data Adequacy ........................................................................ 10-3 11.0 MINERAL RESOURCE ESTIMATES ...................................................................................... 11-1 11.1 Introduction ............................................................................................................................... 11-1 11.2 Exploratory Data Analysis ........................................................................................................ 11-1 11.3 Geological Models .................................................................................................................... 11-1 11.4 Density Assignment ................................................................................................................. 11-2 11.5 Composites .............................................................................................................................. 11-2 11.6 Grade Capping/Outlier Restrictions ......................................................................................... 11-2 11.7 Variography .............................................................................................................................. 11-2 11.8 Estimation/interpolation Methods ............................................................................................. 11-2 11.9 Validation .................................................................................................................................. 11-3 11.10 Confidence Classification of Mineral Resource Estimate ........................................................ 11-4 11.10.1 Mineral Resource Confidence Classification ................................................................... 11-4 11.10.2 Uncertainties Considered During Confidence Classification ........................................... 11-4 11.11 Reasonable Prospects of Economic Extraction ....................................................................... 11-4 11.11.1 Input Assumptions ............................................................................................................ 11-4 11.11.2 Commodity Price .............................................................................................................. 11-5 11.11.3 Cut-off ............................................................................................................................... 11-6 11.11.4 QP Statement ................................................................................................................... 11-6 11.12 Mineral Resource Statement .................................................................................................... 11-6 11.13 Uncertainties (Factors) That May Affect the Mineral Resource Estimate ................................ 11-9 12.0 MINERAL RESERVE ESTIMATES ......................................................................................... 12-1 12.1 Introduction ............................................................................................................................... 12-1 12.2 Pit Optimization ........................................................................................................................ 12-1 12.3 Optimization Inputs and Assumptions ...................................................................................... 12-1 12.4 Ore Loss and Dilution ............................................................................................................... 12-3 12.5 Stockpiles ................................................................................................................................. 12-3 12.6 Commodity Prices .................................................................................................................... 12-3 12.7 Mineral Reserve Statement ...................................................................................................... 12-4 12.8 Uncertainties (Factors) That May Affect the Mineral Reserve Estimate .................................. 12-7 13.0 MINING METHODS ................................................................................................................. 13-1 13.1 Introduction ............................................................................................................................... 13-1 13.2 Geotechnical Considerations ................................................................................................... 13-1 13.3 Hydrogeological Considerations .............................................................................................. 13-4 13.4 Operations ................................................................................................................................ 13-4 13.5 Blasting and Explosives ........................................................................................................... 13-5 13.6 Grade Control ........................................................................................................................... 13-5 13.7 Production Schedule ................................................................................................................ 13-5 13.8 Equipment ................................................................................................................................ 13-7 13.9 Personnel ................................................................................................................................. 13-8 14.0 PROCESSING AND RECOVERY METHODS ........................................................................ 14-1 14.1 Process Method Selection ....................................................................................................... 14-1 14.2 Process Plant ........................................................................................................................... 14-1 14.2.1 Plant Design ......................................................................................................................... 14-2 14.2.2 Equipment Sizing ................................................................................................................. 14-2 14.3 Power and Consumables ......................................................................................................... 14-3 14.4 Personnel ................................................................................................................................. 14-3 15.0 INFRASTRUCTURE ................................................................................................................ 15-1 15.1 Introduction ............................................................................................................................... 15-1 Boddington Operations Western Australia Technical Report Summary Date: February 2026 v 15.2 Roads and Logistics ................................................................................................................. 15-3 15.3 Waste Rock Storage Facilities ................................................................................................. 15-3 15.4 Stockpiles ................................................................................................................................. 15-3 15.5 Tailings Storage Facilities ........................................................................................................ 15-4 15.6 Water Management Structures ................................................................................................ 15-4 15.7 Water Supply ............................................................................................................................ 15-5 15.8 Camps and Accommodation .................................................................................................... 15-5 15.9 Power and Electrical ................................................................................................................ 15-5 16.0 MARKET STUDIES AND CONTRACTS ................................................................................. 16-1 16.1 Markets ..................................................................................................................................... 16-1 16.2 Commodity Price Forecasts ..................................................................................................... 16-1 16.3 Contracts .................................................................................................................................. 16-2 17.0 ENVIRONMENTAL STUDIES, PERMITTING, AND PLANS, NEGOTIATIONS, OR AGREEMENTS WITH LOCAL INDIVIDUALS OR GROUPS ................................................................. 17-1 17.1 Introduction ............................................................................................................................... 17-1 17.2 Baseline and Supporting Studies ............................................................................................. 17-1 17.3 Environmental Considerations/Monitoring Programs ............................................................... 17-1 17.4 Closure and Reclamation Considerations ................................................................................ 17-2 17.4.1 Closure Plans ....................................................................................................................... 17-2 17.4.2 Closure Costs ....................................................................................................................... 17-2 17.5 Permitting ................................................................................................................................. 17-2 17.6 Social Considerations, Plans, Negotiations and Agreements .................................................. 17-2 17.7 Qualified Person’s Opinion on Adequacy of Current Plans to Address Issues........................ 17-4 18.0 CAPITAL AND OPERATING COSTS ..................................................................................... 18-1 18.1 Introduction ............................................................................................................................... 18-1 18.2 Capital Cost Estimates ............................................................................................................. 18-1 18.2.1 Basis of Estimate ................................................................................................................. 18-1 18.2.2 Capital Cost Estimate Summary .......................................................................................... 18-1 18.3 Operating Cost Estimates ........................................................................................................ 18-2 18.3.1 Basis of Estimate ................................................................................................................. 18-2 18.3.2 Operating Cost Estimate Summary...................................................................................... 18-3 19.0 ECONOMIC ANALYSIS .......................................................................................................... 19-1 19.1 Methodology Used ................................................................................................................... 19-1 19.2 Financial Model Parameters .................................................................................................... 19-1 19.3 Sensitivity Analysis ................................................................................................................... 19-5 20.0 ADJACENT PROPERTIES ..................................................................................................... 20-1 21.0 OTHER RELEVANT DATA AND INFORMATION .................................................................. 21-1 22.0 INTERPRETATION AND CONCLUSIONS ............................................................................. 22-1 22.1 Introduction ............................................................................................................................... 22-1 22.2 Property Setting........................................................................................................................ 22-1 22.3 Ownership ................................................................................................................................ 22-1 22.4 Mineral Tenure, Surface Rights, Water Rights, Royalties and Agreements ............................ 22-1 22.5 Geology and Mineralization ...................................................................................................... 22-2 22.6 History ...................................................................................................................................... 22-3 22.7 Exploration, Drilling, and Sampling .......................................................................................... 22-3 22.8 Data Verification ....................................................................................................................... 22-3 22.9 Metallurgical Testwork ............................................................................................................. 22-4 22.10 Mineral Resource Estimates .................................................................................................... 22-5 22.11 Mineral Reserve Estimates ...................................................................................................... 22-5 22.12 Mining Methods ........................................................................................................................ 22-6 Boddington Operations Western Australia Technical Report Summary Date: February 2026 vi 22.13 Recovery Methods ................................................................................................................... 22-6 22.14 Infrastructure ............................................................................................................................ 22-7 22.15 Market Studies ......................................................................................................................... 22-7 22.16 Environmental, Permitting and Social Considerations ............................................................. 22-8 22.17 Capital Cost Estimates ............................................................................................................. 22-9 22.18 Operating Cost Estimates ........................................................................................................ 22-9 22.19 Economic Analysis ................................................................................................................... 22-9 22.20 Risks and Opportunities ........................................................................................................... 22-9 22.20.1 Risks ............................................................................................................................... 22-10 22.20.2 Opportunities .................................................................................................................. 22-11 22.21 Conclusions ............................................................................................................................ 22-11 23.0 RECOMMENDATIONS .......................................................................................................... 23-11 24.0 REFERENCES ......................................................................................................................... 24-1 24.1 Bibliography .............................................................................................................................. 24-1 24.2 Abbreviations and Symbols ...................................................................................................... 24-4 24.3 Glossary of Terms .................................................................................................................... 24-7 25.0 RELIANCE ON INFORMATION PROVIDED BY THE REGISTRANT ................................... 25-1 25.1 Introduction ............................................................................................................................... 25-1 25.2 Macroeconomic Trends ............................................................................................................ 25-1 25.3 Markets ..................................................................................................................................... 25-1 25.4 Legal Matters ............................................................................................................................ 25-1 25.5 Environmental Matters ............................................................................................................. 25-2 25.6 Stakeholder Accommodations ................................................................................................. 25-2 25.7 Governmental Factors .............................................................................................................. 25-2 TABLES Table 1-1: Measured and Indicated Mineral Resource Statement (Gold) ......................................... 1-10 Table 1-2: Inferred Mineral Resource Statement (Gold) ................................................................... 1-10 Table 1-3: Measured and Indicated Mineral Resource Statement (Copper) .................................... 1-11 Table 1-4: Inferred Mineral Resource Statement (Copper) ............................................................... 1-11 Table 1-5: Proven and Probable Mineral Reserve Statement (Gold)................................................ 1-14 Table 1-6: Proven and Probable Mineral Reserve Statement (Copper) ........................................... 1-14 Table 1-7: Commodity Price and Exchange Rate Forecasts ............................................................ 1-18 Table 1-8: Capital Cost Estimate ....................................................................................................... 1-20 Table 1-9: Operating Cost Estimate .................................................................................................. 1-20 Table 1-10: Operating Unit Cost Estimate ........................................................................................... 1-20 Table 1-11: Cash Flow Summary Table .............................................................................................. 1-22 Table 3-1: Tenure Types in Western Australia .................................................................................... 3-2 Table 3-2: Transactions Through Which Newmont Acquired Its Interest in the BGMJV .................... 3-5 Table 3-3: Mineral Tenure Summary Table ......................................................................................... 3-1 Table 5-1: Exploration and Development History Summary Table ..................................................... 5-1 Table 7-1: Geophysical Surveys ......................................................................................................... 7-4 Table 7-2: Property Drill Summary Table ............................................................................................ 7-7 Table 7-3: Drill Summary Table Supporting Mineral Resource Estimates .......................................... 7-8 Table 7-4: Drill Summary of Drilling Completed Post Database Close-out Date .............................. 7-11 Table 8-1: Sample Preparation Methods ............................................................................................. 8-3 Table 8-2: Analytical Methods ............................................................................................................. 8-3 Table 8-3: QA/QC History .................................................................................................................... 8-4


Boddington Operations Western Australia Technical Report Summary Date: February 2026 vii Table 9-1: External Data Verification ................................................................................................... 9-3 Table 11-1: Kriging Estimate Parameters ........................................................................................... 11-3 Table 11-2: Mineral Resource Confidence Classifications .................................................................. 11-4 Table 11-3: Input Parameters (Resources), Open Pit ......................................................................... 11-5 Table 11-4: Measured and Indicated Mineral Resource Statement (Gold) ......................................... 11-7 Table 11-5: Inferred Mineral Resource Statement (Gold) ................................................................... 11-7 Table 11-6: Measured and Indicated Mineral Resource Statement (Copper) .................................... 11-8 Table 11-7: Inferred Mineral Resource Statement (Copper) ............................................................... 11-8 Table 12-1: Input Design Parameters ................................................................................................. 12-2 Table 12-2: Proven and Probable Mineral Reserve Statement (Gold)................................................ 12-5 Table 12-3: Proven and Probable Mineral Reserve Statement (Copper) ........................................... 12-5 Table 13-1: Geotechnical Domains ..................................................................................................... 13-2 Table 13-2: Geotechnical Domain Design Configurations .................................................................. 13-3 Table 13-3: Production Schedule (2026–2034)................................................................................... 13-6 Table 13-4: Production Schedule (2035–2040)................................................................................... 13-6 Table 13-5: Equipment Requirements ................................................................................................. 13-7 Table 16-1: Commodity Price and Exchange Rate Forecasts ............................................................ 16-1 Table 18-1: Capital Cost Estimate ....................................................................................................... 18-2 Table 18-2: Operating Cost Estimate .................................................................................................. 18-3 Table 18-3: Operating Unit Cost Estimate ........................................................................................... 18-3 Table 19-1: Cash Flow Summary Table .............................................................................................. 19-2 Table 19-2: Annualized Cash Flow (2026–2032) ................................................................................ 19-3 Table 19-3: Annualized Cash Flow (2033–2040) ................................................................................ 19-4 FIGURES Figure 1-1: NPV Sensitivity ................................................................................................................. 1-23 Figure 2-1: Project Location Plan ......................................................................................................... 2-2 Figure 2-2: Mining Operations Layout Plan .......................................................................................... 2-3 Figure 3-1: Mineral Tenure Location Plan ............................................................................................ 3-1 Figure 3-2: Surface Rights Plan ........................................................................................................... 3-2 Figure 6-1: Regional Geology Setting .................................................................................................. 6-2 Figure 6-2: Regional Geology Map ....................................................................................................... 6-3 Figure 6-3: Stratigraphic Column Schematic ........................................................................................ 6-5 Figure 6-4: Geology Map, South Pit ..................................................................................................... 6-6 Figure 6-5: Geology Map, North Pit ...................................................................................................... 6-7 Figure 6-6: Geological Cross-Section, South Pit .................................................................................. 6-8 Figure 6-7: Geological Cross-Section, North Pit ................................................................................... 6-9 Figure 6-8: North Pit (N05) Plan View ................................................................................................ 6-13 Figure 6-9: North Pit (N05) Section View ........................................................................................... 6-14 Figure 6-10: S05A/B Pit, Plan View ...................................................................................................... 6-15 Figure 6-11: S05A Pit, Section View .................................................................................................... 6-16 Figure 6-12: S09A Pit, Plan View ......................................................................................................... 6-17 Figure 6-13: S09A Pit, Section View .................................................................................................... 6-18 Figure 7-1: Gravity Image ..................................................................................................................... 7-3 Figure 7-2: Regional Drill Collar Location Plan ..................................................................................... 7-8 Figure 7-3: Regional Drill Collar Location Plan in Operations Vicinity ................................................. 7-9 Figure 7-4: Drill Collar Location Plan for Drilling Supporting Mineral Resource Estimates ................ 7-10 Figure 7-5: Drilling Since Database Close Out Date to December 31, 2025. .................................... 7-12 Boddington Operations Western Australia Technical Report Summary Date: February 2026 viii Figure 14-1: Process Flowsheet ........................................................................................................... 14-1 Figure 15-1: Infrastructure Layout Plan ................................................................................................ 15-2 Figure 19-1: NPV Sensitivity ................................................................................................................. 19-5 Boddington Operations Western Australia Technical Report Summary Date: February 2026 Page 1-1 1.0 EXECUTIVE SUMMARY 1.1 Introduction This technical report summary (the Report) was prepared for Newmont Corporation (Newmont) on the Boddington Operations (Boddington Operations or the Project) located in southern West Australia. 1.2 Terms of Reference The Report was prepared to be attached as an exhibit to support mineral property disclosure, including mineral resource and mineral reserve estimates (MRMR), for the Boddington Operations in Newmont’s Form 10-K for the year ending December 31, 2025. Mineral resources and mineral reserves are reported for the North and South pits (also referred to as Wandoo North and Wandoo South). Mineral reserves are also estimated for material in stockpiles. Gold operations were conducted in two phases. The initial oxide operations, a combination of open pit and underground mining, ran from 1987–2001. The current operations commenced in 2009 from open pit sources. Unless otherwise indicated, all financial values are reported in United States dollars (US$). Unless otherwise indicated, the metric system is used in this Report. For financial values in Australian dollars (AU$), the assumed US$:AU$ exchange rate was 0.70:1. Mineral resources and mineral reserves are reported using the definitions in Regulation S–K 1300 (SK1300), under Item 1300. The Report uses US English. The Report contains forward-looking information; refer to the note regarding forward-looking information at the front of the Report. 1.3 Property Setting The Boddington Operations are located about 130 km southeast of the city of Perth and 17 km northwest of the township of Boddington, and are accessed via a sealed road from the township. Perth is the main source of supplies, and has a large, specialized infrastructure for mining support. Workers commute from Boddington and surrounding settlements to the mine site. The climate is Mediterranean, with hot, dry summers and cool, wet winters. Mining operations are conducted year-round. The mine is located on the Darling Plateau in an area of deeply weathered, undulating landscape that ranges from 200–500 meters Relative Level (mRL). Local relief varies by about 100 m, with shallow valley floors adjacent to broadly convex hills. The mining leases are located largely on private forested land typical of the eastern Jarrah (a type of eucalyptus) forest. Boddington Operations Western Australia Technical Report Summary Date: February 2026 Page 1-2 1.4 Ownership The majority of the Boddington Operations area is located within the original boundaries of a single large tenement (M258SA) granted under a State Agreement known as the Worsley State Agreement. M258SA is held by the Worsley Joint Venture (Worsley JV) and permits the mining of bauxite only. In the early 1980s, the Worsley JV discovered gold mineralization at Boddington. The Worsley State Agreement was amended to enable the granting of all mineral leases under the Mining Act of Western Australia 1978 within the boundaries of M258SA. The Worsley JV established a new joint venture to exploit the gold mineralization, the Boddington Gold Mine Joint Venture (BGMJV). The relationship between the bauxite/alumina operations and the gold operations was regulated under a cross-operation agreement which, in a restated form, continues as at the Report date. The paramount principle regulating the relationship between the Worsley JV and the BGMJV was that bauxite and bauxite operations were to have priority over all other minerals within an area (the Common Area) that was defined within the boundaries of M258SA. Consequently, unless an alternative arrangement is reached, where bauxite is found in an area of the mining leases where Newmont is active, Newmont is required to mine and stockpile bauxite on behalf of the Worsley JV. Ownership of the BGMJV changed over time so that the participants in the Worsley JV were no longer the same as the BGMJV participants. In order to accommodate the transfer of ownership to incoming BGMJV participants whilst maintaining bauxite rights, a series of transactions were entered into that resulted in the present structure whereby the BGMJV participants sublease the mining leases on which the gold mineralization is located. Since 2009, Newmont has had 100% ownership of the BGMJV. The current parties to the BGMJV are Newmont Boddington Pty Ltd (66⅔%) and Saddleback Investments Pty Ltd (Saddleback; (33⅓%). Both companies are indirectly-wholly owned Newmont subsidiaries. 1.5 Mineral Tenure, Surface Rights, Water Rights, Royalties and Agreements Newmont has an interest in a total of 95 tenements in the Boddington area. The total granted area is approximately 21,249 ha and the under-application area is approximately 60,767 ha. The mining area for the Boddington Operations is covered by 13 West Australia Mining Act leases: M70/21–26, M70/564, M70/799, M70/1031, G70/215, G70/218–219 and G70/272, and M264SA. Mining leases M70/21–26 and M70/799 are the key tenements under which gold mining activity is concentrated. Through direct lease holding and sub-lease arrangements with the Worsley JV, Newmont holds the rights to minerals other than bauxite in proportion to the Newmont ownership percentages. A total of 26 of the mining tenements are at an application stage. Under the Mining Act, Mining Leases are granted for 21 years and are renewable. Five mining leases (M70/21–25) were renewed in March 2007 for a 21-year term.


Boddington Operations Western Australia Technical Report Summary Date: February 2026 Page 1-3 Newmont has an automatic right to be granted new subleases upon the Worsley JV renewing the mining leases. The Boddington Operations have freehold ownership of all the eastern and central areas of operations. Within this freehold land are all the existing tailings storage facility (TSF) areas, the plant site, almost all of the area of the main open pit from the former oxide operation, and all but one of the smaller satellite open pits from the 1987–2001 operation. The western portion of the operational area is outside the freehold land is Crown land covered by native forest. Mining operations can be conducted in this area but with certain restrictions imposed by the State Government through the 1978 Mining Act that are applicable to forested Crown lands. The area underlying the Boddington Operations was previously subject to a land claim registered under the Native Title Act and referred to as the Gnaala Karla Booja Claim. This claim was settled as a result of the South West Native Title Settlement between the Western Australian government and the claimant group in 2021. As part of this settlement, the Western Australian government provided the Gnaala Karla Booja with an extensive and ongoing benefits package in return for the extinguishment of all native title claims over lands in the southwest of Western Australia. Newmont’s obligation to comply with the terms of Federal and State cultural heritage legislation, as well as the terms of its Aboriginal cultural heritage agreement continue to apply despite the extinguishment of native title over the Boddington Operations area. Production royalties on copper, gold, and silver are payable to the WA government and are included in the net smelter return (NSR) cut-off determination. 1.6 Geology and Mineralization The deposit style is still somewhat controversial. Features consistent with porphyry-style mineralization, classic orogenic shear zones, and intrusion-related gold–copper–bismuth mineralization, are all recognized, giving rise to a variety of genetic interpretations. The Boddington deposit is hosted within the Wells Formation in the Saddleback Greenstone Belt, which lies in the southeastern corner of the Archaean Yilgarn Craton. The deposit lies within a 6 km strike length of the Wells Formation. For descriptive purposes the deposit is subdivided at approximately 12200 N into two main centers of bedrock mineralization, referred to as Wandoo North (North Pit) and Wandoo South (South Pit). Most of the primary mineralization is hosted within intermediate to felsic intrusive, volcanic, and volcano–sedimentary rocks. The deepest mineralization intercept is at approximately 1,219 m. The laterite zone consists of 1–10 m of topsoil and loose gravel, underlain by 1–2 m of ferruginous duricrust, and a basal zone of 1–10 m of gibbsitic bauxite with goethite, hematite, and minor kaolinite. The saprolite zone, 25–80 m thick, typically consists of mottled and ferruginous kaolinitic clays, with preserved rock textures. Two mineralization stages were recognized. The earliest phase consists of widespread silica– biotite alteration and complex quartz + albite + molybdenite ± muscovite ± clinozoisite ± chalcopyrite veins, all of which are variably deformed by ductile shear zones. Gold in the laterite zones occurs in association with iron and aluminum hydroxides. Gold in the saprolite is hosted in primary quartz veins, in clays immediately adjacent to mineralized quartz veins, and in secondary, shallow dipping, goethitic horizons. Saprock mineralization reflects the mineralization distribution in the underlying bedrock. Bedrock gold mineralization is hosted in veins, lenses and Boddington Operations Western Australia Technical Report Summary Date: February 2026 Page 1-4 stockworks. Chalcopyrite and pyrrhotite are the dominant sulfides, with lesser pyrite, sphalerite, cubanite, cobaltite, arsenopyrite, pentlandite, covellite, bismuthinite, digenite, marcasite and galena. 1.7 History and Exploration Exploration from 1975–2002, prior to Newmont’s Project interest, was conducted by the Geological Survey of Western Australia, Reynolds Australia Mines, the BGMJV, and Alcoa of Australia Limited. Work conducted included geochemical prospecting and sampling, geological mapping, airborne and ground geophysical surveys, drill testing, mineral resource and ore (mineral) reserve estimates, mining studies, environmental studies, applications for environmental approvals, open pit, and underground mining. Newmont became a party to the BGMJV in 2002, and work conducted by Newmont and the BGMJV since that date included geological and structural mapping, a deep sensing geochemical program, airborne and ground geophysical surveys, drill testing, mineral resource and ore (mineral) reserve estimates, mining studies, environmental studies, permit applications, and open pit mining. Newmont is currently using district-scale datasets as exploration tools to identify additional mineralization within the Saddleback Greenstone Belt. The datasets are assisting with recognizing new belt-scale lineaments and felsic intrusions, similar to the monzogranite possibly associated with gold mineralization at Boddington, which could host additional Boddington-style mineralization. A number of possible cutbacks were identified adjacent to the current mine plan that may represent upside potential for the operations if these areas can be included in the life- of-mine (LOM) plan. 1.8 Drilling and Sampling 1.8.1 Drilling Approximately 164,827 drill holes were completed by December 31, 2025, for about 3,966 km of drilling. Drill methods included core, reverse circulation (RC), aircore (AC), rotary air blast (RAB) and vacuum. Drilling that supports the 2025 mineral resource and mineral reserve estimates consists of core and RC drill holes. Blast holes were drilled for drill-and-blast purposes on a 5.2 x 5.2 m pattern for ore and 5.7 x 5.7 m pattern for waste. Standardized logging procedures and software are used to record geological and geotechnical information. Core recoveries are typically 100%. Core and RC collars are recorded using differential global positioning system (DGPS) instruments. Downhole survey instruments used include single shot Eastman, single or multishot Reflex and north-seeking gyro tools. Downhole surveys were taken on spacings ranging from 30–50 m. Boddington Operations Western Australia Technical Report Summary Date: February 2026 Page 1-5 1.8.2 Hydrogeology Groundwater monitoring was completed via a network of monitoring bores and grouted multiple vibrating wire piezometer pore pressure monitoring bores, covering all areas of the active mine site (including waste rock storage facilities (WRSFs) and TSF areas) and the regional areas peripheral to the mine operations. Complementing the groundwater monitoring programs are extensive surface water sampling programs focused on regional, mining (WRSFs and drainage), TSFs, and processing areas. The surface water samples are sent to the same laboratory as the groundwater samples with monitoring of water quality variables specific to the risk associated with the sample location. As required, corporate subject matter experts and/or third-party consultants undertake specialized hydrological/geotechnical evaluations. To the Report date, the hydrogeological data collection programs have provided data suitable for use in the mining operations, and have supported the assumptions used in the active pits. 1.8.3 Geotechnical Geotechnical systems are implemented and maintained to monitor slope and pit wall deformation. Geotechnical data are collected where considered necessary to provide additional information and to verify ground conditions in the vicinity of the open pits and WRSFs. Core drilling methods are used to collect soil and rock samples. Materials encountered are logged and sampled are selected and recovered for laboratory testing where required. In addition to information gathered during core drilling, geological structures are mapped and documented continuously as mining progresses in the open pits. This is aided through use of geo-referenced photogrammetry and high-definition point cloud scanning that is used to create digital references of structures modelled. The geological hard rock setting at the Boddington Operations is well understood and displays consistency in the various open pits located on site. Additional testing continues to confirm the consistency of material strengths and parameters. 1.8.4 Sampling and Assay RC and core samples were typically collected on 1–2 m intervals. A single sample is taken from blastholes. Bulk density values were collected primarily using the water immersion method. Approximately 10% of the samples were sent to an independent offsite laboratory for check measurements. Independent laboratories used for sample preparation and analysis included Classic Comlabs; Genalysis, now part of the Intertek Group (Intertek Genalysis); Amdel, Kalassay, Analabs, UltraTrace Geoanalytical Laboratories (Ultratrace) (all now part of the Bureau Veritas Group), and Australian Assay Laboratories (AAL) in Perth, AAL in Boddington. Since 2006, the primary and check laboratories, Intertek Genalysis and Bureau Veritas, have held ISO/IEC 17025 Boddington Operations Western Australia Technical Report Summary Date: February 2026 Page 1-6 accreditations for selected analytical techniques. The Boddington mine laboratory, operated by AAL and Amdel, was used from 1985–2001. Various sample preparation crushing and pulverizing protocols were used since the 1980s, depending on the laboratory. Recent protocols saw Intertek Genalysis crushing to a nominal P90 passing 3 mm and pulverizing to a nominal 95% minus 100 µm; Ultratrace crushing to 2.8 mm and pulverizing to a nominal 95% passing 90 µm; and Bureau Veritas Kalassay crushing to a nominal 95% passing 3 mm and pulverizing to a nominal 95% passing 90 µm. Analytical methods depended on the sample type and laboratory. For RC and core samples prior to 2006, analysis of gold was by fire assay with either AAS or inductively-coupled plasma atomic emission spectroscopy (ICP-AES). Copper analysis was by either single acid digestion or three- acid digestion followed by AAS. Post 2006, gold was assayed using fire assay with an AAS finish, and a multi-element suite was determined using four-acid digest with either an ICP optical emission spectroscopy (OES) or ICP mass spectrometry (MS) finish. Multi-element determination was not routinely performed prior to 2006, but rather performed on selected drill holes as part of detailed geological investigations. 1.8.5 Quality Assurance and Quality Control A quality assurance and quality control (QA/QC) program was in place from 1989 onward. The type and nature of samples used in the program varied over time. Since 2006, standards and blanks were submitted randomly in the sample stream prior to submission to the assay laboratory. Standards were both commercially-prepared and sourced from Boddington mineralization. The grade control QA/QC process has been in place since 2008. Results are regularly monitored. The QA/QC programs adequately address issues of precision, accuracy, and contamination. 1.9 Data Verification Newmont personnel regularly visit the laboratories that process Newmont samples to inspect sample preparation and analytical procedures. The database that supports mineral resource and mineral reserve estimates is checked using electronic data scripts and triggers. Newmont also conducted a number of internal data verification programs since obtaining its Project interest. Newmont conducts internal audits, termed Reserve and Resource Review (3R) audits, of all its operations. The most recent Boddington Operations 3R audits were conducted in 2012, 2014, 2019 and 2022. The 2022 3R audit found that the Boddington Operations were generally adhering to Newmont’s internal standards and guidelines with respect to the estimation of mineral resources and mineral reserves. Data verification was performed by external consultants or BGMJV partners in support of mine development and operations. Many of the audits were conducted prior to the commencement of the current mining operation in 2009 to ensure that the best possible database, geological


Boddington Operations Western Australia Technical Report Summary Date: February 2026 Page 1-7 interpretations, block models, and resource estimates were available to support investment decisions. The QP receives and reviews monthly reconciliation reports from the mine site. These reports include the industry standard reconciliation factors for tonnage, grade, and metal. Through the review of these reconciliation factors the QP is able to ascertain the quality and accuracy of the data and its suitability for use in the assumptions underlying the mineral resource and mineral reserve estimates. 1.10 Metallurgical Testwork During feasibility-stage studies from 1997–2003, several programs of metallurgical testwork were completed on the Boddington deposit. These supported the initial mining phase. A second phase of testwork was conducted in 2008, and a third phase in 2017. The post-feasibility testwork was primarily conducted at AMMTEC in Perth, now ALS Metallurgy. Samples selected for metallurgical testing during feasibility and development studies were representative of the various styles of mineralization within the different deposits. Samples were selected from a range of locations within the deposit zones. Sufficient samples were taken and tests were performed using sufficient sample mass for the respective tests undertaken. Work completed included mineralogy; comminution and high-pressure grind–roll (HPGR) testwork; Bond ball mill, Bond rod mill work index, and abrasion index tests; flotation and leach testwork; locked cycle flotation tests; scavenger tail leach, cleaner scavenger tail leach tests; flotation tailings cyanidation testwork; determination of thickening and slurry pumping characteristics; rheology; tailings characterization; and oxygen addition. Recovery models were developed using known ore parameters to predict plant recovery. In these models, the throughput rate is fixed and the grind size is allowed to vary with ore hardness, resulting in recovery differences in each of the eight geometallurgical domains. The gold and copper recovery models for the mill are based on head grade. The average LOM gold recovery forecast is 85% and the forecast average LOM copper recovery is 81%. These forecasts do not include the application of recovery degradation to long-term stockpiles of medium-grade ore. Gold recovery is discounted by 3% and copper recovery is discounted by 9% to account for recovery degradation in the business plan. These degradation assumptions were verified by an ongoing stockpile oxidation testwork program. The recovery models are updated periodically as new information becomes available, such as observed plant performance or additional testwork. The last recovery model update occurred in 2025. Since commissioning in 2009, the operation has actively managed the arsenic level in plant feed and, through concentrate blending techniques, controlled the level in copper concentrate shipments to below the penalty rate trigger, hence no penalties were incurred to the Report date. Bismuth is closely associated with gold in the Wandoo ores; however, so it has resulted in penalty levels being exceeded, particularly in the first two years of operation (2009–2011). Most of the high bismuth ores have been processed, resulting in very low to no penalty charges being incurred since 2012. Alumina remains the largest penalty element present in the copper concentrate, with shipments regularly exposed to a penalty adjustment. However, at 4–5% Al2O3 the levels are not far off the Boddington Operations Western Australia Technical Report Summary Date: February 2026 Page 1-8 trigger point of 3% in most contracts and a modification to the process was made during Q1 2019 with the introduction of the cleaner–scalper column which reduces the non-sulfide gangue (i.e., Al2O3) in the concentrate and improves the grade of the concentrate as a result. 1.11 Mineral Resource Estimation 1.11.1 Estimation Methodology The close-out date for the sample database used in Mineral Resource estimation was 5 June 2024. The resource model close-out date was 27 September, 2024. Exploratory data analysis included statistical reviews and contact analysis to determine estimation domain boundaries. Six models were constructed: geology, gold, copper, in-situ bulk density (density), deleterious/secondary elements (arsenic, bismuth, molybdenum, and sulfur), geotechnical, structural, and acid rock drainage. Density values were interpolated using ordinary kriging (OK) to provide block estimates when sufficient data were available. Where insufficient data were available, an assigned density was used. All assay data were composited to 12 m lengths downhole. High-grade and outlier grade cuts were applied to each of the gold, copper, arsenic, bismuth, molybdenum, and sulfur domains. Spatial variability of the grades for gold, copper, arsenic, bismuth, molybdenum, and sulfur was modeled through directional variography of capped 12 m composites. Ordinary kriged estimates for gold, copper, sulfur, arsenic, molybdenum and bismuth and density were conducted in a separate block model with a parent block size of 20 x 20 x 12 m. Domains for each element were coded into these models. The estimation results were subsequently combined into the final block model. The final block size used in the resource block model was a regularized size of 20 x 20 x 12 m to match the current selective mining unit. Estimation allowed for a minimum of eight samples, a maximum of eight, with a maximum of two samples used per drill hole, and a minimum of four and maximum of eight drill holes per block. Grade dilution was applied due to unavoidable mining of small dolerite bodies. Modifying factors were applied to sulfur and copper, based on historical plant reconciliation data. Validation used Newmont-standard methods, including a combination of visual checks, swath plots, global statistical bias checks against input data, alternate estimation methods, and reconciliation with historical mine/plant performance. The validation procedures indicated that the geology and resource models used are acceptable to support the mineral resource estimation. Mineral resource classification was undertaken based primarily on drill spacing and number of drill holes used in the estimate. Mineral resources were classified as measured, indicated, and inferred. A quantitative assessment of geological risk was undertaken using Newmont-standard methods and applied on a block by block basis. Primary risks to resource quality include quantity and spacings of drill data, geological knowledge, geological interpretation, and grade estimates. All identified risks are within acceptable tolerances with associated management plans. Boddington Operations Western Australia Technical Report Summary Date: February 2026 Page 1-9 Mineral resources considered amenable to open pit mining methods are reported within a mine design. Commodity prices used in resource estimation are based on long-term analyst and bank forecasts, supplemented with research by Newmont’s internal specialists. The estimated timeframe used for the price forecasts is the 15-year LOM that supports the mineral reserve estimates. The cut-off grade is defined by a revenue cut-off to account for both copper and gold revenue with two product streams, gold doré and copper concentrate. The block revenue is calculated on the net smelter return (NSR) basis which is the dollar return expected from the sale of the concentrate produced from a tonne of in situ material. The NSR calculation takes into account concentrate shipping and smelting and refining costs. The NSR cut-off for mineral resource reporting is US$18.38/t milled. The incremental (mill) cut-off is US$16.46/t milled. 1.11.2 Mineral Resource Statement Mineral resources are reported using the mineral resource definitions set out in SK1300 on a 100% basis. Newmont holds a 100% Project interest. Mineral resources are current as at December 31, 2025. The reference point for the estimate is in situ. Mineral resources are reported exclusive of those mineral resources converted to mineral reserves. Mineral resources that are not mineral reserves do not have demonstrated economic viability. The mineral resource estimates for the Boddington Operations are summarized in Table 1-1 (measured and indicated; gold), Table 1-2 (inferred; gold), Table 1-3 (measured and indicated; copper), and Table 1-4 (inferred; copper). The Qualified Person for the estimate is Mr. Shaun Chanter, RM SME, Head Reserve Governance – Global, a Newmont employee. Boddington Operations Western Australia Technical Report Summary Date: February 2026 Page 1-10 Table 1-1: Measured and Indicated Mineral Resource Statement (Gold) Area Measured Mineral Resources Indicated Mineral Resources Measured and Indicated Mineral Resources Tonnage (x 1,000 t) Grade (g/t Au) Cont. Gold (x 1,000 oz) Tonnage (x 1,000 t) Grade (g/t Au) Cont. Gold (x 1,000 oz) Tonnage (x 1,000 t) Grade (g/t Au) Cont. Gold (x 1,000 oz) North Pit 14,300 0.28 100 13,300 0.28 100 27,600 0.28 200 South Pit 83,000 0.56 1,500 149,700 0.51 2,500 232,800 0.53 4,000 Open Pit Sub-total 97,300 0.52 1,600 163,000 0.49 2,600 260,400 0.50 4,200 Stockpile — — — 5,200 0.31 100 5,200 0.31 100 Boddington Total 97,300 0.52 1,600 168,200 0.49 2,600 265,500 0.50 4,300 Table 1-2: Inferred Mineral Resource Statement (Gold) Area Inferred Mineral Resources Tonnage (x 1,000 t) Grade (g/t Au) Cont. Gold (x 1,000 oz) North Pit 600 0.5 0 South Pit 3,200 0.5 0 Open Pit Sub-total 3,800 0.5 100 Stockpile — — — Boddington Total 3,800 0.5 100


Boddington Operations Western Australia Technical Report Summary Date: February 2026 Page 1-11 Table 1-3: Measured and Indicated Mineral Resource Statement (Copper) Area Measured Mineral Resources Indicated Mineral Resources Measured and Indicated Mineral Resources Tonnage (x 1,000 t) Grade (Cu %) Cont. Copper (x 1,000 t) Tonnage (x 1,000 t) Grade (Cu %) Cont. Copper (x 1,000 t) Tonnage (x 1,000 t) Grade (Cu %) Cont. Copper (x 1,000 t) North Pit 14,300 0.06 0 13,300 0.06 0 27,600 0.06 0 South Pit 83,000 0.13 100 149,700 0.12 200 232,800 0.12 300 Open Pit Sub- Total 97,300 0.12 100 163,000 0.11 200 260,400 0.11 300 Stockpile — — — 5,200 0.05 0 5,200 0.05 0 Boddington Total 97,300 0.12 100 168,200 0.11 200 265,500 0.11 300 Table 1-4: Inferred Mineral Resource Statement (Copper) Area Inferred Mineral Resources Tonnage (x 1,000 t) Grade (Cu %) Cont. Copper (x 1,000 t) North Pit 600 0.00 0 South Pit 3,200 0.1 0 Open Pit Sub-Total 3,800 0.1 0 Stockpile — — — Boddington Total 3,800 0.1 0 Notes to accompany mineral resource tables: 1. Mineral resources are current as at December 31, 2025, and are reported using the definitions in SK1300 on a 100% basis. The Qualified Person responsible for the estimate is Mr. Shaun Chanter, RM SME, Head Reserve Governance - Global, a Newmont 2. The reference point for the mineral resources is in situ. 3. Mineral Resources are reported exclusive of mineral reserves. Mineral resources that are not mineral reserves do not have demonstrated economic viability. 4. Mineral resources that are potentially amenable to open pit mining methods are constrained within a designed pit . Parameters used are summarized in Table 11-3. 5. Tonnages are metric tonnes rounded to the nearest 100,000. Gold grade is rounded to the nearest 0.01 gold grams per tonne for measured and indicated and 0.1 gold grams per tonne for inferred. Copper grade is reported as a %. Gold ounces and copper tonnes are estimates of metal contained in tonnages and do not include allowances for processing losses. Contained (cont.) gold ounces are reported as troy ounces, rounded to the nearest 100,000. Copper is reported as tonnes rounded to the nearest 100,000. 6. Rounding of tonnes and contained metal content as required by reporting guidelines may result in apparent differences between tonnes, grade and contained metal content. In instances where tonnage and grade are presented but metal is shown as “0”, this is due to the metal contained falling below the metal rounding limit. 7. Totals may not sum due to rounding. Boddington Operations Western Australia Technical Report Summary Date: February 2026 Page 1-12 1.11.3 Factors That May Affect the Mineral Resource Estimate Factors which may affect the mineral resource estimates include: metal price assumptions; changes to the assumptions used to generate the NSR cut-off; changes to design parameter assumptions that pertain to the conceptual pit design that constrain the mineral resources, including changes to geotechnical, mining and metallurgical recovery assumptions, and changes to royalties levied and any other relevant parameters that are included in and impact the NSR cut- off determination; changes in interpretations of mineralization geometry and continuity of mineralization zones; changes to the dilution skin percentages used for large dolerite dykes; and assumptions as to the continued ability to access the site, retain mineral and surface rights titles, maintain the operation within environmental and other regulatory permits, and retain the social license to operate. 1.12 Mineral Reserve Estimation 1.12.1 Estimation Methodology Measured and indicated mineral resources were converted to mineral reserves. Mineral reserves were estimated assuming open pit mining, and the use of conventional Owner-operated equipment. All Inferred blocks are classified as waste in the cash flow analysis that supports mineral reserve estimation. For mineral reserves, Newmont applies a time discount factor to the dollar value block model that is generated in the pit-limit analysis, to account for the fact that a pit will be mined over a period of years, and that the cost of waste stripping in the early years must bear the cost of the time value of money. Optimization work involved floating pit shells at a series of gold and copper prices. The pit shells with the highest NPV were selected for detailed engineering design work. A realistic schedule was developed in order to determine the optimal pit shell; schedule inputs include the minimum mining width, and vertical rate of advance, mining rate, and mining sequence. The mine plan is based on a 41 Mt/a mill throughput. The schedule was developed at an NSR cut-off of US$18.24/t (AU$26.06/t), incorporating the processing cost, metallurgical recovery, incremental ore mining costs, process sustaining capital and tailings dam related rehabilitation costs. The net revenue calculation assumes a gold price of US$2,000/oz or AU$2,857/oz, and a copper price of US$3.75/lb or AU$5.36/lb. The assumed US$:AU$ exchange rate for mineral reserve estimation was 0.70:1. Mineral reserves are reported above an NSR cut-off of US$18.24/t. Pit designs are full crest and toe detailed designs with final ramps based on the selected optimum Whittle cones. Pit designs honor geotechnical guidelines with 15.2 m catch berms. Most of the ore will be directly fed to the process plant; however, some re-handle is required. Direct feeding to the crusher is constrained by where the ore is located in the open pit and the crusher availability. Some higher-grade ore is stockpiled and fed back to the crusher when required. Approximately 50% of feed is re-handle material from the stockpiles. Boddington Operations Western Australia Technical Report Summary Date: February 2026 Page 1-13 Block ore volumes are adjusted for waste proportions. Small dolerite volumes are added to the grade variables as dilution as they are narrower than the selective mining unit (SMU). Larger dolerite volumes are applied to the block as a waste portion and increased by a set amount which represents ore loss against the dolerite contact. Blocks containing >50% oxide material are classified as waste and have the grade set to zero. Stockpile estimates were based on mine dispatch data; the grade comes from closely-spaced blasthole sampling and tonnage sourced from truck factors. The stockpile volumes were typically updated based on monthly surveys. The average grade of the stockpiles was adjusted based on the material balance to and from the stockpile. Commodity prices used in mineral reserve estimation are based on long-term analyst and bank forecasts, supplemented with research by Newmont’s internal specialists. The estimated timeframe used for the price forecasts is the 15-year LOM. 1.12.2 Mineral Reserve Statement Mineral reserves were classified using the definitions set out in SK1300, and are reported on a 100% basis. Newmont holds a 100% Project interest. Mineral reserves are current as at December 31, 2025. The proven and probable mineral reserve estimates for the Boddington Operations are summarized in Table 1-5 (gold) and Table 1-6 (copper). The Qualified Person for the estimate is Mr. Shaun Chanter, RM SME, Head Reserve Governance – Global, a Newmont employee. Boddington Operations Western Australia Technical Report Summary Date: February 2026 Page 1-14 Table 1-5: Proven and Probable Mineral Reserve Statement (Gold) Area Proven Mineral Reserves Probable Mineral Reserves Proven and Probable Mineral Reserves Tonnage (x 1,000 t) Grade (g/t Au) Cont. Gold (x 1,000 oz) Tonnage (x 1,000 t) Grade (g/t Au) Cont. Gold (x 1,000 oz) Tonnage (x 1,000 t) Grade (g/t Au) Cont. Gold (x 1,000 oz) North Pit 144,200 0.57 2,600 142,800 0.55 2,500 286,900 0.56 5,200 South Pit 121,200 0.67 2,600 73,600 0.65 1,500 194,700 0.66 4,200 Open Pit Sub- Total 265,300 0.62 5,300 216,300 0.58 4,100 481,700 0.60 9,300 Stockpile Sub- Total 5,600 0.56 100 57,800 0.43 800 63,400 0.44 900 Boddington Total 271,000 0.61 5,400 274,100 0.55 4,900 545,100 0.58 10,200 Table 1-6: Proven and Probable Mineral Reserve Statement (Copper) Area Proven Mineral Reserves Probable Mineral Reserves Proven and Probable Mineral Reserves Tonnage (x 1,000 t) Grade (Cu %) Cont. Copper (x 1,000 t) Tonnage (x 1,000 t) Grade (Cu %) Cont. Copper (x 1,000 t) Tonnage (x 1,000 t) Grade (Cu %) Cont. Copper (x 1,000 t) North Pit 144,200 0.09 100 142,800 0.10 100 286,900 0.10 300 South Pit 121,200 0.08 100 73,600 0.09 100 194,700 0.08 200 Open Pit Sub-Total 265,300 0.09 200 216,300 0.10 200 481,700 0.09 400 Stockpile Sub-Total 5,600 0.09 0 57,800 0.09 100 63,400 0.09 100 Boddington Total 271,000 0.09 200 274,100 0.10 300 545,100 0.09 500


Boddington Operations Western Australia Technical Report Summary Date: February 2026 Page 1-15 Notes to accompany mineral reserve tables: 1. Mineral reserves are current as at 31 December, 2025. Mineral reserves are reported using the definitions in SK1300 on a 100% basis. The Qualified Person responsible for the estimate is Mr. Shaun Chanter, RM SME, Head – Reserve Governance, a Newmont employee. 2. Mineral reserves are reported at the point of delivery to the process plant. 3. Mineral reserves that will be mined using open pit mining methods are constrained within a designed pit. Parameters used are included in Table 12-1. 4. Tonnages are metric tonnes rounded to the nearest 100,000. Gold grade is rounded to the nearest 0.01 gold grams per tonne. Copper grade is %. Gold ounces and copper tonnes are estimates of metal contained in tonnages and do not include allowances for processing losses. Contained (cont.) gold ounces are reported as troy ounces, rounded to the nearest 100,000. Contained (cont.) copper is reported as metric tonnes. Rounding of tonnes and contained metal content as required by reporting guidelines may result in apparent differences between tonnes, grade and contained metal content. In instances where tonnage and grade are presented but metal is shown as “0”, this is due to the metal contained falling below the metal rounding limit.. Boddington Operations Western Australia Technical Report Summary Date: February 2026 Page 1-16 1.12.3 Factors That May Affect the Mineral Reserve Estimate Areas of uncertainty that may materially impact the mineral reserve estimates include: changes to long-term metal price and exchange rate assumptions; changes to metallurgical recovery assumptions; changes to the input assumptions used to derive the pit designs applicable to the open pit mining methods used to constrain the estimates; changes to the forecast dilution and mining recovery assumptions; changes to the cut-off values applied to the estimates; variations in geotechnical (including seismicity), hydrogeological and mining method assumptions; and changes to environmental, permitting and social license assumptions. 1.13 Mining Methods The geotechnical model for the Boddington deposit was defined by geotechnical drilling and logging, laboratory test work, rock mass classification, structural analysis, and stability modeling. The hydrological model was based on a three-dimensional flow model, historic pumping rates, and drill data. Overall pit slope angles varied between approximately 37–52º according to geology and location of pit infrastructure such as ramps and haul roads. The pit dewatering system will continuously receive large volumes of groundwater and surface run-off over the LOM. The sum of active and passive dewatering has been relatively constant at approximately 140 L/sec; the long-term dewatering strategy assumes that this trend continues throughout the LOM. The water management strategy is to maximize the use of groundwater within the process plant and the loss of excess water by evaporation from the TSF. There is provision in place to capture excess surface water in water storage reservoirs. The LOM plan envisages mining at an average rate of approximately 56 Mt/a for 15 years, peaking at 88 Mt/a in 2026, with a maximum rate of advance by pit stage of six benches per annum and an average of five benches (60 m) per year. The mine life will extend to 2040 with both mine and mill cease in the same year. The mine plan assumes five pit phases remain. 1.14 Recovery Methods The process plant design was based on a combination of metallurgical testwork, previous study designs, and previous operating experience. The design is conventional to the gold industry and has no novel parameters. The process consists of: primary crushing, closed circuit secondary and high-pressure grind roll tertiary crushing, ball milling; flotation to produce a copper–gold concentrate; and conventional leach/adsorption of the cleaner–scavenger tailings stream to produce doré. Power supply to the operations is via the local grid system. Water supply is from a number of sources including local rivers, pit dewatering water, borefield water adjacent to the pits, rainfall run-off and recovered water from the process plant thickeners and TSF. Consumables used in the processing include grinding media, primary collector (thionocarbamate), secondary collector (xanthate), frother, lime, flocculant, cyanide, oxygen, caustic, sulfuric and hydrochloric acid, and peroxide. Boddington Operations Western Australia Technical Report Summary Date: February 2026 Page 1-17 1.15 Infrastructure The majority of the key infrastructure to support the Boddington Operations mining activities envisaged in the LOM is in place. A second TSF (RDA2) will be required for the LOM plan. Within Newmont’s ground holdings, there is sufficient area to allow construction of any additional infrastructure that may be required in the future. The existing infrastructure, staff availability, existing power, water, and communications facilities, and the methods whereby goods are transported to the mine are all in place and well-established, and can support the estimation of mineral resources and mineral reserves. Personnel commute from surrounding settlements or live in a purpose-built accommodation village. A number of WRSFs are in use, segregated as oxide or rock facilities. Potentially acid-forming waste is encapsulated within the WRSFs as required. Boddington operates two run-of-mine (ROM) stockpiles and two medium-grade stockpiles. The stockpiles are reclaimed using a preferential high-grade feed strategy, with the lower medium- grade stockpiles being re-handled to the mill towards the end of the LOM. The F1/F3 tailings facility is the current active TSF for the Boddington Operations. The current F1/F3 dam has approved capacity to 750 Mt, which will provide sufficient storage for tailings storage to mid-2030, assuming remaining capacity of 168 Mt, and an approximate 38 Mt/a process rate. The approved facility has 11 perimeter embankments, of which all are in place. Newmont plans to expand the facility to 830 Mt, which, assuming the same approximately 38 Mt/a process rate, will provide tailings capacity to mid-2032. The expansion to 830 Mt is not currently permitted. Additional storage that will be required for the LOM beyond mid-2032 is being evaluated by Newmont. This is currently envisaged as a new tailings facility (RDA2) with a 294 Mt capacity. Newmont has established a pathway and a timeline for the tailings facility approval and construction such that storage capacity will be available when needed. Water management infrastructure for mine operations includes pit dewatering and mine surface water drainage infrastructure. Power is sourced from the Bluewater Power Station, a thermal power station located 4.5 km northeast of the town of Collie, which is located approximately 80 km from the mine. Power is transmitted through the State power grid from the power station to the mine site. 1.16 Markets and Contracts Newmont has established contracts and buyers for copper concentrate products, and has an internal marketing group that monitors markets for its concentrate. Together with public documents and analyst forecasts, there is a reasonable basis to assume that for the LOM plan, the copper concentrate will be saleable at the assumed commodity pricing. The terms contained within the concentrate sales contracts are typical and consistent with standard industry practice for high-gold, low-copper concentrates. The contracts include industry benchmark terms for metal payables, treatment charges and refining charges for concentrates produced. Depending on the specific contract, the terms for the sale of Boddington’s copper concentrate are either annually negotiated, benchmark-based treatment and refining charges, or a combination of annually-negotiated terms. Treatment charges assumed for estimation of mineral reserves are based on the forecasts published by third-party data providers such as Wood Boddington Operations Western Australia Technical Report Summary Date: February 2026 Page 1-18 Mackenzie or CRU. The formula used for mineral reserves is sensitive to the underlying copper price and is consistent with long-term expectations for copper treatment and refining charges. Newmont’s doré is sold on the spot market, by marketing experts retained in-house by Newmont. The terms contained within the sales contracts are typical and consistent with standard industry practice and are similar to contracts for the supply of doré elsewhere in the world. Newmont uses a combination of historical and current contract pricing, contract negotiations, knowledge of its key markets from a long operations production record, short-term versus long- term price forecasts prepared by Newmont’s internal marketing group, public documents, and analyst forecasts when considering long-term commodity price forecasts. Higher metal prices are used for the mineral resource estimates to ensure the mineral reserves are a sub-set of, and not constrained by, the mineral resources, in accordance with industry-accepted practice. The commodity price and exchange rate forecasts are included in Table 1-7. Table 1-7: Commodity Price and Exchange Rate Forecasts Item Unit Mineral Reserves Mineral Resources Gold US$/oz 2,000 2,300 Copper US$/lb 3.75 4.25 Exchange rate US$:AU$ 0.70:1 0.70:1 The largest in-place contracts other than for product sales cover items such as bulk commodities, operational and technical services, mining and process equipment, and administrative support services. Contracts are negotiated and renewed as needed. Contract terms are typical of similar contracts in Australia that Newmont is familiar with. 1.17 Environmental, Permitting and Social Considerations 1.17.1 Environmental Studies and Monitoring Baseline and supporting environmental studies were completed to assess both pre-existing and ongoing site environmental conditions, as well as to support decision-making processes during operations start-up and restart. Characterization studies were completed for all environmental media including soil, water, waste, air, noise, and closure. Plans were developed and implemented to address aspects of operations such as waste and fugitive dust management, spill prevention and contingency planning, water management, and noise levels. There are five species classified as Threatened Species/Matters of National Environmental Significance in the Project area, including three species of black cockatoo (Baudin’s, Carnaby’s and Forest Red-Tailed), and two species of marsupial, woylie and chuditch. All five species have site-specific management plans. 1.17.2 Closure and Reclamation Considerations Annually and as required by Part VIII of the Mining Act 1978, Boddington must complete a self- assessment report detailing disturbed areas and planned rehabilitation within existing tenements The disturbance area is used to calculate the annual 1% liability levy under the Mine Rehabilitation


Boddington Operations Western Australia Technical Report Summary Date: February 2026 Page 1-19 Fund (MRF) that is charged to the site and remains in effect until all tenements were signed off as rehabilitated. In 2025, the levy amounted to approximately US$1.2 M. Newmont is also required to calculate the closure costs for the Boddington Operations as part of internal closure and financial planning. The closure estimate, as at December 31, 2025, assuming operations to 2040, is calculated as approximately US$0.5 B. 1.17.3 Permitting All major permits and approvals are either in place or Newmont expects to obtain them in the normal course of business. Additional permitting will be required to support the tailings disposal required in the LOM plan. Where permits have specific terms, renewal applications are made of the relevant regulatory authority as required, prior to the end of the permit term. Newmont monitors the regulatory regime in place at each of its operations and ensures that all permits are updated in line with any regulatory changes. 1.17.4 Social Considerations, Plans, Negotiations and Agreements Newmont defines the host communities for the Boddington Operations as those within a 50 km radius of the operation. These include the local government areas of Boddington, Williams, and Wandering, and the community of Dwellingup. Newmont has well-established relationships, engagement forums, and a suite of integrated social impact and opportunity-aligned strategic investment partnerships. The operations area is subject to the South West Native Title Settlement. The Preservation of Aboriginal Heritage Agreement ensures that Newmont meets and exceeds the minimum obligations prescribed in the State’s Aboriginal Heritage Act 1972. 1.18 Capital Cost Estimates Capital cost estimates are at a minimum at a pre-feasibility level of confidence, having an accuracy level of ±25% and a contingency range not exceeding 15%. Capital costs are based on recent prices or operating data. Capital costs include funding for infrastructure, pit dewatering, development drilling, and permitting as well as miscellaneous expenditures required to maintain production. Mobile equipment re-build/replacement schedules and fixed asset replacement and refurbishment schedules are included. Sustaining capital costs reflect current price trends. The overall capital cost estimate for the LOM is US$3.3 B, as summarized in Table 1-8. The forecast mining capital cost estimate (US$0.9 B) over the LOM averages US$1.02/t mined, and the combined LOM processing and support capital (US$2.5 B) forecast averages US$4.47/t milled. Boddington Operations Western Australia Technical Report Summary Date: February 2026 Page 1-20 Table 1-8: Capital Cost Estimate Area Unit Value Mining US$ billion 0.9 Process US$ billion 2.4 Site G&A US$ billion 0.1 Total US$ billion 3.3 Note: numbers have been rounded; totals may not sum due to rounding. 1.19 Operating Cost Estimates Operating cost estimates are at a minimum at a pre-feasibility level of confidence, having an accuracy level of ±25% and a contingency range not exceeding 15%. Operating costs are based on actual costs seen during operations and are projected through the LOM plan. Historical costs are used as the basis for operating cost forecasts for supplies and services unless there are new contract terms for these items. Labor and energy costs are based on budgeted rates applied to headcounts and energy consumption estimates. Operating costs for the LOM are estimated at US$12.3 B, as summarized in Table 1-9. Table 1-9: Operating Cost Estimate Area Unit Value Mining US$ billion 4.2 Process US$ billion 6.9 G&A US$ billion 1.3 Total US$ billion 12.3 Note: numbers have been rounded; totals may not sum due to rounding. The estimated LOM mining cost is US$5.03/t. The base processing cost is estimated at U$12.62/t. In addition, G&A costs are estimated at US$2.31/t (Table 1-10). Table 1-10: Operating Unit Cost Estimate Area Unit Value Mining US$/t mined 5.03 Process US$/t milled 12.62 G&A US$/t milled 2.31 Boddington Operations Western Australia Technical Report Summary Date: February 2026 Page 1-21 1.20 Economic Analysis 1.20.1 Economic Analysis The financial model that supports the mineral reserve declaration is a standalone model that calculates annual cash flows based on scheduled ore production, assumed processing recoveries, metal sale prices and US$/AU$ exchange rate, projected operating and capital costs and estimated taxes. The financial analysis is based on an after-tax discount rate of 5%. All costs and prices are in unescalated “real” dollars. The currency used to document the cash flow is US$. All costs are based on the 2026 budget. Revenue is calculated from the recoverable metals and long-term metal price and exchange rate forecasts. The Boddington Operations are subject to a federal tax rate of 30% on taxable income. The economic analysis assumes constant prices with no inflationary adjustments. The economic analysis is based on 100% equity financing and is reported on a 100% project ownership basis. The NPV5% is US$1.5 B. As the cash flows are based on existing operations where all costs are considered sunk to 1 January 2026, considerations of payback and internal rate of return are not relevant. Free cash flow is us$2.2 B. A summary of the financial results is provided in Table 1-11. The active mining and processing operation ceases in 2040; however, closure costs are estimated to 2059. The closure estimate, as at December 31, 2025, assuming operations to 2040, is calculated as approximately US$0.5 B. Boddington Operations Western Australia Technical Report Summary Date: February 2026 Page 1-22 Table 1-11: Cash Flow Summary Table Item Unit Value Metal prices Gold US$/oz 2,000 Copper US$/lb 3.75 Milled Ore Tonnage Mt 545.1 Gold grade g/t 0.58 Copper grade % 0.09 Gold ounces Moz 10.2 Copper metric tonnes kt 494 Capital costs US$ billion 3.3 Costs applicable to sales US$ billion 13.3 Discount rate % 5 Exchange rate United States dollar: Australian dollar (US$:AU$) 0.70:1 Free Cash Flow US$ billion 2.2 Net Present Value US$ billion 1.5 Note: Table 1-11 contains “forward-looking statements” within the meaning of Section 27A of the Securities Act of 1933, as amended, and Section 21E of the Securities Exchange Act of 1934, as amended, which are intended to be covered by the safe harbor created by such sections and other applicable laws. Please refer to the note regarding forward-looking information at the front of the Report. The cash flow is only intended to demonstrate the financial viability of the Project. Investors are cautioned that the above is based upon certain assumptions which may differ from Newmont’s long-term outlook or actual financial results, including, but not limited to commodity prices, escalation assumptions, and other technical inputs. For example, Table 1-11 uses the price assumptions stated in the table, including a gold commodity price assumption of US$2,000/oz, which varies significantly from current gold prices and the assumptions that Newmont uses for its long-term guidance. Please be reminded that significant variation of metal prices, costs and other key assumptions may require modifications to mine plans, models, and prospects. Numbers have been rounded; totals may not sum due to rounding.


Boddington Operations Western Australia Technical Report Summary Date: February 2026 Page 1-23 1.20.2 Sensitivity Analysis The sensitivity of the Project to changes in metal prices, exchange rate, sustaining capital costs and operating cost assumptions was tested using a range of 25% above and below the base case values (Figure 1-1). Figure 1-1: NPV Sensitivity Note: Figure prepared by Newmont, 2025. FCF = free cash flow; op cost = operating cost; cap cost = capital cost; NPV = net present value. The Project is most sensitive to metal price changes, less sensitive to changes in operating costs, and least sensitive to changes in capital costs. The sensitivity to grade mirrors the sensitivity to the gold price and is not shown. Boddington Operations Western Australia Technical Report Summary Date: February 2026 Page 1-24 1.21 Risks and Opportunities Factors that may affect the mineral resource and mineral reserve estimates are summarized in Chapter 1.11.3 and Chapter 1.12.3. 1.21.1 Risks The risks associated with the Boddington site are generally those expected with a large surface mining operation and include the accuracy of the resource model, unexpected geological features that cause geotechnical issues, dewatering difficulties, and/or operational impacts. Other risks noted include: • Commodity price increases for key consumables such diesel, electricity, tires, and chemicals would negatively impact the stated mineral reserves and mineral resources; • Labor cost increases or productivity decreases could also impact the stated mineral reserves and mineral resources, or impact the economic analysis that supports the mineral reserves; • While the autonomous haulage system is currently operational. Any unforeseen issues with this innovative system could increase costs and/or lower expected productivities; • With bauxite mining having precedence over other minerals there is a risk that any unexpected requirement to advance bauxite mining (or delay gold mining) could increase costs and/or delay the expected production profile; • Geotechnical and hydrological assumptions used in mine planning are based on historical performance, and to date historical performance has been a reasonable predictor of current conditions. Any changes to the geotechnical and hydrological assumptions could affect mine planning, affect capital cost estimates if any major rehabilitation is required due to a geotechnical or hydrological event, affect operating costs due to mitigation measures that may need to be imposed, and impact the economic analysis that supports the mineral reserve estimates; • The mine plan assumes that the existing TSF can be expanded from 750 Mt to 830 Mt. While there is sufficient time for the permitting process prior to the expansion being required in 2029, if there is a delay in the permitting process or the facility cannot be expanded, this could impact the mine plan, the mineral reserve estimates and the economic analysis that supports the mineral reserve estimates; • The mine plan assumes that a second tailings facility can be constructed and permitted. Newmont has established a pathway and a timeline to develop additional tailings capacity such that storage capacity will be available when needed. However, if there are changes to the assumed pathway, to the ability to construct and permit such a facility, or to the timeline assumptions, this could impact the mine plan, the mineral reserve estimates and the economic analysis that supports the mineral reserve estimates; • The mineral reserve estimates are very sensitive to metal prices. Lower metal prices than forecast in the LOM plan may require revisions to the mine plan, with impacts to the mineral reserve estimates and the economic analysis that supports the mineral reserve estimates; • There are five species classified as Threatened Species/Matters of National Environmental Significance in the Project area. Although there are site-specific management plans in place, if there is a major impact seen on the populations from mining activities, the environmental Boddington Operations Western Australia Technical Report Summary Date: February 2026 Page 1-25 permits for the operations could be revised or even revoked. The social license to operate could also be impacted; • Climate changes could impact operating costs and ability to operate; • There is a risk to the Boddington Operations overall if the Worsley JV were to fail to renew the mining leases, as Newmont’s interest relies on the existence of valid mining tenure. 1.21.2 Opportunities Opportunities for the Boddington Operations include moving the stated mineral resources into mineral reserves through additional drilling and study work. The mineral reserves and mineral resources are based on conservative price estimates for gold and copper so upside exists, either in terms of the potential to estimate additional mineral reserves and mineral resources or improved economics should the prices used for gold and copper be increased. Opportunities include: • Conversion of some or all of the measured and indicated mineral resources currently reported exclusive of mineral reserves to mineral reserves, with appropriate supporting studies; • Upgrade of some or all of the inferred mineral resources to higher-confidence categories, such that such better-confidence material could be used in mineral reserve estimation; • Higher metal prices than forecast could present upside sales opportunities and potentially an increase in predicted Project economics; • Potential to link the north and south pits through the saddle area to form a single large open pit. This will require additional mining and economic studies. 1.22 Conclusions Under the assumptions presented in this Report, the Boddington Operations have a positive cash flow, and mineral reserve estimates can be supported. 1.23 Recommendations As Boddington is an operating mine, the QP has no material recommendations to make. Boddington Operations Western Australia Technical Report Summary Date: February 2026 Page 2-1 2.0 INTRODUCTION 2.1 Registrant This technical report summary (the Report) was prepared for Newmont Corporation (Newmont) on the Boddington Operations (Boddington Operations or the Project) located in southern Western Australia (Figure 2-1). 2.2 Terms of Reference 2.2.1 Report Purpose The Report was prepared to be attached as an exhibit to support mineral property disclosure, including mineral resource and mineral reserve estimates, for the Boddington Operations in Newmont’s Form 10-K for the year ending December 31, 2025. Mineral resources and mineral reserves are reported for the North and South pits (also referred to as Wandoo North and Wandoo South). Mineral reserves are also estimated for material in stockpiles. 2.2.2 Terms of Reference The Boddington Operations currently consist of two open pit mines, the North, and the South pits. Gold operations were conducted in two phases. The initial oxide operations, a combination of open pit and underground mining, ran from 1987–2001. The current operations commenced in 2009 from open pit sources. Figure 2-2 shows the location of the current and mined-out open pits, and prospects. Unless otherwise indicated, all financial values are reported in United States dollars (US$). For financial values in Australian dollars (AU$), the assumed US$:AU$ exchange rate was 0.70:1. Unless otherwise indicated, the metric system is used in this Report. Mineral resources and mineral reserves are reported using the definitions in Regulation S–K 1300 (SK1300), under Item 1300. The Report uses US English. The Report contains forward-looking information; refer to the note regarding forward-looking information at the front of the Report.


Boddington Operations Western Australia Technical Report Summary Date: February 2026 Page 2-2 Figure 2-1: Project Location Plan Note: Figure prepared by Newmont, 2022. Boddington Operations Western Australia Technical Report Summary Date: February 2026 Page 2-3 Figure 2-2: Mining Operations Layout Plan Note: Figure prepared by Newmont, 2025. Boddington Operations Western Australia Technical Report Summary Date: February 2026 Page 2-4 2.3 Qualified Persons The following Newmont employee serves as the Qualified Person (QP) for the Report: • Mr. Shaun Chanter, RM SME, Head Reserve Governance - Global, Newmont. Mr. Chanter is responsible for all Report Chapters. 2.4 Site Visits and Scope of Personal Inspection Mr. Shaun Chanter has visited the Boddington Operations on many occasions, most recently from September 17–18, 2025. During site visits to the Project, Mr. Chanter inspected the operating open pits, and viewed the process plant and associated general site infrastructure, including the current tailings storage facility (TSF) operations. While on site, he discusses aspects of the operation with site-based staff and assesses the knowledge and abilities of the site staff to carry out their duties as required. These site discussions include the overall approach to the mine plan, anticipated mining conditions, selection of the production target and potential options for improvement. Other areas of discussion include plant operation and recovery forecasts, capital and operating forecasts and results. Mr. Chanter receives and reviews monthly reconciliation reports from the mine. These reports include the industry standard reconciliation factors for tonnage, grade, and metal; F1 (mineral reserve model compared to ore control model), F2 (mine delivered compared to mill received) and F3 (F1 x F2) along with other measures such as compliance of actual production to mine plan and polygon mining accuracy. The reconciliation factors are recorded monthly and reported in a quarterly control document. Through the review of these reconciliation factors, the QP is able to ascertain the quality and accuracy of the data and its suitability for use in the assumptions underlying the mineral resource and mineral reserves estimates. Mr. Chanter also reviews Newmont’s processes and internal controls at the mine site with operational staff on the work flow for determining mineral resource and mineral reserves estimates, mineral process performance, mining costs, and waste management. 2.5 Report Date Information in the Report is current as at December 31, 2025. 2.6 Information Sources and References The reports and documents listed in Chapter 24 and Chapter 25 of this Report were used to support Report preparation. 2.7 Previous Technical Report Summaries Newmont previously filed a technical report summary on the Project in 2021: • Doe, D., 2021: Boddington Operations, Western Australia, Technical Report Summary: report current at 31 December, 2021. Boddington Operations Western Australia Technical Report Summary Date: February 2026 Page 3-1 3.0 PROPERTY DESCRIPTION 3.1 Introduction The Boddington Operations are located about 130 km southeast of the city of Perth and 17 km northwest of the township of Boddington. The Project centroid is situated at approximately 32°44'15.99"S and 116°21'34.76"E. The open pit operations are centered on: • North Pit: 2°44'34"S and 116°20'24"E; • South Pit: 32°45'18"S and 116°21'30"E. 3.2 Property and Title in Western Australia 3.2.1 Mineral Title In Australia, with limited exceptions, all onshore mineral rights are reserved by the government of the relevant State or Territory. Exploration for, and mining of, minerals in each State and Territory is regulated by legislation and administered by a minister of the Crown assisted by a government department. In Western Australia, the Mining Act 1978 (West Australia) (West Australia Mining Act) is the primary legislation governing the exploration and mining of minerals. Rights to explore for and extract minerals in each State and Territory are conferred by statutory titles, which give the holders certain rights to explore for and/or extract minerals on both Crown and private land. A person must hold the correct type of title over an area of land before conducting any activities associated with that land. Common forms of mining titles in Australia are exploration and prospecting licenses, mining leases, and general purpose leases. In most cases, an exploration license is a prerequisite to obtaining a mining leases. A general purpose lease may also be granted for one or more of a number of permitted purposes. These purposes include erecting, placing and operating machinery and plant in connection with mining operations, depositing, or treating minerals or tailings, and using the land for any other specified purpose directly connected with mining operations. It is possible for an individual or entity person to own the surface of the property, and for another to own the mineral rights. Government royalties are payable as specified in the relevant legislation in each State or Territory. Where native title has not been extinguished, native title legislation may apply to the grant of tenure and there are certain processes to be followed before the grant may occur. Federal and State Aboriginal cultural heritage legislation also operates to protect Aboriginal sites and areas from unauthorized disturbance. The Australian Federal Government has oversight relating to environmental matters of national significance. The Federal Government also has the power to restrict mineral exports for the good of the country, and can exert control over most mineral production. In West Australia, ownership of all minerals is vested in the State Government, administered the mineral industries within its own borders, which includes registering land titles; issuing exploration and development permits; overseeing mining operations (which included administration of inspections); assuring compliance with health, safety, and environmental regulations; and levying royalties and taxes.


Boddington Operations Western Australia Technical Report Summary Date: February 2026 Page 3-2 Exploration and mining companies and individuals may access rights to minerals in West Australia, subject to payment of application fees, rents, and royalties, by obtaining exclusive mining title, in the form of mining “tenements”. The most common West Australian tenure types are summarized in Table 3-1. Table 3-1: Tenure Types in Western Australia License Type Comment Prospecting License/Special Prospecting License for Gold Four-year term. Can be extended for a single four-year term. Maximum area of 200 ha for prospecting license and 10 ha for special license. Exploration License Five-year term. At the end of both the third and fourth year, must surrender 50% of license. For a license applied for and granted after 10 February 2006, the surrender requirement is 40% at the end of the sixth year. Minimum 1 block* size, maximum 70 blocks, except in areas not designated as mineralized areas, where the maximum size is 200 blocks. Can be renewed for a further five-year period, and then by further period or periods of two years. Mining Lease 21-year term, can be renewed. The maximum area for a mining lease (M) applied for before 10 February 2006 is 1,000 ha. After that date, the size applied for must relate to an identified orebody as well as an area for infrastructure requirements. Retention License A “holding" title for a Mineral Resource that has been identified but is not able to be further explored or mined. Cannot exceed five years and is renewable for additional periods not exceeding five years. There is no maximum area. General Purpose Lease For infrastructure related to mining operations, such as camp facilities, operating machinery or depositing or treating tailings. 21-year term, and can be renewed. The maximum area is 10 ha, unless Ministerial Consent is given for a larger area. General purpose leases must be marked out and are limited to a depth of 15 m or such other depth that may be specified Miscellaneous License For purposes such as a road, pipeline, or water. 21-year term, and can be renewed. There is no maximum area. State Agreement State Agreements (SA) are contracts between the State and major project developers that establish a framework of rights and obligations to facilitate the development of resources and/or downstream processing projects in Western Australia. These agreements are ratified by an Act of the WA Parliament known as a State Agreement Act. Note: * A block is a graticular unit. A graticular block is an area of land one minute of latitude long, by one minute of longitude wide and is equal to approximately 310 ha. 3.2.2 Surface Rights Surface rights are generally divisible into two categories: Crown land and private land. Where land is vested in the Crown, typically mining companies deal with government bodies to determine the social impact of the application, and any potential conflicts in land usage, such as forestry or national parks. Crown land can be subject to pastoral or other leasehold arrangements, in which case, mining companies need also to negotiate with the relevant leaseholder. Boddington Operations Western Australia Technical Report Summary Date: February 2026 Page 3-3 In the case of private land, the written consent of the owner of the land must be obtained before a mining title can be granted in respect of certain private land interests. Usually any consent given will be included in a compensation agreement between the landowner and the mining company. However, this consent is not required where the title is only granted in respect of land >30 m below the surface (i.e. subsurface land). 3.2.3 Native Title and Heritage Protection The common law of Australia recognizes a form of native title, under the Native Title Act 1993 (Commonwealth of Australia) (Native Title Act). The Aboriginal Heritage Act 1972 (West Australia) (West Australia Heritage Act) applies to mining tenements and makes it an offence to, among other things, alter or damage an Aboriginal site. An Aboriginal site is defined to include any sacred, ritual, or ceremonial site which is of importance and special significance to persons of Aboriginal descent. There is no requirement or need for a site to be registered as an Aboriginal site for it to qualify as an Aboriginal site for the purposes of the West Australia Heritage Act. The Aboriginal and Torres Strait Islander Heritage Act 1984 (Commonwealth of Australia) also applies to mining tenements and is aimed at the preservation and protection from desecration of significant Aboriginal areas and significant Aboriginal objects. An area or object is found to be desecrated if it is used or treated in a manner inconsistent with Aboriginal tradition. 3.2.4 Government Mining Taxes, Levies or Royalties Mineral royalties are collected under either the West Australia Mining Act or State Agreement Acts which are negotiated for individual projects. In some cases, the State Agreement Act contains specific royalty clauses, while in other cases it simply refers to the West Australia Mining Act royalty sections. In West Australia there are three systems of mineral royalty collection used: • Specific rate: flat rate per tonne; • Ad valorem: percentage of value; • Profit-based: percentage of profit. When any minerals are produced or obtained from a mining tenement, a quarterly production report must be lodged and a gold, silver and copper royalty is payable to the West Australian government. The copper royalty is 5% of the realized copper value and is payable in Australian dollars. The realized copper value is the copper payment made by the smelter, less all contracted costs associated with shipment, treatment and refining of the concentrate and metals arising thereof. The silver royalty is 2.5% of the realized silver value and is payable in US currency. The realized silver value is the silver payment made by the smelter less the cost of silver refining. No gold royalty is payable in respect of the first 2,500 oz of gold produced by a mine in any financial year. For production in excess of 2,500 oz in a financial year, the gold royalty is 2.5% of the gold value. Boddington Operations Western Australia Technical Report Summary Date: February 2026 Page 3-4 3.3 Ownership 3.3.1 Ownership History The majority of the Boddington Operations area is located within the original boundaries of a single large tenement (M258SA) granted under the Worsley State Agreement. M258SA is held by the Worsley Joint Venture (Worsley JV) and permits the mining of bauxite only. The current participants of the Worsley JV are: • South32 Aluminium (RAA) Pty Ltd: 56%; • South32 Alumina (Worsley) Pty Ltd: 30%; • Japan Alumina Associates (Australia) Pty Ltd: 10%; • Sojitz Alumina Pty Ltd: 4%. In the early 1980s, the Worsley JV discovered gold mineralization at Boddington. The Worsley State Agreement was amended to enable the granting of all minerals leases under the West Australia Mining Act within the boundaries of M258SA. On grant of such mineral leases these areas would be temporarily excised from M258SA. Under the Worsley State Agreement when the West Australia Mining Act Mining Leases are relinquished, the area reverts to M258SA. The Worsley JV established a new joint venture to exploit the gold mineralization, the Boddington Gold Mine Joint Venture (BGMJV). The BGMJV Agreement was entered into on 31 March 1987 and initially consisted of the same participants as the Worsley JV. The relationship between the bauxite/alumina operations and the gold operations was regulated under a cross-operation agreement which, in a restated form, continues as at the Report date. The paramount principle regulating the relationship between the Worsley JV and the BGMJV was that bauxite and bauxite operations were to have priority over all other minerals within an area (the Common Area) that was defined within the boundaries of M258SA. Consequently, unless an alternative arrangement is reached, where bauxite is found in an area of the mining leases where Newmont is active, Newmont is required to mine and stockpile bauxite on behalf of the Worsley JV. Ownership of the BGMJV changed over time so that the participants in the Worsley JV were no longer the same as the BGMJV participants. In order to accommodate the transfer of ownership to incoming BGMJV participants whilst maintaining bauxite rights, a series of transactions were entered into that resulted in the present structure whereby the BGMJV participants sublease the mining leases on which the gold mineralization is located. Newmont acquired its interest in the BGMJV through the transactions summarized in Table 3-2. Boddington Operations Western Australia Technical Report Summary Date: February 2026 Page 3-5 Table 3-2: Transactions Through Which Newmont Acquired Its Interest in the BGMJV Year Interest Seller Purchaser 1995 4 and 4/9% Japan Alumina Associates (Australia) Pty Ltd (then called Kobe Alumina Associates (Australia) Pty Limited) Newmont Boddington Pty Ltd (then called PosGold (Boddington) Pty Ltd and ultimately held by Normandy Mining Limited) 1995 40% Reynolds Australia Alumina Ltd Newmont Boddington Pty Ltd (then called PosGold (Boddington) Pty Ltd and ultimately held by Normandy Mining Limited) 2002 Newmont Mining Corporation acquires 100% of Normandy Mining Limited, which was the ultimate owner of PosGold (Boddington) Pty Ltd. 2006 22 and 2/9% Newcrest Operations Limited Newmont Boddington Pty Ltd 2009 33 and 3/9% AngloGold Ashanti Australia Limited Saddleback Investments Pty Ltd 3.3.2 Current Ownership Since 2009, Newmont has had 100% ownership of the BGMJV. The current parties to the BGMJV are Newmont Boddington Pty Ltd (66⅔%) and Saddleback Investments Pty Ltd (Saddleback; (33⅓%). Both companies are indirectly wholly-owned Newmont subsidiaries. 3.4 Property Agreements 3.4.1 Background The region in which the Project is located is a well-known bauxite-alumina mining and production area now held predominantly by either the Worsley JV or the Alcoa Australia Group pursuant to their respective State Agreements. The major part of the West Australia Mining Act tenure (including M70/21–26, M70/564 and M70/799) lies within the original boundaries of M258SA. The remainder of the tenure (including M264SAand M70/1031) lies within the original boundaries of another State Agreement Area known as the Alcoa State Agreement (M1SA). Newmont subleases from the Worsley JV the key mining leases upon which the Boddington operations are located, namely M70/21–26, M70/564 and M70/799. Newmont is entitled to all gold and other non-bauxite mining rights conferred by these leases. The Worsley JV retains the rights to bauxite and priority rights of access in order to mine and recover such bauxite. Where any new leases within the original area of M258SA are granted to the Worsley JV, the non-bauxite rights under such leases are held by the Worsley JV for and on behalf of the BGMJV. 3.4.2 Cross-Operation Agreement The relationship between the Worsley JV bauxite operations and the BGMJV gold operations is regulated through a cross-operation agreement. This agreement provides that the operations of the Worsley JV will have priority over the operations of the BGMJV conducted within the Common


Boddington Operations Western Australia Technical Report Summary Date: February 2026 Page 3-6 Area, and the BGMJV are required to take reasonable measures to conserve bauxite including by mining and stockpiling bauxite on behalf of the Worsley JV. The cross-operation agreement also requires the managers of the respective JVs to keep each other regularly informed as to current and proposed activities in order to alleviate or minimize any potential impact of one operation upon another. 3.5 Mineral Title Newmont has an interest in a total of 95 tenements in the Boddington area. The total granted area is approximately 21,249 ha and the under-application area is approximately 60,767 ha. The mining area for the Boddington Operations is covered by 13 West Australia Mining Act leases: M70/21–26, M70/564, M70/799, M70/1031, G70/215, G70/218–219 and G70/272, and M264SA. Mining leases M70/21–26 and M70/799 are the key tenements under which gold mining activity is concentrated. Through direct lease holding and sub-lease arrangements with the Worsley JV, Newmont holds the rights to minerals other than bauxite in proportion to the Newmont ownership percentages. A total of 26 of the mining tenements are at an application stage. Under the Mining Act, Mining Leases are granted for 21 years and are renewable. Five mining leases (M70/21–25) were renewed in March 2007 for a 21-year term. Newmont has an automatic right to be granted new subleases upon the Worsley JV renewing the mining leases. Mineral tenure is summarized in Table 3-3, and a tenure location plan is provided as Figure 3-1. At the Report date, all required payments had been made and all required statutory reporting had been filed with the West Australian Department of Mines, Industry Regulation and Safety. 3.6 Surface Rights Newmont holds sufficient surface rights to execute the life-of-mine (LOM) plan. A map showing the surface rights is included as Figure 3-2. Boddington Operations Western Australia Technical Report Summary Date: February 2026 Page 3-1 Table 3-3: Mineral Tenure Summary Table Lease Holder Lease Type Lease Status Current Area Application Date (dd/mm/year) Grant Date (dd/mm/year) Expiry Date (dd/mm/year) E70/2149 1 A Ex Application 28 blocks 7/12/1998 — — E70/2336 1 A Ex Application 56 blocks 25/05/2000 — — E70/2550 1 A Ex Application 7 blocks 11/10/2002 — — E70/2562 1 B Ex Withdrawn 8 blocks 2/12/2002 — Death date 20/06/2023 E70/3750 C Ex Application 40 blocks 30/11/2009 — — E70/3982 C Ex Application 6 blocks 1/10/2010 — — E70/4018 C Ex Application 3 blocks 9/12/2010 — — E70/4019 C Ex Application 6 blocks 9/12/2010 — — E70/4235 C Ex Application 2 blocks 30/09/2011 — — E70/4301 C Ex Application 8 blocks 22/02/2012 — — E70/4302 C Ex Application 6 blocks 22/02/2012 — — E70/5836 C Ex Application 61 blocks 14/07/2021 — — E70/5837 C Ex Application 36 blocks 14/07/2021 — — E70/5838 C Ex Application 65 blocks 14/07/2021 — — E70/5839 C Ex Application 44 blocks 14/07/2021 — — M70/18 2 D M Application 884 ha 8/04/1983 — — M70/19 2 D M Application 980 ha 8/04/1983 — — M70/27 2 D M Application 747 ha 14/04/1983 — — M70/28 2 D M Application 720 ha 14/04/1983 — — M70/29 2 D M Application 690 ha 14/04/1983 — — M70/30 2 D M Application 690 ha 14/04/1983 — — M70/31 2 D M Application 907 ha 14/04/1983 — — M70/32 2 D M Application 972 ha 14/04/1983 — — M70/33 2 D M Application 856 ha 14/04/1983 — — M70/34 2 D M Application 873 ha 14/04/1983 — — Boddington Operations Western Australia Technical Report Summary Date: February 2026 Page 3-2 Lease Holder Lease Type Lease Status Current Area Application Date (dd/mm/year) Grant Date (dd/mm/year) Expiry Date (dd/mm/year) M70/35 2 D M Application 967 ha 14/04/1983 — — M70/36 2 D M Application 639 ha 14/04/1983 — — M70/545 2 E M Application 1000 ha 13/07/1989 — — M70/975 1 F M Application 990 ha 14/01/1997 — — P70/1598 C P Application 27.56 ha 24/06/2010 — — E70/710 3 E Ex Granted 9.44 km2 27/04/1988 16/01/1989 15/01/1997 G70/215 C G Granted 28.61 ha 13/05/2005 16/06/2009 15/06/2030 G70/218 C G Granted 51.69 ha 9/02/2006 16/08/2006 15/08/2027 G70/219 C G Granted 9.545 ha 9/02/2006 13/12/2006 12/12/2027 G70272 C G Granted 8.100 ha 30/08/2023 29/05/2025 28/05/2046 G70/279 C G Application 956.00 ha 26/09/2025 — — L70/152 C L Granted 171.68 ha 6/08/2012 14/03/2013 13/03/2034 L70/165 C L Granted 2.128 ha 15/05/2014 22/09/2014 21/09/2035 L70/28 C L Granted 1.2 ha 16/08/1993 4/11/1993 3/11/2023 L70/95 C L Granted 31 ha 9/02/2006 5/05/2006 4/05/2027 L70/96 C L Granted 6 ha 13/07/2006 10/11/2006 9/11/2027 L70/222 C L Application 33.25 ha 10/09/2020 — — M264SA(1) C M Granted 497.35 ha 28/12/1987 1/08/1988 31/07/2030 M264SA(2) C M Granted 408.9 ha 28/12/1987 1/08/1988 31/07/2030 M70/1031 C M Granted 398.9 ha 8/10/1998 11/10/1999 10/10/2020 M70/110 2 F M Granted 5.2955 ha 25/11/1983 3/02/1989 2/02/2031 M70/111 2 F M Granted 121.3 ha 25/11/1983 3/02/1989 2/02/2031 M70/112 2 F M Granted 29.37 ha 25/11/1983 3/02/1989 2/02/2031 M70/113 2 F M Granted 64.485 ha 25/11/1983 3/02/1989 2/02/2031 M70/114 2 F M Granted 817.8 ha 25/11/1983 3/02/1989 2/02/2031 M70/115 2 F M Granted 702.2 ha 25/11/1983 3/02/1989 2/02/2031 M70/116 2 F M Granted 749.3 ha 25/11/1983 3/02/1989 2/02/2031 Boddington Operations Western Australia Technical Report Summary Date: February 2026 Page 3-3 Lease Holder Lease Type Lease Status Current Area Application Date (dd/mm/year) Grant Date (dd/mm/year) Expiry Date (dd/mm/year) M70/1220 C M Granted 43.335 ha 4/03/2005 14/11/2012 13/11/2033 M70/1221 C M Granted 929.3 ha 4/03/2005 14/11/2012 13/11/2033 M70/1236 C M Granted 946 ha 17/06/2005 25/11/2013 24/11/2034 M70/1237 C M Granted 987 ha 17/06/2005 25/11/2013 24/11/2034 M70/1238 C M Granted 708 ha 17/06/2005 25/11/2013 24/11/2034 M70/1239 C M Granted 960 ha 17/06/2005 25/11/2013 24/11/2034 M70/21 3 F M Granted 978.05 ha 14/04/1983 9/04/1986 8/04/2028 M70/22 3 F M Granted 984.6 ha 14/04/1983 9/04/1986 8/04/2028 M70/23 3 F M Granted 966.9 ha 14/04/1983 9/04/1986 8/04/2028 M70/24 3 F M Granted 986.15 ha 14/04/1983 9/04/1986 8/04/2028 M70/25 3 F M Granted 968.38 ha 14/04/1983 9/04/1986 8/04/2028 M70/26 3 F M Granted 527.25 ha 14/04/1983 28/11/2014 27/11/2035 M70/462 C M Granted 476.25 ha 1/11/1988 12/10/1989 11/10/2031 M70/463 C M Granted 359.65 ha 1/11/1988 12/10/1989 11/10/2031 M70/464 C M Granted 725.6 ha 1/11/1988 12/10/1989 11/10/2031 M70/465 C M Granted 359.55 ha 1/11/1988 12/10/1989 11/10/2031 M70/466 C M Granted 109.5 ha 1/11/1988 12/10/1989 11/10/2031 M70/554 2 F M Granted 38.61 ha 13/07/1989 6/04/2004 5/04/2025 M70/564 3 F M Granted 363.8 ha 29/08/1989 27/04/1990 26/04/2032 M70/588 C M Granted 360.15 ha 31/10/1989 7/06/1990 6/06/2032 M70/589 C M Granted 120.05 ha 31/10/1989 7/06/1990 6/06/2032 M70/590 C M Granted 402.55 ha 31/10/1989 7/06/1990 6/06/2032 M70/591 C M Granted 359.9 ha 31/10/1989 7/06/1990 6/06/2032 M70/731 C M Granted 300 ha 3/12/1991 26/01/1993 25/01/2035 M70/799 3 F M Granted 925.4 ha 21/01/1993 21/09/1993 20/09/2035 M70/944 C M Granted 1.5305 ha 21/05/1996 5/12/1996 4/12/2038 M70/945 C M Granted 11.76 ha 21/05/1996 5/12/1996 4/12/2038


Boddington Operations Western Australia Technical Report Summary Date: February 2026 Page 3-4 Lease Holder Lease Type Lease Status Current Area Application Date (dd/mm/year) Grant Date (dd/mm/year) Expiry Date (dd/mm/year) M70/946 C M Granted 0.3385 ha 21/05/1996 5/12/1996 4/12/2038 M70/947 C M Granted 15.63 ha 21/05/1996 5/12/1996 4/12/2038 M70/948 C M Granted 2.496 ha 21/05/1996 5/12/1996 4/12/2038 M70/949 C M Granted 34.925 ha 21/05/1996 5/12/1996 4/12/2038 M70/950 C M Granted 16.465 ha 21/05/1996 5/12/1996 4/12/2038 M70/951 C M Granted 3.88 ha 21/05/1996 5/12/1996 4/12/2038 M70/952 C M Granted 12.13 ha 21/05/1996 5/12/1996 4/12/2038 M70/953 C M Granted 2.6 ha 21/05/1996 5/12/1996 4/12/2038 M70/954 C M Granted 12.865 ha 21/05/1996 5/12/1996 4/12/2038 M70/955 C M Granted 1.349 ha 21/05/1996 5/12/1996 4/12/2038 M70/976 1 F M Granted 861 ha 14/01/1997 30/08/2013 29/08/2034 M70/981 C M Granted 52.19 ha 25/03/1997 3/09/1997 2/09/2039 ML70/662 C ML Granted 90 ha 18/12/1981 1/01/2002 31/12/2022 ML70/663 C ML Granted 90 ha 18/11/1981 1/01/2002 31/12/2022 ML70/751 C ML Granted 120 ha 26/11/1981 1/01/2002 31/12/2022 ML70/752 C ML Granted 120 ha 26/11/1981 1/01/2002 31/12/2022 ML70/753 C ML Granted 50 ha 26/11/1981 1/01/2002 31/12/2022 Notes: A = Newcrest Operations Ltd (22.22%), Newmont Boddington Pty Ltd (44.44%), AngloGold Ashanti Australia Ltd (33.33%). B = Hedges Gold Pty Ltd (100%). C = Newmont Boddington Pty Ltd (66.67%), Saddleback Investments Pty Ltd (33.33%). D = BHP Billiton Minerals Pty Ltd (20%), South32 Aluminium (RAA) Pty Ltd (40%), Japan Alumina Associates (Australia) Pty Ltd (10%), The Shell Company of Australia Ltd (30%). E = South32 Aluminium (RAA) Pty Ltd (50%), Japan Alumina Associates (Australia) Pty Ltd (10%), Sojitz Alumina Pty Ltd (2.5%), The Shell Company of Australia Ltd (37.5%). F = South32 Aluminium (RAA) Pty Ltd (56%), South32 Worsley Alumina Pty Ltd (30%), Japan Alumina Associates (Australia) Pty Ltd (10%), Sojitz Alumina Pty Ltd (4%). Ex = Exploration, G = General Purpose Lease, L = Miscellaneous License, M = Mining Lease, ML = Mineral Lease, P = Prospecting Permit. A block is a graticular unit. A graticular block is an area of land one minute of latitude long, by one minute of longitude wide and is equal to approximately 310 ha. 1. Newmont 100% beneficial owner - upon grant can be transferred. 2. Newmont holds right to sub-lease. 3. Newmont holds a sub-lease. Boddington Operations Western Australia Technical Report Summary Date: February 2026 Page 3-1 Figure 3-1: Mineral Tenure Location Plan Note: Figure prepared by Newmont, 2025. Boddington Operations Western Australia Technical Report Summary Date: February 2026 Page 3-2 Figure 3-2: Surface Rights Plan Boddington Operations Western Australia Technical Report Summary Date: February 2026 Page 3-3 The Boddington Operations have freehold ownership of all the eastern and central areas of operations. Within this freehold land are all the existing residue disposal areas, the plant site, almost all of the area of the main open pit from the former oxide operation, and all but one of the smaller satellite open pits from the 1987–2001 operation. The western portion of the operational area is Crown land covered by native forest. Mining operations can be conducted in this area but with certain restrictions imposed by the State Government through the West Australia Mining Act that are applicable to forested Crown lands. Newmont holds freehold land to the north and to the east of the current mining areas. To the south and east of the Project is freehold farmland. The largest farm immediately south of the mine, Hotham Farm, was acquired by Newmont in December 2011. 3.7 Native Title The area underlying the Boddington Operations was previously subject to a land claim registered under the Native Title Act and referred to as the Gnaala Karla Booja Claim. This claim was settled as a result of the South West Native Title Settlement between the Western Australian government and the claimant group bin 2021. As part of this settlement, the Western Australian government provided GKB with an extensive and ongoing benefits package in return for the extinguishment of all native title claims over lands in the south west of Western Australia. To meet the then-applicable requirements for the Project, Newmont entered into a voluntary agreement with the GKB claimant group in 2006. The Moorditj Booja Community Partnership Agreement has an end date of 30 June 2026. Newmont’s obligation to comply with the terms of Federal and State cultural heritage legislation, as well as the terms of its Aboriginal cultural heritage agreement continue to apply despite the extinguishment of native title over the Boddington Operations area. 3.8 Water Rights Water rights are discussed in Chapter 15.7. 3.9 Royalties Production royalties are payable to the West Australian government and are included in the net smelter return (NSR) cut-off determination. Royalty payments were first incurred in the second half of 2009, and comprise: • Copper royalty of 5% of the realized copper value, calculated in US$ and payable in AU$; • Silver royalty of 2.5% of the realized silver value, calculated in US$ and payable in AU$; • Gold royalty of 2.5% of the gold value, except that no gold royalty is payable in respect of the first 2,500 oz of payable gold produced in any financial year. 3.10 Encumbrances In accordance with contractual arrangements with the Worsley Joint Venture Newmont, the bauxite within the area of its operations is reserved for the benefit of the Worsley Joint Venture and Newmont is required to conserve this bauxite, including through mining and stockpiling


Boddington Operations Western Australia Technical Report Summary Date: February 2026 Page 3-4 bauxite on behalf of the WJV. Certain of its tenements also contain a reservation of bauxite in favor of Alcoa Australia. 3.11 Permitting Requirements Permitting and permitting conditions are discussed in Chapter 17.5 of this Report. The operations as envisaged in the LOM plan are either fully permitted, or the processes to obtain permits are well understood and similar permits were granted to the operations in the past, such as TSF raises. There are no current material violations or fines, as imposed in the mining regulatory context of the Mine Safety and Health Administration (MSHA) in the United States, that apply to the Boddington Operations. 3.12 Significant Factors and Risks That May Affect Access, Title or Work Programs The following significant factors or risks may affect access, title, or right or ability to perform work at the Project: • The failure of the Worsley JV to renew the key mining leases which underpin the Boddington Operations; • Accurate closure cost provisioning, management of rehabilitation stockpiles (topsoil, gravels etc.), changes in design of facilities; • Waste rock management and generation of acid rock drainage (ARD); • Unapproved clearing of native vegetation; • Incorrect disposal of waste resulting in contamination of local area; • Spread of declared weed species or forest dieback disease; • Wildfire and storm risks; • Failure to obtain approvals and amendments to licenses within desired timeframes; • Failure to fully understand regional groundwater interactions and local dewatering activities impact on the local river system; • Breach of commitments with the Moorditj Booja Community Partnership Agreement; • Operations impacting sacred sites; • Reputational damage with local community if complaints or concerns are not addressed. To the extent known to the QP, there are no other known significant factors and risks that may affect access, title, or the right or ability to perform work on the properties that comprise the Boddington Operations that are not discussed in this Report. Boddington Operations Western Australia Technical Report Summary Date: February 2026 Page 4-1 4.0 ACCESSIBILITY, CLIMATE, LOCAL RESOURCES, INFRASTRUCTURE AND PHYSIOGRAPHY 4.1 Physiography The Boddington Operations are located on the Darling Plateau in an area of deeply weathered, undulating landscape that ranges from 200–500 meters Relative Level (mRL). Local relief varies by about 100 m, with shallow valley floors adjacent to broadly convex hills. The mine is located in the catchment area of Thirty Four Mile Brook, a tributary of the Hotham River, which itself flows into the Murray River and then into the Peel Harvey Inlet. The mining leases are located largely on private forested land typical of jarrah forest (a type of eucalyptus) forest. The forests were subject to selective logging for many decades. Land to the west of the Project area is State Forest, whereas much of the land to the south and east was cleared for agriculture or bauxite mining. 4.2 Accessibility The township of Boddington is located 130 km southeast of Perth, is 14 km due west of the main Perth–Albany Highway, and is accessed by an all-weather sealed road. The operations are 17 km northwest of Boddington, and are accessed via a sealed road from the township. Within the operations areas, high-use road surfaces are sealed, and the remaining road types are finished with a gravel surface. The port of Bunbury is used as the trans-shipment point for copper concentrates produced from the mine, and is approximately 170 km southwest of Perth, and approximately 175 km southwest of the operations area. 4.3 Climate The climate is Mediterranean, with hot, dry summers and cool, wet winters. The coldest month is July (average 4.5ºC), and the warmest is January (average 32ºC). Rainfall averages approximately 780 mm/a, with most precipitation falling between June and August. Mining operations are conducted year-round. 4.4 Infrastructure Perth is the main source of supplies, and has a large, specialized infrastructure for mining support. There are adequate schools, medical services, and businesses to support the work force. A skilled and semi-skilled mining workforce was established in the region as a result of on-going mining activities. Workers commute from Boddington and surrounding communities to the mine site. Boddington Operations Western Australia Technical Report Summary Date: February 2026 Page 4-2 The mine site has medical facilities to handle emergencies. In addition, medical facilities are available in Perth to support the mine’s needs. The Boddington Operations currently have all infrastructure in place to support mining and processing activities (see also discussions in Chapter 13, Chapter 14, and Chapter 15 of this Report). These Report chapters also discuss water sources, electricity, personnel, and supplies. Boddington Operations Western Australia Technical Report Summary Date: February 2026 Page 5-1 5.0 HISTORY The ownership changes and ownership history for the operations is summarized in Chapter 3.3. The mine has had two operating phases. From 1987–2001, open pit mining exploited gold in oxide resources in laterite from the original Boddington laterite pit and satellite deposits. A small decline was used to extract gold in quartz veins in the north of the Boddington area. Mining ceased in 2001, the plant and infrastructure were decommissioned, and redundant equipment was sold and removed from site. Feasibility studies during the 1990s and early 2000s examined the economics of mining low-grade hard rock mineralization within the bounds of the former Boddington laterite pit. Mining recommenced in 2009. In 2012, evaluations were undertaken to establish the biggest possible pit scenario for permitting purpose; in this scenario, the mine life would potentially extend until 2041. In 2014, the life-of-mine (LOM) extension project received regulatory approval and the mining proposal approval was granted in 2015. An area of mineralization, termed the CV1 Conveyor Saddle, separates North Pit from South Pit, and would only be mined in times of high gold prices as it currently does not meet reasonable prospects of economic extraction at the gold price forecast in this Report. Table 5-1 summarizes the exploration and development history of the Boddington Operations. Table 5-1: Exploration and Development History Summary Table Year Company Note 1975 Geological Survey of Western Australia (GSWA) Conducted a geochemical prospecting program; identified anomalous Au, As, Cu, Pb, Mo, and Zn in a zone about 5 km long and 500 m wide area within the northern extent of the Saddleback Greenstone Belt 1980 Reynolds Australia Mines Explored a significant gold-mineralized zone in an area within the geochemical anomaly 1982– 1985 BGMJV Drill testing, mineral resource and ore (mineral) reserve estimates, mining studies, environmental studies, applications for environmental approvals 1983 Discovery of an isolated area of supergene enriched copper-gold mineralization within the oxide profile below the water table 1986– 1987 Alcoa of Australia Limited Feasibility studies on Hedges area, a northern continuation of the Boddington deposit 1987 BGMJV Open pit mining commenced at Boddington 1988 Alcoa of Australia Limited Open pit mining commenced at Hedges 1990 BGMJV Discovery of high-grade gold-bearing quartz veins in the northern section of the deposit within oxide and bedrock zones


Boddington Operations Western Australia Technical Report Summary Date: February 2026 Page 5-2 Year Company Note 1991 Construction of supergene plant 1992 Construction of Jarrah Decline to access the high-grade Jarrah quartz veins 1993– 2001 Open pit mining of six satellite deposits 1994 Wandoo low-grade deposit identified 1997 Completion of underground mining on the Jarrah quartz veins. Feasibility study on Wandoo South 1998 Purchase of Hedges (now Wandoo North) 2000 Update of feasibility study using Wandoo South and Wandoo North 2001 Oxide resources depleted, mine placed on care and maintenance 2002 Newmont Acquired Normandy Mining interest in BGMJV 2003 BGMJV Updated feasibility study assuming open pit mining and conventional crush– mill–float processing for copper and cyanide leach processing for gold, focusing on Wandoo South and Wandoo North 2006 Board approval of open pit mining operations 2006 Regulatory approval of open pit mining operations 2006 Newmont Acquired Newcrest interest in BGMJV 2009 Acquired remaining interest in Boddington from AngloGold Ashanti. Commercial production 2012 Evaluated combining the North and South Wandoo open pits to extend mine life 2012 Project receives interim regulatory approval 2015 Life-of-mine extension project receives regulatory approvals Cutback S05A started 2016 Highest record gold production in a year (813 koz) Reached cumulative 5 Moz gold produced 2018 Mill reached name plate capacity of 40 Mt/a Cutback S09A started 2019 D6 water storage reservoir receives regulatory approvals Cutback N03 completed Cutback S04 completed Tonnage mined since 2007 reaches 1 Bt 2020 Mineral reserve addition to the North Pit Board approval for autonomous haul system implementation 2021 Mineral resource addition to the North Pit (N05E) Full autonomous truck fleet roll out on October 5, 2021 D6 water storage reservoir construction completed 2023 Cut-back on N05E commenced Boddington Operations Western Australia Technical Report Summary Date: February 2026 Page 5-3 Year Company Note 2024 11WD expansion completed Mineral reserve addition to the North Pit (N05E) Disturbance footprint amendments for F1/F3 tailings facility to 750 Mt approved 2025 Mining Act and license amendments for F1/F3 tailings facility to 750 Mt approved Updated triennial mine closure plan approved Boddington Operations Western Australia Technical Report Summary Date: February 2026 Page 6-1 6.0 GEOLOGICAL SETTING, MINERALIZATION, AND DEPOSIT 6.1 Deposit Type The deposit style is still somewhat controversial. Features consistent with porphyry-style mineralization, classic orogenic shear zones, and intrusion-related gold–copper–bismuth mineralization, are all recognized, giving rise to a variety of genetic interpretations. Boddington does not fit any classic Archean orogenic gold deposit model, having a general lack of quartz veins and iron carbonate alteration, a copper ± molybdenum ± bismuth association, zoned geochemical anomalism, and evidence of high-temperature, saline, ore-forming fluids. Detailed petrographic, geochemical and melt inclusion studies suggest a late stage ~2,612 Ma, monzogranite intrusion as one of the principal sources of the mineralizing fluids. However, there is also local evidence for older, perhaps proto-ore, porphyry-style copper ± gold in the dioritic intrusions and patchy, locally high-grade, orogenic-style gold mineralization associated with enclosing shear zones and brittle-style deformation, which was focused on the relatively competent dioritic intrusions (Turner et al., 2020). 6.2 Regional Geology The Boddington deposit is hosted within the Wells Formation in the Saddleback Greenstone Belt, which lies in the southeastern corner of the Archaean Yilgarn Craton (Figure 6-1). The Saddleback Greenstone Belt comprises a steeply-dipping and extensively faulted sequence of sedimentary, felsic to mafic volcanic and pyroclastic rocks that were metamorphosed to greenschist–amphibolite facies. The belt is approximately 50 km long, 8 km wide, and is surrounded by granitic and gneissic rocks. Age dates range from 2,715–2,690 Ma. The Saddleback Greenstone Belt was subdivided into three formations (Wilde, 1976; Figure 6-2). These formations include: • Hotham Formation: Metasedimentary rocks; restricted to the southwestern part of the Saddleback Greenstone Belt; • Wells Formation: Felsic to intermediate volcanic rocks and associated granitoid intrusions. This formation is the main host to economic mineralization at Boddington; • Marradong Formation: Meta-basaltic lavas and related doleritic/gabbroic intrusions. This formation includes a significant number of ultramafic intrusions in the northern half of the Saddleback Greenstone Belt. These units are cut by at least three generations of Proterozoic dolerite dykes. The greenstones were emplaced in an island arc setting. Ductile deformation followed, then a second period of supracrustal deposition, again probably in an island arc setting. This second phase was accompanied by coeval granodiorite–tonalite intrusion. Greenschist facies metamorphism followed, and all rocks were affected by brittle–ductile faults. A late monzogranite intrudes the greenstone belt just east of the mine area and is attributed to melting of mid-crustal rocks in an intraplate setting. Boddington Operations Western Australia Technical Report Summary Date: February 2026 Page 6-2 Figure 6-1: Regional Geology Setting Note: Figure from Turner et al., (2020).


Boddington Operations Western Australia Technical Report Summary Date: February 2026 Page 6-3 Figure 6-2: Regional Geology Map Note: Figure prepared by Newmont, 2022. Boddington Operations Western Australia Technical Report Summary Date: February 2026 Page 6-4 6.3 Local Geology The Wells Formation within the greenstone belt is informally divided into three packages (Figure 6-3). The packages consist of: • ‘Lower’ Wells Formation: mixed package of intermediate andesites and diorites with mafic basalts and dolerites; • ‘Main or Central’ Wells Formation: volcanic andesites and intrusive diorites; favorable mineralization host; • ‘Upper’ Wells Formation: predominantly mafic package of basalts and dolerites with minor lenses of intermediate and metasedimentary rock types. Several structures were identified that are controlling elements on the localization and form of mineralization, these being: • Northeast-striking fault corridors, which appear to compartmentalize the deposit. These structures appear to have offset favorable host rocks pre-mineralization; • Intersection of late-stage faults with early ductile quartz–sericite shear zones; • Intersection of west–northwest or northwest-trending faults with structurally-favorable lithologies; Late brittle–ductile west–northwest- or northwest-trending faults that have subvertical dips, which show elevated mineral abundances, and mineralization-related alteration assemblages Boddington Operations Western Australia Technical Report Summary Date: February 2026 Page 6-5 Figure 6-3: Stratigraphic Column Schematic Note: Figure prepared by Newmont, 2021; modified from Turner et al. (2020). Boddington Operations Western Australia Technical Report Summary Date: February 2026 Page 6-6 6.4 Deposit Geology The Boddington deposit lies within a 6 km strike length of the Wells Formation. For descriptive purposes the deposit is subdivided at approximately 12,200 N into two main centers of bedrock mineralization, referred to as Wandoo North (North Pit) and Wandoo South (South Pit). The deposit area geology is shown in Figure 6-4 (south pit) and Figure 6-5 (north pit, with cross- sections provided as Figure 6-6 (south pit) and Figure 6-7 (north pit). Figure 6-4: Geology Map, South Pit Note: Figure prepared by Newmont, 2023. Section line shows the location of Figure 6-6


Boddington Operations Western Australia Technical Report Summary Date: February 2026 Page 6-7 Figure 6-5: Geology Map, North Pit Note: Figure prepared by Newmont, 2023. Section line shows the location of Figure 6-7. Boddington Operations Western Australia Technical Report Summary Date: February 2026 Page 6-8 Figure 6-6: Geological Cross-Section, South Pit Note: Figure prepared by Newmont, 2023. Boddington Operations Western Australia Technical Report Summary Date: February 2026 Page 6-9 Figure 6-7: Geological Cross-Section, North Pit Note: Figure prepared by Newmont, 2023. Boddington Operations Western Australia Technical Report Summary Date: February 2026 Page 6-10 6.4.1 Lithologies Most of the primary mineralization at Boddington is hosted within intermediate to felsic intrusive, volcanic, and volcano-sedimentary rocks, with approximate dimensions of 9,000–11,000 mE; 8,500–14,500 mN; and -675–324 mRL. The deepest mineralization intercept to date is at approximately 1,219 m. The volcanic rocks are dominated by dacites and andesites. The Wells Formation is intruded by at least three magmatic suites: • A suite of quartz-feldspar-phyric diorite, porphyritic diorite, and microdiorite intrusions (Diorite suite) which are spatially linked to the bulk of the Au-Cu mineralization. These were emplaced between 2,714 and 2,691 Ma (Roth, 1992; Allibone et al., 1998; McCuaig and Behn, 1998); • A separate suite of granodiorite-quartz diorite-tonalite intrusions (Eastern suite), which intrude the Marradong and Wells Formations, is dated at ~2,675 Ma (Allibone et al., 1998); • The “Late Granite” (Wourahming monzogranite) suite is the final intrusive event at ~2,612 Ma (Turner et al., 2020). The N05 extended layback, at North Pit, is dominated by diorites, with lesser fragmental volcanic rocks. The diorites at North Pit are mainly porphyritic and generally more felsic compared to the predominantly aphyric diorites of South Pit. A suite of rhyodacitic porphyries are identified at North Pit, but is rarely observed at South Pit. The South Pit is centered on a composite diorite stock, the Central Diorite, which has a known strike length of approximately 1,200 m and thicknesses varying from 300–600 m. The southern portion of the Central Diorite strikes north, and dips subvertically and steeply to the west, with an apparent southerly plunge. To the north, the strike of the diorite changes from north to northwest, following the orientation of a transecting dolerite dike. The dip changes from westerly, to subvertical, to steeply to the southwest. The diorite is in contact with three volcanic units: • Southern volcanic unit: sequence of porphyritic volcanic rocks in the south and west; • Northern volcanic unit: sequence of tuffaceous volcanic rocks to the northwest; • Eastern volcanic unit: characterized by aggregated clusters of plagioclase. Separated from the Central Diorite by the Eastern Shear Zone, a north-striking, steeply west-dipping brittle, ductile tectonic feature. Thin units of fragmental volcaniclastic rocks consisting of angular to well-rounded diorite and andesite clasts ranging from fine ash to agglomerate sizes are common within and around the diorite stock. A series of fine-grained microdiorite dykes, ranging from a few centimeters to several meters wide, cross-cuts andesite, diorite, and fragmental lithologies. A suite of Proterozoic dolerite dykes with three prominent orientations cross-cuts the entire mine sequence, but does not host any significant mineralization.


Boddington Operations Western Australia Technical Report Summary Date: February 2026 Page 6-11 6.4.2 Structure and Alteration The following structural/alteration events were identified at Boddington: • Early (pre-deformation) albite and biotite–silica alteration associated with the dioritic intrusions was interpreted by Roth (1992) to signify potassic alteration (Turner et al., 2020); • D1–D2 ductile shearing was accompanied by silica–sericite–pyrite ± arsenopyrite alteration. Lacks significant gold–copper mineralization. Formed north–south-striking sub-vertical to east-dipping broad ductile shear zones; • D3 northeast-trending ductile shearing produced mylonite zones with silica–albite–biotite– pyrite alteration. Associated with development of massive quartz veins in D2 shear zones; • D4 northwest-trending, brittle-ductile deformation. Late D4 clinozoisite–quartz–chlorite– sulfide veins commonly impart a fine fracture-fill network or mesh texture to the rocks and are generally associated with the bulk of the low-grade gold–copper mineralization. In addition, late D4 actinolite–sulfide veins have a narrow selvage of phlogopite–clinozoisite or quartz–albite, and are associated with zones of higher grade gold and copper (Turner et al., 2020). 6.4.3 Weathering The laterite zone consists of 1–10 m of topsoil and loose gravel, underlain by 1–2 m of ferruginous duricrust, and a basal zone of 1–10 m of gibbsitic bauxite with goethite, hematite, and minor kaolinite. The saprolite zone, 25–80 m thick, typically consists of mottled and ferruginous kaolinitic clays, with preserved rock textures. The saprock zone includes smectite clays, with rock fragments and well preserved textures. The saprock to bedrock transition typically occurs over a few meters. 6.4.4 Mineralization Two mineralization stages were recognized. The earliest phase consists of widespread silica– biotite alteration and complex quartz + albite + molybdenite ± muscovite ± clinozoisite ± chalcopyrite veins, all of which are variably deformed by ductile shear zones. The second, major, alteration stage cross-cuts the first, and comprises: • Quartz + albite + molybdenite ± muscovite ± biotite ± fluorite ± clinozoisite ± chalcopyrite veining; • Clinozoisite + chalcopyrite + pyrrhotite + quartz + chlorite veins that host low-grade gold– copper mineralization; • Actinolite + chalcopyrite + pyrrhotite ± quartz, carbonate + biotite veins that host high-grade mineralization. Gold in the laterite zones occurs in association with iron and aluminum hydroxides. Gold in the saprolite is hosted in primary quartz veins, in clays immediately adjacent to mineralized quartz veins, and in secondary, shallow-dipping, goethitic horizons. Saprock mineralization reflects the mineralization distribution in the underlying bedrock. Boddington Operations Western Australia Technical Report Summary Date: February 2026 Page 6-12 Bedrock gold mineralization is hosted in veins, lenses and stockworks. Chalcopyrite and pyrrhotite the dominant sulfides, with lesser pyrite, sphalerite, cubanite, cobaltite, arsenopyrite, pentlandite, covellite, bismuthinite, digenite, marcasite and galena. Quartz–albite–sulfide veins with coarse molybdenum, a dominant control for molybdenite distribution within the deposit, are found in both the Wandoo North and South areas but are dominant in the South Pit. Non-mineralized, thin felsic and intensely epidote-altered lithologies are seen in the Wandoo North area but are not reported from the South Pit. Figure 6-8 to Figure 6-13 are plan and cross section images at the N05, S05A/B and S09A pits displaying gold mineralization trends in blast hole data and exploration drill hole orientations. Boddington Operations Western Australia Technical Report Summary Date: February 2026 Page 6-13 Figure 6-8: North Pit (N05) Plan View Note: Figure prepared by Newmont, 2025. Image at 150 m RL. Section line shows the location of Figure 6-9. N Boddington Operations Western Australia Technical Report Summary Date: February 2026 Page 6-14 Figure 6-9: North Pit (N05) Section View Note: Figure prepared by Newmont, 2025. Section line at 13,100mN


Boddington Operations Western Australia Technical Report Summary Date: February 2026 Page 6-15 Figure 6-10: S05A/B Pit, Plan View Note: Figure prepared by Newmont, 2025. Image at 150 mRL. Section line shows the location of Figure 6-11. Boddington Operations Western Australia Technical Report Summary Date: February 2026 Page 6-16 Figure 6-11: S05A Pit, Section View Note: Figure prepared by Newmont, 2025. Section line at 10,950mN Boddington Operations Western Australia Technical Report Summary Date: February 2026 Page 6-17 Figure 6-12: S09A Pit, Plan View Note: Figure prepared by Newmont, 2025. Image at 100 m RL. Section line shows the location of Figure 6-13. N Boddington Operations Western Australia Technical Report Summary Date: February 2026 Page 6-18 Figure 6-13: S09A Pit, Section View Note: Figure prepared by Newmont, 2025. Section line at 9,300mN


Boddington Operations Western Australia Technical Report Summary Date: February 2026 Page 7-1 7.0 EXPLORATION 7.1 Exploration 7.1.1 Grids and Surveys Mining operations use a mine grid. The local mine grid was required for two reasons: • Geological: to rotate the north orientation by approximately 40º so that the grid would align with the geology and topography of the area. Initial outcrops were running along a strike of 320º; • Survey: to create a false easting and northing at the origin of the site (10000E and 10000N). This allows a simplified coordinate system to be used and creates a grid with a scale factor of exactly 1, so there are no adjustments to any distances measured. The grid was created from a calibration using the Map Grid of Australia Datum (MGA94, Zone 50). The vertical datum remained the same with the Australian Height Datum (AHD) used with reference to the Ausgeoid09. RL 0 for this datum is mean sea level. The topographic surface used to delimit block models is constructed from an as-mined surveyed pickup that is updated on a monthly basis. 7.1.2 Geological Mapping Very limited amount of bedrock exposure in the Project area restricted surface mapping, while most geological mapping was derived from logging drill core and drill chip samples. Structural mapping is routinely completed of highwalls by the geotechnical department. The mine geology department routinely completes blast hole and highwall mapping, the mapping focuses on dolerite and oxide contacts and major structures. During 2020, a consultant was engaged to complete a review on structural controls on mineralization in the South Pit and exploration drill hole orientations. A third-party consultant reviewed blast hole and core data and completed targeted highwall mapping during his investigation. The primary focus of the review was S09A. The study concluded that the exploration drill hole orientation was sub-optimal to the main mineralization trend. This observation was accounted for in subsequent resource model updates. Drill hole orientation in S05A was considered to be acceptable. During 2022–2023, the same consultant was engaged to review structural controls on the mineralization, focusing around the structures that terminate grade. To support the investigation historical documentation was reviewed, current assaying and geology data were reviewed and relogging of core for the south and north pits was completed. The study found that most of the major structures mapped within the pit are post-mineral faults with no significant grade trends along them. The western shear a major grade break was identified as a sheared zone between intermediate volcanics to the east and barren strongly deformed meta-sedimentary rocks on the west. Identified waste zones within the N05 cutback were found to be controlled by lithology with the upper waste zone identified as a deformed meta-siltstone and the lower as a quartz-eye Boddington Operations Western Australia Technical Report Summary Date: February 2026 Page 7-2 rhyolite sill. The major gold grade clusters in southern Diorite Deeps were associated with dense networks of fine veinlets and fractures. 7.1.3 Geochemistry Boddington was discovered in 1980 by two surface traverses which collected lateritic samples across the Greenstone Belt in an area of geochemical anomalism identified by the GSWA (1978). Geochemical sampling was completed as part of the initial, first-pass exploration program, and was supplemented by data obtained from drilling and mining operations. Samples collected during early programs included stream sediment samples (bulk-leach extractable gold or BLEG), soil (mobile metal ion or MMI) samples and rock chip samples. Later, samples were collected using Newmont’s proprietary deep sensing geochemistry approach. After the initial discovery of Boddington, soil samples were collected on grids ranging from 50 x 100 m out to 200 x 200 m over regional areas of the Saddleback Greenstone Belt. Geochemical surveys using Newmont’s proprietary deep sensing geochemistry approach were collected over the entire greenstone belt to a minimum spacing of 50 x 200 m, with the last samples collected in 2025. The results will be used for exploration target generation within the Saddleback Greenstone Belt. 7.1.4 Geophysics Airborne and ground geophysical surveys were completed as part of initial and greenstone-belt- wide exploration activities (Figure 7-2 and Table 7-1). To date, geophysics at the Boddington Gold Mine and surrounding area has consisted of aeromagnetic/radiometric surveys, test surface time-domain electromagnetic (TDEM) and induced polarization/resistivity surveys, regional and semi-detailed gravity surveys, mise-a-la- masse survey, downhole TDEM surveying wireline logging of selected deep holes. The aeromagnetic and radiometric data are primarily of use in mapping lithology and structure. Geological noise in the form of numerous dolerite dykes and what appears to be maghemite in the laterites makes interpretation of the magnetics somewhat problematic. There are no magnetic minerals associated with the mineralization. The regional gravity broadly maps out the ultramafic/mafic units within, and the extent of, the Saddleback Greenstone Belt. Boddington Operations Western Australia Technical Report Summary Date: February 2026 Page 7-3 Figure 7-1: Gravity Image Note: Figure prepared by Newmont 2021 Boddington Operations Western Australia Technical Report Summary Date: February 2026 Page 7-4 Table 7-1: Geophysical Surveys Survey Type Date Comment Airborne Aeromagnetic 1982 250 m and 500 m line spacing, 100 m flying height. Aeromagnetic 1989 100 m and 250 m line spacing, 80 m flying height. Aeromagnetic 1993 3,220 line km at 50 m and 100 m line spacing, 50 m flying height. Aeromagnetic 1996 8,290 line km at 50 m and 100 m line spacing, 60 m flying height. Gravity 2020 2,184 line km at 200 m line spacing, 80 m flying height. Ground Gravity 1993 to 2008 5,243 stations with varying station spacing in five separate data collection campaigns, comprising 3,030 regional gravity stations and 2,213 detailed stations. IP 1999 2.1 km of dipole-dipole, 100 m electrode spacing. 0.36 km2 coverage of gradient array. TDEM 1999 Fixed loop–Jarrah–13500N–14300N, 9800E–11000E; Moving loop– Jarrah–13550N–13750N, 10000E–11000E; Fixed loop–Mallee– 12200N–13000N, 11400E, 12125E; Moving loop–Mallee–12450N and 12850N, 11400E–12200E and 11400E–12000E. Wireline Logging 2000 Natural gamma, magnetic susceptibility, resistivity, EM conductivity. Holes logged: WBD12500-008, 300 m; WBD12770-003, 294 m; WBD13985-002, 737 m; WBD13485-001, 880 m; WBD13365-001, 819 m. Drill hole TDEM 2001 WBD12770, WBD13080, WBD13485, WBD13365. MLAM 2001 Three lines surveyed; electrodes at WBD12770–120 m; WBD12770–246 m; WBD13080–312 m. Area of the survey encompassed by 9400E–9800E, 12500N–13300N, approximately 0.24 km2. MIMDAS 2004 to 2006 97.5 line km of data collection. 50 m and 100 m dipole spacing and 175–200 m line separation. Completed 10 km at Conveyor, 12.5 km at Hume Tank; 6 km at Eastern Southern Diorite Deeps and 6 km at South Southern Diorite Deeps; 12 km plant site and 12.5 km South Southern Diorite Deeps; 38.4 km WRSFs. SAM 2012 Total area of coverage approximately 0.55 square kilometers at 25 m line spacing. The area surveyed represented 25 line-kilometers of traverses. TDEM 2012 Two fixed loop, 200 m by 200 m surveys with 4 and 5 traverses, respectively, and a smaller vertical loop 4 m by 6 m with 3 traverses were completed. GAIP 2023 71 line km at 300 m line spacing over 26 lines between 1,350 m and 3,750 m in length. 150 m receiver electrode dipole spacing and 300 m line spacing. Line orientation 047-227. Transmitter electrode spacing 10 km. IP 2024 Four pole-dipole IP survey lines between 2.7 km and 3.1 km in length. 100 m electrode dipole spacing. Single line east–west orientation and three lines in a northeast–southwest orientation.


Boddington Operations Western Australia Technical Report Summary Date: February 2026 Page 7-5 Survey Type Date Comment IP 2025 Five lines of dipole-dipole IP between 2 km and 2.3 km line length surveyed. 150 m electrode and transmitter electrode dipole spacing with 200 m line spacing. Line orientation 055-235. Note: MIMDAS = Mt. Isa Mining Distributed Acquisition System; IP = induced polarization; TDEM = time-domain electromagnetic; WRSF = waste rock storage facility. The laterite-hosted gold mineralization does not have associated with it any other mineralization or alteration that maybe detectable or mappable using geophysical techniques, hence is not amenable to geophysical exploration. The downhole wireline logs indicate resistivity lows and EM conductivity highs associated with primary mineralization. These are inferred to be due to presence of sulfides and or the development of secondary porosity associated with faults. The mise-a-la-masse clearly indicates that mineralization at one prospect, Blob/Son of Blob, is detectable using downhole to surface direct current electrical techniques. The downhole transient electromagnetic surveys indicate these zones are not sufficiently conductive to produce a response to transient electromagnetic techniques. The induced polarization tests at the selected prospect, Jarrah, were contaminated by the presence of powerlines and fences, and invalidated the results. However, there is enough evidence by way of the presence of disseminated sulfides associated with higher-grade primary mineralization to infer it would respond to this technique. Geophysics is used in conjunction with other geological datasets to develop exploration targets in Newmont’s tenement package. 7.1.5 Petrology, Mineralogy, and Research Studies Since 1980, a number of structural, petrology, mineralogy, lithogeochemical and research studies were completed on the Boddington Operations. Typically, petrological, and mineralogical studies were completed in support of metallurgical investigations to determine the size, location and minerals associated with gold particles. Transmitted and reflected light petrology, X-ray detection, X-ray fluorescence, scanning electron microscopy, panning, and fluid inclusion thermometry were conducted to learn more about the metal paragenesis, gold-bearing species, and conditions of formation. Multi-element studies were used on drill core to provide multi-element data to support interpretative multi-element geochemical models. Three honors theses, two masters theses and one doctoral thesis were completed on deposit aspects. A second doctoral study is currently being completed in association with the University of Western Australia. The study involves systematically characterizing the compositions and ages of granitic rocks and mineralization to determine which magmatic suite(s) was the primary source of gold-rich mineralization. Initial results highlight the favorable nature of particular dioritic intrusive rocks, with additional work aimed at demonstrating direct links with the main mineralization phase. Boddington Operations Western Australia Technical Report Summary Date: February 2026 Page 7-6 7.1.6 Qualified Person’s Interpretation of the Exploration Information The Saddleback Greenstone Belt has been extensively explored for over 50 years, and a considerable information database has developed as a result of both exploration and mining activities. The primary exploration method is core drilling and assay collection. However, advancements in geophysics and geochemistry, together with regional geological and structural interpretations have improved the amount and quality of data that can be used for exploration vectoring and geological modelling. The geophysical and geochemical information is integrated with the drill hole database to improve deposit model interpretations. 7.1.7 Exploration Potential The Saddleback Greenstone Belt was discovered in the late 1970s and therefore is relatively ‘young’ in comparison to mining and exploration of other greenstone belts in the Yilgarn Craton. Exploration in the Saddleback Greenstone Belt in terms of an ability to prioritize anomalies and prospects, was limited by the level of understanding in respect of the geology, structure, and the relationships these have with geochemistry, regolith/landform evolution, and geophysics. There is limited outcrop of basement lithologies throughout the greenstone belt. Aspects of the geology were covered by numerous investigations, but virtually all of these have focused on the Boddington gold deposit and immediate surrounds. Exploration historically has focused on exploring for both ‘Boddington-style’ and ‘orogenic’ systems as it was documented that the Boddington deposit is likely a hybrid hydrothermal systems with characteristics of both, and also intrusion related characteristics. Outside the mine, there is evidence of orogenic gold veins and intermediates hosting actinolite–clinozoisite–sulfide mineralization. More recently, exploration was re-invigorated throughout the greenstone belt by Newmont with the inclusion of new district scale datasets, including an airborne gravity survey flown over the Saddleback Greenstone Belt in 2020 and the district-scale deep sensing geochemistry program completed in 2020–2025. The combination of geophysics and surface geochemistry to assist with understanding what lies beneath the regolith has aided in developing the geological framework of the Saddleback Greenstone Belt. The datasets are assisting with recognizing new belt-scale lineaments and felsic intrusions, similar to the monzogranite possibly associated with gold mineralization at Boddington, which could host additional Boddington-style mineralization. The current LOM cutbacks are constrained by drilling, and from 2025 exploration has increased the focus on near-mine targets to better define the extents of the mineralization and improve geological understanding. Boddington Operations Western Australia Technical Report Summary Date: February 2026 Page 7-7 7.2 Drilling 7.2.1 Overview 7.2.1.1 Drilling on Property Approximately 164,827 drill holes were completed by December 31, 2025, for about 3,966 km of drilling as summarized in Table 7-2. Drill methods included core, reverse circulation (RC), aircore (AC), rotary air blast (RAB) and vacuum. Drilling that supports the 2025 mineral resource and mineral reserve estimates consists of core and RC drill holes, and totals 7,720 drill holes for 1,529 km (Table 7-3). Drill collar locations are shown on a Project-basis in Figure 7-2 and Figure 7-3 and the collars of those drill holes used in mineral resource estimation are shown in Figure 7-4. Table 7-2: Property Drill Summary Table Drill Type Number of Drill Holes Drill Meters Bore 13 1,233 Unknown 78 1,705 Aircore 22,351 883,175 Vacuum 15,021 127,226 Blast 56,252 241,261 Core 4,066 1,180,479 Geotechnical 387 15,646 Hammer (RC) 4,553 487,635 RAB 2,083 69,306 Underground 448 29,786 Grade control 57,624 899,050 Piezometer 92 4,205 Unknown 1,859 24,924 Total 164,827 3,965,632 Note: Metreage has been rounded to the nearest meter; totals may not sum due to rounding. Boddington Operations Western Australia Technical Report Summary Date: February 2026 Page 7-8 Table 7-3: Drill Summary Table Supporting Mineral Resource Estimates Drill Type Number of Drill Holes Drill Meters Core 3,713 1,120,236 Hammer (RC) 3,974 401,281 Geotechnical (core) 33 7,908 Total 7,720 1,529,425 Note: Metreage has been rounded to the nearest meter; totals may not sum due to rounding. Figure 7-2: Regional Drill Collar Location Plan Note: Figure prepared by Newmont, 2025. N


Boddington Operations Western Australia Technical Report Summary Date: February 2026 Page 7-9 Figure 7-3: Regional Drill Collar Location Plan in Operations Vicinity Note: Figure prepared by Newmont, 2025. N Boddington Operations Western Australia Technical Report Summary Date: February 2026 Page 7-10 Figure 7-4: Drill Collar Location Plan for Drilling Supporting Mineral Resource Estimates Note: Figure prepared by Newmont, 2025. N Boddington Operations Western Australia Technical Report Summary Date: February 2026 Page 7-11 7.2.1.2 Drilling Excluded For Estimation Purposes Drilling excluded from the resource estimate largely comprises historical low-quality holes, grade control drilling from historic operations, and drilling related to the bauxite deposits and operations. Most excluded holes are short, within the oxide zone, and do not intersect the fresh rock that is the focus of modern gold operations. 7.2.1.3 Drilling Since Database Close Out Date The closeout date for the data supporting the Boddington mineral resource and mineral reserve estimates was June 5, 2024. Since the database closeout, 64 holes have been completed for 26,415 m as at December 31, 2025. Drill holes completed were a combination of resource infill, exploration, and geotechnical holes. The breakdown for each type is shown in Table 7-4, while the drill hole locations are shown on Figure 7-5. Table 7-4: Drill Summary of Drilling Completed Post Database Close-out Date Drill Type Number of Holes Drill Meters Exploration Core drilling 10 2,535 Definition Core drilling 32 9,254 Geotech (Core) drilling 22 14,625 Total 64 26,415 Boddington Operations Western Australia Technical Report Summary Date: February 2026 Page 7-12 Figure 7-5: Drilling Since Database Close Out Date to December 31, 2025. Note: Figure prepared by Newmont, 2025.


Boddington Operations Western Australia Technical Report Summary Date: February 2026 Page 7-13 7.2.2 Drill Methods Vacuum, RAB and aircore drilling were primarily used as a first-pass evaluation tool of soil sample anomalies to bedrock. RC drilling was used as a mineral resource delineation tool from Project inception to 2000, and a mineral reserves infill tool from 2009–2021. Infill RC drilling programs are currently used to increase confidence ahead of mining. Core drilling is used for exploration purposes and to support resource and reserve estimates, geotechnical investigations, hydrological campaigns, and to infill areas to increase geological confidence ahead of mining. Core drilling was completed in phases, from 1983 to the Report date. Drill holes classified as core-drilled include both RC pre-collared holes and those wholly drilled as cores. Drill holes classified as core-drilled include both RC pre-collared holes and those wholly drilled as cores. From 2025 core drill holes are primarily drilled at NQ3 size (45.1mm core diameter). Historically, HQ (63.5 mm), NQ (47.6 mm) and NQ2 (50.7 mm) sized drill core were completed, with the amount of HQ drilling being variable, depending on ground conditions, requirements for wedge holes and if the hole was required for later installation of piezometers. 7.2.3 Logging Historically, geological logging of core recorded lithology, alteration, mineralization, and structure in separate ‘passes’ into separate logging templates. Currently, lithology, structure and alteration are logged directly into the database via separate tables. Mineralization is incorporated into the alteration table. Vacuum drill holes were logged for lithology; RAB and aircore drill holes were also logged for alteration, veining, and mineralization. RC logging records lithology, alteration, and mineralization. 7.2.4 Recovery Recoveries were not routinely measured for RC drilling. Core recoveries are typically 100%. 7.2.5 Collar Surveys Historically aircore, RAB, core, and RC (hammer) holes were predominantly picked up by survey after they were drilled. Currently, core and RC collars are picked up the survey team using differential global positioning system (DGPS) instruments. Vacuum holes are pegged by survey before drilling and drilled within 1 m of the collar location peg. Boddington Operations Western Australia Technical Report Summary Date: February 2026 Page 7-14 7.2.6 Down Hole Surveys Not all RC drill holes were downhole surveyed. RC drill holes at the Hedges mine did not have downhole surveys, as was the case with BGMJV RC drill holes prior to 1995. RC drill holes from 1995–2007 were surveyed every 50 m using a single-shot Eastman camera. From 2020–2023, RC holes were surveyed every 30 m using a north-seeking gyroscope. Currently RC holes are surveyed using a continuous gyroscope at 5 m intervals. Historically, all core drill holes were typically downhole surveyed at 50 m intervals except where hole deviation requirements meant additional surveys for close monitoring during drilling. Surveying was conducted with a single-shot Eastman camera. During 2006, downhole surveys were routinely taken at 50 m intervals using a single-shot Eastman camera. In 2007, this was adjusted to 30 m intervals for the first part of the drill hole until a reasonable hole trace was established and then changed to 42 m intervals by the supervising geologist. A Reflex EZ digital camera was introduced in 2007, and used until 2017. From 2018–2023, core holes were surveyed using a north-seek gyroscope every 30 m. Currently core holes are surveyed using a continuous gyroscope at 5 m intervals. Quality assurance and quality control (QA/QC) readings were taken using a gyroscopic instrument by an independent business partner and compared to the original survey conducted by the drilling business partner. Historically, declination corrections were applied to the downhole survey data as required. The same declination correction factors were used for core and RC drilling. 7.2.7 Blast Hole Drilling Blast hole samples are currently used to construct the ore control models that are used for material classification. The approximately 6 kg blast hole samples are collected using a hand- held auger from blast hole cones. Blast holes are drilled for drill-and-blast purposes on a 5.2 x 5.2 m pattern in current cutbacks S05A/B for ore fragmentation and 5.5 x 5.5 m pattern in current cutback N05 for each shot on the pit floor. Blast holes are primarily drilled using Epiroc DML, PV235 and PV231 rigs with a hole diameter of 229 mm. Collar location are determined using a rig-based GPS system with collar locations reviewed by the survey department prior to use in ore control models. 7.2.8 Comment on Material Results and Interpretation The quantity and quality of the lithological, geotechnical, collar and down-hole survey data collected during the exploration and delineation drilling programs are sufficient to support mineral resource and mineral reserve estimation. The collected sample data adequately reflect deposit dimensions, true widths of mineralization, and the style of the deposits. Sampling is representative of the gold and copper grades in the deposit, reflecting areas of higher and lower grades. Drilling is normally perpendicular to the strike of the mineralization, but depending on the dip of the drill hole, and the dip of the mineralization, drill intercept widths are typically greater than true widths. Boddington Operations Western Australia Technical Report Summary Date: February 2026 Page 7-15 7.3 Hydrogeology 7.3.1 Sampling Methods and Laboratory Determinations Groundwater monitoring is completed via a network of monitoring bores and grouted multiple vibrating wire piezometer pore pressure monitoring bores, covering all areas of the active mine site (including waste rock dumps and tailings dam areas) and the regional areas peripheral to the mine operations. Monitoring data are collected for the following variables: • Phreatic water level; • Pore pressure; • Varied suites of water quality variables specific to the risk associated to the location of the monitoring bores (e.g., WRSFs, TSFs, process plants). The groundwater sampling is conducted in accordance with Australian New Zealand Standard AS/NZS 5667.11 with all laboratory samples sent to the National Association of Testing Authorities-certified laboratory, ALS, in Perth, Western Australia. ALS is independent of Newmont. Complimenting the groundwater monitoring programs are extensive surface water sampling programs, sampled in accordance with AS/NZS 5667.1, which are focused on regional, mining (WRSFs and drainage), TSFs, and processing areas. The surface water samples are sent to the same laboratory as the groundwater samples with monitoring of water quality variables specific to the potential risk associated with the sample location. 7.3.2 Comment on Results Pore pressures and groundwater levels are constantly monitored by use of a series of grouted multiple vibrating wire piezometer bores and standpipe groundwater monitoring bores. Site personnel routinely collect data, analyze time-series data on a monthly basis, and summarize findings in quarterly reports. As required, corporate subject matter experts and/or third party consultants undertake specialized hydrological/geotechnical evaluations. All surface and groundwater variables are stored in a cloud-based environmental database (Monitor Pro) along with other key environmental monitoring data (e.g., weather, air quality, and waste tracking). Hydrogeological data have supported mining operations, with gaps since October 2024 from 3G termination for vibrating wire piezometer telemetry being addressed around autonomous haulage system constraints. 7.3.3 Groundwater Models A numerical groundwater flow model (FEFLOW) was developed for the groundwater and hydrogeological system in the 34 Mile Brook catchment. Boddington Operations Western Australia Technical Report Summary Date: February 2026 Page 7-16 7.3.4 Water Balance A probabilistic water balance (Goldsim) model was developed for the site water balance. 7.4 Geotechnical Geotechnical data are collected where deemed necessary to provide additional information and to verify ground conditions in the vicinity of the open pits and WRSFs. Core drilling methods are used to collect soil and rock samples. Materials encountered are logged and samples are selected and recovered for laboratory testing where required. In addition to information gathered during core drilling, geological structures are mapped and documented continuously as mining progresses in the open pits. This is aided through use of geo-referenced photogrammetry and high-definition point cloud scanning that is used to create digital references of structures modelled. 7.4.1 Sampling Methods and Laboratory Determinations Laboratory testing includes a variety of tests used to derive engineering characteristics of soil and rock materials. Materials testing for strength and material characterizations include the following: • Triaxial; • Unconfined compressive strength; • Shear strength; • Tensile strength; • Soil/material classification tests. Newmont uses National Association of Testing Authorities-accredited laboratories to ensure adequate quality and integrity of testing procedures and results. A centralized database of material logs is maintained to enable orderly access to information. 7.4.2 Monitoring Geotechnical systems are implemented and maintained to monitor slope and pit wall deformation. These include the following systems: • Prism arrays monitored using robotic automated total stations; • Alarmed slope stability radars which continuously scan pit walls to pick up deformation and provide alerts where required. In addition to automated monitoring systems, routine visual checks and inspections are carried out across active mining areas. A rockfall register is maintained to track and document events that may occur within the open pits. This is updated as required during operations and through feedback from site personnel. Known details of seismic events are also recorded within site documentation.


Boddington Operations Western Australia Technical Report Summary Date: February 2026 Page 7-17 7.4.3 Comment on Results The geological hard rock setting at the Boddington Operations is well understood and displays consistency in the various open pits located on site. Additional testing continues to confirm the consistency of material strengths and parameters. Monitoring has successfully helped to provide advance notice of areas of differential deformation. Some variation of soil strengths is apparent in various locations in the vicinity of operational areas; the operation has taken actions accordingly where warranted. Where further information is required, additional data may be collected. To the Report date, the geotechnical data collection programs have provided data suitable for use in the mining operations, and have supported the assumptions used in the active pits. Boddington Operations Western Australia Technical Report Summary Date: February 2026 Page 8-1 8.0 SAMPLE PREPARATION, ANALYSES, AND SECURITY 8.1 Sampling Methods BLEG samples were collected from suitable drainages, as 2–5 kg samples, and placed in pre- numbered calico bags. The sample location was recorded, typically on aerial photographs. Soil samples were collected as 2 kg samples from 15–20 cm depths in the soil profile, a description recorded, then samples were placed in a pre-numbered calico bag. Rock chip samples were typically collected as 2–5 kg of grab samples from surface outcrops. Sample locations were recorded, together with a geological description. Vacuum samples were taken at intervals that varied from 0.5–1.0 m to provide a 150 g sample. RAB samples were collected at intervals ranging from 1–2 m to provide 1–2 kg of sample. Aircore samples were usually 2–5 kg in size and collected on 1–2 m intervals. Prior to 2008, RC samples were collected in plastic bags on 1 m intervals via a cyclone before sample reduction utilizing a riffle splitter. The samples were composited to 2 m intervals of 4– 6 kg. Since 2008, samples are collected on 2 m intervals in a drop box and split using cone splitters on the RC rigs. Drill core was sawn in half along an orientation line for sampling using either a manual core saw or an automatic core saw. The core was cut such that the orientation line was preserved. Typically, NQ core was sampled on 2 m intervals and HQ core sampled on 1 m intervals. More recently, NQ2 and NQ3 core was sampled on 1 m intervals and cut with automatic saws. Proterozoic dolerites were not completely sampled. Proterozoic dolerites were samples if the dolerite is <3 m in thickness, as 1 m samples interior to the margins of dolerites >3 m and in the presence of sulfide mineralization. Trenching machine spoil samples were taken from the side of the trench on 2 m spacings as designated by the supervising geologist as part of ore control of clay during the oxide mining phase in the 1980–1990 period. Currently, ore control models at Boddington are constructed using blast hole samples. Blast hole rigs drill a 229 mm diameter hole approximately 13.5 m deep to form an ~1.5 t cone of rock chips around the hole. This cone of rock chips is sampled using an auger bit connect to a battery- powered hand drill. An auger sample is taken by resting the auger three quarters the way up on the collar, angling the auger 40–60º towards the center then slowly drilling into the collar all the way to the base. The auger is then pushed straight up and slowly pulled out of the collar. The material from the collar will be caught on the flights of the auger bit, this material is spun off into a plastic bucket. This process is followed 6–10 times around the collar at evenly-spaced points until a 6–8 kg sample is collected. The sample is then tipped from the bucket into a pre-numbered and allocated sample bag. 8.2 Sample Security Methods Sample security at the Project has not historically been monitored. Sample collection from drill point to laboratory relies upon the fact that samples are either always attended to, or are stored in the locked on-site preparation facility, or are stored in a secure area prior to shipment to the external laboratory. Chain-of-custody procedures consist of filling out sample submittal forms to Boddington Operations Western Australia Technical Report Summary Date: February 2026 Page 8-2 be sent to the laboratory with sample shipments to ensure that all samples are received by the laboratory. 8.3 Density Determinations Historically, the Project’s basement in-situ bulk density determinations were collected on a 50 m x 50 m grid across each geological domain. Analabs, an independent analytical laboratory, undertook in-situ bulk density determinations using the immersion method. Downhole geophysical logging on four drill holes in 1995 and eight drill holes in 2000 confirmed the densities determined using the immersion method. Bulk density values ranged from 2.75 t/m3 in volcanic rocks to 3.00 t/m3 in the Proterozoic dolerites. A total of 4,285 bulk density samples were collected from resource definition and exploration drilling programs during 2006–2011. Samples were analyzed at Genalysis, which is independent of Newmont, using the immersion method. From 2011–2019, SG samples were taken at approximately 50–60 m intervals from drill core. From 2020 density sample frequency was changed to approximately 10 m intervals. The density is measured on site using the immersion method, and then 10% of the samples are sent to the Intertek laboratory to be checked. All data are stored in the acQuire database. 8.4 Analytical and Test Laboratories Historically, from 1983 to 2001, sample analysis was performed by several independent laboratories, including Classic Comlabs, Genalysis, Amdel, Bureau Veritas Kalassay, Analabs, Australian Assay Laboratories (AAL) in Perth, and AAL in Boddington. It is not known if the laboratories were certified at the time. The Boddington mine site laboratory, operational between 1985 and 2001, was owned by AAL from 1985 to December 1995. From December 1995–2001, the laboratory was owned and operated by Analabs. In 1995, the mine laboratory became ISO 9002 accredited. Approximately 80% of the pre-2001 analytical data was completed by the mine laboratory. From 2006 onward, routine analysis of samples collected during core drilling programs was undertaken at Intertek Genalysis in Perth. In 2006, Intertek Genalysis was accredited to ISO/IEC 17025, version 2005. UltraTrace Geoanalytical Laboratories (UltraTrace), Perth, and ALS Perth acted as the umpire laboratories. UltraTrace was part of the Amdel Laboratory group, now part of Bureau Veritas, and was accredited to ISO/IEC 17025. ALS Perth was accredited to ISO/IEC 17025 in 2005. From 2008 to January 2014, ore control and RC samples were sent to the Kalassay laboratory in Perth. Kalassay achieved ISO/IEC 17025 accreditation during 2010. UltraTrace and Kalassay were acquired by the Bureau Veritas group. Since February 2015, Intertek Genalysis has conducted assaying of blast hole and RC samples. Boddington Operations Western Australia Technical Report Summary Date: February 2026 Page 8-3 8.5 Sample Preparation Sample preparation is summarized in Table 8-1. Table 8-1: Sample Preparation Methods Laboratory Sample Type Preparation Procedure Boddington Mine Core Crushed to P95 passing 3 mm; pulverized to P95 passing 150 µm Intertek Genalysis Core, blast holes, RC Crushed to P90 passing 3 mm; pulverized to 95% passing minus 100 µm Ultratrace Core Crushed to 2.8 mm; pulverized to nominal 95% passing 90 µm Bureau Veritas Kalassay Blast holes and RC Crushed to nominal 95% passing 3 mm; pulverized to a nominal 95% passing 90 µm. 8.6 Analysis Analytical methods depended on the sample type and laboratory. Analytical methods are summarized in Table 8-2. Table 8-2: Analytical Methods Date/Method Note Geochemical samples Primarily analyzed using bulk-leach extractable gold methods. Trench, vacuum, aircore and RAB samples were Trench, vacuum, aircore and RAB samples Analyzed for gold by fire assay with an atomic absorption spectrophotometry (AAS) finish. Copper analysis was by either single acid digestion or three-acid digestion followed by AAS. RC and core samples, pre-2006 Gold by fire assay with either AAS or inductively-coupled plasma atomic emission spectroscopy (ICP-AES). Copper analysis was by either single acid digestion or three-acid digestion followed by AAS. Multi-element determination was not routinely performed prior to 2006, but rather performed on selected drill holes as part of detailed geological investigations. When used, the multi- element analytical suite requested typically consisted of silver, arsenic, bismuth, cerium, molybdenum, nickel, lead, antimony, titanium, tungsten, yttrium, zinc, and zirconium. Multi- element analysis was performed by Amdel in 2004, using ICP-MS and ICP-AES after triple- acid digestion. A second multi-element program was undertaken in 2007 by UltraTrace. RC and core samples, 2006 to Report date Fire assay gold with AAS or ICP optical emission spectroscopy (OES) finish on 50 g charge. Multi-element suite using four-acid digest with ICP OES–ICP mass spectrometry (MS) finish for copper, sulfur, arsenic, bismuth, and molybdenum, antimony, cadmium, and nickel. Cadmium and nickel were only performed on core samples. Molybdenum and antimony assays were discontinued in 2013 for RC holes . Bureau Veritas Kalassay used a fire assay method and AAS finish for RC samples between 2009–2014. 2021 to Report date Since 2021 in addition to the typical analytical suite a comprehensive multi-element analysis was performed at ALS Perth using ICP-MS or ICP-OES on one in five assays


Boddington Operations Western Australia Technical Report Summary Date: February 2026 Page 8-4 8.7 Quality Assurance and Quality Control Worsley established a formal QA/QC system in January 1989 that included review of laboratory performance using methods commissioned by Worsley as well as review of the laboratory’s internal systems. The principal monitoring system prior to June 1995 included internal round robins conducted by the BGMJV, which allowed comparison of the Boddington Laboratory against other laboratories and standards. Post June 1995, an updated internal laboratory monitoring system (‘C’ Class) was introduced that allowed electronic capture of quality control data and statistical analysis of results. Formal review of these data was undertaken on a month-by-month basis by BGMJV staff. A summary of the QA/QC history for the Project is provided in Table 8-3. Table 8-3: QA/QC History Date/Method Note Pre-1993 One standard reference material (standard) was run routinely with each batch of samples, blanks were run on an intermittent basis, and duplicates chosen on the basis that anomalous results were checked 1993–1998 One standard, one blank, and six duplicate samples were present in each fire assay batch of 50 samples 1998–2006 Each fire assay batch of 50 included two standards, one blank, two duplicates, and two replicates 2006–2018 Standards and blanks were submitted randomly in the sample stream prior to submission to the assay laboratory. The standards and blanks submitted were all commercially purchased, up until 2010 when Boddington started creating standards from mineralization within the mining area. 2018–2024 Standards were reviewed and created from Boddington material on an as needs basis. For RC samples, rig duplicates were taken at a frequency of one in 20. 2024 to Report date Duplicate core samples on a one in 50 frequency in near-mine drilling. Duplicate samples for the drill core were not taken historically, or during regional drilling. Umpire (check assays) Typically 5% of the pulps were sent to an umpire laboratory for checking. At the laboratory coarse and pulp duplicates were taken from one in 20 samples. Gold assays >3 g/t Au were routinely repeated by the laboratory. Laboratory standards were submitted into every assay batch and make up 5% of the samples being analyzed. 2008 to Report date, grade control The grade control QA/QC process has been in place since 2008. Standards, blanks, and field duplicates were preassigned to blastholes at a frequency of one in 40 for field duplicates and blanks and one in 20 for standards. Boddington Operations Western Australia Technical Report Summary Date: February 2026 Page 8-5 8.8 Database All drilling-related data are stored in a Microsoft SQL server database which supports multi-user access, using the acQuire software interface. The database is administered by a dedicated database manager. Survey, geological, topographical and assay data are uploaded in digital format to the database and were supplied in digital format since the early 1990s. Historical drill data were received in hard-copy format, and manually data-entered. All data are subject to verification checks prior to upload. Checks include coordinates outside the limits preset for that grid, geology, samples, and surveys beyond the end of hole depth in the collar table, that survey dips are restricted to be between 90 and -90 and assay data/sample ID checks. Data imported into the database must go through validation steps before being merged. The validation scripts are run on collar, survey, geology, and assay tables. 8.9 Qualified Person’s Opinion on Sample Preparation, Security, and Analytical Procedures The sample preparation, analysis, quality control, and security procedures used by the Boddington Operations have changed over time to meet evolving industry practices. Practices at the time the information was collected were industry-standard, and frequently were industry- leading practices. The Qualified Person is of the opinion that the sample preparation, analysis, quality control, and security procedures are sufficient to provide reliable data to support estimation of mineral resources and mineral reserves: • Drill collar data are typically verified prior to data entry into the database, by checking the drilled collar position against the planned collar position; • The sampling methods are acceptable, meet industry-standard practice, and are adequate for mineral resource and mineral reserves estimation and mine planning purposes; • The density determination procedure is consistent with industry-standard procedures. A check of the density values for lithologies across the different deposits indicates that there are no major variations in the density results; • The quality of the analytical data is reliable, and that sample preparation, analysis, and security are generally performed in accordance with exploration best practices and industry standards; • Newmont has a QA/QC program comprising blank, standard and duplicate samples. Newmont’s QA/QC submission rate meets industry-accepted standards of insertion rates. The QA/QC data support that there are no material issues with analytical precision or accuracy; • Verification is performed on all digitally-collected data on upload to the main database, and includes checks on surveys, collar co-ordinates, lithology, and assay data. The checks are appropriate, and consistent with industry standards. Boddington Operations Western Australia Technical Report Summary Date: February 2026 Page 9-1 9.0 DATA VERIFICATION 9.1 Internal Data Verification 9.1.1 Data Validation Newmont personnel regularly visit the laboratories that process Newmont samples to inspect sample preparation and analytical procedures. Observations not in conformity with Newmont procedures are recorded in Project files and communicated to the appropriate laboratory for corrective action to be taken. The database is checked using electronic data scripts and triggers. Newmont has conducted a number of internal data verification programs since obtaining its Project interest, which included the following reviews: • Database, including logging consistency, down hole survey, collar coordinate, and assay QA/QC data; • Sample assay bias investigations between core and RC samples; • Analytical repeatability reviews; • Check assay program results; • Geological procedures, resource models, and drill plans; • Sampling protocols, flow sheets, and data storage; • Trial mining and simulation studies. 9.1.2 Reviews and Audits Newmont conducts internal audits, termed Reserve and Resource Review or 3R audits, of all its operations. These audits focus on: • Reserves processes: geology and data collection; resource modelling; geotechnical; mine engineering (long term) for open pit and underground operations; mineral processing (development); sustainability and external relations; financial model; • Operations process: ore control; geotechnical and hydrogeology (operational); mine engineering (operational) for open pit and underground operations; mineral processing (operational); reconciliation. The reviews assess these areas in terms of risks to the contained metal content of the mineral resource and mineral reserve estimates, or opportunities to add to the estimated contained metal content. Findings are by definition areas of incorrect or inappropriate application of methodology or areas of non-compliance to the relevant internal Newmont standard (e.g., such as documents setting out the standards that are expected for aspects of technical services, environmental, Boddington Operations Western Australia Technical Report Summary Date: February 2026 Page 9-2 sustainability and governmental relations) or areas which are materially inconsistent with published Newmont guidelines (e.g., such as guidelines setting out the protocols and expectations for mineral resource and mineral reserve estimation and classification, mine engineering, geotechnical, mineral processing, and social and sustainability). The operation under review is expected to address findings based on the level of criticality assigned to each finding. The most recent Boddington Operations 3R audits were conducted in 2012, 2014, 2019, and 2022. The 2022 3R audit found that the Boddington Operations were generally adhering to Newmont’s internal standards and guidelines with respect to the estimation of mineral resources and mineral reserves. The review team identified no material issues with the mineral resource and mineral reserve estimation processes. Two moderate-impact issues were noted. One was that two of the pit walls had significant rock falls, which will require construction of catch berms. The second was that additional metallurgical testwork should be completed to support metal recovery assumptions in the mineral resource and mineral reserve statements for the area between the mineral resource and mineral reserve pit shell designs. The audit team made a number of recommendations for site-based improvements; however, none of these additional recommendations were considered critical to implement. 9.1.3 Mineral Resource and Mineral Reserve Estimates Newmont established a system of “layered responsibility” for documenting the information supporting the mineral resource and mineral reserve estimates, describing the methods used, and ensuring the validity of the estimates. The concept of a system of “layered responsibility” is that individuals at each level within the organization assume responsibility, through a sign-off or certification process, for the work relating to preparation of mineral resource and mineral reserve estimates that they are most actively involved in. Mineral reserve and mineral resource estimates are prepared and certified by QPs at the mine site level, and are subsequently reviewed by QPs in the Newmont-designated “region”, and finally by corporate QPs based in Newmont’s Denver head office. 9.1.4 Reconciliation Newmont staff perform a number of internal studies and reports in support of mineral resource and mineral reserve estimation for the Boddington Operations. These include reconciliation studies, mineability and dilution evaluations, investigations of grade discrepancies between model assumptions and probe data, drill hole density evaluations, long-range plan reviews, and mining studies to meet internal financing criteria for project advancement. 9.1.5 Subject Matter Expert Reviews The QP requested that information, conclusions, and recommendations presented in the body of this Report be reviewed by Newmont experts or experts retained by Newmont in each discipline area as a further level of data verification.


Boddington Operations Western Australia Technical Report Summary Date: February 2026 Page 9-3 Peer reviewers were requested to cross-check all numerical data, flag any data omissions or errors, review the manner in which the data were reported in the technical report summary, check the interpretations arising from the data as presented in the report, and were asked to review that the QP’s opinions stated as required in certain Report chapters were supported by the data and by Newmont’s future intentions and Project planning. Feedback from the subject matter experts was incorporated into the Report as required. 9.2 External Data Verification Data verification by external consultants or BGMJV partners in support of mine development and operations is summarized in Table 9-1. Table 9-1: External Data Verification Year Company Note 2000, 2001, 2002 Peter Stoker Audit of assay data 2001–2002 AngloGold Ashanti Audit of database and mineral resource estimates 2002 Golder, Newmont, and AngloGold Ashanti Review of resource models 2003 Golder Associates Pty Ltd (Golder) Audit of assay data, resource sensitivity study Quantitative Geoscience Audit of resource estimates BGMJV Audit of resource estimates and block model 2004 Golder Audit of resource model BGMJV Review of resource estimate and model comparisons Newcrest Review of resource estimate using alternative modelling interpretations BGMJV Sensitivity study using Newcrest alternate model 2005 Dr Dominique Francois-Bongarcon (Francois-Bongarcon) Review of sampling protocols and heterogeneity issues 2007 Francois-Bongarcon Review of assay data 2007, 2008 CS-2 Audit of resource estimates 2009 GeoSystems International Audit of resource estimates 2010 AMEC Americas Ltd Audit of resource estimates and block model 2017, 2018 Golder Audit of resource/reserve estimates, including mine planning, geotechnical and metallurgical aspects 2021 SRK Consulting (Australasia) Pty Ltd Review of ore (mineral) reserves Boddington Operations Western Australia Technical Report Summary Date: February 2026 Page 9-4 Many of the audits were conducted prior to the commencement of the current mining operation in 2009 to ensure that the best possible database, geological interpretations, block models, and resource estimates were available to support investment decisions. 9.3 Data Verification by Qualified Person The QP performed site visits as discussed in Chapter 2.4. Observations made during the visits, in conjunction with discussions with site-based technical staff also support the geological interpretations, and analytical and database quality. The QP’s personal inspection supports the use of the data in mineral resource and mineral reserve estimation, and in mine planning. The QP receives and reviews monthly reconciliation reports from the mine site. These reports include the industry standard reconciliation factors for tonnage, grade, and metal; F1 (reserve model compared to ore control model), F2 (mine delivered compared to mill received) and F3 (F1 x F2) along with other measures such as compliance of actual production to mine plan and polygon mining accuracy. The reconciliation factors are recorded monthly and reported in a quarterly control document. Through the review of these reconciliation factors the QP is able to ascertain the quality and accuracy of the data and its suitability for use in the assumptions underlying the mineral resource and mineral reserve estimates. 9.4 Qualified Person’s Opinion on Data Adequacy Data that were verified on upload to the database, checked using the layered responsibility protocols, and reviewed by subject matter experts are acceptable for use in mineral resource and mineral reserve estimation. Boddington Operations Western Australia Technical Report Summary Date: February 2026 Page 10-1 10.0 MINERAL PROCESSING AND METALLURGICAL TESTING 10.1 Introduction During feasibility-stage studies from 1997–2003, several programs of metallurgical testwork were completed on the Boddington deposit. These supported the initial mining phase. A second phase of testwork was conducted in 2008, and a third phase in 2017. The post-feasibility testwork was primarily conducted at AMMTEC in Perth, now ALS Metallurgy. 10.2 Test Laboratories ALS Metallurgy is an independent commercial metallurgical testing facility. There is no international standard of accreditation provided for metallurgical testing laboratories or metallurgical testing techniques. 10.3 Metallurgical Testwork Work completed included mineralogy; comminution and high-pressure grind–roll (HPGR) testwork; Bond ball mill, Bond rod mill work index, and abrasion index tests; flotation and leach testwork; locked cycle flotation tests; scavenger tail leach, cleaner scavenger tail leach tests; flotation tailings cyanidation testwork; determination of thickening and slurry pumping characteristics; rheology; tailings characterization; and oxygen addition. Copper concentrate samples were analyzed to provide a better understanding of the deleterious element content and to generate predictive models, based on feed grades, for use in mine scheduling. The testwork includes but is not limited to: • Head assay multi-element analysis; • Ore density; • Ore moisture; • Ore bulk density (loose and compacted); • Unconfined compressive strength; • Bond crusher work index; • Abrasion index; • Bond rod mill work index; • Bond ball mill work index; • JK drop weight; Boddington Operations Western Australia Technical Report Summary Date: February 2026 Page 10-2 • Mineralogical analysis; • Locked cycle flotation; • Large scale kinetic flotation; • Flash flotation; • Atmospheric and pressure cyanide leaching; • Carbon kinetics; • Gravity recoverable gold; • Thickening; • Rheology; • Slurry agitation; • Residue pumping; • Residue characterization. 10.4 Recovery Estimates Recovery models were developed using known ore parameters to predict plant recovery. In these models, the throughput rate is fixed and the grind size is allowed to vary with ore hardness, resulting in recovery differences in each of the eight geometallurgical domains. The recovery models are updated periodically as new information becomes available, such as observed plant performance or additional testwork. The last recovery model update occurred in 2025. The gold and copper recovery models for the mill are based on head grade. The average LOM gold recovery forecast is 85% and the forecast average LOM copper recovery is 81%. These forecasts do not include the application of recovery degradation to long-term stockpiles of medium-grade ore. Gold recovery is discounted by 3% and copper recovery is discounted by 9% to account for recovery degradation in the business plan. These degradation assumptions were verified by an ongoing stockpile oxidation testwork program. 10.5 Metallurgical Variability Samples selected for metallurgical testing during feasibility and development studies were representative of the various styles of mineralization within the different deposits. Samples were selected from a range of locations within the deposit zones. Sufficient samples were taken and tests were performed using sufficient sample mass for the respective tests undertaken.


Boddington Operations Western Australia Technical Report Summary Date: February 2026 Page 10-3 10.6 Deleterious Elements Since commissioning in 2009, the operation has actively managed the arsenic level in plant feed and, through concentrate blending techniques, controlled the level in copper concentrate shipments to below the penalty rate trigger, hence no penalties were incurred to the Report date. Bismuth is closely associated with gold in the Wandoo ores; however, so it has resulted in penalty levels being exceeded, particularly in the first two years of operation (2009–2011). Most of the high bismuth ores have been processed, resulting in very low to no penalty charges being incurred since 2012. Alumina remains the largest penalty element present in the copper concentrate, with shipments regularly exposed to a penalty adjustment. However, at 4–5% Al2O3 the levels are not far off the trigger point of 3% in most contracts and a modification to the process was made during Q1 2019 with the introduction of the cleaner scalper column which reduces the non-sulfide gangue (i.e., Al2O3) in the concentrate and improves the grade of the concentrate as a result. 10.7 Qualified Person’s Opinion on Data Adequacy The QP notes: • Metallurgical testwork completed on the Project is appropriate to establish acceptable processing for the different geometallurgical domains; • Subsequent production experience and focused investigations guided mill alterations and process changes; • Testwork was completed on mineralization that is typical of the deposit style. The testwork indicates that gold mineralization is often associated with silver as electrum, copper is primarily contained in chalcopyrite and cubanite, and the ore is primarily hosted within diorite and andesite rocks; • Testwork programs, both internal and external, continue to be performed to support current operations and potential improvements. From time to time, this may lead to requirements to adjust cut-off grades, modify the process flowsheet, or change reagent additions and plant parameters to meet concentrate quality, production, and economic targets; • The mill throughput and associated recovery factors are considered appropriate to support mineral resource and mineral reserve estimation, and mine planning; • The plant will produce variations in recovery due to the day-to-day changes in ore type or combinations of ore type being processed. These variations are expected to trend to the forecast recovery value for monthly or longer reporting periods. Boddington Operations Western Australia Technical Report Summary Date: February 2026 Page 11-1 11.0 MINERAL RESOURCE ESTIMATES 11.1 Introduction The close-out date for the sample database used in Mineral Resource estimation was 5 June 2024. The resource model close-out date was 27 September, 2024. Geological models were constructed by Boddington Operations personnel in Leapfrog, with resource estimates in Resource Modeling Solutions Platform, Vulcan, and Supervisor software. Block models were built with cell dimensions that were appropriate to the deposit style, and the mineralization orientation and dimensions. Selectivity during mining, mining method, equipment size, and bench height were also taken into account when determining parent cell size. 11.2 Exploratory Data Analysis Exploratory data analysis was completed to confirm the statistical configuration of gold and copper estimation domains. In addition, contact analysis was conducted to configure the sharing of data where required for estimation purposes across the contact(s) of adjoining domains. 11.3 Geological Models Models were built for: • Geology: dolerite lithology and weathering surfaces; gold, copper, sulfur, arsenic, molybdenum, and bismuth estimation domains; • Gold domains are constructed considering structure, alteration but are largely lithology and grade shells; • Copper: grade shell wireframes constructed by dividing the deposit into four regions based broadly on lithology and, within these regions interpolating high-grade (1,500 ppm) and medium-grade (750 ppm) grade shells; • In-situ bulk density; • Geotechnical: five domains in South Pit, six domains in North Pit; • Structural: four major structures across both the North and South Pits; • Acid rock drainage: net acid-producing potential estimated. The data used for the model construction were approved drill holes extracted from the acQuire database. Data were validated using database and Python validation tools as well as on-screen visualization checks. Issues identified during validation were corrected by the project geologist and re-uploaded to acQuire with assistance from the database administrator. A final extraction was made to incorporate the validated data into the geological modeling process. Boddington Operations Western Australia Technical Report Summary Date: February 2026 Page 11-2 11.4 Density Assignment In-situ bulk density (density) values were interpolated using ordinary kriging (OK) to provide block estimates when sufficient data were available. Domains that did not contain any in-situ bulk density data were assigned a mean value of 2.75 g/cm3. An in-situ bulk density of 3.00 g/cm3 was applied to all modelled dolerites. Weathered bulk density values were assigned to regions delineated by the various weathering products. 11.5 Composites All assay data were composited to 12 m lengths downhole to match the estimated block and bench height and broken on the start of each domain. Intervals <6 m were combined with adjacent longer intervals at drill hole ends. 11.6 Grade Capping/Outlier Restrictions Outlier high grades were statistically determined and grade capped to optimize estimation performance. Capping was defined via exploratory data analysis and applied on the composite data by estimation domain. High-grade cuts were applied to each of the gold, copper, arsenic, bismuth, molybdenum, and sulfur domains. In the case of gold, this initial global domain cap was used to calibrate a local cap, which was used in the final estimate. A high-yield restriction was used to restrict higher grades in areas of sparse drilling. 11.7 Variography Spatial variability of the grades for gold, copper, arsenic, bismuth, molybdenum, and sulfur was modeled through directional variography of capped 12 m composites. Blast hole data were used to inform definition of variogram profiles and directions in domains with production coverage. 11.8 Estimation/interpolation Methods Block models were constructed and estimated in Resource Modeling Solutions Platform for gold and Vulcan software for all other elements. The final block size used in the resource block model was a regularized size of 20 x 20 x 12 m to match the current selective mining unit. The model was constructed in the mine grid orientation with no additional rotation or sub-blocking applied. The blocks were coded for dolerite domains and weathering profile percentages to honor the dilution from dykes and oxidized units. Ordinary kriged estimates for gold, copper, sulfur, arsenic, molybdenum and bismuth and density were conducted in a separate block model with a parent block size of 20 x 20 x 12 m. Domains for each element were coded into these models. The estimation results were subsequently combined into the final block model. Boddington Operations Western Australia Technical Report Summary Date: February 2026 Page 11-3 The estimation methodology included the following: • Analysis to optimize the parameters used for sample searches, including minimum/maximum number of data, distance to samples, and number of data used per drill hole; • Domains treated as mix of hard, soft, and firm boundaries based on contact analysis; • Grade interpolations run as a single estimation pass defined by the variogram directions. Estimation results were reviewed to ensure no unassigned blocks within mining areas; • Block discretization of 4 x 4 x 2. Key parameters used in the kriged estimates are provided in Table 11-1. Table 11-1: Kriging Estimate Parameters Model Unit Value Minimum number of samples number 8 Maximum number of samples number 8 Maximum number of samples per drill hole number 2 Minimum number of drill holes number 4 Maximum number of drill holes number 8 Maximum number of composites per octant number None Estimate type — Single/multi pass Single large dolerite dilution % post processing % 10 High yield restriction range meters 35–70 Gold grade capping g/t Au 1–15 Dilution was applied by expanding the large dolerite volumes. No additional modifying factors were applied. 11.9 Validation Validation used Newmont-standard methods, including a combination of visual checks, swath plots, global statistical bias checks against input data, alternate estimation methods, and reconciliation with historical mine/plant performance. All models were independently peer reviewed to ensure consistency and standards required to support business and operations planning and public reporting of mineral resources and mineral reserves. Modeling methodologies applied were externally audited in early 2021 by third-party consultants SRK, and internally as part of a reserve and resource review in May 2022, with no material findings. The validation procedures indicated that the geology and resource models used are acceptable to support the mineral resource estimation.


Boddington Operations Western Australia Technical Report Summary Date: February 2026 Page 11-4 11.10 Confidence Classification of Mineral Resource Estimate 11.10.1 Mineral Resource Confidence Classification Resource classification parameters were based on the results of a 2021 drill hole spacing simulation study in accordance with Newmont standards. Mineral resource classification was undertaken based primarily on drill spacing and number of drill holes used in the estimate (Table 11-2). Table 11-2: Mineral Resource Confidence Classifications Confidence Category Search Configuration Nominal Drill Grid Measured 3 holes within average distance <27.5 m 35 x 35 m Indicated 3 holes within average <55 m 70 x 70 m Inferred 3 holes within average distance <82.5 m 105 x 105 m A quantitative assessment of geological risk was undertaken using Newmont-standard methods and applied on a block by block basis. Primary risks to resource quality include quantity and spacings of drill data, geological knowledge, geological interpretation, and grade estimates. All identified risks are within acceptable tolerances with associated management plans. 11.10.2 Uncertainties Considered During Confidence Classification Following the analysis in Chapter 11.10.1 that classified the mineral resource estimates into the measured, indicated, and inferred confidence categories, uncertainties regarding sampling and drilling methods, data processing and handling, geological modelling, and estimation were incorporated into the classifications assigned. The areas with the most uncertainty were assigned to the inferred category, and the areas with fewest uncertainties were classified as measured. 11.11 Reasonable Prospects of Economic Extraction 11.11.1 Input Assumptions For each resource estimate, an initial assessment was undertaken that assessed likely infrastructure, mining, and process plant requirements; mining methods; process recoveries and throughputs; environmental, permitting, and social considerations relating to the proposed mining and processing methods, and proposed waste disposal, and technical and economic considerations in support of an assessment of reasonable prospects of economic extraction. Cut-off grades will vary over the life of an open pit, due to variations in capital and operating costs, mine and mill performance, metal prices, exchange rates, and potentially, individual deposit geological and grade characteristics. Boddington Operations Western Australia Technical Report Summary Date: February 2026 Page 11-5 Mineral resources considered amenable to open pit mining methods are reported within a mine design that uses a Lerchs–Grossmann pit shell with the parameters set out in Table 11-3. Table 11-3: Input Parameters (Resources), Open Pit Parameters Item Unit Value Price Gold US$/oz 2,300 Copper US$/lb 4.25 Exchange rate US$:AU$ 0.70:1 Royalty Gold % 2.5 Copper % 5.0 Mill throughput rate Mt/a 41 Metallurgical recovery at average LOM grades of 0.60 g/t Au and 0.09% Cu Gold % 85 Copper % 81 Overall pit slope angles Degrees Variable approximately 37–52 Mining cost US$/t mined 4.99 Mining capital No CRF US$/t mined 0.95 CRF 1.10 US$/t mined 1.04 Mining incremental closure (LOM–ARO) US$/t mined 0.08 Sustaining capital (plant and G&A) No CRF US$/t milled 2.36 CRF 1.12 US$/t milled 2.65 Site and regional G&A (excluding capital costs) US$/t milled 2.09 Process incremental closure (LOM–ARO) US$/t milled 0.11 Incremental ore mining cost US$/t milled (0.12) Breakeven mill NSR cut-off US$/t milled 16.46 Stockpile rehandling US$/t rehandled 1.04 Recoveries degradation US$/t milled 0.88 Breakeven stockpile NSR cut-off US$/t milled 18.38 Note: LOM = life-of-mine; CRF = capital recovery factor; G&A = general and administrative; ARO = asset retirement obligation. 11.11.2 Commodity Price Commodity prices used in resource estimation are based on long-term analyst and bank forecasts, supplemented with research by Newmont’s internal specialists. An explanation of the derivation of the commodity prices is provided in Chapter 16.2. The estimated timeframe used for the price forecasts is the 15-year LOM that supports the mineral reserve estimates. Boddington Operations Western Australia Technical Report Summary Date: February 2026 Page 11-6 11.11.3 Cut-off The cut-off grade is defined by a revenue cut-off to account for both copper and gold revenue with two product streams, gold doré and copper concentrate. The block revenue is calculated on the net smelter return (NSR) basis which is the dollar return expected from the sale of the concentrate produced from a tonne of in situ material. The NSR calculation takes into account concentrate shipping and smelting and refining costs. The NSR cut-off for mineral resource reporting is US$18.38/t milled. The incremental (mill) cut-off is US$16.46/t milled. 11.11.4 QP Statement The QP is of the opinion that any issues that arise in relation to relevant technical and economic factors likely to influence the prospect of economic extraction can be resolved with further work. The mineral resource estimates are performed for a deposit that is in a well-documented geological setting; the Boddington deposit has seen nearly four decades of active open pit operations conducted by Newmont and other parties; Newmont is familiar with the economic parameters required for successful operations in the Boddington area; and Newmont has a history of being able to obtain and maintain permits, and the social license to operate, and meet environmental standards in the Boddington area. There is sufficient time in the 15-year timeframe considered for the commodity price forecast for Newmont to address any issues that may arise, or perform appropriate additional drilling, testwork and engineering studies to mitigate identified issues with the estimates. 11.12 Mineral Resource Statement Mineral resources are reported using the definitions set out in SK1300, and are reported on a 100% basis. Newmont holds a 100% Project interest. The reference point for the mineral resources is in situ. Mineral resources are current as at December 31, 2025. Mineral resources are reported exclusive of those mineral resources converted to mineral reserves. Mineral resources that are not mineral reserves do not have demonstrated economic viability. The Qualified Person responsible for the estimate is Mr. Shaun Chanter, RM SME, Head, Reserves Governance, a Newmont employee. The estimates for the Boddington Operations are provided in Table 11-4 (measured and indicated; gold) and Table 11-5 (inferred; gold), and Table 11-6 (measured and indicated; copper) and Table 11-7 (inferred; copper). Boddington Operations Western Australia Technical Report Summary Date: February 2026 Page 11-7 Table 11-4: Measured and Indicated Mineral Resource Statement (Gold) Area Measured Mineral Resources Indicated Mineral Resources Measured and Indicated Mineral Resources Tonnage (x 1,000 t) Grade (g/t Au) Cont. Gold (x 1,000 oz) Tonnage (x 1,000 t) Grade (g/t Au) Cont. Gold (x 1,000 oz) Tonnage (x 1,000 t) Grade (g/t Au) Cont. Gold (x 1,000 oz) North Pit 14,300 0.28 100 13,300 0.28 100 27,600 0.28 200 South Pit 83,000 0.56 1,500 149,700 0.51 2,500 232,800 0.53 4,000 Open Pit Sub-total 97,300 0.52 1,600 163,000 0.49 2,600 260,400 0.50 4,200 Stockpile — — — 5,200 0.31 100 5,200 0.31 100 Boddington Total 97,300 0.52 1,600 168,200 0.49 2,600 265,500 0.50 4,300 Table 11-5: Inferred Mineral Resource Statement (Gold) Area Inferred Mineral Resources Tonnage (x 1,000 t) Grade (g/t Au) Cont. Gold (x 1,000 oz) North Pit 600 0.5 0 South Pit 3,200 0.5 0 Open Pit Sub-total 3,800 0.5 100 Stockpile — — — Boddington Total 3,800 0.5 100


Boddington Operations Western Australia Technical Report Summary Date: February 2026 Page 11-8 Table 11-6: Measured and Indicated Mineral Resource Statement (Copper) Area Measured Mineral Resources Indicated Mineral Resources Measured and Indicated Mineral Resources Tonnage (x 1,000 t) Grade (Cu %) Cont. Copper (x 1,000 t) Tonnage (x 1,000 t) Grade (Cu %) Cont. Copper (x 1,000 t) Tonnage (x 1,000 t) Grade (Cu %) Cont. Copper (x 1,000 t) North Pit 14,300 0.06 0 13,300 0.06 0 27,600 0.06 0 South Pit 83,000 0.13 100 149,700 0.12 200 232,800 0.12 300 Open Pit Sub-Total 97,300 0.12 100 163,000 0.11 200 260,400 0.11 300 Stockpile — — — 5,200 0.05 0 5,200 0.05 0 Boddington Total 97,300 0.12 100 168,200 0.11 200 265,500 0.11 300 Table 11-7: Inferred Mineral Resource Statement (Copper) Area Inferred Mineral Resources Tonnage (x 1,000 t) Grade (Cu %) Cont. Copper (x 1,000 t) North Pit 600 0.0 0 South Pit 3,200 0.1 0 Open Pit Sub-Total 3,800 0.1 0 Stockpile — — — Boddington Total 3,800 0.1 0 Notes to accompany mineral resource tables: 1. Mineral resources are current as at December 31, 2025, and are reported using the definitions in SK1300 on a 100% basis. The Qualified Person responsible for the estimate is Mr. Shaun Chanter, RM SME, Head, Reserves Governance, a Newmont employee. 2. The reference point for the mineral resources is in situ. 3. Mineral resources are reported exclusive of mineral reserves. Mineral resources that are not mineral reserves do not have demonstrated economic viability. 4. Mineral resources that are potentially amenable to open pit mining methods are constrained within a designed pit . Parameters used are summarized in Table 11-3. 5. Tonnages are metric tonnes rounded to the nearest 100,000. Gold grade is rounded to the nearest 0.01 gold grams per tonne. Copper grade is reported as a %. Gold ounces and copper tonnes are estimates of metal contained in tonnages and do not include allowances for processing losses. Contained (cont.) gold ounces are reported as troy ounces, rounded to the nearest 100,000. Contained (cont.) copper is reported as metric tonnes. Rounding of tonnes and contained metal content as required by reporting guidelines may result in apparent differences between tonnes, grade and contained metal content. In instances where tonnage and grade are presented but metal is shown as “0”, this is due to the metal contained falling below the metal rounding limit. Boddington Operations Western Australia Technical Report Summary Date: February 2026 Page 11-9 11.13 Uncertainties (Factors) That May Affect the Mineral Resource Estimate Factors which may affect the mineral resource estimates include: • Metal price assumptions; • Changes to the assumptions used to generate the NSR cut-off; • Changes to design parameter assumptions that pertain to the conceptual pit shell design that constrain the mineral resources, including changes to geotechnical, mining, and metallurgical recovery assumptions, and changes to royalties levied and any other relevant parameters that are included in and impact the NSR cut-off determination; • Changes in interpretations of mineralization geometry and continuity of mineralization zones; • Changes to the dilution skin percentages used for large dolerite dykes; • Assumptions as to the continued ability to access the site, retain mineral and surface rights titles, maintain the operation within environmental and other regulatory permits, and retain the social license to operate. Boddington Operations Western Australia Technical Report Summary Date: February 2026 Page 12-1 12.0 MINERAL RESERVE ESTIMATES 12.1 Introduction Measured and indicated mineral resources were converted to mineral reserves. Mineral reserves are estimated assuming open pit mining. All Inferred blocks are classified as waste in the cash flow analysis that supports mineral reserve estimation. The NSR approach is the same as summarized for the mineral resources in Chapter 11.11.3. The NSR cut-off for mineral reserves reporting is US$18.24/t milled, which includes stockpile rehandle and recovery degradation. The incremental (mill) cut-off is US$16.33/t milled. 12.2 Pit Optimization For mineral reserves, Newmont applies a time discount factor to the dollar value block model that is generated in the pit-limit analysis, to account for the fact that a pit will be mined over a period of years, and that the cost of waste stripping in the early years must bear the cost of the time value of money. Pit discounting is accomplished by running the pit-limit “dollar” model that discounts the dollar model values at a compound rate based on the depth of the block. Discounting is applied to future costs as well as future revenues, to represent the fact that mining proceeds from the top down within a phase. Optimization work involved floating pit shells at a series of gold prices. The pit shells with the highest NPV were selected for detailed engineering design work. A realistic schedule was developed in order to determine the optimal pit shell; schedule inputs include the minimum mining width, and vertical rate of advance, mining rate, and mining sequence. 12.3 Optimization Inputs and Assumptions The mineral reserves LOM schedule was developed using MineSight software and spreadsheet- based scheduling tools. The mine plan is based on a 41 Mt/a mill throughput. The schedule was developed at an NSR cut-off of US$18.24/t, incorporating the processing cost, metallurgical recovery, incremental ore mining costs, process sustaining capital and tailings dam related rehabilitation costs. The net revenue calculation assumes a gold price of US$2,000/oz or AU$2,857/oz, and a copper price of US$3.75/lb or AU$5.36/lb. The assumed US$:AU$ exchange rate for mineral reserves was 0.70:1. Mineral reserves are reported above an NSR cut-off of $18.24/t, using the inputs in Table 12-1. Boddington Operations Western Australia Technical Report Summary Date: February 2026 Page 12-2 Table 12-1: Input Design Parameters Item Item Unit Value Price Gold US$/oz 2,000 Copper US$/lb 3.75 Exchange rate US$:AU$ 0.70:1 Royalty Gold % 2.5 Copper % 5.0 Mill throughput Mt/a 41 Metallurgical recovery at average LOM grade of 0.60 g/t Au and 0.09% Cu Gold % 85 Copper % 81 Overall pit slope angles Degrees Variable approximately 37–52 Mining cost US$/t mined 5.08 Mining capital No CRF US$/t mined 0.74 CRF 1.10 US$/t mined 0.81 Mining incremental closure (LOM–ARO) US$/t mined 0.08 Base processing cost-without rehandle US$/t milled 11.73 Sustaining capital (plant and G&A) No CRF US$/t milled 2.25 CRF 1.12 US$/t milled 2.52 Site and regional G&A (exclude capital costs) US$/t milled 2.09 Process incremental closure (LOM–ARO) US$/t milled 0.11 Incremental ore mining cost US$/t milled (0.12) Breakeven mill NSR cut-off US$/t milled 16.33 Stockpile rehandling US$/t rehandled 1.04 Recoveries degradation US$/t milled 0.88 Breakeven stockpile NSR cut-off US$/t milled 18.24 Note: LOM = life-of-mine; CRF = capital recovery factor; G&A = general and administrative; ARO = asset retirement obligation. Pit designs are full crest and toe detailed designs with final ramps based on the selected optimum Whittle cones. Pit designs honor geotechnical guidelines with 15.2 m catch berms. Newmont updates its LOM plan each year in preparation for the business plan. All aspects of the plan, including pit stage design and sequencing, cut-off optimization and WRSF and stockpiling strategies are reviewed.


Boddington Operations Western Australia Technical Report Summary Date: February 2026 Page 12-3 The process plant processes higher-grade ores delivered from the mine at an elevated cut-off. The ore between the elevated cut-off and the marginal cut-off is stockpiled for later processing at the end of the mine life. Most of the ore will be directly fed to the process plant; however, some re-handle is required. Direct feeding to the crusher is constrained by where the ore is located in the open pit and the crusher availability. Some higher-grade ore is stockpiled and fed back to the crusher when required. Approximately 58% of feed is re-handle material from the stockpiles. 12.4 Ore Loss and Dilution The block models were constructed to include the expected dilution based on mining methods, bench height, and other factors. The current mine and process reconciliation support this assumption. Dilution is applied to the resource model, and is related to the presence of large dolerite waste volumes. To capture the operational constraints, a 10% dilution factor is applied to the model blocks with large dolerite volumes. No additional modifying dilution is applied in estimation and mine planning. Large dolerite dykes are removed from the resource model and contain no ore. Large dolerites are selectively mined. Accidental mining of the dolerites as ore is avoided as much as practicable due to the hardness of the rock type and the negative impact to the mill of processing the doleritic material. Blocks containing >50% oxide material are classified as waste and have the grade set to zero. 12.5 Stockpiles Stockpile estimates were based on mine dispatch data; the grade comes from closely-spaced blasthole sampling and tonnage sourced from truck factors. The stockpile volumes were typically updated based on monthly surveys. The average grade of the stockpiles was adjusted based on the material balance to and from the stockpile. 12.6 Commodity Prices Commodity prices used in mineral reserve estimation are based on long-term analyst and bank forecasts, supplemented with research by Newmont’s internal specialists. The estimated timeframe used for the price forecasts is the 15-year LOM. Boddington Operations Western Australia Technical Report Summary Date: February 2026 Page 12-4 12.7 Mineral Reserve Statement Mineral reserves were classified using the definitions set out in SK1300, and are reported on a 100% basis. Newmont holds a 100% Project interest. The mineral reserves are current as at December 31, 2025. The reference point for the mineral reserve estimate is at the point of delivery to the process facilities. The Qualified Person responsible for the estimate is Mr. Shaun Chanter, RM SME, Head, Reserves Governance, a Newmont employee. Mineral reserves are reported in Table 12-2 (gold) and Table 12-3 (copper). Tonnages in the table are metric tonnes. Boddington Operations Western Australia Technical Report Summary Date: February 2026 Page 12-5 Table 12-2: Proven and Probable Mineral Reserve Statement (Gold) Area Proven Mineral Reserves Probable Mineral Reserves Proven and Probable Mineral Reserves Tonnage (x 1,000 t) Grade (g/t Au) Cont. Gold (x 1,000 oz) Tonnage (x 1,000 t) Grade (g/t Au) Cont. Gold (x 1,000 oz) Tonnage (x 1,000 t) Grade (g/t Au) Cont. Gold (x 1,000 oz) North Pit 144,200 0.57 2,600 142,800 0.55 2,500 286,900 0.56 5,200 South Pit 121,200 0.67 2,600 73,600 0.65 1,500 194,700 0.66 4,200 Open Pit Sub-Total 265,300 0.62 5,300 216,300 0.58 4,100 481,700 0.60 9,300 Stockpile Sub-Total 5,600 0.56 100 57,800 0.43 800 63,400 0.44 900 Boddington Total 271,000 0.61 5,400 274,100 0.55 4,900 545,100 0.58 10,200 Table 12-3: Proven and Probable Mineral Reserve Statement (Copper) Area Proven Mineral Reserves Probable Mineral Reserves Proven and Probable Mineral Reserves Tonnage (x 1,000 t) Grade (Cu %) Cont. Copper (x 1,000 t) Tonnage (x 1,000 t) Grade (Cu %) Cont. Copper (x 1,000 t) Tonnage (x 1,000 t) Grade (Cu %) Cont. Copper (x 1,000 t) North Pit 144,200 0.09 100 142,800 0.10 100 286,900 0.10 300 South Pit 121,200 0.08 100 73,600 0.09 100 194,700 0.08 200 Open Pit Sub-Total 265,300 0.09 200 216,300 0.10 200 481,700 0.09 400 Stockpile Sub-Total 5,600 0.09 0 57,800 0.09 100 63,400 0.09 100 Boddington Total 271,000 0.09 200 274,100 0.10 300 545,100 0.09 500 Boddington Operations Western Australia Technical Report Summary Date: February 2026 Page 12-6 Notes to accompany mineral reserve tables: 1. Mineral reserves are current as at 31 December, 2025. Mineral reserves are reported using the definitions in SK1300 on a 100% basis. The Qualified Person responsible for the estimate is Mr. Shaun Chanter, RM SME, Head – Reserve Governance, a Newmont employee. 2. Mineral reserves are reported at the point of delivery to the process plant. 3. Mineral reserves that will be mined using open pit mining methods are constrained within a designed pit. Parameters used are included in Table 12-1. 4. Tonnages are metric tonnes rounded to the nearest 100,000. Gold grade is rounded to the nearest 0.01 gold grams per tonne. Copper grade is %. Gold ounces and copper tonnes are estimates of metal contained in tonnages and do not include allowances for processing losses. Contained (cont.) gold ounces are reported as troy ounces, rounded to the nearest 100,000. Contained (cont.) copper is reported as metric tonnes. Rounding of tonnes and contained metal content as required by reporting guidelines may result in apparent differences between tonnes, grade and contained metal content. In instances where tonnage and grade are presented but metal is shown as “0”, this is due to the metal contained falling below the metal rounding limit.


Boddington Operations Western Australia Technical Report Summary Date: February 2026 Page 12-7 12.8 Uncertainties (Factors) That May Affect the Mineral Reserve Estimate Areas of uncertainty that may materially impact the mineral reserve estimates include: • Changes to long-term metal price and exchange rate assumptions; • Changes to metallurgical recovery assumptions; • Changes to the input assumptions used to derive the pit designs applicable to the open pit mining methods used to constrain the estimates; • Changes to the forecast dilution and mining recovery assumptions; • Changes to the cut-off values applied to the estimates; • Variations in geotechnical (including seismicity), hydrogeological and mining method assumptions; • Changes to environmental, permitting, and social license assumptions. Boddington Operations Western Australia Technical Report Summary Date: February 2026 Page 13-1 13.0 MINING METHODS 13.1 Introduction Mineral reserves were estimated assuming open pit mining, and the use of conventional Owner- operated equipment. 13.2 Geotechnical Considerations A number of geotechnical and hydrological studies were completed to support mining, feasibility, and environmental inputs. The geotechnical model for the Boddington deposit was defined by geotechnical drilling and logging, laboratory test work, rock mass classification, structural analysis, and stability modeling. The hydrological model was based on a three-dimensional flow model, historic pumping rates from the Jarrah Pit, and drill data. The rock mass was characterized and grouped into geotechnical domains for design purposes using geotechnical and hydrogeological models as well as operational experience. A detailed structural model was constructed and maintained for input to both long term and operational design. Ground support and rock fall mitigation measures used include: • Cable bolting to reinforce potentially unstable sections of pit wall; • Wire mesh to help control potential rockfall from pit walls; • Rock fall fences and physical barriers that can be installed on a wide and stable catch berm or pit wall to capture rock fall from the benches above; • Manual scaling by rope access to remove loose/unstable rock in areas where machine access is no longer possible; • Machine scaling and chaining of crests as part of the bench turn-over (BTO) process, including using an excavator followed by a rock breaker to scale walls as part of routine work. • A combination of the above methods. Table 13-1 provides a brief summary of the geotechnical domains in operational pits and Table 13-2 provides the design configurations for all domains. Boddington Operations Western Australia Technical Report Summary Date: February 2026 Page 13-2 Table 13-1: Geotechnical Domains Domain Description Fresh andesite and diorite (all pits) Andesite and diorite host rock which is exposed in most areas of all pits. There is no strong joint orientation. Joints are widely spaced (>1.0 m). Near-horizontal undulating fractures are reasonably common, and there are only few intermediate faults. Non- persistent moderate dipping (30º to 60º) closed joints are the main weakness planes that often open-up during blasting, which create incipient structures controlling crest damage Weathered andesite and diorite (all pits) Andesite and diorite moderately to slightly weathered rock beneath the contact with oxide between the Saprolite and Fresh surfaces. This unit is clay altered with broken to highly fractured rocks. It has weaker joint conditions than the fresh material and is prone to increased crest loss when blasted and over time due to degradation. Increased ground support to maintain wall integrity and catch capacity is required in this domain Oxide/transition (all pits) Poor rock-mass, soil strength, silty material. Completely to highly weathered material with relic structure Oxide/transition – S09 West Wall (S09 pit) Poor rock-mass, soil strength, silty material. Completely to highly weathered material with relic structure. Batter angle laid back due to bench-scale slumping in previous cutback with no impact on overall slope angle Oxide/transition – S09 East Wall (S09 pit) Poor rock-mass, soil strength, silty material. Completely to highly weathered with relic structure. This material has a higher degree of saturation compared to the western wall oxides. Relic structure is often dipping in to the pit Backfill (all pits) Residual strength unspecified oxide materials from historic mining Vertical dolerites (all pits) There are several late stage dolerite intrusion events which are similar from a geotechnical perspective. This is an extremely strong rock mass with UCS > 200 MPa. Moderately-spaced (0.3–1.0 m) planar joints are the main weakness causing this rock mass to be more sensitive to blasting (direction and set-up) and long-term degradation compared to the andesite and diorite in Domain 1 Sub-horizontal dolerite (South Pits) Characterized by the existence of broken zones or layers associated with north-northeast dipping (15° to 30°) sub-horizontal dolerite sills that are exposed on the north and southeast walls of South Pits. The thicknesses of the broken zones vary from 0.3–8 m Western shear zone (North Pit) Near vertical, moderately to well-developed foliation, shear zone of andesite and diorite, including a north–south-trending dolerite dyke. The shear within this wall is highly persistent, likely to below the final pit floor, with parallel structures. This domain requires extreme care when blasting, and is much more sensitive than the surrounding rock mass of Domain 1 A-breccia and South Bowl (North Pit) Operational experience has shown that this area is challenging for wall control blast and excavation. Response to blasting and excavation suggested that rock mass is harder than in other areas. Slope performance is mostly unsatisfactory with poor crest retention. An above-average amount of scaling and a wider design catch berm are therefore required Sentinels wall (North Pit) The Sentinel structural set is steeply dipping into the pit at 45–75º along the west wall of the N03 pit for the full height of the wall. Crest retention along these structures is poor and significant ground support is required. This domain requires extreme care during blasting Boddington Operations Western Australia Technical Report Summary Date: February 2026 Page 13-3 Table 13-2: Geotechnical Domain Design Configurations Domain Bench Height (m) BFA 1 st Flitch (˚) BFA 2 nd + 3rd Flitch (˚) Batter Height (m) IRA (˚) Step-in berm (m) Berm Width (m) Berm Gradient (%) Fresh andesite and diorite 12 75 90 36 60.8 1.3 15.2 — Weathered andesite and diorite 12 75 90 36 60.8 1.3 15.2 — Oxide/transition 12 54 — 12 30 — 12 — Oxide/transition – S09 west wall 12 45 — 12 30 — 9.0 -3 (into pit) Oxide/transition – S09 east wall 12 45 — 12 28 — 10.5 -3 (into pit) Backfill — 20 — — 20 — — — Vertical dolerites 12 75 90 36 58 1.3 17.3 — Sub-horizontal dolerite broken zone 12 65 90 36 56 1.3 17.0 — Western shear zone 12 75 90 36 59 1.3 16.7 — A-Breccia and South Bowl 12 75 90 36 59 1.3 16.7 — Sentinels wall 12 75 90 36 59 1.3 16.7 — The minimum pit slope design acceptance criteria were specified in the Newmont Corporation – Surface Ground Control Standard - Open Pit (NEM-TES-STA-003, dated 31 May 2019). The acceptance criteria were adopted from Read and Stacey (2009) and are in line with mining industry standards. Open pit designs were assessed and reviewed prior to pit excavation to ensure adequacy and integrity of design geometry with consideration to ground conditions. Three-dimensional models were developed for design geometry and various geological materials and structural features. The models were used to assess slope stability. Slope stability models incorporated material parameters derived during ground investigations, laboratory testing, and assessments of in-situ conditions as appropriate. Hydrogeological data from dedicated monitoring stations were also used to characterize geotechnical slope stability models. Overall pit slope angles varied between approximately 37–52º according to geology and location of pit infrastructure such as ramps and haul roads. Inter-ramp slope angles in hard rock varied between 58–60.8º depending on specific conditions encountered within pit walls. The inter-ramp slope angles within oxide slopes varied between 20–30º.


Boddington Operations Western Australia Technical Report Summary Date: February 2026 Page 13-4 A continuous system of assessment was implemented and adhered to during ongoing excavation processes in order to document and verify geological conditions as they were encountered. A structural model was maintained, updated, and made available to help inform ongoing operations. Geotechnical staff were also employed to offer progressive assessments of conditions encountered during excavation including providing documented guidance to inform pit development initiatives. Automated deformation monitoring systems including alarmed slope stability radars and automated prism monitoring stations were also maintained and used to supplement performance assessment. 13.3 Hydrogeological Considerations There are two deep open pits, and the pit dewatering system will continuously receive large volumes of groundwater and surface run-off over the LOM. As groundwater inflows vary with the vertical and horizontal advancement of each pit, the combined rate of active and passive dewatering has remained relatively constant at approximately 140 L/sec (4.4 GL/year), of which water carts consume about 0.5–0.8 GL/year. The long-term dewatering strategy assumes that this trend continues throughout the LOM. The infrastructure requirements are 230 L/sec (single line) for cases where average groundwater inflow is <100 L/sec and 460 L/sec (two lines) per pit where average inflow exceeds 100 L/sec when mining at the bottom of pit. The designed pumping rates are considerably higher than average inflows (up to four times greater), to mitigate pit flooding risks. The water management strategy is to maximize the use of the groundwater within the process plant and to minimize the evaporation losses at the TSF. There is provision in place to capture excess surface water in water storage reservoirs. The LOM pit dewatering plan will strategically and progressively upgrade the in-pit sump pump system (passive dewatering) and dewatering-bores (active dewatering) to meet operational needs as required. 13.4 Operations The LOM plan envisages mining at an average rate of approximately 56 Mt/a for 15 years, peaking at 88 Mt/a in 2026, with a maximum rate of advance by pit stage of six benches per annum and an average of five benches (60 m) per year. The mine life will extend to 2040; both the mine and the mill cease operations in the same year. The mine plan assumes five pit phases remain. An illustration showing the final pit layout was provided in Figure 2-2. Pit design assumptions include haul road widths for two-way travel of 38 m, maximum ramp grades of 10% and minimum pit-bottom widths of 75 m as a safety measure. Boddington Operations Western Australia Technical Report Summary Date: February 2026 Page 13-5 13.5 Blasting and Explosives All drilling operations are performed by Newmont with Newmont-owned rigs that are self- maintained by Newmont. The drill rigs are configured in the down-the-hole (DTH) mode, and consist of seven Atlas Copco PV231five Atlas Copco PV235 and five Atlas Copco D65 rigs. Production drilling and blasting is done on 12 m benches with patterns and powder factors varying by material type and geological conditions. Production blasting uses Heavy ANFO blends which is loaded into both production and buffer holes; the stemming length varies according to rock type and other geologic conditions. 13.6 Grade Control Grade control is conducted using blast hole samples which are assayed for gold, copper, and sulfur. Blast holes are mapped for dolerite contacts. These assay samples and dolerite maps are used to develop ore control models for each shot blasted. The shots are modeled using OK and constructed using Vulcan software. A revenue script run to determine the value of each block taking into account gold and copper grade and modifying factors such as mining costs and recovery. The ore control models are blocked out using revenue and Vulcan’s Grade Control Optimizer software. These blocks are subsequently translated using blast movement data prior to marking out the boundaries on the pit floor at which time the shot is released for mining. Patterns include: • Ore: 5.0 x 5.0 m, using a 13.5 m hole, and one sample is taken per blast hole; • Waste: 5.2 x 5.2 m, using a 13.5 m hole, and one sample is taken per blast hole. 13.7 Production Schedule The LOM production plan is included in Table 13-3 and Table 13-4. Boddington Operations Western Australia Technical Report Summary Date: February 2026 Page 13-6 Table 13-3: Production Schedule (2026–2034) Item Units Total 2026 2027 2028 2029 2030 2031 2032 2033 2034 Material mined Mt 894.9 87.6 86.5 86.2 82.4 82.3 77.1 68.2 38.0 41.1 Ore processed Mt 545.1 38.0 37.6 37.7 37.6 37.6 39.0 40.1 41.0 41.0 Material mined total includes 60.5 Mt of initial stockpiles. Table 13-4: Production Schedule (2035–2040) Item Units 2035 2036 2037 2038 2039 2040 Material mined Mt 45.0 36.5 23.0 32.3 28.6 19.7 Ore processed Mt 41.0 41.2 41.0 25.0 25.0 22.0 Boddington Operations Western Australia Technical Report Summary Date: February 2026 Page 13-7 13.8 Equipment LOM peak equipment requirements are provided in Table 13-5. Table 13-5: Equipment Requirements Purpose Type Peak Number Hauling 793 AHS ex-pit and re-handle 45 Loading 7495HD rope shovel 2 6060 hydraulic shovel 2 9040 hydraulic excavator 3 995 wheel loader 2 Drilling PV231 production drill 7 PV235 production drill 5 D65 presplit drill 5 Support D11 track dozer 6 854G wheel dozer 4 834H wheel dozer 1 18H grader 1 24M grader 3 785C/D water truck 4 374 rock breaker 1 330 rock breaker 2 966H loader 5 972 stemming loader 1 988H tire handler 1 988 cable reeler 1 773E service truck 2 Cable truck 1 Volvo stemming truck 1 Low loader 1 Drill water cart 2 Drill service truck 1 HIT890 rock breaker 2 Mine services truck 2


Boddington Operations Western Australia Technical Report Summary Date: February 2026 Page 13-8 13.9 Personnel The mining personnel total required for LOM operations is about 658. Boddington Operations Western Australia Technical Report Summary Date: February 2026 Page 14-1 14.0 PROCESSING AND RECOVERY METHODS 14.1 Process Method Selection The process plant design was based on a combination of metallurgical testwork, previous study designs and prior operating experience. The design follows conventional practices within the gold processing industry and does not incorporate any novel unit operations. 14.2 Process Plant A summary process flow sheet is included in Figure 14-1. Figure 14-1: Process Flowsheet Figure prepared by Newmont, 2021. Boddington Operations Western Australia Technical Report Summary Date: February 2026 Page 14-2 14.2.1 Plant Design The selected process consists of primary crushing, closed circuit secondary and HPGR tertiary crushing, ball milling, and hydrocyclone classification to generate a milled product with a P80 of 150 μm at a slurry density of 35–38% solids. Flash flotation facilities were included to treat a portion of the mill discharge stream; however, flash flotation trials were unsuccessful and the facilities were removed from the process flowsheet. Cyclone overflow from the mill circuit is treated in a flotation circuit that produces a copper–gold concentrate for export. Rougher and scavenger flotation concentrates are reground and cleaned to achieve an acceptable final concentrate grade. Concentrate is thickened and filtered before being trucked to the port of Bunbury. The cleaner–scavenger tailings stream is thickened and leached under elevated cyanide concentrations. Separately, scavenger tailings are thickened and leached in a conventional leach and adsorption circuit. Leached slurry from the cleaner scavenger tailings circuit is subsequently directed to the scavenger tailings circuit, enabling combined gold recovery and production of gold bullion. Leach residue is pumped to the residue disposal area, and residual weakly acid-dissociable cyanide (CNwad) is maintained below a targeted level by a Caro’s acid cyanide destruction plant. This facility can treat the following streams: • Decant water returning to the plant so that cyanide levels do not inhibit flotation; • Decant water recycling to the decant pond to maintain CNwad levels in the pond at an average of 30 ppm and a not-to-exceed level of 50 ppm; • Residue slurry from the plant to protect the decant pond from excursions caused in CNwad levels by short-term variability in the copper head grade. The carbon from the scavenger tailings adsorption circuit is treated by a conventional split-Anglo American Research Laboratory (AARL) method elution and reactivated in horizontal reactivation kilns. Gold recovery from the eluate is by electrowinning, cathode sludge filtration and drying, and smelting. Plant utilization in the LOM plan is 89% for the secondary/tertiary crushing circuits, and 89% for the milling circuit. 14.2.2 Equipment Sizing The Project process plant incorporates the following major equipment: • 2.3 km overland conveyor; • Two ROM stockpiles, two medium-grade stockpiles, three WRSF areas; • Two 60-113 primary crushers; • Six MP1000 secondary crushers; Boddington Operations Western Australia Technical Report Summary Date: February 2026 Page 14-3 • Four 3.66 m x 7.32 m coarse screens; • Four 6.5 MW HPGR capacity (8,000 t/h); • Four 15.6 MW ball mills (7.9 m x 13.6 m); • Four flash flotation SK1800 Outotec cells: (decommissioned); • Roughers/scavengers: three parallel trains consisting of 2 x 150 m3 and 6 x 200 m3 Outotec tank cells; • One 19 m diameter Outotec regrind high-rate thickener; • Regrind mills: two Vtm 1250 950 kW Vertimills; • First cleaners/cleaner scavengers: nine 100 m3 Outotec tank cells; • Coarse cleaners: three 30 m3 Outotec tank cells; • Second and third cleaners: five 8 m3 Outotec U-shape cells; • One 27 m diameter Outotec high-rate concentrate thickener; • One 144 m2 (upgraded from 108 m2) area Larox concentrate pressure filter; • One 19 m diameter Outotec cleaner scavenger tails high- rate thickener; • One 74 m diameter Outotec scavenger tails high-rate thickener; • Two 450 m3 and seven 175 m3 cleaner scavenger tails (CSt) leach tanks; • Carbon-in-leach: two parallel trains (each 12 leach tanks); total 60,500 m3 capacity. 14.3 Power and Consumables Power supply to the operations is via the local grid system with a thermal power station built at Collie providing the additional demand for the operation as well as supplementing the existing grid. Water supply is from a number of sources, including the Hotham river (during winter only), pit dewatering water, borefield water adjacent to the pits, rainfall run-off and recovered water from the thickeners and TSF. Decreased rainfall during winter could impact the mill production if sufficient water cannot be drawn from the river. Consumables used in the processing include grinding media, primary collector (thionocarbamate), secondary collector (xanthate), frother, lime, flocculant, cyanide, oxygen, caustic, sulfuric and hydrochloric acid, and peroxide. 14.4 Personnel The process plant has a personnel count of 389.


Boddington Operations Western Australia Technical Report Summary Date: February 2026 Page 15-1 15.0 INFRASTRUCTURE 15.1 Introduction The majority of the key infrastructure required to support mining operations is constructed and operational. This includes: • Open pit; • Roads; • Two ROM stockpiles, one medium-grade stockpile, one low-grade stockpile, two oxide rock waste stockpiles, one WRSF; • Two TSFs, one constructed and operational, and a second, RDA2, in the permitting phase; • 2.3 km overland conveyor; • Four major water management facilities, including a decant water pond and water recycling facility; • Electrical sub-station; • Concentrate storage shed and load-out facility; • Accommodation village; • Heavy equipment and light vehicle shops, warehouses, and offices; • On-site core storage, and sample pulp storage. A layout plan is included as Figure 15-1. A second TSF is required for the LOM plan. Boddington Operations Western Australia Technical Report Summary Date: February 2026 Page 15-2 Figure 15-1: Infrastructure Layout Plan Note: Figure prepared by Newmont, 2025. RDA = residue disposal area (TSF). Boddington Operations Western Australia Technical Report Summary Date: February 2026 Page 15-3 15.2 Roads and Logistics The Project is accessed by an all-weather road network from Perth as discussed in Chapter 4. 15.3 Waste Rock Storage Facilities A number of WRSFs are in use, segregated as oxide or rock facilities. Potentially acid-forming waste is encapsulated as required. A WRSF expansion in the 11WD area was completed in 2024 to provide capacity for the remaining LOM. 15.4 Stockpiles Boddington operates two run-of-mine (ROM) stockpiles; ROM and ROM premium (ROMPR) located adjacent to the crusher on the west side of the North Pit. The cut-offs for ROM stockpiles are adjusted quarterly to ensure the preferential feed for the period. The ROMPR cut-off is US$24.5/t and ROM varies between is US$19.64–24.5/t. Newmont operates a medium-grade stockpile, MG2, which is located to the northwest of the South Pit. Entry to the MG2 stockpile is tested using the stockpile (mineral reserve) cut-off US$18.24/t. Stockpiling of ROMPR and ROM cut-off grade ores will be for short periods of time with no recovery degradation effect expected. Stockpiling of MG2 material will allow the material to oxidize for several years prior to processing. Benchmarking of sites with similar mineralogy and climatic conditions led to a baseline assumption that processing of these oxidized stockpile ores will result in a 6% loss in copper recovery and a 3% loss in gold recovery when they are finally processed. A program for testing the oxidation rates and impact to recovery was developed with Newmont Metallurgical Services and has been ongoing since November 2016. A review of the testwork completed to date has recommended that the Boddington Operations to apply a 9% deduction to the modelled copper recovery and 3% deduction to the modelled gold recovery to both medium- term stockpiling of high-grade ore and long-term stockpiling of medium-grade ore (Stewart, 2022). The combined stockpile is located adjacent to the crusher on the west side of the North Pit and reaches peak capacity in 2032 with 118 Mt. The stockpiles are reclaimed using a preferential high-grade feed strategy, with the lower medium-grade stockpiles being re-handled to the mill towards the end of the LOM. The stockpiles are reclaimed using conventional mining fleet and loading units. Boddington Operations Western Australia Technical Report Summary Date: February 2026 Page 15-4 15.5 Tailings Storage Facilities The F1/F3 tailings facility is the current active TSF for the Boddington Operations. The current F1/F3 dam has approved capacity to 750 Mt, which will provide sufficient storage for tailings storage to mid-2030, assuming remaining capacity of 168 Mt, and an approximate 38 Mt/a process rate. The approved facility has 11 perimeter embankments, of which all are in place. Newmont plans to expand the facility to 830 Mt, which, assuming the same approximately 38 Mt/a process rate, will provide tailings capacity to mid-2029. The expansion to 830 Mt is not currently permitted. Additional storage that will be required for the LOM beyond mid-2032 is being evaluated by Newmont. This is currently envisaged as a new tailings facility (RDA2) with a 294 Mt capacity. Newmont has established a pathway and a timeline for the tailings facility approval and construction such that storage capacity will be available when needed. The key input parameters dictating the tailings facility construction quantities and schedule include: • Process plant throughput; • Annual rate of rise from tailings deposition; • Beach slope angles; • Capacity for dam expansion; • Management of scope within the available construction areas; • Embankment designs and infrastructure to ensure geotechnical factors of safety in line with the Australian National Committee on Large Dams (2019) guidelines. The TSF is operated as a zero-discharge facility; all water is returned to the process facility for reuse. The TSF has enhanced monitoring systems including an extensive network of piezometers and inclinometers to track dam performance against the Trigger Action Response Plan, and to support proactive dam safety management. 15.6 Water Management Structures Water management infrastructure for mine operations include the following: • Pit dewatering infrastructure for pumping away both surface run-off and groundwater from open pits and for monitoring pore pressure distribution, which consists of: o In-pit sump pumping (passive dewatering); o Dewatering-bores (active dewatering); o Grouted multiple vibrating wire piezometer pore pressure monitoring bores;


Boddington Operations Western Australia Technical Report Summary Date: February 2026 Page 15-5 • Mine surface water drainage infrastructure for mitigating risks associated with storm water, sediments, erosions, saturations of ground and acid rock drainage, in accordance with the water characterization, which consists of: o Fresh water (non-contact water); o Mine water (contact water, no acid rock drainage); o Impacted water (contact water, potential acid rock drainage). Where practicable, the drainage infrastructures in the mining area are designed and constructed to segregate each characterized water from others by means of designated open channel network, sub-surface drainage systems, water retaining ponds and water reticulation infrastructures. All surface runoff and waste dump seepage are collected at designated retention ponds and pumped-away to the plant. As required, the drainage system has an ability of discharging a portion of fresh water to the downstream as an environmental flow. 15.7 Water Supply Process water is supplied direct from the mine pits, regional water bores, and onsite storage dams. The storage dams are filled by abstraction of water from the Hotham River under license SWL60668(8) from the Department of Water and Environmental Regulation. This license allows for water abstraction to a maximum of 15 GL/a. Process water supply is maximized from the residual disposal area and the wet well dyke (acid rock drainage) to minimize raw water usage. Potable water for the camp and mining operation is produced from an onsite reverse osmosis plant. A probabilistic site wide water balance model has been developed in the Goldsim platform to support operations and studies. The model is updated and calibrated annually with regular water use, abstraction, and storage capacity. 15.8 Camps and Accommodation The current workforce consists of approximately 1,000 employees and 700 contractors with approximately 25% of these residing locally within a 25 km radius of the operations and the balance residing in a purpose-built accommodation village. 15.9 Power and Electrical Power is sourced from the Bluewater Power Station, a thermal power station located 4.5 km northeast of Collie, and approximately 80 km from the mine. Power is transmitted through the State power grid from the power station to the mine site. Boddington Operations Western Australia Technical Report Summary Date: February 2026 Page 16-1 16.0 MARKET STUDIES AND CONTRACTS 16.1 Markets Newmont has an established sales and marketing team that is responsible for understanding the market supply and demand fundamentals, setting a strategy, negotiating contracts, and ensuring there are reliable, reputable buyers for the concentrates and doré that are being produced at the global operations. Together with public documents and analyst forecasts, there is a reasonable basis to assume that for Boddington’s LOM plan, the copper concentrate and doré will be saleable. The concentrate produced is marketed as a copper/gold concentrate. Smelters operating their own precious metal refineries at their copper smelting operations are best suited to process Boddington concentrates. Long-term contracts are in place with smelters in Korea and Japan for a large portion of the mine production of copper concentrate. The remaining production is placed on the spot market. The pricing of the concentrate is driven by London Metal Exchange (LME) copper pricing, London Bullion Market Association (LBMA) gold pricing, and annual processing benchmark terms negotiated by major industry players and published by third-party data providers. Doré is sold on the spot market by in-house marketing experts. There are no agency relationships relevant to the marketing strategies used. Product valuation is included in the economic analysis in Chapter 19, and is based on a combination of the metallurgical recovery, commodity pricing, and consideration of processing charges. 16.2 Commodity Price Forecasts Newmont uses a combination of historical and current contract pricing, contract negotiations, knowledge of its key markets from a long operations production record, short-term versus long- term price forecasts prepared by Newmont’s internal corporate marketing group, public documents, and analyst forecasts when considering long-term commodity price forecasts. Higher metal prices are used for the mineral resource estimates to ensure the mineral reserves are a sub-set of, and not constrained by, the mineral resources, in accordance with industry- accepted practice. The metal price and exchange rate forecasts are provided in Table 16-1. Table 16-1: Commodity Price and Exchange Rate Forecasts Item Unit Mineral Reserves Mineral Resources Gold US$/oz 2,000 2,300 Copper US$/lb 3.75 4.25 Exchange rate US$:AU$ 0.70:1 0.70:1 Boddington Operations Western Australia Technical Report Summary Date: February 2026 Page 16-2 16.3 Contracts Newmont has contracts in place for the majority of the annual copper concentrate production. The terms contained within the concentrate sales contracts are typical and consistent with standard industry practice for high-gold, low-copper concentrates. The contracts include references to industry benchmark terms for metal payables, treatment charges and refining charges for concentrates produced. Depending on the specific contract, the terms for the sale of the copper concentrate are either annually negotiated, benchmark-based treatment and refining charges, or a combination of annually-negotiated terms. Treatment charges assumed for estimation of mineral reserves are based on the forecasts published by third-party specialist data providers such as Wood Mackenzie or CRU. The formula used for mineral reserves is sensitive to the underlying copper price, and is consistent with Newmont’s long-term expectations for copper treatment and refining charges. Newmont’s doré is sold on the spot market, by marketing experts retained in-house by Newmont. The terms contained within the sales contracts are typical and consistent with standard industry practice and are similar to contracts for the supply of doré elsewhere in the world. The largest in-place contracts other than for product sales cover items such as bulk commodities, operational and technical services, mining and process equipment, and administrative support services. Contracts are negotiated and renewed as needed. Contract terms are typical of similar contracts in Australia that Newmont is familiar with. Boddington Operations Western Australia Technical Report Summary Date: February 2026 Page 17-1 17.0 ENVIRONMENTAL STUDIES, PERMITTING, AND PLANS, NEGOTIATIONS, OR AGREEMENTS WITH LOCAL INDIVIDUALS OR GROUPS 17.1 Introduction Two phases of gold mining were conducted, from 1987–2001, and from 2009 to date. 17.2 Baseline and Supporting Studies Baseline and supporting environmental studies were completed to assess both pre-existing and ongoing site environmental conditions, as well as to support decision-making processes during operations start-up and restart. Characterization studies were completed for all environmental media including soil, water, waste, air, noise, and closure. Plans were developed and implemented to address aspects of operations such as waste and fugitive dust management, spill prevention and contingency planning, water management, and noise levels. 17.3 Environmental Considerations/Monitoring Programs Monitoring and regulatory compliance systems were updated following approval of the current operations in 2015, based on a 2036 LOM footprint. Areas that are monitored relate to clearing of native vegetation, acid rock and mine drainage, groundwater and surface water impacts, air, blast and noise emissions, weed and forest disease, feral animals, and impacts to state and national species of conservation significance. These mitigation plans were put in place to address approvals associated with pit expansion, increased production rates, expansion of WRSFs, construction of a new TSF, and construction of a additional water storage area. Annual compliance reporting also includes Newmont complying with terms set out in the Control of Pollution operating license (L8306/2008/3), the Mining Act tenement conditions, and the Hotham River abstraction license. There are five species classified as Threatened Species/Matters of National Environmental Significance in the Project area, including three species of black cockatoo (Baudin’s, Carnaby’s and forest red-tailed), and two species of marsupial, woylie and chuditch. All five species have site-specific management plans.


Boddington Operations Western Australia Technical Report Summary Date: February 2026 Page 17-2 17.4 Closure and Reclamation Considerations 17.4.1 Closure Plans The 1978 West Australian Mining Act requires that Newmont submits a closure plan every three years or as part of a mining proposal or as directed by the WA Department of Energy, Mines, Industry Regulation and Safety that is compliant with the 2016 Statutory Guideline for Mining Proposal and Mine Closure Plans. The most recent closure plan was submitted in 2023. The closure plan covers rehabilitation of the WRSFs, TSF, processing plant and other infrastructure with the goal of achieving safe, stable, and nonpolluting in perpetuity landforms. The open pits, post mining will be left as voids with interconnected pit lakes surrounded by constructed abandonment bunds. The closure strategy for disturbance associated with infrastructure and services is varied with the WRSF and TSF to be reshaped, fitted with drainage structures, covered with oxide and a growth medium, ripped, and seeded with local provenance species 17.4.2 Closure Costs Annually and as required by Part VIII of the Mining Act 1978, Boddington must complete a self- assessment report detailing disturbed areas and planned rehabilitation within existing tenements The disturbance area is used to calculate the annual 1% liability levy under the Mine Rehabilitation Fund (MRF) that is charged to the site and remains in effect until all tenements were signed off as rehabilitated. In 2025, the levy amounted to approximately US$1.2 M. Newmont is also required to calculate the closure costs for the Boddington Operations as part of internal closure and financial planning The closure estimate, as at 2025, assuming operations to 2040, is calculated as approximately US$0.5 B. 17.5 Permitting All major permits and approvals are either in place or Newmont expects to obtain them in the normal course of business. Additional permitting in support of the LOM tailings strategy (RDA2) was in progress at the Report date. Where permits have specific terms, renewal applications are made of the relevant regulatory authority as required, prior to the end of the permit term. Newmont monitors the regulatory regime in place for the Boddington Operations, and ensures that all permits are updated in line with any regulatory changes. 17.6 Social Considerations, Plans, Negotiations and Agreements The Boddington Operations are located within the Shire of Boddington local government area. Newmont defines the host communities for the Boddington Operations as those within a 50 km radius of the operation. These include the local government areas of Boddington, Williams, and Boddington Operations Western Australia Technical Report Summary Date: February 2026 Page 17-3 Wandering, and the community of Dwellingup. The Project’s area of influence consists of the following hierarchy that is applied to engagement, employment, procurement, and discretionary social investment: • The local government areas and communities; • The Gnaala Karla Booja Native Title Claimant or Indigenous Land Use Agreement area including the regional centers of Kwinana, Armadale, Rockingham, Bunbury, Collie, Narrogin, and Mandurah; • The broader southwest West Australian region including the greater Perth metropolitan area. In 2019 and 2020, the Boddington Operations completed the most recent five-yearly Social Impact Assessment and Social Baseline and Economic Contribution Assessment updates, which were supported by perception survey engagement processes. These social knowledge base studies quantify the operations social license, impact, engagement, employment, procurement, and discretionary investment aspects and inform LOM Social Management Planning. A social impact assessment was in progress at the Report date, and was expected to be delivered by Q2 2026 and would provide updated risks and opportunities for the Boddington Operations. A social impact assessment is currently in program to be delivered in Q4 2025–Q2 2026 and provide updated risks and opportunities for the Boddington Operations. Newmont has well-established relationships, engagement forums, and a suite of integrated social impact and opportunity-aligned strategic investment partnerships. The operations area is subject to the South West Native Title Settlement. The Preservation of Aboriginal Heritage Agreement formalized in 2007 prescribes the operations Heritage Area of Influence, the Heritage Agreement Project Area and Newmont’s particular heritage responsibilities reflected in the operations Cultural Heritage Management Plan. The Preservation of Aboriginal Heritage Agreement underpins and frames the heritage aspects of the Moorditj Booja Community Partnership Agreement (2006) between Gnaala Karla Booja People, Newmont, and the South West Aboriginal Land and Sea Council. The Preservation of Aboriginal Heritage Agreement ensures that Newmont meets and exceeds the minimum obligations prescribed in the State’s Aboriginal Heritage Act 1972. The agreement sets out processes for: • Communication and consultation via the Relationship Committee; • Joint management of Aboriginal heritage; • Heritage survey request triggers, methods, and team selection procedures; • Heritage survey costs and reporting; • Monitoring of ground disturbance works at specified Aboriginal sites; • Breaches and grievance resolution; • Environmental protection; • Identification and relocation of ancestral remains or objects; Boddington Operations Western Australia Technical Report Summary Date: February 2026 Page 17-4 • Section 18 Ministerial Consent processes; • Identification, protection, and preservation of Aboriginal cultural heritage; • Preservation of Aboriginal sites and objects. Aboriginal heritage sites identified in surveys are registered with the Aboriginal Heritage Inquiry System managed by the West Australia Department of Planning, Lands and Heritage. Sites are also mapped into Newmont’s ARC GIS heritage layers, are reflected in the site’s Cultural Heritage Management Plan and inform the operation’s Aboriginal cultural heritage due diligence that is embedded in Newmont’s Disturbance Permitting Processes. 17.7 Qualified Person’s Opinion on Adequacy of Current Plans to Address Issues Based on the information provided to the QP by Newmont (see Chapter 25), there are no material issues known to the QP. The Boddington Operations are mature mining operations and currently have the social license to operate within local communities. Boddington Operations Western Australia Technical Report Summary Date: February 2026 Page 18-1 18.0 CAPITAL AND OPERATING COSTS 18.1 Introduction Capital and operating cost estimates are at a minimum at a pre-feasibility level of confidence, having an accuracy level of ±25% and a contingency range not exceeding 15%. 18.2 Capital Cost Estimates 18.2.1 Basis of Estimate The capital estimate uses the 2026 budget plan (2026BP) capital as base. The capital cost consists of sustaining capitals for mining, processing, TSF, and site support. Capital costs are based on recent prices or operating data. Mining capital cost includes funding for mobile equipment re-build and replacement, mining infrastructures, surface drainage, pit dewatering, and miscellaneous expenditures required to maintain production. The cost also includes part of mobile equipment maintenance cost that is capitalized with asset componentization principle. Mobile equipment re-build and replacement schedule is driven by the age, annual usage, and life of the asset. Processing capital cost includes funding for fixed asset replacement and refurbishment, processing infrastructures, permitting, and miscellaneous expenditures required to maintain production. An undifferentiated process capital allowance of US$35 M/a was added for the period 2030–2035. The TSF capital cost includes funding for study and construction of F1/F3 to 750 Mt, F1/F3 capacity upgrade to 830 Mt and RDA2 to 600 Mt. The F1/F3 capacity upgrade is to mitigate risk to production due to potential delays in RDA2 construction. The RDA2 capital cost estimate is based on updated study estimates. Site support capital cost includes funding for village upgrade, roads, safety and emergency response and information technology. A total of US$84 M was added to the site sustaining capital cost, spread to years beyond 2029 to ensure the yearly capital is at similar run rate as the period from 2026–2029. 18.2.2 Capital Cost Estimate Summary The mining capital is US$1.02/t, and the combined processing and support capital is US$4.47/t. The overall capital cost estimate for the LOM is US$3.3 B as summarized in Table 18-1.


Boddington Operations Western Australia Technical Report Summary Date: February 2026 Page 18-2 Table 18-1: Capital Cost Estimate Area Unit Value Mining US$ billion 0.9 Process US$ billion 2.4 Site G&A US$ billion 0.1 Total US$ billion 3.3 Note: numbers have been rounded; totals may not sum due to rounding. 18.3 Operating Cost Estimates 18.3.1 Basis of Estimate The operating cost consists of mine operating cost, process operating cost and general and administration (G&A) cost. The costs are in 2026 dollars and no escalation was applied after 2026. The cost parameters used in calculation are derived from the 2026BP. The 2026BP rates and cost parameters are based on actuals seen during operations or contract terms. Actual costs and rates are used as the basis for forecasts for supplies and services unless there are new contract terms for these items. Labor and energy costs are based on budgeted rates applied to headcounts and energy consumption estimates. Mining operating costs include fixed and variable mine operation and mine maintenance costs which were estimated using the 2026BP cost assumptions and profiles. The process operating costs adopt a unit cost approach, with two distinct sub-approaches tailored to accommodate variations in production scenarios. During periods of normal throughput, processing operating costs are estimated using unit cost profiles by year sourced from the 2026BP. The total processing cost is calculated by multiplying the annual throughput by the corresponding unit cost for that year. The rehandle cost is added to the processing cost to account for cost reallocation from mining operation. The cost is derived from a high level analysis which determined that 25 Mt/a can be achieved by operating two ball mills only, at an annualized utilization of 91%. There would be an incremental reduction in operating equipment for secondary crushers, HPGRs and flotation and only one of the two scavenger tailings leach trains and associated gold recovery equipment would be required. As a result there will be cost reduction, but not in similar proportion to the throughput reduction. Site and regional G&A costs are estimated by multiplying the 2026BP profile and rates with the Reserve mine plan mill throughput. Boddington Operations Western Australia Technical Report Summary Date: February 2026 Page 18-3 18.3.2 Operating Cost Estimate Summary Operating costs for the LOM are estimated at US$12.3 B, as summarized in Table 18-2 and Table 18-3. Table 18-2: Operating Cost Estimate Area Unit Value Mining US$ billion 4.2 Process US$ billion 6.9 G&A US$ billion 1.3 Total US$ billion 12.3 Note: numbers have been rounded; totals may not sum due to rounding. Table 18-3: Operating Unit Cost Estimate Area Unit Value Mining US$/t mined 5.03 Process US$/t milled 12.62 G&A US$/t milled 2.31 Boddington Operations Western Australia Technical Report Summary Date: February 2026 Page 19-1 19.0 ECONOMIC ANALYSIS 19.1 Methodology Used The financial model that supports the mineral reserve declaration is a standalone model that calculates annual cash flows based on scheduled ore production, assumed processing recoveries, metal sale prices and US$/AU$ exchange rate, projected operating and capital costs and estimated taxes. The financial analysis is based on an after-tax discount rate of 5%. All costs and prices are in unescalated “real” dollars. The currency used to document the cash flow is US$. All costs are based on the 2026 business plan budget. Revenue is calculated from the recoverable metals and long-term metal price and exchange rate forecasts. 19.2 Financial Model Parameters The economic analysis is based on the metallurgical recovery predictions in Chapter 10.4, the mineral reserve estimates in Chapter 13, the mine plan discussed in Chapter 14, the commodity price forecasts in Chapter 16, closure cost estimates in Chapter 17.4.2, and the capital and operating costs outlined in Chapter 18. Royalties were summarized in Chapter 3.9. The Boddington Operations are subject to a federal tax rate of 30% on taxable income. The economic analysis is based on 100% equity financing and is reported on a 100% project ownership basis. The economic analysis assumes constant prices with no inflationary adjustments. The NPV5% is US$1.5 B. As the cash flows are based on existing operations where all costs are considered sunk to 1 January 2026, considerations of payback and internal rate of return are not relevant. Free cash flow is us$2.2 B. A summary of the financial results is provided in Table 19-1. Boddington Operations Western Australia Technical Report Summary Date: February 2026 Page 19-2 Table 19-1: Cash Flow Summary Table Item Unit Value Metal prices Gold US$/oz 2,000 Copper US$/lb 3.75 Milled Ore Tonnage Mt 545.1 Gold grade g/t 0.58 Copper grade % 0.09 Gold ounces Moz 10.2 Copper metric tonnes kt 494 Capital costs US$ billion 3.3 Costs applicable to sales US$ billion 13.3 Discount rate % 5 Exchange rate United States dollar: Australian dollar (US$:AU$) 0.70:1 Free Cash Flow US$ billion 2.2 Net Present Value US$ billion 1.5 Note: Table 19-1 contains “forward-looking statements” within the meaning of Section 27A of the Securities Act of 1933, as amended, and Section 21E of the Securities Exchange Act of 1934, as amended, which are intended to be covered by the safe harbor created by such sections and other applicable laws. Please refer to the note regarding forward-looking information at the front of the Report. The cash flow is only intended to demonstrate the financial viability of the Project. Investors are cautioned that the above is based upon certain assumptions which may differ from Newmont’s long-term outlook or actual financial results, including, but not limited to commodity prices, escalation assumptions, and other technical inputs. For example, Table 19-1 uses the price assumptions stated in the table, including a gold commodity price assumption of US$2,000/oz, which varies significantly from current gold prices and the assumptions that Newmont uses for its long-term guidance. Please be reminded that significant variation of metal prices, costs and other key assumptions may require modifications to mine plans, models, and prospects. Numbers have been rounded; totals may not sum due to rounding. An annualized cash flow statement is provided in Table 19-2 and Table 19-3. In these tables, EBITDA = earnings before interest, taxes, depreciation, and amortization. The active mining and processing operation ceases in 2040, however, closure costs are estimated to 2059. The closure estimate, as at December 31, 2025, assuming operations to 2040, is calculated as approximately US$0.5 B.


Boddington Operations Western Australia Technical Report Summary Date: February 2026 Page 19-3 Table 19-2: Annualized Cash Flow (2026–2032) Item Units LOM Total 2026 2027 2028 2029 2030 2031 2032 Material mined Mt 894.9 87.6 86.5 86.2 82.4 82.3 77.1 68.2 Ore processed Mt 545.1 38.0 37.6 37.7 37.6 37.6 39.0 40.1 Contained gold, ounces Moz 10.2 0.8 0.8 0.8 0.9 0.8 0.8 0.8 Contained copper, metric tonnes kt 494 26 31 33 34 33 38 40 Processed ore, gold grade g/t 0.58 0.62 0.70 0.69 0.71 0.66 0.65 0.62 Processed ore, copper grade % 0.09 0.07 0.08 0.09 0.09 0.09 0.10 0.10 Recovered gold, ounces Moz 8.6 0.6 0.7 0.7 0.7 0.7 0.7 0.7 Recovered copper, metric tonnes kt 391 20 25 27 27 27 31 33 Recovery, gold % 84 85 85 85 85 85 85 85 Recovery, copper % 79 79 80 80 80 80 81 81 Net revenue US$ billion 19.6 1.4 1.6 1.6 1.6 1.5 1.6 1.5 Costs associated with sales US$ billion (13.3) (0.9) (1.0) (0.9) (0.9) (0.9) (0.9) (1.0) EBITDA US$ billion 6.1 0.5 0.6 0.6 0.7 0.6 0.6 0.6 Operating cash flow US$ billion 5.4 0.3 0.4 0.5 0.5 0.4 0.5 0.5 Total capital US$ billion (3.3) (0.2) (0.3) (0.4) (0.4) (0.4) (0.4) (0.2) Free Cash Flow US$ billion 2.1 0.0 0.1 0.1 0.1 0.0 0.1 0.3 Boddington Operations Western Australia Technical Report Summary Date: February 2026 Page 19-4 Table 19-3: Annualized Cash Flow (2033–2040) Item Units 2033 2034 2035 2036 2037 2038 2039 2040 Material mined Mt 38.0 41.1 45.0 36.5 23.0 32.3 28.6 19.7 Ore processed Mt 41.0 41.0 41.0 41.2 41.0 25.0 25.0 22.0 Contained gold, ounces Moz 0.7 0.6 0.6 0.6 0.6 0.5 0.5 0.4 Contained copper, metric tonnes kt 35 27 33 35 39 35 31 25 Processed ore, gold grade g/t 0.52 0.43 0.48 0.46 0.45 0.63 0.64 0.58 Processed ore, copper grade % 0.08 0.07 0.08 0.08 0.10 0.14 0.12 0.12 Recovered gold, ounces Moz 0.6 0.5 0.5 0.5 0.5 0.4 0.4 0.3 Recovered copper, metric tonnes kt 27 20 25 26 29 29 26 21 Recovery, gold % 84 83 84 83 83 85 85 84 Recovery, copper % 79 73 77 75 75 8% 83 81 Net revenue US$ billion 1.3 1.1 1.2 1.2 1.2 1.0 1.0 0.8 Costs associated with sales US$ billion (0.9) (0.9) (1.0) (1.0) (1.1) (0.7) (0.7) (0.6) EBITDA US$ billion 0.4 0.1 0.2 0.2 0.1 0.4 0.4 0.2 Operating cash flow US$ billion 0.4 0.2 0.3 0.2 0.2 0.4 0.4 0.2 Total capital US$ billion (0.2) (0.2) (0.2) (0.2) (0.1) (0.0) (0.0) (0.0) Free Cash Flow US$ billion 0.3 0.0 0.1 0.1 0.1 0.3 0.3 0.2 Note: Table 19-2 and Table 19-3 contain “forward-looking statements” within the meaning of Section 27A of the Securities Act of 1933, as amended, and Section 21E of the Securities Exchange Act of 1934, as amended, which are intended to be covered by the safe harbor created by such sections and other applicable laws. Please refer to the note regarding forward-looking information at the front of the Report. The cash flow is only intended to demonstrate the financial viability of the Project. Investors are cautioned that the above is based upon certain assumptions which may differ from Newmont’s long-term outlook or actual financial results, including, but not limited to commodity prices, escalation assumptions, and other technical inputs. For example, Table 19-2 and Table 19-3 use the price assumptions stated in the tables, including a gold commodity price assumption of US$2,000/oz, which varies significantly from current gold prices and the assumptions that Newmont uses for its long-term guidance. Please be reminded that significant variation of metal prices, costs and other key assumptions may require modifications to mine plans, models, and prospects. Cash flow metal recoveries vary slightly from in situ recoveries as the recovered metal in the cash flow is calculated using combined recoveries as outcome of the processing schedule: in situ recoveries for direct feed and degraded recoveries for rehandled feed. The process schedule assumes recovery degradation of -3% Au and -9% Cu. Numbers have been rounded; totals may not sum due to rounding. EBITDA = earnings before interest, taxes, depreciation, and amortization. Material mined total includes 60.5 Mt of initial stockpiles. Boddington Operations Western Australia Technical Report Summary Date: February 2026 Page 19-5 19.3 Sensitivity Analysis The sensitivity of the Project to changes in metal prices, exchange rate, sustaining capital costs and operating cost assumptions was tested using a range of 25% above and below the base case values Figure 19-1. Figure 19-1: NPV Sensitivity Note: Figure prepared by Newmont, 2025. FCF = free cash flow; op cost = operating cost; cap cost = capital cost; NPV = net present value. The Project is most sensitive to metal price changes, less sensitive to changes in operating costs, and least sensitive to changes in capital costs. The sensitivity to grade mirrors the sensitivity to the gold price and is not shown. Boddington Operations Western Australia Technical Report Summary Date: February 2026 Page 20-1 20.0 ADJACENT PROPERTIES This Chapter is not relevant to this Report.


Boddington Operations Western Australia Technical Report Summary Date: February 2026 Page 21-1 21.0 OTHER RELEVANT DATA AND INFORMATION This Chapter is not relevant to this Report. Boddington Operations Western Australia Technical Report Summary Date: February 2026 Page 22-1 22.0 INTERPRETATION AND CONCLUSIONS 22.1 Introduction The QP notes the following interpretations and conclusions, based on the review of data available for this Report. 22.2 Property Setting The Boddington Operations are located in an area that has more than 40 years of mining activity. As a result, local and regional infrastructure, and the supply of goods available to support mining operations is well-established. Personnel with experience in mining-related activities are available in the district. There are excellent transportation routes that access the Boddington area. There are no significant topographic or physiographic issues that would affect the Boddington Operations. The dominant vegetation type is temperate boreal forest. Mining operations are conducted year-round. 22.3 Ownership The current parties to the BGMJV are Newmont Boddington Pty Ltd (66⅔%) and Saddleback Investments Pty Ltd (Saddleback; (33⅓%). Both companies are indirectly-wholly owned Newmont subsidiaries. 22.4 Mineral Tenure, Surface Rights, Water Rights, Royalties and Agreements Newmont subleases from the Worsley JV the key mining leases upon which the Boddington operations are located, namely M70/21–26, M70/564 and M70/799. Newmont is entitled to all gold and other non-bauxite mining rights conferred by the lease. The Worsley JV retains the rights to bauxite and priority rights of access in order to mine and recover such bauxite. The relationship between the Worsley JV bauxite operations and the BGMJV gold operations is regulated through a cross-operation agreement. This agreement confers priority on the bauxite operations such that the operations of the Worsley JV will take priority over the operations of the BGMJV and the BGMJV are required to take reasonable measures to conserve bauxite including by mining and stockpiling bauxite on behalf of the Worsley JV. Newmont has an interest in a total of 95 tenements in the Boddington area. The total granted area is approximately 21,249 ha and the under-application area is approximately 60,767 ha. Mining leases M70/21–26 and M70/799 are the key tenements under which gold mining activity is concentrated. Boddington Operations Western Australia Technical Report Summary Date: February 2026 Page 22-2 Through direct lease holding and sub-lease arrangements with the Worsley JV, Newmont holds the rights to minerals other than bauxite in proportion to the Newmont ownership percentages. Newmont holds sufficient surface rights to execute the LOM plan. Process water is supplied direct from the mine pits, from onsite storage reservoirs which were filled in the winter months by pumping from the Hotham River under a license from the Department of Water or from regional water bores which are available all year round. Process water is also sourced as reclamation of water from the decant pond at the TSF. Production royalties are payable to the West Australian government and are included in the net smelter return (NSR) cut-off determination. The Boddington Operations have freehold ownership of all the eastern and central areas of operations. The western portion of the operational area is outside the freehold land, and is Crown land covered by native forest. Mining operations can be conducted in this area but with certain restrictions imposed by the State Government through the 1978 Mining Act that are applicable to forested Crown lands. The restrictions have known and manageable requirements. The Boddington Operations area was previously subject to a land claim registered under the Native Title Act and referred to as the Gnaala Karla Booja Claim. This claim has now been settled. Newmont’s obligation to comply with the terms of Federal and State cultural heritage legislation, as well as the terms of its Aboriginal cultural heritage agreement continue to apply despite the extinguishment of native title over the Boddington Operations area. 22.5 Geology and Mineralization The deposit style is still somewhat controversial. Features consistent with porphyry-style mineralization, classic orogenic shear zones, and intrusion-related gold–copper–bismuth mineralization, are all recognized, giving rise to a variety of genetic interpretations. The geological understanding of the settings, lithologies, and structural and alteration controls on mineralization in the different zones is sufficient to support estimation of mineral resources and mineral reserves. The geological knowledge of the area is also considered sufficiently acceptable to reliably inform mine planning. The mineralization style and setting are well understood and can support declaration of mineral resources and mineral reserves. Newmont continues to actively explore in the Saddleback Greenstone Belt. Geophysics and surface geochemistry datasets are assisting in recognizing new belt-scale lineaments and felsic intrusions, similar to the monzogranite possibly associated with gold mineralization at Boddington, which could host additional Boddington-style mineralization. A number of possible cutbacks were identified adjacent to the current mine plan that may represent upside potential for the operations if these areas can be included in the LOM plan. Boddington Operations Western Australia Technical Report Summary Date: February 2026 Page 22-3 22.6 History The Boddington Operations have over 40 years of active mining history, and exploration activities date back to 1980 when gold was first discovered. 22.7 Exploration, Drilling, and Sampling The exploration programs completed to date are appropriate for the style of the mineralization within the Boddington Operations area. Drilling is normally perpendicular to the strike of the mineralization, but depending on the dip of the drill hole, and the dip of the mineralization, drill intercept widths are typically greater than true widths. Sampling methods, sample preparation, analysis, and security conducted prior to Newmont’s interest in the operations were in accordance with exploration practices and industry standards at the time the information was collected. Current Newmont sampling methods are acceptable for mineral resource and mineral reserve estimation. Sample preparation, analysis and security for the Newmont programs are currently performed in accordance with exploration best practices and industry standards. The quantity and quality of the lithological, geotechnical, collar and down-hole survey data collected during the exploration and delineation drilling programs are sufficient to support mineral resource and mineral reserve estimation. The collected sample data adequately reflect deposit dimensions, true widths of mineralization, and the style of the deposits. Sampling is representative of the gold and copper grades in the deposit, reflecting areas of higher and lower grades. Density measurements are considered to provide acceptable density values for use in mineral resource and mineral reserve estimation. The sample preparation, analysis, quality control, and security procedures used by the Boddington Operations have changed over time to meet evolving industry practices. Practices at the time the information was collected were industry-standard, and frequently were industry- leading practices. The sample preparation, analysis, quality control, and security procedures are sufficient to provide reliable data to support estimation of mineral resources and mineral reserves. The QA/QC programs adequately address issues of precision, accuracy, and contamination. Modern drilling programs typically included blanks, duplicates, and standard samples. QA/QC submission rates meet industry-accepted standards. 22.8 Data Verification Newmont had data collection procedures in place that included several verification steps designed to ensure database integrity. Newmont staff also conducted regular logging, sampling, laboratory, and database reviews. In addition to these internal checks, Newmont contracted independent


Boddington Operations Western Australia Technical Report Summary Date: February 2026 Page 22-4 consultants to perform laboratory, database, and mine study reviews. The process of active database quality control and internal and external audits generally resulted in quality data. The data verification programs concluded that the data collected from the Boddington Operations area adequately support the geological interpretations and constitute a database of sufficient quality to support the use of the data in mineral resource and mineral reserve estimation. Data that were verified on upload to the database are acceptable for use in mineral resource and mineral reserve estimation. The QP receives and reviews monthly reconciliation reports from the mine site. Through the review of these reconciliation factors the QP is able to ascertain the quality and accuracy of the data and its suitability for use in the assumptions underlying the mineral resource and mineral reserve estimates. 22.9 Metallurgical Testwork Industry-standard studies were performed as part of process development and initial mill design. Subsequent production experience and focused investigations guided mill alterations and process changes. Testwork programs, both internal and external, continue to be performed to support current operations and potential improvements. From time to time, this may lead to requirements to adjust cut-off grades, modify the process flowsheet, or change reagent additions and plant parameters to meet concentrate quality, production, and economic targets. Samples selected for testing were representative of the various types and styles of mineralization. Samples were selected from a range of depths within the deposit. Sufficient samples were taken so that tests were performed on sufficient sample mass. Recovery factors estimated are based on appropriate metallurgical testwork, and are appropriate to the mineralization types and the selected process routes. The average LOM gold recovery forecast is 85% and the forecast average LOM copper recovery is 81%. These forecasts do not include the application of recovery degradation to long-term stockpiles of medium-grade ore. Gold recovery is discounted by 3% and copper recovery is discounted by 9% to account for recovery degradation in the business plan. These degradation assumptions were verified by an ongoing stockpile oxidation testwork program. The mill throughput and associated recovery factors are considered appropriate to support mineral resource and mineral reserve estimation, and mine planning. Since commissioning in 2009, the operation has actively managed the arsenic level in plant feed and, through concentrate blending techniques, controlled the level in copper concentrate shipments to below the penalty rate trigger, hence no penalties were incurred to the Report date. Alumina remains the largest penalty element present in the copper concentrate, with shipments regularly exposed to a penalty adjustment. However, at 4–5% Al2O3 the levels are not far off the trigger point of 3% in most contracts and a modification to the process was made during Q1 2019 with the introduction of a cleaner–scalper column which reduces the non-sulfide gangue (i.e., Al2O3) in the concentrate and improves the grade of the concentrate as a result. Boddington Operations Western Australia Technical Report Summary Date: February 2026 Page 22-5 22.10 Mineral Resource Estimates Newmont has a set of protocols, internal controls, and guidelines in place to support the mineral resource estimation process, which the estimators must follow. Estimation was performed by Newmont personnel. All mineralogical information, exploration boreholes and background information were provided to the estimators by the geological staff at the mines or by exploration staff. Modelling was performed in Leapfrog, with resource estimates in Vulcan, Supervisor software and proprietary geostatistics workflows. Mineral resources are reported using the mineral resource definitions set out in SK1300, and are reported exclusive of those mineral resources converted to mineral reserves. The reference point for the estimate is in situ. Factors which may affect the mineral resource estimates include: metal price assumptions; changes to the assumptions used to generate the NSR cut-off; changes to design parameter assumptions that pertain to the conceptual pit shell design that constrain the mineral resources, including changes to geotechnical, mining and metallurgical recovery assumptions, and changes to royalties levied and any other relevant parameters that are included in and impact the NSR cut- off determination; changes in interpretations of mineralization geometry and continuity of mineralization zones; changes to the dilution skin percentages used for large dolerite dykes; and assumptions as to the continued ability to access the site, retain mineral and surface rights titles, maintain the operation within environmental and other regulatory permits, and retain the social license to operate. 22.11 Mineral Reserve Estimates Mineral reserves were converted from measured and indicated mineral resources. Inferred mineral resources were set to waste. Estimation was performed by Newmont personnel. All current mineral reserves will be exploited using open pit mining methods or are in stockpiles. The mine plan is based on a 41 Mt/a mill throughput rate. Pit designs are full crest and toe detailed designs with final ramps based on the selected optimum Whittle cones. Pit designs honor geotechnical guidelines. The mine schedule was developed at an NSR cut-off of US$18.24/t, incorporating the processing cost, metallurgical recovery, incremental ore mining costs, process sustaining capital and tailings dam-related rehabilitation costs. The block models were constructed to include the expected dilution based on mining methods, bench height, and other factors. The current mine and process reconciliation appears to support this assumption. The mill processes higher-grade ores delivered from the mine at an elevated cut-off. The ore between the elevated cut-off and the marginal cut-off is stockpiled for later processing at the end of the mine life. Stockpile estimates were based on mine dispatch data; the grade comes from closely-spaced blasthole sampling and tonnages were sourced from truck factors. Boddington Operations Western Australia Technical Report Summary Date: February 2026 Page 22-6 Mineral reserves are reported using the mineral reserve definitions set out in SK1300. The reference point for the estimate is the point of delivery to the process plant. Areas of uncertainty that may materially impact the mineral reserve estimates include: changes to long-term metal price and exchange rate assumptions; changes to metallurgical recovery assumptions; changes to the input assumptions used to derive the pit designs applicable to the open pit mining methods used to constrain the estimates; changes to the forecast dilution and mining recovery assumptions; changes to the cut-off values applied to the estimates; variations in geotechnical (including seismicity), hydrogeological and mining method assumptions; and changes to environmental, permitting and social license assumptions. 22.12 Mining Methods Mineral reserves were estimated assuming open pit mining, and the use of conventional Owner- operated equipment. Open pit designs were assessed and reviewed prior to pit excavation to ensure adequacy and integrity of design geometry with consideration to ground conditions. A continuous system of assessment was implemented and is adhered to during ongoing excavation processes in order to document and verify geological conditions as they were encountered. The pit dewatering system will continuously receive large volumes of groundwater and surface run-off over the LOM. The long-term dewatering strategy assumes that this trend continues throughout the LOM. The LOM pit dewatering plan will strategically upgrade the in-pit sump pump system (passive dewatering) and dewatering-bores (active dewatering) to cope with operational needs as required. The LOM plan envisages mining at an average rate of approximately 56 Mt/a for 15 years, peaking at 87 Mt/a in 2026, with a maximum rate of advance by pit stage of six benches per annum and an average of five benches (60 m) per year. The mine life will extend to 2040 with both mine and mill ceasing in the same year. The mine plan assumes five pit phases remain. As part of day-to-day operations, Newmont will continue to perform reviews of the mine plan and consider alternatives to, and variations within, the plan. Alternative scenarios and reviews may be based on ongoing or future mining considerations, evaluation of different potential input factors and assumptions, and corporate directives. 22.13 Recovery Methods The process plant design was based on a combination of metallurgical testwork, previous study designs, previous operating experience. The design is conventional to the gold industry and has no novel parameters. The plant will produce variations in recovery due to the day-to-day changes in ore type or combinations of ore type being processed. These variations are expected to trend to the forecast recovery value for monthly or longer reporting periods. Boddington Operations Western Australia Technical Report Summary Date: February 2026 Page 22-7 22.14 Infrastructure The majority of the key infrastructure to support the mining activities envisaged in the LOM is in place. A second TSF (RDA2) will be required for the LOM plan. Within Newmont’s ground holdings, there is sufficient area to allow construction of any additional infrastructure that may be required in the future. Personnel live either surrounding settlements or stay at the accommodation village. A number of WRSFs are in use, segregated as oxide or rock facilities. Potentially acid-forming waste is encapsulated as required. Stockpiles are reclaimed using a preferential high-grade feed strategy, with the lower medium- grade stockpiles being re-handled to the mill towards the end of the LOM. The stockpiles are reclaimed using conventional mining fleet and loading units. The F1/F3 tailings facility is the current active TSF for the Boddington Operations. The current F1/F3 dam has approved capacity to 750 Mt, which will provide sufficient storage for tailings storage to mid-2030, assuming remaining capacity of 168 Mt, and an approximate 38 Mt/a process rate. The approved facility has 11 perimeter embankments, of which all are in place. Newmont plans to expand the facility to 830 Mt, which, assuming the same approximately 38 Mt/a process rate, will provide tailings capacity to mid-2032. The expansion to 830 Mt is not currently permitted. Additional storage that will be required for the LOM beyond mid-2032 is being evaluated by Newmont. This is currently envisaged as a new tailings facility with a 294 Mt capacity. Newmont has established a pathway and a timeline for the tailings facility approval and construction such that storage capacity will be available when needed. The current TSF is operated as a zero-discharge facility; all water is returned to the process facility for reuse. Process water is supplied direct from the mine pits, from onsite storage reservoirs which were filled in the winter months by pumping from the Hotham River under a license from the Department of Water or from regional water bores which are available year-round. Process water is also sourced as reclamation of water from the decant pond at the TSF. Power is sourced from the Bluewater Power Station, and transmitted through the State power grid from the power station to the mine site. 22.15 Market Studies Newmont has an internal marketing department that is tasked with monitoring global commodities markets, including the products from the Boddington Operations. The operations produce a gold– copper concentrate. Newmont has contracts in place for the majority of the copper concentrate. The terms contained within the concentrate sales contracts are typical and consistent with standard industry practice for high-gold, low-copper concentrates. The contracts include industry benchmark terms for metal payables, treatment charges and refining charges for concentrates


Boddington Operations Western Australia Technical Report Summary Date: February 2026 Page 22-8 produced. Depending on the specific contract, the terms for the sale of the copper concentrate are either annually negotiated, benchmark-based treatment and refining charges, or a combination of annually-negotiated terms. Newmont’s bullion is sold on the spot market, by marketing experts retained in-house by Newmont. The terms contained within the sales contracts are typical and consistent with standard industry practice and are similar to contracts for the supply of doré elsewhere in the world. The largest in-place contracts other than for product sales cover items such as bulk commodities, operational and technical services, mining and process equipment, and administrative support services. Contracts are negotiated and renewed as needed. Contract terms are typical of similar contracts in Australia that Newmont is familiar with. 22.16 Environmental, Permitting and Social Considerations Baseline and supporting environmental studies were completed to assess both pre-existing and ongoing site environmental conditions, as well as to support decision-making processes during operations start-up and restart. Characterization studies were completed for all environmental media including soil, water, waste, air, noise, and closure. Plans were developed and implemented to address aspects of operations such as waste and fugitive dust management, spill prevention and contingency planning, water management, and noise levels. There are five species classified as Threatened Species/Matters of National Environmental Significance in the Project area. All five species have site-specific management plans. Annually and as required by Part VIII of the Mining Act 1978, Boddington must complete a self- assessment report detailing disturbed areas and planned rehabilitation within existing tenements The disturbance area is used to calculate the annual 1% liability levy under the Mine Rehabilitation Fund (MRF) that is charged to the site and remains in effect until all tenements were signed off as rehabilitated. In 2025, the levy amounted to approximately US$1.2 M. Newmont is also required to calculate the closure costs for the Boddington Operations as part of internal closure and financial planning The closure estimate, as at 2025, assuming operations to 2040, is calculated as approximately US$0.5 B. All major permits and approvals are either in place or Newmont expects to obtain them in the normal course of business. Additional permitting will be required to support the tailings disposal required in the LOM plan. Where permits have specific terms, renewal applications are made of the relevant regulatory authority as required, prior to the end of the permit term. The operations area is subject to the South West Native Title Settlement. Newmont has well-established relationships, engagement forums, and a suite of integrated social impact and opportunity-aligned strategic investment partnerships. Boddington Operations Western Australia Technical Report Summary Date: February 2026 Page 22-9 22.17 Capital Cost Estimates Capital costs were based on recent prices or operating data and are at a minimum at a pre- feasibility level of confidence, having an accuracy level of ±25% and a contingency range not exceeding 15%. Capital costs included funding for infrastructure, pit dewatering, development drilling, and permitting as well as miscellaneous expenditures required to maintain production. Mobile equipment re-build/replacement schedules and fixed asset replacement and refurbishment schedules were included. Sustaining capital costs reflected current price trends. The mining capital is US$1.02/t, and the combined processing and support capital is US$4.47/t. The overall capital cost estimate for the LOM is US$3.3 B 22.18 Operating Cost Estimates Operating costs were based on actual costs seen during operations and are projected through the LOM plan, and are at a minimum at a pre-feasibility level of confidence, having an accuracy level of ±25% and a contingency range not exceeding 15%. Historical costs were used as the basis for operating cost forecasts for supplies and services unless there are new contract terms for these items. Labor and energy costs were based on budgeted rates applied to headcounts and energy consumption estimates. Operating costs for the LOM are estimated at US$12.3 B. The estimated LOM mining cost is US$5.03/t. The base processing cost is estimated at US$12.62/t. In addition, G&A costs are estimated at US$2.31/t. 22.19 Economic Analysis The NPV5% is US$1.5 B. As the cash flows are based on existing operations where all costs are considered sunk to 1 January 2026, considerations of payback and internal rate of return are not relevant. Free cash flow is us$2.2 B. The active mining and processing operation ceases in 2040; however, closure costs are estimated to 2059. Closure costs are estimated at $0.5 B. The Project is most sensitive to metal price changes, less sensitive to changes in operating costs, and least sensitive to changes in capital costs. The sensitivity to grade mirrors the sensitivity to the gold price. 22.20 Risks and Opportunities Factors that may affect the mineral resource and mineral reserve estimates were identified in Chapter 11.13 and Chapter 12.9 respectively. Boddington Operations Western Australia Technical Report Summary Date: February 2026 Page 22-10 22.20.1 Risks The risks associated with the Boddington site are generally those expected with a large surface mining operation and include the accuracy of the resource model, unexpected geological features that cause geotechnical issues, dewatering difficulties, and/or operational impacts. Other risks noted include: • Commodity price increases for key consumables such diesel, electricity, tires, and chemicals would negatively impact the stated mineral reserves and mineral resources; • Labor cost increases or productivity decreases could also impact the stated mineral reserves and mineral resources, or impact the economic analysis that supports the mineral reserves; • While the autonomous haulage system is currently operational, any unforeseen issues with this innovative system could increase costs and/or lower expected productivities; • With bauxite mining having precedence over other minerals there is a risk that any unexpected requirement to advance bauxite mining (or delay gold mining) could increase costs and/or delay the expected production profile; • Geotechnical and hydrological assumptions used in mine planning are based on historical performance, and to date historical performance has been a reasonable predictor of current conditions. Any changes to the geotechnical and hydrological assumptions could affect mine planning, affect capital cost estimates if any major rehabilitation is required due to a geotechnical or hydrological event, affect operating costs due to mitigation measures that may need to be imposed, and impact the economic analysis that supports the mineral reserve estimates; • The mine plan assumes that the existing TSF can be expanded from 750 Mt to 830Mt. While there is sufficient time for the permitting process prior to the expansion being required in 2029, if there is a delay in the permitting process or the facility cannot be expanded, this could impact the mine plan, the mineral reserve estimates and the economic analysis that supports the mineral reserve estimates; • The mine plan assumes that a second tailings facility can be constructed and permitted. Newmont has established a pathway and a timeline to develop additional tailings capacity such that storage capacity will be available when needed. However, if there are changes to the assumed pathway, to the ability to construct and permit such a facility, or to the timeline assumptions, this could impact the mine plan, the mineral reserve estimates and the economic analysis that supports the mineral reserve estimates; • The mineral reserve estimates are very sensitive to metal prices. Lower metal prices than forecast in the LOM plan may require revisions to the mine plan, with impacts to the mineral reserve estimates and the economic analysis that supports the mineral reserve estimates; • There are five species classified as Threatened Species/Matters of National Environmental Significance in the Project area. Although there are site-specific management plans in place, if there is a major impact seen on the populations from mining activities, the environmental Boddington Operations Western Australia Technical Report Summary Date: February 2026 Page 23-11 permits for the operations could be revised or even revoked. The social license to operate could also be impacted; • Climate changes could impact operating costs and ability to operate; • There is a risk to the Boddington Operations overall if the Worsley JV were to fail to renew the mining leases, as Newmont’s interest relies on the existence of valid mining tenure. 22.20.2 Opportunities Opportunities for the Boddington Operations include moving the stated mineral resources into mineral reserves through additional drilling and study work. The mineral reserves and mineral resources are based on conservative price estimates for gold and copper so upside exists, either in terms of the potential to estimate additional mineral reserves and mineral resources or improved economics should the prices used for gold and copper be increased. Opportunities include: • Conversion of some or all of the measured and indicated mineral resources currently reported exclusive of mineral reserves to mineral reserves, with appropriate supporting studies; • Upgrade of some or all of the inferred mineral resources to higher-confidence categories, such that such better-confidence material could be used in mineral reserve estimation; • Higher metal prices than forecast could present upside sales opportunities and potentially an increase in predicted Project economics; • Potential to link the north and south pits through the saddle area to form a single large open pit. This will require additional mining and economic studies. 22.21 Conclusions Under the assumptions presented in this Report, the Boddington Operations have a positive cash flow, and mineral reserve estimates can be supported. 23.0 RECOMMENDATIONS As Boddington is an operating mine, the QP has no material recommendations to make.


Boddington Operations Western Australia Technical Report Summary Date: February 2026 Page 24-1 24.0 REFERENCES 24.1 Bibliography Allibone, A.H., Windh, J., Etheridge, M.A., Burton, D., Anderson, G., Edwards, P., Miller, A., Graves, C., Fanning, C.M., and Wysoczanski, R., 1998: Timing Relationships and Structural Controls on the Location of Au–Cu Mineralization at the Boddington Gold Mine, Western Australia: Economic Geology, 93, pp. 245–270. AMMTEC, 1989: Assessment of Australian Assay Laboratories Boddington Facility: unpublished internal report by AMMTEC to Boddington Gold Mine. ANCOLD, 2019: Guidelines on Tailings Dams – Planning, Design, Construction, Operation and Closure: July 2019, Revision 1. AngloGold Ashanti Australia, 2001: AngloGold Inputs for 1999 Wandoo Resource Assessment and the Derivation of a Factor for the Economic Model: unpublished internal report by AngloGold Ashanti Australia to NBGJV, October 2001. AngloGold Ashanti Australia, 2003: Boddington Joint Venture, 2003 AngloGold–BGM Collaborative Study — Boddington Gold Mine Exploration Data Review and Target Generation: unpublished internal report NBGJV, December 2003. AngloGold Ashanti Australia, 2004a: Boddington – Drill Hole Bias Examination: unpublished internal report by AngloGold Ashanti Australia to NBGJV, February 2004. AngloGold Ashanti Australia, 2004b: Boddington Basement Pits Grade Control Information Examination: unpublished internal report by AngloGold Ashanti Australia to NBGJV, March 2004. AngloGold Ashanti Australia, 2004c: Boddington Geology and Domain Review: unpublished internal report by AngloGold Ashanti Australia to NBGJV, June 2004. Augenstein, C. et.al. 2012: Boddington Geological Campaign 2012: unpublished internal report by Jigsaw Geoscience to NBG, November 2012. Barley M.E., Groves D.I. and Blake T.S., 1992: Archaean metal deposits related to tectonics: evidence from Western Australia, Perth, Western Australia: Geology Department and University Extension, University of Western Australia Publication 22, p. 307–324. Boddington Gold Mining Company, 2003: Review of AGAA Estimation Domains: internal NBGJV report, October 2003. Boddington Gold Mining Company, 2004a: FSU Local Resource Estimate Quality, Mining Dilution and Recovery Review: internal NBGJV report, January 2004. Boddington Gold Mining Company, 2004b: Recommended Configuration of the FSU Phase 3 Local Resource Estimate: internal NBGJV report, December 2004. Douglas, I., 2004: Boddington Drill Hole Bias Investigations: internal memorandum from Newmont Gold Corp. to NBGJV, 4 April, 2004. Fluor Australia Pty Ltd, 2000: Boddington Expansion Feasibility Study Update: internal report by Fluor Australia Pty Ltd to Boddington Gold Mine, Volume 1 (Executive Summary), Volume 2 (Geology and Resource), Volume 3 (Mining), and Volume 4 (Process). Boddington Operations Western Australia Technical Report Summary Date: February 2026 Page 24-2 Gleeson, K., Tangney, G., Behn, M., and Hutchin, S., 1999: Boddington Gold Mine — Wandoo Project, Wandoo South and North Geology Report, Volume 1: internal report by Boddington Gold Mine. Golder Associates, 2002: Report on Geological Modeling and Recoverable Resource Estimation of the Wandoo Deposit: internal report by Golder Associates to NBGJV, May 2002. Golder Associates, 2002: Review of the Effects of Potential Check Assay Biases: unpublished internal report by Golder Associates to NBGJV, May 2002. Golder Associates, 2003: Report on 2003 Multiple Indicator Kriging Resource Estimate of the Wandoo Deposit, Boddington Gold Mine: internal report by Golder Associates to NBGJV, May 2003. Golder Associates, 2004a: Kriging Neighborhood Analysis and Re-estimation of the Boddington Gold Mine Expansion Resource Model: internal report by Golder Associates to NBGJV, April 2004. Golder Associates, 2004b: Review of Acid Rock Drainage Studies for the Boddington Expansion Project: internal report by Golder Associates to NBGJV, April 2004. Golder Associates, 2005a: Local Resource Estimates for the Boddington Gold Mine Expansion: internal report by Golder Associates to NBGJV, February 2005. Golder Associates, 2005b: Global Resource Simulation Study for the Boddington Gold Mine Expansion: internal report by Golder Associates to NBGJV, June 2005. Golder Associates, 2005c: BGME Probability-Based Resource Classification Using Simulations: internal report by Golder Associates to NBGJV, September 2005. Golder Associates, 2017a: Technical Review of Mineral Resources and Mineral Reserves: internal report by Golder Associates to NBG, May 2017. Golder Associates, 2017b: Newmont Boddington 2017 Preliminary Ore Reserve: internal report by Golder Associates to NBG, November 2017. Golder Associates, 2018: Technical Review of 2017 Mineral Resource Update: internal report by Golder Associates to NBG, January 2018. Kenny, K., Tangney, G., and Rowell, A., 2002: Boddington Expansion Project Wandoo Mineral Resource: internal report by AngloGold Ashanti Australia to NBGJV. Kirkham, R.V., 1972: Porphyry Deposits: in Blackadar, R.G., ed., Report of Activities Part B, November 1971 to March 1972: Geological Survey of Canada, Paper 72-1b, pp. 62–64. Knight Piesold Consulting, 2016: F1/F3 Residue Disposal Area 2015 RDA Cone Penetration Testing: internal report by Knight Piesold Consulting to NBG, February 2016 Libby, W.G. and DeLaeter, J.R., 1998: Biotite Rb-Sr Age Evidence for Early Palaeozoic Tectonism and the Cratonic Margin in Southwestern Australia: Australian Journal of Earth Sciences, vol 45, pp. 623–632. Masters, S., 2008: Audit of the BGM 2007 Resource Model, Boddington Mine, WA: internal report byCS-2 Pty Ltd to NBGJV, September 2008. McCuaig, T., and Behn, M., 2001: Boddington Gold Mine: Nature of the Mineralisation in the Wandoo North Basement Resource and Refinements to the Model for Genesis of Mineralisation at Wandoo: internal report by SRK Consulting to NBGJV. Boddington Operations Western Australia Technical Report Summary Date: February 2026 Page 24-3 McCuaig, T.C, Behn, M.T., Stein, H., Hagemann, S.G., McNaughton, N., Cassidy, K,F., Champion, D., and Wyborn, L., 2002: The Boddington Gold Mine: a new style of Archaean Au– Cu deposit: in WA Gold Giants, MSc Short Course Notes, Centre for Global Metallogeny, University of WA, pp. 61–64. Miller, A., Behn, M., and Gleeson K., 1996: Wandoo Prospect Geological Report, Volume 1: internal report by Boddington Gold Mine. Newmont Mining Corporation, 2014b: Geotechnical Study for Hard Rock Slope Design at Newmont Boddington Gold, 20130328-GT-PROJ-AT- Hard Rock Study Report Final, March 2014. Newmont Mining Corporation, 2016: 75Deg Steepening Trails: internal report, GT-GM060- 20161026-AGJ-FINAL, October 2016. Newmont Mining Ltd. 2004a: NML Review of Boddington Project Resource: internal report by Newmont Mining Ltd to NBGJV, January 2004. Newmont Mining Ltd, 2004b: Boddington Drill Hole Bias Investigations: internal report by Newmont to NBGJV, April 2004. Peattie R., 2004: Boddington Drillhole Bias Examination: internal memorandum from AngloGold Ashanti to NBGJV, 19 February 2004. Petrucci, P., 2014: Metallurgical Performance Model Update 2014, Newmont Boddington Gold: internal report by Boddington Gold Mine. Petrucci, P., 2015: 2015 Gold Recovery Function Update, Newmont Boddington Gold: internal report by Boddington Gold Mine. Petrucci, P., 2021: Impact of Stockpile Oxidation on Recovery at NBG: Newmont Boddington Gold, unpublished internal report by Boddington Gold Mine. Quantitative Geoscience, 2003: Audit of the 2003 Boddington Resource Estimate: unpublished internal report by Quantitative Geoscience to NBGJV, October 2003. Ravenscroft, P., 2007: Review of Gold Resource Modeling Methodology, Boddington Mine, WA: internal report by CS-2 Pty Ltd to NBGJV, August 2007. Roberts, M., 2012: Metallurgical Performance Models, Newmont Boddington Gold: internal report by Boddington Gold Mine. Rossi, M., 2009: 2009 UC Resource Model Independent Audit Report, Boddington Gold Mine: internal report by GeoSystems International Inc to NBG, September 2009. Roth, E., 1992: The Nature and Genesis of Archaean Porphyry-Style Cu–Au–Mo Mineralisation at the Boddington Gold Mine, Western Australia: Ph.D. thesis, University of Western Australia. Runge, K.,2012: Evaluation of Recovery Function Predictions – February 2012: internal report by Metso Process Technology & Innovation to NBG Sillitoe, R. H., 2000: Gold-Rich Porphyry Deposits: Descriptive and Genetic Models and their Role in Exploration and Discover: in Gold in 2000, Reviews in Economic Geology, Vol. 13, Society of Economic Geologists. Sinclair, W.D., 2006: Consolidation and Synthesis of Mineral Deposits Knowledge - Porphyry Deposits: report posted to Natural Resources Canada website 30 January 2006, 14 http://gsc.nrcan.gc.ca/mindep/synth_dep/porph/index_e.php>. Boddington Operations Western Australia Technical Report Summary Date: February 2026 Page 24-4 Snowden Consulting, 2012: 2235: Geotechnical Assessment of Fresh Rock Pit Cut-back: April 2012. SRK Consulting, 2005: Deleterious Elements Modeling: internal report by SRK Consulting to NBGJV, May 2005. SRK Consulting, 2012. NEM008: Boddington Gold Mine: Geotechnical Study for Final Saprolite Slopes: February 2012. Stein, H.J., Markey, R.J., Morgan, J.W., Selby, D., Creaser, R.A., McCuaig, T.C., and Behn M., 2001: Re-Os Dating of Boddington Molybdenite, SW Yilgarn: Two Au Mineralization Events: report posted to University of Alberta website. Stewart, J. 2022: Effects of Stockpile Oxidation on Recoveries at NBG. Internal Memorandum, February April, 2022. Stoker, P., 2000: Audit Boddington Expansion QA/QC: internal report to NBGJV, September 2000. Stoker, P., 2001: Review of Additional QA/QC Data, Boddington Expansion: internal report to NBGJV, February 2001. Stoker, P., 2002: Review of BGM QA/QC Assay Data, Boddington Expansion: internal report to NBGJV, January 2002. Surman, J., 1999: Boddington Gold Mine Audit of data used in preparation for the Wandoo Bedrock Resource Estimation: internal report by Snowden Mining Industry Consultants to Boddington Gold Mine. Symons, P.M., Anderson, G., Beard, T.J., Hamilton, L.M., Reynolds, G.D., Robinson, J.M., Staley, R.W., and Thompson, C.M., 1990: Boddington Gold Deposit: in Geology of the Mineral Deposits of Australia and Papua New Guinea, ed. F. E. Hughes, Australasian Institute of Mining and Metallurgy Monograph 14, Volume 1, pp. 165–169. Tangney, G., 2000: Boddington Gold Mine Basement Gold Assay Quality Control: internal memorandum by Boddington Gold Mine. Wilde, S. A., 1976: The Saddleback Group – A Newly-Discovered Archaean Greenstone Belt in the Southwestern Yilgarn Block: Western Australian Geological Survey Annual Report 1975, pp. 92–95. 24.2 Abbreviations and Symbols Abbreviation/Symbol Term AAL Australian Assay Laboratories AARL Anglo American Research Laboratory AAS Atomic Absorption Spectrometry Alcoa Alcoa of Australia Ltd. Amdel Amdel Laboratory


Boddington Operations Western Australia Technical Report Summary Date: February 2026 Page 24-5 Abbreviation/Symbol Term ARD acid rock drainage AU$ Australian dollar B billion BGJV Boddington Gold Joint Venture BGMJV Boddington Gold Mine Joint Venture BHP BHP Minerals Ltd. CIM Canadian Institute of Mining, Metallurgy and Petroleum CNwad weak acid-dissociable cyanide CRF capital recovery factor CST cleaner scavenger tailings DGPS digital global positioning system G&A general and administrative Genalysis Genalysis Laboratory GPS global positioning system HPGR high pressure grinding rolls ICP-AES inductively-coupled plasma atomic emission spectroscopy ICP-MS inductively coupled plasma– mass spectrometry ICP-OES inductively coupled plasma- optical emission spectroscopy JORC Joint Ore Reserve Committee LOM life-of-mine M million MMI mobile metal ion MPa megapascals NAPP net acid-producing potential NBG Newmont Boddington Gold NBGJV Newmont Boddington Gold Joint Venture Boddington Operations Western Australia Technical Report Summary Date: February 2026 Page 24-6 Abbreviation/Symbol Term Newmont Newmont Corporation; formerly Newmont Mining Corporation NSR net smelter return OK ordinary kriging QA/QC Quality assurance and quality control QP Qualified Person RAB rotary air blast RC reverse circulation RDA residue disposal area Reynolds Reynolds Australia Alumina Ltd. RL Relative level ROM run-of-mine RQD rock quality description SAG semi-autogenous grind SG Specific gravity Shell The Shell Company of Australia Ltd. SME Society for Mining, Metallurgy and Exploration SMU selective mining unit TSF tailing storage facility UltraTrace UltraTrace Geoanalytical Laboratories US United States WA Western Australia WA Heritage Act Aboriginal Heritage Act 1972 (WA) Worsley Worsley Alumina Pty Ltd Worsley JV Worsley Alumina Joint Venture Boddington Operations Western Australia Technical Report Summary Date: February 2026 Page 24-7 24.3 Glossary of Terms Term Definition acid rock drainage/acid mine drainage Characterized by low pH, high sulfate, and high iron and other metal species. amphibolite facies one of the major divisions of the mineral-facies classification of metamorphic rocks, the rocks of which formed under conditions of moderate to high temperatures (500° C, or about 950° F, maximum) and pressures. Amphibole, diopside, epidote, plagioclase, almandine and grossular garnet, and wollastonite are minerals typically found in rocks of the amphibolite facies ANFO A free-running explosive used in mine blasting made of 94% prilled aluminum nitrate and 6% No. 3 fuel oil. ball mill A piece of milling equipment used to grind ore into small particles. It is a cylindrical shaped steel container filled with steel balls into which crushed ore is fed. The ball mill is rotated causing the balls themselves to cascade, which in turn grinds the ore. bullion Unrefined gold and/or silver mixtures that have been melted and cast into a bar or ingot. Caro’s acid A reagent (H2SO5) generated through the combination of hydrogen peroxide and sulfuric acid, used in cyanide destruction and detoxification. comminution/crushing/grinding Crushing and/or grinding of ore by impact and abrasion. Usually, the word "crushing" is used for dry methods and "grinding" for wet methods. Also, "crushing" usually denotes reducing the size of coarse rock while "grinding" usually refers to the reduction of the fine sizes. concentrate The concentrate is the valuable product from mineral processing, as opposed to the tailing, which contains the waste minerals. The concentrate represents a smaller volume than the original ore cut-off grade A grade level below which the material is not “ore” and considered to be uneconomical to mine and process. The minimum grade of ore used to establish reserves. cyanidation A method of extracting gold or silver by dissolving it in a weak solution of sodium cyanide. data verification The process of confirming that data has been generated with proper procedures, has been accurately transcribed from the original source and is suitable to be used for mineral resource and mineral reserve estimation decline A sloping underground opening for machine access from level to level or from the surface. Also called a ramp. density The mass per unit volume of a substance, commonly expressed in grams/ cubic centimeter. Boddington Operations Western Australia Technical Report Summary Date: February 2026 Page 24-8 Term Definition development Often refers to the construction of a new mine or; Is the underground work carried out for the purpose of reaching and opening up a mineral deposit. It includes shaft sinking, cross-cutting, drifting and raising. dilution Waste of low-grade rock which is unavoidably removed along with the ore in the mining process. easement Areas of land owned by the property owner, but in which other parties, such as utility companies, may have limited rights granted for a specific purpose. electrowinning. The removal of precious metals from solution by the passage of current through an electrowinning cell. A direct current supply is connected to the anode and cathode. As current passes through the cell, metal is deposited on the cathode. When sufficient metal has been deposited on the cathode, it is removed from the cell and the sludge rinsed off the plate and dried for further treatment. elution Recovery of the gold from the activated carbon into solution before zinc precipitation or electro-winning. EM Geophysical method, electromagnetic system, measures the earth's response to electromagnetic signals transmitted by an induction coil encumbrance An interest or partial right in real property which diminished the value of ownership, but does not prevent the transfer of ownership. Mortgages, taxes, and judgements are encumbrances known as liens. Restrictions, easements, and reservations are also encumbrances, although not liens. feasibility study A feasibility study is a comprehensive technical and economic study of the selected development option for a mineral project, which includes detailed assessments of all applicable modifying factors, as defined by this section, together with any other relevant operational factors, and detailed financial analysis that are necessary to demonstrate, at the time of reporting, that extraction is economically viable. The results of the study may serve as the basis for a final decision by a proponent or financial institution to proceed with, or finance, the development of the project. A feasibility study is more comprehensive, and with a higher degree of accuracy, than a pre-feasibility study. It must contain mining, infrastructure, and process designs completed with sufficient rigor to serve as the basis for an investment decision or to support project financing. flotation Separation of minerals based on the interfacial chemistry of the mineral particles in solution. Reagents are added to the ore slurry to render the surface of selected minerals hydrophobic. Air bubbles are introduced to which the hydrophobic minerals attach. The selected minerals are levitated to the top of the flotation machine by their attachment to the bubbles and into a froth product, called the "flotation concentrate." If this froth carries more than one mineral as a designated main constituent, it is called a "bulk float". If it is selective to one constituent of the ore, where more than one will be floated, it is a "differential" float. flowsheet The sequence of operations, step by step, by which ore is treated in a milling, concentration, or smelting process.


Boddington Operations Western Australia Technical Report Summary Date: February 2026 Page 24-9 Term Definition frother A type of flotation reagent which, when dissolved in water, imparts to it the ability to form a stable froth gangue The fraction of ore rejected as tailing in a separating process. It is usually the valueless portion, but may have some secondary commercial use greenschist facies one of the major divisions of the mineral facies classification of metamorphic rocks, the rocks of which formed under the lowest temperature and pressure conditions usually produced by regional metamorphism. Temperatures between 300 and 450 °C (570 and 840 °F) and pressures of 1 to 4 kilobars are typical. The more common minerals found in such rocks include quartz, orthoclase, muscovite, chlorite, serpentine, talc, and epidote high pressure grinding rolls (HPGR) A type of crushing machine consisting of two large studded rolls that rotate inwards and apply a high pressure compressive force to break rocks. indicated mineral resource An indicated mineral resource is that part of a mineral resource for which quantity and grade or quality are estimated on the basis of adequate geological evidence and sampling. The term adequate geological evidence means evidence that is sufficient to establish geological and grade or quality continuity with reasonable certainty. The level of geological certainty associated with an indicated mineral resource is sufficient to allow a qualified person to apply modifying factors in sufficient detail to support mine planning and evaluation of the economic viability of the deposit. inferred mineral resource An inferred mineral resource is that part of a mineral resource for which quantity and grade or quality are estimated on the basis of limited geological evidence and sampling. The term limited geological evidence means evidence that is only sufficient to establish that geological and grade or quality continuity is more likely than not. The level of geological uncertainty associated with an inferred mineral resource is too high to apply relevant technical and economic factors likely to influence the prospects of economic extraction in a manner useful for evaluation of economic viability. A qualified person must have a reasonable expectation that the majority of inferred mineral resources could be upgraded to indicated or measured mineral resources with continued exploration; and should be able to defend the basis of this expectation before his or her peers. initial assessment An initial assessment is a preliminary technical and economic study of the economic potential of all or parts of mineralization to support the disclosure of mineral resources. The initial assessment must be prepared by a qualified person and must include appropriate assessments of reasonably assumed technical and economic factors, together with any other relevant operational factors, that are necessary to demonstrate at the time of reporting that there are reasonable prospects for economic extraction. An initial assessment is required for disclosure of mineral resources but cannot be used as the basis for disclosure of mineral reserves internal rate of return (IRR) The rate of return at which the Net Present Value of a project is zero; the rate at which the present value of cash inflows is equal to the present value of the cash outflows. Boddington Operations Western Australia Technical Report Summary Date: February 2026 Page 24-10 Term Definition IP Geophysical method, induced polarization; used to directly detect scattered primary sulfide mineralization. Most metal sulfides produce IP effects, e.g., chalcopyrite, bornite, chalcocite, pyrite, pyrrhotite JORC code The Australasian Code for Reporting of Mineral Resources and Ore Reserves prepared by the Joint Ore Reserves Committee of the Australasian Institute of Mining and Metallurgy, Australian Institute of Geoscientists and Mineral Council of Australia, as amended. Provides minimum standards for public reporting to ensure that investors and their advisers have all the information they would reasonably require for forming a reliable opinion on the results and estimates being reported. Adopted by the ASX for reporting ore body size and mineral concentrations. life of mine (LOM) Number of years that the operation is planning to mine and treat ore, and is taken from the current mine plan based on the current evaluation of ore reserves. lithogeochemistry The chemistry of rocks within the lithosphere, such as rock, lake, stream, and soil sediments locked cycle flotation test A standard laboratory flotation test where certain intermediate streams are recycled into previous separation stages and the test is repeated across a number of cycles. This test provides a more realistic prediction of the overall recovery and concentrate grade that would be achieved in an actual flotation circuit, compared with a more simple batch flotation test. measured mineral resource A measured mineral resource is that part of a mineral resource for which quantity and grade or quality are estimated on the basis of conclusive geological evidence and sampling. The term conclusive geological evidence means evidence that is sufficient to test and confirm geological and grade or quality continuity. The level of geological certainty associated with a measured mineral resource is sufficient to allow a qualified person to apply modifying factors, as defined in this section, in sufficient detail to support detailed mine planning and final evaluation of the economic viability of the deposit. mill Includes any ore mill, sampling works, concentration, and any crushing, grinding, or screening plant used at, and in connection with, an excavation or mine. mineral reserve A mineral reserve is an estimate of tonnage and grade or quality of indicated and measured mineral resources that, in the opinion of the qualified person, can be the basis of an economically viable project. More specifically, it is the economically mineable part of a measured or indicated mineral resource, which includes diluting materials and allowances for losses that may occur when the material is mined or extracted. The determination that part of a measured or indicated mineral resource is economically mineable must be based on a preliminary feasibility (pre- feasibility) or feasibility study, as defined by this section, conducted by a qualified person applying the modifying factors to indicated or measured mineral resources. Such study must demonstrate that, at the time of reporting, extraction of the mineral reserve is economically viable under reasonable investment and market assumptions. The study must establish a life of mine Boddington Operations Western Australia Technical Report Summary Date: February 2026 Page 24-11 Term Definition plan that is technically achievable and economically viable, which will be the basis of determining the mineral reserve. The term economically viable means that the qualified person has determined, using a discounted cash flow analysis, or has otherwise analytically determined, that extraction of the mineral reserve is economically viable under reasonable investment and market assumptions. The term investment and market assumptions includes all assumptions made about the prices, exchange rates, interest and discount rates, sales volumes, and costs that are necessary to determine the economic viability of the mineral reserves. The qualified person must use a price for each commodity that provides a reasonable basis for establishing that the project is economically viable. mineral resource A mineral resource is a concentration or occurrence of material of economic interest in or on the Earth’s crust in such form, grade or quality, and quantity that there are reasonable prospects for economic extraction. The term material of economic interest includes mineralization, including dumps and tailings, mineral brines, and other resources extracted on or within the earth’s crust. It does not include oil and gas resources, gases (e.g., helium and carbon dioxide), geothermal fields, and water. When determining the existence of a mineral resource, a qualified person, as defined by this section, must be able to estimate or interpret the location, quantity, grade or quality continuity, and other geological characteristics of the mineral resource from specific geological evidence and knowledge, including sampling; and conclude that there are reasonable prospects for economic extraction of the mineral resource based on an initial assessment, as defined in this section, that he or she conducts by qualitatively applying relevant technical and economic factors likely to influence the prospect of economic extraction. net present value (NPV) The present value of the difference between the future cash flows associated with a project and the investment required for acquiring the project. Aggregate of future net cash flows discounted back to a common base date, usually the present. NPV is an indicator of how much value an investment or project adds to a company. net smelter return (NSR) A defined percentage of the gross revenue from a resource extraction operation, less a proportionate share of transportation, insurance, and processing costs. open pit A mine that is entirely on the surface. Also referred to as open-cut or open-cast mine. ounce (oz) (troy) Used in imperial statistics. A kilogram is equal to 32.1507 ounces. A troy ounce is equal to 31.1035 grams. overburden Material of any nature, consolidated or unconsolidated, that overlies a deposit of ore that is to be mined. penalty elements Elements that when recovered to a flotation concentrate, attract a penalty payment from the smelting customer. This is because those elements are Boddington Operations Western Australia Technical Report Summary Date: February 2026 Page 24-12 Term Definition deleterious, and cause quality, environmental or cost issues for the smelter. Includes elements such as As, Hg and Pb. plant A group of buildings, and especially to their contained equipment, in which a process or function is carried out; on a mine it will include warehouses, hoisting equipment, compressors, repair shops, offices, mill or concentrator. preliminary feasibility study, pre- feasibility study A preliminary feasibility study (prefeasibility study) is a comprehensive study of a range of options for the technical and economic viability of a mineral project that has advanced to a stage where a qualified person has determined (in the case of underground mining) a preferred mining method, or (in the case of surface mining) a pit configuration, and in all cases has determined an effective method of mineral processing and an effective plan to sell the product. A pre-feasibility study includes a financial analysis based on reasonable assumptions, based on appropriate testing, about the modifying factors and the evaluation of any other relevant factors that are sufficient for a qualified person to determine if all or part of the indicated and measured mineral resources may be converted to mineral reserves at the time of reporting. The financial analysis must have the level of detail necessary to demonstrate, at the time of reporting, that extraction is economically viable probable mineral reserve A probable mineral reserve is the economically mineable part of an indicated and, in some cases, a measured mineral resource. For a probable mineral reserve, the qualified person’s confidence in the results obtained from the application of the modifying factors and in the estimates of tonnage and grade or quality is lower than what is sufficient for a classification as a proven mineral reserve, but is still sufficient to demonstrate that, at the time of reporting, extraction of the mineral reserve is economically viable under reasonable investment and market assumptions. The lower level of confidence is due to higher geologic uncertainty when the qualified person converts an indicated mineral resource to a probable reserve or higher risk in the results of the application of modifying factors at the time when the qualified person converts a measured mineral resource to a probable mineral reserve. A qualified person must classify a measured mineral resource as a probable mineral reserve when his or her confidence in the results obtained from the application of the modifying factors to the measured mineral resource is lower than what is sufficient for a proven mineral reserve. proven mineral reserve A proven mineral reserve is the economically mineable part of a measured mineral resource. For a proven mineral reserve, the qualified person has a high degree of confidence in the results obtained from the application of the modifying factors and in the estimates of tonnage and grade or quality. A proven mineral reserve can only result from conversion of a measured mineral resource. qualified person A qualified person is an individual who is a mineral industry professional with at least five years of relevant experience in the type of mineralization and type of deposit under consideration and in the specific type of activity that person is undertaking on behalf of the registrant; and an eligible member or licensee in good standing of a recognized professional organization at the time the technical report is prepared.


Boddington Operations Western Australia Technical Report Summary Date: February 2026 Page 24-13 Term Definition For an organization to be a recognized professional organization, it must: (A) Be either: (1) An organization recognized within the mining industry as a reputable professional association, or (2) A board authorized by U.S. federal, state, or foreign statute to regulate professionals in the mining, geoscience, or related field; (B) Admit eligible members primarily on the basis of their academic qualifications and experience; (C) Establish and require compliance with professional standards of competence and ethics; (D) Require or encourage continuing professional development; (E) Have and apply disciplinary powers, including the power to suspend or expel a member regardless of where the member practices or resides; and; (F) Provide a public list of members in good standing. reclamation The restoration of a site after mining or exploration activity is completed. refining A high temperature process in which impure metal is reacted with flux to reduce the impurities. The metal is collected in a molten layer and the impurities in a slag layer. Refining results in the production of a marketable material. resistivity Observation of electric fields caused by current introduced into the ground as a means of studying earth resistivity in geophysical exploration. Resistivity is the property of a material that resists the flow of electrical current rock quality designation (RQD) A measure of the competency of a rock, determined by the number of fractures in a given length of drill core. For example, a friable ore will have many fractures and a low RQD. rod mill A rotating cylindrical mill which employs steel rods as a grinding medium. royalty An amount of money paid at regular intervals by the lessee or operator of an exploration or mining property to the owner of the ground. Generally based on a specific amount per tonne or a percentage of the total production or profits. Also, the fee paid for the right to use a patented process. run-of-mine (ROM) Rehandle where the raw mine ore material is fed into the processing plant’s system, usually the crusher. This is where material that is not direct feed from the mine is stockpiled for later feeding. Run-of-mine relates to the rehandle being for any mine material, regardless of source, before entry into the processing plant’s system. semi-autogenous grinding (SAG) A method of grinding rock into fine powder whereby the grinding media consists of larger chunks of rocks and steel balls. specific gravity The weight of a substance compared with the weight of an equal volume of pure water at 4°C. Boddington Operations Western Australia Technical Report Summary Date: February 2026 Page 24-14 Term Definition strike length The horizontal distance along the long axis of a structural surface, rock unit, mineral deposit, or geochemical anomaly. supergene Mineral enrichment produced by the chemical remobilization of metals in an oxidized or transitional environment. tailings Material rejected from a mill after the recoverable valuable minerals have been extracted. Boddington Operations Western Australia Technical Report Summary Date: February 2026 Page 25-1 25.0 RELIANCE ON INFORMATION PROVIDED BY THE REGISTRANT 25.1 Introduction The QP fully relied on the registrant for the information used in the areas noted in the following sub-sections. The QP considers it reasonable to rely on the registrant for the information identified in those sub-sections, for the following reasons: • The registrant has been owner and operator of the gold mining operations since 2012, and the registrant’s predecessor company operated the mine from 2002 onward, collectively, the registrant has had operational management of the mining operations for 23 years; • The registrant has employed industry professionals with expertise in the areas listed in the following sub-sections; • The registrant has a formal system of oversight and governance over these activities, including a layered responsibility for review and approval; • The registrant has considerable experience in each of these areas. 25.2 Macroeconomic Trends • Information relating to inflation, interest rates, discount rates, exchange rates, and taxes was obtained from the registrant. This information is used in the economic analysis in Chapter 19. It supports the assessment of reasonable prospects for economic extraction of the mineral resource estimates in Chapter 11, and inputs to the determination of economic viability of the mineral reserve estimates in Chapter 12. 25.3 Markets • Information relating to market studies/markets for product, market entry strategies, marketing and sales contracts, product valuation, product specifications, refining and treatment charges, transportation costs, agency relationships, material contracts (e.g., mining, concentrating, smelting, refining, transportation, handling, hedging arrangements, and forward sales contracts), and contract status (in place, renewals), was obtained from the registrant. This information is used in the economic analysis in Chapter 19. It supports the assessment of reasonable prospects for economic extraction of the mineral resource estimates in Chapter 11, and inputs to the determination of economic viability of the mineral reserve estimates in Chapter 12. 25.4 Legal Matters • Information relating to the corporate ownership interest, the mineral tenure (concessions, payments to retain property rights, obligations to meet expenditure/reporting of work conducted), surface rights, water rights (water take allowances), royalties, encumbrances, Boddington Operations Western Australia Technical Report Summary Date: February 2026 Page 25-2 easements and rights-of-way, violations and fines, permitting requirements, and the ability to maintain and renew permits was obtained from the registrant. This information is used in support of the property description and ownership information in Chapter 3, the permitting and mine closure descriptions in Chapter 17, and the economic analysis in Chapter 19. It supports the reasonable prospects of economic extraction for the mineral resource estimates in Chapter 11, and the assumptions used in demonstrating economic viability of the mineral reserve estimates in Chapter 12. 25.5 Environmental Matters • Information relating to baseline and supporting studies for environmental permitting, environmental permitting and monitoring requirements, ability to maintain and renew permits, emissions controls, closure planning, closure and reclamation bonding and bonding requirements, sustainability accommodations, and monitoring for and compliance with requirements relating to protected areas and protected species was obtained from the registrant. This information is used when discussing property ownership information in Chapter 3, the permitting and closure discussions in Chapter 17, and the economic analysis in Chapter 19. It supports the reasonable prospects of economic extraction for the mineral resource estimates in Chapter 11, and the assumptions used in demonstrating economic viability of the mineral reserve estimates in Chapter 12. 25.6 Stakeholder Accommodations • Information relating to social and stakeholder baseline and supporting studies, hiring and training policies for workforce from local communities, partnerships with stakeholders (including national, regional, and state mining associations; trade organizations; fishing organizations; state and local chambers of commerce; economic development organizations; non-government organizations; and, state and federal governments), and the community relations plan was obtained from the registrant. This information is used in the social and community discussions in Chapter 17, and the economic analysis in Chapter 19. It supports the reasonable prospects of economic extraction for the mineral resource estimates in Chapter 11, and the assumptions used in demonstrating economic viability of the mineral reserve estimates in Chapter 12. 25.7 Governmental Factors • Information relating to taxation and royalty considerations at the Project level, monitoring requirements and monitoring frequency, bonding requirements, and violations and fines was obtained from the registrant. This information is used in the discussion on royalties and property encumbrances in Chapter 3, the monitoring, permitting and closure discussions in Chapter 17, and the economic analysis in Chapter 19. It supports the reasonable prospects of economic extraction for the mineral resource estimates in Chapter 11, and the assumptions used in demonstrating economic viability of the mineral reserve estimates in Chapter 12.


Cadia Valley Operations New South Wales Australia Technical Report Summary Report current as at: December 31, 2025 Qualified Person: Mr. Shaun Chanter, RM SME. Cadia Valley Operations New South Wales, Australia Technical Report Summary Date: February 2026 Page a NOTE REGARDING FORWARD-LOOKING INFORMATION This Technical Report Summary contains forward-looking statements within the meaning of the U.S. Securities Act of 1933 and the U.S. Securities Exchange Act of 1934 (and the equivalent under Canadian securities laws), that are intended to be covered by the safe harbor created by such sections. Such forward-looking statements include, without limitation, statements regarding Newmont’s expectation for its mines and any related development or expansions, including estimated cash flows, production, revenue, EBITDA, costs, taxes, capital, rates of return, mine plans, material mined and processed, recoveries and grade, future mineralization, future adjustments and sensitivities and other statements that are not historical facts. Forward-looking statements address activities, events, or developments that Newmont expects or anticipates will or may occur in the future and are based on current expectations and assumptions. Although Newmont’s management believes that its expectations are based on reasonable assumptions, it can give no assurance that these expectations will prove correct. Such assumptions, include, but are not limited to: (i) there being no significant change to current geotechnical, metallurgical, hydrological and other physical conditions; (ii) permitting, development, operations and expansion of operations and projects being consistent with current expectations and mine plans, including, without limitation, receipt of export approvals; (iii) political developments in any jurisdiction in which Newmont operates being consistent with its current expectations; (iv) certain exchange rate assumptions being approximately consistent with current levels; (v) certain price assumptions for gold, copper, silver, molybdenum and oil; (vi) prices for key supplies being approximately consistent with current levels; and (vii) other planning assumptions. Important factors that could cause actual results to differ materially from those in the forward- looking statements include, among others, risks that estimates of mineral reserves and mineral resources are uncertain and the volume and grade of ore actually recovered may vary from our estimates, risks relating to fluctuations in metal prices; risks due to the inherently hazardous nature of mining-related activities; risks related to the jurisdictions in which we operate, uncertainties due to health and safety considerations, uncertainties related to environmental considerations, including, without limitation, climate change, uncertainties relating to obtaining approvals and permits, including renewals, from governmental regulatory authorities; and uncertainties related to changes in law; as well as those factors discussed in Newmont’s filings with the U.S. Securities and Exchange Commission, including Newmont’s latest Annual Report on Form 10-K for the period ended December 31, 2025, which is available on newmont.com. Newmont does not undertake any obligation to release publicly revisions to any “forward-looking statement,” including, without limitation, outlook, to reflect events or circumstances after the date of this document, or to reflect the occurrence of unanticipated events, except as may be required under applicable securities laws. Investors should not assume that any lack of update to a previously issued “forward-looking statement” constitutes a reaffirmation of that statement. Continued reliance on “forward-looking statements” is at investors’ own risk. Cadia Valley Operations New South Wales, Australia Technical Report Summary Date: February 2026 Page i CONTENTS 1.0 EXECUTIVE SUMMARY ........................................................................................................... 1-1 1.1 Introduction ................................................................................................................................. 1-1 1.2 Terms of Reference ................................................................................................................... 1-1 1.3 Property Setting ......................................................................................................................... 1-1 1.4 Ownership .................................................................................................................................. 1-2 1.5 Mineral Tenure, Surface Rights, Water Rights, Royalties and Agreements .............................. 1-2 1.6 Geology and Mineralization ........................................................................................................ 1-3 1.7 History and Exploration .............................................................................................................. 1-5 1.8 Drilling and Sampling ................................................................................................................. 1-5 1.8.1 Drilling .................................................................................................................................... 1-5 1.8.2 Hydrogeology ......................................................................................................................... 1-6 1.8.3 Geotechnical .......................................................................................................................... 1-6 1.8.4 Sampling and Assay .............................................................................................................. 1-6 1.8.5 Quality Assurance and Quality Control .................................................................................. 1-7 1.9 Data Verification ......................................................................................................................... 1-7 1.10 Metallurgical Testwork ............................................................................................................... 1-8 1.11 Mineral Resource Estimation ..................................................................................................... 1-8 1.11.1 Estimation Methodology ......................................................................................................... 1-8 1.11.2 Mineral Resource Statement ................................................................................................ 1-10 1.11.3 Factors That May Affect the Mineral Resource Estimate..................................................... 1-12 1.12 Mineral Reserve Estimation ..................................................................................................... 1-12 1.12.1 Estimation Methodology ....................................................................................................... 1-12 1.12.2 Mineral Reserve Statement .................................................................................................. 1-13 1.12.3 Factors That May Affect the Mineral Reserve Estimate ....................................................... 1-14 1.13 Mining Methods ........................................................................................................................ 1-15 1.13.1 Cadia East ............................................................................................................................ 1-15 1.13.2 Ridgeway .............................................................................................................................. 1-17 1.14 Recovery Methods ................................................................................................................... 1-17 1.15 Infrastructure ............................................................................................................................ 1-19 1.16 Markets and Contracts ............................................................................................................. 1-20 1.17 Environmental, Permitting and Social Considerations ............................................................. 1-21 1.17.1 Environmental Studies and Monitoring ................................................................................ 1-21 1.17.2 Waste Rock .......................................................................................................................... 1-21 1.17.3 Tailings Storage Facilities .................................................................................................... 1-21 1.17.4 Water Supply and Water Management ................................................................................ 1-22 1.17.5 Closure and Reclamation Considerations ............................................................................ 1-23 1.17.6 Permitting ............................................................................................................................. 1-23 1.17.7 Social Considerations, Plans, Negotiations and Agreements .............................................. 1-23 1.18 Capital Cost Estimates ............................................................................................................. 1-23 1.19 Operating Cost Estimates ........................................................................................................ 1-24 1.20 Economic Analysis ................................................................................................................... 1-25 1.20.1 Economic Analysis ............................................................................................................... 1-25 1.20.2 Sensitivity Analysis ............................................................................................................... 1-27 1.21 Risks and Opportunities ........................................................................................................... 1-28 1.21.1 Risks ..................................................................................................................................... 1-28 1.21.2 Opportunities ........................................................................................................................ 1-29 1.22 Conclusions .............................................................................................................................. 1-29 Cadia Valley Operations New South Wales, Australia Technical Report Summary Date: February 2026 Page ii 1.23 Recommendations ................................................................................................................... 1-29 2.0 INTRODUCTION ........................................................................................................................ 2-1 2.1 Introduction ................................................................................................................................. 2-1 2.2 Terms of Reference ................................................................................................................... 2-1 2.2.1 Report Purpose ...................................................................................................................... 2-1 2.2.2 Terms of Reference................................................................................................................ 2-1 2.3 Qualified Persons ....................................................................................................................... 2-4 2.4 Site Visits and Scope of Personal Inspection ............................................................................ 2-4 2.5 Report Date ................................................................................................................................ 2-4 2.6 Information Sources and References ........................................................................................ 2-4 2.7 Previous Technical Report Summaries ...................................................................................... 2-4 3.0 PROPERTY DESCRIPTION ...................................................................................................... 3-1 3.1 Introduction ................................................................................................................................. 3-1 3.2 Property and Title in New South Wales ..................................................................................... 3-1 3.2.1 Mineral Title ............................................................................................................................ 3-1 3.2.2 Surface Rights ........................................................................................................................ 3-2 3.2.3 Government Mining Taxes, Levies or Royalties .................................................................... 3-2 3.3 Ownership .................................................................................................................................. 3-2 3.4 Mineral Title ................................................................................................................................ 3-3 3.5 Surface Rights ............................................................................................................................ 3-5 3.6 Water Rights............................................................................................................................... 3-8 3.7 Royalties ..................................................................................................................................... 3-9 3.8 Encumbrances ........................................................................................................................... 3-9 3.9 Permitting ................................................................................................................................... 3-9 3.10 Community Concerns, Regulatory Actions, and Legal Proceedings ......................................... 3-9 3.11 Significant Factors and Risks That May Affect Access, Title or Work Programs .................... 3-10 4.0 ACCESSIBILITY, CLIMATE, LOCAL RESOURCES, INFRASTRUCTURE AND PHYSIOGRAPHY ...................................................................................................................................... 4-1 4.1 Physiography.............................................................................................................................. 4-1 4.2 Accessibility ................................................................................................................................ 4-2 4.3 Climate ....................................................................................................................................... 4-2 4.4 Local Resources and Infrastructure ........................................................................................... 4-3 4.5 Seismicity ................................................................................................................................... 4-3 5.0 HISTORY ................................................................................................................................... 5-1 6.0 GEOLOGICAL SETTING, MINERALIZATION, AND DEPOSIT ............................................... 6-1 6.1 Deposit Type .............................................................................................................................. 6-1 6.1.1 Alkalic Porphyry Gold–Copper Deposits ................................................................................ 6-1 6.2 Regional Geology ....................................................................................................................... 6-2 6.3 Local Geology ............................................................................................................................ 6-6 6.3.1 Lithologies .............................................................................................................................. 6-6 6.3.2 Metamorphism ........................................................................................................................ 6-9 6.3.3 Structure ................................................................................................................................. 6-9 6.3.4 Mineralization ......................................................................................................................... 6-9 6.3.5 Weathering ........................................................................................................................... 6-10 6.4 Deposit Geology ....................................................................................................................... 6-10 6.4.1 Cadia East ............................................................................................................................ 6-10 6.4.1.1 Geology ............................................................................................................................ 6-10 6.4.1.2 Alteration .......................................................................................................................... 6-11 6.4.1.3 Structure ........................................................................................................................... 6-14 6.4.1.4 Mineralization ................................................................................................................... 6-14


Cadia Valley Operations New South Wales, Australia Technical Report Summary Date: February 2026 Page iii 6.4.2 Ridgeway .............................................................................................................................. 6-15 6.4.2.1 Geology ............................................................................................................................ 6-15 6.4.2.2 Alteration .......................................................................................................................... 6-18 6.4.2.3 Structure ........................................................................................................................... 6-18 6.4.2.4 Mineralization ................................................................................................................... 6-18 7.0 EXPLORATION ......................................................................................................................... 7-1 7.1 Exploration ................................................................................................................................. 7-1 7.1.1 Grids and Surveys .................................................................................................................. 7-1 7.1.2 Geological Mapping ............................................................................................................... 7-1 7.1.3 Geochemistry ......................................................................................................................... 7-2 7.1.4 Geophysics ............................................................................................................................. 7-5 7.1.5 Petrology, Mineralogy, and Research Studies ..................................................................... 7-10 7.1.6 Qualified Person’s Interpretation of the Exploration Information ......................................... 7-10 7.1.7 Exploration Potential ............................................................................................................ 7-11 7.2 Drilling ...................................................................................................................................... 7-13 7.2.1 Overview .............................................................................................................................. 7-13 7.2.1.1 Drilling on Property ........................................................................................................... 7-13 7.2.1.2 Drilling Excluded For Estimation Purposes ...................................................................... 7-19 7.2.1.3 Drilling Since Database Close-out Date ........................................................................... 7-19 7.2.2 Drill Methods ........................................................................................................................ 7-21 7.2.3 Logging ................................................................................................................................. 7-21 7.2.4 Recovery .............................................................................................................................. 7-22 7.2.5 Collar Surveys ...................................................................................................................... 7-22 7.2.6 Down Hole Surveys .............................................................................................................. 7-22 7.2.7 Comment on Material Results and Interpretation ................................................................ 7-23 7.3 Hydrogeology ........................................................................................................................... 7-23 7.3.1 Overview .............................................................................................................................. 7-23 7.3.2 Sampling Methods and Laboratory Determinations ............................................................. 7-24 7.3.3 Comment on Results ............................................................................................................ 7-24 7.3.4 Groundwater Models ............................................................................................................ 7-24 7.3.5 Water Balance ...................................................................................................................... 7-25 7.4 Geotechnical ............................................................................................................................ 7-25 7.4.1 Overview .............................................................................................................................. 7-25 7.4.2 Sampling Methods and Laboratory Determinations ............................................................. 7-26 7.4.2.1 Geotechnical Logging ...................................................................................................... 7-26 7.4.2.2 Laboratory Rock Strength Testing ................................................................................... 7-26 7.4.2.3 On-site Point Load Testing ............................................................................................... 7-26 7.4.3 Comment on Results ............................................................................................................ 7-26 8.0 SAMPLE PREPARATION, ANALYSES, AND SECURITY ...................................................... 8-1 8.1 Sampling Methods ..................................................................................................................... 8-1 8.1.1 RC .......................................................................................................................................... 8-1 8.1.2 Core ........................................................................................................................................ 8-1 8.1.3 Grade Control ......................................................................................................................... 8-1 8.1.4 Production Sampling .............................................................................................................. 8-1 8.2 Sample Security Methods .......................................................................................................... 8-1 8.3 Density Determinations .............................................................................................................. 8-2 8.4 Analytical and Test Laboratories ................................................................................................ 8-2 8.5 Sample Preparation ................................................................................................................... 8-3 8.6 Analysis ...................................................................................................................................... 8-4 8.7 Quality Assurance and Quality Control ...................................................................................... 8-4 Cadia Valley Operations New South Wales, Australia Technical Report Summary Date: February 2026 Page iv 8.7.1 QA/QC Procedures ................................................................................................................ 8-4 8.7.2 Current QA/QC Reviews ........................................................................................................ 8-5 8.7.2.1 Short-Term Control Measures and Reporting .................................................................... 8-5 8.7.2.2 Longer-Term Control Measures and Reporting ................................................................. 8-5 8.7.3 Analytical QA/QC Review ...................................................................................................... 8-6 8.8 Database .................................................................................................................................... 8-6 8.9 Qualified Person’s Opinion on Sample Preparation, Security, and Analytical Procedures ....... 8-6 9.0 DATA VERIFICATION ............................................................................................................... 9-1 9.1 Internal Data Verification ............................................................................................................ 9-1 9.1.1 Mineral Resource and Mineral Reserve Estimates ................................................................ 9-1 9.1.2 Reconciliation ......................................................................................................................... 9-2 9.1.3 Mineral Resource and Mineral Reserve Review .................................................................... 9-2 9.1.4 Subject Matter Expert Reviews .............................................................................................. 9-2 9.2 External Data Verification ........................................................................................................... 9-3 9.3 Data Verification by Qualified Person ........................................................................................ 9-4 9.4 Qualified Person’s Opinion on Data Adequacy .......................................................................... 9-4 10.0 MINERAL PROCESSING AND METALLURGICAL TESTING .............................................. 10-1 10.1 Introduction ............................................................................................................................... 10-1 10.2 Metallurgical Testwork ............................................................................................................. 10-1 10.2.1 Cadia East ............................................................................................................................ 10-1 10.2.1.1 Sample Selection ......................................................................................................... 10-2 10.2.1.2 Testwork Summary ...................................................................................................... 10-2 10.2.2 Ridgeway .............................................................................................................................. 10-5 10.2.2.1 Sample Selection ......................................................................................................... 10-6 10.2.2.2 Testwork Summary ...................................................................................................... 10-6 10.3 Recovery Estimates ................................................................................................................. 10-7 10.3.1 Cadia East ............................................................................................................................ 10-7 10.3.2 Ridgeway .............................................................................................................................. 10-9 10.4 Metallurgical Variability ............................................................................................................ 10-9 10.5 Deleterious Elements ............................................................................................................. 10-10 10.5.1 Cadia East .......................................................................................................................... 10-10 10.5.2 Ridgeway ............................................................................................................................ 10-10 10.6 Qualified Person’s Opinion on Data Adequacy ...................................................................... 10-11 11.0 MINERAL RESOURCE ESTIMATES ...................................................................................... 11-1 11.1 Introduction ............................................................................................................................... 11-1 11.2 Modelling Approach ................................................................................................................. 11-1 11.2.1 Cadia East ............................................................................................................................ 11-1 11.2.2 Ridgeway .............................................................................................................................. 11-1 11.3 Exploratory Data Analysis ........................................................................................................ 11-2 11.3.1 Cadia East ............................................................................................................................ 11-2 11.3.2 Ridgeway .............................................................................................................................. 11-2 11.4 Composites .............................................................................................................................. 11-2 11.4.1 Cadia East ............................................................................................................................ 11-2 11.4.2 Ridgeway .............................................................................................................................. 11-2 11.5 Grade Capping/Outlier Restrictions ......................................................................................... 11-3 11.5.1 Cadia East ............................................................................................................................ 11-3 11.5.2 Ridgeway .............................................................................................................................. 11-3 11.6 Density (Specific Gravity) Assignment ..................................................................................... 11-3 11.6.1 Cadia East ............................................................................................................................ 11-3 11.6.2 Ridgeway .............................................................................................................................. 11-3 Cadia Valley Operations New South Wales, Australia Technical Report Summary Date: February 2026 Page v 11.7 Variography .............................................................................................................................. 11-3 11.7.1 Cadia East ............................................................................................................................ 11-3 11.7.2 Ridgeway .............................................................................................................................. 11-4 11.8 Estimation/Interpolation Methods ............................................................................................. 11-4 11.8.1 Cadia East ............................................................................................................................ 11-4 11.8.2 Ridgeway .............................................................................................................................. 11-5 11.9 Block Model Validation ............................................................................................................. 11-5 11.10 Confidence Classification of Mineral Resource Estimate ........................................................ 11-6 11.10.1 Mineral Resource Confidence Classification ................................................................... 11-6 11.10.1.1 Cadia East .................................................................................................................... 11-6 11.10.1.2 Ridgeway ...................................................................................................................... 11-6 11.10.2 Uncertainties Considered During Confidence Classification ........................................... 11-6 11.11 Stockpiles ................................................................................................................................. 11-7 11.12 Reasonable Prospects of Economic Extraction ....................................................................... 11-7 11.12.1 Input Assumptions ............................................................................................................ 11-7 11.12.1.1 Cadia East .................................................................................................................... 11-7 11.12.1.2 Ridgeway ...................................................................................................................... 11-8 11.12.1.3 Cadia Hill Stockpiles .................................................................................................... 11-9 11.12.2 Commodity Price .............................................................................................................. 11-9 11.12.3 Cut-off ............................................................................................................................. 11-10 11.12.4 QP Statement ................................................................................................................. 11-10 11.13 Mineral Resource Statement.................................................................................................. 11-10 11.14 Uncertainties (Factors) That May Affect the Mineral Resource Estimate .............................. 11-12 12.0 MINERAL RESERVE ESTIMATES ......................................................................................... 12-1 12.1 Introduction ............................................................................................................................... 12-1 12.2 Cadia East ................................................................................................................................ 12-1 12.2.1 Overview .............................................................................................................................. 12-1 12.2.2 Net Smelter Return............................................................................................................... 12-3 12.2.3 Development Ore Selection ................................................................................................. 12-3 12.2.4 Panel Cave Ore Selection .................................................................................................... 12-3 12.2.5 Shut-off Values ..................................................................................................................... 12-3 12.2.6 Dilution ................................................................................................................................. 12-4 12.2.7 Metallurgical Recoveries ...................................................................................................... 12-4 12.3 Ridgeway .................................................................................................................................. 12-4 12.3.1 Overview .............................................................................................................................. 12-4 12.3.2 Net Smelter Return............................................................................................................... 12-5 12.3.3 Development Ore Selection ................................................................................................. 12-6 12.3.4 Block Cave Ore Selection .................................................................................................... 12-6 12.3.5 Metallurgical Recovery ......................................................................................................... 12-6 12.4 Royalties ................................................................................................................................... 12-6 12.5 Mineral Reserve Statement ...................................................................................................... 12-7 12.6 Uncertainties (Factors) That May Affect the Mineral Reserve Estimate .................................. 12-8 13.0 MINING METHODS ................................................................................................................. 13-1 13.1 Cadia East Operations ............................................................................................................. 13-1 13.1.1 Overview .............................................................................................................................. 13-1 13.1.2 Geotechnical Considerations ............................................................................................... 13-3 13.1.2.1 Rock Quality and Geotechnical Domains .................................................................... 13-3 13.1.2.2 Design Considerations ................................................................................................. 13-4 13.1.2.3 Cave Initiation ............................................................................................................... 13-5 13.1.2.4 Hydraulic Fracturing ..................................................................................................... 13-5 Cadia Valley Operations New South Wales, Australia Technical Report Summary Date: February 2026 Page vi 13.1.2.5 Caveability, Fragmentation, and Flow .......................................................................... 13-5 13.1.2.6 Cave Subsidence ......................................................................................................... 13-5 13.1.2.7 Ground Support ............................................................................................................ 13-6 13.1.3 Hydrogeological Considerations .......................................................................................... 13-6 13.1.3.1 Hydrogeology ............................................................................................................... 13-6 13.1.3.2 Inflows .......................................................................................................................... 13-6 13.1.3.3 Dewatering ................................................................................................................... 13-7 13.1.4 Design Considerations ......................................................................................................... 13-7 13.1.4.1 Extraction Levels .......................................................................................................... 13-8 13.1.4.2 Undercut Levels ........................................................................................................... 13-8 13.1.4.3 Monitoring and Cave Engineering Horizon .................................................................. 13-9 13.1.4.4 Waste ........................................................................................................................... 13-9 13.1.5 Declines ................................................................................................................................ 13-9 13.1.6 Ventilation ............................................................................................................................. 13-9 13.1.7 Materials Handling System ................................................................................................ 13-10 13.1.8 Equipment .......................................................................................................................... 13-11 13.1.9 Facilities ............................................................................................................................. 13-12 13.1.10 Blasting ........................................................................................................................... 13-12 13.1.11 Production Schedule ...................................................................................................... 13-13 13.1.12 Personnel ....................................................................................................................... 13-13 13.2 Ridgeway ................................................................................................................................ 13-13 13.2.1 Introduction ......................................................................................................................... 13-13 13.2.2 Geotechnical Considerations ............................................................................................. 13-14 13.2.3 Hydrogeological Considerations ........................................................................................ 13-14 13.2.3.1 Inflows ........................................................................................................................ 13-14 13.2.3.2 Dewatering ................................................................................................................. 13-15 13.2.4 Design Considerations ....................................................................................................... 13-15 13.2.5 Ventilation ........................................................................................................................... 13-16 13.2.6 Materials Handling System ................................................................................................ 13-16 13.2.7 Facilities ............................................................................................................................. 13-16 13.2.8 Equipment .......................................................................................................................... 13-16 13.2.9 Production Schedule .......................................................................................................... 13-17 13.2.10 Personnel ....................................................................................................................... 13-17 14.0 PROCESSING AND RECOVERY METHODS ........................................................................ 14-1 14.1 Introduction ............................................................................................................................... 14-1 14.2 Flowsheet ................................................................................................................................. 14-1 14.3 Plant Design ............................................................................................................................. 14-3 14.3.1 Concentrator 1 Design ......................................................................................................... 14-3 14.3.2 Concentrator 2 Design ......................................................................................................... 14-3 14.3.3 Molybdenum Plant Design ................................................................................................... 14-3 14.4 Equipment Sizing ..................................................................................................................... 14-4 14.5 Power and Consumables ......................................................................................................... 14-7 14.5.1 Energy .................................................................................................................................. 14-7 14.5.2 Water .................................................................................................................................... 14-7 14.5.3 Process Consumables ......................................................................................................... 14-7 14.6 Personnel ................................................................................................................................. 14-7 15.0 INFRASTRUCTURE ................................................................................................................ 15-1 15.1 Introduction ............................................................................................................................... 15-1 15.2 Road and Logistics ................................................................................................................... 15-3 15.2.1 Roads ................................................................................................................................... 15-3


Cadia Valley Operations New South Wales, Australia Technical Report Summary Date: February 2026 Page vii 15.2.2 Concentrate Dewatering and Handling ................................................................................ 15-3 15.3 Stockpiles ................................................................................................................................. 15-5 15.4 Waste Storage Facilities .......................................................................................................... 15-5 15.5 Tailings Storage Facilities ........................................................................................................ 15-5 15.6 Water Management .................................................................................................................. 15-5 15.7 Built Infrastructure .................................................................................................................... 15-5 15.8 Camps and Accommodation .................................................................................................... 15-6 15.9 Power and Electrical ................................................................................................................ 15-6 15.10 Fuel .......................................................................................................................................... 15-6 15.11 Communications ...................................................................................................................... 15-6 15.12 Water Supply ............................................................................................................................ 15-6 16.0 MARKET STUDIES ................................................................................................................. 16-1 16.1 Markets ..................................................................................................................................... 16-1 16.1.1 Existing Markets ................................................................................................................... 16-1 16.1.2 Cadia East ............................................................................................................................ 16-1 16.1.3 Ridgeway .............................................................................................................................. 16-3 16.2 Commodity Price Forecasts ..................................................................................................... 16-3 16.3 Contracts .................................................................................................................................. 16-3 17.0 ENVIRONMENTAL STUDIES, PERMITTING, AND PLANS, NEGOTIATIONS, OR AGREEMENTS WITH LOCAL INDIVIDUALS OR GROUPS ................................................................. 17-1 17.1 Introduction ............................................................................................................................... 17-1 17.2 Baseline and Supporting Studies ............................................................................................. 17-1 17.3 Environmental Considerations/Monitoring Programs............................................................... 17-2 17.4 Stockpiles ................................................................................................................................. 17-1 17.5 Waste Rock Storage Facilities ................................................................................................. 17-1 17.6 Tailings Storage Facility ........................................................................................................... 17-2 17.6.1 Overview .............................................................................................................................. 17-2 17.6.2 Northern Tailings Storage Facility (NTSF) Embankment Failure ......................................... 17-4 17.6.3 LOM Requirements .............................................................................................................. 17-4 17.6.4 Deposition Methods ............................................................................................................. 17-5 17.7 Water Management .................................................................................................................. 17-5 17.7.1 Management Strategy .......................................................................................................... 17-5 17.7.2 Cadia Pit TSF ....................................................................................................................... 17-7 17.8 Water Supply ............................................................................................................................ 17-7 17.8.1 Overview .............................................................................................................................. 17-7 17.8.2 Water Recycling ................................................................................................................... 17-9 17.9 Closure Plan ............................................................................................................................. 17-9 17.10 Permitting ............................................................................................................................... 17-10 17.10.1 Statutory Environmental Approvals and Compliance ..................................................... 17-10 17.10.2 Operating Permits .......................................................................................................... 17-10 17.10.3 Modification 15 ............................................................................................................... 17-11 17.10.4 Cadia Continued Operations Project.............................................................................. 17-11 17.11 Considerations of Social and Community Impacts ................................................................ 17-12 17.12 Qualified Person’s Opinion on Adequacy of Current Plans to Address Issues ..................... 17-12 18.0 CAPITAL AND OPERATING COSTS ..................................................................................... 18-1 18.1 Introduction ............................................................................................................................... 18-1 18.2 Capital Cost Estimates ............................................................................................................. 18-1 18.2.1 Basis of Estimate.................................................................................................................. 18-1 18.2.2 Capital Cost Summary ......................................................................................................... 18-2 18.3 Operating Cost Estimates ........................................................................................................ 18-2 Cadia Valley Operations New South Wales, Australia Technical Report Summary Date: February 2026 Page viii 18.3.1 Basis of Estimate.................................................................................................................. 18-2 18.3.2 Operating Cost Summary ..................................................................................................... 18-2 19.0 ECONOMIC ANALYSIS .......................................................................................................... 19-1 19.1 Methodology Used ................................................................................................................... 19-1 19.2 Financial Model Parameters .................................................................................................... 19-1 19.3 Sensitivity Analysis ................................................................................................................... 19-1 20.0 ADJACENT PROPERTIES ..................................................................................................... 20-1 21.0 OTHER RELEVANT DATA AND INFORMATION .................................................................. 21-1 22.0 INTERPRETATION AND CONCLUSIONS ............................................................................. 22-1 22.1 Introduction ............................................................................................................................... 22-1 22.2 Property Setting ....................................................................................................................... 22-1 22.3 Ownership ................................................................................................................................ 22-1 22.4 Mineral Tenure, Surface Rights, Water Rights, Royalties and Agreements ............................ 22-1 22.5 Geology and Mineralization ...................................................................................................... 22-2 22.6 History ...................................................................................................................................... 22-2 22.7 Exploration, Drilling, and Sampling .......................................................................................... 22-3 22.8 Data Verification ....................................................................................................................... 22-3 22.9 Metallurgical Testwork ............................................................................................................. 22-4 22.10 Mineral Resource Estimates .................................................................................................... 22-4 22.11 Mineral Reserve Estimates ...................................................................................................... 22-5 22.12 Mining Methods ........................................................................................................................ 22-5 22.13 Recovery Methods ................................................................................................................... 22-6 22.14 Infrastructure ............................................................................................................................ 22-6 22.15 Market Studies ......................................................................................................................... 22-6 22.16 Environmental, Permitting and Social Considerations ............................................................. 22-6 22.17 Capital Cost Estimates ............................................................................................................. 22-8 22.18 Operating Cost Estimates ........................................................................................................ 22-8 22.19 Economic Analysis ................................................................................................................... 22-8 22.20 Risks and Opportunities ........................................................................................................... 22-8 22.20.1 Risks ................................................................................................................................. 22-8 22.20.2 Opportunities .................................................................................................................... 22-9 22.21 Conclusions .............................................................................................................................. 22-9 23.0 RECOMMENDATIONS ............................................................................................................ 23-1 24.0 REFERENCES ......................................................................................................................... 24-1 24.1 Bibliography.............................................................................................................................. 24-1 24.2 Abbreviations............................................................................................................................ 24-4 24.3 Glossary of Terms .................................................................................................................... 24-6 25.0 RELIANCE ON INFORMATION PROVIDED BY THE REGISTRANT ................................... 25-1 25.1 Introduction ............................................................................................................................... 25-1 25.2 Macroeconomic Trends ............................................................................................................ 25-1 25.3 Markets ..................................................................................................................................... 25-1 25.4 Legal Matters............................................................................................................................ 25-2 25.5 Environmental Matters ............................................................................................................. 25-2 25.6 Stakeholder Accommodations ................................................................................................. 25-2 25.7 Governmental Factors .............................................................................................................. 25-2 Cadia Valley Operations New South Wales, Australia Technical Report Summary Date: February 2026 Page ix TABLES Table 1-1: Measured and Indicated Mineral Resource Statement .................................................... 1-11 Table 1-2: Inferred Mineral Resource Statement .............................................................................. 1-11 Table 1-3: Proven and Probable Mineral Reserve Statement ........................................................... 1-14 Table 1-4: Commodity Price and Exchange Rate Forecasts ............................................................ 1-20 Table 1-5: Capital Cost Estimate Summary ...................................................................................... 1-24 Table 1-6: Operating Cost Estimate Summary.................................................................................. 1-24 Table 1-7: Operating Unit Cost Estimate ........................................................................................... 1-25 Table 1-8: Cash Flow Summary Table .............................................................................................. 1-26 Table 3-1: Deposit Locations ............................................................................................................... 3-1 Table 3-2: Mineral Titles ...................................................................................................................... 3-1 Table 3-3: Mineral Tenure Summary Table ......................................................................................... 3-3 Table 3-4: Water Access Licenses ...................................................................................................... 3-8 Table 5-1: Project History .................................................................................................................... 5-1 Table 6-1: Deposit Model Features ..................................................................................................... 6-1 Table 6-2: Major Fault Types, Cadia East ......................................................................................... 6-14 Table 7-1: Geophysical Surveys ......................................................................................................... 7-6 Table 7-2: Project Drill Summary Table by Company ....................................................................... 7-13 Table 7-3: Project Drill Summary Table by Area ............................................................................... 7-15 Table 7-4: Drill Holes Supporting Cadia East Mineral Resource Estimate ....................................... 7-16 Table 7-5: Drill Holes Supporting Ridgeway Mineral Resource Estimate ......................................... 7-16 Table 9-1: Internal Data Verification Measures ................................................................................... 9-1 Table 9-2: External Data Verification Programs .................................................................................. 9-3 Table 10-1: Cadia East Testwork Summary (1995–2011) .................................................................. 10-3 Table 10-2: Cadia East Testwork Summary (2015–2021) .................................................................. 10-4 Table 10-3: Ridgeway Deeps Testwork Summary .............................................................................. 10-6 Table 10-4: Cadia East Gold Recovery Models .................................................................................. 10-7 Table 10-5: Cadia East Copper Recovery Models .............................................................................. 10-8 Table 11-1: Kriging Estimation Parameters ......................................................................................... 11-5 Table 11-2: Cadia East Drill Spacing Supporting Confidence Categories .......................................... 11-6 Table 11-3: Metal Price and Exchange Rate Assumptions ................................................................. 11-7 Table 11-4: Inputs Used for Reasonable Prospects of Economic Extraction, Cadia East .................. 11-8 Table 11-5: Inputs Used for Reasonable Prospects of Economic Extraction, Ridgeway ................... 11-9 Table 11-6: Inputs Used for Reasonable Prospects of Economic Extraction, Cadia Hill Stockpiles .. 11-9 Table 11-7: Measured and Indicated Mineral Resource Statement (gold, copper, silver) ................ 11-11 Table 11-8: Measured and Indicated Mineral Resource Statement (molybdenum) .......................... 11-11 Table 11-9: Inferred Mineral Resource Statement (gold, copper, silver) .......................................... 11-11 Table 11-10: Inferred Mineral Resource Statement (molybdenum) ................................................ 11-11 Table 12-1: Metal Price and Exchange Rate Assumptions ................................................................. 12-1 Table 12-2: Mineral Reserve Shut-off Value ....................................................................................... 12-4 Table 12-3: Metallurgical Recovery, Cadia East ................................................................................. 12-4 Table 12-4: Ridgeway Deeps Lift 1 Shut-Off Values ........................................................................... 12-6 Table 12-5: Metallurgical Recovery, Ridgeway ................................................................................... 12-6 Table 12-6: Proven and Probable Mineral Reserve Statement ........................................................... 12-7 Table 13-1: Cadia East Key Design Parameters................................................................................. 13-7 Table 13-2: Future Development Profiles ............................................................................................ 13-8 Table 13-3: Primary Equipment Summary, Cadia East .................................................................... 13-11 Table 13-4: Secondary Production Equipment Summary, Cadia East ............................................. 13-12 Cadia Valley Operations New South Wales, Australia Technical Report Summary Date: February 2026 Page x Table 13-5: Forecast Production Schedule, Cadia East ................................................................... 13-13 Table 13-6: Key Design Parameters, Ridgeway ............................................................................... 13-15 Table 13-7: Primary Equipment, Ridgeway ....................................................................................... 13-16 Table 14-1: Process Equipment .......................................................................................................... 14-4 Table 16-1: Commodity Price and Exchange Rate Forecasts ............................................................ 16-3 Table 17-1: Cadia Modifications .......................................................................................................... 17-2 Table 17-2: Environmental Management and Monitoring Regime ...................................................... 17-1 Table 17-3: Waste Management ......................................................................................................... 17-1 Table 17-4: Water Management System Elements............................................................................. 17-5 Table 17-5: Water Management Strategy ........................................................................................... 17-6 Table 17-6: Key Permits .................................................................................................................... 17-11 Table 18-1: Capital Cost Estimate Summary ...................................................................................... 18-2 Table 18-2: Operating Cost Estimate Summary.................................................................................. 18-3 Table 18-3: Operating Unit Cost Estimate ........................................................................................... 18-3 Table 19-1: Cash Flow Summary Table .............................................................................................. 19-2 Table 19-2: Annualized Cash Flow (2026–2033) ................................................................................ 19-4 Table 19-3: Annualized Cash Flow (2034–2043) ................................................................................ 19-5 Table 19-4: Annualized Cash Flow (2044–2053) ................................................................................ 19-6 Table 19-5: Annualized Cash Flow (2054–2058) ................................................................................ 19-7 FIGURES Figure 1-1: Sensitivity Analysis ........................................................................................................... 1-27 Figure 2-1: Project Location Plan ......................................................................................................... 2-2 Figure 2-2: Deposit Locations ............................................................................................................... 2-3 Figure 3-1: Mineral Tenure Location Plan ............................................................................................ 3-6 Figure 3-2: Surface Rights Location Map ............................................................................................. 3-7 Figure 6-1: Regional Geology of the Ordovician Rocks of New South Wales ..................................... 6-3 Figure 6-2: Cadia Valley Geological Plan ............................................................................................. 6-4 Figure 6-3: Cadia Valley Geological Cross Section (long-section looking north 22500N) ................... 6-5 Figure 6-4: Comparative Stratigraphy .................................................................................................. 6-7 Figure 6-5: Comparative Geological Cross-Sections ........................................................................... 6-8 Figure 6-6: Geology Section, Cadia East (15,820 mE) ...................................................................... 6-12 Figure 6-7: Geology Section, Cadia Far East (Section 15820 mE) .................................................... 6-13 Figure 6-8: Geology Level Plan, Ridgeway (5280RL level) ................................................................ 6-16 Figure 6-9: Geological Sections, Ridgeway ........................................................................................ 6-17 Figure 6-10: Alteration and Pyrite Zoning, Ridgeway (section 11050 mE) .......................................... 6-19 Figure 7-1: Stream Sediment Sampling ............................................................................................... 7-3 Figure 7-2: Rock Chip Sampling ........................................................................................................... 7-4 Figure 7-3: Soil Sampling ..................................................................................................................... 7-5 Figure 7-4: Geophysical Survey Location Plan .................................................................................... 7-9 Figure 7-5: Regional Prospects .......................................................................................................... 7-12 Figure 7-6: Project Drill Hole Location Plan ........................................................................................ 7-14 Figure 7-7: Cadia East Drill Hole Location Plan ................................................................................. 7-17 Figure 7-8: Ridgeway Drill Hole Location Plan ................................................................................... 7-18 Figure 7-9: Drilling Since Cadia East Database Closeout Date ......................................................... 7-20 Figure 12-1: Planned Mine Layout Schematic, Cadia East .................................................................. 12-2 Figure 12-2: Ridgeway Mine Layout Schematic ................................................................................... 12-5 Figure 13-1: Schematic Showing Mining Operations ........................................................................... 13-2


Cadia Valley Operations New South Wales, Australia Technical Report Summary Date: February 2026 Page xi Figure 13-2: Geotechnical Block Model Schematic .............................................................................. 13-4 Figure 13-3: Planned Infrastructure Schematic, Cadia East .............................................................. 13-10 Figure 13-4: Offset Herringbone Layout Schematic ........................................................................... 13-15 Figure 14-1: Simplified Process Flow Diagram .................................................................................... 14-2 Figure 15-1: Infrastructure Layout Plan ................................................................................................ 15-2 Figure 15-2: Final Project Layout ......................................................................................................... 15-4 Figure 17-1: Tailings Storage Facility Location Plan ............................................................................ 17-3 Figure 19-1: Sensitivity Analysis ........................................................................................................... 19-1 Cadia Valley Operations New South Wales, Australia Technical Report Summary Date: February 2026 Page 1-1 1.0 EXECUTIVE SUMMARY 1.1 Introduction This technical report summary (the Report) was prepared for Newmont Corporation (Newmont) on the Cadia Valley Operations (Cadia Valley Operations or the Project), in New South Wales (NSW), Australia. The Cadia Valley Operations are 100% owned by Newmont, and consist of the operating Cadia East gold mine (Cadia East), the mined-out Cadia Hill gold mine (Cadia Hill), and the Ridgeway gold mine (Ridgeway) that is on care-and-maintenance. 1.2 Terms of Reference Mineral resources are estimated for the Cadia East and Ridgeway deposits and the Cadia Hill stockpile. Mineral reserves are estimated for Cadia East and Ridgeway, and in stockpiles. Mineral resources and mineral reserves are reported using the definitions in Regulation S–K 1300 (SK1300), under Item 1300. All measurement units used in this Report are metric unless otherwise noted, and currency is expressed in United States dollars (US$) as identified in the text. The Australian currency is the Australian dollar (AU$), the assumed US$:AU$ exchange rate was 0.70:1. Unless otherwise indicated, all financial values are reported in US$ including all operating costs, capital costs, cash flows, taxes, revenues, expenses, and overhead distributions. The mine plan uses the terms block cave (Ridgeway) and panel cave (Cadia East). A block cave operation produces from the full orebody footprint from the outset of the operation. In panel caving the active caving zone moves across the full footprint with time. Development of a new panel in a panel caving operation is analogous to a pit cutback in an open pit mining operation. The Report uses US English. 1.3 Property Setting The Cadia Valley Operations are located approximately 25 km south–southwest of the town of Orange in NSW, and approximately 200 km west–northwest of Sydney. The Cadia Valley Operations are accessed by sealed road from Orange. Commuter airlines provide Brisbane to Orange, Sydney to Orange, and Melbourne to Orange services. The Orange airport is about 12 km northeast of the Cadia Valley Operations. The area experiences the warmest temperatures from November to March and the coolest from May to August. The lowest mean monthly rainfall occurs March and April and the highest mean monthly rainfall occurs in August. The most common wind directions are from the southwest and northeast. Mining and exploration activities are conducted year-round. Elevations range from approximately 600 m Australian height datum (AHD) to 1,000 mAHD. The region is characterized by gently undulating hills, cleared open grassland and vegetation consisting mainly of scattered paddock trees, with isolated patches of remnant woodland and Cadia Valley Operations New South Wales, Australia Technical Report Summary Date: February 2026 Page 1-2 shelterbelts, and State Forest plantations of Monterey Pine. The dominant land use in the Orange region is agriculture, principally grazing (sheep and cattle), cropping and orchards. The bushfire season in the Cadia valley area and Central West Region is generally from mid- November to mid-March. Depending on factors such as weather, fuel loads (build-up of leaf litter and broken branches), and drought indices, this season can be extended from early September to late April. There are moderate fuel loads associated with the open forest and woodland areas within the Cadia East subsidence zone and the tailings storage facilities (TSF) expansion areas that may present a fire hazard. The deposits are located in an area that has been seismically active both prior to and subsequent to the commencement of mining by Newcrest. These events can produce seismic loading, and this risk is considered in infrastructure design. 1.4 Ownership The Cadia Valley Operations are 100% owned by Newmont through its wholly-owned subsidiary, Cadia Holdings Pty Ltd. 1.5 Mineral Tenure, Surface Rights, Water Rights, Royalties and Agreements The Cadia Valley Operations consist of 11 granted Mining Leases and 11 granted Exploration Licenses, with a total approximate area of 386 km2. The current minimum statutory annual expenditure changes on an annual basis depending on approved work programs. All statutory obligations to retain the Exploration Licenses had been met as at December 31, 2025. Newmont predominantly owns all surface properties covered by the Mining Leases and a number of properties in the surrounding area. Newmont also holds licenses to occupy crown roads within the Mining Leases and two small portions of crown land comprising Lot 7001 in Deposited Land (DP) 1020360 and Lot 103 in DP 750371 within Mining Lease 1405. Newmont holds occupation permits for infrastructure within surrounding State forest lands. The concentrate pipeline and return water line from Blayney is subject to leases within public lands under the control of the Blayney and Cabonne local government areas. Newmont owns the land on which the Cadia dewatering plant is located (Lot 106 DP1161062) and leases adjoining Lot 102 which contains the rail track spur line from Mitziya Pty Ltd as owner of the adjoining ‘Sea-Link’ development site. The rail track spur line connects to the Great Western Railway line, with transport of concentrate ultimately to Port Kembla. An Environmental Protection License covers the operations within the six Mining Leases plus the Cadia dewatering facilities, and ancillary infrastructure. Newmont holds water access licenses under the Water Management Act 2000 for water extraction. In New South Wales the royalty rate is 4% of the ex-mine value of the bullion and concentrate “recovered” (recovered being sold material and increases in stockpile material), less allowable deductions (treatment, depreciation, realization, and administration costs). Currently, gold, silver, copper, and molybdenum are levied at 4% of the ex-mine value less allowable deductions. There are no other royalties or similar obligations payable on the Project. There are a number of current community concerns, regulatory actions, and legal proceedings in relation to the Cadia Valley Operations. Cadia Valley Operations New South Wales, Australia Technical Report Summary Date: February 2026 Page 1-3 In October 2023 the New South Wales Environment Protection Authority commenced two charges against Newmont for the Cadia Valley Operations relating to alleged air pollution from the surface of the Cadia Valley Operations’ tailing storage facilities on October 13 and 22, 2022. Newmont has entered a plea of not guilty in relation to both charges, and the matter will go to court in February 2026. Community concerns were raised in relation to groundwater and surface water quality downstream of the Cadia Valley Operations, and in relation to both metals and per- and polyfluoroalkyl substances. The New South Wales Environment Protection Authority completed extensive sampling of the surface water network in the Upper Belubula River catchment and produced publicly available reports. The Environment Protection Authority sampling shows that water in the district meets irrigation and livestock criteria. Traces of perfluorooctane sulfonic acid, a chemical found in fire-fighting foams amongst other uses, were detected in water monitoring within the Cadia Valley Operations. As a result, the New South Wales Environment Protection Authority altered the site’s Environment Protection License to have Newmont engage an independent consultant to undertake an investigation of potential sources of perfluorooctane sulfonic acid on site. The New South Wales Environment Protection Authority has also put the same investigative condition on other major industries in the Orange district. Newmont has not used fire-fighting foam containing perfluorooctane sulfonic acid since 2016. 1.6 Geology and Mineralization The Cadia East and Ridgeway deposits are considered to be examples of alkalic porphyry gold– copper-style mineralization. The Cadia deposits are located in the eastern Lachlan Fold Belt of NSW and formed within the intra-oceanic Macquarie Arc, a belt of Ordovician to early Silurian mafic to intermediate volcanic, volcaniclastic and intrusive rocks. Post-mineral deformation partially dismembered the district, thereby superposing different porphyry copper–gold systems as well as the host stratigraphy level. The basement rocks in the Cadia district are Ordovician siltstones and volcanic units of the Weemalla Formation. They are conformably overlain by andesitic to basaltic andesitic lithologies of the Ordovician Forest Reefs Volcanics. Silurian conglomerates, sandstones, and siltstones (part of the Waugoola Group) cover large portions of the Ordovician volcano-sedimentary succession. Tertiary basalts of the Canobolas Volcanic Complex cover the Paleozoic rocks to the north and east of the district. Mineralization-related Ordovician to Silurian alkalic intrusions young eastwards across the Cadia Valley, with Ridgeway being the oldest deposit in the district and Cadia East the youngest. Three main intrusive complexes were identified. Although currently spatially separated due to the current erosion level, they may be connected at depth. The Cadia Intrusive Complex (CIC) consists of pyroxene diorite, monzodiorite and occasional pyroxenite in the west to monzonite, quartz monzonite, and quartz monzodiorite in the east. The mafic, western portion of the CIC is interpreted to be separated from the eastern, felsic portion of the CIC by a major north–northwest-striking, west–southwest-dipping thrust fault, the Purple Fault.


Cadia Valley Operations New South Wales, Australia Technical Report Summary Date: February 2026 Page 1-4 The Ridgeway Intrusive Complex (RIC) is located 2.5 km northwest of the Cadia Hill portion of the CIC, with the top of the RIC occurring about 500 m below surface. At least three intrusive stages were defined, of which the latter two have a clearly demonstrated temporal relationship with Ridgeway deposit alteration and mineralization. The RIC comprises a vertically attenuated composite pipe of monzodiorite to quartz monzonite. It has horizontal dimensions of 200 x 100 m, is elongated along a northwest trending axis, and extends subvertically for at least 1 km. The Cadia East Intrusive Complex (CEIC) comprises a series of west–northwest- to west-striking dikes that dip steeply to the north. The top of the complex averages about 800 m below the surface. Dyke compositions range from monzodiorite and quartz monzodiorite to quartz monzonite. The major regional structure is the 30 km long Werribee–Cadiangullong Fault Zone. Where the Werribee–Cadiangullong Fault Zone intersects structures related to the west–northwest-oriented Lachlan Transverse Zone, it forms a series of north–northwest- and northeast-trending thrust faults. This structural intersection appears to have controlled the location of the CIC and associated mineralization. Newmont identified more than 56 structures during production and development activities that influence the Cadia Valley-wide structural setting, and therefore mine planning and caving operations. Underground mapping demonstrated that fault behavior at the local scale can be highly complex, particularly for steeply-dipping structures. The Cadia porphyry deposits record a sequence of alteration and mineralization events that evolved from early-stage magnetite-stable sodic, potassic and calc-potassic alteration with locally significant gold–copper mineralization, through a period of transitional stage potassic alteration that introduced most of the gold–copper mineralization. Propylitic and calc-silicate alteration were developed in the deposit peripheries at this time and a late stage of feldspathic alteration developed irregularly around the deposit margins and locally destroyed mineralization. The mineralization within the Project area occurs within a 6 km-long west–northwest-oriented corridor. Mineralization in the porphyry deposits occurs as sheeted and stockwork quartz–sulfide veins, and locally as broadly stratabound disseminated mineralization (Cadia East) and skarn (Big Cadia and Little Cadia). The Cadia deposit occupies a mineralized zone 2.5 km in strike length, 600 m in width and over 1,900 m in vertical extent. Mineralization at Cadia East is divided into two broad overlapping zones: an upper, copper-rich disseminated zone and a deeper gold-rich zone associated with sheeted veins. The upper zone forms a relatively small cap to the overall mineralized envelope and has a core of disseminated chalcopyrite (and rare bornite), capped by chalcopyrite–pyrite mineralization. The deeper zone is localized around a core of steeply-dipping, sheeted, quartz– calcite–bornite–chalcopyrite–molybdenite veins, with the highest gold grades associated with the bornite-bearing veins. Copper and molybdenite form a mineralized blanket above and to the east of the higher-grade gold envelope. The Ridgeway deposit is a subvertical body of quartz–sulfide vein stockwork mineralization with an elliptical, pipe-like geometry, elongated along a northwest-striking axis. Stockwork dimensions are approximately 400 m east–west, 250 m north–south and the deposit extends to a depth in excess of 1,000 m. Mineralization at Ridgeway and Ridgeway Deeps occurs in dense quartz vein stockworks and sheeted arrays localized in and around the small (50–100 m diameter) composite diorite to quartz–monzonite intrusive complex. The most strongly developed quartz stockwork veining and alteration, and the highest copper and gold grades, occur immediately adjacent to the monzonite. Sulfide minerals are zoned from a bornite to chalcopyrite (plus gold) core, outwards and upwards through a chalcopyrite-rich to an outer pyrite-rich domain. Cadia Valley Operations New South Wales, Australia Technical Report Summary Date: February 2026 Page 1-5 1.7 History and Exploration Historical gold and copper mining operations occurred at a number of small deposits in the general Cadia area. Prior to Newmont’s interest, Pacific Copper Limited (Pacific Copper), and Homestake Australia Limited conducted exploration in the Big Cadia area, including soil sampling, core, reverse circulation (RC), and rotary air blast (RAB) drilling. Newcrest acquired the property in March 1991 with an initial focus on the small shallow oxide resources at Big Cadia. Newcrest completed rock chip, soil, and stream sediment geochemical sampling, down-hole, ground and airborne geophysical surveys, technical studies, and mining operations. Newmont acquired Newcrest in November, 2023. Cadia is a mature district with numerous exploration prospects. As such, the amount of data and geological knowledge that is available is extensive. Newmont is currently using district-scale datasets and tools to potentially identify additional mineralization surrounding current Cadia Valley Operations. 1.8 Drilling and Sampling 1.8.1 Drilling Drilling to December 31, 2025 consisted of 7,039 drill holes (about 1,771,939 m). Drill types used include core, RC, aircore, rotary air blast (RAB), sonic, and percussion. Core drilling is the predominant drill type. The drilling that supports the mineral resource estimates consists of: • Cadia East: 691 drill holes (about 494,759 m); • Ridgeway: 495 drill holes (about 232,096 m); Aircore, RAB, sonic, and percussion drill types are not used in mineral resource estimation. The drilling of the Cadia East deposit includes drill core of the following sizes, NQ3 (47.6 mm core diameter), HQ3 (63.5 mm) and PQ (85 mm). Drilling at Ridgeway is predominantly LTK60 (44.0 mm), NQ (47.6 mm) or HQ (63.5 mm) core sizes. Most drill holes are collared at PQ or HQ sizes for accurate and safe drilling. The drill hole size is then reduced at the geologist’s discretion as the drill hole advances. Most of the drilling uses triple-tube core tools. RC drilling is used for infill resource definition on occasion; however, geotechnical data are not collected from RC drilling. Early logging (pre–2000) was typically conducted on 1 m intervals. After 2000, lithology was logged on a variable interval basis with intervals determined from combinations of rock type, alteration, structure, and mineralization. Logging and data collection include collar, lithology, mineralization, structure, geotechnical and bulk density information. Lithology is logged based on the geological unit, with subdivisions created based on alteration and mineralization. There are only minor zones of lost core or poor core recovery overall. Core recovery is generally excellent Project-wide, with core recoveries in fresh rock of around 99–100%. Survey methods included theodolite surveys and differential global positioning system (DGPS) instruments. A variety of methods were used to measure down-hole deviation (dip and azimuth), Cadia Valley Operations New South Wales, Australia Technical Report Summary Date: February 2026 Page 1-6 including FlexIT, Ranger, Eastman, Maxibor, Multishot, and gyroscopic instruments. Face and wall samples are located using iSITE mapping equipment, with field data processed in Vulcan. Drawpoint samples do not require accurate location and are labelled according to the drawpoint number. 1.8.2 Hydrogeology The Cadia monitoring drill hole network has continuously expanded over time due to the inherent complexity of fractured bedrock aquifers. Currently there are 149 groundwater drill holes active within, and surrounding, the Cadia Valley Operations, of which 120 are monitored on a routine basis. To the Report date, the hydrogeological data collection programs have provided data suitable for use in the mining operations, and have supported the assumptions used in the active mining operations. Monitoring data are collected for the following elements: groundwater level (piezometric surface) and water quality variables. A regional numerical groundwater flow model has been developed to predict impacts from mining and tailings storage at Cadia. A new regional numerical flow model is under development. The site water balance is on average negative and as a result, the site needs to import water to satisfy all the demand requirements. During wet seasons, however, the site water balance becomes positive, capturing more water than required. 1.8.3 Geotechnical The geological hard rock setting at Cadia East and Ridgeway is well understood and displays reasonable consistency through the spatial extent of the host sequences. Where this is not the case due to geotechnical conditions or alteration (e.g. Ca-La Fracture Zones), these areas are well defined and domained accordingly. To date, the geotechnical data collection programs have provided data suitable for use in the mining operations, with this data used in various geotechnical models (e.g., RMR, Q’, P32 and Is50) that inform at both tunnel (development design) and cave/mine-wide (e.g., subsidence, flow, fragmentation, propagation, and seismic hazard) scale. 1.8.4 Sampling and Assay Core is sampled and analyzed on intervals determined by the geologist, with the aim of a nominal 2 m sample interval. Minimal RC sampling has been undertaken. Intervals for bulk density determination are selected according to lithology, alteration, and mineralization considerations. Density determinations are performed on site by geologists or geological assistants as part of the logging process, and use the water immersion method. Depending on the deposit and the geotechnical conditions encountered, measurements are generally taken at 20–50 m intervals down hole. Third-party, independent analytical and sample preparation laboratories used during early exploration efforts include Genalysis (Townsville), AAL (Orange), Analabs (Townsville), ALS Chemex (Townsville), and AMDEL (Orange, Perth). There are no accreditation data available in Cadia Valley Operations New South Wales, Australia Technical Report Summary Date: February 2026 Page 1-7 the Project database for these laboratories at the time of use. Other third-party, independent analytical and sample preparation laboratories include ALS Chemex (Orange), and Intertek (Perth), both of which hold ISO170025 accreditations for selected analytical techniques. The Newcrest Services Laboratory, located in Orange (NSLO), has been used as the primary laboratory since June 2010. NSLO holds ISO 17025 accreditations but is not independent. Sample preparation and analytical methods varied over time. Earlier programs typically crushed to 2 mm and pulverized to 90% passing 75 µm; after 2009 this was amended to crushing to 2 mm and pulverizing to 95% passing 75 µm. The analytical methods used for the majority of the legacy data are not recorded in the Project database. Information recorded typically consists of the element and detection limit. Legacy analyses were primarily for gold and copper, but a multi-element suite could occasionally be completed. Depending on the area, some core may have gaps where no assays were recorded. Samples collected during the Newcrest/Newmont programs were routinely assayed for gold, copper, and a multi-element suite. Data are stored in a SQL server database using acQuire software. Regular reviews of data quality are conducted by site and corporate teams prior to resource estimation, in addition to external reviews. The database is regularly backed up, and copies are stored both offsite and in Newmont- owned facilities. Sample security has not historically been monitored. Sample collection from drill point to laboratory relies upon the fact that samples are either always attended, or stored in the locked on-site preparation facility, or stored in a secure area prior to laboratory shipment. Chain-of- custody procedures consist of sample submittal forms to be sent to the laboratory with sample shipments to ensure that all samples are received by the laboratory. 1.8.5 Quality Assurance and Quality Control A comprehensive quality assurance and quality control (QA/QC) program is in place for sample analysis. The process typically involves submission and analysis of standard reference materials, blanks, duplicates, replicates, and grind and crush size checks. QA/QC submission rates are typical for the program at the time the data were collected. Results are regularly monitored. The QA/QC programs adequately address issues of precision, accuracy, and contamination. 1.9 Data Verification Newmont personnel regularly visit the laboratories that process Newmont samples to inspect sample preparation and analytical procedures. The database that supports mineral resource and mineral reserve estimates is checked using electronic data scripts and triggers. Data verification was performed by external consultants in support of mine development and operations. No material issues were identified in the reviews. Observations made during the QP’s site visit, in conjunction with discussions with site-based technical staff also support the geological interpretations, and analytical and database quality.


Cadia Valley Operations New South Wales, Australia Technical Report Summary Date: February 2026 Page 1-8 The QP’s personal inspection supports the use of the data in mineral resource and mineral reserve estimation, and in mine planning. The QP received reconciliation reports from the operations. Through the review of these reconciliation factors, the QP can accept the use of the data in support of the mineral resource and mineral reserve estimates. 1.10 Metallurgical Testwork Independent laboratories and testwork facilities used during metallurgical evaluation included AMML, ALS Townsville, ALS Brisbane, Metso Minerals Process Technology, JKTech, Metcon, Enviromet, Optimet, Amdel, Normet, and Lakefield Laboratory (Canada). Metallurgical testwork and mineralogical information supporting the process design and metal recovery estimates included: optical mineralogy; X-ray diffraction (XRD) and mineral laboratory analysis (MLA); comminution tests (drop-weight (DWi), SAG mill comminution (SMC), Bond ball work index (BWi), rod work index (RWi), abrasion (Ai); rougher and cleaner flotation tests, gravity testwork, primary grind and regrind size sensitivity tests; evaluation of alternate reagents; flash flotation testing, fluorine depression batch flotation tests and locked cycle flotation tests. Overall, samples selected for metallurgical testing during feasibility, development and expansion studies were representative of the various styles of mineralization within the different mineralized zones. Samples were selected from a range of locations and metal grades within the deposit zones. Sample density is acceptable for forecasting purposes. Cadia East and Ridgeway can be described as "well behaved" porphyry copper deposits where the mineralogical drivers of metallurgical performance are well understood, risks were recognized and appropriate industry standard mitigating actions are identified. Metallurgical recovery forecasts are: • Cadia East gold recovery rates are forecast at approximately 80%, copper recovery rates at approximately 86%, silver recovery rates at approximately 67% and molybdenum recovery rates (relative to plant feed) of approximately 67%; • Ridgeway: recovery forecasts for the overall LOM are 81% for gold, 87% for copper and 66% for silver; • Stockpiles: gold recovery of 64%, and copper recovery of 75%. Fluorine is the main deleterious element identified at Cadia East that could influence concentrate sales and marketing. Since 2017, all material within the plant has been processed through a Jameson cell, giving maximum fluorine rejection, particularly of the entrained fluorine-bearing minerals, and therefore it is unlikely that fluorine levels in copper concentrate will exceed the maximum contractual limits over the LOM. There are expected to be no deleterious elements in any Ridgeway concentrates that will trigger penalty payments or rejection rates. 1.11 Mineral Resource Estimation 1.11.1 Estimation Methodology The Cadia East resource model is based on a structural model and lithological model that uses multi-element geochemistry. Grade shells of 0.1% Cu, 0.1 g/t Au, and 20 ppm Mo inform the area Cadia Valley Operations New South Wales, Australia Technical Report Summary Date: February 2026 Page 1-9 of mineralization. A total of five estimation domains were constructed, and were used in the estimation of gold, copper, silver, molybdenum, fluorine, iron, lead, sulfur, and zinc. Ordinary kriging (OK) was used as the estimation method for all elements in all domains. Gold, copper, and molybdenum were estimated using locally varying anisotropy (LVA). At Ridgeway, estimation domains were based on lithology and structure inside a mineralized envelope. Individual domains were created for gold, copper, sulfur, and silver. Data were separated into six geological domains, seven structural domains, and six grade domains. At Cadia East, the drill hole database was composited to 10 m downhole for use in all subsequent analysis and estimation. Composite lengths of 2 m and 4 m were tested at Ridgeway to verify the optimum length, and the 4 m length was selected to support resource estimation of gold and copper. Capping was only applied to selected elements and domains at Cadia East. Local capping was employed for gold, copper, and molybdenum to preserve higher grades where those grades are supported by surrounding data. No grade caps were applied during estimation at Ridgeway. At Cadia East, bulk density was estimated using OK. Bulk density was assigned by domain at Ridgeway. For Cadia East, grade estimations for the major elements were completed using OK. A kriging neighborhood analysis was used for the search neighborhoods. A minimum of 10 composites and a maximum of 20 composites were used in estimating. A restriction of maximum of four composites per drill hole was applied to avoid any single drill hole having too much influence on an estimated block. A block discretization of 4 x 4 x 4 was applied to all the blocks for estimation. Domains were treated as soft to firm with variable data sharing ranges between 5–40 m. The following estimation parameters were used for the Ridgeway mineral resource estimate: block size of 25 m (E) x 25 m (N) x 25 m (elevation); minimum of eight samples and maximum of 48 samples; and OK interpolation. Estimation parameters for the Ridgeway resource model were optimized using quantitative kriging neighborhood analysis. The block models and informing composites were validated using a combination of visual inspection in plan and section, nearest-neighbor model comparison, swath plots, grade–tonnage curves, and direct block simulation. Resource confidence categories were assigned on the basis of drill spacing studies at Cadia East. The gold average variogram weighted distance was taken as a proxy for the gold average drill hole spacing. Mineral resources for Ridgeway were classified within a 0.2 g/t Au grade shell based on drill spacing. Stockpiles generated from the mining of the former Cadia Hill open pit are estimated as measured mineral resources using the cost assumptions for Cadia Hill at the time the stockpile material was deposited. The mineral resource estimate for Cadia East was reported within an outline determined by net smelter return (NSR) cut-offs for each block in the resource model. The NSR was the estimated proceeds from the sale of mineral products after the application of metal recoveries and deduction of transport, smelting, refining, and marketing charges, as well as royalty payments. The reporting shell (potentially economic outline) was expanded or contracted (in places) to fully encompass the panel cave footprints, or remove areas that were not considered potentially mineable. The classification of material at Cadia East was constrained within an US$24.62 NSR cut-off, and was considered to be the boundary at which the material had reasonable prospects for economic extraction. Cadia Valley Operations New South Wales, Australia Technical Report Summary Date: February 2026 Page 1-10 The Ridgeway estimate was reported assuming an underground mass mining method, likely block/panel caving. There was an assumption of a change in the mining method at 5040 mRL, from sub-level caving to block caving. The conceptual cave was constructed by assigning an NSR value to all blocks in the resource block model, determining a cave footprint string, and projecting directly to the top of the cave column. The cave was not allowed to expand beyond the extraction level footprint but could be reduced in diameter as a draw bell can be shut-off at cut-off grade before the entire column was extracted. Column heights ranged from 150–400 m with minimum diameters of 120 m. Mineral resources were reported inclusive of internal zones of non-mineralized diluting material. These zones can include low-grade to barren monzonite zones and late-stage pyroxene porphyry dikes. Mineral resources were reported using an US$8.75/t value shell. Commodity prices used in resource estimation are based on long-term analyst and bank forecasts, supplemented with research by Newmont’s internal specialists. The estimated timeframe used for the price forecasts is the 32-year LOM that supports the mineral reserve estimates. For those deposits considered potentially amenable to underground mass mining methods, Cadia East and Ridgeway, no cut-off is used. The entire volume within the mineable shape outline is reported including internal dilution. 1.11.2 Mineral Resource Statement Mineral resources are reported using the mineral resource definitions set out in SK1300 on a 100% basis. Newmont holds a 100% Project interest. The estimates are current as at December 31, 2025. The reference point for the estimates is in situ or in stockpiles. Mineral resources are reported exclusive of those mineral resources converted to mineral reserves. Mineral resources that are not mineral reserves do not have demonstrated economic viability. Measured and indicated mineral resources are summarized in Table 1-1. Inferred mineral resources are presented in Table 1-2. The Qualified Person for the estimate is Mr. Shaun Chanter, RM SME, Head Reserve Governance - Global, a Newmont employee. Cadia Valley Operations New South Wales, Australia Technical Report Summary Date: February 2026 Page 1-11 Table 1-1: Measured and Indicated Mineral Resource Statement Resource Confidence Classification Area Tonnes (kt) Grade Contained Metal Au (g/t) Cu (%) Ag (g/t) Au (koz) Cu (kt) Ag (koz) Measured Stockpile 28,500 0.30 0.13 — 300 0 — Indicated Underground 1,009,300 0.29 0.25 0.62 9,400 2,600 20,200 Total measured and indicated 1,037,800 0.29 0.25 0.62 9,700 2,600 20,200 Resource Confidence Classification Area Tonnes (kt) Grade Contained Metal Mo (%) Mo (kt) Indicated Underground 938,100 0.01 100 Total measured and indicated 938,100 0.01 100 Table 1-2: Inferred Mineral Resource Statement Resource Confidence Classification Area Tonnes (kt) Grade Contained Metal Au (g/t) Cu (%) Ag (g/t) Au (koz) Cu (kt) Ag (koz) Inferred Underground 163,900 0.2 0.2 0.4 1,300 300 2,300 Resource Confidence Classification Area Tonnes (kt) Grade Contained Metal Mo (%) Mo (kt) Inferred Underground 124,200 0.01 0 Notes to Accompany Mineral Resource Tables: 1. Mineral resources are current as at December 31, 2025. Mineral resources are reported using the definitions in SK1300 on a 100% basis. The Qualified Person responsible for the estimate is Mr. Shaun Chanter, RM SME, Head Reserve Governance - Global, a Newmont employee. 2. The reference point for the mineral resources is in situ or in stockpiles. 3. Mineral resources are reported exclusive of mineral reserves. Mineral resources that are not mineral reserves do not have demonstrated economic viability. 4. Mineral resources that are potentially amenable to underground mass mining methods are reported using the inputs summarized in Table 11-4 and Table 11-5. Mineral resources in stockpiles are constrained using the inputs summarized in Table 11-6. 5. Tonnages are metric tonnes. Gold and silver ounces and copper and molybdenum tonnes are estimates of metal contained in tonnages and do not include allowances for processing losses. 6. Rounding as required by reporting guidelines may result in apparent differences between tonnes, grade and contained metal content. Tonnes are rounded to the nearest 100,000 tonnes. Ounces are rounded to the nearest 100,000 ounces and tonnes are rounded to the nearest 100,000. In instances where tonnage and grade are presented but metal is shown as “0”, this is due to the metal contained falling below the metal rounding limit.


Cadia Valley Operations New South Wales, Australia Technical Report Summary Date: February 2026 Page 1-12 1.11.3 Factors That May Affect the Mineral Resource Estimate Areas of uncertainty that may materially impact the mineral resource estimates include: changes to long-term metal and exchange rate price assumptions; changes in local interpretations of mineralization geometry, structures, and continuity of mineralized zones; changes to geological and grade shape and geological and grade continuity assumptions; changes to metallurgical recovery assumptions; changes to the input assumptions used to derive the conceptual underground mass mining methods used to constrain the estimates; changes to the to the input assumptions used in the constraining pit shell for those mineral resources amenable to open pit mining methods; changes to the NSR cut-offs applied to the estimates; variations in geotechnical (including seismicity), hydrogeological and mining assumptions; and changes to environmental, permitting and social license assumptions. A risk to the resource estimates is the assumption that there will be sufficient tailings storage capacity at the tailings cost input assumption used when considering reasonable prospects of economic extraction. 1.12 Mineral Reserve Estimation 1.12.1 Estimation Methodology Mineral reserves are reported for Cadia East and Ridgeway. The Cadia East mine is operating; Ridgeway is currently on care-and-maintenance. Mineral reserves are estimated assuming bulk underground mining methods. Mine designs supporting the mineral reserves were based on the most recently approved pre-feasibility and feasibility studies, and the operating mine life-of-mine plans. At Cadia East, only draw-columns generating a positive NSR value (economic draw-columns) are included in the reserve, except where it is necessary to include an uneconomic draw-column to ensure a practical mining shape. Draw-column heights were limited by a shut-off NSR value of US$24.62/t. All development material is planned to be hauled to the surface portal dump. From the portal, dump ore is then screened and cleaned of any remnant ground support steel and then hauled to the mill for processing. Waste is hauled to the waste rock storage facility (WRSF) using surface equipment. Mining footprints were determined using a cost of US$525,000 per drawpoint, or US$1.05 million per drawbell. No other capital costs are included in the evaluations as the remaining costs are sunk as part of footprint establishment. Internal dilution is incorporated into the mine plan. All development has mining factors for dilution and recovery applied to accurately represent the expected mined tonnes. The following recovery ranges are anticipated over the LOM: gold: 70–85%; copper: 80–87%; molybdenum: 65–75%; and silver: 62–67%. Estimation of the mineral reserves at Ridgeway involved standard steps of mine optimization, mine design, production scheduling, and financial modelling. Factors and assumptions were based on operating experience and performance in gained in the Cadia Valley Operations. The basis of the analysis is considered to be at a pre-feasibility level of study or higher. Mine plans are based on the extraction of caving blocks solely delineated on the basis of Indicated material. Dilution is included within the probable mineral reserve. The NSR calculation includes reserve revenue factors, metallurgical recovery assumptions, transport costs and refining charges and royalty charges. The site operating costs include mining cost, processing cost, relevant site general and administration costs, and relevant sustaining capital costs. This cost equates to a Cadia Valley Operations New South Wales, Australia Technical Report Summary Date: February 2026 Page 1-13 break-even cut-off value (equivalent to a shut-off value) of approximately US$24.62/t milled. All development material is planned to be hauled to the surface portal dump. All drawpoints with a positive net present value (NPV) are considered, with the assumption that all draw columns will be mined to a profitable height after the cost of cave establishment has been sunk. Recoveries for gold are anticipated to range from approximately 60–70% and recoveries of copper are expected to range from approximately 65–75% through the life of the project. Royalties are calculated as 4% of block revenue less all off site realization costs (treatment and refining charges), less ore treatments costs and less one third of site general and administrative costs. The royalty payments equate to approximately 3% of total revenue on average. 1.12.2 Mineral Reserve Statement Mineral reserves are reported using the mineral reserve definitions set out in SK1300 on a 100% basis. Newmont has a 100% Project interest. Mineral reserves are current as at December 31, 2025. The reference point for the mineral reserve estimate is as delivered to the process facilities. Mineral reserves are reported in Table 1-3. The Qualified Person for the estimate is Mr. Shaun Chanter, RM SME, Head Reserve Governance - Global, a Newmont employee. Cadia Valley Operations New South Wales, Australia Technical Report Summary Date: February 2026 Page 1-14 Table 1-3: Proven and Probable Mineral Reserve Statement Reserve Confidence Classification Area Tonnage (kt) Grade Contained Metal Gold (g/t Au) Copper (% Cu) Silver (g/t Ag) Gold (koz) Copper (kt) Silver (koz) Probable Stockpile 4,300 0.48 0.31 0.74 100 0 100 Underground 1,003,300 0.42 0.29 0.67 13,400 2,900 21,700 Total probable mineral reserves 1,007,600 0.42 0.29 0.67 13,500 2,900 21,800 Reserve Confidence Classification Area Tonnage (kt) Grade Molybdenum (% Mo) Contained Metal Molybdenum (kt) Probable Stockpile 4,300 0.01 0 Underground 992,100 0.01 100 Total probable mineral reserves 996,400 0.01 100 Notes to Accompany Mineral Reserves Table: 1. Mineral reserves current as at December 31, 2025. Mineral reserves are reported using the definitions in SK1300 on a 100% basis. The Qualified Person responsible for the estimate is Mr. Shaun Chanter, RM SME, Head Reserve Governance - Global, a Newmont employee. 2. The reference point for the mineral reserves is the point of delivery to the process plant. 3. Mineral reserves are reported using the assumptions listed in Table 12-1 to Table 12-4. 4. Tonnages are metric tonnes. Gold and silver ounces and copper and molybdenum tonnes are estimates of metal contained in tonnages and do not include allowances for processing losses. 5. Rounding as required by reporting guidelines may result in apparent differences between tonnes, grade and contained metal content. Tonnes are rounded to the nearest 100,000 tonnes. Ounces are rounded to the nearest 100,000 ounces. In instances where tonnage and grade are presented but metal is shown as “0”, this is due to the metal contained falling below the metal rounding limit. 1.12.3 Factors That May Affect the Mineral Reserve Estimate Areas of uncertainty that may materially impact the mineral reserve estimates include: changes to long-term metal price and exchange rate assumptions; changes to metallurgical recovery assumptions; changes to the input assumptions used to derive the cave outlines and the mine plan that is based on those cave designs; changes to operating and capital cost assumptions used, including changes to input cost assumptions such as consumables, labor costs, royalty and taxation rates; variations in geotechnical, mining, dilution and processing recovery assumptions, including changes to designs as a result of changes to geotechnical, hydrogeological, and engineering data used; changes to the shut-off criteria used to constrain the estimates; ability to source power supplies if the current assumptions cannot be met; ability to obtain sufficient water to meet operational needs; changes to the assumed permitting and regulatory environment under Cadia Valley Operations New South Wales, Australia Technical Report Summary Date: February 2026 Page 1-15 which the mine plan was developed; ability to permit additional TSF capacities or facilities; ability to maintain mining permits and/or surface rights; ability to obtain operations certificates in support of mine plans; ability to obtain and maintain social and environmental license to operate. There is a risk to the mineral reserve estimates if Newmont is not able to demonstrate that the Cadia Valley Operations can remediate, maintain and operate the existing TSFs in line with the costs estimated in the LOM plan. A similar risk exists with the costs estimated for the TSF expansion included in the cash flow analysis. Newmont must also demonstrate that the operations can be mined within the existing environmental permit requirements. 1.13 Mining Methods 1.13.1 Cadia East The current Cadia East operations are planned as a series of three lifts (Lifts 1, 2, and 3). The relative elevation of these lifts and all underground infrastructure is expressed in mine height datum which is 5,000 m above AHD. Lifts 1 and 2 are approximately 1,200–1,400 m high with their bases located at approximately 4650 mRL and 4450 mRL, respectively. Lift 3 sits below Lift 2 with a block height of 275 m and a base at 4,175 mRL. Lift 1 refers to the following panel caves: PC1–1, PC1–2, PC1–3 and PC1–4. Lift 2 refers to the following panel caves: PC2, PC2–3, PC2– 4 and PC2–5. Lift 3 refers to the following panel cave: PC 3–1. Cadia East is accessed via two declines, the main access decline, and the conveyor decline. An overall geotechnical block model was created for the Cadia underground mining area. This model allows for a detailed understanding of the rock mass and its likely response to the cave mining process. Caveability tests and modelling undertaken as part of studies has shown that the orebody is amenable to caving. The planned preconditioning design for cave growth is one that implements a regular and tightly-spaced hydraulic fracturing geometry of between 1.5–2 m fracture spacing with a draw sequence that is initiated adjacent to the existing cave, to mitigate any potential pendant effect. Cave initiation will commence adjacent to existing caves for operations on the Lift 1 and Lift 2 levels. This cave initiation position was aligned to prevent the formation of a low-mobility cave-flow area (pendant). The Lift 3 level will be initiated under the existing Lift 2 caves, and the breakthrough to the lift above will be managed via a combination of fracturing, draw control, and personnel exclusion from high-risk zones. Future mining blocks at Cadia will adopt new technologies in cave monitoring, using magnetic cave beacons that can actively monitor the cave propagation and material flow and can be combined with expert systems and software packages that simulate the whole caving process. At the end of the Cadia East mine life, the surface subsidence area would be approximately 250 ha and would resemble a dish-shaped depression surrounded by steep slopes on the margin. A quantitative prediction of water inflow to the extraction level was completed with modelling predicting an increase of cave moisture with time and an increase of total discharge (both ore moisture and seepage). Most of inflow will occur from the base of the subsidence crater. Inflow via the non-ponded crater zone will be limited. The modelling predicted that peak discharge to the extraction level will mimic surface infiltration, with multi-day extreme storm events associated with the highest risks of increased inflow. Dewatering facilities are designed to accommodate groundwater and surface catchment area water inflows for a one-in-100-year rainfall event. There is no discharge of water from the mine dewatering activities to the environment, with water reused in processing facilities or recycled into the underground operations.


Cadia Valley Operations New South Wales, Australia Technical Report Summary Date: February 2026 Page 1-16 The mining method involves inducing caving of the rock mass by undercutting a block of ore. Mining proceeds by progressively advancing an “undercut” level beneath the block of ore. Above the undercut level, the overlying host rocks are pre-conditioned using blasting and/or hydraulic fracturing, resulting in controlled fracturing of the ore block. Following pre-conditioning of the overlying host rocks, broken ore is removed through an extraction level developed below the undercut level. The extraction level is connected to the undercut level by drawbells, through which the ore gravitates to drawpoints on the extraction level. The ore is removed by a load–haul–dump (LHD) fleet to underground crushing stations. At each crushing station, ore is tipped into a coarse ore bin, which then feeds the crusher itself which passes material to a surge bin used to regulate the feed from the crushing station onto the collection conveyors. The collection conveyors are in turn used to regulate feed onto the main trunk belt system and to allow for the automated removal of tramp metals. The main trunk belt is used to transport ore to the surface at a rate of approximately 4,600 t/h (with work underway to upgrade this to 5,150 t/h). The incline conveyor commences at 4,400 mRL (i.e. the base of Lift 2), extends approximately 7,500 m to the surface and is deposited onto the concentrator coarse ore stockpile where it is gravity fed into the ore processing system. Waste rock is removed from the underground workings via the decline and is hauled to the South Waste Rock Facility. Fresh air enters the underground workings via the main and conveyor declines and six ventilation intake shafts (VR4, VR6, VR10, VR122, VR16, VR18). A total flow intake of approximately 2,500 m3/s of installed capacity to maintain underground air quality. Air is expelled from the workings via six vertical shafts and exhaust fan installations (VR3, VR5, VR7, VR8, VR121, VR11). Blasting consists of development blasting and production blasting to precondition the ore. Emulsion explosives are typically used for blasting purposes. Ammonium nitrate fuel oil (ANFO) may be used on occasions if emulsion charging is not available. Hydraulic fracturing is used to augment the caving process. Groundwater that accumulates in the underground mine workings is collected, and then pumped to the surface at a maximum rate of about 160 L/s. Underground facilities include workshops, wash bays, fuel bays, offices, and crib rooms. Underground workshops are used to maintain the development and production fleet. The Cadia East mine is supplied by a dedicated 132 kV transmission line feed which in turn feeds into the site switchyard. Three 33 kV feeders run from the surface substation to provide a ring main to the underground workings. Equipment requirements include primary development, cave development, and production equipment. A secondary production fleet will support this equipment. These equipment types are conventional to panel cave mining operations. The mining personnel total requirement for LOM operations is approximately 505 for underground production and 424 for mining projects. Cadia Valley Operations New South Wales, Australia Technical Report Summary Date: February 2026 Page 1-17 1.13.2 Ridgeway The upper portion of the deposit down to 5040 mRL (approximately 800 m below surface) has been mined using SLC methods, resulting in a column of caved material that extends to the surface to form a subsidence zone. An underground crusher was installed at the base of the SLC area and crushed ore was conveyed out of the mine via an inclined conveyor system. SLC mining is now complete. As a result of extensive reviews and study it was proposed that a 5.6 Mt/a block cave mine be established 250 m downdip of the base of the SLC at the 4786 mRL. Subsequent to establishment and ramp-up, the mine was debottlenecked to the point of achieving a total of 9.6 Mt/a. Mineral reserves still remain in Lift 1. There are four primary domains of generally good RMR rates within Ridgeway Deeps. The drawpoints are designed to manage cave draw and the extraction is scheduled to manage load transfer within the cave footprint. The primary ground support consists of fiber-reinforced shotcrete, mesh, and rock bolts. Secondary support consists of Osro straps and cables. Subsidence zone monitoring has been modelled using FLAC3D for surface and underground subsidence. Existing monitoring of the subsidence undertaken through a mixture of techniques, including LiDAR survey, InSAR and visual inspections. A simple model that assumes a direct hydraulic connection between rain falling in the catchment formed by the crater and being directly transmitted to the workings is used for pump designs. Pumping capacity was found to be adequate to deal with inflows generated by a one-in-100-year rainfall event. The Ridgeway deposit is accessed via two declines. Ridgeway Deeps L1 uses an offset herringbone design for drawpoint layouts. Extraction crosscuts are spaced at 30 m intervals and drawbells at 18 m apart. Ridgeway has an established ventilation system that uses the VR1, VR2, VR3 and VR7 raises to provide fresh air. Return air reports to the VR4 and VR6 systems. There are no proposed changes to the current ventilation plan at Ridgeway. Ore will initially be transported to surface using of 60 t trucks while evaluation of reinstating the crushing and materials handling system is undertaken. There are jaw crushers with tipping points installed on the 4786 mRL with rock breakers installed to precondition oversize. The currently installed maintenance workshop, refueling station, crib room and offices will be used to support current underground operations. Equipment requirements include loaders, grader, service truck, rock breaker, and integrated tool carrier. The mining personnel total requirement for LOM operations is approximately 180 for Ridgeway Deeps Lift 1. 1.14 Recovery Methods The copper-gold plants were first commissioned in 1998 and 2002 respectively for Concentrator 1 and Concentrator 2. Both concentrators have undergone a number of alterations and expansions. Metallurgical testwork, in conjunction with operational results, were used to refine plant operations. Metallurgical testing programs have been conducted since the 1990s to test the amenability of the mineralization to conventional separation processes for gold, copper, and Cadia Valley Operations New South Wales, Australia Technical Report Summary Date: February 2026 Page 1-18 molybdenum. Based on these tests, two concentrators were constructed using conventional flotation and gravity separation methods and have subsequently treated the Cadia Hill, Ridgeway, and Cadia East mineralization. Testing programs included extensive comminution testing with results informing past and future throughput upgrades and debottlenecking of the two concentrator plants. Coarse particle flotation has been applied to the scavenger tails of Concentrator 1 Train 3 since 2018. A coarse particle flotation circuit with dedicated regrind and cleaning was installed on Train 1 and Train 2 in 2022. The molybdenum plant was designed to produce molybdenum concentrate as a by-product from the concentrator operations. Concentrator 1 consists of: a gyratory crusher crushing excess ore stockpiled on the surface; a screening plant; two cone crushers for secondary crushing of screen oversize; a HPGR for further size reduction ahead of SAG milling; a single 20 MW SAG mill in open circuit configuration with oversize pebbles returning to the screening plant; three ball mills in closed circuit with hydrocyclones; flash flotation and gravity concentrator processing of hydrocyclone underflow, gravity concentrator processing of flash flotation concentrate; and rougher and scavenger flotation of the slurry from three ball mill circuits (i.e. flotation trains 1, 2, and 3) with concentrate reporting to regrind mills; a coarse ore flotation circuit using HydroFloat technology on train 3 rougher tailings; cleaner flotation circuits using both conventional and Jameson cell technology; and thickening of rougher tailings before pumping to the tailings storage facilities. Concentrator 2 was commissioned in 2002 and had a target rate of 4 Mt/a. The circuit consisted of primary crushing, SAG and ball milling, gravity concentration to produce gold doré and flotation to produce copper–gold concentrate. In mid-2008, the facilities were upgraded to suit predictions of harder and fines-deficient ore from Ridgeway Deeps block cave mine. The upgrade included installation of a secondary crushing circuit and additional regrind mill power. A 2.24 MW Vertimill was installed in 2011 in a tertiary milling duty to reduce flotation feed size and improve metal recoveries. In 2022, Concentrator 2 was upgraded to increase throughput and maintain recovery of Cadia East ore. This included the addition of a second tertiary duty 3.2 MW Vertimill, upgraded secondary and tertiary crushers from MP800 to MP1000, upgraded primary cyclones and pumps, and a rougher Jameson cell. Capacity will increase to over 8 Mt/a nominal capacity over a three- year ramp up period. Concentrator 2 consists of: an overland conveyor system transporting ore from the main coarse ore stockpile (COS) to the processing plant; secondary and tertiary crushing using conventional cone crushers; a SAG mill in closed circuit with two pebble crushers; a ball mill and Vertimill (0.93 MW) in closed circuit with hydrocyclones for secondary grinding; another Vertimill (2.2 MW) for tertiary grinding; flash flotation and gravity concentrators processing hydrocyclone underflow; additional gravity concentrator treating flash flotation concentrate; and rougher and scavenger flotation (conventional cells) processing grinding circuit product; regrind mill; cleaner flotation stages using both conventional and Jameson flotation cells; thickening of rougher tailings before pumping to tailings storage facility; and thickening of final gold/copper concentrate product. The combined, thickened copper concentrate slurry, with a grade of 23–26% copper, is pumped to Blayney where it is filtered and railed to Port Kembla before export. Approximately 15% of the gold in feed ore is recovered from the gravity concentrator product via shaking tables and then smelted on site to produce gold doré for sale. The molybdenum plant produces molybdenum by processing the copper concentrate stream to produce two saleable products, a gold-rich copper concentrate and a molybdenum-rich concentrate. The flotation circuit consists of conditioning, a rougher flotation, cleaner–scavenger, and regrind circuits. Each stage of the flotation process increases the molybdenum grade and Cadia Valley Operations New South Wales, Australia Technical Report Summary Date: February 2026 Page 1-19 returns copper ores to the discharge streams. The final molybdenum concentrate is thickened, filtered, and dried before being packed into bulk bags for transport. The rougher tails are sent to rejoin the Blayney copper concentrate slurry pipeline. Power is sourced from the State grid. Concentrator 1 uses approximately 60% of the site total power consumption, with Concentrator 2 using an additional 15%. The process plants use a combination of on-site recycled water (e.g. thickener overflow and TSF return water) and make- up water. Sources have included Cadiangullong Dam, Rodds Creek Water Holding Dam, Belubula River, Flyers Creek Weir, Cadia Creek Weir, on-site groundwater extraction bores, and site run-off. Key processing reagents include collectors, frother, lime, and flocculant with other key materials being mill grinding media. The processing facilities directly employ 250 persons. 1.15 Infrastructure Existing project infrastructure includes the following: operating panel cave mining operations at Cadia East; block cave operations at Ridgeway (on care and maintenance); Ridgeway and Cadia declines and conveyor incline boxcuts and portals, hardstand areas, contractor area, mine workshops, general stores building, fuel storage facility, and administration and ablution facilities; underground crushing, handling and incline conveyor systems to transfer ore and waste rock mined from Cadia East and Ridgeway to the Cadia Valley Operations processing facilities; ventilation shafts; Concentrator 1 and Concentrator 2, molybdenum plant (under construction); TSFs and associated tailings pipelines, pumps and tailings water return infrastructure; concentrate dewatering facilities; concentrate loading and handling facilities; water management structures; water pipelines and pumping stations; electrical substations and associated electrical infrastructure; support facilities such as truck and vehicle shops, warehouse, offices, clinic and emergency response facilities, and environmental monitoring facilities. The railway facilities are leased. The ongoing Cadia expansion project includes the following still to be executed: • Underground mine cave establishment for PC2–3, PC1–2, PC1–3, PC1–4, PC2–4, PC2–5, and PC3–1 in Cadia East with associated support infrastructure; • Ridgeway Deeps Lift 1 at Ridgeway with associated support infrastructure. An expansion to the tailings storage infrastructure is also required. As the Project is drive-in-drive-out of Orange and other nearby communities, there are no accommodation requirements. The operations are supplied by dual 132 kV feeders from Orange, known as the 9MC and 94G circuits, each consisting of a 5.2 km underground section of cable from the Orange North 132 kV switching station to the outskirts of Orange. The 94G circuit continues via a 22.2 km long overhead line directly to the Cadia 132 kV substation. The 9MC circuit continued via an overhead line to the Flyers Creek 132 kV switching station where it then splits into the 9MT circuit, which supplies Flyers Creek Wind Farm, and the 9MR circuit that supplies the Cadia 132 kV substation. The combined 9MR/94G service load is limited to the connection agreement maximum site load of 220 MVA.


Cadia Valley Operations New South Wales, Australia Technical Report Summary Date: February 2026 Page 1-20 1.16 Markets and Contracts The Cadia Valley Operations produce two types of concentrates: • A high-quality clean copper concentrate with typical copper grades, elevated gold grades, payable silver, and relatively low levels of impurities; • A high-quality molybdenum concentrate. The quality of both concentrates and the continuing strong global demand for concentrates, means that these concentrates are readily marketable, and highly sought after by smelters and traders. Newmont also produces doré that is delivered to a gold refinery in Australia to produce refined gold and silver. Once refined, gold and silver is sold on the open market. Newmont uses a combination of historical and current contract pricing, contract negotiations, knowledge of its key markets from a long operations production record, short-term versus long- term price forecasts prepared by Newmont’s internal corporate marketing group, public documents, and analyst forecasts when considering long-term commodity price forecasts. Higher metal prices are used for the mineral resource estimates to ensure the mineral reserves are a sub-set of, and not constrained by, the mineral resources, in accordance with industry-accepted practice. The long-term commodity price and exchange rate forecasts shown in Table 1-4. Table 1-4: Commodity Price and Exchange Rate Forecasts Commodity Units Mineral Reserves Mineral Resources Gold US$/oz 2,000 2,300 Silver US4/oz 25.00 28.00 Copper US$/lb 3.75 4.25 Molybdenum US$/lb 13.00 16.00 Exchange rate US$:AU$ 0.70:1 0.70:1 There are contracts currently in place to support sales of all products produced by the Cadia Valley Operations; including long-term, smelter direct copper concentrates sales and purchase agreements, molybdenum concentrate sales and purchase agreements, and doré refining agreements. There are contracts in place providing ship-loading services, rail services, and loading/port agency services. Other major contracts for the Cadia Valley Operations cover categories such as electricity supply, bulk commodities, operational and technical services, mining and process equipment, earthworks projects, security, transportation and logistics, and administrative support services. Contracts are typically reviewed and negotiated on an as-needs basis. Based on Newmont’s knowledge, the contract terms are typical of similar contracts both regionally and nationally. Contracts required to support the Cadia East and Ridgeway operations are expected to be in line with existing contract terms and norms. Cadia Valley Operations New South Wales, Australia Technical Report Summary Date: February 2026 Page 1-21 1.17 Environmental, Permitting and Social Considerations Newmont presently holds a Project Approval for the Cadia East Project (06_0295) under the Environmental Planning and Assessment Act 1979 (EP&A Act; as modified) that provides for mining operations until June 30, 2031. Newmont holds an approval under the Environment Protection and Biodiversity Conservation Act 1999 (EPBC Act) that is current until June 30, 2031. Detailed baseline studies were completed at each major development stage of the Cadia Valley Operations. It is expected that a number of social, cultural heritage and environmental baseline studies will require updating to support the submission of the proposed Cadia expansion project permitting application. 1.17.1 Environmental Studies and Monitoring Environmental monitoring across the Project includes the following key areas: noise monitoring; air quality monitoring; blast and vibration monitoring; groundwater level and quality monitoring; spring monitoring; surface water flows and quality; aquatic ecosystem monitoring; rehabilitation monitoring; and pollution discharge monitoring. The Mining Leases require a Mining Operations Plan to be prepared that outlines significant disturbance, rehabilitation plans, and mine closure strategies. Development not otherwise covered by existing approvals and Mining Operation Plans will require new authorizations. 1.17.2 Waste Rock The current waste rock materials and low-grade ore categories are classified using color nomenclature that reflects the management approach to that material (yellow, green, blue, and pink). Low-grade ore and mineralized waste (yellow and green materials) are placed in accessible parts of the South Waste Rock Facility for reclamation. Blue waste rock can be used as construction material (e.g. for raising of the TSFs). Pink waste material is encapsulated with a combination of a low permeability layer and a cover of blue waste rock over each layer of pink waste material. The cover system is designed to reduce oxygenation and infiltration rates. 1.17.3 Tailings Storage Facilities There are three tailings storage facilities: the Northern TSF (NTSF), the Southern TSF (STSF), and the mined-out Cadia Hill open pit (Cadia Pit TSF), each of which are located within the Cadia mining lease. Newcrest was granted approval on April 20, 2018 to use the former Cadia Hill open pit as a TSF. Tailings were shown to be non-acid-forming (NAF). The NTSF design consists of an earth and rock-fill dam, with nine embankment raises undertaken. All raises since 2008 have involved upstream construction. The STSF is also an earth and rock- fill dam, with, to date, six embankment raises undertaken, the last three of which used the upstream method. On March 9, 2018, a slump (the Event) occurred in the southern wall of the NTSF, causing it to lose containment of tailings. The tailings were captured within the basin of the STSF. A prohibition notice issued by the NSW resources regulator on depositing tailings in the NTSF remains in place as at December 31, 2025. Cadia Valley Operations New South Wales, Australia Technical Report Summary Date: February 2026 Page 1-22 An Independent Technical Review Board (ITRB) investigation of the Event was completed in April, 2019 and has been publicly released. The Independent Technical Review Board ultimately attributed the failure to slow movement in a previously unidentified weak foundation layer, which lead to the liquefaction of tailings and sudden failure of the slope. In response to the Independent Technical Review Board recommendations, Newcrest expanded geotechnical investigations of the TSF foundations and identified areas where additional embankment buttressing was required. Newmont have also significantly increased surface and subsurface monitoring of the TSFs since the Event. Newmont continues to investigate the remediation of the NTSF slump zone, and is undertaking buttressing of the embankment, as approved. Since April 2018, tailings deposition has primarily been in the Cadia Pit TSF with some deposition in the STSF also occurring, with no deposition in the NTSF. Newcrest engaged expert engineering firms to develop buttress designs and to remediate existing TSF embankments to acceptable safety levels. Where there was a lack of data, conservative assumptions on foundation strengths were assumed. Initial buttressing of the NTSF western wall was completed in 2023, with buttressing work on-going as at December 31, 2025. Buttress construction along the STSF has been completed in 2025 to support ongoing operations. Future tailings storage beyond the Cadia Pit TSF and STSF storage capacities will be required later in the mine plan to support the LOM production plan envisaged in this Report. Planning and community engagement is currently ongoing to extend the STSF in height and footprint (referred to as the Southern Tailings Storage Facility Extended) and different technologies are being considered as part of the regulatory approvals process. The capital and operating cost estimates include provision for future tailings storage. These costs were included in the economic analysis that supports the mineral reserves. 1.17.4 Water Supply and Water Management Water supply is characterized by variable supply sources. Water requirements are proportional to the amount of mineral processing and significant water storage is required to provide consistent supply. The amount of water taken from each source is dependent on the conditions set through agreement or licensing and the physical amount available. The water supply scheme comprises recycling of water used on-site and make-up water required to compensate for losses in the system. Newmont also manages water that accumulates in the Cadia Pit TSF (from tailings supernatant water and rainfall runoff) by recovering (pumping) this water to the water management system for re-use in ore processing. Droughts have, in the past, resulted in a prolonged period of very low water supply. Drought conditions are a risk to future operations if unduly prolonged. The LOM plan assumes that 65– 70% of all water will be recycled. Newmont continues to pursue further water saving initiatives, both in the plant and by way of optimization of onsite bores. Water management structures and facilities include: tailings storage facilities return water system including the Central Pumping Station; process water pond; Cadia Pit TSF, NTSF, and STSF; sediment dams and ponds containing site runoff; WRSF leachate ponds; Cadiangullong Dam; Cadia Creek Weir; Belubula River pumping system; and the Rodds Creek Water Holding Dam. Cadia Valley Operations New South Wales, Australia Technical Report Summary Date: February 2026 Page 1-23 1.17.5 Closure and Reclamation Considerations The Cadia Mine Closure Plan includes a detailed cost estimate, which is used in determining the closure liability. Additionally, the Mining Operations Plan is a requirement of the mining leases and contains Newmont’s rehabilitation commitments for the period of the plan (usually three years). Considerable rehabilitation of WRSFs has already been completed, with success evidenced by the absence of significant erosion and by well-established vegetation. Newmont’s closure planning includes provision for retention of infrastructure of potential use to other parties, and extensive monitoring, especially of water quality and landform stability. The closure provision in the financial analysis supporting the mineral reserves is estimated at US$0.5 B. 1.17.6 Permitting Newmont holds the key permits required to support the current operations. The Cadia expansion will trigger a need to evaluate the proposal under various NSW Government environment and mining legislation and key Commonwealth legislation. Changes to the project will require a new application and reviews conducted under a number of these legislative acts. 1.17.7 Social Considerations, Plans, Negotiations and Agreements Community Relations are managed in accordance with the Communities Policy and Social Performance Standard. Community relations are undertaken by the Health, Safety, Environment and Social Responsibility Department in line with the Community Relations Strategy. The objective of the Cadia Community Relations Strategy is to provide a strategic and systematic organizational approach to interactions with local communities and stakeholders which facilitate the open exchange of information so that Newmont can respond to emerging needs at any point of its operations in the Cadia area. Regular forums are held with local government authorities and residents and contributes to a Community Partnerships Program (CPP) in which employee volunteers are involved in assessing applications for funding of community projects based on established criteria. In accordance with the requirements of the site’s Project Approval, the Cadia Valley Operations have a Community Consultative Committee, which provides a regular forum for discussion of community issues related to operational activities, and for accurate dissemination of material about those activities. 1.18 Capital Cost Estimates Capital cost estimates are at a minimum at a pre-feasibility level of confidence, having an accuracy level of ±25% and a contingency range not exceeding 15%. The Cadia East estimate was broken down into: • Direct costs: Permanent plant equipment supply; bulk materials supply; direct labor; contractors’ distributable costs; construction equipment for mass earthworks; freight, construction indirect costs;


Cadia Valley Operations New South Wales, Australia Technical Report Summary Date: February 2026 Page 1-24 • Indirect costs: Engineering, procurement and contract management (EPCM) costs including field construction management services, project office and home office costs for engineering, procurement, project services, and sub-consultant EPCM costs; Owner’s team costs; and contingency. The Ridgeway cost estimate was based on the following parameters: • Mining: detailed estimate; • Underground material handling and infrastructure: factored estimate for direct costs, indirect costs factored. The overall capital cost estimate for the combined Cadia Operations as envisaged in the financial analysis is outlined in Table 1-5, and totals US$9.7 B. Table 1-5: Capital Cost Estimate Summary Cost Area Units Value Mining US$ billion 4.1 Processing US$ billion 4.9 Site general and administrative US$ billion 0.6 Total Capital US$ billion 9.7 Note: numbers may not sum due to rounding. 1.19 Operating Cost Estimates Operating cost estimates are at a minimum at a pre-feasibility level of confidence, having an accuracy level of ±25% and a contingency range not exceeding 15%. Operating costs were based on actual costs seen during operations and were projected through the LOM plan. These costs were applied to an activity-based cost model and factored according to estimated fixed/variable components for existing assets. Operating costs for new infrastructure were based on a zero-based forecast cost base. Labor and energy costs were based on budgeted rates applied to headcounts and energy consumption estimates. Site operating costs for the Cadia Operations LOM total US$22.0 B. The operating cost estimate is summarized in Table 1-6 and Table 1-7. Table 1-6: Operating Cost Estimate Summary Cost Area Units Value Mining US$ billion 7.1 Processing US$ billion 10.8 General and administrative US$ billion 4.1 Total Operating Costs US$ billion 22.0 Note: numbers may not sum due to rounding Cadia Valley Operations New South Wales, Australia Technical Report Summary Date: February 2026 Page 1-25 Table 1-7: Operating Unit Cost Estimate Area Unit Value Mining US$/t mined 7.06 Process US$/t milled 10.72 G&A US$/t milled 4.11 1.20 Economic Analysis 1.20.1 Economic Analysis The financial model that supports the mineral reserve declaration is a standalone model that calculates annual cash flows based on scheduled ore production, assumed processing recoveries, metal sale prices and US$:AU$ exchange rate, projected operating and capital costs and estimated taxes. The financial analysis is based on an after-tax discount rate of 5%. All costs and prices are in unescalated “real” dollars. The currency used to document the cash flow is US$. All costs are based on the 2026 business plan. Revenue is calculated from the recoverable metals and long-term metal price and exchange rate forecasts. Taxation considerations include: Federal tax rate of 30%; State government royalty of 4%; payroll tax; annual land taxes; and local government area rates and levies. The economic analysis is based on 100% equity financing and is reported on a 100% project ownership basis. The economic analysis assumes constant prices with no inflationary adjustments. The NPV5% is US$2.6 B. As the cash flows are based on existing operations where all costs are considered sunk to January 1, 2026, considerations of payback and internal rate of return are not relevant. Free cash flow is US$ 5.3 B. A summary of the financial results is provided in Table 1-8. Cadia Valley Operations New South Wales, Australia Technical Report Summary Date: February 2026 Page 1-26 Table 1-8: Cash Flow Summary Table Item Unit Value Gold price US$/oz 2,000 Copper price US$/lb 3.75 Silver price US$/oz 25.00 Molybdenum price US$/lb 13.00 Material mined Mt 1,007.6 Ore processed Mt 1,007.6 Contained gold, processed Moz 13.5 Contained copper, processed kt 2,924 Contained silver, processed Moz 21.8 Contained molybdenum, processed kt 84 Processed ore gold grade g/t 0.42 Processed ore copper grade % 0.29 Processed ore silver grade g/t 0.67 Processed ore molybdenum grade % 0.01 Recovered gold Moz 10.7 Recovered copper kt 2,447 Recovered silver Moz 13.2 Recovered molybdenum kt 51 Recovery, gold % 79 Recovery, copper % 84 Recovery, silver % 60 Recovery, molybdenum % 62 Net revenue US$ billion 39.1 Costs applicable to sales US$ billion (22.8) EBITDA US$ billion 16.2 Operating cash flow (after estimated taxes and other adjustments) US$ billion 15.0 Total capital US$ billion (9.7) Free Cash Flow (FCF) US$ billion 5.3 Net Present Value US$ billion 2.6 Note: Table 1-8 contains “forward-looking statements” within the meaning of Section 27A of the Securities Act of 1933, as amended, and Section 21E of the Securities Exchange Act of 1934, as amended, which are intended to be covered by the safe harbor created by such sections and other applicable laws. Please refer to the note regarding forward-looking information at the front of the Report. The cash flow is only intended to demonstrate the financial viability of the Project. Investors are cautioned that the above is based upon certain assumptions which may differ from Newmont’s long-term outlook or actual financial results, including, but not limited to commodity prices, escalation assumptions, and other technical inputs. For example, Table 1-8 uses the price assumptions stated in the table, including a gold commodity price assumption of US$2,000/oz, a copper commodity price assumption of US$3.75/lb, a silver commodity price assumption of US$25/oz, and a molybdenum price assumption of US$13.00/lb, which vary significantly from current Cadia Valley Operations New South Wales, Australia Technical Report Summary Date: February 2026 Page 1-27 gold, copper, silver, and molybdenum prices and the assumptions that Newmont uses for its long-term guidance. Please be reminded that significant variation of metal prices, costs and other key assumptions may require modifications to mine plans, models, and prospects. Numbers have been rounded; totals may not sum due to rounding. EBITDA = earnings before interest, taxes, depreciation, and amortization. The cash flow in this Report has been adjusted to align with the generally-accepted accounting principles (GAAP) required for US-listed companies. In the cash flow analysis 2026 is evaluated at a gold price of US$2,000/oz; with the copper price at US$3.75/lb. Material mined total includes 4.3 Mt of initial stockpiles. 1.20.2 Sensitivity Analysis The sensitivity of the Project to changes in grades, sustaining capital costs and operating cost assumptions was tested using a range of 25% above and below the base case values. The resulting sensitivities are shown in Figure 1-1. Figure 1-1: Sensitivity Analysis Note: figure prepared by Newmont, 2025. FCF = free cash flow, NPV = net present value at 5% discount rate, OPEX = operating expenditure, CAPEX = capital expenditure. The changes in metal prices are representative of changes in grade. The Project is most sensitive, in order, to metal prices and grade, less sensitive to operating costs, and least sensitive to capital costs.


Cadia Valley Operations New South Wales, Australia Technical Report Summary Date: February 2026 Page 1-28 1.21 Risks and Opportunities 1.21.1 Risks Risks that may affect the mineral resource and mineral reserve estimates are identified in Chapter 1.11.3 and Chapter 1.12.3 respectively. Risks associated with the block cave mining method include a cave not propagating as anticipated, excessive air gaps forming during the cave propagation, unplanned ground movement occurring due to changes in stresses released in the surrounding rock and larger or more frequent mining-induced seismicity than anticipated. Additionally, during cave establishment and propagation, higher levels of seismic activity, and higher likelihood of damage to excavations from seismic events, are expected. This has been observed during the cave establishment phase of Cadia’s PC2–3 project and is expected during the establishment of Cadia’s PC1–2 project in the coming years. Such seismic events and associated damage may require changes to the mining plan and upgrades to ground support systems, which could take several months. Large seismic events may also occur after cave establishment and propagation and during steady state caving, although the likelihood of this is lower. Excessive water ingress, disturbance, and the presence of fine materials may also give rise to unplanned releases of material of varying properties and of water through drawbells. The Cadia Valley Operations recorded sudden unplanned releases of both dry fine ore material and wet mud material through drawbells in 2023. Failure to maintain compliance with applicable law or the Cadia Valley Operations’ Environmental Protection License may result in the Environment Protection Authority suspending or revoking the Environmental Protection License, seeking court orders, or issuing additional prevention notices to specify actions that must, or must not, be taken, or prohibition notices directing Cadia to cease an activity. Ongoing enforcement, and challenges in maintaining compliance, may impact the Cadia Valley Operations’ ability to secure a future expansion of its project approval to extend the LOM beyond 2031. The Cadia Valley Operations have previously been, and may in the future be, subject to prosecutions and penalties for noncompliance with air quality requirements or the terms of its Environmental Protection License, including in respect of emissions from any vent rise or emissions from the NTSF and the STSF. Operational changes required to achieve or maintain compliance, including reductions in mining rates and other limitations on mining or processing operations, or additional requirements to install costly pollution control equipment, may adversely impact the assumptions used in the mine plan and economic analysis that supports mineral reserves. An ongoing Project risk is the operations’ ability to manage the TSF instability. The LOM plan assumes that the STSF can resume operations. If this cannot be managed, there is a risk that once the Cadia Pit TSF is filled mining and processing operations will cease pending other solutions. This will affect both the Project LOM plan and forecast economic outcomes. There is a risk that the Southern Tailings Storage Facility Extended cannot be permitted as envisaged in this Report. In this instance, mining and processing operations will be delayed or could even cease. This will affect both the Project LOM plan and forecast economic outcomes. There is a heightened level of community concern relating to the perceived impact of mining activities on the health of the community, and the condition of residential properties, located in Cadia Valley Operations New South Wales, Australia Technical Report Summary Date: February 2026 Page 1-29 proximity to the Project. These developments, including community complaints associated with Newmont’s Cadia Valley Operations activities, could give rise to reputational harm, operational disruptions, increased regulatory scrutiny of mining activities or delays to Project development. 1.21.2 Opportunities There is Project upside opportunity if the mineral resources exclusive of mineral reserves can be upgraded to mineral reserves with additional testwork and study. 1.22 Conclusions Under the assumptions presented in this Report, the Cadia Valley Operations have a positive cash flow, and mineral reserve estimates can be supported. 1.23 Recommendations As Cadia is an operating mine, the QP has no material recommendations to make. Cadia Valley Operations New South Wales, Australia Technical Report Summary Date: February 2026 Page 2-1 2.0 INTRODUCTION 2.1 Introduction This technical report summary (the Report) was prepared for Newmont Corporation (Newmont) on the Cadia Valley Operations (Cadia Valley Operations or the Project), in New South Wales (NSW), Australia. The location of the Cadia Valley Operations is shown in Figure 2-1. The Cadia Valley Operations are 100% owned by Newmont. The operations consist of the operating Cadia East gold mine (Cadia East), the mined-out Cadia Hill gold mine (Cadia Hill), and the Ridgeway gold mine (Ridgeway) that is on care-and-maintenance. 2.2 Terms of Reference 2.2.1 Report Purpose The Report was prepared to be attached as an exhibit to support mineral property disclosure, including mineral resource and mineral reserve estimates, for the Cadia Valley Operations in Newmont’s Form 10-K for the year ending December 31, 2025. 2.2.2 Terms of Reference Mineral resources are estimated for the Cadia East and Ridgeway deposits and the Cadia Hill stockpile. Mineral reserves are estimated for Cadia East and Ridgeway, and in stockpiles. The major deposits within the Project area are shown in Figure 2-2. Mineral resources and mineral reserves are reported using the definitions in Regulation S–K 1300 (SK1300), under Item 1300. All measurement units used in this Report are metric unless otherwise noted, and currency is expressed in United States dollars (US$) as identified in the text. The Australian currency is the Australian dollar (AU$). Unless otherwise indicated, all financial values are reported in US$ including all operating costs, capital costs, cash flows, taxes, revenues, expenses, and overhead distributions. The mine plan uses the terms block cave (Ridgeway) and panel cave (Cadia East). A block cave operation produces from the full orebody footprint from the outset of the operation. In panel caving the active caving zone moves across the full footprint with time. Development of a new panel in a panel caving operation is analogous to a pit cutback in an open pit mining operation. The Report uses US English. Cadia Valley Operations New South Wales, Australia Technical Report Summary Date: February 2026 Page 2-2 Figure 2-1: Project Location Plan Note: Figure prepared by Newcrest, 2020.


Cadia Valley Operations New South Wales, Australia Technical Report Summary Date: February 2026 Page 2-3 Figure 2-2: Deposit Locations Note: Figure prepared by Newmont, 2024. Cadia Valley Operations New South Wales, Australia Technical Report Summary Date: February 2026 Page 2-4 2.3 Qualified Persons This Report was prepared by the following Newmont Qualified Person (QP): • Mr. Shaun Chanter, RM SME, Head Reserve Governance - Global, Newmont. Mr. Chanter is responsible for all Report chapters. 2.4 Site Visits and Scope of Personal Inspection Mr. Chanter visited the Cadia Valley Operations on September 10, 2025. During that visit he inspected the underground operations, toured the mill facility, and viewed the tailings storage facilities. Mr. Chanter had meetings with onsite staff and management discussing aspects of mine plans and costs. 2.5 Report Date Information in this Report is current as at December 31, 2025. 2.6 Information Sources and References The reports and documents listed in Chapter 24 and Chapter 25 of this Report were used to support Report preparation. . 2.7 Previous Technical Report Summaries Newmont previously filed a technical report summary on the Project: • Doe, D., 2024: Cadia Valley Operations, New South Wales, Australia, Technical Report Summary, current at December 31, 2023. Cadia Valley Operations New South Wales, Australia Technical Report Summary Date: February 2026 Page 3-1 3.0 PROPERTY DESCRIPTION 3.1 Introduction The Cadia Valley Operations are located approximately 25 km south–southwest of the town of Orange in NSW, and about 190 km west–northwest of Sydney, at approximately 33o28’25” S latitude, 149o00’00” E longitude. The deposit locations are summarized in Table 3-1. Table 3-1: Deposit Locations Deposit Latitude (South) Longitude (East) Cadia East -33.464307 149.014074 Ridgeway -33.435933 148.977096 3.2 Property and Title in New South Wales 3.2.1 Mineral Title All exploration and mining activity in NSW must be conducted under an exploration, assessment, or mining title. Licenses are granted for one or more ‘groups’ of minerals. The types of licenses are summarized in Table 3-2. Table 3-2: Mineral Titles Title Type Note Exploration License Gives the holder the exclusive right to explore for specified mineral group(s) within the Exploration License area, during the term of the license. The granting of an Exploration License does not give any right to mine, nor does it guarantee a Mining Lease will be granted with the Exploration License area. Although Exploration Licenses may be granted for periods of up to six years, they are usually granted for a period of five years. They can be renewed for a further term (up to six years but usually five years), with the opportunity for subsequent renewals. Exploration Licenses are generally required to be reduced by 50% on each renewal. Applications for Exploration Licenses must include a program of activities that the applicant proposes to undertake if the license is granted. Assessment Lease An Assessment Lease is designed to cater for situations between exploration and mining. The lease allows the holder to maintain an authority over a potential project area, without having to commit to further exploration. The holder can, however, continue exploration to further assess the viability of commercial mining. Cadia Valley Operations New South Wales, Australia Technical Report Summary Date: February 2026 Page 3-2 Title Type Note The application area must generally coincide with what would normally be appropriate for a Mining Lease. It must include the mining area outlined in the conceptual mine plan, together with areas for infrastructure and any appropriate buffer zone. Any portions of the original exploration title beyond the application should be relinquished unless the applicant can justify the retention of these areas. Assessment leases may be granted for up to six years and may be renewed for further periods of up to six years. Mining Lease A Mining Lease gives the holder the exclusive right to mine for specified minerals within the Mining Lease area during the term of the lease. In addition to allowing mining, a Mining Lease permits prospecting operations and Ancillary Mining Activities (AMA) to be conducted in association with mining operations. A Mining Lease for mining purposes only may also be applied for. A Mining Lease area may also include any associated infrastructure and must be consistent with the development consent area. Mining Leases may be granted for up to 21 years, and may be renewed for further period of 21 years (or longer with the approval of the Premier). Ancillary Mining Activities Titleholders seeking regulation for their AMAs have the option to either apply for a mining lease for Ancillary Mining Activities only, or an Ancillary Mining Activity (AMA) Condition to be imposed on an existing mining lease for minerals. NSW uses a graticular system for granting of Exploration Licenses. This system divides the State into a series of ‘blocks’ with dimensions of five minutes of latitude by five minutes of longitude. Each block comprises 25 ‘units’ with dimensions of one minute of latitude by one minute of longitude. Although the area of a unit varies slightly depending on the location within the State, each unit is approximately 3 km2. 3.2.2 Surface Rights Mineral rights are separate to surface rights. Land access agreements must be negotiated with surface rights holders for exploration activities. The duration of those agreements will vary depending on the terms agreed to by the various parties. 3.2.3 Government Mining Taxes, Levies or Royalties In New South Wales the royalty rate is 4% of the ex-mine value of the bullion and concentrate “recovered” (recovered being sold material and increases in stockpile material), less allowable deductions (treatment, depreciation, realization, and administration costs). Currently, gold, silver, copper and molybdenum are levied at 4% of the ex-mine value less allowable deductions. 3.3 Ownership The Cadia Valley Operations are 100% owned by Newmont through its wholly-owned subsidiary, Cadia Holdings Pty Ltd (CHPL).


Cadia Valley Operations New South Wales, Australia Technical Report Summary Date: February 2026 Page 3-3 3.4 Mineral Title The Cadia Valley Operations consist of 11 granted Mining Leases and 11 granted Exploration Licenses, with a total approximate area of 386 km2. Details of leases and licenses are provided in Table 3-3 and Figure 3-1. Mining Leases do not have statutory annual expenditure requirements. The current minimum statutory annual expenditure changes on an annual basis depending on approved work programs. As at December 31, 2025, minimum expenditures had been met on all leases. Table 3-3: Mineral Tenure Summary Table Lease Name Lease Type Lease Status Grant Date Expiry Date Legal Entity Area (km2) EPL1024 Exploration License Granted 21/05/1985 20/05/2028 Newmont NOL Pty Ltd 3.29 EL2033 Exploration License Granted 07/07/1983 06/07/2026 Cadia Holdings Pty Ltd 71.15 EL2378 Exploration License Granted 26/02/1985 05/02/2027 Cadia Holdings Pty Ltd 93.27 EL2984 Exploration License Granted 11/01/1988 10/01/2028 Cadia Holdings Pty Ltd 16.6 EL3767 Exploration License Granted 18/02/1991 17/02/2028 Cadia Holdings Pty Ltd 19.0 EL3856 Exploration License Granted 21/05/1991 20/05/2027 Newcrest Mining Limited 99.18 EL4616 Exploration License Granted 8/11/1993 7/11/2026 Newcrest Mining Limited 11.5 EL4620 Exploration License Granted 19/11/1993 18/11/2029 Newmont NOL Pty Ltd 10.9 Cadia Valley Operations New South Wales, Australia Technical Report Summary Date: February 2026 Page 3-4 Lease Name Lease Type Lease Status Grant Date Expiry Date Legal Entity Area (km2) EL5609 Exploration License Granted 23/08/1999 22/08/2029 Newmont NOL Pty Ltd 0.1 EL6589 Exploration License Granted 03/07/2006 02/07/2029 Newcrest Mining Limited 1.57 EL9751 Exploration License Granted 24/02/2025 23/02/2031 Newmont NOL Pty Ltd 0.012 ML1242 Mining Lease Granted 22/08/1991 21/08/2029 Climax Australia Pty Ltd 1.64 ML1243 Mining Lease Granted 22/08/1991 21/08/2029 Climax Australia Pty Ltd 2.58 ML1405 Mining Lease Granted 5/10/1996 4/10/2038 Cadia Holdings Pty Ltd 31.16 ML1449 Mining Lease Granted 1/6/1999 4/10/2038 Cadia Holdings Pty Ltd 0.99 ML1472 Mining Lease Granted 23/10/2000 22/10/2021 (renewal pending) Cadia Holdings Pty Ltd 12 ML1481 Mining Lease Granted 8/3/2001 7/3/2043 Cadia Holdings Pty Ltd 5.84 ML 1689 Mining Lease Granted 11/9/2013 11/9/2034 Cadia Holdings Pty Ltd 1.54 ML 1690 Mining Lease Granted 10/9/2013 10/9/2034 Cadia Holdings Pty Ltd 0.7 ML1189 Mining Lease Granted 14/05/1987 13/05/2029 Climax Australia Pty Ltd 2.47 Cadia Valley Operations New South Wales, Australia Technical Report Summary Date: February 2026 Page 3-5 Lease Name Lease Type Lease Status Grant Date Expiry Date Legal Entity Area (km2) MPL272 Mining Lease Granted 22/08/1991 21/08/2029 Climax Australia Pty Ltd 0.002 MPL273 Mining Lease Granted 22/08/1991 21/08/2029 Climax Australia Pty Ltd 0.37 385.86 Note: Dates in day, month, year format. Cadia Holdings Pty Ltd, Newmont NOL Pty Ltd, and Newcrest Mining Limited are Newmont subsidiaries. Climax Australia Pty Ltd. (Climax) is the registered holder of the mineral tenures within the Second Junction Reef Joint Venture. Newmont holds a 81.10% interest in the joint venture and Barrick Gold Corp holds the remaining 18.9% interest. Newcrest, prior to being purchased by Newmont, bought out Climax’s interest in the joint venture in August 2021. On completion of the sale agreement the exploration licenses were transferred to Cadia Holdings Pty Ltd. However, due to legacy environmental liabilities associated with the mining leases, the mining leases were retained in Climax’s name. 3.5 Surface Rights Land over which Newmont holds surface rights is shown in Figure 3-2. Newmont predominantly owns all surface properties covered by the Mining Leases and a number of surface properties in the surrounding area. Newmont also holds licenses to occupy crown roads within the Mining Leases and a small portion of crown land comprising Lot 7001 in Deposited Land (DP) 1020360 within Mining Lease 1405. Newmont holds occupation permits for infrastructure within surrounding State forest lands. Some road areas within crown lands are still in the process of purchase. The concentrate pipeline and return water line from Blayney are subject to leases within public lands under the control of the Blayney and Cabonne local government areas (LGAs or councils). Newmont owns the land on which the Cadia dewatering plant is located (Lot 106 DP1161062) and leases adjoining Lot 102 that contain the rail track spur line from Mitziya Pty Ltd as owner of the adjoining ‘Sea-Link’ development site. The rail track spur line connects to the Great Western Railway line, with transport of concentrate ultimately to Port Kembla. Under the Minister’s Condition of Approval issued under the Environmental Planning and Assessment Act 1979 (EP&A Act), Newmont may be required to acquire additional properties where mining operations may have environmental impacts that exceed certain specified limits upon those properties. The surface rights are sufficient to support mining operations, provided that subsidence or other impacts do not occur outside existing approved Mining Leases. Cadia Valley Operations New South Wales, Australia Technical Report Summary Date: February 2026 Page 3-6 Figure 3-1: Mineral Tenure Location Plan Note: Figure prepared by Newmont, 2025.


Cadia Valley Operations New South Wales, Australia Technical Report Summary Date: February 2026 Page 3-7 Figure 3-2: Surface Rights Location Map Note: Figure prepared by Newmont, 2024. Cadia Valley Operations New South Wales, Australia Technical Report Summary Date: February 2026 Page 3-8 3.6 Water Rights Newmont holds water access licenses under the Water Management Act 2000 for water extraction as listed in Table 3-4. Table 3-4: Water Access Licenses Water Access License (WAL) Water Source Unit Share (ML) Description 31062  Orange Basalt 286 Pumped extraction: ‘Te Anau’ bore. Incidental groundwater inflow: Ridgeway and Cadia East. 31072 * Lachlan Fold Belt MDB 371 Pumped extraction: CB3, CB6, CB8, CB9 and RH641. 36229 Lachlan Fold Belt MDB 931 Incidental groundwater inflow: Ridgeway, Cadia East, Cadia Extended Pit and the Pit tailings storage facility. 32255 Belubula River Regulated Water Source 3,125 Pumped extraction: Belubula River, Supplementary. 32280 Belubula River Regulated water Source 4,080 Pumped extraction: Belubula River, General Security. 31527 Lachlan Unregulated and Alluvial Water Source 4,200 Pumped/piped extraction: Cadiangullong Creek, Cadia Creek #, Copper Gully, Rodds Creek, Flyers Creek. 31517 Belubula tributaries below Carcoar Dam 6 Irrigation supply for ‘Narambon’ property. 31505 Lachlan Unregulated and Alluvial Water Source 4 Stock and domestic supply for ‘Stratton Vale’ property. Notes: * = groundwater extraction from water supply bores is limited to a maximum of 2.5 ML/day up to the total water access license limit in each water year. # = water is piped from Cadia Creek to Cadiangullong Dam and accounted for as a component of the total Cadiangullong Creek extraction. Harvesting of water on-site (including Cadiangullong Creek, Flyers Creek, Cadia Creek, Rodds Creek and Copper Gully) is licensed at 4,200 ML/a. Newmont also holds about 1,588 ML in groundwater licenses in the Orange Basalt and Lachlan Fold Belt lithologies and 4,080 ML of Belubula River General Security and 3,125 ML of Belubula River Supplementary license. Newmont must demonstrate through groundwater impact assessments that there is minimal to no impact on surrounding groundwater levels if such extraction is undertaken. Additional information on water management is provided in Chapter 15. Cadia Valley Operations New South Wales, Australia Technical Report Summary Date: February 2026 Page 3-9 3.7 Royalties Royalties levied at the State level are outlined in Chapter 3.2.3. There are no other royalties or similar obligations payable on the Project. 3.8 Encumbrances There are no known encumbrances. 3.9 Permitting Permitting and permitting conditions are discussed in Chapter 17.10 of this Report. The operations as envisaged in the life-of-mine (LOM) plan are either fully permitted, or the processes to obtain permits are well understood and similar permits were granted to the operations in the past, such as TSF raises. There are no current material violations or fines, as imposed in the mining regulatory context of the Mine Safety and Health Administration (MSHA) in the United States, that apply to the Cadia Valley Operations. 3.10 Community Concerns, Regulatory Actions, and Legal Proceedings Ongoing issues related to tailings storage are discussed in Chapter 17.6.2. In October 2023 the New South Wales Environment Protection Authority commenced two charges against Newmont for the Cadia Valley Operations relating to alleged air pollution from the surface of the Cadia Valley Operations’ tailing storage facilities on October 13 and 22, 2022. Newmont has entered a plea of not guilty in relation to both charges, and the matter will go to court in February 2026. Community concerns were raised in relation to groundwater and surface water quality downstream of the Cadia Valley Operations, and in relation to both metals and per- and polyfluoroalkyl substances. The New South Wales Environment Protection Authority completed extensive sampling of the surface water network in the Upper Belubula River catchment and produced publicly available reports. The Environment Protection Authority sampling shows that water in the district meets irrigation and livestock criteria. Traces of perfluorooctane sulfonic acid, a chemical found in fire-fighting foams amongst other uses, were detected in water monitoring within the Cadia Valley Operations. As a result, the New South Wales Environment Protection Authority altered the site’s Environment Protection License to have Newmont engage an independent consultant to undertake an investigation of potential sources of perfluorooctane sulfonic acid on site. The New South Wales Environment Protection Authority has also put the same investigative condition on other major industries in the Orange district. Newmont has not used fire-fighting foam containing perfluorooctane sulfonic acid since 2016. Cadia Valley Operations New South Wales, Australia Technical Report Summary Date: February 2026 Page 3-10 3.11 Significant Factors and Risks That May Affect Access, Title or Work Programs To the extent known to the QP, there are no other significant factors and risks that may affect access, title, or the right or ability to perform work on the Cadia Valley Operations that are not discussed in this Report.


Cadia Valley Operations New South Wales, Australia Technical Report Summary Date: February 2026 Page 4-1 4.0 ACCESSIBILITY, CLIMATE, LOCAL RESOURCES, INFRASTRUCTURE AND PHYSIOGRAPHY 4.1 Physiography The Cadia Valley Operations are located in the Central Tablelands of NSW on the western side of the Great Dividing Range. Elevations range from approximately 600 m Australian Height Datum (AHD) to 1,000 mAHD. Areas of higher elevation in the region include Mount Canobolas (1,396 mAHD) and Mount Towac (1,136 mAHD) located to the north of the Cadia Valley. The region is characterized by gently undulating hills, cleared open grassland and vegetation consisting mainly of scattered paddock trees, with isolated patches of remnant woodland and shelterbelts, and State Forest plantations of Monterey Pine. State Forests situated in the area include the Glenwood and Canobolas State Forests to the southwest of Orange, and Mullion Range State Forest to the north of Orange. The main watercourse through the Cadia valley is Cadiangullong Creek, which flows in a southerly direction to its junction with the Belubula River, some 15 km south. Tributaries of Cadiangullong Creek within the Cadia valley include Rodds Creek, Cadia Creek, Copper Gully and Hoares Creek. The Cadia Valley is defined by a series of rolling hills which form ridgelines to the east and west of Cadiangullong Creek. To the south, the Cadia Valley opens out to generally gently-undulating land extending to the Belubula River, with occasional steeply sided gullies in the lower portion of the catchment. The dominant land use in the Orange region is agriculture, principally grazing (sheep and cattle), cropping and orchards. Other agricultural activities include honey production, viticulture, and softwood production. Land use in the vicinity of the Cadia Valley Operations is dominated by sheep and cattle grazing in the more gently undulating areas, and private and state forestry operations on poorer soil and steeper slopes such as the Mount Canobolas State Forest. The bushfire season experienced in the Cadia Valley area and Central West Region is generally from mid-November to mid-March. Depending on factors such as weather, fuel loads (build-up of leaf litter and broken branches) and drought indices, this season can be extended from early September to late April. There are moderate fuel loads associated with the open forest and woodland areas within the Cadia East subsidence zone and the tailings storage facilities expansion areas. Cadia Valley Operations New South Wales, Australia Technical Report Summary Date: February 2026 Page 4-2 4.2 Accessibility The Cadia Valley Operations are located approximately 25 km southwest of Orange, in the NSW Central Tablelands. Orange is connected to Sydney, the largest city in NSW, by 265 km of sealed road. The Mid-Western Highway (State Highway 6) and the Mitchell Highway (State Highway 7) provide regional highway access to the Cadia area. The Mid-Western Highway connects Bathurst to West Wyalong in western NSW, via Blayney, and the Mitchell Highway connects Bathurst to Bourke in northwestern NSW, via Orange. The Great Western Highway (State Highway 5), connects Bathurst to Sydney. Access to the operations from Orange, Blayney and surrounding regional road network is available via Forest Road, Cadia Road, Orchard Road, Long Swamp Road/Woodville Road, and Panuara Road. Panuara Road is a local road that provides an east–west link between Four Mile Creek Road and Errowanbang Road, passing to the south of Cadia. The principal route used to access the Cadia Valley Operations from Orange is via Forest Road, Cadia Road and Ridgeway Road. The existing site access road is located off Ridgeway Road. A secondary access road, the molybdenum plant access road, also provides access to the operations, and is located approximately 5 km to the south of the intersection of the Cadia and Ridgeway Roads. Commuter airlines provide Brisbane to Orange, Sydney to Orange, and Melbourne to Orange services. The Orange airport is about 12 km northeast of the Cadia Valley Operations. Bus and passenger rail services also operate between Orange and Sydney. 4.3 Climate The closest Bureau of Meteorology weather station to the Cadia Valley Operations is located approximately 12 km east–northeast, at Orange airport. The mean annual rainfall recorded at the station is approximately 885 mm. The lowest mean monthly rainfall (approximately 50 mm) occurs in autumn (March and April) and the highest mean monthly rainfall occurs in August (approximately 92 mm). Evaporation rates vary markedly between winter and summer. The area experiences the warmest temperatures from November to March and the coolest from May to August. Average daily maximum temperatures peak in January, while average daily minimum temperatures are lowest in July. The most common wind directions are from the southwest and northeast. The bushfire season is typically from mid-November to mid-March. Mining and exploration activities are currently conducted year-round. It is expected that mining activities associated with the Ridgeway operations will also be year-round. Cadia Valley Operations New South Wales, Australia Technical Report Summary Date: February 2026 Page 4-3 4.4 Local Resources and Infrastructure Local shires or local government authorities include Orange (population of approximately 38,000), Blayney (population approximately 7,000) and Cabonne (population approximately 12,000). The Cadia Valley Operations are located on lands designated under the respective LGA Local Environment Plans (LEP) as Zone 1(a) or general rural; Zone 1(f) or forestry; Zone 1(c) or rural small holdings; Zone 2(v) or urban or village; and Zone 7(a) which is designated for environment protection. The operations are located within rural zone RU1 Primary Production land in both the Blayney Local Environment Plan (LEP) 2012 and Cabonne LEP 2012. The Cadia East project area falls within the Blayney and Cabonne LGAs. Surrounding land is also zoned RU1 Primary Production except for state forest land to the north and east of Cadia which is zoned RU3 Forestry where located on state forest-owned land. The Cadia dewatering plant is situated on land zoned IN1 General Industrial, while the rail track spur line is within zone SP2 Rail Infrastructure Facilities. The mining operations are within driving distance of Orange. There is a skilled mining workforce in the region. The Cadia Valley Operations currently either have all infrastructure in place to support mining and processing activities (see also discussions in Chapter 13, Chapter 14, and Chapter 15 of this Report), or the requirements for LOM are well understood. These Report chapters also discuss water sources, electricity, personnel, and supplies. 4.5 Seismicity The deposits are located in an area which has been seismically active both prior to and subsequent to mining by Newmont. These events can produce seismic loading at the site and this risk is considered in infrastructure design. Block caving operations can induce local seismicity. In the case of the Cadia Valley Operations, the risk impacts are managed by the Technical Services department. Cadia Valley Operations New South Wales, Australia Technical Report Summary Date: February 2026 Page 5-1 5.0 HISTORY The Project history is summarized in Table 5-1. Table 5-1: Project History Year Company Work Completed 1851 Discovery of copper and gold in Cadia area. 1918–1929; 1941–1943 Quarrying and underground operations undertaken at Big Cadia. mid-1960s Pacific Copper Limited (Pacific Copper) Targeted the Big and Little Cadia deposits, prompted by the proximity of historical mine workings, and in particular, by magnetic anomalies over the skarn at Big Cadia. 1980s Pacific Copper, Homestake Australia Limited (Homestake) Joint venture to explore for gold. Work completed included grid-based soil sampling and drilling at Cadia Hill, core, reverse circulation (RC), and rotary air blast (RAB) drilling. Drilled two RC percussion holes to downhole depths of 95 m to test magnetic targets, with poor results. Seven core holes, three RC percussion holes and numerous RAB holes at Cadia Hill. None of this work continued on to the main area of mineralized monzonite, partly due to the presence of post-mineral sediments and residual and transported soil. Newcrest 1991–November 2023 Acquired the property in March 1991 with an initial focus on the small shallow oxide resources at Big Cadia. Completed soil, rock chip geochemical sampling; core and RC drilling; mining studies; environmental baseline and supporting studies; metallurgical testwork. Feasibility study assuming open pit mining methods at Cadia Hill, mining commenced 1998, and was completed in 2012, after more than 4 Moz Au and 0.35 Mt Cu were produced over the LOM. Stockpile treatment continued until 2018. Concentrator 1 constructed to support Cadia Hill operation. Construction of Ridgeway underground operations commenced 2000, first production recorded in 2002. The Ridgeway mine is currently on care and maintenance. Ridgeway ore supplied to a new 4 Mt/a concentrator (Concentrator 2) adjacent to Concentrator 1. Concentrator 2 design capacity was increased to about 8 Mt/a. Mining of Cadia Extended, via open pit methods, commenced 2003, ceased in 2004, following pit highwall failure, and displacement of the access ramp. As instability of the pit walls prevented mining of the lowest two benches, the pit was permanently closed and backfilled. In 2009, mining extended into the Ridgeway Deeps area below the completed sub-level caving (SLC) operation using the lower-cost block cave mining method. Mining operations were completed in 2016. Some stockpile material was treated in 2017–2018. Underground operations at Cadia East approved in 2010, and mining commenced in 2012 as a series of panel caves, across multiple lifts. Panel


Cadia Valley Operations New South Wales, Australia Technical Report Summary Date: February 2026 Page 5-2 Year Company Work Completed Cave 1 (PC1) commenced in January 2013. Commercial production from Panel Cave 2 (PC2) commenced in October 2014. Panel Cave 2–3 (PC2– 3) commenced production in 2023. Panel Cave 1–2 (PC1–2) is currently being developed in preparation for production. Program of upgrades and modifications was completed at Concentrator 1 to enable ore from Cadia East to be processed at a design capacity rate of about 26 Mt/a. Concentrator upgrade included provision to produce a separate molybdenum concentrate due to elevated molybdenum grades in some parts of Cadia East. Modification 14, approved in December 2021, to increase the permitted processing capacity from 32 Mt/a to 35 Mt/a is subject to condition 6A (reproduced below) which includes Newcrest commissioning an independent air quality audit report to the satisfaction of the DPE Secretary in relation to Newcrest’s approach to managing and minimizing the off-site air quality impacts of the Cadia Valley Operations. The independent air quality audit report has been undertaken and Newmont is continuing to work with NSW government agencies to gain approval to increase the throughput rate to 35 Mt/a of ore processed on-site. Condition 6A states: “A maximum of 35 million tonnes of ore from the project in a calendar year may be processed on-site, subject to the Proponent commissioning an independent air quality audit report to the satisfaction of the Secretary. The independent audit report must: (a) be prepared in accordance with the Independent Environmental Audit requirements in Schedule 5 of this approval; and (b) describe details and scheduling of all reasonable and feasible best practice measures that are being implemented for managing and minimizing off-site air quality impacts of the project, particularly from the NTSF, STSF, and ventilations shafts”. November 2023–2025 Newmont Acquires Newcrest November 2023. Modification 15, approved January 2025 addressing additional tailings buttressing and hydrocyclone sands tailings activities Note: NTSF = north tailings storage facility; STSF = south tailings storage facility. DPE: New South Wales Department of Planning and Environment. Cadia Valley Operations New South Wales, Australia Technical Report Summary Date: February 2026 Page 6-1 6.0 GEOLOGICAL SETTING, MINERALIZATION, AND DEPOSIT 6.1 Deposit Type 6.1.1 Alkalic Porphyry Gold–Copper Deposits The major deposits that comprise the Cadia Valley Operations are considered to be examples of alkalic porphyry gold–copper-style mineralization. Features of this deposit style are summarized in Table 6-1. Table 6-1: Deposit Model Features Item Note Setting Alkaline rocks associated with gold–copper deposition are commonly found in arc environments and areas of extensional tectonics. Host rocks are often subaqueous volcanic-related sequences that were intruded by equigranular to coarsely porphyritic and locally pegmatitic, high-level stocks and dike complexes. Multiple intrusive phases are common, and a wide variety of breccia types can develop. Intrusive rocks can range from (alkalic) gabbro to syenite in composition. Host features Alkalic deposits are typically locally high-grade, and are associated with small volume, pipe- like alkalic intrusions that may be as small as a few hundred meters. Deposit outlines are highly variable, ranging from small to large, but typically showing significant vertical extents. Deposits can occur in clusters, with locations influenced by a combination of structural, stratigraphic, breccia, and intrusive controls. Alteration Alteration generally has a restricted footprint, but displays complex assemblages and zonation. Potassium metasomatism leads to the development of a potassic alteration footprint commonly surrounded by a propylitic aureole. The deepest parts of some systems can be associated with a calc-silicate assemblage, commonly accompanied by sodic alteration. Sodic alteration has also been recognized peripheral to potassic zones. Advanced argillic alteration is rarely present, and phyllic zones are usually restricted to fault zones that developed late in the history of the hydrothermal system. Supergene enrichment zones are generally not present. Wall rock alteration is often represented by a biotite–magnetite–orthoclase assemblage. The abundance of biotite and magnetite is controlled by the iron and magnesium content of the wall rocks. Skarns may occur and can be economically significant. Potassic-style alteration in igneous rocks tends to correlate with calc–potassic assemblages in altered carbonate rocks dominated by andraditic garnets, diopside, epidote, and sometimes biotite. Mineralization Mineralization can be present in the form of stockworks, veinlets, disseminations, and replacements. The major sulfides present can include chalcopyrite, pyrite, and magnetite. Other minerals can include bornite, chalcocite, galena, sphalerite, tellurides, and tetrahedrite. Gangue minerals often include K-feldspar, and sericite, with lesser garment, clinopyroxene (diopsidic) and anhydrite. Hydrothermal magnetite veinlets are generally abundant. Quartz veining is well developed in the Cadia Valley. Cadia Valley Operations New South Wales, Australia Technical Report Summary Date: February 2026 Page 6-2 Item Note Brecciation Breccias in alkalic systems are associated with hydrothermal and phreatomagmatic processes. Magnetite-cemented hydrothermal breccias may host high-grade mineralization. Gold–copper mineralogical associations Gold may be present as discrete grains of native gold, tellurides, or auriferous sulfides. Alkalic porphyry deposits may also show elevated tellurium and platinum-group element concentrations. In copper-rich deposits, gold is commonly associated with bornite and high copper concentration. Gold is usually found in stockwork veins of quartz, sulfides, native gold, and tellurides. 6.2 Regional Geology The alkalic porphyry gold–copper deposits of the Cadia district are located in the eastern Lachlan Fold Belt of New South Wales. The district comprises four porphyry deposits, Ridgeway, Cadia Extended (Cadia Quarry), Cadia Hill and Cadia East, and two related iron-skarn deposits, Big Cadia and Little Cadia. The Cadia deposits formed within the intra-oceanic Macquarie Arc (Figure 6-1), a belt of Ordovician to early Silurian mafic to intermediate volcanic, volcaniclastic and intrusive rocks. As much as 2.5 km of Ordovician stratigraphy is preserved in the Cadia district, including siltstone and sandstones of the Weemalla Formation and andesitic to basaltic andesitic Forest Reefs Volcanics (FRV; Wilson et al., 2003; Harris et al., 2009). Porphyry-style mineralization is centered on multiphase monzodiorite to quartz monzonite intrusions (Figure 6-2; Wilson et al., 2003) of the Cadia Intrusive Complex (CIC). Silurian conglomerates, sandstones, and siltstones (part of the Waugoola Group) cover large portions of the Ordovician volcano-sedimentary succession. Tertiary basalts of the Canobolas Volcanic Complex cover the Paleozoic rocks to the north and east of the district. Published geochronologic studies show that the mineralization-related Ordovician to Silurian alkalic intrusions become progressively younger to the east across the Cadia Valley, with Ridgeway being the oldest deposit in the district (ca. 455 Ma) and Cadia East the youngest (ca. 437 Ma; Wilson et al., 2007). Narrow pipe-like stocks and dikes that are associated with gold and copper mineralization cut the volcano–sedimentary rocks and the large, compositionally zoned (dioritic to monzonitic) intrusive suite that is exposed in the center of the district. Regional east–west shortening, linked to terrane docking and accretion at the end of the Benambran Orogeny, produced thrust fault systems around the CIC during the early Silurian, including curviplanar, northerly-striking, moderately-dipping basement thrust faults of the Cadiangullong system. Post-mineral deformation has partially dismembered the district, superposing different porphyry copper–gold systems as well as the host stratigraphy levels (Figure 6-3; Harris et al., 2009). Cadia Valley Operations New South Wales, Australia Technical Report Summary Date: February 2026 Page 6-3 Figure 6-1: Regional Geology of the Ordovician Rocks of New South Wales Note: Figure prepared by Newcrest, 2011. RBVB = Rockley–Gulgong Volcanic Belt; JNVB = Junee–Narromine Volcanic Belt; MVB = Molong Volcanic Belt; KVB = Kiandra Volcanic Belt; CVO = Cadia Valley Operations; MORB = mid-ocean ridge basalt.


Cadia Valley Operations New South Wales, Australia Technical Report Summary Date: February 2026 Page 6-4 Figure 6-2: Cadia Valley Geological Plan Note: Figure prepared by Newcrest, 2011. Cadia Hill and Cadia Quarry are not reported as having current mineral resource or mineral reserve estimates. Mining has previously occurred at both Cadia Hill and Cadia Quarry. Cadia Valley Operations New South Wales, Australia Technical Report Summary Date: February 2026 Page 6-5 Figure 6-3: Cadia Valley Geological Cross Section (long-section looking north 22500N) Note: Figure prepared by Newmont, 2024. Cadia Hill and Cadia Quarry are not reported as having current mineral resource or mineral reserve estimates. Mining has previously occurred at both Cadia Hill and Cadia Quarry. Cadia Valley Operations New South Wales, Australia Technical Report Summary Date: February 2026 Page 6-6 6.3 Local Geology The mineralization within the Project area occurs within a 6 km-long west–northwest-oriented corridor. 6.3.1 Lithologies Figure 6-4 presents a comparative stratigraphy across the Cadia Valley. Figure 6-5 presents a series of geological cross-sections through the deposits. The basement rocks in the Cadia district are fine-grained, thinly-laminated, carbonaceous to volcanic siltstones, with minor arenaceous volcanic beds of the Weemalla Formation. The Weemalla Formation crops out to the south and southwest of Cadia Hill and to the west of Ridgeway. It is conformably overlain by the FRV, a sequence of basic to intermediate volcanic and volcano- sedimentary rocks. The FRV is divided into four lithofacies (Wilson, 2003): • Volcanic lithic conglomerates, breccias and sandstones; • Planar laminated volcanic siltstone; • Bedded calcareous volcanic sandstone; • Clinopyroxene- and plagioclase-phyric lava and subvolcanic intrusions of basaltic to basalt– andesite composition. Three main Ordovician intrusive complexes were identified in the Cadia district. Although currently spatially separated due to the current erosion level, they may be connected at depth. The Cadia Intrusive Complex (CIC) consists of pyroxene diorite, monzodiorite and occasional pyroxenite in the west to monzonite, quartz monzonite, and quartz monzodiorite in the east. The mafic, western portion of the CIC is interpreted to be separated from the eastern, felsic portion of the CIC by a major north–northwest-striking, west–southwest-dipping thrust fault, the Purple Fault. The Ridgeway Intrusive Complex (RIC) is located 2.5 km northwest of the Cadia Hill portion of the CIC, with the top of the RIC occurring about 500 m below surface. At least three intrusive stages were defined, of which the latter two have a clearly demonstrated temporal relationship with Ridgeway deposit alteration and mineralization. The RIC comprises a vertically attenuated composite pipe of monzodiorite to quartz monzonite. It has horizontal dimensions of 200 x 100 m, is elongated along a northwest-trending axis, and extends subvertically for at least 1 km. Cadia Valley Operations New South Wales, Australia Technical Report Summary Date: February 2026 Page 6-7 Figure 6-4: Comparative Stratigraphy Note: Figure from Wilson, 2003. The Cadia Far East Intrusive Complex referred to in the figure is currently termed the Cadia East Intrusive Complex.


Cadia Valley Operations New South Wales, Australia Technical Report Summary Date: February 2026 Page 6-8 Figure 6-5: Comparative Geological Cross-Sections Note: Figure from Wilson, 2003. The Cadia Far East Intrusive Complex referred to in the figure is currently termed the Cadia East Intrusive Complex. Cadia Valley Operations New South Wales, Australia Technical Report Summary Date: February 2026 Page 6-9 The Cadia East Intrusive Complex (CEIC; formerly termed the Cadia Far East Intrusive Complex) comprises a series of west–northwest- to west-striking dikes that dip steeply to the north. The top of the complex averages about 800 m below the surface. Dyke compositions range from monzodiorite and quartz monzodiorite to quartz monzonite. Middle to Late Silurian shale, sandstones, and fossiliferous limestone of the Cadia Coach Shale unconformably overlie the eastern part of the district. This unit can reach 200 m in thickness above the Ordovician rocks at Cadia East. Elsewhere in the district, the Cadia Coach Shale infills deep down-faulted basins and can be as much as 1,500 m thick. Rafts and inliers of Silurian lithologies are also preserved along part of some major fault structures. A clast to cobble-rich lithology, informally termed the “valley-fill breccia”, also of Silurian age, forms a north–south-oriented zone that is preserved on the southern slopes of Sharps Ridge, the highest local topography. Patchy outcrops of Tertiary olivine basalt to basaltic andesite, related to the Canobolas Volcanic Complex, occur throughout the Cadia district. They totally conceal the Ridgeway deposit and partially overlie the Cadia East and Little Cadia deposits. The basalts are up to 80 m thick at Cadia Far East and comprise at least six lava flows with vesicular tops and local intercalations of peat. 6.3.2 Metamorphism Regional metamorphism is sub to lower greenschist facies. 6.3.3 Structure The major regional structure is the 30 km long Werribee–Cadiangullong Fault Zone. Where the Werribee–Cadiangullong Fault Zone intersects structures related to the west–northwest oriented Lachlan Transverse Zone, it forms a series of north–northwest- and northeast-trending thrust faults. This structural intersection appears to have controlled the location of the CIC and associated mineralization, and has disrupted the Cadia Hill deposit. The Cadia Hill deposit sits in a fault-bounded block within the basement thrust fault system, whereas the Ridgeway deposits lie in the hanging wall and the Cadia East deposit in the footwall. 6.3.4 Mineralization Several mineralization styles are known in the district: • Cadia Hill: intrusive wall rock, and volcanic-hosted deposit associated with sheeted quartz vein mineralization; • Cadia East: volcanic-hosted, intrusion-centered deposit with disseminated and sheeted quartz vein mineralization; • Cadia Far East (historical, now discontinued name; part of Cadia East): volcanic- and intrusion-hosted deposit with mainly sheeted quartz vein mineralization; Cadia Valley Operations New South Wales, Australia Technical Report Summary Date: February 2026 Page 6-10 • Cadia Quarry: intrusive wall rock deposit associated with sheeted quartz–calcite–sulfide veins and locally developed zones of mineralized pegmatitic breccia; • Ridgeway: intrusion- and volcanic-hosted quartz stockwork vein mineralization; • Big/Little Cadia, Little Cadia: iron-rich skarn mineralization. 6.3.5 Weathering Weathering is typically restricted to 30–60 m depth. The overlying Silurian sedimentary and Tertiary volcanic rocks have largely protected the mineralization from weathering effects. 6.4 Deposit Geology 6.4.1 Cadia East The Cadia East deposit occupies a mineralized zone 2.5 km in strike length, 600 m in width and over 1,900 m in vertical extent. It is located below and to the east of the Cadia Hill deposit. During early exploration activities, the name “Cadia East” was used to refer to disseminated near- surface mineralization that was hosted by FRV valley-fill units, while the name “Cadia Far East” referred to the sheeted vein-hosted mineralization within the underlying FRV basement. After mining commenced at Cadia East, the distinction between the two mineralization types as separate deposits was discontinued. 6.4.1.1 Geology Mineralization is developed in the FRV, and in a series of subvertical to steeply north-dipping monzodioritic to quartz monzonitic dikes, that are termed the Cadia Far East intrusive complex (CFEIC). The syn-mineral nature of at least some of the intrusions is indicated by the presence of mineralized xenoliths within monzonite porphyry dikes that also host porphyry-style veining and alteration. The Weemalla Formation has been intersected at depth and consists of finely-bedded siltstone interbedded with basaltic volcanic rocks. Overlying this unit are five lithofacies of the FRV, and from shallow emplacement to depth, the lithofacies include: • Upper bedded unit: approximately 80 m thickness of finely planar-laminated feldspathic siltstone; • Volcaniclastic unit: approximately 200 m thickness of sandy matrix polymictic conglomerate and volcaniclastic sandstones and locally volcanic breccia; • Lower bedded unit: around 60 m thickness of bedded calcareous sandstone, typically altered to skarn mineral assemblages; Cadia Valley Operations New South Wales, Australia Technical Report Summary Date: February 2026 Page 6-11 • Massive volcanic rocks: about 150 m thickness of massive pyroxene phyric basalt to andesite lavas; • Lower sequence: at least 1,100 m thickness of polymictic conglomerates and volcaniclastic sandstones. Intrusive porphyry dikes and sills are interpreted to be coeval with the FRV volcanic units. In the Cadia East area, the 5–30 m thick porphyry dikes appear to be stratigraphically controlled by the bedded units, and acted as feeders to overlying sills. The largest dyke has been traced for 1,500 m along strike, is coincident with a change in shape of the orebody on Easting 15570, and is cross-cut by mineralized veins. Two large porphyry sills located above the lower bedded unit can be traced along the upper portion of Cadia East. Numerous smaller sills and dikes also exist in this area. The uppermost of the units is termed the capping porphyry, and is thickest (approximately 70 m) in the middle of the deposit. Figure 6-6 and Figure 6-7 are sections showing the geology, alteration, mineralization zoning, and vein distribution in the Cadia East and Cadia Far East zones respectively. 6.4.1.2 Alteration Mineralization at Cadia East is associated with an alteration system that occurs in roughly concentric zones about the core of the deposit. Within this alteration system both pervasive and selvage styles of alteration are recognized. The pervasive alteration overprints regional propylitic (chlorite–carbonate–epidote) alteration and is characterized by variably intense albite alteration. The selvage style of alteration is largely made up of three alteration types: • Hematite/K-feldspar alteration associated with quartz veins (generally mineralized); • Phyllic alteration associated with faults; • Iron carbonate–albite alteration associated with faults. Figure 6-6 and Figure 6-7 include example sections showing alteration zoning.


Cadia Valley Operations New South Wales, Australia Technical Report Summary Date: February 2026 Page 6-12 Figure 6-6: Geology Section, Cadia East (15,820 mE) Note: Figure from Wilson, 2003. Cadia Valley Operations New South Wales, Australia Technical Report Summary Date: February 2026 Page 6-13 Figure 6-7: Geology Section, Cadia Far East (Section 15820 mE) Note: Figure from Wilson, 2003. Cadia Valley Operations New South Wales, Australia Technical Report Summary Date: February 2026 Page 6-14 6.4.1.3 Structure Three major groups of faults were identified (Table 6-2). Table 6-2: Major Fault Types, Cadia East Fault Type Description Sericite–chlorite– clay (SCC) shears Most common type of fault at Cadia East, and range in scale from millimeters wide to tens of centimeters wide. Infill can vary from friable sericite–chlorite to puggy clay–gouge. Pyrite is common, hence the former description as a “pyrite fault”, a nomenclature that has been discontinued. The most continuous sub-set, the P Faults (P1 and P2) are east–northeast– west–southwest-striking (parallel to the orebody) and transect the panel cave areas. These faults are anastomosing, and locally discontinuous with splays, and consist of SCC shears that are soft, present deteriorating ground upon exposure, and have a well-developed shear fabric. East–northeast–west–southwest- and east–southeast–west–southwest-striking fault subsets appear to be limited to a 50–100 m strike length and do not have the continuity of the P Faults. The east–southeast-striking shears may be shear fractures that link the tensional fractures within a fault jog, hence their limited (<100 m) continuity along strike. Carbonate– laumontite (Ca– La) fracture zones Highly fractured and veined zones to tens of meters wide. Calcite-laumontite mineralization is common throughout the Cadia East system, but there are concentrations of calcite– laumontite on the hanging wall (Ca–La North) and footwall (Ca–La Central) sides of the higher-grade orebody (copper and gold), and on the northwest corner of the lower-grade copper zone (Ca–La West). The faults are late-stage zones of very poor ground conditions as a consequence of the hydration/dehydration of laumontite and reactivation of sub-vertical faults during episodes of basin inversion. Carbonate faults Either related to late low-angle thrusts that are likely splays off the regional Gibb Fault (e.g., Cat Fault), or flexural slip along bedding planes and volcanic contacts during basin inversion and reactivation of steeper SCCs (e.g. Carb 1, 2, 3, 4, 5). Characterized by zones of iron- carbonate–albite alteration and chlorite shearing around a zone of calcite veins, or intervals of calcite-rich puggy (sticky) gouge with an iron carbonate selvedge. The Cat Fault has been estimated to have at least 80 m of reverse movement and 200m of sinistral offset. 6.4.1.4 Mineralization Mineralization at Cadia East is divided into two broad overlapping zones: an upper, copper-rich disseminated zone and a deeper gold-rich zone associated with sheeted veins. The upper zone forms a relatively small cap to the overall mineralized envelope and has a core of disseminated chalcopyrite (and rare bornite), capped by chalcopyrite–pyrite mineralization (Fox et al., 2009). The deeper zone is localized around a core of steeply-dipping, sheeted, quartz–calcite–bornite– chalcopyrite–molybdenite veins, with the highest gold grades associated with the bornite-bearing veins. Copper and molybdenite form a mineralized blanket above and to the east of the higher- grade gold envelope. Cadia Valley Operations New South Wales, Australia Technical Report Summary Date: February 2026 Page 6-15 Gold:copper values are vertically zoned. The upper, disseminated zone of volcanic-hosted mineralization typically has low Au:Cu values (<1), whereas the envelopes of sheeted quartz– calcite–sulfide veins have higher Au:Cu values (typically >2). Figure 6-6 and Figure 6-7 include examples of mineralization zoning. 6.4.2 Ridgeway The deposit is a subvertical body of quartz–sulfide vein stockwork mineralization with an elliptical, pipe-like geometry, elongated along a northwest-striking axis. Stockwork dimensions are approximately 400 m east–west, 250 m north–south and the deposit extends to a depth in excess of 1,000 m. 6.4.2.1 Geology Mineralization is spatially and temporally associated with a composite intrusive plug consisting of multiple mafic monzonite to quartz monzonite phases that intruded the FRV. The earliest phase is a mafic monzonite, which is a northwest striking, subvertical body with horizontal dimensions of 200 x 50 m wide and a vertical extent of at least 500 m. It occurs as a subvertical plug along the southern side of the Ridgeway deposit. Three phases of porphyritic intrusion (early-mineral monzonite, and inter- and late-mineral quartz monzonite) post-date the mafic monzonite, and form a composite pipe along the northeastern margin of the mafic monzonite. This pipe has a horizontal footprint of about 130 x 40 m, oriented along a west–northwest trending axis. The pipe has been recognized over a vertical interval of >650 m and remains open at depth. Figure 6-8 is a level plan showing the relationship of the various intrusive phases. Figure 6-9 is a section through the deposit showing the geology in relation to the copper and gold grade shells.


Cadia Valley Operations New South Wales, Australia Technical Report Summary Date: February 2026 Page 6-16 Figure 6-8: Geology Level Plan, Ridgeway (5280RL level) Note: Figure from Wilson, 2003. Cadia Valley Operations New South Wales, Australia Technical Report Summary Date: February 2026 Page 6-17 Figure 6-9: Geological Sections, Ridgeway Note: Figure from Wilson, 2003. Section on left at 11,050 mE; section on right at 22,750 mE. Cadia Valley Operations New South Wales, Australia Technical Report Summary Date: February 2026 Page 6-18 6.4.2.2 Alteration Hydrothermal alteration is broadly zoned from an inner calc-potassic (actinolite–biotite– orthoclase) and potassic (orthoclase–biotite–quartz) core, outwards through propylitic (chlorite– hematite–magnetite–epidote–albite–pyrite ± calcite) and sodic (albite–pyrite) assemblages (Wilson et al., 2003). The transition to more distal metal-poor propylitic alteration zones has been long recognized by the disappearance of hematite-dusted secondary albite (Holliday et al., 2002). Figure 6-9 includes a cross-section through the deposit showing the alteration zoning. 6.4.2.3 Structure The Ridgeway deposit is centered on multiple steeply-dipping porphyries occurring at the confluence of two gently-dipping structural blocks. To the west of Ridgeway, stratigraphy gently dips east, whereas sedimentary units to the east dip west to west–northwest at 10–20°. These rocks are cut by multiple moderate-dipping reverse faults. A single prominent fault, the Tinnock Fault, occurs with ~500 m of stratigraphic offset (as defined by two stratigraphic pinpoints, including the two lowermost units of the Forest Reefs Volcanics), placing lower parts of the stratigraphy over higher parts. Numerous other moderately-dipping faults splay from this master fault and dismember parts of the Ridgeway deposit. In the deposit, these faults only displace the intrusions by several tens of meters (Harris et al., 2009). 6.4.2.4 Mineralization Mineralization at Ridgeway and Ridgeway Deeps occurs in dense quartz vein stockworks and sheeted arrays localized in and around the small (50–100 m diameter) composite diorite to quartz–monzonite intrusive complex. The most strongly developed quartz stockwork veining and alteration, and the highest copper and gold grades, occur immediately adjacent to the monzonite. The frequency of the veins and intensity of alteration decreases away from the intrusive complex margin (Wilson et al., 2003). Ore minerals include bornite and chalcopyrite with lesser covellite and gold and occur in veins and as disseminations (Wilson et al., 2003). Sulfide minerals are zoned from a bornite to chalcopyrite (plus gold) core, outwards and upwards through a chalcopyrite-rich to an outer pyrite-rich domain. Figure 6-10 includes a cross-section through the deposit showing the sulfide mineralization zoning. Cadia Valley Operations New South Wales, Australia Technical Report Summary Date: February 2026 Page 6-19 Figure 6-10: Alteration and Pyrite Zoning, Ridgeway (section 11050 mE) Note: Figure from Wilson, 2003. Section at top at 11,050mE; section on bottom at 22,750mE. Bn = bornite, ccp = chalcopyrite, cpx = clinopyroxene, pl = plagioclase, py = pyrite


Cadia Valley Operations New South Wales, Australia Technical Report Summary Date: February 2026 Page 7-1 7.0 EXPLORATION 7.1 Exploration 7.1.1 Grids and Surveys The Cadia Valley Operations grid and co-ordinate system is consistent for all deposits and operations. Grid north is aligned at 30.5º east of true north, and 19.3º east of magnetic north. This grid was used to locate all historical data, including drilling, and is used for all current drilling. A constant added to the entire Project grid co-ordinates in approximately 1995, to allow for the Ridgeway area, such that 10,000 was added to the easting, 20,000 to the northing, and 5,000 m added to the Australian height datum (AHD) elevation for all deposits. Surface topography as-builts across the Cadia East area are based on a combination of GPS, theodolite/total station and aerial photogrammetry surveys. Photogrammetry is levelled by ground-surveyed control points. The data is considered to be accurate to within ±500 mm. 7.1.2 Geological Mapping Surface geological mapping was performed by Newcrest geologists, in conjunction with staff of the NSW Department of Primary Industry (Orange 1:100 000 Geological Sheet, 1997). At the Ridgeway mine, during operations, development advances of approximately 4 m in length were mapped in detail to paper, at 1:250 scale for rock type, quartz veining, and structures. The paper maps were georeferenced and digitized. The information was used to update the geological and fault interpretations for the deposit. Paper-based mapping was completed during the development of Cadia East Panel Caves 1 and 2. Underground mapping at a scale of 1:500, captured rock type and structures that were used to inform geological and structural interpretations. Data collected from mapping were transferred to the acQuire database, with digital records of the maps stored on the local network. Underground digital mapping at Cadia East commenced in November 2018, using the Maptek I- Site SR3 laser scanner, coinciding with commencement of the early works for PC2-3 development. This technology enables the capture of high-quality 3D photogrammetry for more accurate geological and structural interpretations. In addition, the system reduced the exposure of personnel at the development face underground and can be used to collect digital scans of unsupported development headings. Digital images are collected, geo-referenced and geologically mapped to inform the geological interpretation of the PC2-3 and PC1-2 footprint. Geological interpretation is focused on structural and lithological mapping within the mining footprint. Cadia Valley Operations New South Wales, Australia Technical Report Summary Date: February 2026 Page 7-2 7.1.3 Geochemistry Geochemical sampling has predominantly been completed in areas of Ordovician basement outcrop. Areas of Silurian sedimentary cover and Tertiary basalt are largely unsampled due to the lack of effectiveness of sampling techniques within these areas. Newmont has trialed its proprietary deep sensing geochemistry in areas with Silurian cover. These samples are similar to soil samples and are combined with those samples in the soil sampling totals. Sampling methods included rock chip (6,372 samples), stream sediment (1,951), and soil (31,812) sampling, for a total of 40,135 samples recorded in the database. Sampling was ongoing at the Report date. Sample locations are shown in Figure 7-1 (stream sediment), Figure 7-2 (rock chip) and Figure 7-3 (soil). Surface geochemical sampling has principally been used as a mineralization vectoring tool to prioritize exploration prospects and generate direct drill targets. Cadia Valley Operations New South Wales, Australia Technical Report Summary Date: February 2026 Page 7-3 Figure 7-1: Stream Sediment Sampling Note: Figure prepared by Newmont, 2025. Cadia Valley Operations New South Wales, Australia Technical Report Summary Date: February 2026 Page 7-4 Figure 7-2: Rock Chip Sampling Note: Figure prepared by Newmont, 2025.


Cadia Valley Operations New South Wales, Australia Technical Report Summary Date: February 2026 Page 7-5 Figure 7-3: Soil Sampling Note: Figure prepared by Newmont, 2025. 7.1.4 Geophysics Airborne, ground, and drill hole geophysical surveys were conducted as summarized in Table 7-1. The areas covered by geophysical surveys are shown in Figure 7-4. Cadia Valley Operations New South Wales, Australia Technical Report Summary Date: February 2026 Page 7-6 Table 7-1: Geophysical Surveys Survey Type Year Note Airborne heli-magnetic and radiometric survey 1996 The entire Cadia mineralized system was covered by a heli-magnetic and radiometric survey, acquired by Geoinstruments during 1996. The system used a compensated ‘stinger’ magnetometer mounted on a Bell JetRanger, and a 16 L radiometric crystal pack. The specifications were 50 m spaced north–south lines, and a 25 m flight height. Magnetic data were acquired at 0.1 s intervals, and radiometric data at 1 s intervals. The heli-magnetic and radiometric data provide lithological, structural, and alteration information over the area. Three-dimensional inversion of the total magnetic intensity (TMI) data using UBC MAG3D software was used to create a 3D susceptibility block model. The magnetic response west of Cadia Hill is primarily the result of more mafic phases of the intrusive complex, which average around 0.01 SI susceptibility. The anomalies associated with Ridgeway, Cadia East, and the magnetic rim around part of Cadia Hill are primarily a result of magnetite alteration. The Tertiary basalt can sometimes be observed in the TMI data as remnantly- magnetized ‘lows’. Heliborne Falcon geophysical survey 2010 A heliborne Falcon geophysical survey was completed in June 2010. The survey was conducted on a 200 m traverse line spacing, and 2 km tie-line spacings, with a terrain clearance of 80 m. The survey was designed to gain a better picture of structure and gross lithology not evident in existing helimagnetic data as well as facilitate the investigation of blind felsic intrusive targets, and to assist in optimizing future drilling campaigns. Data interpretation indicates the presence of a number of felsic bodies in the survey area. Intrepid Geophysics were approached in September 2023 to apply their full-tensor processing workflow on the Falcon airborne (heliborne) gravity gradiometry (AGG) survey data acquired in 2010, across the Cadia Valley Operations. The full-tensor workflow is designed to maximize the AGG data signal to noise ratio to ensure the cleanest possible primary products for input into derived enhancements and other applications. The resultant data processed by Intrepid showed more consistency than the original Fugro data with more detail and less line parallel striations in the data. The processed raster images will be useful in the understanding of fundamental basement faults and the orientation of late intrusions along favorable hydrothermal pathways across Newmont’s tenure. Ground magnetic survey 1992 A ground magnetic survey using Overhauser magnetometers was conducted around the Cadia Hill and Cadia East areas. Newcrest personnel acquired the data on the local grid at 50 m line spacing, using a hip chain to trigger readings every meter. Cadia Valley Operations New South Wales, Australia Technical Report Summary Date: February 2026 Page 7-7 Survey Type Year Note These data were used to help optimize the direction of the initial drilling at Cadia Hill. The data confirmed north–northwest structural and alteration trends extending outwards from limited exposures of quartz veining. Drill holes were oriented normal to this strike, which proved to be the dominant direction of mineralization. In early 1994, 2D and 2.5D inversions were performed on the ground magnetic data at Cadia East, using Geosoft MAGMOD3 software. The models suggested that an earlier 221 m hole drilled by Pacific Copper did not properly test the magnetic ‘high’ anomaly at Cadia East, as seen in the TMI data. As a result, a vertical core hole was drilled to 404 m depth in early 1994 (NC104). The hole intersected magnetite veins, monzonite dikes, and increasing copper grades at depth. Follow-up drilling discovered the Cadia East mineralization under Silurian sedimentary cover. 1994 Partly as a result of the magnetite association with mineralization, the ground magnetic survey work was extended over the entire contiguous Cadia magnetic complex. This included the Ridgeway area northwest of Cadia Hill, where the magnetic complex continued under Tertiary basalt cover. Ground induced polarization 1995 Trial 200 m dipole-dipole induced polarization (IP) surveys were carried out by Scintrex Pty Ltd at Cadia Hill and Cadia East, with the dipole spacing selected to provide adequate depth of investigation. A Scintrex IPR-12 receiver was used, measuring apparent chargeability and resistivity. The Cadia Hill sulfides gave a large response about three times background in the pseudosection. Cadia East, which has a very high pyrite content in an upper disseminated zone (Sulfide Lode), gave a very large response about three times background beneath a minimum of 60 m of cover. Due to the success of these trials, additional lines along strike to the southeast and northwest were acquired. The stronger IP responses measured within the Cadia East area are due to the pyrite-rich Weemalla Formation sediments. The Ridgeway IP anomaly was drilled by RC drilling during 1995, and the drill hole intersected as much as 5% pyrite, with anomalous copper and gold, below the Tertiary cover. Subsequent deeper drilling discovered the Ridgeway deposit, at depths below 500 m. Ground 2D Mount Isa Mines Distributed Acquisition System (MIMDAS) IP and magneto-tellurics (MT) 2018– 2019 Geophysical Resources and Services Pty Ltd (GRS) carried out a survey of 2D MIMDAS IP and MT)to survey four prospects in the greater Cadia area, two of which, Cadia NE and Cadia NW, are within the current Project area. All lines used 200 m spaced receivers with a dipole-dipole configuration. The transmitter dipole locations, also on 200 m intervals, were spaced equidistantly between the receivers. Cadia Valley Operations New South Wales, Australia Technical Report Summary Date: February 2026 Page 7-8 Survey Type Year Note Ground 3D MIMDAS IP and MT survey 2023 GRS were consulted to carry out a 3D MIMDAS IP and MT survey over the Barton Park– Rowan Brae prospects, situated to the northwest of the Ridgeway and Cadia mines. The array used 200 m spaced receivers with a dipole-dipole configuration. The transmitter dipole locations were read on 400 m intervals between the receivers. An additional sulfide discrimination AMIRA-P1245 Spectral IP project is proposed to be run once the final block is completed, providing suitable target and chargeability contrast exists. The survey was completed in November 2023. Preliminary 3D models have been produced with data quality control on the contractor’s final model underway. Geological interpretation of geophysical signatures within the models has also commenced for the purpose of target generation. Ground gravity 1994– 1995 Acquired at nominal 500 m spacing, using digital global positioning system (DGPS) instruments for positioning and levelling. Significant structural trends are evident in the data, especially a northeast-oriented structure in the vicinity of Cadia Hill, and the west over east Cadiangullong thrust fault. Ground magneto-telluric survey 2017 Consisted of two lines, with station spacings at 500 m along lines 1 km apart. Due to the limited nature of the data collected, no evaluations have been done to date. Magneto-telluric survey extensions are planned as part of anticipated MIMDAS IP survey activity. Downhole electromagnetics Downhole transient electromagnetics has been trialed in the Ridgeway area, with data being acquired by Outer Rim using Crone equipment. No off-hole conductors were observed. Physical property measurements 1995– 2023 A significant quantity of physical property information has been acquired, both from well logs, and measurements on core. The information has been used as constraints in geophysical modelling, as well as to assist density characterization for resource calculations. Remnant magnetization measurements were performed on core from the Big and Little Cadia magnetite-bearing skarns. Ground induced polarization/resistivity survey 1997 17 lines of dipole-dipole IP/Resistivity (200m dipoles) over Ridgeway, Cadia and Cadia East. 2005 12 lines of pole-dipole IP/Resistivity (100m dipoles) were collected at Barton Park 2002 A 3D IP/Resistivity survey (100m dipoles) was collected at Gooleys. Ground induced polarization/resistivity survey and ground audio-magneto-telluric survey 2014 3 lines of AMT, 5 lines of pole-dipole, 1 line of offset pole-pole and 3 lines of dipole-dipole were collected at Junction Reefs. Ground induced polarization/resistivity survey 2005 3D 100 m pole-dipole IP/Resistivity surveys were collected at Warrengoong, Gooley’s West and East and also Willow Park.


Cadia Valley Operations New South Wales, Australia Technical Report Summary Date: February 2026 Page 7-9 Figure 7-4: Geophysical Survey Location Plan Note: Figure prepared by Newmont, 2025. Cadia Valley Operations New South Wales, Australia Technical Report Summary Date: February 2026 Page 7-10 Geophysical surveys are principally used to assist with subsurface modelling of lithology and structural frameworks, as well as being used to refine prospect sizes and locations. 7.1.5 Petrology, Mineralogy, and Research Studies Numerous research projects and studies were completed on the Cadia district and deposits within the district. Regional/academic studies were completed that include: • Geochemical vectors to mineralization from hydrothermal alteration minerals such as epidote (green rocks studies); • Evaluation of the relationship of shoshonitic magmatism to gold–copper porphyry mineralization; • Examination of the system architecture of the alkalic porphyry copper deposits in the Cadia area. Multiple petrological studies were conducted as part of broader research studies and to directly understand the mineralogy of the Cadia deposits. Petrology has been completed on selected core and rock samples from Ridgeway, Cadia East, Cadia Hill and numerous exploration prospects. Corescan infra-red and near-infra-red hyperspectral analyses were conducted on selected drill core and RC chips from the Cadia deposits. This technique provides accurate mineralogical information through very high-resolution scanning of the sample and use of specific algorithmic processing of the acquired spectra. This technique can be used to accurately identify hydrothermal alteration minerals that are not readily identifiable during geological logging. As the targeted mineralization styles are well known to have predictably zoned hydrothermal alteration patterns around mineralized centers, being able to identify the mineralogical assemblages of drilling samples can be a useful tool for improving the understanding of the known orebodies and vectoring towards orebodies in exploration. Drill core from the Cadia East and Ridgeway deposits, as well as from regional prospects, were analyzed to assist in this process. 7.1.6 Qualified Person’s Interpretation of the Exploration Information The exploration programs completed to date are appropriate to the style of the deposits and prospects; Exploration potential remains within the Project area, and Newmont is actively exploring using a number of conceptual geological models to drive the exploration activities. Cadia Valley Operations New South Wales, Australia Technical Report Summary Date: February 2026 Page 7-11 7.1.7 Exploration Potential Cadia is a mature district, and the amount of data and geological knowledge that is available is extensive. The exploration programs focus on the following mineralization styles: • Porphyry gold–copper, mainly located on northwest–southeast-oriented structural trends extending outwards from the Cadia deposits. Includes associated pegmatite-related sulfide lenses and breccias; • Gold–base metal quartz–carbonate veins and breccias; • Gold–copper ‘breccia pipes’; • Replacement style magnetite/hematite–copper–gold skarns; • Distal reduced gold skarns. Prospects within the Project area are shown in Figure 7-5. Historically these prospects have broadly been divided into the following target styles: • Porphyry gold–copper, mainly located on northwest–southeast-oriented structural trends extending outwards from the Cadia deposits. Includes associated pegmatite-related sulfide lenses and breccias; • Gold–base metal quartz–carbonate veins and breccias; • Gold–copper ‘breccia pipes’; • Replacement style magnetite/hematite–copper–gold skarns; • Distal reduced gold skarns. Cadia Valley Operations New South Wales, Australia Technical Report Summary Date: February 2026 Page 7-12 Figure 7-5: Regional Prospects Note: Figure prepared by Newmont, 2024.


Cadia Valley Operations New South Wales, Australia Technical Report Summary Date: February 2026 Page 7-13 7.2 Drilling 7.2.1 Overview 7.2.1.1 Drilling on Property Table 7-2 summarizes the drilling to December 31, 2025 on a Project-wide basis. Across all programs, a total of 7,039 drill holes (about 1,772 km), has been completed. A Project-wide drill location plan is included as Figure 7-6. Table 7-2: Project Drill Summary Table by Company Operator Number of Drill Holes Meters Drilled (m) BHP Gold Mines 33 571 Newcrest/Newmont 5,173 1,610,192 Pacific Copper 363 31,690 Unknown 1,470 129,486 Totals 7039 1,771,939 Note: numbers have been rounded to the nearest meter. Cadia Valley Operations New South Wales, Australia Technical Report Summary Date: February 2026 Page 7-14 Figure 7-6: Project Drill Hole Location Plan Note: Figure prepared by Newmont, 2025 Cadia Valley Operations New South Wales, Australia Technical Report Summary Date: February 2026 Page 7-15 Drill types used on a Project basis to December 31, 2025 include core, RC, aircore, rotary air blast (RAB), sonic, and percussion (Table 7-3). Core drilling is the predominant drill type. Table 7-3: Project Drill Summary Table by Area Deposit/Location Drill Types Number of Drill Holes Meters Drilled (m) Big Cadia Core, resource development, RC, percussion, trench, other 500 40,134 Cadia Central Core, resource development 22 9,131 Cadia East(1) Aircore, core, geotechnical, raisebore, resource development, RC, RAB, percussion, sonic, other 2,174 778,667 Cadia Hill Aircore, core, geotechnical, resource development, RC, RAB, percussion, other 1,488 288,208 Cadia Extended (Cadia Quarry) Core, resource development, RC, trench, other 531 118,486 Cadia West Core 6 5,853 Forest Core, RC, other 305 33,753 Four Mile Creek Core, resource development, RC, percussion, other 301 54,039 General exploration Aircore, core, RC, other 64 5,050 Nashdale Core, RC 21 3,245 Paunara Other 624 102,429 Ridgeway Aircore, core, geotechnical, resource development, underground, RC, percussion, RAB, trench, other 998 329,505 Wire Gully Core, resource development 5 3,439 Total 7,039 1,771,939 Note: Numbers have been rounded to the nearest meter. “Other” is assigned to drill holes in the database for which no drill hole purpose was allocated. General exploration includes some RC holes that were assigned to joint venture purposes in the database, but are within the Project mineral tenure outline. Trenches are included in the drill database as dummy drill holes. There are 29 geotechnical inspection and monitoring drill holes that have no recorded metreage in the database. Drill holes are typically coded in the database by drill hole purpose, which can include geotechnical, raise bore, resource development (ResDev), and general underground designations; however, the database may not record the drill hole type for every drill hole. Drill holes for which no purpose or drill type were recorded are tabulated as “other”. The database stores trench data as a dummy drill hole type. The drilling that supports the mineral resource estimates consists of: • Cadia East: 691 drill holes (about 495 km), Table 7-4; • Ridgeway: 495 drill holes (about 232 km), Table 7-5. Cadia Valley Operations New South Wales, Australia Technical Report Summary Date: February 2026 Page 7-16 Table 7-4: Drill Holes Supporting Cadia East Mineral Resource Estimate Drill Type Number of Drill Holes Meters Drilled (m) Core 275 174,639 RAB,RC 3 280 ResDev department 407 317,032 Geotech 6 2,809 Total 691 494,759 Note: numbers have been rounded to the nearest meter Table 7-5: Drill Holes Supporting Ridgeway Mineral Resource Estimate Drill Type Number of Drill Holes Meters Drilled (m) Core 491 228,836 ResDev department 3 3,210 percussion 1 50 Total 495 232,096 Note: numbers have been rounded to the nearest meter Drill collar locations for these drill holes are shown in Figure 7-7 (Cadia) and Figure 7-8 (Ridgeway).


Cadia Valley Operations New South Wales, Australia Technical Report Summary Date: February 2026 Page 7-17 Figure 7-7: Cadia East Drill Hole Location Plan Note: Figure prepared by Newmont, 2025. Due to the block model extents, some drilling that is used in the Ridgeway model is included in the plan view. Cadia Valley Operations New South Wales, Australia Technical Report Summary Date: February 2026 Page 7-18 Figure 7-8: Ridgeway Drill Hole Location Plan Note: Figure prepared by Newmont, 2025. Due to the block model extents, some drilling that is used in the Cadia East model is included in the plan view. Cadia Valley Operations New South Wales, Australia Technical Report Summary Date: February 2026 Page 7-19 7.2.1.2 Drilling Excluded For Estimation Purposes Aircore, sonic, and percussion drill types are not used in mineral resource estimation. The majority of the RAB drilling is excluded; however, there may be instances where RAB drilling that has passed all validation checks may be used. 7.2.1.3 Drilling Since Database Close-out Date The data supporting the Cadia East resource estimate was extracted on May 12, 2025. Since the database closeout, 14 drill holes have been completed for 5,692 m as at December 31, 2025. Drill hole locations are shown on Figure 7 9. Recent drilling and assaying has been completed within PC1–3 and PC3–1 cave volumes. Additional drilling located in PC1–3 was completed to increase the level of in-situ geological confidence and is expected to have only a local impact on grade. Drilling proximal to PC3–1 and the margins of mineralization at depth is expected to have a larger impact on the resource model, when incorporated, due to the wide drill spacing. Changes may occur in the locations of the bounding lithological contacts, to the grades assumed on the edges of the cave design, and to mine planning optimization of higher grades in the upper portion of the lift. The data supporting the Ridgeway mineral resource estimate was extracted on February 28, 2025. Thirteen drill holes have been completed for 7,943 m post the database close-out date to December 31, 2025 (Figure 7-9). The holes have been drilled and assayed for a variety of reasons, including resource definition and to delineate the mineralization within the Weemalla sequence and evaluate the continuity and geometry of the orebody at depth. Cadia Valley Operations New South Wales, Australia Technical Report Summary Date: February 2026 Page 7-20 Figure 7-9: Drilling Since Cadia East Database Closeout Date Note: Figure prepared by Newmont, 2025.


Cadia Valley Operations New South Wales, Australia Technical Report Summary Date: February 2026 Page 7-21 7.2.2 Drill Methods The drilling of the Cadia East deposit includes drill core of the following sizes, NQ3 (47.6 mm core diameter), HQ3 (63.5 mm) and PQ (85 mm). Drilling at Ridgeway is predominantly LTK60 (44.0 mm), NQ (47.6 mm) or HQ (63.5 mm) core sizes. Most drill holes are collared at PQ or HQ sizes for accurate and safe drilling. The drill hole size is then reduced at the geologist’s discretion as the drill hole advances. All recent drilling is orientated using the Reflex Orientation tool (ACT III). During logging the length (or number) of consistently oriented runs provides a gauge of the reliability of oriented core. Core drilling in the 2000s was oriented using the BallMark orientation system or the ACE electronic (accelerometer) tool. During early programs, drill holes were oriented using a chinagraph spear on three consecutive runs at defined intervals. All recent core drilling retrieves the core using triple-tube splits for enhanced recovery and protection from core loss. Surface RC drilling has historically been used for infill resource definition on occasion; however, geotechnical data is not collected from RC drilling. Percussion, RC, aircore, and RAB drilling techniques have been used, where Project requirements and objectives allow; however, currently core drilling is the preferred drill method. 7.2.3 Logging Early logging (pre-2000) was conducted on 1 m intervals. Geological logging style and quality is dependent on the drill program and date. Logging completed prior to 1995 was recorded on paper logs. Only Newcrest drill holes after 1995 are electronically recorded in acQuire. For Newmont programs after 2000, lithology is logged on a variable interval basis with intervals determined from combinations of rock type, alteration, structure, and mineralization. Geological logging is performed using acQuire software to record observations made on core and percussion chips onto laptop computers. Procedures for geological and geotechnical logging are outlined in Newmont’s logging guides. The exploration drill core logging system consists of eight log sheets (windows) into which data are entered. Log sheets include information on the drill collar, lithology, mineralization, alteration, structure, geotechnical, bulk density, and a summary. Lithology is logged based on the geological unit, with subdivision created based on alteration and mineralization. The lithology intervals form the base of lithological models and geotechnical domains. Historically, mineralization was logged on 2 m intervals that corresponded to the 2 m sample intervals. Modern logging records mineralization from short to broad intervals relative to the absence/presence of potentially-economic sulfide content. The structure log is designed to capture major discontinuities such as shears, faults, intrusive contacts, foliation, bedding, and veins. Geotechnical logging includes interpretation and identification of major structures likely to form a discrete failure surface. Unless joints and fractures are related to a larger structure, their logging is recorded as a set. Cadia Valley Operations New South Wales, Australia Technical Report Summary Date: February 2026 Page 7-22 Detailed geotechnical data collection is not routinely obtained from all core drill holes; however, basic geotechnical parameters such as rock quality designation (RQD), recovery and fracture frequency are collected. Logging information is recorded directly from the digital loggers. The software automatically validates the data using validation checking tables to ensure only accepted codes can be entered into specific areas. The acQuire database management software has data entry protocols that ensure the soundness of imported data. Sample identifiers are generated on site and assays are loaded by direct transfer from laboratory, validated by a geologist. All assay results are provided with laboratory certification. All core holes are processed in-house by, in order, orienting, marking-up, then photographing, and cutting for sample assay. In September 2025 a Veracio TruScan unit arrived on site which resulted in a change in workflow. Core processing completed in house is oriented, XRF data is collected, then photography, then mark-up and cutting for sample assay. As this is a trial not all core will be processed with the XRF data capture. 7.2.4 Recovery There are only minor zones of lost core or poor core recovery overall. Core recovery is generally excellent Project-wide, with core recoveries in fresh rock of around 99–100%. Core recoveries are routinely recorded by geologists and core technicians. This is monitored by geological personnel to highlight core loss in mineralized areas. At Cadia East, there are small zones of lost core or poor core recovery. Core loss is largely constrained to surface drilling, with underground drilling returning 99.7% recovery. At Ridgeway, in general, there are only minor zones of lost core or poor core recovery. For the majority of the completed drill holes, core recovery is 100%. 7.2.5 Collar Surveys All drill hole collars were surveyed by Newmont/Newcrest or predecessor company survey staff. Survey methods included theodolite surveys and differential global positioning system (DGPS) instruments. The majority of drill hole collars are recorded by mine surveyors, loaded by the database administrator or geologists, and validated by supervising geologist. Drill holes that require high accuracy are aligned by mine surveyors before commencement of drilling. 7.2.6 Down Hole Surveys Drill holes are normally surveyed using a combination of electronic and gyroscope survey tools. Currently, at Cadia East, single-shot surveys using the Imdex OMNIx42 tool at 15 m or 30 m intervals. At the geologist’s discretion, end-of-hole continuous surveys are requested if there are suspect surveys throughout the hole. Historically, tools such as the FlexIT Smart Tool EMS system (EMS), the Ranger EMS system, and an Eastman camera were used. Cadia Valley Operations New South Wales, Australia Technical Report Summary Date: February 2026 Page 7-23 Down-hole surveys at Ridgeway were collected using a variety of instrumentation, including Eastman Camera, Eastman single-shot, electronic multi-shot, Maxibor, north-seeking gyro, and standard gyro. The majority of underground drill holes were surveyed using the Maxibor optical tool. Gyro surveys were completed by Downhole Surveys Pty Ltd at drill hole completion at down- hole intervals of 5 m. Surveys were completed to as close to total hole depth as possible. 7.2.7 Comment on Material Results and Interpretation Drill spacing in Cadia East ranges from approximately 20 x 20 m in the better drilled deposit areas to about 200 m spacing on the less well drilled portions of the deposit. Ridgeway Deeps drill spacing ranges from approximately 30 x 30 m to about 100 x 100 m. The term “true thickness” is not generally applicable to porphyry-style deposits as the entire rock mass is potentially mineralized and there is often no preferred orientation to the mineralization. In areas that display porphyry-style mineralization, in general, most drill holes intersect mineralized zones at an angle, and the drill hole intercept widths reported for those drill holes are typically greater than the true widths of the mineralization at the drill intercept point. In the opinion of the QP, the quantity and quality of the logged geological data, collar, and downhole survey data collected in the exploration and infill drill programs are sufficient to support mineral resource (Ridgeway) or mineral reserve (Cadia East, Ridgeway) estimation. While dated, the Ridgeway information is considered sufficient for the proposed mining method, based on historical reconciliation. In the QP’s opinion, no material factors were identified with the data collection from the drill programs that could significantly affect mineral resource (Ridgeway) or mineral reserve (Cadia East, Ridgeway) estimation. 7.3 Hydrogeology 7.3.1 Overview The main aquifers in the Cadia region are within fractured systems of the Tertiary basalt and structural zones in the underlying Silurian and Ordovician rocks. The extent of the fractured aquifer system is uncertain, and is dependent on the connectivity of fracture networks, as well as the occurrence of chemical precipitates, or clay infill restricting groundwater flow. The transmission of groundwater within these fractured systems may be enhanced in the weathered zone and restricted at depth, due to a combination of reduced fracture connectivity, narrowing of fracture apertures under overburden stress ,and the absence of weathering. Perched groundwater systems may form at the interface between weathered and fractured units (including Silurian/Ordovician rocks and Tertiary basalt), which overlie fresh massive rock. These systems will drain downslope and emanate as surface seepage typically within creek lines or topographic breaks of slope. Cadia Valley Operations New South Wales, Australia Technical Report Summary Date: February 2026 Page 7-24 7.3.2 Sampling Methods and Laboratory Determinations The Cadia monitoring groundwater monitoring network has continuously expanded over time due to the inherent complexity of fractured bedrock aquifers. Currently there are 149 groundwater monitoring boreholes active within, and surrounding, the Cadia Valley Operations, of which 120 are monitored on a routine basis. Groundwater monitoring is conducted through a comprehensive network of boreholes that span the entire mine lease and adjacent regional areas. In total, 321 groundwater quality samples are collected annually. Monitoring data are collected for the following variables: • Groundwater level (piezometric surface); • Water quality. Groundwater quality sampling is performed in accordance with Australian New Zealand Standard AS/NZS 5667.11. All samples sent for analytical testing are provided to ALS Environmental Division (ALS Environmental), a National Association of Testing Authorities Australia (NATA) certified laboratory, located in Sydney, NSW. ALS Environmental is independent of Newmont. 7.3.3 Comment on Results Groundwater levels are constantly monitored via a telemetry network of 66 monitoring boreholes, providing six hourly data on water levels. Additional to the automated network, site personnel routinely collect water level and quality information on a monthly, quarterly, and annual basis. Information obtained from monitoring is summarized and reviewed by specialist hydrogeology third party consultants every six months. The piezometric surface on a regional scale has been relatively stable over time, with the exception of the steep zone of depressurization that has developed locally around the Cadia Hill Pit, Ridgeway, and Cadia East mines. 7.3.4 Groundwater Models A regional numerical groundwater flow model has been developed to predict impacts from mining and tailings storage at Cadia. This model has been modified, refined, and improved to replicate site conditions and prediction capacity through subsequent updates in 2013, 2016, and 2021. The most recent revision of the groundwater model (using MODFLOW-USG software) occurred in 2021 using monitoring data up to mid-2020. The updated model provides predictions of groundwater level drawdown, inflow to mining areas and pits, leakage from TSFs, and baseflow losses in creeks and streams. A new regional numerical flow model is under development for environmental impact statement (EIS) submission under the Cadia Continued Operational Project and, when finalized, will integrate all of the geological, hydrological, and hydrogeological information gathered after 2021.


Cadia Valley Operations New South Wales, Australia Technical Report Summary Date: February 2026 Page 7-25 7.3.5 Water Balance The site water balance is on average negative and as a result, the site needs to import water to satisfy all the demand requirements. During wet seasons, however, the site water balance becomes positive, capturing more water than required. The climatic cycle from late 2019 to early 2023 resulted in an excess of water on site, primarily stored in the former Cadia pit, which is being used as tailings storage facility. The Goldsim based water balance model simulates water storage, supply, and usage using both historical weather data and projected climatic scenarios. The model incorporates wide range of variables, including initial water storage volume, pumping, and processing rates, triggers, and other site specific parameters. It serves as a forecasting tool for assessing the site water balance over short-term and long-term horizons. Input assumptions include available water sources, water security licenses, anticipated future production rates, water recovery efficiencies, tailings settled density, and overall operational water demand. 7.4 Geotechnical 7.4.1 Overview Most drilling is core drilling with a triple tube configuration, as this suits the mineralization style. Geotechnical data are not collected from RC drill holes. The procedures for geotechnical logging are outlined in an internal guidance document, the Cadia Logging Guide. Core drillers are directed to mark induced breaks in the core so that these breaks are not counted as natural fractures. The geotechnical logger also assesses the breaks and excludes any deemed to be mechanically induced that have not been marked by the core driller. Detailed geotechnical data collection is not routinely obtained from all core drill holes, with the extent of collection dictated by the aims of the individual drilling program, considering the existing geotechnical data proximal to the planned drilling targets. At pre-mining stages when limited data may be available, geotechnical logging and sampling of drill core is prioritized to obtain sufficient data to make an informed geotechnical assessment of the rock mass conditions. At later development stages, rock strength testing and geotechnical logging may not be considered necessary, though all attempts are made to geotechnically log the core if the resources are available. Cadia Valley Operations New South Wales, Australia Technical Report Summary Date: February 2026 Page 7-26 7.4.2 Sampling Methods and Laboratory Determinations 7.4.2.1 Geotechnical Logging Newmont uses acQuire software systems to record and manage geological and geotechnical data. Until April 2021, geotechnical logging was collected in one data entry object that covered rock mass data (e.g., RQD, fracture frequency, intact rock strength) and defect data (e.g., joint, fracture, vein) grouped into sets. From April 2021, the rock mass and defect data have been separated into two data entry objects (rock mass and defects), with the defect data collected per defect (and not as sets within a defined interval) to allow for fracture spacing analysis to be undertaken and average spacing to be calculated. 7.4.2.2 Laboratory Rock Strength Testing Where considered necessary by the geotechnical department, core specimens are sent to a NATA-accredited laboratory for rock strength testing. These tests routinely include uni-axial compressive, tri-axial compressive and tensile strength tests, with specialty testing (e.g., raise bore index, CERCHAR abrasivity index) as required for the drill hole purpose. 7.4.2.3 On-site Point Load Testing Selected drill holes are point load tested at the on-site core processing facility using a Geosystems PLT-10 point load tester to obtain point load strength index (Is50) data. This is usually done systematically (every 1–2 m, on the meter mark) to remove sample selection bias and to facilitate determining rock mass strength at various scales through synthetic rock mass modelling, in addition to providing an intact rock strength determination at the tested depth. 7.4.3 Comment on Results The geological hard rock setting at Cadia East and Ridgeway is well understood and displays reasonable consistency through the spatial extent of the host sequences. Where this is not the case due to geotechnical conditions or alteration (e.g. Ca-La Fracture Zones), these areas are well defined and domained accordingly. To date, the geotechnical data collection programs have provided data suitable for use in the mining operations, with this data used in various geotechnical models (e.g., RMR, Q’, P32 and Is50) that inform at both tunnel (development design) and cave/mine-wide (e.g., subsidence, flow, fragmentation, propagation, and seismic hazard) scale. Cadia Valley Operations New South Wales, Australia Technical Report Summary Date: February 2026 Page 8-1 8.0 SAMPLE PREPARATION, ANALYSES, AND SECURITY 8.1 Sampling Methods 8.1.1 RC RC drilling is used sparingly. When drilled, samples were taken on 1 m intervals in pre-2000 drill programs. Splits were retained in calico bags and placed on spoil piles on the ground. Samples were composited to 4 m from the spoil piles. If anomalous grades were returned, the 1 m splits were analyzed. Post 2000, 2–5 kg samples were collected through a 1:8 riffle splitter attached to the rig cyclone. 8.1.2 Core Intact and competent drill core was cut in half along the cut-line using a diamond saw. Where the core was too soft to be cut with a diamond saw, a knife was used. Where the core was too broken or brittle to be cut by the saw, the fragments were manually sampled. Typically core was sampled on 2 m intervals. For some locations and historic periods sampling was completed on 1 m intervals. 8.1.3 Grade Control Grade control drilling cannot be conducted in block or panel mines once caving is initiated. Historically, close spaced cave pre-conditioning drilling was completed to facilitate ground mass fracturing. The core was logged and assayed as grade control drilling. 8.1.4 Production Sampling At Cadia East and Ridgeway production sampling from drawpoints is predominantly used in reconciliation. Production sampling within Cadia East consists of 3–8 kg samples, collected and screened from drawpoints at a target rate of one sample per 2,000 t mined. 8.2 Sample Security Methods Sample security at the Cadia Valley Operations has not previously been monitored. Historically, sample collection from drill point to laboratory relied upon the fact that samples were either always attended to, or stored in the locked on-site preparation facility, or stored in a secure area prior to laboratory shipment. In June 2023, the core processing facility transitioned to a boom gate security system, which is activated when persons entering the location are ‘tagged on’ and logged into the site. This allows for the monitoring of all personnel entering the sample preparation area. Cadia Valley Operations New South Wales, Australia Technical Report Summary Date: February 2026 Page 8-2 Chain-of-custody procedures consist of sample submittal forms to be sent to the laboratory with sample shipments to ensure that all samples are received by the laboratory. Three core yards are currently in use: • Mine site core processing facility: secure facility used for core processing (logging, sampling); • Mine site core storage facility: approximately 2 km north of the mine site processing yard; designated yard used to store core following processing at the mine site facility; • Exploration yard: about 5 km northeast of the mine site core processing facility; used for exploration core processing and storage. Site personnel have a system of ordering the archival core. Exploration core tray locations are recorded. Pulps and coarse rejects are delivered to the Corfe Processing Facility and Exploration Yard in shrink wrapped (plastic wrapping) pallets. Exploration and resource definition drilling pulps are sorted and housed within sea containers or sheds for permanent storage. Grade control pulps (drawpoint and/or face samples) are stored for a period of six months before disposal. 8.3 Density Determinations Intervals for bulk density determination are selected according to lithology, alteration, and mineralization considerations. Density determinations are performed on site by geologists or geological assistants as part of the logging process, and use the water immersion method. Depending on the deposit and the geotechnical conditions encountered, measurements are generally taken at 20–50 m intervals down hole. Density measurements are statistically analyzed during the estimation process, with outlying or erroneous data excluded from any calculations or estimations. There were 16,056 density determinations in the database for Cadia East as at May 12, 2025. These range from 117–to 5.26 t/m3, with a mean of 2.76 t/m3, and median of 2.76 t/m3. There were 7,913 density determinations in the database for Ridgeway as at February 28 , 2025. These range from 2–4.7 t/m3, with a mean of 2.80 t/m3, and median of 2.79 t/m3. 8.4 Analytical and Test Laboratories A number of laboratories were used during the exploration and operational history: • Analabs, located in Townsville (Analabs): used as the primary laboratory in early campaigns from 1998–2000. Laboratory was independent of Newmont/Newcrest. Accreditations during the time used are not recorded in the Project database; • AMDEL, located in Orange (AMDEL Orange): used as the primary laboratory for assaying until May 2004. Laboratory was independent of Newmont/Newcrest. Accreditations during the time used are not recorded in the Project database;


Cadia Valley Operations New South Wales, Australia Technical Report Summary Date: February 2026 Page 8-3 • AMDEL, located in Perth (AMDEL Perth): noted to have been used for primary assay of two drill holes from Ridgeway in 2005–2006. Laboratory was independent of Newmont/Newcrest. Accreditations during the time used are not recorded in the Project database. There is no information as to sample preparation or analytical protocols used; • ALS Chemex, located in Orange (ALS Orange): used from May 2004 until May 2010 as a primary laboratory, and since September 2023, currently used for exploration and resource definition assays. Laboratory was independent of Newmont/Newcrest. ALS Orange and ALS Brisbane are currently used as the primary laboratories for all resource definition core samples. Preparation and fire assay is performed at ALS Orange. Pulp samples, prepared at ALS Orange, are currently being sent on to ALS Brisbane for multi-element assay. Both ALS laboratories are ISO 17025-2005 accredited for specific analytical methods and ISO 9001:2015 accredited; • Newmont Services Laboratory, located in Orange (NSLO): used as the primary laboratory for resource sample analysis from June 2010–2023. Currently, the NSLO is used as the primary laboratory for production drawpoint and development samples, and infill drilling.; • Intertek Laboratory, located in Perth, Western Australia (Intertek Perth): used as check laboratory from 2018–2023. Laboratory is independent of Newmont/Newcrest. ISO 17025 accredited for specific analytical methods. Earlier in the Project history, check assays were completed at Genalysis in Townsville, AAL in Orange, Analabs in Townsville, and ALS Chemex in Townsville. Genalysis is now owned by the Intertek Group. Laboratory accreditations at the time used are not recorded in the Project database. All of these laboratories were independent of Newmont/Newcrest. Only a limited number of samples were generated by exploration activities in 2024–2025. As a result, no check assays were completed. Once there are sufficient samples to warrant the check assay program being re-instated, and a currently underway internal transfer of data handling from the mine geology team to the exploration geology team is completed, Newmont intends to select and use an appropriate laboratory for the check programs. 8.5 Sample Preparation Sample preparation methods have some variations over time. For sample preparation prior to April 2009, where known, the overall sample preparation procedure typically included: • Weighing and oven-drying; • Crushing to 2 mm; • Pulverizing to 90% passing 75 µm. From 2009 the sample preparation procedure has typically been: • Weighing and oven-drying; • Crushing to 3.5 mm; Cadia Valley Operations New South Wales, Australia Technical Report Summary Date: February 2026 Page 8-4 • Pulverizing to 95% passing 106 µm. 8.6 Analysis Sample preparation and analytical methods varied over time. Elemental detection limits varied depending on the element being analyzed, the laboratory performing the analysis, and the digestion and analytical method used. Where known, prior to 2016, samples were generally assayed as follows: • Gold determined using fire assay and atomic absorption spectroscopy (AAS); • Copper in the Ridgeway deposit area was initially determined by multi-acid digest with AAS finish; • Copper determined by inductively coupled plasma–optical emission spectrometry (ICP– OES). Ore grade (>1%) mixed acid digest for Cu ≥1% with flame AAS finish; • Sulfur, iron, molybdenum, lead, zinc grades determined by ICP–OES; • Cyanide-soluble copper (CuCN) determined by flame AAS. Results were recorded electronically and uploaded to the resource database for checking and validation. Analytical methods from 2016 onward include: • Fire assay using a nominal 30 g or 50 g sample charge, four-acid digest/AAS read, two-acid digest/OES read for grade control samples; • Copper determined by ICP–OES after four-acid digest; • Ag, As, Bi, Co, Fe, Ni, Pb, Sn, Zn and S determined by ICP–OES after four-acid digest; • F determined by combustion ion chromatography; • Multi-element geochemical analysis by ICP-MS and ICP-OES after four-acid digest; • S >10% by combustion analysis (furnace and infra-red absorption); • CuCN (solution strength 0.4% CN/sample weight 0.2 g and time four-hour leach). 8.7 Quality Assurance and Quality Control 8.7.1 QA/QC Procedures A comprehensive QA/QC program is in place for sample analysis. Metallurgy and waste characterization are generally determined once assays have been received, validated, and interpreted. Cadia Valley Operations New South Wales, Australia Technical Report Summary Date: February 2026 Page 8-5 The QA/QC procedures currently involve some or all of the following: • Received sample weights; • Standard reference material (SRMs) at a rate of 1:20. • Field duplicates from the original sample (The other half of the core) at a rate of 1:20. • Duplicates from the crusher coarse splits at rate of 1:20. • Duplicates from the pulverizer pulp at rate of 1:20. • Checks on grind and crush size from the sample preparation steps; • Insertion of blank samples at a rate of 1:40. • Replicate submissions of pulps to an alternative laboratory for analysis; The procedures also include visits to the laboratory for confirmation of actual procedures applied, and monthly QA/QC meetings with laboratory personnel. A monthly report is prepared for the site Superintendent – Geology detailing QA/QC performance and reports are prepared to support the documentation of the mineral resource estimates. All assays are checked and verified in accordance with QA/QC and database management procedures. Sample identifiers are generated on site and assays are loaded by direct transfer from one of the laboratories, then validated by a geologist. All assay results are also provided with laboratory certification. Logging information is transferred directly from the digital loggers. A validation checking table ensures only valid codes can be entered to specific areas. The acQuire database management software has data entry protocols that ensure the validity of imported data. 8.7.2 Current QA/QC Reviews 8.7.2.1 Short-Term Control Measures and Reporting Weekly monitoring of key metrics including SRMs and blanks have been recorded by the sites on the corporate server since November 2011 and that process was in place as at December 31, 2025. A log of non-compliant laboratory batches with associated actions has been filed on the corporate server since December 2013. 8.7.2.2 Longer-Term Control Measures and Reporting From November 2010 to June 2017, the corporate QA/QC specialist prepared monthly consolidated assay reviews that highlighted improvements and issues needing attention. This reporting was accompanied by individual QA/QC reviews of assays used for resource modelling. These reports are filed on the corporate server and were reviewed by the QA/QC specialist to investigate any issues requiring improvement actions. Cadia Valley Operations New South Wales, Australia Technical Report Summary Date: February 2026 Page 8-6 From June 2017 to July 2019, the procedure was modified such that all reporting was done by the mine site on a monthly basis. A corporate review of the monitoring was conducted in July 2019. From July 2019 onward, monthly site-based reporting was undertaken, and all reports were filed on the Newmont server and reviewed by the geology superintendent. 8.7.3 Analytical QA/QC Review All resource drill hole data are checked as the batch is loaded and any errors are corrected if possible. Errors that could have an effect on either the geological interpretation or the resource model trigger re-assaying of all or part of the analytical job. 8.8 Database Data are stored in a SQL server database using acQuire software. Assay data and geological data are electronically loaded into acQuire and the database is replicated in a centralized database system. Regular reviews of data quality are conducted by site and corporate teams prior to resource estimation, in addition to external reviews. The databases are regularly backed up, and copies are stored both offsite and in Newmont facilities. 8.9 Qualified Person’s Opinion on Sample Preparation, Security, and Analytical Procedures In the opinion of the QP, the sample methods, including preparation, analysis, and security practices and results are acceptable, are in line with industry-accepted practices, and are adequate to support mineral resource and mineral reserve estimation and mine planning purposes at Cadia East and Ridgeway, based on the following: • Drill sampling was adequately spaced to first define, then infill, gold, copper, silver and molybdenum (Cadia East) and gold and copper (Ridgeway) anomalies to produce prospect- scale and deposit-scale drill data; • Sample preparation for core samples has followed a similar procedure since Newmont/Newcrest’s Project involvement. The preparation procedure is in line with industry- standard methods; • Analytical methods for core samples used similar procedures for the core drill programs. The analytical procedure is in line with industry-standard methods; • Newmont/Newcrest used a QA/QC program comprising blank, SRM and duplicate samples. QA/QC submission rates are typical for the program at the time the data were collected. Evaluations of the QA/QC data do not indicate any material problems with the analytical programs; therefore, the gold, copper, silver and molybdenum (Cadia East) and gold and


Cadia Valley Operations New South Wales, Australia Technical Report Summary Date: February 2026 Page 8-7 copper (Ridgeway) analyses from the core drilling are suitable for inclusion in mineral resource estimates; • Data collected prior to the introduction of digital logging were subject to validation, using inbuilt program triggers that automatically checked data on upload to the database; • Verification is performed on all digitally-collected data on upload to the main database, and includes checks on surveys, collar co-ordinates, lithology, and assay data. The checks are appropriate, and consistent with industry standards; • Sample security has relied upon the fact that the samples were always attended or locked in the on-site sample preparation facility. Chain-of-custody procedures consist of filling out sample submittal forms that are sent to the laboratory with sample shipments to make certain that all samples are received by the laboratory; • Current sample storage procedures and storage areas are consistent with industry norms. Cadia Valley Operations New South Wales, Australia Technical Report Summary Date: February 2026 Page 9-1 9.0 DATA VERIFICATION 9.1 Internal Data Verification Internal data verification measures on information included in the database are summarized in Table 9-1. Table 9-1: Internal Data Verification Measures Verification Area Note Laboratory inspections Regularly conducted by the Newmont Operations chemist. Intertek Perth: 2013, 2017, 2018, 2019, 2021, 2023; ALS Orange: 2023; ALS Brisbane: 2023; Newmont Laboratory Service in Orange (NLSO): annually. Round-robin laboratory checks Run quarterly by Geostats Pty Ltd (Geostats), an independent third-party organization that undertakes world-wide assay programs. The NSLO participates in Geostats’ programs on a six-monthly basis, and has performed within expected industry standards. The most recent program participation report was dated October 2023. Data verification All data and interpretative inputs to mineral resource models are checked and verified in accordance with a range of site operating procedures and governance standards. Database review In-house team check, verify and validate new data and to ensure the integrity of the total resource database. Day-to-day management of the data is undertaken by geologists on site using the acQuire database system. Resource model reviews The following detailed data review was carried out for the current resource models: validation of collar surveys against the DTM; downhole surveys consistency of hole path; missing or overlapping intervals; presence of negative values; depth of the assayed holes compared to the hole depth stored with the collar details; silver assay values and detection limits; removal and correction of duplicate assays stored in database as primary assays. All corrections were completed before final data extraction for input into the mineral resource estimate. 9.1.1 Mineral Resource and Mineral Reserve Estimates Newmont established a system of “layered responsibility” for documenting the information supporting the mineral resource and mineral reserve estimates, describing the methods used, and ensuring the validity of the estimates. The concept of a system of “layered responsibility” is that individuals at each level within the organization assume responsibility, through a sign-off or certification process, for the work relating to preparation of mineral resource and mineral reserve estimates that they are most actively involved in. Cadia Valley Operations New South Wales, Australia Technical Report Summary Date: February 2026 Page 9-2 9.1.2 Reconciliation Newmont staff have performed a number of internal studies and reports in support of mineral resource and mineral reserve estimation. These include reviews of the reconciliation and mixing model, drill hole spacing evaluations, ventilation, and long-range plan reviews. 9.1.3 Mineral Resource and Mineral Reserve Review Newmont completed a Reserve and Resource Review (3R) audit in 2023, which examined • Geological model; • Geostatistical assumptions; • Confidence classifications; • Assumptions used when assessing reasonable prospects of economic extraction; • Inferred not included in mine plan; • Cave design; • Geotechnical and hydrogeological assumptions; • Throughput rates and metallurgical recovery assumptions; • Capital and operating costs; • Sustainability; • Mine plan and production schedule; • Tailings; • Review of risks and opportunities. 9.1.4 Subject Matter Expert Reviews The QP requested that information, conclusions, and recommendations presented in the body of this Report be reviewed by Newmont experts or experts retained by Newmont in each discipline area as a further level of data verification. Peer reviewers were requested to cross-check all numerical data, flag any data omissions or errors, review the manner in which the data were reported in the technical report summary, check the interpretations arising from the data as presented in the report, and were asked to review that the QP’s opinions stated as required in certain Report chapters were supported by the data and by Newmont’s future intentions and Project planning. Feedback from the subject matter experts was incorporated into the Report as required. Cadia Valley Operations New South Wales, Australia Technical Report Summary Date: February 2026 Page 9-3 9.2 External Data Verification A number of external data verification programs have been undertaken and are summarized in Table 9-2. Table 9-2: External Data Verification Programs Year Consultant Review Findings and Notes December 2011 Minffordd Pty Ltd acQuire resource development database No material issues were identified following the review. March 2013 acQuire Technology Solutions Resource development and ore control databases No material issues were noted with either database. 2015 SRK Cadia Extended and Big Cadia resource estimates No material issues were identified following the reviews. September 2015 Agoratek International Consultants Inc. (Agoratek) investigate possible causes for underground mine to mill variances in grade at Cadia East No material issues were identified following the reviews, with several recommendations actioned. 2016 SRK 2016 Cadia East resource model No material issues were identified with the gold, copper, molybdenum, or silver estimates following the review. July 2016 Agoratek Investigate behavior of coarse and gravity recoverable gold in the plant processing streams and determining whether some of it could escape the successive sampling stages between mine and ship No material issues were identified following the reviews, with several recommendations actioned. March 2018 Agoratek Review Cadia East geological draw point sampling method, sample weight, sample frequency, sample size fraction The current sampling methodology is adequate in most areas when followed. Some improvements were recommended for the process. July 2018 Agoratek Validate the drawpoint sampling practice at Cadia East, by reviewing recently acquired, new experimental data Noted that the current drawpoint sampling was globally correct and satisfactory, with minor recommendations actioned. March 2019 Agoratek Validation of current sampling per cave, deportment of Au, Cu and Mo at each cave, sample frequency, effect of maturation of caves on sampling performance No material issues were identified following the reviews, with several recommendations actioned.


Cadia Valley Operations New South Wales, Australia Technical Report Summary Date: February 2026 Page 9-4 Year Consultant Review Findings and Notes 2021 Derisk Geomining Consultants 2021 Cadia East mineral resource estimate (model) The estimate is robust with no material or immaterial concerns. 2024 Geological Data Design Review of collar and survey location data, geological logging data, and sample and assay data used in the current Cadia East model The exported resource dataset is suitable for use in the resource update 9.3 Data Verification by Qualified Person The QP performed a site visit in September 2025 (refer to Chapter 2.4). Observations made during the visit, in conjunction with discussions with site-based technical staff also support the geological interpretations, and analytical and database quality. The QP’s personal inspection supports the use of the data in mineral resource and mineral reserve estimation, and in mine planning. The QP received reconciliation reports from the operations. Through the review of these reconciliation factors, the QP can accept the use of the data in support of the mineral resource and mineral reserve estimates. 9.4 Qualified Person’s Opinion on Data Adequacy Data that were verified on upload to the database, checked using the layered responsibility protocols, and reviewed by subject matter experts are acceptable for use in mineral resource and mineral reserve estimation. Cadia Valley Operations New South Wales, Australia Technical Report Summary Date: February 2026 Page 10-1 10.0 MINERAL PROCESSING AND METALLURGICAL TESTING 10.1 Introduction Newmont operates two adjacent concentrators, Concentrator 1 and Concentrator 2, currently treating ore from Cadia East mine. Molybdenum is recovered from the copper concentrate at a separate molybdenum plant. Metallurgical testing programs have been conducted since the 1990s to test the amenability of the mineralization to conventional separation processes for gold, copper, and molybdenum. Based on these tests, two concentrators were constructed using conventional flotation and gravity separation methods and have subsequently treated the Cadia Hill, Ridgeway, and Cadia East mineralization. Laboratories and testwork facilities used during metallurgical evaluation included AMML, ALS Townsville, ALS Brisbane, Metso Minerals Process Technology, JKTech, Metcon, Enviromet, Optimet, Amdel, Normet, Lakefield Laboratory (Canada), ALS Burnie, ALS Perth, Aminpro Santiago (Chile), and KYSPYmet. These facilities are independent of Newmont. Metallurgical testwork facilities are typically not accredited for metallurgical testwork techniques. 10.2 Metallurgical Testwork Metallurgical testwork and mineralogical analysis completed on the deposits has included: • Cadia East: optical mineralogy, micro-XRF (µXRF), X-ray diffraction (XRD) and mineral laboratory analysis (MLA); comminution tests (Bond ball work index (BWi), drop weight index (DWi), SAG mill comminution (SMC) tests, rod work index (RWi) and abrasion index (Ai)); gravity testwork; rougher and cleaner flotation tests, primary grind and regrind size sensitivity tests; evaluation of alternate reagents; flash flotation testing, fluorine depression batch flotation tests, and locked cycle flotation tests; • Ridgeway: BWi, DWi, SMC tests; comparison to the original feasibility data; gravity and flotation testing; primary grind and regrind sensitivity flotation tests; and locked cycle confirmatory tests; 10.2.1 Cadia East Initial testwork programs focused on determining the response of Cadia East ores types to the original Concentrator 1 flowsheet designed for processing Cadia Hill open pit ore. Subsequent metallurgical investigation efforts were directed towards improving the understanding of the specific processing needs of the Cadia East mineralization, particularly in regard to maximizing gold recovery and reducing fluorine content in copper concentrate product. A total of 12 campaigns (stages) of bench-scale laboratory testwork were completed between 1995 and 2011. Cadia Valley Operations New South Wales, Australia Technical Report Summary Date: February 2026 Page 10-2 Confirmatory testing of bulk ore samples in a laboratory pilot plant, and also in a plant trial with Cadia East underground ore, was completed in 2008. Testwork conducted from 2015–2021 focused on revising the models used to forecast copper and gold recoveries based on information gathered from further drill sampling, face samples, and the metallurgical response in the process plants from ore provided from the PC1 and PC2 caves. These data were used to update all areas of the orebody to provide a realistic representation of the expected processing performance, and were incorporated into a LOM plan that includes a concentrator throughput increase to 33–35 Mt/a. 10.2.1.1 Sample Selection The mine plan presented in the Cadia East feasibility study recommended two initial panel caves (PC) PC1–1 and PC2–1, to be followed by two larger panel caves, PC1–2 and PC2–2. Samples used in the early testwork (Stages 1 to 8) were core samples mostly sourced relatively high in the PC1–2 cave, consistent with the initial open pit mining concept. Later program stages (Stages 9 to 12) selected material from PC1–1, PC1–2 and an area east of the mine; samples based on lithology and grade, categorized as volcanic, breccia, monzonite, conglomerate, or porphyry; composites with similar grades and expected mineralogy, but not lying within any one particular mining block; and a composite sample sourced from a drill hole intersecting the lower-central, and upper-central portion of the PC2–1 mining block. The 2015–2021 tests included material from panel caves designated as PC1–2, PC1–3, PC2–3, PC3–1 and PC2 (PC2–1 and PC2–2) to reflect updated mine plans. Ongoing geometallurgical testwork programs include PC2 Upper Infill (10 samples), PC1-2 Upper Infill (12 samples), PC2– 3 Lower Infill (10 samples) and PC1–3 prefeasibility study (50 samples). Current programs will continue to apply the standardized geometallurgical testwork program that has been in use since 2016. 10.2.1.2 Testwork Summary Key findings from the 1995–2011 test work programs that informed early stages of the process design for Cadia East, and hence planned upgrades to the existing Cadia Hill and Ridgeway Concentrators include: • Two geometallurgical domains were identified, a fine-grained, disseminated, predominantly chalcopyrite domain near surface and a deeper, sheeted vein domain, predominantly consisting of bornite. Pyrite was present but more prolific at the edges of the deposit and gold was present as free gold or attached to copper minerals. Fluorite was identified as a gangue mineral; • Comminution test work identified the Cadia East ores to be generally harder than those from Cadia Hill and Ridgeway. The 75th percentile DWi value was 10. The BWi was 20.6 kWh/t compared to 18.6 kWh/t for Ridgeway; • Gravity gold recovery tests were undertaken, confirming that a reasonable proportion of gold could be recovered using the existing gravity circuits; Cadia Valley Operations New South Wales, Australia Technical Report Summary Date: February 2026 Page 10-3 • Flotation testing initially focused on a primary grind size P80 of 150 μm and regrinding to a P80 of 38 μm ahead of cleaning. Both laboratory, pilot plant, and industrial scale (processing a parcel of Cadia East ore through the existing concentrator) demonstrated that marketable grade copper concentrates 20–25 % Cu could be produced using the existing flotation circuit with few modifications. Table 10-1 provides a summary of the 1995–2011 testwork. Table 10-2 provides a summary of the 2015–2021 testwork results that support the current LOM plan designs. Results for work currently underway are not included in Table 10-2. Table 10-1: Cadia East Testwork Summary (1995–2011) Test Notes Optical mineralogy, X- ray diffraction, and mineral laboratory analysis Identified two geometallurgical domains: a finer grained, disseminated chalcopyrite domain, predominantly near surface; and sheeted veining, containing bornite, predominantly at depth. Both chalcopyrite and bornite were observed to be relatively coarse grained. Pyrite content is variable but tends to be higher at the periphery of the orebody. Gold occurs as either fine grained free gold or attached to the copper minerals. Gangue minerals present include fluorine containing minerals sericite and fluorite, as well as minor apatite and biotite. The mineralogy of the fluorine containing minerals is important with regards to meeting concentrate fluorine specifications. DWi; SAG mill competency The 75th percentile value for the DWi results was calculated to be 10.0, and was used in flowsheet design. This represented approximately 20% increased energy demand when compared with Cadia Hill ore with a typical value of 8.1. BWi BWi average for all tests was 20.6 kWh/t, which is higher than the typical values of 17.5 kWh/t for Cadia Hill ores and 18.7 kWh/t for Ridgeway ores. The 75th percentile value of 21.5 kWh/t was used for plant design. Rod work index (RWi) RWi average of all tests was 29.1 kWh/t and is therefore over 40% harder than the typical values of 20 kWh/t for Cadia Hill ores, and 21 kWh/t for Ridgeway ores. The 75th percentile value of 31.1 kWh/t was used for plant design. Abrasion index (Ai) The average from all tests was 0.193, which is lower than typical values for Cadia Hill and Ridgeway, indicating that the Cadia East underground ore is less abrasive. A value of 0.21 was used in design. High pressure grinding rolls (HPGR) Tests were encouraging. Design parameters were determined for inclusion of a HGPR circuit to reduce ore sizing ahead of the semi-autogenous grind (SAG) mill. Gravity recoverable gold Recovery increases with increasing gold head grade; recovery increases at finer grind sizes. Based on a primary grind size of P80 = 150 μm the following relationship was proposed: For gold head grade < 0.5 g/t: gravity gold recovery (%) = 22.9 x Au + 0.54; For gold head grade > 0.5 g/t: gravity gold recovery (%) = 5.0365 x Au + 10.94. Flotation testing Design primary grind size of P80 = 150 μm selected. Regrinding testwork indicated a requirement for rougher and scavenger concentrates to be reground to a particle size of P80 = 38 μm for optimum copper recovery. Concentrate regrinding at a size of P80 = 38 μm results in concentrate with fluorine content near to, or above, the rejection limit in most samples. A nominal regrind size of


Cadia Valley Operations New South Wales, Australia Technical Report Summary Date: February 2026 Page 10-4 Test Notes 25 μm was shown to reduce fluorine to more acceptable levels, but at the expense of copper and gold recovery. Other elements of potential concern in final concentrate quality as determined in batch tests were chlorine, mercury, and molybdenum. However, mercury levels from both piloting and a plant trial were satisfactory, and molybdenum can be recovered from concentrate as a by-product, leaving fluorine and chlorine as the principal elements to be managed. The Cadia East ore types are composed of a finer mineral grain structure than the Cadia Hill and Ridgeway ores, resulting in slower flotation kinetics. Flotation recovery models for gold and copper were developed based on batch tests, but it was noted that variability within the models was high. The major driver for higher gold recovery was found to be gold grade of feed, and likewise copper head grade was found to be the major driver for higher copper recovery. Flotation piloting of four ore types resulted in copper recoveries varying between 85% and 94%, at concentrate grades of 19.9% to 25.5% Cu. A plant trial with underground ore resulted in recoveries of 80.1% for gold and 83.6% for copper. Evaluation of alternative reagent schemes resulted in the standard Cadia Hill flotation reagent suite, consisting of Cytec 8761 collector and MIBC frother, being used as the basis of flotation design. Table 10-2: Cadia East Testwork Summary (2015–2021) Test Notes Mineralogy PC1-2 samples exhibit consistency in their general mineralogy. Mineralogical evaluation of PC1-2 ores indicates that chalcopyrite is the dominant CuS mineral; no anomalous Cu mineralogy was detected. There does not appear to be variation in mineral abundances with location within the cave; however, the CuS association data indicates that there are distinct spatial zones of differing mineral association. This regional difference is further supported by the analysis of CuS grain size data. PC1-2 ores contain higher levels of pyrite than PC2, but similar levels to PC1-1 and PC2-3 ores. The pyrite to copper sulfide ratio in PC1-2 is higher than other caves due to lower copper mineralization. The ores tested under the feasibility study cover a wide range of sulfide mineral ratios and grades, which should provide a sound basis for the recovery modelling work. Mineralogical evaluation of PC2-3 ores indicates that chalcopyrite is the dominant CuS mineral in PC2-3 ores. No anomalous Cu mineralogy was detected, with chalcopyrite and bornite the only significant Cu species. PC2-3 is considered to be a high Cu, low Au zone. Plant Cu recovery is anticipated to be higher than PC1-1 and PC2 ores currently being processed, commensurate with PC2-3’s higher average Cu head grade (0.42% versus 0.32% Cu for PC2). PC2-3 has the highest Mo head grade of all Cadia East mining zones and this Mo is observed to be present in a similar form to that found in all other samples analyzed for Cadia to date, ranging from disseminated grains at low grades through to clustered at higher grades. 138 samples have been tested for mineralogy across the Cadia East deposit. Comminution All ores are generally categorized as ‘hard’. Ores that have previously been processed are represented by PC1 and PC2 belt cut data tested routinely. The remaining ores in PC1–2, PC2–3 and PC3–1 are all harder than any ore processed to date. The updated hardness values were incorporated into the LOM plan. Cadia Valley Operations New South Wales, Australia Technical Report Summary Date: February 2026 Page 10-5 Test Notes Recoveries The metallurgical performance of Cadia East has been tested using diamond drill core samples primarily using the mineral laboratory AMML (formally known as Metcon). All recovery figures quoted as based on a laboratory batch flotation test at 150 μm primary grind size. Detailed recovery and mineralogical investigations conducted through the pre-feasibility and feasibility studies of the mine macro blocks has determined the following: • Gold recovery is mineralogically driven by association with copper sulfide grains. Gold recovery is modelled using spatial location and Au assays to estimate Au recovery. • Copper recovery is mineralogically driven by copper sulfide grain size. Copper recovery model uses spatial location and Cu assay to estimate Cu recovery. • Molybdenum recovery is driven by Mo grain type, which corresponds to increases in head grade. Mo flotation response is observed to be aligned with changes in grain type and consequently, head assay with an inflection point observed at 70 and 300 ppm in the feed. 69 samples were geometallurgical tested within PC2. The average gold head grade of ore samples tested from PC2 was 1.30 g/t, ranging from 0.12–5.11 g/t. The average copper head grade of ores tested from PC2 was 0.47%, ranging from 0.12–0.94%. The average gold recovery of PC2 ores was 84.8% over the total flotation time. The average copper recovery of PC2 ores was 91.6% over the total flotation time. 36 samples were geometallurgical tested within PC2-3. The average gold head grade for ores tested from PC2–3 is 0.36 g/t, ranging from 0.01–1.58 g/t. The average copper head grade for ores tested from PC2–3 is 0.41%, ranging from 0.09–0.97%. The average Au recovery of PC2–3 ores is 83.5% Au recovery over the total flotation time. In general, PC2–3 ores are performing consistently in terms of their gold recovery. The copper recovery performance of PC2–3 ores can be considered high, averaging 91.6% over the total flotation time, which is the highest copper recoveries of all ores tested. 90 samples were geometallurgical tested within PC1-2. The average gold head grade for ores tested from PC1–2 was 0.52 g/t, ranging from 0. 04–2.47 g/t. The average copper head grade of ores tested from PC1–2 was 0.22%, ranging from 0.09–0.69%. The gold recovery performance of PC1–2 ores have the highest recoveries from all ores tested, averaging 85.6% over the total flotation time. The copper recovery performance of PC1-2E ores can be considered high, averaging 90.4% Cu recovery over the total flotation time. 26 samples were geometallurgical tested within PC3-1. The average gold head grade of ores tested from PC3–1 is 0.77 g/t, ranging from 0.18–3.21 g/t. The average copper head grade of ores tested from PC3–1 is 0.42%, ranging from 0.19–0.75%. The average gold recovery of PC3–1 ores was 82.7% over the total flotation time, which is the lowest of the ores tested. The average copper recovery of PC3–1 ores tested was 90.0% which is consistent with the recoveries reported for PC2, and the average recovery to the first flotation concentrate of 56.1% is also consistent with PC2 performance, showing slower flotation kinetics than PC1–2. 10.2.2 Ridgeway Concentrator 2 was designed to treat a throughput rate of 4 Mt/a from the Ridgeway underground mine. Testwork was undertaken as part of initial feasibility studies, and the concentrator was commissioned in 2002. The flowsheet included autogenous (AG) grinding, pebble crushing, ball milling, flash float and gravity concentration, rougher flotation, and cleaner flotation to produce Cadia Valley Operations New South Wales, Australia Technical Report Summary Date: February 2026 Page 10-6 gold doré, and marketable gold-rich copper sulfide concentrates. The circuit capacity was progressively increased to 5.6 Mt/a through the conversion of the AG mill to a SAG mill. A regrind mill was installed to improve copper concentrate grades. In 2007, additional phases of metallurgical testwork were undertaken to investigate the predicted metallurgical performance of deeper ore below the 5065 mRL crusher, and to support changes that would result from moving from sub-level caving (SLC) to block caving (Ridgeway Deeps Lift 1). A total of 151 samples were tested across the three separate stages. In 2024, a fourth stage of testwork (12 samples) was completed focusing on the metallurgical performance of sub-level caving in Lift 2 below the Lift 1 block cave (4786 mRL). The testwork procedure for the most recent program was aligned with the current standard that has been in place since 2016. 10.2.2.1 Sample Selection Drill core intervals from a wide range of spatial locations across the deposit were selected and sorted by lithology to prepare five variability lithology composites. The lithology composites were subjected to grind sensitivity flotation testing and locked cycle flotation tests. A master composite sample was used in comminution testing, grind sensitivity flotation tests, gravity/flotation testing, and locked cycle confirmatory tests. The master composite consisted of 33% sediment, 30% volcanic, 21% monzonite, 11% porphyry and 6% monzodiorite lithologies. 10.2.2.2 Testwork Summary Testwork and testwork results are summarized in Table 10-3. Table 10-3: Ridgeway Deeps Testwork Summary Test Notes Bond work index (BWi) The average BWi across Stages 1-4 was 19.1 kWh/t. Sediment material was the hardest ore type averaging 20.1 kWh/t. SAG mill competency (A*b) Impact to breakage resistance was higher for Ridgeway Deeps ore than previous ore mined. The average breakage hardness as defined by a standard comminution parameter (A*b) was 40.1, compared to an equivalent average of 45.5 for previous ore mined. Flotation grind Conducted at sizes between 53–212 µm. Flotation performance of Ridgeway Deeps ore is grind-dependent. Gold recovery is very grind dependent while copper recovery was less dependent. A finer grind in the regrind of rougher flotation concentrate was considered necessary to realize optimum recovery. Grind sensitivity with individual rock types showed differences in sensitivity to grind, with monzonite as the least sensitive, and porphyry the most sensitive. Gravity gold Variable between rock types with mean gravity recoveries ranging between 17% and 26%. Cadia Valley Operations New South Wales, Australia Technical Report Summary Date: February 2026 Page 10-7 Test Notes Locked cycle; rougher flotation copper recovery Locked cycle tests at simulated plant conditions resulted in final concentrate grades ranging from 18–26% copper and copper recoveries ranging between 89–96%. Concentrate Concentrate generally had low levels of penalty elements, but the levels of fluorine and Al2O3+MgO in some samples were of concern. The higher hardness with increasing depth and the change from SLC mining to block cave mining, resulted in a requirement to install more energy in the Concentrator 2 comminution circuit. Comminution modelling showed that installation of a secondary crusher would be required to maintain target throughput. Based on an analysis of all results, the required changes to Concentrator 2 for processing of the deeper ore were determined to be: • Installation of a secondary crusher to allow the mill to maintain 5.6 Mt/a; • Installation of additional grinding capacity to achieve a finer primary grind; • An upgrade of the concentrate regrind circuit to target a concentrate P80 of 38 μm. 10.3 Recovery Estimates 10.3.1 Cadia East The 2015–2021 testwork resulted in mine block-specific gold recovery models being developed for the purpose of forecasting the expected gold recovery on the basis of gold head grade and spatial location. These are summarized in Table 10-4. Table 10-4: Cadia East Gold Recovery Models Area Model/Algorithm PC3–1 & PC2–L (lower) Gold recovery (%) = 76.68 + 2.25 x Ln (Au) PC2–M (middle) PC2–U (upper) Gold recovery (%) = 79.76 + 3.52 x Ln (Au) PC2–3 Low Fe:S group (the majority of ore): Gold recovery (%) = (9.022 – 0.000417 x Y + 0.000210 x Z + 0.0560 x Ln (Au)) x 100; High Fe:S group (a small subset of the ore): Gold recovery (%) = (0.855 + 0.133 x Ln (Au)) x 100. PC1–1 Gold recovery (%) = 80.65 + 2.88 x Ln (Au) PC1–2, PC1–3 Above Carb 2 Fault: Gold recovery (%) = 100 x (0.7499 + 0.0609 x Au (g/t) + 0.0723 x S %) Gold dominant domain: Gold recovery (%) = 24.32 + (0.7 x CuRghrRec%) + 3.67 x Ln(Aug/t:S%) + 3.51 x S% Copper dominant domain: Gold recovery (%) = 1.0 x CuRghrRec% - 8.06


Cadia Valley Operations New South Wales, Australia Technical Report Summary Date: February 2026 Page 10-8 Gold recovery is expected to be lowest for PC3–1 and the lower part of PC2–1. The middle and upper parts of PC2 are expected to have lower gold recoveries than those of the PC1 group ores. Block-specific copper recovery models were developed for the purpose of forecasting the expected copper recovery on the basis of copper head grade and spatial location. These are summarized in Table 10-5. Table 10-5: Cadia East Copper Recovery Models Area Model/Algorithm PC2–M Copper recovery (%) = 90.92 +7.30 x Ln (Cu) PC3–1 Copper recovery (%) = 88.49 + 4.45 x Ln (Cu) PC1–1, PC2–M, PC2–U, PC1-4, PC2-4 & PC2-5 Copper recovery (%) = ((Cu) – 0.067 x (Cu) + 0.0127)) ÷ (Cu) x 100 – 3 PC2–3 Copper recovery (%) = (1.126 + 0.170 x Ln (Cu) – 0.234 x Cu) x 100 PC1–2, PC1–3 Above the Carb 2 Fault: copper recovery (%) = 2.9693 x Ln(Cu x 10000) + 68.216 High recovery domain (massive/vein textured): copper recovery (%) = 1.76 x Ln (Cu) + 95.59 Mixed recovery domain (mixed texture): copper recovery (%) = 4.42 x Ln(Cu) + 93.18 Low recovery domain (disseminated texture): copper recovery (%) = 10.52 x Ln(Cu) + 92.39 Copper recoveries for PC1-2 are expected to be higher than those experienced for PC1–1 ores (baseline). Current experience of lower plant recoveries while treating PC2 lower ores is indicated to be limited to those ores, and copper recoveries are expected to improve as ores from the middle and upper parts of PC2 begin to be processed. PC3–1 is expected to have lower copper recoveries than the PC1–1 ores currently treated. Molybdenum recovery is driven by molybdenite morphology, which is related to increases in head grade. Molybdenite flotation response is observed to have data inflection points at head grades of 70 and 300 ppm in feed. Three models were developed based on these inflection points for molybdenum recovery to copper concentrate: • Mo in feed >70 ppm, recovery (%) = 56.40 + 5.811 x Ln (Mo in ppm); • Mo in feed ≤70 ppm, recovery (%) = 21.047 + 13.788 x Ln (Mo in ppm); • Mo in feed >300 ppm, recovery (%) = 89.5. The overall sliver recovery model for Cadia East ore is: • Silver recovery (%) = 0.81 x gold recovery (%). Cadia Valley Operations New South Wales, Australia Technical Report Summary Date: February 2026 Page 10-9 An optimization testwork program, including both locked cycle tests and piloting was conducted to evaluate whether a saleable molybdenum concentrate could be produced from copper concentrate. The outcomes of this testwork included: • High concentrate grades of >52% Mo were achieved at recoveries up to 96% Mo recovery; • The use of diesel as a molybdenum collector was required to give high molybdenum recoveries; • The inclusion of a Jameson cell in the roughing duty, followed by mechanical rougher scavenger cells, enabled higher concentrate grades in pilot plant test work. A Jameson cell has been included in the plant flowsheet; • Regrinding was shown to be beneficial for both grade and recovery. The gold and copper recovery equations are based on standardized laboratory results. For final anticipated recovery performance, a number of modifying factors are applied in order to account for actual plant performance. These modifying factors account the recovery impact of flowsheet unit processes including Jameson cells, HydroFloat and gravity concentration and plant grind variability. These modifying factors take the form of a copper and gold adjustment of +2–3% for the current concentrators and are included in the recoveries reported. Cadia East gold recovery rates are forecast at approximately 81%, copper recovery rates at approximately 87%, silver recovery rates at approximately 67%, and molybdenum recovery rates (relative to plant feed) of approximately 67%. 10.3.2 Ridgeway The overall copper recovery algorithm for Ridgeway Deeps mineralization is: • Copper recovery (%) = 83.5447 + 8.2837 * Copper head grade (%Cu) + 1.5007 * Cu:S ratio in feed. The overall gold recovery model for Ridgeway Deeps mineralization is: • Gold recovery (%) = 4.0445 x Gold head grade (g/t) + 77.406. The overall sliver recovery model for Ridgeway Deeps mineralization is: • Silver recovery (%) = 0.81 x gold recovery (%). Recovery forecasts for Ridgeway overall are 81% for gold, 88% for copper and 66% for silver. 10.4 Metallurgical Variability Samples selected for metallurgical testing during feasibility and development studies for Cadia East and Ridgeway were representative of the various styles of mineralization within the different deposits. Samples were selected from a range of locations within the deposits. Sufficient samples were taken, and tests were performed using sufficient sample mass for the respective tests undertaken. Cadia Valley Operations New South Wales, Australia Technical Report Summary Date: February 2026 Page 10-10 Variability assessments are supported by mill production and extensive underground exposures. Cadia East and Ridgeway are “well-behaved” porphyry copper deposits where the mineralogical drivers of metallurgical performance are well understood, risks have been recognized and appropriate industry standard mitigating actions are identified. 10.5 Deleterious Elements 10.5.1 Cadia East Fluorine is the main deleterious element identified at Cadia East that could influence concentrate sales and marketing. The average fluorine head grade in the mill feed material is predicted to be 1,500 ppm F, and in the range of 1,200–1,900 ppm F over the LOM. The majority of fluorine is present as fluorite (about 50%) and as biotite-dominant and sericite micas (also about 50%). The relationship between copper concentrate quality and deleterious fluorine content is dependent on the type and quantity of fluorine-bearing minerals. Fluorine-bearing minerals may end up in the concentrate through either of two processes: • Fluorine minerals attached to, or locked within, sulfide or other floating minerals, and recovered into concentrate; • Fluorine minerals recovered into concentrate by entrainment, physically “dragged” in to concentrate by high mass recovery and poor froth washing. Jameson cells were installed in the plant to remove fluorine from the concentrate. The first Jameson cell was installed in Concentrator 1 in 2013, followed by Concentrator 2 in 2016 and another 2 in Concentrator 1 in 2017. Since 2024 all HydroFloat concentrate is directed to dedicated regrind and Jameson cell cleaner. All material within the plant is processed through a Jameson cell, giving maximum fluorine rejection, particularly of the entrained fluorine-bearing minerals, and therefore it is unlikely that fluorine levels in copper concentrate will exceed the maximum contractual limits over the LOM. 10.5.2 Ridgeway During its operating history, Ridgeway produced a high-quality copper concentrate with high gold grades, payable silver credits and relatively low levels of impurities that did not attract a penalty from smelters. There are expected to be no deleterious elements in any Ridgeway concentrates that will trigger penalty payments or rejection rates. This forecast is supported by resource analyses that do not indicate any change in geochemistry which is likely to impact on concentrate sales for the Ridgeway material. Cadia Valley Operations New South Wales, Australia Technical Report Summary Date: February 2026 Page 10-11 10.6 Qualified Person’s Opinion on Data Adequacy The QP notes: • The testwork undertaken is of an adequate level to ensure an appropriate representation of metallurgical characterization and the derivation of corresponding metallurgical recovery factors for Cadia East and Ridgeway. Independent external reviews of its Cadia East geometallurgical program in recent years. Initial metallurgical assumptions are supported by multiple years of production data; • More recent testwork data were used to update all areas of the Cadia East to provide a realistic representation of the performance; • Block-specific gold and copper recovery models were developed for Cadia East for the purpose of forecasting the expected gold recovery on the basis of head grade and spatial location. Each model is customized during pre-feasibility and feasibility studies and are applied to the specific Cadia East mine blocks the models were developed for. Mineralogical drivers have been identified for areas of gold and copper recovery variability linked to copper sulfide grain size; • Molybdenum recovery at Cadia East is driven by molybdenite morphology, which corresponds to increases in head grade. Molybdenum flotation response is observed to be aligned with changes in grain type and consequently, head assay with inflection points observed at 70 and 300 ppm in feed; • Cadia East gold recovery rates are forecast at approximately 80%, copper recovery rates at approximately 86%, silver recovery rates at approximately 67% and molybdenum recovery rates (relative to plant feed) of approximately 67%; • Recoveries for Ridgeway are based on algorithms; gold recovery forecasts for the overall are 81% for gold, 88% for copper and 66% for silver; • Fluorine is the main deleterious element identified at Cadia East that could influence concentrate sales and marketing. Since 2017, all material within Concentrator 1 has been processed through a Jameson cell giving maximum fluorine rejection of fluorine-bearing entrained minerals, and therefore it is considered unlikely that future concentrate will not be able to meet the marketing conditions set by the smelters; • The Ridgeway concentrate was historically clean, very marketable, and had high copper grades. There are expected to be no deleterious elements in any Ridgeway concentrates that will trigger penalty payments or rejection rates. Based on these checks, the geometallurgical testwork, geometallurgical recovery modelling, and reconciliation and historical production data support the estimation of mineral resources and mineral reserves, and the inputs to the economic analysis.


Cadia Valley Operations New South Wales, Australia Technical Report Summary Date: February 2026 Page 11-1 11.0 MINERAL RESOURCE ESTIMATES 11.1 Introduction The following database closeout dates and modelling assumptions apply: • Cadia East: May 12, 2025. The model was constructed from 20 x 20 x 20 m cells, with no sub-celling; • Ridgeway: March 31, 2009. The model was estimated using Datamine software. Modelling used a block size of 25 x 25 x 25 m with sub-celling to 5 x 5 x 5 m. 11.2 Modelling Approach 11.2.1 Cadia East The resource model is based on a structural model and lithological model that uses multi-element geochemistry. Grade shells of 0.1% copper, 0.1 ppm gold, and 20 ppm molybdenum inform the area of mineralization. Cadia East geological wireframes were constructed in Leapfrog software using implicit modelling interpolations from primary logging codes extracted from the acQuire database. A total of five estimation domains were constructed, and were used in the estimation of gold, copper, silver, molybdenum, fluorine, iron, lead, sulfur, and zinc. Ordinary kriging was used as the estimation method for all elements in all domains. Gold, copper, and molybdenum were estimated using locally varying anisotropy (LVA). 11.2.2 Ridgeway The geological inputs for the Ridgeway resource model were constructed by incorporating all available drill holes (surface and underground) and data collected from the underground mining levels. The interpretations were conducted on mining level plans between 5330RL and 4980RL. Level plans were generated in MapInfo and included all “backs” mapping and drill hole data. Major structures and lithologies were interpreted and then digitized for loading into Datamine. Estimation domains were based on lithology and structure inside a mineralized envelope. Individual domains were created for gold, copper, sulfur, and silver. Data were separated into six geological domains, seven structural domains, and six grade domains. The Claudia Fault shows a 150 m offset, and was interpreted to be a hard domain boundary. To accommodate the fault influence, two sub-faults were interpolated, the Deep Purple and Deep Red faults, which had the same relationships and orientations of the faults of the same names above the Claudia Fault. The Deep Red fault was not used to domain grade; however, the Deep Purple fault was a major hard boundary for both mineralization and grade. Cadia Valley Operations New South Wales, Australia Technical Report Summary Date: February 2026 Page 11-2 11.3 Exploratory Data Analysis 11.3.1 Cadia East Core drilling is the primary drill method for Cadia East, with drill holes ranging from PQ through to NQ size. All core drill holes that were captured in the acQuire database under the CE project code were extracted to ensure all holes across the Cadia East deposit were used. Exploration data analysis was completed for all estimated variables. Contact analysis was conducted to assess data sharing across domain boundaries. 11.3.2 Ridgeway The statistical characteristics of the gold, copper and sulfur domains were reviewed for the Ridgeway deposit in 25 m horizontal, east–west and north–south slices through the mineralized system. 11.4 Composites 11.4.1 Cadia East At Cadia East, the drill hole database was composited to 10 m downhole for use in all subsequent analysis and estimation. The length of 10 m was selected as a balance between geological resolution, scale of the mineralization and mining, and the block size used for estimation (20 x 20 x 20 m). The composites are distributed evenly, to ensure all sampling is retained. Missing assay values were removed or ignored during compositing. The drill hole database is first composited, and then flagged by the final estimation domains. Checks were completed on the raw grades before and after compositing to ensure that no samples were lost during the compositing process. Nearest neighbor and inverse distance declustering were conducted in Resource Modelling Solutions Platform. Declustering was undertaken for all estimated elements to assess declustered statistics. 11.4.2 Ridgeway Composite lengths of 2 m and 4 m were tested at Ridgeway to verify the optimum length, and the 4 m length was selected to support resource estimation of gold and copper. The global statistics and stationarity of all of the domains were assessed using Isatis software. Subsequently, some of the original domains were re-combined due to similar geostatistical characteristics and some were discarded. The quartz veining and sulfide species domains, and the majority of the grade domains were not used. However, the 0.2 g/t Au and 0.2% Cu domains were retained as they separate background metal values from the Ridgeway mineralization. The resulting domains were a combination of the geological and structural domains within a 0.2 g/t Au and/or 0.2% Cu grade domain. Cadia Valley Operations New South Wales, Australia Technical Report Summary Date: February 2026 Page 11-3 11.5 Grade Capping/Outlier Restrictions 11.5.1 Cadia East Grade capping was determined statistically to optimize estimation performance. Capping was assessed during exploration data analysis and applied to composites by domain. An assessment of global capping for all elements was completed. The global caps for gold, copper, and molybdenum were used to calibrate the local capping, while the global capping for other elements was used in the estimates. Local capping was employed for gold, copper, and molybdenum to preserve higher grades where those grades are supported by surrounding data. The result is a capping scheme with minimal cutting where high grades are locally consistent, but increased cutting for grades that are spatial outliers. 11.5.2 Ridgeway No grade caps were applied during estimation at Ridgeway. 11.6 Density (Specific Gravity) Assignment 11.6.1 Cadia East At Cadia, intervals for bulk density determination are selected according to lithology/alteration/mineralization as part of the logging process. The measurements are performed on site by geologists or geological assistants using the Archimedes water immersion method. Measurements are generally taken at 20–50 m intervals down hole. At Cadia East, bulk density was interpolated using ordinary kriging (OK). 11.6.2 Ridgeway Bulk density was assigned by domain at Ridgeway. 11.7 Variography 11.7.1 Cadia East Variography was completed for Cadia East using Resource Modeling Solutions Platform software using the capped 10 m composites. Pairwise Relative variograms were calculated and modeled by domain for all estimated elements. Local variograms were calculated and modeled for gold, copper, and molybdenum to better match changes to mineralization orientations within domains. Cadia Valley Operations New South Wales, Australia Technical Report Summary Date: February 2026 Page 11-4 11.7.2 Ridgeway Ridgeway variograms were modelled for gold, copper, silver, and sulfur within each estimation domain. All models are spherical, typically with two structures, and were developed over raw experimental variograms. The main orientation of the Ridgeway mineralization is west–northwest to east–southeast, dipping sub-vertically. This is the plane of maximum continuity. Drilling at Ridgeway is predominantly from south to north at various dips. Downhole variograms orientated in this direction (with tolerances ± slicing width applied) were generated to provide information on the nugget and short-range structures, and in the wider domains to provide insight into longer- range structures. 11.8 Estimation/Interpolation Methods 11.8.1 Cadia East Cadia East grade estimates were completed in Resource Modeling Solutions Platform for all elements. The estimate occurred into a regularized and unrotated 20 x 20 x 20 m block grid. Model blocks were coded with lithology, and estimation domains. Ordinary kriging was used for all elements. Each estimated element was estimated in a unique model prior to combination in a final model. The estimation methodology included the following: • Kriging parameter assessment and optimization, including minimum and maximum numbers of samples, search ranges, and numbers of samples used per drill hole; • Domains were treated as soft to firm with variable data sharing ranges between 5–40 m; • Grade interpolation as a single estimation pass defined by the variogram directions; • Block discretization of 4 x 4 x 4 within 20 x 20 x 20 m blocks; • Estimation review and validation. Key estimation parameters are provided in Table 11-1.


Cadia Valley Operations New South Wales, Australia Technical Report Summary Date: February 2026 Page 11-5 Table 11-1: Kriging Estimation Parameters Model Au, Cu, Mo Density Other Elements Minimum number of samples 10 10 10 Maximum number of samples 16 40 12–20 Maximum number of samples per drill hole 4 4 4 Minimum number of drill holes 3 3 3 Maximum number of drill holes 16 40 12–20 Maximum number of composites per octant NA NA NA Single/multi pass estimate Single Single Single Capping type Local None None or global Note: N/A = not applicable Density at Cadia East is low variability and exhibits a low nugget variogram. Ordinary kriging was employed with a maximum of 40 composites and validated against, nearest neighbor, inverse distance, simple kriging, and theoretical discrete gaussian check models. 11.8.2 Ridgeway Estimation parameters for the Ridgeway resource model were optimized using quantitative kriging neighborhood analysis. This process involved estimating individual blocks using OK to test the slope of regression between the true and estimated grade, estimate value, variance, and percentage of negative kriging weights. Each block was simple kriged to record the weight-of- the-mean, which was used as an indicator of estimation quality. Blocks on the margins of domains, in the center of domains, of higher than average grade, average grade and lower than average grade were tested. The results of analysis indicate that the estimation parameters are not sensitive to changes in search neighborhood. The most sensitive estimation parameter was found to be the number of samples used to estimate each block. The following estimation parameters were used for the Ridgeway mineral resource estimate: • Block size of 25 m (E) x 25 m (N) x 25 m (elevation); • Minimum of eight samples and maximum of 48 samples; • OK interpolation. 11.9 Block Model Validation Block model validation varied by deposit, and could include the following methods: visual inspection; filtering the models and checking for any un-estimated blocks; comparing the global statistics of each domain and variable with the corresponding block estimates; comparing OK Cadia Valley Operations New South Wales, Australia Technical Report Summary Date: February 2026 Page 11-6 estimates and the kriging and cell declustered composite means; comparing the composite and block grades in slices throughout the deposit; locally comparing drill holes and estimated blocks in cross-section and plan; comparing the models to the previous estimate by area and level; swath plots; and comparison against theoretical change of support models and alternative estimates. The Cadia East model was internally independently peer reviewed. 11.10 Confidence Classification of Mineral Resource Estimate 11.10.1 Mineral Resource Confidence Classification 11.10.1.1 Cadia East Mineral resource classification at Cadia East was assigned primarily based on drill hole spacing in accordance with Newmont’s internal standards. Drill spacing used in classification was determined from a 2024 drill hole spacing study. The spacing used are provided in Table 11-2. Table 11-2: Cadia East Drill Spacing Supporting Confidence Categories Category Grid Spacing X (m) Grid Spacing Y (m) Grid Spacing Z (m) Indicated 125 125 125 Inferred 175 175 175 11.10.1.2 Ridgeway The Ridgeway resource classification was reviewed with relation to sample density, hole spacing, survey method, geological interpretation, and confidence in the geological model (especially fault projection) and geologically through slope of regression. Mineral resources were classified within a 0.2 g/t Au grade shell based on the following assumptions: • Indicated mineral resources: an average weighted sample distance of <60 m; • Inferred mineral resources: an average weighted sample distance of 60–100 m. 11.10.2 Uncertainties Considered During Confidence Classification Following the analysis in Chapter 11.10.1 that classified the mineral resource estimates into the indicated and inferred confidence categories, uncertainties regarding sampling and drilling methods, data processing and handling, geological modelling, and estimation were incorporated into the classification assigned. The areas with the most uncertainty were assigned to the inferred category, and the areas with fewest uncertainties were classified as indicated. Cadia Valley Operations New South Wales, Australia Technical Report Summary Date: February 2026 Page 11-7 11.11 Stockpiles Stockpile tonnes and grades are built up from a combination of truck and survey data, and modelled in three dimensions. Stockpiled material is classed as measured mineral resources. 11.12 Reasonable Prospects of Economic Extraction 11.12.1 Input Assumptions For each resource estimate, an initial assessment was undertaken that assessed likely infrastructure, mining, and process plant requirements; mining methods; process recoveries environmental, permitting, and social considerations relating to the proposed mining and processing methods, and technical and economic considerations in support of an assessment of reasonable prospects of economic extraction. Metal price assumptions used in mineral resource estimation are summarized in Table 11-3. Table 11-3: Metal Price and Exchange Rate Assumptions Metal Price Assumptions Units Value Gold US$/oz 2,300 Copper US$/lb 4.25 Silver US$/oz 28.00 Molybdenum US$/lb 16.00 Exchange rate US$:AU$ 0.70:1 11.12.1.1 Cadia East Mineral resources considered amenable to underground mining method Block Caving for Cadia East was reported within a volume determined by a mineable shape evaluation which assesses areas achieving net smelter return (NSR) cut-off, cave establishment costs, resource classification, and minimum caving dimension requirements. The mineable volume process included depleting reserve caves, mineable block cave volume assessment, and then limiting the top of draw columns to US$24.62 NSR cut-off, key economic parameters are set out in Table 11-3 and Table 11-4. Cadia Valley Operations New South Wales, Australia Technical Report Summary Date: February 2026 Page 11-8 Table 11-4: Inputs Used for Reasonable Prospects of Economic Extraction, Cadia East Activity Units Value Mine operating cost US$/t milled 6.78 Ore treatment operating cost US$/t milled 9.58 General & administrative cost US$/t milled 3.98 Sustaining capital cost US$/t milled 4.28 Cut-off NSR value US$/t milled 24.62 Gold recovery % 81 Copper recovery % 87 Silver recovery % 68 Molybdenum recovery % 67 Note: numbers have been rounded. The metallurgical recovery assumptions were provided in Chapter 10.3.1. 11.12.1.2 Ridgeway The estimate was reported assuming an underground mass mining method, likely block/panel caving. There was an assumption of a change in the mining method at 5040 mRL, from sub-level caving to block caving. The conceptual cave was constructed by assigning an NSR value to all blocks in the resource block model, determining a cave footprint string, and projecting directly to the top of the cave column. The cave was not allowed to expand beyond the extraction level footprint, but could be reduced in diameter as a draw bell can be shut-off at cut-off grade before the entire column was extracted. Column heights ranged from 150–400 m with minimum diameters of 120 m. Metallurgical formulae were used on the Ridgeway grade model to estimate recoverable metal, regardless of sulfide species as input to the estimated block value. The formulae estimate the metal deportment to gravity, tailings, and concentrate (refer to discussion in Chapter 10.3.2). The recoveries were grind-size dependent. There was no direct input of geotechnical parameters to the resource model. Mineral resources were reported inclusive of internal zones of non-mineralized diluting material. These zones can include low-grade to barren monzonite zones and late-stage pyroxene porphyry dikes. Mineral resources input parameters are provided in Table 11-5. Metal prices used were included in Table 11-3.


Cadia Valley Operations New South Wales, Australia Technical Report Summary Date: February 2026 Page 11-9 Table 11-5: Inputs Used for Reasonable Prospects of Economic Extraction, Ridgeway Activity Units Value Mine operating cost US$/t milled 10.72 Ore treatment operating cost US$/t milled 9.58 General & administrative cost US$/t milled 3.98 Sustaining capital cost US$/t milled 4.28 Cut-off NSR value US$/t milled 28.57 Gold recovery % 81 Copper recovery % 87 Silver recovery % 66 11.12.1.3 Cadia Hill Stockpiles Assumptions used in the determination of reasonable prospects of economic extraction for the Cadia Hill stockpiles are provided in Table 11-6. Table 11-6: Inputs Used for Reasonable Prospects of Economic Extraction, Cadia Hill Stockpiles Assumption Unit Input Gold recovery % 64 Copper recovery % 75 Gold price US$/oz 2,300 Copper price US$/lb 4.25 Exchange rate US$:AU$ 0.70:1 Surface rehandle US$/t milled 1.00 Processing US$/t milled 9.58 General and administrative US$/t milled 3.98 Total Costs US$/t milled 14.56 11.12.2 Commodity Price Commodity prices used in resource estimation are based on long-term analyst and bank forecasts, supplemented with research by Newmont’s internal specialists. An explanation of the derivation of the commodity prices is provided in Chapter 16.2. The estimated timeframe used for the price forecasts is the 31-year LOM that supports the mineral reserve estimates. Cadia Valley Operations New South Wales, Australia Technical Report Summary Date: February 2026 Page 11-10 11.12.3 Cut-off For those deposits considered potentially amenable to underground mass mining methods, Cadia East and Ridgeway. No cut-off is used within the mineable shape outline, the entire volume within is reported including internal dilution due to mining method. Stockpiles reported as mineral resources are reported above a US$14.56/t cut-off. The cut-off grade must cover the costs of surface rehandle (US$1.00/t), processing (US$9.58/t) and general and administrative costs (US$3.98/t). 11.12.4 QP Statement The QP is of the opinion that any issues that arise in relation to relevant technical and economic factors likely to influence the prospect of economic extraction can be resolved with further work. The mineral resource estimates are performed for a deposit that is in a well-documented geological setting; the district has seen nearly decades of open pit and underground operations conducted by Newmont and its predecessors; Newmont is familiar with the economic parameters required for successful operations in the Cadia area; and Newmont has a history of being able to obtain and maintain permits, social license and meet environmental standards in New South Wales. There is sufficient time in the 31-year timeframe (processing ends 2056) considered for the commodity price forecast for Newmont to address any issues that may arise, or perform appropriate additional drilling, testwork and engineering studies to mitigate identified issues with the estimates. 11.13 Mineral Resource Statement Mineral resources are reported using the mineral resource definitions set out in SK1300 on a 100% basis. Newmont holds a 100% Project interest. The estimates are current as at December 31, 2025. The reference point for the estimates is in situ and in stockpiles. Mineral resources are reported exclusive of those mineral resources converted to mineral reserves. The Qualified Person for the estimates is Mr. Shaun Chanter, RM SME, Head Reserve Governance – Global, a Newmont employee. Measured and indicated mineral resources are included in Table 11-7 (gold, copper, and silver) and Table 11-8 (molybdenum). Inferred mineral resources are summarized in Table 11-9 (gold, copper, and silver) and Table 11-10 (molybdenum). Cadia Valley Operations New South Wales, Australia Technical Report Summary Date: February 2026 Page 11-11 Table 11-7: Measured and Indicated Mineral Resource Statement (gold, copper, silver) Resource Confidence Classification Area Tonnes (kt) Grade Contained Metal Au (g/t) Cu (%) Ag (g/t) Au (koz) Cu (kt) Ag (koz) Measured Stockpile 28,500 0.30 0.13 — 300 0 — Indicated Underground 1,009,300 0.29 0.25 0.62 9,400 2,600 20,200 Total measured and indicated 1,037,800 0.29 0.25 0.62 9,700 2,600 20,200 Table 11-8: Measured and Indicated Mineral Resource Statement (molybdenum) Resource Confidence Classification Area Tonnes (kt) Grade Contained Metal Mo (%) Mo (kt) Indicated Underground 938,100 0.01 100 Total measured and indicated 938,100 0.01 100 Table 11-9: Inferred Mineral Resource Statement (gold, copper, silver) Resource Confidence Classification Area Tonnes (kt) Grade Contained Metal Au (g/t) Cu (%) Ag (g/t) Au (koz) Cu (kt) Ag (koz) Inferred Underground 163,900 0.2 0.1 0.4 1,300 300 2,300 Total inferred 163,900 0.2 0.1 0.4 1,300 300 2,300 Table 11-10: Inferred Mineral Resource Statement (molybdenum) Resource Confidence Classification Area Tonnes (kt) Grade Contained Metal Mo (%) Mo (kt) Inferred Underground 124,200 0.01 0 Total inferred 124,200 0.01 0 Notes to Accompany Mineral Resource Tables: 1. Mineral resources are current as at December 31, 2025. Mineral resources are reported using the definitions in SK1300 on a 100% basis. The Qualified Person responsible for the estimate is Mr. Shaun Chanter RM SME, Head Reserve Governance – Global, a Newmont employee. 2. The reference point for the mineral resources is in situ or in stockpiles. Cadia Valley Operations New South Wales, Australia Technical Report Summary Date: February 2026 Page 11-12 3. Mineral resources are reported exclusive of mineral reserves. Mineral resources that are not mineral reserves do not have demonstrated economic viability. 4. Mineral resources that are potentially amenable to underground mass mining methods are reported using the inputs summarized in Table 11-4 and Table 11-5. Mineral resources in stockpiles are constrained using the inputs summarized in Table 11-6. 5. Tonnages are metric tonnes. Gold and silver ounces and copper and molybdenum tonnes are estimates of metal contained in tonnages and do not include allowances for processing losses. 6. Rounding as required by reporting guidelines may result in apparent differences between tonnes, grade and contained metal content. Tonnes are rounded to the nearest 100,000 tonnes. Ounces are rounded to the nearest 100,000 ounces. In instances where tonnage and grade are presented but metal is shown as “0”, this is due to the metal contained falling below the metal rounding limit. 11.14 Uncertainties (Factors) That May Affect the Mineral Resource Estimate Areas of uncertainty that may materially impact the mineral resource estimates include: • Changes to long-term metal price and exchange rate assumptions; • Changes in local interpretations of mineralization geometry, structures, and continuity of mineralized zones; • Changes to geological and grade shape and geological and grade continuity assumptions; • Changes to metallurgical recovery assumptions; • Changes to the input assumptions used to derive the conceptual underground mass mining methods used to constrain the estimates; • Changes to the to the input assumptions used in the constraining pit shell for those mineral resources amenable to open pit mining methods; • Changes to the NSR cut-offs applied to the estimates; • Variations in geotechnical (including seismicity), hydrogeological and mining assumptions; • Forecast dilution; • Changes to environmental, permitting, and social license assumptions. An additional risk to the mineral resource estimate is the assumption that there will be sufficient tailings storage capacity at the tailings cost input assumption used when considering reasonable prospects of economic extraction. There are no other environmental, legal, title, taxation, socioeconomic, marketing, political or other relevant factors known to the QP that would materially affect the estimation of mineral resources that are not discussed in this Report.


Cadia Valley Operations New South Wales, Australia Technical Report Summary Date: February 2026 Page 12-1 12.0 MINERAL RESERVE ESTIMATES 12.1 Introduction Mineral reserves are reported for Cadia East and Ridgeway. The Cadia East mine is operating; Ridgeway is currently on care-and-maintenance. Mine designs supporting the mineral reserves were based on the most recently approved pre- feasibility and feasibility studies, and the operating mine life-of-mine plans. Metal price and exchange rate assumptions used in mineral reserve estimation are provided in Table 12-1. Table 12-1: Metal Price and Exchange Rate Assumptions Item Units Price Gold price US$/oz 2,000 Copper price US$/lb 3.75 Molybdenum price US$/lb 13.00 Silver price US$/oz 25.00 Long-term exchange rate US$:AU$ 0.70:1 Cost estimates used in the preparation of the mineral reserves are based on the most recent studies approved by Newmont relating to the exploitation of the two deposits. The mineral reserves include material that, when delivered to the mine portals, has a recovered value greater than the cost of all downstream processes, including fixed costs. Mineral reserves are estimated assuming bulk underground mining methods. 12.2 Cadia East 12.2.1 Overview The current Cadia East mine plan is at a minimum of pre-feasibility level of evaluation and outlines the execution of the life of mine plan over a series of three lifts (Lifts 1, 2, and 3). Lift 1 and Lift 2 have an existing panel cave and will, by the end of operations, have four extensions in total each, with Lift 3 having one panel extension. The planned mine layout is provided in Figure 12-1. Cadia Valley Operations New South Wales, Australia Technical Report Summary Date: February 2026 Page 12-2 Figure 12-1: Planned Mine Layout Schematic, Cadia East Note: Figure prepared by Newmont, 2024. The basic methodology employed to complete mine designs included: • Creation of drawbell footprints; • Extraction and undercut layouts were designed and access, infrastructure and related ventilation and materials handling development were added to build total mine design; • All design was undertaken using mine design and geotechnical parameters; • Geotechnical modelling was undertaken on mine design to determine stability and highlight problem areas that need modification; • Final mine design was completed using geotechnical recommendations. Cadia Valley Operations New South Wales, Australia Technical Report Summary Date: February 2026 Page 12-3 12.2.2 Net Smelter Return The panel cave outline was prepared by analyzing the cost of constructing and establishing drawpoints, and mining and processing ore. These cost estimates were then compared to the estimated NSR generated by mining the material from the draw-column overlying the drawpoint. NSR values are calculated on a payable metal basis taking metal prices, metallurgical recoveries, and realization costs (transportation, smelting, royalties, etc.) into account. Only draw-columns generating a positive NSR value (economic draw-columns) are included in the reserve, except where it is necessary to include an uneconomic draw-column to ensure a practical mining shape. Draw-column heights were limited by a shut-off NSR value of US$24.62/t. 12.2.3 Development Ore Selection All development waste and part of the ore material will be hauled to the surface portal dump. From the portal, dump ore is then screened and cleaned of any remnant ground support steel and then hauled to the mill for processing. Waste is hauled to the waste rock storage facility (WRSF) using surface equipment. The costs involved are: • Site processing cost US$9.58/t; • Surface cleaning and screening: US$3.15/t. A breakeven cut-off value has been used for ore waste delineation of US$12.73/t. 12.2.4 Panel Cave Ore Selection Mining footprints were determined using a cost of US$525,000 per drawpoint, or US$1.05 million per drawbell. No other capital costs are included in the evaluations as the remaining costs are sunk as part of footprint establishment. All drawpoints with a positive net present value (NPV) are considered, with the assumption that all draw columns will be mined to a profitable height after the cost of cave establishment has been sunk. 12.2.5 Shut-off Values Long term breakeven mineral reserve shut-off value inputs are provided in Table 12-2. Cadia Valley Operations New South Wales, Australia Technical Report Summary Date: February 2026 Page 12-4 Table 12-2: Mineral Reserve Shut-off Value Activity Units Value Mining US$/t milled 6.78 Processing US$/t milled 9.58 Site general & administrative (G&A) US$/t milled 3.98 Sustaining capital cost US$/t milled 4.28 Shutoff NSR value US$/t milled 24.62 12.2.6 Dilution Internal dilution is incorporated into the mine plan. All development has mining factors for dilution and recovery applied to accurately represent the expected mined tonnes. 12.2.7 Metallurgical Recoveries The recovery ranges in Table 12-3 are anticipated over the LOM. Table 12-3: Metallurgical Recovery, Cadia East Element Unit Value Gold % 70–85 Copper % 80–87 Silver % 62–67 Molybdenum % 65–75 12.3 Ridgeway 12.3.1 Overview A schematic showing the relationships of the mined-out SLC and Ridgeway Deeps Lift 1 operations is provided in Figure 12-2.


Cadia Valley Operations New South Wales, Australia Technical Report Summary Date: February 2026 Page 12-5 Figure 12-2: Ridgeway Mine Layout Schematic Note: Figure prepared by Newmont, 2024. Estimation of the mineral reserves involved standard steps of mine optimization, mine design, production scheduling, and financial modelling. Factors and assumptions were based on operating experience and performance in gained in the Cadia Valley Operations. The basis of the analysis is considered to be at a pre-feasibility study level or higher. Mine plans are based on the extraction of caving blocks solely delineated on the basis of Indicated material. Dilution is included within the probable mineral reserve. 12.3.2 Net Smelter Return Estimation uses a value-based cut-off by determining the NSR value equal to the relevant site operating cost. The NSR calculation considers reserve revenue factors, metallurgical recovery assumptions, transport costs and refining charges and royalty charges. The site operating costs include mining cost, processing cost, relevant site general and administration costs. This cost Cadia Valley Operations New South Wales, Australia Technical Report Summary Date: February 2026 Page 12-6 equates to a break-even cut-off value (equivalent to a shut-off value) of approximately US$24.62t milled (Table 12-4). Table 12-4: Ridgeway Deeps Lift 1 Shut-Off Values Activity Unit Break Even NSR Mine operating cost US$/t milled 13.72 Ore treatment operating cost US$/t milled 9.58 General & administration cost US$/t milled 1.32 Shutoff NSR value US$/t milled 24.62 12.3.3 Development Ore Selection All development material is planned to be hauled to the surface portal dump. From the portal, dump ore will be screened and cleaned of any remnant ground support steel and hauled to the mill for processing. Waste will be hauled to the waste dump using surface equipment. 12.3.4 Block Cave Ore Selection All drawpoints with a positive net present value (NPV) are considered, with the assumption that all draw columns will be mined to a profitable height after the cost of cave establishment has been sunk. 12.3.5 Metallurgical Recovery Metallurgical recoveries are listed in Table 12-5. Table 12-5: Metallurgical Recovery, Ridgeway Element Unit Value Gold % 70–80 Copper % 80–90 Silver % 55–65 12.4 Royalties Royalties are calculated as 4% of block revenue less all off site realization costs (treatment and refining charges), less ore treatments costs and less one third of site general and administrative costs. The royalty payments equate to approximately 3% of total revenue on average. Cadia Valley Operations New South Wales, Australia Technical Report Summary Date: February 2026 Page 12-7 12.5 Mineral Reserve Statement Mineral reserves are reported using the mineral reserve definitions set out in SK1300 on a 100% basis. Mineral reserves are current as at December 31, 2025. The reference point for the mineral reserve estimate is as delivered to the process facilities. Mineral reserves are reported in Table 12-6. The Qualified Person for the estimate is Mr. Shaun Chanter, RM SME, Head Reserve Governance - Global, a Newmont employee. Table 12-6: Proven and Probable Mineral Reserve Statement Reserve Confidence Classification Area Tonnage (kt) Grade Contained Metal Gold (g/t Au) Copper (% Cu) Silver (g/t Ag) Gold (koz) Copper (kt) Silver (koz) Probable Stockpile 4,300 0.48 0.31 0.74 100 0 100 Underground 1,003,300 0.42 0.29 0.67 13,400 2,900 21,700 Total probable mineral reserves 1,007,600 0.42 0.29 0.67 13,500 2,900 21,800 Reserve Confidence Classification Area Tonnage (kt) Grade Molybdenum (% Mo) Contained Metal Molybdenum (kt) Probable Underground 4,300 0.01 0 Stockpile 992,100 0.01 100 Total probable mineral reserves 996,400 0.01 100 Notes to Accompany Mineral Reserves Table: 1. Mineral reserves current as at December 31, 2025. Mineral reserves are reported using the definitions in SK1300 on a 100% basis. The Qualified Person responsible for the estimate is Mr. Shaun Chanter, RM SME, Head Reserve Governance - Global, a Newmont employee. 2. The reference point for the mineral reserves is the point of delivery to the process plant. 3. Mineral reserves are reported using the assumptions listed in Table 12-1 to Table 12-4. 4. Tonnages are metric tonnes. Gold and silver ounces and copper and molybdenum tonnes are estimates of metal contained in tonnages and do not include allowances for processing losses. 5. Rounding as required by reporting guidelines may result in apparent differences between tonnes, grade and contained metal content. Tonnes are rounded to the nearest 100,000 tonnes. Ounces are rounded to the nearest 100,000 ounces. In instances where tonnage and grade are presented but metal is shown as “0”, this is due to the metal contained falling below the metal rounding limit. Cadia Valley Operations New South Wales, Australia Technical Report Summary Date: February 2026 Page 12-8 12.6 Uncertainties (Factors) That May Affect the Mineral Reserve Estimate Areas of uncertainty that may materially impact the mineral reserve estimates include: • Changes to long-term metal price and exchange rate assumptions; • Changes to metallurgical recovery assumptions; • Changes to the input assumptions used to derive the cave outlines and the mine plan that is based on those cave designs; • Changes to the shut-off criteria used to constrain the estimates; • Changes to operating and capital cost assumptions used, including changes to input cost assumptions such as consumables, labor costs, royalty, and taxation rates; • Variations in geotechnical, mining, dilution, and processing recovery assumptions, including changes to designs as a result of changes to geotechnical, hydrogeological, and engineering data used; • Ability to source power supplies if the current assumptions cannot be met; • Ability to obtain sufficient water to meet operational needs; • Changes to the assumed permitting and regulatory environment under which the mine plan was developed; • Ability to permit additional TSF capacities or facilities; • Ability to maintain mining permits and/or surface rights; • Ability to obtain operations certificates in support of mine plans; • Ability to obtain and maintain social and environmental license to operate. There is a risk to the mineral reserve estimates if Newmont is not able to demonstrate that the Cadia Valley Operations can remediate, maintain and operate the existing TSFs in line with the costs estimated in the LOM plan. A similar risk exists with the costs estimated for the TSF expansion included in the cash flow analysis. Newmont must also demonstrate that the operations can be mined within the existing environmental permit requirements. There are no other environmental, legal, title, taxation, socioeconomic, marketing, political or other relevant factors known to the QP that would materially affect the estimation of mineral reserves that are not discussed in this Report.


Cadia Valley Operations New South Wales, Australia Technical Report Summary Date: February 2026 Page 13-1 13.0 MINING METHODS 13.1 Cadia East Operations 13.1.1 Overview The current operations are planned as a series of three lifts (Lifts 1, 2, and 3). The relative elevation of these lifts and all underground infrastructure is expressed in mine height datum which is 5,000 m above AHD. Lifts 1 and 2 are approximately 1,200–1,400 m high with their bases located at approximately 4650 mRL and 4450 mRL, respectively. Lift 3 sits below Lift 2 with a block height of 275 m and a base at 4,175 mRL. Lift 1 refers to the following panel caves: PC1–1, PC1–2, PC1–3 and PC1–4. Lift 2 refers to the following panel caves: PC2, PC2–3, PC2–4 and PC2–5. Lift 3 refers to the following panel cave: PC 3–1. Cadia East is accessed via two declines, the main access decline, and the conveyor decline. The mining method involves inducing caving of the rock mass by undercutting a block of ore. Mining proceeds by progressively advancing an “undercut” level beneath the block of ore. Above the undercut level, the overlying host rocks are pre-conditioned using blasting and/or hydraulic fracturing, resulting in controlled fracturing of the ore block (Figure 13-1). Following pre-conditioning of the overlying host rocks, broken ore is removed through an extraction level developed below the undercut level. The extraction level is connected to the undercut level by drawbells, through which the ore gravitates to drawpoints on the extraction level. The ore is removed by a LHD fleet to underground crushing stations. At each crushing station, ore is tipped into a coarse ore bin, which then feeds the crusher itself which passes material to a surge bin used to regulate the feed from the crushing station onto the collection conveyors. The collection conveyors are in turn used to regulate feed onto the main trunk belt system and to allow for the automated removal of tramp metals. The main trunk belt is used to transport ore to the surface at a rate of approximately 4,600 t/h (with work underway to upgrade this to 5,150 t/h). The incline conveyor commences at 4,400 mRL (i.e. the base of Lift 2), extends approximately 7,500 m to the surface and is deposited onto the concentrator coarse ore stockpile where it is gravity fed into the ore processing system. Waste rock is removed from the underground workings via the decline and is hauled to the South Waste Rock Facility. Cadia Valley Operations New South Wales, Australia Technical Report Summary Date: February 2026 Page 13-2 Figure 13-1: Schematic Showing Mining Operations Note: Figure prepared by Resource Strategies, 2012. Cadia Valley Operations New South Wales, Australia Technical Report Summary Date: February 2026 Page 13-3 Fresh air enters the underground workings via the main and conveyor declines and six ventilation intake shafts (VR4, VR6, VR10, VR122, VR16, VR18) A total flow intake of approximately 2,500 m3/s of installed capacity to maintain underground air quality. Air is expelled from the workings via six vertical shafts and exhaust fan installations (VR3, VR5, VR7, VR8, VR121, VR11). Blasting consists of development blasting and production blasting to precondition the ore. Emulsion explosives are typically used for blasting purposes. Ammonium nitrate fuel oil (ANFO) may be used on occasions if emulsion charging is not available. Hydraulic fracturing is used to augment the caving process. Groundwater that accumulates in the underground mine workings is collected, and then pumped to the surface at a maximum rate of about 160 L/s. Underground facilities include workshops, wash bays, fuel bays, offices, and crib rooms. Underground workshops are used to maintain the development and production fleet. The Cadia East mine is supplied by a dedicated 132 kV transmission line feed which in turn feeds into the site switchyard. Three 33 kV feeders run from the surface substation to provide a ring main to the underground workings. 13.1.2 Geotechnical Considerations 13.1.2.1 Rock Quality and Geotechnical Domains Geotechnical data collection included: • Rock mass rating (RMR90); • Q prime (Q and Q') values. In an effort to provide additional insight into the potential for veining or small defects within intact rock to affect the overall strength and behavior of the rock mass, where possible the data was used to calculate in-situ rock mass rating classification values. Intact rock strength and competency generally increases with depth and to the east of the mine at Cadia East. Laboratory strength testing has confirmed these rock mass findings. Monzonite is the main intrusive type at Cadia East with varying levels found within the host volcanic unit. An overall geotechnical block model was created for the Cadia underground mining area, and divided into five areas: • Far West (including PC1–2 and PC1–4); • Centre West (including PC1–2, PC1–4, and part of PC1); • Centre East (including PC2, part of PC1 and the western part of PC3–1); • Middle East (including PC2-3 and the eastern half of PC3–1); • Far East (including some access development). Cadia Valley Operations New South Wales, Australia Technical Report Summary Date: February 2026 Page 13-4 A schematic section through the model is provided as Figure 13-2. This model allows for a detailed understanding of the rock mass and its likely response to the cave mining process. Figure 13-2: Geotechnical Block Model Schematic Note: Figure prepared by Newcrest, 2020. 13.1.2.2 Design Considerations Modelling indicates that the caveability of panel caves is not significantly influenced by faults that are known to exist within the orebody. Localized effects, predominantly on cave establishment processes, have been taken into account whilst completing mine designs for the panel caves. Caveability tests and modelling undertaken as part of studies has shown that the orebody is amenable to caving. Modelling also indicate that effective homogeneous preconditioning could increase the recovery of ore by having more material caved from the flanks, and prevent potential hangs-up in the areas that are not caved due to lower intensity hydraulic fracturing. The increased mobilization of the cave flanks would appear to reduce cave necking. The planned preconditioning design for cave growth is one that implements a regular and tightly- spaced hydraulic fracturing geometry of between 1.5–4 m fracture spacing with a draw sequence that is initiated adjacent to the existing cave, to mitigate any potential pendant effect.


Cadia Valley Operations New South Wales, Australia Technical Report Summary Date: February 2026 Page 13-5 13.1.2.3 Cave Initiation Cave initiation will commence adjacent to existing caves for operations on the Lift 1 and Lift 2 levels. This cave initiation position was aligned to prevent the formation of a low-mobility cave- flow area (pendant). The Lift 3 level will be initiated under the existing Lift 2 caves, and the breakthrough to the lift above will be managed via a combination of fracturing, draw control, and personnel exclusion from high-risk zones. 13.1.2.4 Hydraulic Fracturing Hydraulic fracturing activities will be conducted in two main functional areas, the orebody and infrastructure areas with two separate intents. The orebody will be fractured at a minimum of 1.5– 4 m vertical spacings to enhance cave propagation. Pre-conditioning is expected to provide caving angles of 85–90°. Infrastructure areas will be fractured at a minimum of 4 m vertical spacings to reduce the seismic hazard. Areas within the infrastructure that require fracturing are defined by excavations that are within 30 m of areas where there is significant potential for strain-bursting (based on numerical models), or excavations within 30 m of a major structure with the potential to produce local slippage along discontinuities. 13.1.2.5 Caveability, Fragmentation, and Flow Findings from fragmentation studies, which included analysis of over 500 drawpoint photos and the results from cave markers and cave tracker beacons supports the current extraction level spacing, drawbell, and drawpoint designs being used as optimum for recovery of the fragmented ore. Draw behavior results derived from the current cave marker and cave tracker beacons show that disturbed flow mechanisms are occurring in the cave material during cave draw. Pre-conditioning was applied to the rock mass in Cadia East PC1 and PC2, and the results of this, combined with the rock mass properties, have shown that the mine is capable of caving to surface without significant risk of stall. Future caves have similarly been planned with pre- conditioning, and rock mass conditions are anticipated to be similar to current site experience. The implementation of preconditioning reduces drawpoint hang-ups, oversize rocks and provides an improvement in caveability by placing regular fractures in the caving block. This preconditioning is specifically designed to address the first 50 m of draw where the largest and most inefficient production draw exists. 13.1.2.6 Cave Subsidence A mine-scale tri-dimensional numerical model was completed and used to assess the potential underground and surface subsidence. The average break angle for the Ordovician volcaniclastic rock and the Silurian sediments at Cadia East are 70º and 55°, respectively. At the end of the Cadia Valley Operations New South Wales, Australia Technical Report Summary Date: February 2026 Page 13-6 Cadia East mine life, the surface subsidence area would be approximately 250 ha and would resemble a dish-shaped depression surrounded by steep slopes on the margin. 13.1.2.7 Ground Support Primary support will consist of fiber-reinforced shotcrete, mesh, and rock bolts. In addition, each cut will have face meshing, and an additional ring of rock bolts to join mesh with the previous cut. Secondary support will consist of cables. In-cycle cables will be required through zones of high deformation such as strain burst-prone areas. 13.1.3 Hydrogeological Considerations 13.1.3.1 Hydrogeology The hydrogeology of the Cadia East deposit area can be described as following: • The Tertiary basalt forms a productive aquifer with yields that vary from low to high and produces consistently good water quality suitable for potable use; • The underlying Silurian sequence is more variable but can form low yield aquifer from sandstone and siltstones, with locally high yields where fractured limestones are present; • The Ordovician volcaniclastic basement rocks have widely spaced and poorly interconnected fracture networks beyond the major fault zones and form an aquitard with very low yields and slightly brackish water quality. Any surface runoff from the within the subsidence crater and the upslope areas will drain into the cave, eventually flowing to the lowest point in the cave column. Some of the water will be held as entrained moisture in the cave material. 13.1.3.2 Inflows A quantitative prediction of water inflow to the extraction level was completed with modelling predicting an increase of cave moisture with time, and an increase of total discharge (both ore moisture and seepage), typically for the 50th rainfall percentile: • By FY29: 5–45 L/s; • By FY48: 30–85 L/s. Most of inflow will occur from the base of the subsidence crater. Inflow via the non-ponded crater zone will be limited. Cave moisture is predicted to increase through the mine life, although the muck pile is expected to remain largely unsaturated. There may still be pathways of quick water transfer, for example, under ponded areas or through fracture zones. The modelling predicted that peak discharge to the extraction level will mimic surface infiltration, with multi-day extreme storm events associated with the highest risks of increased inflow. Cadia Valley Operations New South Wales, Australia Technical Report Summary Date: February 2026 Page 13-7 Recharge of the groundwater levels is noted to occur following substantial rainfall events across the region. The actual recharge amount varies substantially across the entire field, due in part to the variable rock storage, permeability parameters, and topographic features. Discharge of groundwater in the field will occur in two main areas, baseflow into creeks and into mining voids. 13.1.3.3 Dewatering Mine dewatering is currently achieved with a vertical dam and Geho positive displacement pump system placing water into thickener TH2003 for reuse in the ore treatment facility. The dewatering facilities are designed to accommodate groundwater and surface catchment area water inflows for a one-in-100-year rainfall event. There is no discharge of water from the mine dewatering activities to the environment, with water reused in processing facilities or recycled into the underground operations. 13.1.4 Design Considerations Key assumptions in the design process are included as Table 13-1. Table 13-1: Cadia East Key Design Parameters Development Area Gradient Access declines (max) 1 in 6 Conveyor declines (max) 1 in 5.3 Level development (max) 1 in 6 Level development (min) 1 in 50 Minimum development radius 25 m Excavation Sizes: Vertical Diameter Ore passes 4.5 m Ventilation rises 3.0–6.0 m Geotechnical Distance Drawbell spacing 32 x 20 m Major apex pillar 44 m Minor apex pillar 22.5 m Crusher cave footprint standoff 110 m Minimum pillar distance (XY or Z) 17 m Min angle BTW drives 59° The default density for caved material is 2.2 t/m3. The range for neighboring drawpoints is 28 m. In each case, this allows for rilling and toppling interaction between neighboring drawpoints within the specified radius. The draw cone used has a maximum radius of 14 m and a maximum height of 1,350 m. Cadia Valley Operations New South Wales, Australia Technical Report Summary Date: February 2026 Page 13-8 Development profile assumptions are provided in Table 13-2. Table 13-2: Future Development Profiles Profile Width (m) Height (m) Arch radius (m) Type A 5.5 6.0 5.7 Decline, access, ventilation B 5.0 5.7 3.7 Turning bays P 5.7 6.3 3.6 Conveyor decline T 5.0 4.6 5.8 Drawpoints, perimeter drives, undercut drill drives U 5.4 4.6 6.5 Extraction drive, tipple approaches H 4.7 4.6 3.5 Sumps Mass excavation 6–12 8–15 65% of width Workshops, conveyor transfers, crushing station 13.1.4.1 Extraction Levels Future extraction level development (inclusive of PC2–3) will consist of: • 1,119 drawbells, with total footprint dimensions of 700,000 m2 across seven panel areas; • Crushers located adjacent to the footprint, connected to the level via development drives for LHD operation and situated with a 110–130 m standoff from the edge outer edge of the nearest drawbells. • The standard extraction level layout used in mine planning is an El Teniente layout with spacing of 32 x 20 m, a 60° turn out angle and 5.4 m wide x 4.6 m high drive, as per PC1 and PC2. This spacing is considered to meet the needs of extraction level stability and ore recovery under Cadia East conditions; • Extraction level perimeter drives are located at least 50 m from the edge of the undercut; • Crushing stations have a four- or five-tipple dump arrangement. Extraction level drainages are designed so that water flows away from the crusher. 13.1.4.2 Undercut Levels A number of undercutting processes are planned for Cadia East.


Cadia Valley Operations New South Wales, Australia Technical Report Summary Date: February 2026 Page 13-9 These are summarized as: • Post undercutting: PC2–3, PC1–2, PC1–3; high post undercut; • Advanced undercut: PC1–4, PC2–4, PC2–5 and PC3–1; W-cut advanced undercut with apex drive. 13.1.4.3 Monitoring and Cave Engineering Horizon A monitoring and cave engineering horizon was designed for the 5050 mRL for PC1–1, PC1–2 and PC2–3. A perimeter drive was designed 150 m from the undercut edge to ensure adequate monitoring access post cave breakthrough. The development will be used for infrastructure hydro-fracturing, orebody hydrofracturing, geotechnical instrumentation, and ventilation. 13.1.4.4 Waste Waste material from development activities will be trucked to the surface by underground trucks to a stockpile near the portal, and then be rehandled to the surface South Waste Rock Facility by surface equipment. 13.1.5 Declines The Cadia East deposit is accessed via two declines: • Main access decline: approximately 10 km long; dimensions of 6.0 mW x 6.5 mH; gradient of 1:7 to 1:8. Functions as an air intake, and is the general mine access for heavy vehicles, light vehicles, and personnel; • Conveyor decline: about 7 km long; dimensions of 6.0 mW x 6.5 mH; gradient of 1:5. Functions as an air intake, and is the main trunk conveyor system and secondary access for light vehicles and personnel. 13.1.6 Ventilation Fresh air enters the underground workings via the main decline, conveyor decline, the northern ventilation decline, four surface ventilation intake shaft systems (VR4, VR6, VR122, VR18) and two internal ventilation shaft system (VR10, VR16). Return air reports to vertical shafts and exhaust fan systems (VR3, VR5, VR7, VR8, VR11, VR121) The ventilation and cooling requirements for a base annual production rate of 33–35 Mt were examined. The airflow requirement was determined and a general allowance for fixed infrastructure and system leakage was included in the ventilation calculations. It was assumed a development rate of up to 1,000 m per month would be achieved during peak development. Cadia Valley Operations New South Wales, Australia Technical Report Summary Date: February 2026 Page 13-10 An allowance of 5% of mine ventilation requirements was added for ventilation system leakage to determine the total exhaust capacity requirements. 13.1.7 Materials Handling System Infrastructure required to support each cave will include: • Primary crusher (2 x in the case of PC1–2); • Four- or five-way tipple arrangement; • ROM bin (at least 450 t capacity); • Crushed ore bin (at least 1,000 t capacity); • Extension of an existing conveyor to transfer station 20 for PC2–3 and transfer station 30 for PC3–1; other caves will use the existing transfer stations on the trunk belt; • Each crushing station will require the installation of lateral conveyors at a rate of up to 3,000 t/h (5,150 t/h in the case of PC1–2 and PC1–3). The infrastructure required is illustrated in Figure 13-3. In that figure, PC1 and PC1–2 are shown in the uppermost image, and the remaining caves in the lowermost image. Figure 13-3: Planned Infrastructure Schematic, Cadia East Note: Figure prepared by Newcrest, 2023. Cadia Valley Operations New South Wales, Australia Technical Report Summary Date: February 2026 Page 13-11 13.1.8 Equipment Equipment forecasts are included in Table 13-3 and Table 13-4. Table 13-3: Primary Equipment Summary, Cadia East Purpose Equipment Description Equipment Type Number at Peak Primary development equipment Face drilling jumbo Atlas Copco E2C30 1 Atlas Copco E2C 1 Rock bolting jumbo Atlas Copco M2D18 6 Cable bolting jumbo Sandvik DS422i 6 Development loader Sandvik LH621 5 Truck 60 t Sandvik TH663 10 Tool carrier Volvo L120F/ L90F 9 Shotcrete rig Jacon Maxijet X3 1 Normet MF050VC Spraymec 3 Elphinstone WR820 7 Development charge up rig Normet Charmec 4 Primary cave preparation equipment Production drill Atlas Copco E7C 7 Charge-up Unit Explosives Supplier Emulsion Truck 2 Development loader Sandvik LH621 2 Primary production equipment Production loader Caterpillar R3000H 25 Epiroc S18 12 Sandvik LH621i 2 CAT R2900XE 1 Secondary break hammer Cat 321 3 Sandvik LH517 Rockbreaker 3 Epiroc ST14 LHD Rockbreaker 1 Secondary break drill and blast Maclean Engineering BH3 Blockholer 2 Water cannon Maclean WC3 3 High hangup removal Maclean Engineering High Hang-up Removal Unit BH3 6 Secondary break preparation loader Sandvik LH621i 2 Cadia Valley Operations New South Wales, Australia Technical Report Summary Date: February 2026 Page 13-12 Table 13-4: Secondary Production Equipment Summary, Cadia East Equipment Description Equipment Type Number at Peak Grader Caterpillar 12M2 1 Water truck Caterpillar 730C converted to water truck 2 Roller Bomag 213 1 Light vehicle Toyota Landcruiser 70 50–100 Backhoe JCB 2 Service truck Caterpillar 730 Service Truck 2 Integrated tool carrier Volvo IT 16 13.1.9 Facilities No changes are expected to the types of facilities that are used in support of current underground operations such as maintenance workshop facilities, refueling station, crib rooms, and offices. In addition to these facilities, the following will be required during the expansion: • Lunch room and workshops; • Substations and pumping facilities; • Further dewatering surface connection for dewatering as the mine progresses; • Additional ventilation fans. The existing 33 kV and 11 kV electrical distribution systems will be extended to supply power to the operating caves. The current operational philosophy for the existing dewatering system has three pump types to remove water from underground to the surface. Raw water will be supplied from the surface raw and fire water tank, and distributed underground via the conveyor decline. Potable water is delivered underground in the form of water bottles. The underground network system includes two fiber optic cable systems: one multi-mode fiber optic network, which connects protection relays to the site-wide load monitoring and control system; and one single-mode fiber optic network, which handles the plant control system and general communications. 13.1.10 Blasting Drawbells will be drilled using 76 mm blastholes and blasted using smooth blasting techniques to minimize pillar damage. Each drawbell will require approximately 1,600 m of drilling.


Cadia Valley Operations New South Wales, Australia Technical Report Summary Date: February 2026 Page 13-13 Undercuts will be drilled with 102 mm diameter blastholes. Minor bogging will be conducted from the undercut level which will be conducted for advanced undercutting and clean up any swell reporting into the drill drive for post undercutting areas. Intensive blast preconditioning will be undertaken as part of the PC2–3 undercutting process. The design consists of 102 mm diameter blastholes to heavily fragment the ore. 13.1.11 Production Schedule The dates of initiation of each cave are provided in Table 13-5. Table 13-5: Forecast Production Schedule, Cadia East Panel Cave ID Start of Construction Year of First Production Anticipated Ore (Mt) PC2–3 CY20 CY24 126 PC1–2 CY23 CY26 276 PC1–3 CY30 CY32 112 PC3–1 CY34 CY37 169 PC2–4 CY39 CY41 95 PC1–4 CY42 CY45 108 PC2–5 CY48 CY49 15 Note: CY = calendar year. The cave locations are shown in Figure 12-2. During cave construction, an additional 7 Mt of cave development ore will be extracted and processed. The LOM production schedule, that includes the production from Cadia East, is provided with the cash flow analysis in Chapter 19. 13.1.12 Personnel The mining personnel total requirement for LOM operations is approximately 505 for underground production and 424 for mining projects. 13.2 Ridgeway 13.2.1 Introduction Ridgeway is a vertical porphyry copper/gold deposit located within the Cadia Valley and approximately 5 km from the ore treatment facility and adjacent to the Cadia Hill deposit. The Cadia Valley Operations New South Wales, Australia Technical Report Summary Date: February 2026 Page 13-14 upper portion of the deposit down to 5040 mRL (approximately 800 m below surface) has been mined using SLC methods, resulting in a column of caved material that extends to the surface to form a subsidence zone. An underground crusher was installed at the base of the SLC area and crushed ore was conveyed out of the mine via an inclined conveyor system. SLC mining is now complete. The Ridgeway Deeps Lift 1 block cave operation was mined from 2007–2015. The change to block caving was introduced after the identification that the grade profile for Ridgeway was declining to the point where subsequent SLC levels below the 5040 mRL were uneconomic. It was also recognized that experience with techniques and methods of cave establishment were required for the then future Cadia East operations which were significantly larger in scale. As a result of extensive reviews and study it was proposed that a 5.6 Mt/a block cave mine be established 250 m downdip of the base of the SLC at the 4786 mRL. Subsequent to establishment and ramp-up, the mine was debottlenecked to the point of achieving a total of 9.6 Mt/a. A total of 17 Mt grading 0.57 g/t Au and 0.29% Cu remains in the Lift 1 level. 13.2.2 Geotechnical Considerations There are four primary domains of generally good RMR rates within Ridgeway Deeps, the Eastern block volcanic rocks, Western block fractured sedimentary rocks, southern monzonite, and the southeastern massive sedimentary rocks. The drawpoints are designed to manage cave draw and the extraction is scheduled to manage load transfer within the cave footprint. The primary ground support consists of fiber-reinforced shotcrete, mesh, and rock bolts. Secondary support consists of Osro straps and cables. Subsidence zone monitoring has been modelled using FLAC3D for surface and underground subsidence. Existing monitoring of the subsidence undertaken through a mixture of techniques, including LiDAR survey, InSAR and visual inspections. 13.2.3 Hydrogeological Considerations 13.2.3.1 Inflows A study was undertaken by third-party hydrologists Kalf & Associates in 2002 to assess the implications of a direct connection between the surface crater and the underground workings. The findings of this study proposed a simple model having a direct hydraulic connection between rain falling in the catchment formed by the crater and being directly transmitted to the workings. Pumping capacity was found to be adequate to deal with inflows generated by a one-in-100-year rainfall event. Cadia Valley Operations New South Wales, Australia Technical Report Summary Date: February 2026 Page 13-15 13.2.3.2 Dewatering The design criteria for the pumping system were assumed to be unchanged from Ridgeway Deeps Lift 1 block cave with expected normal flows of 10–30 L/s, and capable of handling emergency flows of 85 L/s. 13.2.4 Design Considerations Key assumptions used in the design process are provided in Table 13-6. Table 13-6: Key Design Parameters, Ridgeway Development Width (m) Height (m) Access decline 5.5 6.0 Conveyor decline 6.0 6.0 Undercut level access 5.0 5.7 Undercut crosscuts 4.5 4.5 Extraction level access 5.5 6.0 Extraction level crosscuts 4.5 4.5 Drawpoint 4.0 4.0 Ridgeway Deeps L1 uses an offset herringbone design for drawpoint layouts (Figure 13-4). Figure 13-4: Offset Herringbone Layout Schematic Note: Figure prepared by Newcrest, 2014. Cadia Valley Operations New South Wales, Australia Technical Report Summary Date: February 2026 Page 13-16 Extraction crosscuts are spaced at 30 m intervals and drawbells at 18 m apart. The Ridgeway deposit is accessed via two declines: • Main access decline: approximately 10 km long; dimensions of 6.0 mW x 6.0 mH; and a gradient of 1:10 to 1:6. Functions as an air intake, and is the general mine access for heavy vehicles, light vehicles, and personnel; • Conveyor decline: about 7 km long, dimensions of 6.0 mW x 6.0 mH; and a gradient of 1:6 to 1:5.3. Functions as an air intake, and contains the main trunk conveyor system and secondary access for light vehicles and personnel. 13.2.5 Ventilation Ridgeway has an established ventilation system that uses the VR1, VR2, VR3 and VR7 raises to provide fresh air. Return air reports to the VR4 and VR6 systems. There are no proposed changes to the current ventilation plan at Ridgeway. 13.2.6 Materials Handling System Ore will initially be transported to surface using of 60 t trucks while evaluation of reinstating the crushing and materials handling system is undertaken. There are jaw crushers with tipping points installed on the 4786 mRL with rock breakers installed to precondition oversize. 13.2.7 Facilities The currently installed maintenance workshop, refueling station, crib room and offices will be used to support current underground operations. 13.2.8 Equipment Equipment requirements are included in Table 13-7. Table 13-7: Primary Equipment, Ridgeway Equipment Description Equipment Type Number at Peak Loaders Sandvik LH517 1 Epiroc ST18 LHD 1 Grader Caterpillar 12M2 1 Service truck Caterpillar 730 1 Rock breaker Maclean BH3 1 Integrated tool carrier Volvo IT 90F 1


Cadia Valley Operations New South Wales, Australia Technical Report Summary Date: February 2026 Page 13-17 13.2.9 Production Schedule The LOM production schedule that includes the production from Ridgeway is provided with the cash flow analysis in Chapter 19. 13.2.10 Personnel The mining personnel total requirement for LOM operations is approximately 180 for Ridgeway Deeps Lift 1. Cadia Valley Operations New South Wales, Australia Technical Report Summary Date: February 2026 Page 14-1 14.0 PROCESSING AND RECOVERY METHODS 14.1 Introduction The copper-gold plants were first commissioned in 1998 and 2002 respectively for Concentrator 1 and Concentrator 2. Both concentrators have undergone a number of alterations and expansions. The testwork discussed in Chapter 10, in conjunction with operational results, were used to refine plant operations. Metallurgical testing programs have been conducted since the 1990s to test the amenability of the mineralization to conventional separation processes for gold, copper, and molybdenum. Based on these tests, two concentrators were constructed using conventional flotation and gravity separation methods and have subsequently treated the Cadia Hill, Ridgeway, and Cadia East mineralization. Testing programs included extensive comminution testing with results informing past and future throughput upgrades and debottlenecking of the two concentrator plants. Coarse particle flotation has been applied to the scavenger tails of Concentrator 1 Train 3 since 2018. A coarse particle flotation circuit with dedicated regrind and cleaning was installed on Train 1 and Train 2 in 2022. The molybdenum plant was designed to produce molybdenum concentrate as a by-product from the concentrator operations. 14.2 Flowsheet A simplified flow diagram for the two concentrators, molybdenum plant, and filter plant, is included as Figure 14-1. Cadia Valley Operations New South Wales, Australia Technical Report Summary Date: February 2026 Page 14-2 Figure 14-1: Simplified Process Flow Diagram Note: Figure prepared by Newmont, 2025. oarse Parti le lotation P ir uit e ondar rushers all ills ou her a en er lotation ells lash loat ra it ir uit old or ill ailin s hi ener e rind leaner ir uit e ondar rusher p rade all ill ou her a en er lotation ertiar rusher p rade ill ertiar ill Pe le rusher rushin rindin rd e ondar rusher o n e n tr a to r lotation rushin rindin o n e n tr a to r lotation P lash loat ra it ir uit old or Primar lone p rade dditional ertiar ill e ameson ell ou her ailin s hi ener dditional P ir uit on Pumps leaner ir uit ailin s hi ener e rind ill oarse ailin s o l P la n t il te r P la n t ou her lotation st nd leaner ells on entrate andlin to an s ul opper on entrate hi eners Pressure ilters ol on hi ener opper on hi ener to an on Pump e ei al an Pipeline to lane rd th leaner ells e rind ill ilter a oader Pipeline to ol Plant Intermediate hi ener leaner a en er ells to an s larifier opper on entrate to s rain to Port Cadia Valley Operations New South Wales, Australia Technical Report Summary Date: February 2026 Page 14-3 14.3 Plant Design 14.3.1 Concentrator 1 Design Concentrator 1 was commissioned in 1998, designed for Cadia Hill ore, and had a design capacity of 17 Mt/a. The circuit consisted of primary crushing, SAG and ball milling, gravity concentration to produce gold doré and flotation to produce copper–gold concentrate. In 2012, Concentrator 1 was upgraded for the processing of harder Cadia East ore which included the addition of a HPGR circuit, ahead of the SAG mill, and a third ball mill and third flotation train. In 2022, Concentrator 1 was upgraded to increase the throughput and recovery of Cadia East ore. This included the addition of a third secondary crusher, upgrading the SAG mill motor to 22 MW and a coarse particle flotation circuit. These modifications were designed to increase this circuit capacity to 26 Mt/a. 14.3.2 Concentrator 2 Design Concentrator 2 was commissioned in 2002 and had a target rate of 4 Mt/a. The circuit consisted of primary crushing, SAG and ball milling, gravity concentration to produce gold doré and flotation to produce copper–gold concentrate. In mid-2008, the facilities were upgraded to suit predictions of harder and fines-deficient ore from Ridgeway Deeps block cave mine. The upgrade included installation of a secondary crushing circuit and additional regrind mill power. A 2.24 MW Vertimill was installed in 2011 in a tertiary milling duty to reduce flotation feed size and improve metal recoveries. In 2022, Concentrator 2 was upgraded to increase throughput and maintain recovery of Cadia East ore. This included the addition of a second tertiary duty 3.2 MW Vertimill, upgrading of the secondary and tertiary crushers from MP800 to MP1000, upgrading the primary cyclones and pumps, and installation of a rougher Jameson cell. These modifications were designed to increase this circuit capacity to 8 Mt/a. 14.3.3 Molybdenum Plant Design Construction of the molybdenum plant commenced in 2020, and the plant was commissioned in 2022. The plant is scheduled to process between 300,000–400,000 t of Cadia concentrate and produce about 3,500–4,000 t of molybdenum concentrate annually. The molybdenum plant receives feed from the overland copper concentrate pipeline that transports concentrate slurry from the copper concentrators to the Blayney concentrate filter plant. The molybdenum flotation circuit includes a conditioning Eh/pH stage, a rougher flotation stage, a four-stage cleaner-scavenger circuit, a regrind stage, and thickener stage. The molybdenum concentrate is thickened, filtered, and dried, before being packaged into bulk bags for transport.


Cadia Valley Operations New South Wales, Australia Technical Report Summary Date: February 2026 Page 14-4 Copper-rich tails from the molybdenum plant rougher flotation stage are thickened and returned to the existing copper concentrate transport system for pumping to Blayney. 14.4 Equipment Sizing An equipment list for the concentrators and molybdenum plant is provided in Table 14-1. Table 14-1: Process Equipment Plant Area Description Manufacturer Model/Size Quantity Note Underground Jaw-gyratory crusher Thyssen-Krupp BK 63-75 4 Surface Jaw-gyratory crusher Thyssen-Krupp BK 63-75 1 Concentrator 1 HPGR Thyssen-Krupp (Polysius) PM 8-24 / 17 M 1 Secondary crusher Metso (Nordberg) MP1000 2 SAG mill Mill – Metso (Svedala), gearless motor drive – Siemens 40 ft 1 Gearless motor drive (GMD) 22MW Ball mill Metso (Svedala) 22 ft x 36 ft 6 in 2 Dual pinion drive Ball mill Metso 26 ft x 42 ft 1 Dual pinion drive Flash flotation cell Outotec SK1200 3 Batch centrifugal concentrator ConSep QS48 5 Knelson concentrator Batch centrifugal concentrator Sepro SB2400 2 Falcon concentrator Batch centrifugal concentrator Sepro SB5200 1 Falcon concentrator Rougher/scavenger flotation cells Outotec OK150 14 Rougher/scavenger flotation cells Outotec OK300 5 Cleaner/cleaner scavenger flotation cells Outotec OK30 10 Recleaner flotation cells Outotec OK8 3 Cleaner/cleaner scavenger flotation cells Outotec e50 10 Vertimill Metso VTM1250 1 Cadia Valley Operations New South Wales, Australia Technical Report Summary Date: February 2026 Page 14-5 Plant Area Description Manufacturer Model/Size Quantity Note Vertimill Metso (Svedala) VTM650 1 Although the body is that of a VTM650, the motor and gear box were modified effectively to a VTM800 Vertimill Metso VTM4500 1 Cleaner Jameson cell Glencore Technology B6500/24 1 (Formerly Xstrata Technology) Cleaner Jameson cell Glencore Technology B5400/18 1 (Formerly Xstrata Technology) Recleaner Jameson cell Glencore Technology E2532/6 1 (Formerly Xstrata Technology) Cleaner Jameson cell Glencore Technology E4232/10 1 (Formerly Xstrata Technology) Tailings thickener EIMCO 53 m 1 Tailings thickener FLSmidth 40 m 1 Concentrate thickener Outokumpu Supaflo 20 m 1 CrossFlow classifier Eriez XF-3050 4 HydroFloat cell Eriez HF-3350 2 HydroFloat cell Eriez HF-4250 4 Concentrator 2 Secondary crusher Metso MP1000 1 Tertiary crusher Metso MP1000 1 Pebble recycle crusher Kawasaki 1500Z 2 AG mill Metso (Svedala) 32’ x 16’ 1 Single pinion drive Ball mill Metso (Svedala) 6,706 mm x 8,534 mm 1 Single pinion drive Flash flotation cell Outotec SK1200 1 Batch centrifugal concentrator ConSep QS48 2 Knelson concentrator Batch centrifugal concentrator Sepro SB2400 2 Falcon concentrator Rougher Jameson cell Glencore Technology Z8500/12 1 (Formerly Xstrata Technology) Rougher/scavenger flotation cells Outotec OK100 7 Cadia Valley Operations New South Wales, Australia Technical Report Summary Date: February 2026 Page 14-6 Plant Area Description Manufacturer Model/Size Quantity Note Cleaner/cleaner scavenger flotation cells Outotec OK30 9 Recleaner flotation cells Outotec OK20 1 Recleaner flotation cells Outotec OK8 3 Vertimill Metso VTM1250 2 Flotation regrind application Vertimill Metso VTM3000 1 Tertiary milling application Vertimill Metso VTM4500 1 Tertiary milling application Recleaner Concorde Cell MetsoOutotec E3432/8 1 Retrofit to E-Type Jameson cell Tailings thickener Outokumpu Supaflo 29 m 1 Concentrate thickener Outokumpu Supaflo 12 m 1 Molybdenum Concentrator Rougher Jameson cell Glencore Technology E2532/6 1 (Formerly Xstrata Technology) Rougher-scavenger cells Outotec e30 5 Intermediate thickener Outotec 7m 1 HiGmill Outotec HIG75/200F 1 Flotation regrind application Cleaner/cleaner scavenger flotation cells Outotec e5 10 Recleaner Jameson cells Glencore Technology Z1200/1 2 (Formerly Xstrata Technology) Concentrate thickener Outotec 7m 1 Dewatering filter press Outotec PF1281 1 Larox filter Tailings thickener Outotec 24m 1 Copper–gold concentrate filtration GEHO pump Weir Minerals TZPM500 1 Dewatering filter press Jord C-3811 2 Plate and frame filter Cadia Valley Operations New South Wales, Australia Technical Report Summary Date: February 2026 Page 14-7 14.5 Power and Consumables 14.5.1 Energy Concentrator 1 uses approximately 60% of the site total power consumption, with Concentrator 2 using a further 15%. The site processing areas including water reticulation and tailings storage account for 75% of site power demand. Power is delivered via a distribution network fed by the site link to the state electricity grid. Power for the molybdenum plant is sourced from the Cadia Valley Operations network. 14.5.2 Water The water supply for the operations is from a number of sources including recovered water from tailings storage facility locations and tailings thickeners, onsite rainfall catchment, onsite bores, and nearby river systems. 14.5.3 Process Consumables The two copper–gold concentrators use the same suite of consumable products in the extraction of gold and copper concentrate from Cadia East ore including grinding media, primary collector (thiocarbamate), secondary collector (dithiophosphinate), tertiary collector (xanthate), emulsified diesel, frother, lime and flocculant. The molybdenum plant uses a suite of consumable products in the extraction of molybdenite from Cadia East copper–gold concentrate including sodium hydrosulfide, sodium hypochlorite, caustic soda, frother, carbon dioxide, defoaming agents, and emulsified diesel. 14.6 Personnel The processing facilities directly employ 250 persons.


Cadia Valley Operations New South Wales, Australia Technical Report Summary Date: February 2026 Page 15-1 15.0 INFRASTRUCTURE 15.1 Introduction Key infrastructure supporting the Cadia Valley Operations includes: • Operating panel cave mining operations at Cadia East; • Block cave operations at Ridgeway (on care and maintenance); • Ridgeway and Cadia decline and conveyor incline boxcuts and portals, hardstand areas, contractor’s area, mine workshops, general stores building, fuel storage facility, and administration and ablution facilities; • Underground crushing, handling, and incline conveyor systems to transfer ore and waste rock mined from Cadia East and Ridgeway to the ore processing facilities; • Ventilation shafts at both Cadia East and Ridgeway; • South waste rock facility; • Ore treatment facilities consisting of Concentrator 1 and Concentrator 2; • Molybdenum recovery plant; • Northern tailings storage facility (NTSF), southern tailings storage facility (STSF) and Cadia Pit TSF and associated tailings pipelines, pumps and tailings water return infrastructure; • Water management structures (Cadiangullong Dam, Copper Gully Dam, Hoares Creek Dam, Cadia Creek Weir, process water pond, site runoff pond, sediment ponds, waste rock dump leachate ponds, tailings drainage collection ponds); • Water pipelines and pumping stations; • Electricity substation, powerlines, communication towers, and switching stations; • Cadia dewatering facilities; • Various support facilities including truck and vehicle shops, warehouse, administration, contractor and temporary offices, fuel storage, core processing facilities, clinic and emergency response facilities, gatehouse, mess facilities, change rooms, personnel training facilities, information technology (IT) communications setups and towers, environmental monitoring facilities, water treatment plants, sewage treatment plants, reagents shed, and plant nurseries; • Concentrate loading and handling facilities. The railway facilities are leased. The infrastructure layout for the operations is shown in Figure 15-1. Cadia Valley Operations New South Wales, Australia Technical Report Summary Date: February 2026 Page 15-2 Figure 15-1: Infrastructure Layout Plan Note: Figure prepared by Newmont, 2025. Cadia Valley Operations New South Wales, Australia Technical Report Summary Date: February 2026 Page 15-3 The ongoing Cadia expansion project includes the following still to be executed: • Underground mine cave establishment for PC2–3, PC1–2, PC1–3, PC1–4, PC2–4, PC2–5, and PC3–1 in Cadia East with associated support infrastructure; • Ridgeway Deeps Lift 1 at Ridgeway with associated support infrastructure. An expansion to the tailings storage infrastructure that will be required for the LOM plan is discussed in Chapter 17.6.3. The final infrastructure layout that supports the LOM plan is provided in Figure 15-2. 15.2 Road and Logistics 15.2.1 Roads Access details are discussed in Chapter 4.2. The Mid-Western Highway (State Highway 6) connects Bathurst to Hay in western NSW, via Blayney, and the Mitchell Highway (State Highway 7) connects Bathurst to Bourke in northwestern NSW, via Orange. The Great Western Highway (State Highway 5) which connects Bathurst to Sydney provides access to Sydney. Main Roads 245 and 559 provide a link between Orange and Blayney. The principal route used to access the Cadia Valley Operations is from Orange via Forest Road and Cadia Road. Gravel haul roads provide access to the processing facilities, TSFs, and WRSFs. Gravel roads are used to access areas such as water supply dams, and ventilation shafts. Use of these internal access roads is restricted to mine personnel. The Cadia Valley Operations Dewatering Facility is accessed from Newbridge Road, which connects to the Mid-Western Highway in Blayney. 15.2.2 Concentrate Dewatering and Handling Copper concentrates are pumped to the Cadia dewatering facility at Blayney for final dewatering and railing to the Port Kembla Gateway for shipping to customer smelters. Design capacity is based on a concentrator copper metal production of up to 115 kt/a with a copper concentrate grade of 20.8% copper and 9% moisture content. The design of the dewatering facility includes an additional allowance for concentrate volume variations on a daily, weekly, and monthly basis, and maximum design capacity is 622,000 dt/a. Concentrate is loaded into containers using a mobile loader and forklift. The current rail contract with Qube Logistics allows for trains of 44 wagons (88 containers), based on about 5.5 rail services per week. Cadia Valley Operations New South Wales, Australia Technical Report Summary Date: February 2026 Page 15-4 Figure 15-2: Final Project Layout Note: Figure prepared by Newmont, 2025.


Cadia Valley Operations New South Wales, Australia Technical Report Summary Date: February 2026 Page 15-5 Port Kembla Gateway currently loads between two and three ships per month at an annual rate of between 300,000–400,000 dt/a, and has the potential capacity to handle between 600,000– 700,000 dt/a. Newmont has a Services Agreement in place with Port Kembla Gateway for the receival of concentrate by rail, unloading of trains, storage of concentrate prior to shiploading, stevedoring of concentrate and loading by bulk conveyor and spout onto export vessels. 15.3 Stockpiles Stockpiles are discussed in Chapter 17.4. 15.4 Waste Storage Facilities The WRSFs are discussed in Chapter 17.5. 15.5 Tailings Storage Facilities The TSFs are discussed in Chapter 17.6. 15.6 Water Management The water management strategy and supporting infrastructure are discussed in Chapter 17.7. 15.7 Built Infrastructure As noted in Chapter 15.1, much of the mine infrastructure is constructed and operational. However, additional infrastructure will be required to support the LOM plan: • Construction of a larger tailings pilot plant and embankment using sand (known as hydrocyclone sands); • Expansion of the existing 132 kV electrical substation; • Upgrade of existing infrastructure at the PAX facility; • Two HydroFloat cells; • Realignment of a section of the Belubula River pipeline; • Two additional Cadia East Underground Mine upcast surface ventilation fans; • A major realignment of Panuara Road; • Relocation of the existing on-site batch plant, warehouse, and associated laydown facility; • Additional tailings storage capacity (see discussion in Chapter 17.6.3. Cadia Valley Operations New South Wales, Australia Technical Report Summary Date: February 2026 Page 15-6 15.8 Camps and Accommodation As the Project is drive-in-drive-out of Orange and other nearby communities, there are no accommodation requirements. 15.9 Power and Electrical The operations are supplied by dual 132 kV feeders from Orange, known as the 9MC and 94G circuits, each consisting of a 5.2 km underground section of cable from the Orange North 132 kV switching station to the outskirts of Orange. The 94G circuit continues via a 22.2 km long overhead line directly to the Cadia 132 kV substation. The 9MC circuit continued via an overhead line to the Flyers Creek 132 kV switching station where it then splits into the 9MT circuit, which supplies Flyers Creek Wind Farm, and the 9MR circuit that supplies the Cadia 132 kV substation. Ownership of the assets is as follows: • Cadia Valley Operations: 132/33 kV substation at the Cadia mine; • Transgrid: Orange North 132 kV switching station; • Essential Energy: Flyers Creek 132 kV switching station; 132 kV circuits connecting Transgrid Orange North switching station, Flyers Creek switching station and the Cadia Valley Operations. The combined 9MR/94G service load is limited to the connection agreement maximum site load of 220 MVA. 15.10 Fuel The Cadia Valley Operations maintain a month’s fuel supplies on site to service the light and heavy vehicle fleet requirements. 15.11 Communications There are two public cell towers in the Cadia Valley, owned by Telstra and Optus. There are three wide-area network connections to the operations. 15.12 Water Supply Water requirements for the Project are discussed in Chapter 17.7. Cadia Valley Operations New South Wales, Australia Technical Report Summary Date: February 2026 Page 16-1 16.0 MARKET STUDIES 16.1 Markets 16.1.1 Existing Markets The Cadia Valley Operations produce two types of concentrates: • A high-quality clean copper concentrate with typical copper grades, elevated gold grades, payable silver, and relatively low levels of impurities; • A high-quality molybdenum concentrate. The quality of both concentrates and the continuing strong global demand for concentrates, means that these concentrates are readily marketable, and highly sought after by smelters and traders. Newmont also produces doré that is delivered to a gold refinery in Australia to produce refined gold and silver. Once refined, gold and silver is sold on the open market. 16.1.2 Cadia East The majority of the world’s copper concentrate production is processed through pyrometallurgical processes in copper smelters and refineries throughout the world. Primary smelting technologies may be further broken down to Outokumpu, Mitsubishi, Teniente, Noranda, Isasmelt and Vanyukov processes. Recent technological advances have seen the introduction of double-flash and bottom-blown furnaces, with both technologies being advanced significantly in China. The bottom-blown furnaces are said to be able to treat lower concentrate grades with higher impurities while maintaining high metal recoveries. Copper market demand is largely driven by the development of electrical transport, electrical transmission grids, and renewable power generation. Global copper demand is fueled by the backdrop of an expected acceleration in Chinese economic activity. Mines producing concentrate and smelters smelting and refining concentrate can be categorized as either integrated or custom. Integrated mines/smelters produce concentrate from their own mines for feed to their own smelters. Custom producers buy or sell concentrate on the open market. Some integrated producers cross the arbitrary definition by buying or selling concentrate on the market from time to time to supplement smelter feed or to offload excess mine production. The custom market accounts for about 60% of global copper concentrate and has grown markedly over the last 20 years. In contrast, the integrated share of the market has diminished over time. Growth in demand for refined copper has been dominated by China over recent years, and global refined copper marginal demand is virtually completely dependent on Chinese demand. Demand for custom concentrate is manifested through demand by custom smelters. In terms of demand for copper concentrate, this market is also China-centric. China has emerged as the largest buyer of copper concentrate on a global basis. Consequently, whereas Japanese and Cadia Valley Operations New South Wales, Australia Technical Report Summary Date: February 2026 Page 16-2 European smelters once led the market in establishing commercial terms which were often followed by others in the market, the Chinese smelters now share that role. Some 60% of custom concentrate purchasers are located in the Asian region. The natural market for concentrate from the Cadia Valley Operations is Asia, and the operations have a comparative advantage in selling to nearby smelters in Asia when compared with mines in the Americas and Africa. As additional tonnage at Cadia is produced, it will either be added to existing contracts (those contracts will be expanded) or sold to new smelter customers in Asia with whom direct communication already takes place. Although most smelters once sought to feed concentrate at 28–33% Cu on a blended basis, declining grades from major mines have forced them to feed at about 25–28% Cu. At a grade of around 22–25% Cu, Cadia concentrate will continue to be purchased for blending with other qualities of concentrates, in accordance with smelters’ feed plans. The forecast concentrate volume will be predominantly sold into the market on a forward (contracted) basis, with smelter direct contracts being the first preference. Any excess concentrate will be sold into the trader/spot market. Typical clean concentrates attract copper payable of 96.5%, subject to a 1.0 unit deduction. The gold-payable scale in a sales contract will vary depending on the smelter’s capabilities and gold in concentrate grade. Generally, the higher the gold in concentrate grade is the higher the payables will be. Gold payability typically ranges from 97.5–98.25%. In Asian markets, silver is paid at 90% of the analytical silver content subject to such content being higher than 30 g/t Ag. No payment is made below 30 g/t Ag. The concentrate market is influenced by an annual treatment and refinery charge (TC/RC), which are fees paid to smelters/refineries by mines for converting copper concentrate to copper cathode. These fees, known as the benchmark, are currently set by leading miners and smelters, and signal to the market that copper concentrate supply is in deficit or surplus. Molybdenum is used in steel alloys to increase strength, hardness, electrical conductivity and resistance to corrosion and wear. These 'moly steel' alloys are used in parts of engines. Other alloys are used in heating elements, drills and saw blades. The main end-use industries include building and construction industries and the aerospace and defense industries. Molybdenum supply predominantly comes from producers such as China, Chile, and the United States, with approximately 50% of production produced as a by-product from mining operations with other commodities as the primary payable element. The market is currently operating in supply deficit with non-Chinese mine production dropping 23% since 2020. The market continues to operate in a deficit as new roasting capacity comes online; hence the market is expected to remain strong and competitive. The molybdenum concentrate will have a grade ranging from 48–52% Mo with <2% Cu. The standard payable terms for molybdenum are 100% of the molybdenum value. Each concentrate is assessed on a case-by-case basis, and discounts are applied to cover the cost of consumers’ treatment costs. Material is currently loaded into bulk bags and containerized for global shipment.


Cadia Valley Operations New South Wales, Australia Technical Report Summary Date: February 2026 Page 16-3 16.1.3 Ridgeway Marketing for any future copper concentrate and doré production from Ridgeway would use similar approaches to those outlined in Chapter 16.1.2. for Cadia East. Ridgeway would not produce a molybdenum concentrate. 16.2 Commodity Price Forecasts Newmont uses a combination of historical and current contract pricing, contract negotiations, knowledge of its key markets from a long operations production record, short-term versus long- term price forecasts prepared by Newmont’s internal corporate marketing group, public documents, and analyst forecasts when considering long-term commodity price forecasts. Higher metal prices are used for the mineral resource estimates to ensure the mineral reserves are a sub-set of, and not constrained by, the mineral resources, in accordance with industry- accepted practice. The long-term commodity price and exchange rate forecasts are shown in Table 16-1. Table 16-1: Commodity Price and Exchange Rate Forecasts Commodity Units Mineral Reserves Mineral Resources Gold US$/oz 2,000 2,300 Silver US4/oz 25.00 28.00 Copper US$/lb 3.75 4.25 Molybdenum US$/lb 13.00 16.00 Exchange rate US$:AU$ 0.70:1 0.70:1 16.3 Contracts There are contracts currently in place to support sales of all products produced by the Cadia Valley Operations; including long-term, smelter direct copper concentrates sales and purchase agreements, molybdenum concentrate sales and purchase agreements, and doré refining agreements. There are contracts in place providing ship-loading services, rail services, and loading/port agency services. Other major contracts for the Cadia Valley Operations cover categories such as electricity supply, bulk commodities, operational and technical services, mining and process equipment, earthworks projects, security, transportation and logistics, and administrative support services. Contracts are typically reviewed and negotiated on an as-needs basis. Based on Newmont’s knowledge, the contract terms are typical of similar contracts both regionally and nationally. Contracts required to support the Cadia East and Ridgeway operations are expected to be in line with existing contract terms and norms. Cadia Valley Operations New South Wales, Australia Technical Report Summary Date: February 2026 Page 17-1 17.0 ENVIRONMENTAL STUDIES, PERMITTING, AND PLANS, NEGOTIATIONS, OR AGREEMENTS WITH LOCAL INDIVIDUALS OR GROUPS 17.1 Introduction The main New South Wales legislation of relevance is the EP&A Act. Newmont presently holds a Project Approval for the Cadia East Project (06_0295) under the EP&A Act (as modified) that provides for mining operations until June 30, 2031. Other NSW State legislation of particular relevance to the proposed Cadia expansion include the following Acts and subordinate regulations: • Mining Act, 1992; • Protection of the Environment Operations Act, 1997; • Water Management Act, 2000; • Biodiversity Conservation Act, 2016; • National Parks and Wildlife Act, 1974. The key Commonwealth act of potential relevance to Cadia is the Environment Protection and Biodiversity Conservation Act 1999 (EPBC Act). Newmont holds an approval under the EPBC Act for the Cadia East Project (2006/3196). The EPBC Act approval (2006/3196) also has effect until June 30, 2031. 17.2 Baseline and Supporting Studies Commencing in 1998 as an open cut mine, and operating continuously since then, the Cadia Operations currently operate in accordance with NSW Project Approval (PA 06_0295) (Cadia consent) granted by the NSW Minister for Planning on January 6, 2010. An Environmental Assessment (EA) was prepared to support the application for the consent which contains all baseline, supporting studies and impact assessments. PA 06_0295 consolidates and replaced the previous NSW development consents issued to the Cadia Operations, and has been modified on 15 occasions to enable the optimization and expansion of mining operations at site. Each modification was supported by environmental studies and impact assessments. The modifications are listed in Table 17-1 . Cadia Valley Operations New South Wales, Australia Technical Report Summary Date: February 2026 Page 17-2 Table 17-1: Cadia Modifications Modification Chronology Description MOD 1 1 Cadia Hill decline; MOD 2 3 Blayney dewatering facility; MOD 3 2 Cadia road pipeline; MOD 4 4 Surface preconditioning (hydraulic); MOD 5 5 Surface preconditioning (blasting); MOD 6 6 Processing rate increase; MOD 7 7 Biodiversity offsets; MOD 8 9 Administrative; MOD 9 8 Surface preconditioning and on site warehouse MOD 10 10 Molybdenum plant relocation; MOD 11 11 Cadia Hill tailings; MOD 12 12 Cadia Hill tailings Increase; MOD 13 13 Cadia Hill tailings completion ; MOD 14 14 Increased processing rate; MOD 15 15 Various including tailings dam embankment upgrade. 17.3 Environmental Considerations/Monitoring Programs Monitoring undertaken across the Project includes: • Noise monitoring; • Air quality monitoring; • Blast and vibration monitoring; • Groundwater level and quality monitoring; • Spring monitoring; • Surface water flows and quality; • Aquatic ecosystem monitoring; • Rehabilitation monitoring; • Biodiversity (flora and fauna) monitoring; • Pollution discharge monitoring; • Energy and emissions monitoring; and Cadia Valley Operations New South Wales, Australia Technical Report Summary Date: February 2026 Page 17-3 • Climate monitoring. Environmental monitoring is documented in the following management plans: • Cadia Water Management Plan (2023); • Cadia Offsite Traffic Management Plan (2023); • Cadia Biodiversity Management Plan (2025); • Threatened Species Management Protocol (2025); • Cadia Rehabilitation Management Plan (2024); • Cadia Rehabilitation Strategy (2020); • Cadia Cultural Heritage Management Plan (2022); • Cadia Historic Heritage Management Plan (2025); • Cadia Noise Monitoring Program (2021); • Cadia Blast Monitoring Program, (2025); • Cadia Dewatering Facility Water Management Plan (2023); • Cadia Air Quality and Greenhouse Gas Management Plan (2024). Conditions in the Project Approvals, Environmental Protection License 5590, and mining leases, require annual reporting to various organizations, and local and State government departments on Newmont’s environmental performance at the Cadia Valley Operations. The mining leases further require a Forward Works Program to be prepared that outlines significant disturbance, rehabilitation plans, and mine closure strategies. Development not otherwise covered by the project approvals and Mining Operation Plans requires new authorizations. Management plans and programs were developed in consultation with relevant community groups, government agencies, and departments, and are updated as required. Table 17-2 summarizes the key documents and the monitoring regime in place. Reports and results are regularly posted to the Cadia Valley Operations website. Safety management systems at the Cadia Valley Operations are governed by the Cadia Safety Management Plan. In addition to established site standards and procedures, the Cadia Valley Operations maintain major hazard and risk registers.


Cadia Valley Operations New South Wales, Australia Technical Report Summary Date: February 2026 Page 17-1 Table 17-2: Environmental Management and Monitoring Regime Aspect Management/Monitoring Plan or Program Monitoring Type/ Parameters Frequency of Sampling or Monitoring Monitoring Locations Vibration and overpressure Cadia vibration (blast) monitoring program Blast monitoring units (measure ground vibration (mm/sec) and air overpressure dB (Lin Peak)) 24 hours continual (12:00–12:00) Coorabin Meribah; Chimney; Chesterfield; Rosebank; Mayburies; Warrengong Air quality Cadia Air Quality and Greenhouse Gas Management Plan Dust deposition Monthly DG5A: Bundella; DG15A: Bundarra; DG17: Ashleigh Park; DG18: Wire Gully; DG19: Oakey Creek; DG29A: Meribah; DG12A: Flyers Creek Weir; DG9A: Exploration; GL6: Somervaille; DGL8: CDWF; DGL9 – Hollwood Respirable crystalline silica Monthly D1: Bundarra; D2: Woodville; D3: Triangle Flat; D4: Meribah TSP 24-hour period, 6- day interval D1: Bundarra; D2: Woodville; D3: Triangle Flat; D4: Meribah, Flyers Creek BAM (PM10 and PM2.5) 24 hours continual (12:00–12:00) D1: Bundarra; D2: Woodville; D3: Triangle Flat; D4: Meribah TSP, Type 1 & Type 2 metals Monthly Vent rises VR3, VR5, VR7, VR8 Diesel particulates, respirable crystalline silica Annually Vent rises VR3, VR5, VR7, VR8, VR11, VR12 Noise Cadia Noise Monitoring Program Unattended (7-day period) dBA and attended Biannually on a rotation basis Chesterfield; Warrengong; Willow Creek; South Log; Bonnie Glen; Rosebank; Northwest; Attended 2-monthly Chesterfield; Warrengong; Willow Creek; South Log; Bonnie Glen; Rosebank; Northwest; Cadia Valley Operations New South Wales, Australia Technical Report Summary Date: February 2026 Page 17-2 Aspect Management/Monitoring Plan or Program Monitoring Type/ Parameters Frequency of Sampling or Monitoring Monitoring Locations Cadia Offsite Traffic Management Plan Traffic (directional unattended) Biannual Cadia Road; Woodville Road; Orchard Road Pests and weeds Biodiversity Management Plan Vertebrate pests, noxious weeds, environmental weeds Continuous Site wide and neighboring Cadia owned farms Meteorology Water Management Plan Temperature; barometric pressure; wind direction; wind speed; sigma-theta; relative humidity; solar radiation; evaporation; rainfall Continuous Weather stations Ridgeway; Southern Lease Boundary Pluviometers (rainfall only) PVDC; PVLO; 412147; USFC; SPR03; PV3; PV6; MB74; CWRR; 412167; 412702 Rehabilitation Rehabilitation Management Plan Ecology monitoring Annually* *Pending climatic conditions, reference site monitoring may be extended to biannual Woodland Reference Sites* RfWood01: Bundarra; RfWood02: Ashleigh Park; RfWood04: CVO Access Rd; RWood05 (RfBush01); RfPast01; RfPast03; RrRip02 (Bakers Shaft); RrRip03 (CVO Cadiang Ck) Monitoring Sites Ashleigh Park; South Dump 01; South Dump 02; South Dump 03; South Dump 04; South Dump 05; South Dump 06; South Dump 07; South Dump 08; South Dump 09; South Dump 10; North Dump 01; North Dump 02; North Dump 03; Willunga DS01; Willunga DS02; Cadiangullong Creek; Creek Diversion Cadia Valley Operations New South Wales, Australia Technical Report Summary Date: February 2026 Page 17-3 Aspect Management/Monitoring Plan or Program Monitoring Type/ Parameters Frequency of Sampling or Monitoring Monitoring Locations Cover system performance (including acid rock drainage) Rehabilitation Management Plan Thermal conductivity water; content sensor net; radiometer water levels; interflow monitoring; rain gauge Continuous North Waste Rock Dump P1; P2; P3; P4; P5; P6; S1; S2 Natural Site South Waste Rock Dump P1; P2; P3, P4; P5; P6 Surface and Groundwater Water Management Plan Water Quality, Water Level Monthly, biannually, yearly 53 surface water locations, 115 groundwater monitoring locations Aquatic ecosystem monitoring Water Management Plan Macroinvertebrate, fish populations, and aquatic habitat condition Biannually (autumn and spring) Cadiangullong Creek CC1; CC2; CC3; CC4; CC5 Flyers Creek FC1; FC2 Swallow Creek SC1 Panuara Rivulet PR1; PR2 Rodd’s Creek RC1 Diggers Creek DG1 Historical heritage Historical Heritage Management Plan Monitoring for structural damage of Cornish engine house, crusher and chimney and historic surrounds in SHR779 Monthly (internal); annual (external independent) SHR 779 Cadia Valley Operations New South Wales, Australia Technical Report Summary Date: February 2026 Page 17-4 Aspect Management/Monitoring Plan or Program Monitoring Type/ Parameters Frequency of Sampling or Monitoring Monitoring Locations Sediment dams Water Management Plan Water level and maintenance/pump out requirements Following 10 mm rainfall 1% AEP design dams SROP; northern leachate (NLD); southern leachate (SLD); ST14; R2 5% AEP design dams CS; AR1; AR4-5 combined; CD GL; CD HT; SB4A; SB10; SB12; SB14; SB15; CD15; CP1A*; CP2; CP3; CP4; CD11’ CD13; CD14; molybdenum plant area; RCD (1); H18-H19 combined; T6; T7-T8 combined (1)


Cadia Valley Operations New South Wales, Australia Technical Report Summary Date: February 2026 Page 17-1 17.4 Stockpiles The majority of the surface stockpiles generated from the mining of Cadia Hill and Ridgeway were processed through the concentrator facilities. Mineral resources in stockpiled materials were estimated at Cadia Hill. 17.5 Waste Rock Storage Facilities The current waste rock materials and low-grade ore categories are classified using color nomenclature (Table 17-3). Table 17-3: Waste Management Waste Type Comment Blue waste Managed as non-acid forming; identified by ore control as having a modelled total sulfur content that is less than 0.5%. Pink waste Managed as potentially acid-forming; identified by ore control as having modelled total sulfur content that is greater than or equal to 0.5%. Yellow waste Stockpiled, low-grade mineralized ore. Green waste Stockpiled mineralized waste rock with current sub-economic gold/copper content. This material may or may not be reclaimed for processing before the end of the mine life; is mineralized and managed as potentially acid forming. Low-grade ore and mineralized waste (i.e. yellow and green materials) are placed in accessible parts of the South Waste Rock Facility for reclamation. Blue waste rock can be used as construction material (e.g. for TSF raises). Pink waste is encapsulated with a combination of a low permeability layer and a cover of blue waste material over each layer of pink waste material. The cover system is designed to reduce oxygenation and infiltration rates. The approved South Waste Rock Facility has a surface disturbance area of approximately 450 ha and extends to about 100 m above the natural surface level. The facility is partially rehabilitated in accordance with Newmont’s commitment for progressive rehabilitation over the life of the mine. In-line with this strategy, additional rehabilitation is planned to be completed prior to operational closure. Mine waste and tailings were subject to rigorous geochemical testwork, using best-practice methods to assess risks of acid generation from oxidation of sulfides. While some waste is potentially acid forming (PAF), kinetic testwork (regular leaching of columns of material) has shown that sulfide oxidation is slow, so that PAF waste is unlikely to produce acid drainage while stored at surface prior to being encapsulated with non-acid forming (NAF) and/or acid-consuming waste. Prior to encapsulation, PAF material is stored in a designated compartment within the waste stockpile, to manage risks of acidic and metal-enriched (particularly copper-enriched) drainage Cadia Valley Operations New South Wales, Australia Technical Report Summary Date: February 2026 Page 17-2 escaping to the broader environment. As much as 50% of the open-pit mine waste was PAF, as is almost all underground waste. 17.6 Tailings Storage Facility 17.6.1 Overview There are three tailings storage facilities: the Northern Tailings Storage facility (NTSF), the Southern Tailings Storage Facility (STSF), and the mined-out Cadia Hill open pit (Cadia Pit TSF), each of which are located within the Cadia mining lease (Figure 17-1). Cadia Valley Operations New South Wales, Australia Technical Report Summary Date: February 2026 Page 17-3 Figure 17-1: Tailings Storage Facility Location Plan Note: Figure prepared by Newmont, 2025. Cadia Valley Operations New South Wales, Australia Technical Report Summary Date: February 2026 Page 17-4 The NTSF, in operation since 1998, is located approximately 3 km south of the processing plant site, and the STSF, in operation since 2002, is downstream of the NTSF. Both TSF embankments were constructed across the former Rodds Creek; the NTSF being at the upstream location and the STSF at the downstream location. The NTSF design consists of an earth and rock-fill dam, with nine embankment raises completed. All raises since 2008 have involved upstream construction. The STSF is also an earth and rock-fill dam, with, to date, six embankment raises completed; the last three of which used the upstream method. The Cadia Pit TSF and STSF are planned to be operated to the current approved tailings elevations with future STSF raises converted from upstream towards centerline raise methods. Tailings were shown to be non-acid forming, which significantly reduces potential costs of closure and rehabilitation of the TSFs. 17.6.2 Northern Tailings Storage Facility (NTSF) Embankment Failure On March 9, 2018, a slump (the Event) occurred in the southern wall of the NTSF, causing it to lose containment of tailings. The tailings were captured within the basin of the STSF. A prohibition notice issued by the NSW resources regulator on depositing tailings in the NTSF remains in place as at December 31, 2025. An Independent Technical Review Board (ITRB) investigation of the Event was completed in April, 2019 and has been publicly released. The Independent Technical Review Board ultimately attributed the failure to slow movement in a previously unidentified weak foundation layer, which lead to the liquefaction of tailings and sudden failure of the slope. In response to the Independent Technical Review Board recommendations, Newcrest expanded geotechnical investigations of the TSF foundations and identified areas where additional embankment buttressing was required. Newmont have also significantly increased surface and subsurface monitoring of the TSFs since the Event. Newmont continues to investigate the remediation of the NTSF slump zone, and is undertaking buttressing of the embankment, as approved. Since April 2018, tailings deposition has primarily been in the Cadia Pit TSF with some deposition in the STSF also occurring, with no deposition in the NTSF. Newcrest engaged expert engineering firms to develop buttress designs and to remediate existing TSF embankments to acceptable safety levels. Where there was a lack of data, conservative assumptions on foundation strengths were assumed. Initial buttressing of the NTSF western wall was completed in 2023, with buttressing work on-going as at December 31, 2025. Buttress construction along the STSF was completed in 2025 to support ongoing operations. 17.6.3 LOM Requirements LOM plan requirements for tailings storage were reviewed during 2023. Storage capacity of the STSF was estimated at 85 Mt from December 31, 2025 to the currently-approved design height.


Cadia Valley Operations New South Wales, Australia Technical Report Summary Date: February 2026 Page 17-5 The total deposition storage for the Cadia Pit TSF would be 140 Mt from July 1, 2023. The deposition plan for operations would therefore consist of the two TSFs, with the Cadia Pit TSF receiving tailings from trains 1, 2 and 3 from Concentrator 1 and the STSF receiving tailings from Concentrator 2. In this scenario, the current tailings facilities will be filled after 2030. Future tailings storage beyond the Cadia Pit TSF and STSF storage capacities will be required later in the mine plan to support the LOM production plan envisaged in this Report. Planning and community engagement is currently ongoing to extend the STSF in height and footprint (referred to as the Southern Tailings Storage Facility Extended) and different technologies are being considered as part of the regulatory approvals process. The capital and operating cost estimates include provision for future tailings storage. These costs were included in the economic analysis that supports the mineral reserves. 17.6.4 Deposition Methods The tailings delivery infrastructure currently delivers tailings from Concentrator 1 and Concentrator 2 to the Cadia Pit TSF. As at December 31, 2025, no tailings are being deposited into the NTSF and STSF. 17.7 Water Management 17.7.1 Management Strategy The water management system includes the components in Table 17-4. The majority of water on-site is recycled. The water management strategy is outlined in Table 17-5. Table 17-4: Water Management System Elements Item Item Tailings storage facilities return water system including the Central Pumping Station Return water from the Cadia dewatering facilities. Process water pond Cadia Hill open pit (dewatering). NTSF and STSF Ridgeway/Ridgeway Deeps underground mine (dewatering). Sediment dams and ponds containing site runoff Cadia East and Cadia Hill Deeps exploration declines (dewatering). Waste rock dump leachate ponds Orange Sewage Treatment Plant tertiary treated effluent (delivered to site via a pipeline owned by Orange City Council. Cadiangullong Dam, which has a capacity of approximately 4,200 ML On-site groundwater extraction bores (potable water, and process water under exceptional circumstances). Cadia Valley Operations New South Wales, Australia Technical Report Summary Date: February 2026 Page 17-6 Item Item Cadia Creek Weir (gravity fed to Cadiangullong Dam) Flyers Creek Weir. Allows extraction of water from Flyers Creek when flows in the creek are above 3.5 ML/day. Belubula River pumping system Cadia Extended open pit acts as a water storage reservoir. Rodds Creek Water Holding Dam, which holds water pumped from the Belubula River (maximum annual licensed quantity of 7,205 ML) and other sources as required (see Table 17-5). Table 17-5: Water Management Strategy Area Comment Processing plant and ore stockpile areas Runoff from the ore processing facilities site is intercepted and conveyed to the process water pond via a system of bunded collection drains constructed around the perimeter of the plant area. The design basis is containment of all runoff from a one-in-100 year average recurrence interval (1% AEP), 72 hour rainfall event. Mining operations A system of sediment dams, clean water diversions, internal runoff drains and culverts are in place. Mine dewatering system Water collected from Ridgeway and Cadia Hill is sent to the process water pond or the Rodds Creek Water Holding Dam. Water from Cadia East is sent to TH2003 or the process water pond. Tailings Seepage from the NTSF reports to the STSF and decant pool. Seepage from the STSF reports to a seepage collection pond below the STSF. A float controlled pump located at the seepage collection pond returns collected seepage water to the STSF. Water recycling from the NTSF and STSF is maximized through the use of floating decant structures, a runoff/drainage collection pond and return water system. Rodds Creek Water Holding Dam Collects and holds the following: licensed water extractions from the Belubula River; water transferred from Cadiangullong Dam; excess water in the site water management system, including but not limited to excess water in the tailings storage facilities, water from on-site sediment dams, and water from underground dewatering activities; and treated effluent from Orange. Internal runoff collection Project area runoff is collected by a series of bunds and collection ponds, the majority of which are existing and approved. Runoff from the administration/laydown areas and other disturbed areas is collected during rainfall events and transferred to the process water pond or Rodds Creek Water Holding Dam for inclusion in the water supply system. The objectives of the erosion and sediment control system are to control soil erosion and sediment generation from areas disturbed by construction activities; and to maintain water quality (particularly in terms of suspended solids content) in local watercourses to acceptable standards for downstream use. Cadia Valley Operations New South Wales, Australia Technical Report Summary Date: February 2026 Page 17-7 The water management strategy incorporates the following components: • Sequencing to reduce to minimum practicable levels the potential for sediment generation; • Upslope clean water diversions to limit run-on to disturbed areas; • Use of small-scale runoff controls comprising silt fences and rockfill filter bunds; • Rapid stabilization and/or revegetation of disturbed areas. 17.7.2 Cadia Pit TSF A review was conducted of the impact of using the mined-out Cadia Hill open pit as a TSF. The geotechnical investigation, based on ongoing recalibration of geotechnical models, indicated that the Cadia Hill open pit and the Cadia East subsidence zone would not intersect. Instead of a single pit lake, there would be a lake on each of the two mining areas. The groundwater assessment considered the potential groundwater implications of the proposed deposition of approximately an additional 177 Mt of tailings in the Cadia Hill open pit. Tailings slurry, initially deposited to 713 mAHD, will settle to about 563 mAHD in the middle of the former Cadia Hill open pit. Within a 6–7-year period, it is anticipated that the level of the tailings will fall below 700 mAHD and a lake will form over the settling tailings. post-closure, as the pit water level falls and equilibrates, the potential for direct seepage to Cadiangullong Creek will reduce to zero. A post-mining groundwater elevation between 700–710 mAHD in the vicinity of Cadiangullong Creek indicates there will be an inward hydraulic gradient established southwest of the pit wall resulting in the pit forming a long-term groundwater ‘sink’. Additional monitoring bores were installed to monitor the impact of tailings deposition in the Cadia Hill open pit, with further bores planned adjacent to the southwestern corner of the Cadia Pit TSF. Monitoring activities will remain in place post closure of the Cadia Pit TSF. Surface water monitoring suggests that the in-pit water is currently significantly less saline than long term water quality predicted for the approved final void. From a surface water perspective, it was concluded that there would be minimal surface water impacts from the proposed continued tailings deposition into the Cadia Pit TSF. Newmont manages water that accumulates in the Cadia Pit TSF (from tailings supernatant water and rainfall runoff) by recovering (pumping) this water to the water management system for re- use in ore processing. Pumping rates would approximately match the tailings deposition rate and anticipated rainfall runoff. Reclaim from the Cadia Pit TSF would be given the same use priority as the other operational tailings storages. 17.8 Water Supply 17.8.1 Overview Water supply for mining and processing purposes is characterized by variable supply sources. Water requirements are proportional to the amount of mineral processing and significant water Cadia Valley Operations New South Wales, Australia Technical Report Summary Date: February 2026 Page 17-8 storage is required to provide consistent supply. The amount of water taken from each source is dependent on the conditions set through agreement or licensing and the physical amount available. The water supply scheme consists of recycling of water used on-site and make-up water required to compensate for losses in the system. Mine water and excess water in the TSFs are recycled. Make-up water sources comprise extraction from the Belubula River, Cadiangullong Dam, Rodds Creek Water Holding Dam, Flyers Creek Weir, Cadia Creek Weir, Orange Sewage Treatment Plant treated effluent, on-site groundwater extraction bores, and site run-off (see also water management discussion in Chapter 17.7). Harvesting of water on-site (including Cadiangullong Creek, Flyers Creek, Cadia Creek, Rodds Creek and Copper Gully) is licensed up to 4,200 ML/a. In addition to ensuring adequate water supply, the water system also plays a critical role in managing water accumulation during prolonged periods of above average rainfall, as occurs during La Nina events. This is achieved by reserving airspace in the Rodds Creek Water Holding Dam to allow transfer of water from the TSF, leachate collection dams and sediment control dams. Tertiary treated effluent is sourced from Orange under an agreement between the Orange City Council and Newcrest (now Newmont). The agreement has an upper limit on the amount that can be supplied per annum, but varies depending on the rainfall. Extraction of water from surface water systems (creeks and river) and groundwater is governed by water licenses issued by the NSW State Government. The conditions imposed on those licenses limit the rate of extraction, the times at which water can be extracted and the total amount of water that can be extracted per year. A water balance review in support of 32 Mt/a operations till 2030 was completed, assuming deposition of highly-thickened tailings, 65% w/w solids, from Concentrator 1 into the STSF at a rate of 14 Mt/a. The remaining tailings from Concentrator 1 were assumed to continue to go to the Cadia Pit TSF at a rate of around 10 Mt/a, while Concentrator 2 tailings would report to the STSF at approximately 8 Mt/a. Models showed that there is a very low risk of water shortage in the short-term (five years). Over the longer term, there is a small risk of around 10% in any given year of a small shortfall of approximately 1,000 ML which equates to around 2 Mt/a of production rate. Installation of a high compression thickening facility to improve the overall recovery of water from tailings at the higher throughput rates and the installation of 150 L/s of dewatering capacity to return rainfall back to the process plant will be required to ensure acceptable water reliability for the Cadia Valley Operations. No further external water sources or supplies are considered necessary for the LOM. Droughts have, in the past, resulted in a prolonged period of very low water supply. Drought conditions are a risk to future operations if unduly prolonged. Based on the Aqueduct Water Risk Atlas, which assesses water risk on a five-tiered scale against a series of indicators (including physical quantity, quality, and regulatory and reputational risk), the water risk ranges from medium to high at the Cadia Valley Operations. This rating is the median of the risk ratings assigned in the atlas.


Cadia Valley Operations New South Wales, Australia Technical Report Summary Date: February 2026 Page 17-9 17.8.2 Water Recycling The LOM plan assumes that 65–70% of all water will be reused. Newmont has continued to implement water saving efficiency measures which has resulted in net water reuse rates increasing from approximately 65–70% to approximately 85%. This higher rate of water reuse has been driven by improving the level of water reuse from the tailings thickeners in the process plant and by exceptionally high water reuse rates being delivered from the Cadia Pit TSF. Newmont continues to pursue further water saving initiatives, both in the plant and by way of optimization of onsite bores. 17.9 Closure Plan The overarching rehabilitation goals, final land uses and landforms, and mine closure benchmarks are detailed in the Cadia Valley Operations Rehabilitation Management Plan (2024). At the completion of mining, the key final landforms/features, as currently approved, will include the following: • Landscaped pasture and woodlands over the South Waste Rock Facility and North Waste Rock Facility, and waste rock backfilled Cadia Extended open pit including selective encapsulation of potentially acid-forming waste rock, with a non-acid forming material and topsoil cover; • Grazing land over the NTSF and STSF; • Secured subsidence zones created by Ridgeway and Cadia East; • Water cover Cadia Hill open pit void; • Decommissioning and rehabilitation of mine infrastructure, e.g. ore processing facilities and workshops; • Retaining Rodds Creek Water Holding Dam, Cadiangullong Dam, and associated pipelines for potential future regional water infrastructure demands; • Vegetation corridor enhancement areas across Newmont-owned land. The key element of the Cadia expansion project that would require revision of the currently- approved Cadia East project rehabilitation commitments is the development and closure of the Cadia Pit TSF that would largely be backfilled with tailings with a supernatant final void lake. The Cadia Mine Closure Plan includes a detailed cost estimate, which is used in determining the closure liability. Additionally, the Forward Works Program is a requirement of the mining leases and contains Newmont’s rehabilitation commitments for the period of the plan (usually three years). Considerable rehabilitation of WRSFs has already been completed, with success evidenced by the absence of significant erosion and by well-established vegetation. Cadia Valley Operations New South Wales, Australia Technical Report Summary Date: February 2026 Page 17-10 Newmont’s closure planning includes provision for retention of infrastructure of potential use to other parties, and extensive monitoring, especially of water quality and landform stability. The closure provision in the financial analysis supporting the mineral reserves is estimated at US$0.5 B. 17.10 Permitting 17.10.1 Statutory Environmental Approvals and Compliance Project Approval 06_0295 (PA 06_0295) for the Cadia East Project was granted by the NSW Minister for Planning under Part 3A of the EP&A Act on January 6, 2010. PA 06_0295 includes the Cadia East underground mine, the Cadia Hill open pit mine (now used to store tailings), the Ridgeway underground mine, the NTSF and STSF, the concentrate dewatering facilities in Blayney, and a wide range of ancillary and supporting infrastructure. Commonwealth (Federal) approval under the EPBC Act was required for Cadia East Project Approval because of potential impacts on a Federally-Listed Endangered Ecological Community. The Commonwealth agreed, as is usual, that Federal requirements could be addressed through the NSW Assessment Bilateral Agreement (the Agreement). The Agreement streamlines the assessment process for major projects that require both NSW and Australian Government environmental approvals. It is made under the Commonwealth's EPBC Act. Under the Agreement, the NSW Government assesses development applications on behalf of the Australian Government. The Australian Government remains the decision-maker for the EPBC Act approval, considering the assessment report prepared by NSW's Department of Planning and Environment. Subordinate approvals (authorities to construct, licenses to operate and to extract groundwater and surface water, etc.) were obtained as required. These approvals have led to the development of sophisticated and well-integrated environmental management plans designed to satisfy the operational performance indicators and thresholds that form part of the approvals. Compliance is primarily reported via an Annual Review Report to the NSW Government, as required by the EA process and Environment Protection License. Other reports are produced to meet conditions of subsidiary licenses, as required by relevant legislation. Copies of these are publicly available on the Cadia Valley Operations website. 17.10.2 Operating Permits Newmont holds the key permits required to support the current operations. These permits are summarized in Table 17-6. Cadia Valley Operations New South Wales, Australia Technical Report Summary Date: February 2026 Page 17-11 Table 17-6: Key Permits Permit/Permit Area Note Cadia East Project Approval PA06_0295 and subsequent modifications. Granted mining leases ML1405; ML1449; ML1472; ML1481; ML1689; ML1690. Local development consents Black Rock Range Subdivision (Development Consent No. 16/2010). Environmental protection license Approval No. 5590, and subsequent variations and revisions. Heritage approvals and permits General monitoring/archival recording; conservation of Cadia (Cornish) engine house crusher room and chimney; development consent for a rural cemetery, garden of remembrance and interpretive center; excavation permits for Little and Big Cadia; retention of existing strengthening of engine house, crusher room, and chimney. Prescribed dams (Dams Safety Act 1978) Cadiangullong Dam; Cadia Tailings Dam (Northern TSF); Cadia Southern Tailings Dam (Southern TSF); Rodds Creek Water Holding Dam; North Waste Rock Dump Detention Basin (Hoares Creek Dam). Enclosure permit No. 20364. Work Cover Hazardous chemicals at premises; license to store explosives. Environmental Protection Authority Resource recovery order and resource recovery exemption – Orange treated sewage biosolids. 17.10.3 Modification 15 Newmont is seeking a modification to PA 06_0295 to allow for placing additional buttressing material on the outer wall of the TSF embankment footprints, and therefore changes to the embankment footprints, the restart of the Ridgeway underground mine and other changes to related elements at Cadia (referred to as the Tailings Storage Facility Embankment Buttressing Modification). 17.10.4 Cadia Continued Operations Project The Cadia Continued Operations project is proposal is for a continuation of existing operations beyond 2031 (for a period of approximately 22–25 years from the date of approval, to 2048– 2050). The three main elements are: • Continued underground mining in the Cadia East and Ridgeway mining areas; • Construction of an extension to the current STSF; • Realignment of the Panuara and Cadia Roads to account for these project features. Cadia Valley Operations New South Wales, Australia Technical Report Summary Date: February 2026 Page 17-12 Community involvement and input also underpins the Social Impact Assessment process that is being undertaken as a part of the Environmental Impact Statement, to ensure that the matters of most importance to stakeholders are understood and inform the planning and assessment of the Cadia Continued Operations project. 17.11 Considerations of Social and Community Impacts Community relations are managed in accordance with the Newmont Communities Policy and Social Performance Standard. Community relations are undertaken by the Social Performance Department in line with the Cadia Social Performance Strategy. The objective of the Cadia Social Performance Strategy is to provide a strategic and systematic organizational approach to interactions with local communities and stakeholders which facilitate the open exchange of information so that Cadia Valley Operations can respond to emerging needs at any point of its operations in the Cadia area. The Cadia Valley Operations holds regular forums with local government authorities and residents, including the Community Consultative Committee and contributes to a Community Partnerships Program in which employee volunteers are involved in assessing applications for funding of community projects based on established criteria. The Community Consultative Committee involves representatives of the three local government authorities and the community. This provides a regular forum for discussion of community issues related to Cadia Valley Operations’ activities, and for accurate dissemination of material about those activities. 17.12 Qualified Person’s Opinion on Adequacy of Current Plans to Address Issues Newmont notes that there has been some negative community feedback as a result of the operations, and particularly in relation to dust and noise generation from works at the NTSF and STSF which are currently not actively receiving tailings. These areas are actively managed to minimize dust generation, with corrective action plans developed and under implementation. Studies undertaken in 2023 by Cadia Valley Operations and the Environment Protection Authority showed that dust management practices are effective at protecting human health in alignment with background levels. Additionally, a report by the NSW Health department into community health concerns released in August 2025 confirmed no definitive evidence of health impacts from heavy metal exposure among participants, and that no broader community testing is required. Following the NTSF embankment slump, Newmont has been actively implementing recommendations from the Independent Technical Review Board to stabilize and repair the area and avoid the type of failure in future. Buttressing work of the western embankment was completed in 2023 with studies in progress to determine further work to stabilize the area further prior to the facility returning to service. Newmont is working closely with the New South Wales regulatory authorities on these plans.


Cadia Valley Operations New South Wales, Australia Technical Report Summary Date: February 2026 Page 17-13 Based on the information provided to the QP by Newmont (see Chapter 25), there are no material issues known to the QP. The Cadia Operations are mature mining operations and currently have the social license to operate within local communities. The QP considers the plans outlined above are adequate to address the issues outlined. Cadia Valley Operations New South Wales, Australia Technical Report Summary Date: February 2026 Page 18-1 18.0 CAPITAL AND OPERATING COSTS 18.1 Introduction Capital and operating cost estimates are at a minimum at a pre-feasibility level of confidence, having an accuracy level of ±25% and a contingency range not exceeding 15%. 18.2 Capital Cost Estimates 18.2.1 Basis of Estimate The Cadia East estimate was broken down into: • Direct costs: Permanent plant equipment supply; bulk materials supply; direct labor; contractors’ distributable costs; construction equipment for mass earthworks; freight, construction indirect costs; • Indirect costs: Engineering, procurement and contract management (EPCM) costs including field construction management services, project office and home office costs for engineering, procurement, project services, and sub-consultant EPCM costs; Owner’s team costs; and contingency. The Ridgeway cost estimate was based on the following parameters: • Mining: detailed estimate; • Underground material handling and infrastructure: factored estimate for direct costs, indirect costs were factored. Mine capital costs were based on modelling, using mine plans and schedules, engineering take- off of development quantities, equipment data, consumable estimates, and labor schedules. Mine infrastructure and services capital, and mill debottlenecking and supporting infrastructure capital were based on equipment lists and material take-offs from engineering drawings. Owner’s costs were factored from all direct costs, and based on benchmarking against costs from similar projects and historical precedence at site. Sustaining capital costs were taken from current operational practice and adjusted using mine plans and schedules, engineering designs, and equipment recapitalization strategies. These costs included estimates for mining, ore processing, and tailings deposition. Labor estimates for underground mining were calculated using project underground mine development and operating schedules consistent with site experience in execution of similar activities and using industry standard practices. Operator and maintenance labor rates were taken from standard pay scales and benchmarked against the eastern seaboard hard rock mining cost base in the McDonald Gold & General Mining Industries Remuneration Report (McDonald’s remuneration survey). Labor estimates for construction activities were calculated using detailed project construction estimates. Labor rates were based on historical and current site project rates. Cadia Valley Operations New South Wales, Australia Technical Report Summary Date: February 2026 Page 18-2 The operating assumption for underground activities is a 12-hour shift with 24/7 continuous work arrangements. For surface construction activities, the assumption was for a day-shift only, with a six-day, 56-hour working week. Tailings cost estimates were prepared based on an EPCM model execution methodology. Direct and indirect costs were calculated, with Owners’ costs and contingency added. Bulk earthworks package rates were sourced from competitive tender rates as part of the Cadia integrated tailings program. 18.2.2 Capital Cost Summary The overall capital cost estimate for the Cadia Operations as envisaged in the financial analysis is outlined in Table 18-1 and totals US$9.7 B. This includes current and future tailings expenditure categorized as sustaining capital. Table 18-1: Capital Cost Estimate Summary Cost Area Units Value Mining US$ billion 4.1 Processing US$ billion 4.9 Site general and administrative US$ billion 0.6 Total Capital US$ billion 9.7 Note: Numbers may not sum due to rounding. 18.3 Operating Cost Estimates 18.3.1 Basis of Estimate Operating costs were based on actual costs seen during operations and were projected through the LOM plan. These costs were applied to an activity-based cost model and factored according to estimated fixed/variable components for existing assets. Operating costs for new infrastructure were based on a zero-based forecast cost base. Labor and energy costs were based on budgeted rates applied to headcounts and energy consumption estimates. 18.3.2 Operating Cost Summary Site operating costs for the LOM total US$22.0 B. The operating cost estimate is summarized in Table 18-2 and Table 18-3. Cadia Valley Operations New South Wales, Australia Technical Report Summary Date: February 2026 Page 18-3 Table 18-2: Operating Cost Estimate Summary Cost Area Units Value Mining US$ billion 7.1 Processing US$ billion 10.8 General and administrative US$ billion 4.1 Total Operating Costs US$ billion 22.0 Note: Numbers may not sum due to rounding. Table 18-3: Operating Unit Cost Estimate Area Unit Value Mining US$/t mined 7.06 Process US$/t milled 10.72 G&A US$/t milled 4.11


Cadia Valley Operations New South Wales, Australia Technical Report Summary Date: February 2026 Page 19-1 19.0 ECONOMIC ANALYSIS 19.1 Methodology Used The financial model that supports the mineral reserve declaration is a standalone model that calculates annual cash flows based on scheduled ore production, assumed processing recoveries, metal sale prices and US$:AU$ exchange rate, projected operating and capital costs and estimated taxes. The financial analysis is based on an after-tax discount rate of 5%. All costs and prices are in unescalated “real” dollars. The currency used to document the cash flow is US$. All costs are based on the 2026 business plan budget. Revenue is calculated from the recoverable metals and long-term metal price and exchange rate forecasts. 19.2 Financial Model Parameters The economic analysis is based on the metallurgical recovery predictions in Chapter 10.4, the mineral reserve estimates in Chapter 12, the mine plan discussed in Chapter 13.10, the commodity price forecasts in Chapter 16, closure cost estimates in Chapter 17.9, and the capital and operating costs outlined in Chapter 18. Royalties were summarized in Chapter 3.2.5 and Chapter 3.8. Taxation considerations include: • Federal tax rate of 30%; • State government royalty of 4%; • Payroll tax; • Annual land taxes; • Council rates and levies. The Cadia Operations economic analysis is based on 100% equity financing and is reported on a 100% project ownership basis. The economic analysis assumes constant prices with no inflationary adjustments. The NPV5% is US$2.6 B. As the cash flows are based on existing operations where all costs are considered sunk to 1 January 2026, considerations of payback and internal rate of return are not relevant. Free cash flow is us$5.3 B. A summary of the financial results is provided in Table 19-1. Cadia Valley Operations New South Wales, Australia Technical Report Summary Date: February 2026 Page 19-2 Table 19-1: Cash Flow Summary Table Item Unit Value Gold price US$/oz 2,000 Copper price US$/lb 3.75 Silver price US$/oz 25.00 Molybdenum price US$/lb 13.00 Material mined Mt 1,007.6 Ore processed Mt 1,007.6 Contained gold, processed Moz 13.5 Contained copper, processed kt 2,924 Contained silver, processed Moz 21.8 Contained molybdenum, processed kt 84 Processed ore gold grade g/t 0.42 Processed ore copper grade % 0.29 Processed ore silver grade g/t 0.67 Processed ore molybdenum grade % 0.01 Recovered gold Moz 10.7 Recovered copper kt 2,447 Recovered silver Moz 13.2 Recovered molybdenum kt 51 Recovery, gold % 79 Recovery, copper % 84 Recovery, silver % 60 Recovery, molybdenum % 62 Net revenue US$ billion 39.1 Costs applicable to sales US$ billion (22.8) EBITDA US$ billion 16.2 Operating cash flow (after estimated taxes and other adjustments) US$ billion 15.0 Total capital US$ billion (9.7) Free Cash Flow (FCF) US$ billion 5.3 Net Present Value (NPV) US$ billion 2.6 Note: Table 19-1 contains “forward-looking statements” within the meaning of Section 27A of the Securities Act of 1933, as amended, and Section 21E of the Securities Exchange Act of 1934, as amended, which are intended to be covered by the safe harbor created by such sections and other applicable laws. Please refer to the note regarding forward-looking information at the front of the Report. The cash flow is only intended to demonstrate the financial viability of the Project. Investors are cautioned that the above is based upon certain assumptions which may differ from Newmont’s long-term outlook or actual financial results, including, but not limited to Cadia Valley Operations New South Wales, Australia Technical Report Summary Date: February 2026 Page 19-3 commodity prices, escalation assumptions, and other technical inputs. For example, Table 19-1 uses the price assumptions stated in the table, including a gold commodity price assumption of US$2,000/oz, a copper commodity price assumption of US$3.75/lb, a silver commodity price assumption of US$25/oz, and a molybdenum price assumption of US$13.00/lb, which vary significantly from current gold, copper, silver, and molybdenum prices and the assumptions that Newmont uses for its long-term guidance. Please be reminded that significant variation of metal prices, costs and other key assumptions may require modifications to mine plans, models, and prospects. Numbers have been rounded; totals may not sum due to rounding. EBITDA = earnings before interest, taxes, depreciation, and amortization. The cash flow in this Report has been adjusted to align with the generally-accepted accounting principles (GAAP) required for US-listed companies. In the cash flow analysis 2026 is evaluated at a gold price of US$2,000/oz; with the copper price at US$3.75/lb. Material mined over the LOM total includes 4.3 Mt of initial stockpiles. An annualized cash flow statement is provided in Table 19-2 to Table 19-5. The overall recovery estimates shown in Table 19-2 to Table 19-5 will vary depending on the timing and mixing of individual mining zones at the time of processing, as well as the processing rate at the time of treatment. In addition, the cash flow model uses the output from flow model (PCBC) for tonnes and grade. Recovery equations are applied to each ore source by annualised periods resulting in minor variation between reserves (insitu recovery) and the cash flow model recoveries. The variances are not considered material for a positive economic valuation test via the cash flow model. Silver recovery equations applied in the cost model have been historically conservative, noting the variance is immaterial in the economic test In these tables, EBITDA = earnings before interest, taxes, depreciation, and amortization. The active mining and processing operation ceases in 2056; however, closure costs are estimated to 2058. Cadia Valley Operations New South Wales, Australia Technical Report Summary Date: February 2026 Page 19-4 Table 19-2: Annualized Cash Flow (2026–2033) Item Units LOM Total 2026 2027 2028 2029 2030 2031 2032 2033 Material mined Mt 1,007.6 29.4 31.6 30.9 32.9 31.6 34.0 34.0 34.0 Ore processed Mt 1,007.6 32.0 30.1 29.2 32.0 32.0 33.3 34.5 34.5 Contained gold, processed Moz 13.5 0.4 0.4 0.4 0.5 0.5 0.5 0.5 0.5 Contained copper, processed kt 2,924 101 98 101 110 113 116 117 104 Contained silver, processed Moz 21.8 0.8 0.7 0.7 0.7 0.7 0.7 0.7 0.7 Contained molybdenum, processed kt 84 4 3 3 3 3 3 3 3 Processed ore gold grade g/t 0.42 0.40 0.40 0.42 0.44 0.47 0.45 0.43 0.43 Processed ore copper grade % 0.29 0.32 0.32 0.34 0.35 0.35 0.35 0.34 0.30 Processed ore silver grade g/t 0.67 0.74 0.73 0.74 0.73 0.70 0.67 0.65 0.64 Processed ore molybdenum grade % 0.01 0.01 0.01 0.01 0.01 0.01 0.01 0.01 0.01 Recovered gold Moz 10.7 0.3 0.3 0.3 0.4 0.4 0.4 0.4 0.4 Recovered copper Kt 2,447 84 81 84 94 96 99 100 89 Recovered silver Moz 13.2 0.4 0.4 0.4 0.4 0.4 0.4 0.5 0.5 Recovered molybdenum kt 51 2 2 2 2 2 2 2 2 Recovery, gold % 79 76 76 77 79 81 81 82 83 Recovery, copper % 84 83 83 84 85 85 86 86 85 Recovery, silver % 60 56 56 56 59 62 63 63 64 Recovery, molybdenum % 62 61 62 62 61 60 59 59 60 Net revenue US$ billion 39.1 1.2 1.2 1.2 1.4 1.5 1.5 1.5 1.4 Costs applicable to sales US$ billion (22.8) (0.7) (0.7) (0.7) (0.7) (0.8) (0.8) (0.8) (0.8) EBITDA US$ billion 16.2 0.5 0.5 0.5 0.7 0.7 0.7 0.7 0.6 Operating cash flow (after estimated taxes and other adjustments) US$ billion 15.0 0.7 0.5 0.5 0.6 0.7 0.7 0.7 0.6 Total capital US$ billion (9.7) (0.8) (0.9) (0.8) (0.6) (0.4) (0.4) (0.2) (0.2) Free Cash Flow (FCF) US$ billion 5.3 (0.1) (0.4) (0.3) 0.1 0.3 0.4 0.5 0.5


Cadia Valley Operations New South Wales, Australia Technical Report Summary Date: February 2026 Page 19-5 Table 19-3: Annualized Cash Flow (2034–2043) Item Units 2034 2035 2036 2037 2038 2039 2040 2041 2042 2043 Material mined Mt 34.6 34.0 34.0 34.0 34.0 34.0 34.0 34.0 34.0 34.0 Ore processed Mt 34.5 34.4 34.5 34.5 34.4 34.4 34.2 34.5 34.0 33.8 Contained gold, processed Moz 0.5 0.5 0.5 0.5 0.6 0.6 0.5 0.5 0.5 0.5 Contained copper, processed kt 97 91 81 76 81 96 106 107 98 94 Contained silver, processed Moz 0.7 0.8 0.8 0.8 0.8 0.8 0.9 0.9 0.8 0.8 Contained molybdenum, processed kt 2 2 2 2 3 3 3 3 3 3 Processed ore gold grade g/t 0.42 0.41 0.45 0.49 0.50 0.52 0.50 0.47 0.43 0.43 Processed ore copper grade % 0.28 0.26 0.24 0.22 0.24 0.28 0.31 0.31 0.29 0.28 Processed ore silver grade g/t 0.65 0.68 0.69 0.70 0.70 0.73 0.78 0.77 0.73 0.70 Processed ore molybdenum grade % 0.01 0.01 0.01 0.01 0.01 0.01 0.01 0.01 0.01 0.01 Recovered gold Moz 0.4 0.4 0.4 0.5 0.5 0.5 0.4 0.4 0.4 0.4 Recovered copper Kt 81 76 67 63 67 81 90 91 83 79 Recovered silver Moz 0.5 0.5 0.5 0.5 0.5 0.5 0.5 0.5 0.5 0.5 Recovered molybdenum kt 1 1 1 2 2 2 2 2 2 2 Recovery, gold % 83 84 84 83 82 81 80 79 79 78 Recovery, copper % 84 84 83 83 83 85 85 85 85 84 Recovery, silver % 64 63 64 66 65 64 62 61 60 60 Recovery, molybdenum % 61 62 62 63 63 62 62 61 61 62 Net revenue US$ billion 1.4 1.3 1.3 1.3 1.4 1.5 1.5 1.5 1.3 1.3 Costs applicable to sales US$ billion (0.8) (0.8) (0.8) (0.8) (0.8) (0.8) (0.8) (0.8) (0.8) (0.8) EBITDA US$ billion 0.6 0.5 0.5 0.6 0.6 0.7 0.8 0.7 0.6 0.5 Operating cash flow (after estimated taxes and other adjustments) US$ billion 0.6 0.5 0.5 0.5 0.6 0.6 0.6 0.6 0.5 0.4 Total capital US$ billion (0.3) (0.3) (0.3) (0.4) (0.3) (0.3) (0.4) (0.3) (0.2) (0.3) Free Cash Flow (FCF) US$ billion 0.3 0.3 0.3 0.2 0.3 0.4 0.3 0.3 0.3 0.1 Cadia Valley Operations New South Wales, Australia Technical Report Summary Date: February 2026 Page 19-6 Table 19-4: Annualized Cash Flow (2044–2053) Item Units 2044 2045 2046 2047 2048 2049 2050 2051 2052 2053 Material mined Mt 34.0 34.0 34.0 33.4 32.7 34.0 34.1 34.0 36.2 35.8 Ore processed Mt 34.5 34.5 34.5 33.8 32.7 34.0 34.0 33.9 34.5 34.5 Contained gold, processed Moz 0.5 0.5 0.5 0.5 0.4 0.4 0.4 0.4 0.4 0.4 Contained copper, processed kt 100 103 108 103 96 94 89 89 94 91 Contained silver, processed Moz 0.8 0.8 0.7 0.7 0.7 0.7 0.6 0.6 0.7 0.6 Contained molybdenum, processed kt 3 3 3 3 3 3 3 2 2 3 Processed ore gold grade g/t 0.43 0.44 0.42 0.42 0.40 0.39 0.35 0.37 0.37 0.32 Processed ore copper grade % 0.29 0.30 0.31 0.31 0.29 0.28 0.26 0.26 0.27 0.26 Processed ore silver grade g/t 0.71 0.68 0.67 0.63 0.63 0.63 0.59 0.58 0.59 0.58 Processed ore molybdenum grade % 0.01 0.01 0.01 0.01 0.01 0.01 0.01 0.01 0.01 0.01 Recovered gold Moz 0.4 0.4 0.4 0.3 0.3 0.3 0.3 0.3 0.3 0.3 Recovered copper Kt 84 86 91 86 79 77 73 73 77 74 Recovered silver Moz 0.5 0.5 0.4 0.4 0.4 0.4 0.4 0.4 0.4 0.4 Recovered molybdenum kt 2 2 2 2 2 2 2 2 1 2 Recovery, gold % 78 78 77 77 77 77 77 78 78 78 Recovery, copper % 84 84 84 83 83 82 82 82 82 82 Recovery, silver % 60 60 60 60 59 58 58 59 58 56 Recovery, molybdenum % 62 62 61 61 62 62 62 62 62 62 Net revenue US$ billion 1.4 1.4 1.4 1.3 1.2 1.2 1.1 1.2 1.2 1.1 Costs applicable to sales US$ billion (0.8) (0.8) (0.8) (0.8) (0.7) (0.8) (0.7) (0.7) (0.7) (0.7) EBITDA US$ billion 0.6 0.6 0.6 0.5 0.5 0.5 0.4 0.4 0.5 0.4 Operating cash flow (after estimated taxes and other adjustments) US$ billion 0.5 0.5 0.5 0.5 0.4 0.4 0.3 0.3 0.4 0.3 Total capital US$ billion (0.4) (0.4) (0.3) (0.2) (0.2) (0.2) (0.2) (0.1) (0.1) (0.1) Free Cash Flow (FCF) US$ billion 0.1 0.2 0.3 0.3 0.2 0.2 0.2 0.2 0.3 0.2 Cadia Valley Operations New South Wales, Australia Technical Report Summary Date: February 2026 Page 19-7 Table 19-5: Annualized Cash Flow (2054–2058) Item Units 2054 2055 2056 2057 2058 Material mined Mt 29.6 23.9 8.8 — — Ore processed Mt 33.4 22.4 10.3 — — Contained gold, processed Moz 0.3 0.2 0.1 — — Contained copper, processed kt 89 57 25 — — Contained silver, processed Moz 0.6 0.4 0.2 — — Contained molybdenum, processed kt 3 2 1 — — Processed ore gold grade g/t 0.29 0.24 0.24 — — Processed ore copper grade % 0.27 0.26 0.24 — — Processed ore silver grade g/t 0.59 0.60 0.63 — — Processed ore molybdenum grade % 0.01 0.01 0.01 — — Recovered gold Moz 0.2 0.1 0.1 — — Recovered copper Kt 72 47 21 — — Recovered silver Moz 0.3 0.2 0.1 — — Recovered molybdenum kt 2 1 1 — — Recovery, gold % 77 77 77 — — Recovery, copper % 81 82 84 — — Recovery, silver % 54 54 62 — — Recovery, molybdenum % 64 64 65 — — Net revenue US$ billion 1.0 0.6 0.3 — — Costs applicable to sales US$ billion (0.6) (0.5) (0.4) — — EBITDA US$ billion 0.4 0.1 (0.2) — — Operating cash flow (after estimated taxes and other adjustments) US$ billion 0.4 0.1 (0.1) (0.2) (0.2) Total capital US$ billion (0.2) (0.1) (0.0) — — Free Cash Flow (FCF) US$ billion 0.2 (0.1) (0.2) (0.2) (0.2) Cadia Valley Operations New South Wales, Australia Technical Report Summary Date: February 2026 Page 19-8 Note to accompany cash flow tables: Table 19-2 to Table 19-5 contain “forward-looking statements” within the meaning of Section 27A of the Securities Act of 1933, as amended, and Section 21E of the Securities Exchange Act of 1934, as amended, which are intended to be covered by the safe harbor created by such sections and other applicable laws. Please refer to the note regarding forward-looking information at the front of the Report. The cash flow is only intended to demonstrate the financial viability of the Project. Investors are cautioned that the above is based upon certain assumptions which may differ from Newmont’s long-term outlook or actual financial results, including, but not limited to commodity prices, escalation assumptions, and other technical inputs. For example, Table 19-2 to Table 19-5 use the price assumptions stated in the tables, including a gold commodity price assumption of US$2,000/oz, a copper commodity price assumption of US$3.75/lb, a silver commodity price assumption of US$25/oz, and a molybdenum price assumption of US$13.00/lb, which vary significantly from current gold, copper, silver, and molybdenum prices and the assumptions that Newmont uses for its long-term guidance. Please be reminded that significant variation of metal prices, costs and other key assumptions may require modifications to mine plans, models, and prospects. Numbers have been rounded; totals may not sum due to rounding. EBITDA = earnings before interest, taxes, depreciation, and amortization. The cash flow in this Report has been adjusted to align with the generally-accepted accounting principles (GAAP) required for US-listed companies. In the cash flow analysis 2026 is evaluated at a gold price of US$2,000/oz; with the copper price at US$3.75/lb. Material mined over the LOM total includes 4.3 Mt of initial stockpiles.


Cadia Valley Operations New South Wales, Australia Technical Report Summary Date: February 2026 Page 19-1 Table 19-1 to Table 19-5 contain “forward-looking statements” within the meaning of Section 27A of the Securities Act of 1933, as amended, and Section 21E of the Securities Exchange Act of 1934, as amended, which are intended to be covered by the safe harbor created by such sections and other applicable laws. Please refer to the note regarding forward-looking information at the front of the Report. The cash flow is only intended to demonstrate the financial viability of the Project. Investors are cautioned that the above is based upon certain assumptions which may differ from Newmont’s long-term outlook or actual financial results, including, but not limited to commodity prices, escalation assumptions, and other technical inputs. For example, Table 19-1 to Table 19-5 use the price assumptions stated in the table, including a gold commodity price assumption of US$2,000/oz, a silver commodity price of US$2,000/oz, a copper commodity price of US$3.75/lb, and a molybdenum commodity price of US$13.00/lb, prices which vary significantly from current gold prices and the assumptions that Newmont uses for its long-term guidance. Please be reminded that significant variation of metal prices, costs and other key assumptions may require modifications to mine plans, models, and prospects. 19.3 Sensitivity Analysis The sensitivity of the Project to changes in grades, sustaining capital costs and operating cost assumptions was tested using a range of 25% above and below the base case values. The changes in metal prices are representative of changes in grade. The Project is most sensitive, in order, to metal prices and grade, less sensitive to operating costs, and least sensitive to capital costs (Figure 19-1). Figure 19-1: Sensitivity Analysis Note: Figure prepared by Newmont, 2025. FCF = free cash flow, NPV = net present value at 5% discount rate, OPEX = operating expenditure, CAPEX = capital expenditure. Cadia Valley Operations New South Wales, Australia Technical Report Summary Date: February 2026 Page 20-1 20.0 ADJACENT PROPERTIES This Chapter is not relevant to this Report. Cadia Valley Operations New South Wales, Australia Technical Report Summary Date: February 2026 Page 21-1 21.0 OTHER RELEVANT DATA AND INFORMATION This Chapter is not relevant to this Report. Cadia Valley Operations New South Wales, Australia Technical Report Summary Date: February 2026 Page 22-1 22.0 INTERPRETATION AND CONCLUSIONS 22.1 Introduction The QP notes the following interpretations and conclusions, based on the review of data available for this Report. 22.2 Property Setting The Project is located in an area with good local and regional infrastructure and the ability to supply of goods to support mining operations is well-established. Personnel with experience in mining-related activities are available in the district. There are transportation routes that access the Project area. There are no significant topographic or physiographic issues that would affect the Cadia Valley Operations. However, the Project is in a seismically-active region. Mining operations are conducted year-round. 22.3 Ownership The Cadia Valley Operations are 100% owned by Newmont through its wholly-owned subsidiary, CHPL. 22.4 Mineral Tenure, Surface Rights, Water Rights, Royalties and Agreements Information from legal experts and Newmont’s in-house experts supports that the tenure held is valid and sufficient to support a declaration of mineral resources and mineral reserves. Newmont holds sufficient surface rights to allow mining activities at Cadia East and Ridgeway. The surface rights are sufficient to support mining operations, provided that subsidence or other impacts do not occur outside existing approved Mining Leases. Additional negotiations and permits may be required in support of additional TSF storage to accommodate the mine plan envisaged in this Report. Newmont holds permits that allow abstraction of groundwater, and surface water in support of the Cadia Valley Operations. Royalties are payable to the NSW State. Currently, gold, silver, and copper are levied at 4% ex- mine value (value less allowable deductions). Environmental liabilities for the Cadia Valley Operations are typical of those that would be expected to be associated with a long-life mining operation where mining activities were conducted via open pit and underground mass mining methods.


Cadia Valley Operations New South Wales, Australia Technical Report Summary Date: February 2026 Page 22-2 In October 2023 the New South Wales Environment Protection Authority commenced two charges against Newmont for the Cadia Valley Operations relating to alleged air pollution from the surface of the Cadia Valley Operations’ tailing storage facilities on October 13 and 22, 2022. Newmont has entered a plea of not guilty in relation to both charges, and the matter will go to court in February 2026. Community concerns were raised in relation to groundwater and surface water quality downstream of the Cadia Valley Operations, and in relation to both metals and per- and polyfluoroalkyl substances. The New South Wales Environment Protection Authority completed extensive sampling of the surface water network in the Upper Belubula River catchment and produced publicly available reports. The Environment Protection Authority sampling shows that water in the district meets irrigation and livestock criteria. Traces of perfluorooctane sulfonic acid, a chemical found in fire-fighting foams amongst other uses, were detected in water monitoring within the Cadia Valley Operations. As a result, the New South Wales Environment Protection Authority altered the site’s Environment Protection License to have Newmont engage an independent consultant to undertake an investigation of potential sources of perfluorooctane sulfonic acid on site. The New South Wales Environment Protection Authority has also put the same investigative condition on other major industries in the Orange district. Newmont has not used fire-fighting foam containing perfluorooctane sulfonic acid since 2016. To the extent known to the QP, there are no other significant factors and risks that may affect access, title, or the right or ability to perform work on the Project that are not discussed in this Report. 22.5 Geology and Mineralization The Cadia East and Ridgeway deposits are considered to be examples of alkalic porphyry gold– copper-style mineralization. The understanding of the Cadia East and Ridgeway deposit settings, lithologies, mineralization, and the geological, structural, and alteration controls on mineralization is sufficient to support estimation of mineral resources and mineral reserves. Exploration potential remains within the Project area, and Newmont is actively exploring using a number of conceptual geological models to drive the exploration activities. 22.6 History The Cadia Valley Operations have had an active mining history, from 1998 onward, firstly by open pit methods, then from underground. Newmont and its predecessor, Newcrest, have been actively exploring in the Orange area since 1991. Cadia Valley Operations New South Wales, Australia Technical Report Summary Date: February 2026 Page 22-3 22.7 Exploration, Drilling, and Sampling The exploration programs completed to date are appropriate for the style of the deposits in the Project area. Sampling methods, sample preparation, analysis, and security conducted prior to Newmont/Newcrest’s interest in the operations were in accordance with exploration practices and industry standards at the time the information was collected. Current sampling methods are acceptable for mineral resource and mineral reserve estimation. Sample preparation, analysis and security for the Newmont/Newcrest programs are performed in accordance with current exploration practices and generally-accepted industry standards. The quantity and quality of the lithological, geotechnical, collar and down-hole survey data collected during the exploration and delineation drilling programs and included in the database subset that supports estimation are sufficient to support mineral resource and mineral reserve estimation. The collected sample data adequately reflect deposit dimensions, true widths of mineralization, and the style of the deposits. Sampling is representative of the gold, copper, silver, and molybdenum grades in the relevant deposits, reflecting areas of higher and lower grades. No material factors were identified with the data collection from the drill programs that could significantly affect mineral resource estimation. The sample preparation, analysis, quality control, and security procedures used by the Cadia Valley Operations have changed over time to meet evolving industry practices. Practices at the time the information was collected were industry-standard. The sample preparation, analysis, quality control, and security procedures are sufficient to provide reliable data to support estimation of mineral resources and mineral reserves. The QA/QC programs adequately address issues of precision, accuracy, and contamination. Modern drilling programs typically included blanks, duplicates, and standard samples. QA/QC submission rates meet industry-accepted standards. Density measurements are considered to provide acceptable density values for use in mineral resource and mineral reserve estimation. 22.8 Data Verification The database that supports mineral resource and mineral reserve estimates is checked using electronic data scripts and triggers. Data verification was performed by external consultants in support of mine development and operations. No material issues were identified in the reviews. Observations made during the QP’s site visit, in conjunction with discussions with site-based technical staff also support the geological interpretations, and analytical and database quality. The QP’s personal inspection supports the use of the data in mineral resource and mineral reserve estimation, and in mine planning. The QP received reconciliation reports from the operations. Through the review of these reconciliation factors, the QP can accept the use of the data in support of the mineral resource and mineral reserve estimates. Cadia Valley Operations New South Wales, Australia Technical Report Summary Date: February 2026 Page 22-4 22.9 Metallurgical Testwork Metallurgical testwork and associated analytical procedures were appropriate to the mineralization type, appropriate to establish the optimal processing routes, and were performed using samples that are typical of the mineralization styles found within the Cadia East and Ridgeway deposits. Samples selected for testing were representative of the various types and styles of mineralization. Samples were selected from a range of depths within the deposits. Sufficient samples were taken so that tests were performed on sufficient sample mass. Metallurgical recovery forecasts are: • Cadia East gold recovery rates are forecast at approximately 80%, copper recovery rates at approximately 86%, silver recovery rates at approximately 67% and molybdenum recovery rates (relative to plant feed) of approximately 67%; • Ridgeway: recovery forecasts for the overall LOM are 81% for gold, 87% for copper and 66% for silver; • Stockpiles: gold recovery of 64%, and copper recovery of 75%. Fluorine is the main deleterious element identified at Cadia East that could influence concentrate sales and marketing. Since 2017, all material within the plant has been processed through a Jameson cell, giving maximum fluorine rejection, particularly of the entrained fluorine-bearing minerals, and therefore it is unlikely that fluorine levels in copper concentrate will exceed the maximum contractual limits over the LOM. There are expected to be no deleterious elements in any Ridgeway concentrates that will trigger penalty payments or rejection rates. 22.10 Mineral Resource Estimates Mineral resources are reported using the mineral resource definitions set out in SK1300, and are reported exclusive of those mineral resources converted to mineral reserves. The reference point for the estimate is in situ or in stockpiles. Mineral resources are reported on a 100% basis. Areas of uncertainty that may materially impact the mineral resource estimates include: changes to long-term metal and exchange rate price assumptions; changes in local interpretations of mineralization geometry, structures, and continuity of mineralized zones; changes to geological and grade shape and geological and grade continuity assumptions; changes to metallurgical recovery assumptions; changes to the input assumptions used to derive the conceptual underground mass mining methods used to constrain the estimates; changes to the to the input assumptions used in the constraining pit shell for those mineral resources amenable to open pit mining methods; changes to the NSR cut-offs applied to the estimates; variations in geotechnical (including seismicity), hydrogeological and mining assumptions; and changes to environmental, permitting and social license assumptions. A risk to the resource estimates is the assumption that there will be sufficient tailings storage capacity at the tailings cost input assumption used when considering reasonable prospects of economic extraction. Cadia Valley Operations New South Wales, Australia Technical Report Summary Date: February 2026 Page 22-5 22.11 Mineral Reserve Estimates Mineral reserves were converted from measured and indicated mineral resources. Inferred mineral resources were set to waste. Mineral reserves are reported using the mineral resource definitions set out in SK1300. The reference point for the estimate is the point of delivery to the process facilities. Mineral reserves are reported on a 100% basis. Areas of uncertainty that may materially impact the mineral reserve estimates include: changes to long-term metal price and exchange rate assumptions; changes to metallurgical recovery assumptions; changes to the input assumptions used to derive the cave outlines and the mine plan that is based on those cave designs; changes to operating and capital cost assumptions used, including changes to input cost assumptions such as consumables, labor costs, royalty and taxation rates; variations in geotechnical, mining, dilution and processing recovery assumptions, including changes to designs as a result of changes to geotechnical, hydrogeological, and engineering data used; changes to the shut-off criteria used to constrain the estimates; ability to source power supplies if the current assumptions cannot be met; ability to obtain sufficient water to meet operational needs; changes to the assumed permitting and regulatory environment under which the mine plan was developed; ability to permit additional TSF capacities or facilities; ability to maintain mining permits and/or surface rights; ability to obtain operations certificates in support of mine plans; ability to obtain and maintain social and environmental license to operate. There is a risk to the mineral reserve estimates if Newmont is not able to demonstrate that the Cadia Valley Operations can remediate, maintain and operate the existing TSFs in line with the costs estimated in the LOM plan. A similar risk exists with the costs estimated for the TSF expansion included in the cash flow analysis. Newmont must also demonstrate that the operations can be mined within the existing environmental permit requirements. 22.12 Mining Methods Mining operations are conducted year-round. It is expected that mining activities associated with the Ridgeway mine will also be year-round. The mine plans are based on the current knowledge of geotechnical, hydrological, mining and processing information. Mine designs incorporate underground infrastructure and ventilation requirements. Underground operations use and will continue to use conventional block or panel cave underground mining methods and equipment fleets. The projected combined Cadia East and Ridgeway mine life is 31 years (2026–2056).


Cadia Valley Operations New South Wales, Australia Technical Report Summary Date: February 2026 Page 22-6 22.13 Recovery Methods The process methods are generally conventional to the industry. The comminution and recovery processes are widely used with no significant elements of technological innovation. The process plant flowsheet designs were based on testwork results, previous study designs, and industry-standard practices. The process plants will produce variations in recovery due to the day-to-day changes in ore type or combinations of ore type being processed. These variations are expected to trend to the forecast recovery value for monthly or longer reporting periods. 22.14 Infrastructure Infrastructure required for operations is constructed and operational. Some additional facilities will be required to support the operations as envisaged in the LOM plan. The preliminary modelling of the mid-western NSW transmission system has identified supply restrictions under various contingent scenarios, although under system intact conditions, the regional transmission system has sufficient capacity to meet the Project power demands. 22.15 Market Studies The Cadia Valley Operations produce a copper concentrate, a molybdenum concentrate and doré. All products are readily marketable. Newmont uses a combination of historical and current contract pricing, contract negotiations, knowledge of its key markets from a long operations production record, short-term versus long- term price forecasts prepared by Newmont’s internal corporate marketing group, public documents, and analyst forecasts when considering long-term commodity price forecasts. Higher metal prices are used for the mineral resource estimates to ensure the mineral reserves are a sub-set of, and not constrained by, the mineral resources, in accordance with industry-accepted practice. Contracts are typically reviewed and negotiated on an as-needs basis. Based on Newmont’s knowledge, the contract terms are typical of similar contracts both regionally and nationally. 22.16 Environmental, Permitting and Social Considerations Baseline studies were completed in support of current and former operations. Environmental monitoring is undertaken across the Project, and in the vicinity of the Cadia Valley Operations. The mining leases further require a Mining Operations Plan to be prepared that outlines significant disturbance, rehabilitation plans, and mine closure strategies. Development not otherwise covered by existing approvals and Mining Operation Plans will require new authorizations. The current waste rock materials and low-grade ore categories are classified using color nomenclature that reflects the management approach to that material. Cadia Valley Operations New South Wales, Australia Technical Report Summary Date: February 2026 Page 22-7 There are three tailings storage facilities: the NTSF, the STSF, and the mined-out Cadia Hill open pit (Cadia Pit TSF), each of which are located within the Cadia mining lease. The NTSF design consists of an earth and rock-fill dam, with nine embankment raises undertaken. All raises since 2008 have involved upstream construction. The STSF is also an earth and rock-fill dam, with, to date, six embankment raises undertaken, the last three of which used the upstream method. The Cadia Pit TSF and STSF are planned to be operated to the current approved tailings elevations with future STSF raises converted from upstream towards centerline raise methods. Tailings were shown to be non-acid forming. The Event occurred in the southern wall of the NTSF, causing it to lose containment of tailings. The tailings were captured within the basin of the STSF. A prohibition notice issued by the NSW resources regulator on depositing tailings in the NTSF remains in place as at December 31, 2025. An Independent Technical Review Board investigation of the Event was completed in April, 2019 and has been publicly released. The Independent Technical Review Board ultimately attributed the failure to slow movement in a previously unidentified weak foundation layer, which lead to the liquefaction of tailings and sudden failure of the slope. In response to the Independent Technical Review Board recommendations, Newcrest expanded geotechnical investigations of the TSF foundations and identified areas where additional embankment buttressing was required. Newmont have also significantly increased surface and subsurface monitoring of the TSFs since the Event. Newmont continues to investigate the remediation of the NTSF slump zone, and is undertaking buttressing of the embankment, as approved. Since April 2018, tailings deposition has primarily been in the Cadia Pit TSF with some deposition in the STSF also occurring, with no deposition in the NTSF. Newcrest engaged expert engineering firms to develop buttress designs and to remediate existing TSF embankments to acceptable safety levels. Where there was a lack of data, conservative assumptions on foundation strengths were assumed. Initial buttressing of the NTSF western wall was completed in 2023, with buttressing work on-going as at December 31, 2025. Buttress construction along the STSF has been completed in 2025 to support ongoing operations. Future tailings storage beyond the Cadia Pit TSF and STSF storage capacities will be required later in the mine plan to support the LOM production plan envisaged in this Report. Planning and community engagement is currently ongoing to extend the STSF in height and footprint and different technologies are being considered as part of the regulatory approvals process. The capital and operating cost estimates include provision for future tailings storage. These costs were included in the economic analysis that supports the mineral reserves. Water supply is characterized by variable supply sources. Droughts have, in the past, resulted in a prolonged period of very low water supply. Drought conditions are a risk to future operations if unduly prolonged. Newmont holds the key permits required to support the current operations. The Cadia expansion will trigger a need to evaluate the proposal under various NSW Government environment and mining legislation and key Commonwealth legislation. Cadia Valley Operations New South Wales, Australia Technical Report Summary Date: February 2026 Page 22-8 Community relations are managed in accordance with the Communities Policy and Social Performance Standard. The closure provision in the financial analysis supporting the mineral reserves, is estimated at US$0.5 B. 22.17 Capital Cost Estimates Capital costs are at a minimum at a pre-feasibility level of confidence, having an accuracy level of ±25% and a contingency range not exceeding 15%. The overall capital cost estimate for the Cadia Operations LOM is approximately US$9.7 B. 22.18 Operating Cost Estimates Operating costs are at a minimum at a pre-feasibility level of confidence, having an accuracy level of ±25% and a contingency range not exceeding 15%. Operating costs were based on actual costs seen during operations and were projected through the LOM plan. The overall operating cost estimate for the Cadia Operations LOM, is approximately US$22.0 B. 22.19 Economic Analysis The NPV at a discount rate of 5% is US$2.6 B and Free Cash flow of $5.3 B The active mining and processing operation ceases in 2056; however, closure costs are estimated to 2058. 22.20 Risks and Opportunities 22.20.1 Risks Risks that may affect the mineral resource and mineral reserve estimates are identified in Chapter 11.14 and Chapter 12.6 respectively. Risks associated with the block cave mining method include a cave not propagating as anticipated, excessive air gaps forming during the cave propagation, unplanned ground movement occurring due to changes in stresses released in the surrounding rock and larger or more frequent mining-induced seismicity than anticipated. Additionally, during cave establishment and propagation, higher levels of seismic activity, and higher likelihood of damage to excavations from seismic events, are expected. This has been observed during the cave establishment phase of Cadia’s PC2–3 project and is expected during the establishment of Cadia’s PC1–2 project in the coming years. Such seismic events and associated damage may require changes to the mining plan and upgrades to ground support systems, which could take several months. Large seismic events may also occur after cave establishment and propagation Cadia Valley Operations New South Wales, Australia Technical Report Summary Date: February 2026 Page 22-9 and during steady state caving, although the likelihood of this is lower. Excessive water ingress, disturbance, and the presence of fine materials may also give rise to unplanned releases of material of varying properties and of water through drawbells. The Cadia Valley Operations recorded sudden unplanned releases of both dry fine ore material and wet mud material through drawbells in 2023. Failure to maintain compliance with applicable law or the Cadia Valley Operations’ Environmental Protection License may result in the Environment Protection Authority suspending or revoking the Environmental Protection License, seeking court orders, or issuing additional prevention notices to specify actions that must, or must not, be taken, or prohibition notices directing Cadia to cease an activity. Ongoing enforcement, and challenges in maintaining compliance, may impact the Cadia Valley Operations’ ability to secure a future expansion of its project approval to extend the LOM beyond 2031. The Cadia Valley Operations have previously been, and may in the future be, subject to prosecutions and penalties for noncompliance with air quality requirements or the terms of its Environmental Protection License, including in respect of emissions from any vent rise or emissions from the NTSF and the STSF. Operational changes required to achieve or maintain compliance, including reductions in mining rates and other limitations on mining or processing operations, or additional requirements to install costly pollution control equipment, may adversely impact the assumptions used in the mine plan and economic analysis that supports mineral reserves. An ongoing Project risk is the operations’ ability to manage the TSF instability. The LOM plan assumes that the STSF can resume operations. If this cannot be managed, there is a risk that once the Cadia Pit TSF is filled mining and processing operations will cease pending other solutions. This will affect both the Project LOM plan and forecast economic outcomes. There is a risk that the Southern Tailings Storage Facility Extended cannot be permitted as envisaged in this Report. In this instance, mining and processing operations will be delayed or could even cease. This will affect both the Project LOM plan and forecast economic outcomes. There is a heightened level of community concern relating to the perceived impact of mining activities on the health of the community, and the condition of residential properties, located in proximity to the Project. These developments, including community complaints associated with Newmont’s Cadia Valley Operations activities could give rise to reputational harm, operational disruptions, increased regulatory scrutiny of mining activities or delays to Project development. 22.20.2 Opportunities There is Project upside opportunity if the mineral resources exclusive of mineral reserves can be upgraded to mineral reserves with additional testwork and study. 22.21 Conclusions Under the assumptions presented in this Report, the Cadia Valley Operations have a positive cash flow, and mineral reserve estimates can be supported.


Cadia Valley Operations New South Wales, Australia Technical Report Summary Date: February 2026 Page 23-1 23.0 RECOMMENDATIONS As Cadia is an operating mine, the QP has no material recommendations to make. Cadia Valley Operations New South Wales, Australia Technical Report Summary Date: February 2026 Page 24-1 24.0 REFERENCES 24.1 Bibliography Barton, N., Lien, R., and Lunde, J., 1974: Engineering Classification of Rock Masses for the Design of Tunnel Support: Rock Mechanics vol 6, pp. 189–236. Beck, D, 2013: Ridgeway Deeps Lift 2 Coupled Simulation of Footprint Deformation: Beck Engineering. Cadia Holdings Pty Ltd, 2018: Rehabilitation Strategy: internal CHPL report. Chamberlain, C.M., Jackson, M., Jago, C.P., Pass, H.E., Simpson, K.A., Cooke, D.R., and Tosdal, R.M., 2006: Toward an Integrated Model for Alkalic Porphyry Copper Deposits in British Columbia (NTS 093A, N; 104G): BC Ministry of Energy, Mines and Petroleum Resources, Geological Field work 2006, Paper 2007-1259. Cuison, A.L., 2010: Geology and Genesis of the Ridgeway Porphyry Au-Cu Deposit, NSW: PhD thesis, University of Tasmania. Flores G., and Karzulovic, A., 2003: Geotechnical Guideline for a Transition from Open Pit to Underground Mining: Geotechnical Characterization: Report to International Caving Study II, Brisbane, Julius Kruttschnitt Mineral Research Centre. Fluor, 2010: Cadia East Project Feasibility Study Report: April 2010. Forster D.B., Seccombe P.K., and Phillips D., 2004: Controls on Skarn Mineralization and Alteration at the Cadia Deposits, New South Wales, Australia: Economic Geology and the Bulletin of the Society of Economic Geologists 99, pp. 761–788. Fox, N., Harris, A., Cooke, D., and Collett, D., 2009: Controls on the Formation of the Cadia East Alkalic Porphyry Au-Cu Deposit, NSW: Potential Reactivation of Early Basin Structures: Macquarie Arc Conference, Orange. Glen R.A., Walshe J.L., Barron L.M., and Watkins J.J., 1998: Ordovician Convergent-Margin Volcanism and Tectonism in the Lachlan Sector of East Gondwana: Geology 26, pp. 751– 754. Glen R.A., Hancock P.L., and Whittaker A., 2005: Basin Inversion by Distributed Deformation; the Southern Margin of the Bristol Channel Basin, England. Journal of Structural Geology 27, pp. 2,113–2,134. Glen R.A., Crawford A.J., and Cooke D.R., 2007: Tectonic Setting of Porphyry Cu-Au Mineralization in the Ordovician-Early Silurian Macquarie Arc, Eastern Lachlan Orogen, New South Wales; Geological Evolution and Metallogenesis of the Ordovician Macquarie Arc, Lachlan Orogen, New South Wales: Australian Journal of Earth Sciences 54, pp. 465–479. Cadia Valley Operations New South Wales, Australia Technical Report Summary Date: February 2026 Page 24-2 Harris, A.C., Percival, I.G., Allen, C.M., Cooke, D.R., Tosdal, R.M., McMillan, C., Dunham, P.D., and Collett, D., 2009: Inverted Submarine Basins Hosting the Cadia Valley Porphyry Ore Deposits, New South Wales: Fundamental Controls on System Architecture: Macquarie Arc Conference, Orange. Holliday J.R., Wilson A.J., Blevin P.L., Tedder I.J., Dunham P.D., and Pfitzner M., 2002: Porphyry Gold-Copper Mineralization in the Cadia District, Eastern Lachlan Fold Belt, New South Wales, and its Relationship to Shoshonitic Magmatism: Mineralium Deposita 37, pp. 100–116. Holliday J.R. and Cooke D.R., 2007: Advances in Geological Models and Exploration Methods for Copper ± Gold Porphyry Deposits: in Milkereit B. ed. Proceedings of Exploration 07: Fifth Decennial International Conference on Mineral Exploration: Toronto, Canada, pp. 791–809. Jeffries, M., Morgenstern, N.R., Van Zyl, D., and Wates, J., 2019: Report on NTSF Embankment Failure, Cadia Valley Operations, for Ashurst Australia: report prepared by the Independent Technical Review Board, April 17, 2019, 119 p. and appendices. Laubscher, D.H., 1990: A Geomechanics Classification System for the Rating of Rock Mass in Mine Design: Trans. S. Afr. Inst. Min. Metal. 9(10). Micko, J., Tosdal, R.M., Bissig, T., Chamberlain, C.M. and Simpson, K.A., 2014: Hydrothermal Alteration and Mineralization of the Galore Creek Alkalic Cu-Au Porphyry Deposit, Northwestern British Columbia, Canada: Economic Geology, v. 109, pp. 891–914. Newcrest Mining Limited, 2007: Ridgeway Deeps Feasibility Study: internal Newcrest report, Vols 1 to 4. Newcrest Mining Limited, 2014: Pre-Feasibility Study- Ridgeway Deeps Lift 2: internal Newcrest report. Newcrest Mining Limited, 2018: Cadia Expansion Pre-Feasibility Study: internal Newcrest report, August 8, 2018. Newcrest Mining Limited, 2019a: Expert Review of Cadia Tailings Facility Completed: news release, April 30, 2019, 3 p. Newcrest Mining Limited, 2019b: Cadia Valley Operations Cadia Hill Tailings Completion Modification – Modification Report: draft report prepared for NSW Department of Planning & Environment. Newcrest Mining Limited, 2019c: Cadia Expansion Feasibility Study: internal Newcrest report, September 9, 2019. Packham G., Percival I., and Bischoff G., 1999: Age Constraints on Strata Enclosing the Cadia and Junction Reefs Ore Deposits of Central New South Wales, and Tectonic Implications: Quarterly Notes - Geological Survey of New South Wales 110, pp. 1–12. Cadia Valley Operations New South Wales, Australia Technical Report Summary Date: February 2026 Page 24-3 Panteleyev, A., 1995: Porphyry Cu±Mo±Au: in Selected British Columbia Mineral Deposit Profiles, Volume 1, D.V. Lefebure and G.E. Ray, eds, British Columbia Ministry of Energy, Mines, and Petroleum Resources, pp. 87–91. Pfitzner, M, 2007: Ridgeway Deeps Feasibility Study Volume 4.3: Technical Geotechnical, August 8, 2007. Seedorff, E. Dilles, J.H., Proffett, J.M., Jr., Einaudi, M., Zurcher, L., Stavast, W.J.A., Johnson, D.A., and Barton, M.D., 2005: Porphyry Deposits: Characteristics and Origin of Hypogene Features: Economic Geology 100th Anniversary Volume, pp. 251–298. Sillitoe, R.H., 2000: Role of Gold-Rich Porphyry Models in Exploration, in S.G. Hagerman and P.H. Brown, eds., Gold in 2000, Reviews in Economic Geology, v. 13, pp. 311–346. Sillitoe, R.H., 2010: Porphyry Copper Systems: Economic Geology, v. 105, pp. 3–41. Sinclair, W.D., 2006: Consolidation and Synthesis of Mineral Deposits Knowledge - Porphyry Deposits: report posted to Natural Resources Canada website 30 January, 2006, 14 p., <http://gsc.nrcan.gc.ca/mindep/synth_dep/porph/index_e.php. Singer, D.A., Berger, V.I., and Moring, B.C., 2008: Porphyry Copper Deposits of the World: Database and Grade and Tonnage Models: U.S. Geological Survey Open-File Report 2008-1155, version 1.0 (http://pubs.usgs.gov/of/2008/1155/). Stevens, B.P.J., 1972: Mine Data Sheets to Accompany Metallogenic Map Bathurst 1:250,000 sheet: cited in Bajwah, Z.U., Seccombe, P.K., and Offier, R., 1987: Trace Element Distribution, Co:Ni Ratios and Genesis of the Big Cadia Iron-Copper Deposit, New South Wales, Australia: Mineralium Deposita, vol. 22, pp. 292–300. Washburn, M., 2008: Architecture of the Silurian Sedimentary Cover Sequence in the Cadia Porphyry Au-Cu District, NSW, Australia: Implications for Post-Mineral Deformation: M.Sc. thesis, University of British Columbia. Wilson A.J., 2003: The Geology, Genesis and Exploration Context of the Cadia Gold-Copper Porphyry Deposits, New South Wales, Australia: PhD thesis, University of Tasmania, Hobart, Tasmania, Australia. Wilson A.J., Cooke D.R., and Harper B.L., 2003: The Ridgeway Gold-Copper Deposit; a High- Grade Alkalic Porphyry Deposit in the Lachlan Fold Belt, New South Wales, Australia: Economic Geology 98, pp. 1,637–1,666. Wilson A.J., Cooke D.R., Stein H.J., Fanning C.M., Holliday J.R., and Tedder I.J., 2007: U-Pb and Re-Os Geochronologic Evidence for Two Alkalic Porphyry Ore-Forming Events in the Cadia District, New South Wales, Australia: Economic Geology 102, pp. 3–26.


Cadia Valley Operations New South Wales, Australia Technical Report Summary Date: February 2026 Page 24-4 24.2 Abbreviations Abbreviation/Symbol Term µm micrometer AU$ Australian dollar AA atomic absorption AG autogenous grind AHD Australian height datum Ai abrasion index ANSTO Australian Nuclear Science Technology Organisation ARD acid rock drainage B billion BWi Bond work index CHPL Cadia Holdings Pty Ltd CY calendar year DGPS differential global positioning system dmt dry metric tonnes dmt/a dry metric tonnes per annum DP Deposited Land DPE New South Wales Department of Planning and Environment. DWi drop weight index EA Environmental Assessment E&PA Act Environmental Planning and Assessment Act 1979 EPA Environment Protection Authority EPBC Act Environment Protection and Biodiversity Conservation Act 1999 EPCM engineering, procurement, and construction management EPL Environment Protection License FA fire assay FY financial year; in the Australian context G&A general and administrative GPS global positioning system HiG high intensity grind HPGR high pressure grinding roller ICP-AES inductively coupled plasma atomic emission spectroscopy ICP-MS inductively coupled plasma–mass spectrometry ICP-OES inductively coupled plasma optical emission spectroscopy ID2 inverse distance weighting to the power of two IFC International Finance Corporation Cadia Valley Operations New South Wales, Australia Technical Report Summary Date: February 2026 Page 24-5 Abbreviation/Symbol Term IP induced polarization koz thousand ounces kt thousand tonnes LBMA London Bullion Market Association (now known simply as LBMA) LECO Analyzer designed for wide-range measurement of carbon and sulfur content of mineralization LG Lerchs–Grossmann LGA local government area LHD load–haul–dump vehicle LiDAR light detection and ranging LME London Metal Exchange LOM life-of-mine mAHD meters above Australian height datum masl meters above sea level mH meters high ML million liters ML/a million liters per annum MLA mineral liberation analysis/analyzer mRL meters relative level MSHA United States Mine Safety and Health Administration Mt million tonnes MVAr megavolt ampere reactive MW megawatt mW meters wide NAF Non-acid forming NATA National Association of Testing Authorities Australia Newcrest Newcrest Mining Limited Newmont Newmont Corporation NN nearest neighbor NPV net present value NSR net smelter return NSW New South Wales NTSF northern tailings storage facility OES optical emission spectrometry PAF potentially acid-forming PM10 Particulate matter with a diameter of ≤10 µm, inhalable into lungs PM2.5 Particulate matter with a diameter of ≤2.5 µm, inhalable into lungs Cadia Valley Operations New South Wales, Australia Technical Report Summary Date: February 2026 Page 24-6 Abbreviation/Symbol Term QA/QC quality assurance and quality control QP Qualified Person RAB rotary air blast RC reverse circulation ROM run-of-mine RQD rock quality description RWi Bond rod mill work index SAG semi-autogenous grind SG specific gravity SMC breakage characteristics testing SME Society for Mining, Metallurgy and Exploration STSF southern tailings storage facility TSF tailings storage facility US United States US$ United States dollar wmt wet metric tonnes wmt/a wet metric tonnes per annum WRSF waste rock storage facility XRD X-ray diffraction 24.3 Glossary of Terms Term Definition acid rock drainage/acid mine drainage Characterized by low pH, high sulfate, high iron, and other metal species. alluvium Unconsolidated terrestrial sediment composed of sorted or unsorted sand, gravel, and clay that was deposited by water. ANFO A free-running explosive used in mine blasting made of 94% prilled aluminum nitrate and 6% No. 3 fuel oil. aquifer A geologic formation capable of transmitting significant quantities of groundwater under normal hydraulic gradients. autogenous grinding (AG) A grinding process in which the ore in the mill is crushed by the interaction between the ore particles or the ore and lining plates of the mill. azimuth The direction of one object from another, usually expressed as an angle in degrees relative to true north. Azimuths are usually measured in the clockwise direction, thus an azimuth of 90 degrees indicates that the second object is due east of the first. ball mill A piece of milling equipment used to grind ore into small particles. It is a cylindrical shaped steel container filled with steel balls into which crushed ore Cadia Valley Operations New South Wales, Australia Technical Report Summary Date: February 2026 Page 24-7 Term Definition is fed. The ball mill is rotated causing the balls themselves to cascade, which in turn grinds the ore. bullion Unrefined gold and/or silver mixtures that have been melted and cast into a bar or ingot. carbonaceous Containing graphitic or hydrocarbon species, e.g., in an ore or concentrate; such materials generally present some challenge in processing, e.g., preg- robbing characteristics. CERCHAR abrasivity test This test method determines the abrasiveness of rock by of measuring the wear on the tip of a steel stylus caused by scratching against a freshly broken or saw cut rock surface for a prescribed 10 mm distance. comminution/crushing/grinding Crushing and/or grinding of ore by impact and abrasion. Usually, the word "crushing" is used for dry methods and "grinding" for wet methods. Also, "crushing" usually denotes reducing the size of coarse rock while "grinding" usually refers to the reduction of the fine sizes. concentrate The concentrate is the valuable product from mineral processing, as opposed to the tailing, which contains the waste minerals. The concentrate represents a smaller volume than the original ore curviplanar Has the form of a curved plane cut-off grade A grade level below which the material is not “ore” and considered to be uneconomical to mine and process. The minimum grade of ore used to establish reserves. data verification The process of confirming that data was generated with proper procedures, was accurately transcribed from the original source and is suitable to be used for mineral resource and mineral reserve estimation density The mass per unit volume of a substance, commonly expressed in grams/ cubic centimeter. diatreme A volcanic vent or pipe that formed when magma was forced through flat-lying sedimentary rock. dilution Waste of low-grade rock which is unavoidably removed along with the ore in the mining process. drawbell A funnel for broken rock that allows for rock extraction, connecting the undercut level, where the rock starts breaking, with the block cave production level, allowing the rock to flow into drawpoints. drawpoint The point at which gravity-fed ore or waste from a higher level is loaded into hauling units. easement Areas of land owned by the property owner, but in which other parties, such as utility companies, may have limited rights granted for a specific purpose. encumbrance An interest or partial right in real property which diminished the value of ownership, but does not prevent the transfer of ownership. Mortgages, taxes, and judgements are encumbrances known as liens. Restrictions, easements, and reservations are also encumbrances, although not liens. feasibility study A feasibility study is a comprehensive technical and economic study of the selected development option for a mineral project, which includes detailed assessments of all applicable modifying factors, as defined by this section, together with any other relevant operational factors, and detailed financial


Cadia Valley Operations New South Wales, Australia Technical Report Summary Date: February 2026 Page 24-8 Term Definition analysis that are necessary to demonstrate, at the time of reporting, that extraction is economically viable. The results of the study may serve as the basis for a final decision by a proponent or financial institution to proceed with, or finance, the development of the project. A feasibility study is more comprehensive, and with a higher degree of accuracy, than a pre-feasibility study. It must contain mining, infrastructure, and process designs completed with sufficient rigor to serve as the basis for an investment decision or to support project financing. financial year In the Australian context, a year commencing on July 1 and finishing on June 30 flotation Separation of minerals based on the interfacial chemistry of the mineral particles in solution. Reagents are added to the ore slurry to render the surface of selected minerals hydrophobic. Air bubbles are introduced to which the hydrophobic minerals attach. The selected minerals are levitated to the top of the flotation machine by their attachment to the bubbles and into a froth product, called the "flotation concentrate." If this froth carries more than one mineral as a designated main constituent, it is called a "bulk float". If it is selective to one constituent of the ore, where more than one will be floated, it is a "differential" float. flowsheet The sequence of operations, step by step, by which ore is treated in a milling, concentration, or smelting process. frother A type of flotation reagent which, when dissolved in water, imparts to it the ability to form a stable froth gangue The fraction of ore rejected as tailing in a separating process. It is usually the valueless portion, but may have some secondary commercial use graticule A grid of longitudinal/vertical and latitudinal/horizontal lines used in map or other representations. gravity concentrator Uses the differences in specific gravity between gold and gangue minerals to realize a separation of the gold from the gangue. heap leaching A process whereby valuable metals, usually gold and silver, are leached from a heap or pad of crushed ore by leaching solutions percolating down through the heap and collected from a sloping, impermeable liner below the pad. high pressure grinding rolls (HPGR) A type of crushing machine consisting of two large, studded rolls that rotate inwards and apply a high pressure compressive force to break rocks. hydrocyclone Separates out product phases on the basis of gravity within aqueous solutions. HydroFloat A fluidized bed coarse particle flotation device the overcomes buoyancy and froth recovery restrictions through up-current water velocity and plug flow conditions. indicated mineral resource An indicated mineral resource is that part of a mineral resource for which quantity and grade or quality are estimated on the basis of adequate geological evidence and sampling. The term adequate geological evidence means evidence that is sufficient to establish geological and grade or quality continuity with reasonable certainty. The level of geological certainty associated with an indicated mineral resource is sufficient to allow a qualified person to apply modifying factors in sufficient detail to support mine planning and evaluation of the economic viability of the deposit. Cadia Valley Operations New South Wales, Australia Technical Report Summary Date: February 2026 Page 24-9 Term Definition inferred mineral resource An inferred mineral resource is that part of a mineral resource for which quantity and grade or quality are estimated on the basis of limited geological evidence and sampling. The term limited geological evidence means evidence that is only sufficient to establish that geological and grade or quality continuity is more likely than not. The level of geological uncertainty associated with an inferred mineral resource is too high to apply relevant technical and economic factors likely to influence the prospects of economic extraction in a manner useful for evaluation of economic viability. A qualified person must have a reasonable expectation that the majority of inferred mineral resources could be upgraded to indicated or measured mineral resources with continued exploration; and should be able to defend the basis of this expectation before his or her peers. initial assessment An initial assessment is a preliminary technical and economic study of the economic potential of all or parts of mineralization to support the disclosure of mineral resources. The initial assessment must be prepared by a qualified person and must include appropriate assessments of reasonably assumed technical and economic factors, together with any other relevant operational factors, that are necessary to demonstrate at the time of reporting that there are reasonable prospects for economic extraction. An initial assessment is required for disclosure of mineral resources but cannot be used as the basis for disclosure of mineral reserves internal rate of return (IRR) The rate of return at which the Net Present Value of a project is zero; the rate at which the present value of cash inflows is equal to the present value of the cash outflows. IP Geophysical method, induced polarization; used to directly detect scattered primary sulfide mineralization. Most metal sulfides produce IP effects, e.g., chalcopyrite, bornite, chalcocite, pyrite, pyrrhotite Jameson cell High-intensity froth flotation cell. life of mine (LOM) Number of years that the operation is planning to mine and treat ore, and is taken from the current mine plan based on the current evaluation of ore reserves. measured mineral resource A measured mineral resource is that part of a mineral resource for which quantity and grade or quality are estimated on the basis of conclusive geological evidence and sampling. The term conclusive geological evidence means evidence that is sufficient to test and confirm geological and grade or quality continuity. The level of geological certainty associated with a measured mineral resource is sufficient to allow a qualified person to apply modifying factors, as defined in this section, in sufficient detail to support detailed mine planning and final evaluation of the economic viability of the deposit. merger A voluntary combination of two or more companies whereby both stocks are merged into one. Merrill-Crowe circuit A process which recovers precious metals from solution by first clarifying the solution, then removing the air contained in the clarified solution, and then precipitating the gold and silver from the solution by injecting zinc dust into the solution. The valuable sludge is collected in a filter press for drying and further treatment Cadia Valley Operations New South Wales, Australia Technical Report Summary Date: February 2026 Page 24-10 Term Definition mill Includes any ore mill, sampling works, concentration, and any crushing, grinding, or screening plant used at, and in connection with, an excavation or mine. mineral reserve A mineral reserve is an estimate of tonnage and grade or quality of indicated and measured mineral resources that, in the opinion of the qualified person, can be the basis of an economically viable project. More specifically, it is the economically mineable part of a measured or indicated mineral resource, which includes diluting materials and allowances for losses that may occur when the material is mined or extracted. The determination that part of a measured or indicated mineral resource is economically mineable must be based on a preliminary feasibility (pre- feasibility) or feasibility study, as defined by this section, conducted by a qualified person applying the modifying factors to indicated or measured mineral resources. Such study must demonstrate that, at the time of reporting, extraction of the mineral reserve is economically viable under reasonable investment and market assumptions. The study must establish a life of mine plan that is technically achievable and economically viable, which will be the basis of determining the mineral reserve. The term economically viable means that the qualified person has determined, using a discounted cash flow analysis, or has otherwise analytically determined, that extraction of the mineral reserve is economically viable under reasonable investment and market assumptions. The term investment and market assumptions includes all assumptions made about the prices, exchange rates, interest and discount rates, sales volumes, and costs that are necessary to determine the economic viability of the mineral reserves. The qualified person must use a price for each commodity that provides a reasonable basis for establishing that the project is economically viable. mineral resource A mineral resource is a concentration or occurrence of material of economic interest in or on the Earth’s crust in such form, grade or quality, and quantity that there are reasonable prospects for economic extraction. The term material of economic interest includes mineralization, including dumps and tailings, mineral brines, and other resources extracted on or within the earth’s crust. It does not include oil and gas resources, gases (e.g., helium and carbon dioxide), geothermal fields, and water. When determining the existence of a mineral resource, a qualified person, as defined by this section, must be able to estimate or interpret the location, quantity, grade or quality continuity, and other geological characteristics of the mineral resource from specific geological evidence and knowledge, including sampling; and conclude that there are reasonable prospects for economic extraction of the mineral resource based on an initial assessment, as defined in this section, that he or she conducts by qualitatively applying relevant technical and economic factors likely to influence the prospect of economic extraction. net present value (NPV) The present value of the difference between the future cash flows associated with a project and the investment required for acquiring the project. Aggregate of future net cash flows discounted back to a common base date, usually the present. NPV is an indicator of how much value an investment or project adds to a company. Cadia Valley Operations New South Wales, Australia Technical Report Summary Date: February 2026 Page 24-11 Term Definition net smelter return (NSR) A defined percentage of the gross revenue from a resource extraction operation, less a proportionate share of transportation, insurance, and processing costs. open pit A mine that is entirely on the surface. Also referred to as open-cut or open- cast mine. orogeny A process in which a section of the earth's crust is folded and deformed by lateral compression to form a mountain range ounce (oz) (troy) Used in imperial statistics. A kilogram is equal to 32.1507 ounces. A troy ounce is equal to 31.1035 grams. overburden Material of any nature, consolidated or unconsolidated, that overlies a deposit of ore that is to be mined. pebble crushing A crushing process on screened larger particles that exit through the grates of a SAG mill. Such particles (typically approx. 50 mm diameter) are not efficiently broken in the SAG mill and are therefore removed and broken, typically using a cone crusher. The crushed pebbles are then fed to a grinding mill for further breakage. peperite A type of rock that forms when magma comes into contact with wet sediments. phyllic alteration Minerals include quartz–sericite–pyrite plant A group of buildings, and especially to their contained equipment, in which a process or function is carried out; on a mine it will include warehouses, hoisting equipment, compressors, repair shops, offices, mill or concentrator. potassic alteration A relatively high temperature type of alteration which results from potassium enrichment. Characterized by biotite, K-feldspar, adularia. preg-robbing A characteristic of certain ores, typically that contain carbonaceous species, where dissolved gold is re-adsorbed by these species, leading to an overall reduction in gold recovery. Such ores require more complex treatment circuits to maximize gold recovery. preliminary feasibility study, pre- feasibility study A preliminary feasibility study (prefeasibility study) is a comprehensive study of a range of options for the technical and economic viability of a mineral project that has advanced to a stage where a qualified person has determined (in the case of underground mining) a preferred mining method, or (in the case of surface mining) a pit configuration, and in all cases has determined an effective method of mineral processing and an effective plan to sell the product. A pre-feasibility study includes a financial analysis based on reasonable assumptions, based on appropriate testing, about the modifying factors and the evaluation of any other relevant factors that are sufficient for a qualified person to determine if all or part of the indicated and measured mineral resources may be converted to mineral reserves at the time of reporting. The financial analysis must have the level of detail necessary to demonstrate, at the time of reporting, that extraction is economically viable probable mineral reserve A probable mineral reserve is the economically mineable part of an indicated and, in some cases, a measured mineral resource. For a probable mineral reserve, the qualified person’s confidence in the results obtained from the application of the modifying factors and in the estimates of tonnage and grade or quality is lower than what is sufficient for a classification as a proven mineral reserve, but is still sufficient to demonstrate that, at the time of


Cadia Valley Operations New South Wales, Australia Technical Report Summary Date: February 2026 Page 24-12 Term Definition reporting, extraction of the mineral reserve is economically viable under reasonable investment and market assumptions. The lower level of confidence is due to higher geologic uncertainty when the qualified person converts an indicated mineral resource to a probable reserve or higher risk in the results of the application of modifying factors at the time when the qualified person converts a measured mineral resource to a probable mineral reserve. A qualified person must classify a measured mineral resource as a probable mineral reserve when his or her confidence in the results obtained from the application of the modifying factors to the measured mineral resource is lower than what is sufficient for a proven mineral reserve. propylitic Characteristic greenish color. Minerals include chlorite, actinolite and epidote. Typically contains the assemblage quartz–chlorite–carbonate proven mineral reserve A proven mineral reserve is the economically mineable part of a measured mineral resource. For a proven mineral reserve, the qualified person has a high degree of confidence in the results obtained from the application of the modifying factors and in the estimates of tonnage and grade or quality. A proven mineral reserve can only result from conversion of a measured mineral resource. qualified person A qualified person is an individual who is a mineral industry professional with at least five years of relevant experience in the type of mineralization and type of deposit under consideration and in the specific type of activity that person is undertaking on behalf of the registrant; and an eligible member or licensee in good standing of a recognized professional organization at the time the technical report is prepared. For an organization to be a recognized professional organization, it must: (A) Be either: (1) An organization recognized within the mining industry as a reputable professional association, or (2) A board authorized by U.S. federal, state, or foreign statute to regulate professionals in the mining, geoscience, or related field; (B) Admit eligible members primarily on the basis of their academic qualifications and experience; (C) Establish and require compliance with professional standards of competence and ethics; (D) Require or encourage continuing professional development; (E) Have and apply disciplinary powers, including the power to suspend or expel a member regardless of where the member practices or resides; and; (F) Provide a public list of members in good standing. raisebore A method of obtaining vertical openings using a drilling machine reclamation The restoration of a site after mining or exploration activity is completed. refining A high temperature process in which impure metal is reacted with flux to reduce the impurities. The metal is collected in a molten layer and the impurities in a slag layer. Refining results in the production of a marketable material. resistivity Observation of electric fields caused by current introduced into the ground as a means of studying earth resistivity in geophysical exploration. Resistivity is the property of a material that resists the flow of electrical current Cadia Valley Operations New South Wales, Australia Technical Report Summary Date: February 2026 Page 24-13 Term Definition rilling Running down a slope or chute. rock quality designation (RQD) A measure of the competency of a rock, determined by the number of fractures in a given length of drill core. For example, a friable ore will have many fractures and a low RQD. royalty An amount of money paid at regular intervals by the lessee or operator of an exploration or mining property to the owner of the ground. Generally based on a specific amount per tonne or a percentage of the total production or profits. Also, the fee paid for the right to use a patented process. run-of-mine (ROM) Rehandle where the raw mine ore material is fed into the processing plant’s system, usually the crusher. This is where material that is not direct feed from the mine is stockpiled for later feeding. Run-of-mine relates to the rehandle being for any mine material, regardless of source, before entry into the processing plant’s system. semi-autogenous grinding (SAG) A method of grinding rock into fine powder whereby the grinding media consists of larger chunks of rocks and steel balls. shut-off The shut-off value (grade) in a block or panel cave mine determines when a drawpoint will be shut off and mining will cease from that drawpoint. skarn A calc-silicate metamorphic rock that has been chemically and mineralogically altered by metasomatism of fluid of magmatic, metamorphic, meteoric or are origin. specific gravity The weight of a substance compared with the weight of an equal volume of pure water at 4°C. tailings Material rejected from a mill after the recoverable valuable minerals have been extracted. triaxial compressive strength A test for the compressive strength in all directions of a rock or soil sample uniaxial compressive strength A measure of the strength of a rock, which can be determined through laboratory testing, and used both for predicting ground stability underground, and the relative difficulty of crushing. wrigglite Finely laminated skarn Cadia Valley Operations New South Wales, Australia Technical Report Summary Date: February 2026 Page 25-1 25.0 RELIANCE ON INFORMATION PROVIDED BY THE REGISTRANT 25.1 Introduction The QP fully relied on the registrant for the information used in the areas noted in the following sub-sections. The QP considers it reasonable to rely on the registrant for the information identified in those sub-sections, for the following reasons: • The registrant, through its merger with Newcrest, has been Owner and operator of the mining operations for more than 27 years, with 15 of those years focusing on underground operations; • The registrant has employed industry professionals with expertise in the areas listed in the following sub-sections; • The registrant has a formal system of oversight and governance over these activities, including a layered responsibility for review and approval; • The registrant has considerable experience in each of these areas. 25.2 Macroeconomic Trends • Information relating to inflation, interest rates, discount rates, exchange rates, and taxes was obtained from the registrant. This information is used in the economic analysis in Chapter 19. It supports the assessment of reasonable prospects for economic extraction of the mineral resource estimates in Chapter 11, and inputs to the determination of economic viability of the mineral reserve estimates in Chapter 12. 25.3 Markets • Information relating to market studies/markets for product, market entry strategies, marketing and sales contracts, product valuation, product specifications, refining and treatment charges, transportation costs, agency relationships, material contracts (e.g., mining, concentrating, smelting, refining, transportation, handling, hedging arrangements, and forward sales contracts), and contract status (in place, renewals), was obtained from the registrant. This information is used in the economic analysis in Chapter 19. It supports the assessment of reasonable prospects for economic extraction of the mineral resource estimates in Chapter 11, and inputs to the determination of economic viability of the mineral reserve estimates in Chapter 12. Cadia Valley Operations New South Wales, Australia Technical Report Summary Date: February 2026 Page 25-2 25.4 Legal Matters • Information relating to the corporate ownership interest, the mineral tenure (concessions, payments to retain property rights, obligations to meet expenditure/reporting of work conducted), surface rights, water rights (water take allowances), royalties, encumbrances, easements and rights-of-way, violations and fines, permitting requirements, and the ability to maintain and renew permits was obtained from the registrant. This information is used in support of the property description and ownership information in Chapter 3, the permitting and mine closure descriptions in Chapter 17, and the economic analysis in Chapter 19. It supports the reasonable prospects of economic extraction for the mineral resource estimates in Chapter 11, and the assumptions used in demonstrating economic viability of the mineral reserve estimates in Chapter 12. 25.5 Environmental Matters • Information relating to baseline and supporting studies for environmental permitting, environmental permitting and monitoring requirements, ability to maintain and renew permits, emissions controls, closure planning, closure and reclamation bonding and bonding requirements, sustainability accommodations, and monitoring for and compliance with requirements relating to protected areas and protected species was obtained from the registrant. This information is used when discussing property ownership information in Chapter 3, the permitting and closure discussions in Chapter 17, and the economic analysis in Chapter 19. It supports the reasonable prospects of economic extraction for the mineral resource estimates in Chapter 11, and the assumptions used in demonstrating economic viability of the mineral reserve estimates in Chapter 12. 25.6 Stakeholder Accommodations • Information relating to social and stakeholder baseline and supporting studies, hiring, and training policies for workforce from local communities, partnerships with stakeholders (including national, regional, and state mining associations; trade organizations; fishing organizations; state and local chambers of commerce; economic development organizations; non-government organizations; and state and federal governments), and the community relations plan was obtained from the registrant. This information is used in the social and community discussions in Chapter 17, and the economic analysis in Chapter 19. It supports the reasonable prospects of economic extraction for the mineral resource estimates in Chapter 11, and the assumptions used in demonstrating economic viability of the mineral reserve estimates in Chapter 12. 25.7 Governmental Factors • Information relating to taxation and royalty considerations at the Project level, monitoring requirements and monitoring frequency, bonding requirements, and violations and fines was obtained from the registrant.


Cadia Valley Operations New South Wales, Australia Technical Report Summary Date: February 2026 Page 25-3 This information is used in the discussion on royalties and property encumbrances in Chapter 3, the monitoring, permitting and closure discussions in Chapter 17, and the economic analysis in Chapter 19. It supports the reasonable prospects of economic extraction for the mineral resource estimates in Chapter 11, and the assumptions used in demonstrating economic viability of the mineral reserve estimates in Chapter 12.


Lihir Operations Papua New Guinea Technical Report Summary Report current as at: December 31, 2025 Qualified Person: Mr. Shaun Chanter, RM SME. Lihir Operations Papua New Guinea Technical Report Summary Date: February 2026 Page a NOTE REGARDING FORWARD-LOOKING INFORMATION This Technical Report Summary contains forward-looking statements within the meaning of the U.S. Securities Act of 1933 and the U.S. Securities Exchange Act of 1934 (and the equivalent under Canadian securities laws), that are intended to be covered by the safe harbor created by such sections. Such forward-looking statements include, without limitation, statements regarding Newmont’s expectation for its mines and any related development or expansions, including estimated cash flows, production, revenue, EBITDA, costs, taxes, capital, rates of return, mine plans, material mined and processed, recoveries and grade, future mineralization, future adjustments and sensitivities and other statements that are not historical facts. Forward-looking statements address activities, events, or developments that Newmont expects or anticipates will or may occur in the future and are based on current expectations and assumptions. Although Newmont’s management believes that its expectations are based on reasonable assumptions, it can give no assurance that these expectations will prove correct. Such assumptions, include, but are not limited to: (i) there being no significant change to current geotechnical, metallurgical, hydrological and other physical conditions; (ii) permitting, development, operations and expansion of operations and projects being consistent with current expectations and mine plans, including, without limitation, receipt of export approvals; (iii) political developments in any jurisdiction in which Newmont operates being consistent with its current expectations; (iv) certain exchange rate assumptions being approximately consistent with current levels; (v) certain price assumptions for gold and oil; (vi) prices for key supplies being approximately consistent with current levels; and (vii) other planning assumptions. Important factors that could cause actual results to differ materially from those in the forward- looking statements include, among others, risks that estimates of mineral reserves and mineral resources are uncertain and the volume and grade of ore actually recovered may vary from our estimates, risks relating to fluctuations in metal prices; risks due to the inherently hazardous nature of mining-related activities; risks related to the jurisdictions in which we operate, uncertainties due to health and safety considerations, uncertainties related to environmental considerations, including, without limitation, climate change, uncertainties relating to obtaining approvals and permits, including renewals, from governmental regulatory authorities; and uncertainties related to changes in law; as well as those factors discussed in Newmont’s filings with the U.S. Securities and Exchange Commission, including Newmont’s latest Annual Report on Form 10-K for the period ended December 31, 2025, which is available on newmont.com. Newmont does not undertake any obligation to release publicly revisions to any “forward-looking statement,” including, without limitation, outlook, to reflect events or circumstances after the date of this document, or to reflect the occurrence of unanticipated events, except as may be required under applicable securities laws. Investors should not assume that any lack of update to a previously issued “forward-looking statement” constitutes a reaffirmation of that statement. Continued reliance on “forward-looking statements” is at investors’ own risk. Lihir Operations Papua New Guinea Technical Report Summary Date: February 2026 Page i CONTENTS 1.0 EXECUTIVE SUMMARY ........................................................................................................... 1-1 1.1 Introduction ................................................................................................................................. 1-1 1.2 Terms of Reference ................................................................................................................... 1-1 1.3 Property Setting ......................................................................................................................... 1-1 1.4 Ownership .................................................................................................................................. 1-2 1.5 Mineral Tenure, Surface Rights, Water Rights, Royalties and Agreements .............................. 1-2 1.6 Geology and Mineralization ........................................................................................................ 1-3 1.7 History and Exploration .............................................................................................................. 1-4 1.8 Drilling and Sampling ................................................................................................................. 1-4 1.8.1 Drilling .................................................................................................................................... 1-4 1.8.2 Hydrogeology ......................................................................................................................... 1-5 1.8.3 Geotechnical .......................................................................................................................... 1-5 1.8.4 Sampling and Assay .............................................................................................................. 1-5 1.8.5 Quality Assurance and Quality Control .................................................................................. 1-7 1.9 Data Verification ......................................................................................................................... 1-7 1.10 Metallurgical Testwork ............................................................................................................... 1-7 1.11 Mineral Resource Estimation ..................................................................................................... 1-9 1.11.1 Estimation Methodology ......................................................................................................... 1-9 1.11.2 Mineral Resource Statement ................................................................................................ 1-10 1.11.3 Factors That May Affect the Mineral Resource Estimate..................................................... 1-11 1.12 Mineral Reserve Estimation ..................................................................................................... 1-12 1.12.1 Estimation Methodology ....................................................................................................... 1-12 1.12.2 Mineral Reserve Statement .................................................................................................. 1-12 1.12.3 Factors That May Affect the Mineral Reserve Estimate ....................................................... 1-13 1.13 Mining Methods ........................................................................................................................ 1-14 1.14 Recovery Methods ................................................................................................................... 1-15 1.15 Infrastructure ............................................................................................................................ 1-16 1.16 Markets and Contracts ............................................................................................................. 1-17 1.17 Environmental, Permitting and Social Considerations ............................................................. 1-18 1.17.1 Environmental Studies and Monitoring ................................................................................ 1-18 1.17.2 Closure and Reclamation Considerations ............................................................................ 1-19 1.17.3 Permitting ............................................................................................................................. 1-19 1.17.4 Social Considerations, Plans, Negotiations and Agreements .............................................. 1-20 1.18 Capital Cost Estimates ............................................................................................................. 1-20 1.19 Operating Cost Estimates ........................................................................................................ 1-21 1.20 Economic Analysis ................................................................................................................... 1-22 1.20.1 Economic Analysis ............................................................................................................... 1-22 1.20.2 Sensitivity Analysis ............................................................................................................... 1-23 1.21 Risks and Opportunities ........................................................................................................... 1-24 1.21.1 Risks ..................................................................................................................................... 1-24 1.21.2 Opportunities ........................................................................................................................ 1-25 1.22 Conclusions .............................................................................................................................. 1-26 1.23 Recommendations ................................................................................................................... 1-26 2.0 INTRODUCTION ........................................................................................................................ 2-1 2.1 Introduction ................................................................................................................................. 2-1 2.2 Terms of Reference ................................................................................................................... 2-2 Lihir Operations Papua New Guinea Technical Report Summary Date: February 2026 Page ii 2.2.1 Report Purpose ...................................................................................................................... 2-2 2.2.2 Terms of Reference................................................................................................................ 2-2 2.3 Qualified Persons ....................................................................................................................... 2-2 2.4 Site Visits and Scope of Personal Inspection ............................................................................ 2-2 2.5 Report Date ................................................................................................................................ 2-2 2.6 Information Sources and References ........................................................................................ 2-3 2.7 Previous Technical Report Summaries ...................................................................................... 2-3 3.0 PROPERTY DESCRIPTION ...................................................................................................... 3-1 3.1 Introduction ................................................................................................................................. 3-1 3.2 Property and Title in Papua New Guinea ................................................................................... 3-1 3.2.1 Mineral Title ............................................................................................................................ 3-1 3.2.2 Surface Rights ........................................................................................................................ 3-2 3.2.3 Government Mining Taxes, Levies or Royalties .................................................................... 3-2 3.3 Ownership .................................................................................................................................. 3-2 3.4 Mineral Title ................................................................................................................................ 3-3 3.5 Surface Rights ............................................................................................................................ 3-5 3.6 Water Rights............................................................................................................................... 3-5 3.7 Royalties ..................................................................................................................................... 3-5 3.8 Encumbrances ........................................................................................................................... 3-5 3.9 Permitting ................................................................................................................................... 3-5 3.10 Significant Factors and Risks That May Affect Access, Title or Work Programs ...................... 3-6 4.0 ACCESSIBILITY, CLIMATE, LOCAL RESOURCES, INFRASTRUCTURE AND PHYSIOGRAPHY ...................................................................................................................................... 4-1 4.1 Physiography.............................................................................................................................. 4-1 4.2 Accessibility ................................................................................................................................ 4-1 4.3 Climate ....................................................................................................................................... 4-1 4.4 Infrastructure .............................................................................................................................. 4-2 4.5 Seismicity ................................................................................................................................... 4-2 5.0 HISTORY ................................................................................................................................... 5-1 6.0 GEOLOGICAL SETTING, MINERALIZATION, AND DEPOSIT ............................................... 6-1 6.1 Deposit Type .............................................................................................................................. 6-1 6.2 Regional Geology ....................................................................................................................... 6-1 6.3 Local Geology ............................................................................................................................ 6-3 6.4 Deposit Geology ......................................................................................................................... 6-6 6.4.1 Overview ................................................................................................................................ 6-6 6.4.2 Lithologies .............................................................................................................................. 6-6 6.4.3 Structure ................................................................................................................................. 6-9 6.4.4 Alteration ................................................................................................................................ 6-9 6.4.5 Mineralization ....................................................................................................................... 6-10 6.4.6 Oxidation/Weathering ........................................................................................................... 6-12 6.4.7 Alteration Model ................................................................................................................... 6-12 7.0 EXPLORATION ......................................................................................................................... 7-1 7.1 Exploration ................................................................................................................................. 7-1 7.1.1 Grids and Surveys .................................................................................................................. 7-1 7.1.2 Geological Mapping ............................................................................................................... 7-1 7.1.3 Geochemistry ......................................................................................................................... 7-1 7.1.4 Geophysics ............................................................................................................................. 7-2 7.1.5 Airborne Surveys .................................................................................................................... 7-3


Lihir Operations Papua New Guinea Technical Report Summary Date: February 2026 Page iii 7.1.6 Ground Surveys ..................................................................................................................... 7-3 7.1.7 Marine and Near-Shore Surveys ............................................................................................ 7-4 7.1.8 Petrology, Mineralogy, and Research Studies ....................................................................... 7-4 7.1.9 Qualified Person’s Interpretation of the Exploration Information ........................................... 7-5 7.1.10 Exploration Potential .............................................................................................................. 7-6 7.2 Drilling ........................................................................................................................................ 7-8 7.2.1 Overview ................................................................................................................................ 7-8 7.2.1.1 Drilling on Property ............................................................................................................. 7-8 7.2.1.2 Drilling Excluded For Estimation Purposes ...................................................................... 7-12 7.2.1.3 Drilling Since Database Close-out Date ........................................................................... 7-12 7.2.2 Drill Methods ........................................................................................................................ 7-14 7.2.3 Logging ................................................................................................................................. 7-14 7.2.4 Recovery .............................................................................................................................. 7-14 7.2.5 Collar Surveys ...................................................................................................................... 7-15 7.2.6 Down Hole Surveys .............................................................................................................. 7-15 7.2.7 Grade Control ....................................................................................................................... 7-15 7.2.8 Comment on Material Results and Interpretation ................................................................ 7-15 7.3 Hydrogeology ........................................................................................................................... 7-16 7.3.1 Overview .............................................................................................................................. 7-16 7.3.2 Sampling Methods and Laboratory Determinations ............................................................. 7-16 7.3.3 Comment on Results ............................................................................................................ 7-16 7.3.4 Groundwater Models ............................................................................................................ 7-16 7.3.5 Water Balance ...................................................................................................................... 7-16 7.3.6 Comment on Results ............................................................................................................ 7-16 7.4 Geotechnical ............................................................................................................................ 7-16 7.4.1 Overview .............................................................................................................................. 7-16 7.4.2 Sampling Methods and Laboratory Determinations ............................................................. 7-17 7.4.3 Comment on Results ............................................................................................................ 7-17 8.0 SAMPLE PREPARATION, ANALYSES, AND SECURITY ...................................................... 8-1 8.1 Sampling Methods ..................................................................................................................... 8-1 8.1.1 Geochemical Sampling .......................................................................................................... 8-1 8.1.2 Core Sampling ........................................................................................................................ 8-1 8.1.3 RC Sampling .......................................................................................................................... 8-1 8.1.4 Sonic Sampling ...................................................................................................................... 8-1 8.1.5 Ore Control (Blast Hole) Sampling ......................................................................................... 8-2 8.2 Sample Security Methods .......................................................................................................... 8-2 8.3 Density Determinations .............................................................................................................. 8-2 8.4 Analytical and Test Laboratories ................................................................................................ 8-3 8.5 Sample Preparation ................................................................................................................... 8-3 8.5.1 Legacy .................................................................................................................................... 8-3 8.5.2 Current ................................................................................................................................... 8-4 8.6 Analysis ...................................................................................................................................... 8-4 8.6.1 Legacy .................................................................................................................................... 8-5 8.6.2 Current ................................................................................................................................... 8-5 8.7 Quality Assurance and Quality Control ...................................................................................... 8-6 8.7.1 Procedures ............................................................................................................................. 8-6 8.7.2 Pre-2012 Performance ........................................................................................................... 8-6 8.7.3 2012–Report Date QA/QC ..................................................................................................... 8-8 Lihir Operations Papua New Guinea Technical Report Summary Date: February 2026 Page iv 8.7.3.1 Short-Term QA/QC Measures and Reporting .................................................................... 8-8 8.7.3.2 Longer-Term Control Measures and Reporting ................................................................. 8-8 8.7.4 Newcrest Legacy QA/QC Reviews ........................................................................................ 8-9 8.8 Database .................................................................................................................................. 8-10 8.9 Qualified Person’s Opinion on Sample Preparation, Security, and Analytical Procedures ..... 8-11 9.0 DATA VERIFICATION ............................................................................................................... 9-1 9.1 Internal Data Verification ............................................................................................................ 9-1 9.1.1 Laboratory Visits..................................................................................................................... 9-1 9.1.2 Laboratory Checks ................................................................................................................. 9-1 9.1.3 Internal Data Verification ........................................................................................................ 9-1 9.1.4 Mineral Resource and Mineral Reserve Estimates ................................................................ 9-1 9.1.5 Reconciliation ......................................................................................................................... 9-2 9.1.6 Mineral Resource and Mineral Reserve Review .................................................................... 9-2 9.1.7 Subject Matter Expert Reviews .............................................................................................. 9-2 9.2 External Data Verification ........................................................................................................... 9-2 9.3 Data Verification by Qualified Person ........................................................................................ 9-3 9.4 Qualified Person’s Opinion on Data Adequacy .......................................................................... 9-3 10.0 MINERAL PROCESSING AND METALLURGICAL TESTING .............................................. 10-1 10.1 Introduction ............................................................................................................................... 10-1 10.2 Metallurgical Testwork ............................................................................................................. 10-2 10.2.1 Early Testwork ...................................................................................................................... 10-2 10.2.2 1992 Feasibility Study .......................................................................................................... 10-2 10.2.3 2014 Pilot Plant Pressure Oxidation .................................................................................... 10-2 10.2.4 Geometallurgical Test Program ........................................................................................... 10-3 10.2.5 Mineralogy ............................................................................................................................ 10-3 10.2.6 Metallurgical Types .............................................................................................................. 10-3 10.3 Recovery Estimates ................................................................................................................. 10-4 10.3.1 Comminution Response ....................................................................................................... 10-4 10.3.2 Basis of Recovery Forecast ................................................................................................. 10-4 10.3.3 Flotation Recovery ............................................................................................................... 10-4 10.3.4 Neutralization, Cyanidation and Adsorption Recovery......................................................... 10-5 10.3.5 Recovery Uplift ..................................................................................................................... 10-5 10.3.6 Final Recoveries................................................................................................................... 10-5 10.4 Metallurgical Variability ............................................................................................................ 10-6 10.5 Deleterious Elements ............................................................................................................... 10-6 10.6 Qualified Person’s Opinion on Data Adequacy ........................................................................ 10-7 11.0 MINERAL RESOURCE ESTIMATES ...................................................................................... 11-1 11.1 Introduction ............................................................................................................................... 11-1 11.2 Exploratory Data Analysis ........................................................................................................ 11-1 11.3 Geological Models .................................................................................................................... 11-1 11.4 Density Assignment ................................................................................................................. 11-1 11.5 Grade Capping/Outlier Restrictions ......................................................................................... 11-2 11.6 Composites .............................................................................................................................. 11-2 11.7 Variography .............................................................................................................................. 11-2 11.8 Estimation/interpolation Methods ............................................................................................. 11-2 11.8.1 Kriging Neighborhood Analysis ............................................................................................ 11-2 11.8.2 Gold and Sulfide Sulfur Grade Estimation ........................................................................... 11-3 11.8.3 Minor Element Estimation .................................................................................................... 11-3 Lihir Operations Papua New Guinea Technical Report Summary Date: February 2026 Page v 11.9 Validation .................................................................................................................................. 11-3 11.10 Reconciliation ........................................................................................................................... 11-4 11.11 Confidence Classification of Mineral Resource Estimate ........................................................ 11-4 11.11.1 Mineral Resource Confidence Classification ....................................................................... 11-4 11.11.2 Uncertainties Considered During Confidence Classification ............................................... 11-4 11.12 Reasonable Prospects of Economic Extraction ....................................................................... 11-5 11.12.1 Input Assumptions ................................................................................................................ 11-5 11.12.2 Commodity Price .................................................................................................................. 11-5 11.12.3 Cut-off ................................................................................................................................... 11-5 11.12.4 QP Statement ....................................................................................................................... 11-6 11.13 Mineral Resource Statement.................................................................................................... 11-6 11.14 Uncertainties (Factors) That May Affect the Mineral Resource Estimate ................................ 11-7 12.0 MINERAL RESERVE ESTIMATES ......................................................................................... 12-1 12.1 Introduction ............................................................................................................................... 12-1 12.2 Mineral Reserve Inputs and Assumptions ............................................................................... 12-1 12.2.1 Inputs .................................................................................................................................... 12-1 12.2.2 Pit Optimization Considerations ........................................................................................... 12-2 12.3 Ore Loss and Dilution ............................................................................................................... 12-2 12.4 Stockpiles ................................................................................................................................. 12-2 12.5 Mineral Reserve Statement ...................................................................................................... 12-4 12.6 Uncertainties (Factors) That May Affect the Mineral Reserve Estimate .................................. 12-4 13.0 MINING METHODS ................................................................................................................. 13-1 13.1 Introduction ............................................................................................................................... 13-1 13.2 Geotechnical Considerations ................................................................................................... 13-1 13.3 Hydrogeological Considerations .............................................................................................. 13-4 13.4 Geothermal Considerations ..................................................................................................... 13-4 13.4.1 Geothermal Depressurization and Pit Cooling ..................................................................... 13-4 13.4.2 Hot Ground Mining Methods ................................................................................................ 13-5 13.5 Operational Considerations ...................................................................................................... 13-5 13.5.1 Consideration of Marginal Cut-off Grades ........................................................................... 13-5 13.5.2 Operational Cut-off Grades .................................................................................................. 13-6 13.5.3 Grade Control and Production Monitoring ........................................................................... 13-6 13.6 Production Schedule ................................................................................................................ 13-6 13.7 Blasting and Explosives ........................................................................................................... 13-7 13.8 Mining Equipment .................................................................................................................... 13-7 13.9 Personnel ................................................................................................................................. 13-8 14.0 PROCESSING AND RECOVERY METHODS ........................................................................ 14-1 14.1 Process Method Selection ....................................................................................................... 14-1 14.2 Flowsheet ................................................................................................................................. 14-1 14.2.1 Crushing and Milling ............................................................................................................. 14-4 14.2.2 Flotation ................................................................................................................................ 14-4 14.2.3 Flotation Tailings Gold Recovery ......................................................................................... 14-4 14.2.4 Pressure Oxidation ............................................................................................................... 14-5 14.2.5 Counter-Current Decant Washing, Neutralization and Gold Recovery ................................ 14-6 14.2.6 Residue Tailings ................................................................................................................... 14-6 14.3 Blending Strategy ..................................................................................................................... 14-7 14.4 Equipment Sizing ..................................................................................................................... 14-7 14.5 Power and Consumables ......................................................................................................... 14-1 Lihir Operations Papua New Guinea Technical Report Summary Date: February 2026 Page vi 14.5.1 Energy .................................................................................................................................. 14-1 14.5.2 Water .................................................................................................................................... 14-1 14.5.3 Process Materials ................................................................................................................. 14-1 14.6 Personnel ................................................................................................................................. 14-1 15.0 INFRASTRUCTURE ................................................................................................................ 15-2 15.1 Introduction ............................................................................................................................... 15-2 15.2 Roads and Logistics ................................................................................................................. 15-4 15.3 Stockpiles ................................................................................................................................. 15-4 15.4 Waste Storage Facilities .......................................................................................................... 15-4 15.5 Tailings Disposal ...................................................................................................................... 15-4 15.6 Built Infrastructure .................................................................................................................... 15-4 15.7 Camp and Accommodation ...................................................................................................... 15-5 15.8 Power and Electrical ................................................................................................................ 15-5 15.9 Fuel .......................................................................................................................................... 15-5 15.10 Communications ...................................................................................................................... 15-5 15.11 Water Supply ............................................................................................................................ 15-5 16.0 MARKET STUDIES ................................................................................................................. 16-1 16.1 Markets ..................................................................................................................................... 16-1 16.2 Commodity Price Forecasts ..................................................................................................... 16-1 16.3 Contracts .................................................................................................................................. 16-1 17.0 ENVIRONMENTAL STUDIES, PERMITTING, AND PLANS, NEGOTIATIONS, OR AGREEMENTS WITH LOCAL INDIVIDUALS OR GROUPS ................................................................. 17-1 17.1 Introduction ............................................................................................................................... 17-1 17.2 Baseline and Supporting Studies ............................................................................................. 17-1 17.3 Environmental Considerations/Monitoring Programs............................................................... 17-2 17.4 Stockpiles ................................................................................................................................. 17-3 17.5 Waste Rock Disposal ............................................................................................................... 17-3 17.6 Tailings Disposal ...................................................................................................................... 17-3 17.7 Water Management .................................................................................................................. 17-4 17.8 Nearshore Soil Barrier (NSB) ................................................................................................... 17-4 17.9 Water Supply ............................................................................................................................ 17-5 17.9.1 Fresh Water Supply Overview ............................................................................................. 17-5 17.9.2 Fresh Water Supply Water Extraction Permits .................................................................... 17-5 17.9.3 Seawater .............................................................................................................................. 17-6 17.10 Closure Considerations ............................................................................................................ 17-6 17.11 Permitting ................................................................................................................................. 17-6 17.12 Considerations of Social and Community Impacts .................................................................. 17-8 17.13 Qualified Person’s Opinion on Adequacy of Current Plans to Address Issues ....................... 17-9 18.0 CAPITAL AND OPERATING COSTS ..................................................................................... 18-1 18.1 Introduction ............................................................................................................................... 18-1 18.2 Capital Cost Estimates ............................................................................................................. 18-1 18.2.1 Basis of Estimate.................................................................................................................. 18-1 18.2.2 Capital Cost Summary ......................................................................................................... 18-2 18.3 Operating Cost Estimates ........................................................................................................ 18-2 18.3.1 Basis of Estimate.................................................................................................................. 18-2 18.3.2 Operating Cost Summary ..................................................................................................... 18-3 19.0 ECONOMIC ANALYSIS .......................................................................................................... 19-1 19.1 Methodology Used ................................................................................................................... 19-1


Lihir Operations Papua New Guinea Technical Report Summary Date: February 2026 Page vii 19.2 Financial Model Parameters .................................................................................................... 19-1 19.3 Sensitivity Analysis ................................................................................................................... 19-5 20.0 ADJACENT PROPERTIES ..................................................................................................... 20-1 21.0 OTHER RELEVANT DATA AND INFORMATION .................................................................. 21-1 22.0 INTERPRETATION AND CONCLUSIONS ............................................................................. 22-1 22.1 Introduction ............................................................................................................................... 22-1 22.2 Property Setting ....................................................................................................................... 22-1 22.3 Ownership ................................................................................................................................ 22-1 22.4 Mineral Tenure, Surface Rights, Water Rights, Royalties and Agreements ............................ 22-1 22.5 Geology and Mineralization ...................................................................................................... 22-2 22.6 History ...................................................................................................................................... 22-2 22.7 Exploration, Drilling, and Sampling .......................................................................................... 22-2 22.8 Data Verification ....................................................................................................................... 22-3 22.9 Metallurgical Testwork ............................................................................................................. 22-3 22.10 Mineral Resource Estimates .................................................................................................... 22-4 22.11 Mineral Reserve Estimates ...................................................................................................... 22-4 22.12 Mining Methods ........................................................................................................................ 22-5 22.13 Recovery Methods ................................................................................................................... 22-6 22.14 Infrastructure ............................................................................................................................ 22-6 22.15 Market Studies ......................................................................................................................... 22-6 22.16 Environmental, Permitting and Social Considerations ............................................................. 22-6 22.17 Capital Cost Estimates ............................................................................................................. 22-7 22.18 Operating Cost Estimates ........................................................................................................ 22-7 22.19 Economic Analysis ................................................................................................................... 22-7 22.20 Risks and Opportunities ........................................................................................................... 22-8 22.20.1 Risks ..................................................................................................................................... 22-8 22.20.2 Opportunities ........................................................................................................................ 22-9 22.21 Conclusions .............................................................................................................................. 22-9 23.0 RECOMMENDATIONS ............................................................................................................ 23-1 24.0 REFERENCES ......................................................................................................................... 24-1 24.1 Bibliography.............................................................................................................................. 24-1 24.2 Abbreviations............................................................................................................................ 24-4 24.3 Glossary of Terms .................................................................................................................... 24-6 25.0 RELIANCE ON INFORMATION PROVIDED BY THE REGISTRANT ................................... 25-1 25.1 Introduction ............................................................................................................................... 25-1 25.2 Macroeconomic Trends ............................................................................................................ 25-1 25.3 Markets ..................................................................................................................................... 25-1 25.4 Legal Matters............................................................................................................................ 25-1 25.5 Environmental Matters ............................................................................................................. 25-2 25.6 Stakeholder Accommodations ................................................................................................. 25-2 25.7 Governmental Factors .............................................................................................................. 25-2 Lihir Operations Papua New Guinea Technical Report Summary Date: February 2026 Page viii TABLES Table 1-1: Measured and Indicated Mineral Resource Statement .................................................... 1-11 Table 1-2: Inferred Mineral Resource Statement .............................................................................. 1-11 Table 1-3: Proven and Probable Mineral Reserve Statement ........................................................... 1-13 Table 1-4: Commodity Price and Exchange Rate Forecasts ............................................................ 1-17 Table 1-5: Capital Cost Estimate ....................................................................................................... 1-21 Table 1-6: Operating Cost Estimate .................................................................................................. 1-21 Table 1-7: Operating Unit Cost Estimate ........................................................................................... 1-22 Table 1-8: Cash Flow Summary Table .............................................................................................. 1-23 Table 3-1: Mineral Title in PNG ........................................................................................................... 3-1 Table 3-2: Mineral Tenure Summary Table ......................................................................................... 3-3 Table 5-1: Exploration and Development History Summary Table ..................................................... 5-1 Table 5-2: Deposit Zone Descriptions ................................................................................................. 5-2 Table 6-1: Deposit Model Features ..................................................................................................... 6-1 Table 6-2: Alteration Domains ........................................................................................................... 6-12 Table 7-1: Prospective Areas .............................................................................................................. 7-6 Table 7-2: Drill Summary Table by Operator ....................................................................................... 7-8 Table 7-3: Drill Summary Table by Drill Purpose ................................................................................ 7-9 Table 7-4: Drilling Used in Mineral Resource Estimation .................................................................... 7-9 Table 7-5: Drilling Since Database Close-Out Date .......................................................................... 7-12 Table 8-1: Assay Techniques and Detection Limits ............................................................................ 8-4 Table 8-2: QA/QC History .................................................................................................................... 8-6 Table 8-3: Newcrest QA/QC Reviews ................................................................................................. 8-9 Table 10-1: Flotation Recovery Forecasts .......................................................................................... 10-5 Table 11-1: Resource Classification Spacing ...................................................................................... 11-4 Table 11-2: Inputs for Marginal Cut-off Grade (Mineral Resource) ..................................................... 11-5 Table 11-3: Measured and Indicated Mineral Resource Statement .................................................... 11-7 Table 11-4: Inferred Mineral Resource Statement .............................................................................. 11-7 Table 12-1: Inputs for Marginal Cut-off Grade (Mineral Reserve) ....................................................... 12-1 Table 12-2: Proven and Probable Mineral Reserve Statement ........................................................... 12-4 Table 13-1: Geotechnical Zones Grouped By Inter-Ramp Angle (v10.6) ........................................... 13-2 Table 13-2: Mineral Reserve Marginal Cut-off Grade Input Assumptions .......................................... 13-6 Table 13-3: Primary Mine Fleet ........................................................................................................... 13-7 Table 13-4: Secondary/Support Mine Fleet ......................................................................................... 13-8 Table 14-1: Key Process Equipment ................................................................................................... 14-8 Table 14-2: Water Type Usage ........................................................................................................... 14-1 Table 16-1: Commodity Price and Exchange Rate Forecasts ............................................................ 16-1 Table 18-1: Capital Cost Estimate ....................................................................................................... 18-2 Table 18-2: Operating Cost Estimate .................................................................................................. 18-3 Table 18-3: Operating Unit Cost Estimate ........................................................................................... 18-3 Table 19-1: Cash Flow Summary Table .............................................................................................. 19-2 Table 19-2: Annualized Cash Flow (2026–2034) ................................................................................ 19-3 Table 19-3: Annualized Cash Flow (2035–2040) ................................................................................ 19-4 Lihir Operations Papua New Guinea Technical Report Summary Date: February 2026 Page ix FIGURES Figure 1-1: Sensitivity Analysis ........................................................................................................... 1-24 Figure 2-1: Project Location Plan ......................................................................................................... 2-1 Figure 3-1: Mineral Tenure Location Plan ............................................................................................ 3-4 Figure 5-1: Zone Locations ................................................................................................................... 5-3 Figure 6-1: Regional Tectonic Elements .............................................................................................. 6-2 Figure 6-2: Volcanic Blocks Comprising Aniolam Island ...................................................................... 6-4 Figure 6-3: Volcanic Blocks Showing Fringing Limestone ................................................................... 6-5 Figure 6-4: Stratigraphic Column, Luise Area ...................................................................................... 6-8 Figure 6-5: Long Sections, Lihir Deposit ............................................................................................ 6-11 Figure 6-6: Alteration Model ............................................................................................................... 6-13 Figure 7-1: Geophysical Survey Location Plan .................................................................................... 7-2 Figure 7-2: Prospect Location Plan ...................................................................................................... 7-7 Figure 7-3: Project Drill Collar Location Plan ...................................................................................... 7-10 Figure 7-4: Drill Collar Locations Supporting Mineral Resource Estimate. ........................................ 7-11 Figure 7-5: Collar Locations, Drilling Completed Since Database Close-Out Date. .......................... 7-13 Figure 12-1: LOM Pit Phase Plan ......................................................................................................... 12-3 Figure 13-1: Pit Slope Design Inter-Ramp Angles................................................................................ 13-3 Figure 14-1: Simplified Process Flow Sheet (Part A) ........................................................................... 14-2 Figure 14-2: Simplified Process Flow Sheet (Part B) ........................................................................... 14-3 Figure 14-3: Flotation Tailings Gold Recovery ..................................................................................... 14-5 Figure 15-1: Infrastructure Layout Plan ................................................................................................ 15-3 Figure 19-1: Sensitivity Analysis ........................................................................................................... 19-5 Lihir Operations Papua New Guinea Technical Report Summary Date: February 2026 Page 1-1 1.0 EXECUTIVE SUMMARY 1.1 Introduction This Technical Report Summary (the Report) was prepared for Newmont Corporation (Newmont) on the Lihir Operations (Lihir Operations or the Project) located in Papua New Guinea (PNG). The host island, Aniolam Island, is also known as Niolam Island and Lihir Island, and is the largest of five islands that make up the Lihir Island group (Mali, Mahur, Masehet, Sanambiet, and Aniolam). The Lihir Project is 100% owned by Newmont’s wholly owned subsidiary, Lihir Gold Limited (Lihir Gold). 1.2 Terms of Reference The Report was prepared to be attached as an exhibit to support mineral property disclosure, including mineral resource and mineral reserve estimates, for the Lihir Operations in Newmont’s Form 10-K for the year ending December 31, 2025. Information in the Report is current as at December 31, 2025. Mineral resources and mineral reserves are reported for the Lihir Project. Mineral resources and mineral reserves are also estimated for material in stockpiles. Mineral resources and mineral reserves are reported using the definitions in Regulation S–K 1300 (SK1300), under Item 1300. All measurement units used in this Report are metric unless otherwise noted, and currency is expressed in United States dollars (US$) as identified in the text. The PNG currency is the kina. Unless otherwise indicated, all financial values are reported in US$ including all operating costs, capital costs, cash flows, taxes, revenues, expenses, and overhead distributions. The Report refers to Newmont as the operator from November 2023 onward, to distinguish work conducted by Newmont after the acquisition from work completed by Newcrest prior to the acquisition. 1.3 Property Setting Aniolam Island is located approximately 900 km northeast of the PNG national capital, Port Moresby. Access to Aniolam Island is through the Kunaye airport located about 7 km north of the Lihir Operations and approximately 3 km north of the Londolovit town site. Newmont employees are predominantly PNG nationals who are fly-in-fly-out (FIFO) of a number of different PNG communities or residents of Aniolam Island. The majority of senior management roles are residential based on Aniolam Island while most expatriate employees typically are FIFO from the hub of Cairns, in Australia. Daily travel to the Lihir Operations from the Londolovit residential town site is by road. Sea passenger services operate to local islands. Marine facilities are established to service oil tankers, general cargo ships, passenger ferries, and work boats.


Lihir Operations Papua New Guinea Technical Report Summary Date: February 2026 Page 1-2 Aniolam Island is located at latitude 3° south and does not experience distinct wet or dry seasons. Rainfall is high year-round. Temperatures at the mine site range from 21–34°C. Wind speeds at the mine site are generally light and variable. Mining activities are conducted year-round. Exploration activities may be curtailed by heavy rainfall. The general mine area ranges in elevation from 0–200 masl. Mining is conducted at elevations below sea level. Natural vegetation on the island is predominantly tropical rain forest. Papua New Guinea extends across several major tectonic plate boundaries and is one of the most seismically active regions in the world. Aniolam Island is located in the West Melanesian Arc seismic source zone where earthquakes of magnitude eight have been recorded. Most earthquakes in the region result from strike-slip movement but some occur along steeply-dipping reverse faults resulting in a strong vertical motion component and have potential to generate local tsunamis. Both tsunami and earthquake risks were assessed and incorporated into the Project design criteria. Volcanic activity on Aniolam Island is limited to remnant hydrothermal venting in the Luise Caldera in the form of hot springs and fumaroles. Isolated geothermal activity in the form of hot springs is evident elsewhere on the island, such as within the southern Kinami caldera. 1.4 Ownership Newmont indirectly wholly-owns the Lihir Operations. Newmont acquired Newcrest Mining Limited (Newcrest) in 2023 and is the Project operator. 1.5 Mineral Tenure, Surface Rights, Water Rights, Royalties and Agreements The Project consists of a granted Special Mining Lease, two granted Mining Leases, one granted Exploration License, five granted Leases for Mining Purposes, and three Mining Easements. The total area held in respect to the mineral tenure is approximately 238 km2. The Lihir deposit is located on Special Mining Lease 6. Special Mining Lease 6, Lease for Mining Purposes 34–40, and Mining Easements 71–73 expire on March 16, 2035. Exploration License 485 expired in March 2024 and an application for renewal is in process; Mining Lease 125 and Mining Lease 126 both expired on July 20, 2025, and applications for renewal are in process. Newmont must lodge annual and bi-annual reports on activities conducted on the mineral tenure. As at December 31, 2025, all statutory reporting requirements had been met. The Project area is situated on land held under customary, State, and private ownership, including under State lease. The bulk of the land that is, or will be, affected by Project operations and closure is customary owned. Newmont has been granted rights to undertake mining and processing of gold and related activities, through negotiations with the state and local government, and landowners in the area. The Special Mining License entitles Newmont to enter and occupy the land for the purpose of mining and the ancillary mining purposes for which the Mining Lease was granted. There are some areas of the lease where mineral resources are estimated where agreements are not yet in place with local landowners or the community. Environmental permits for water extraction and waste disposal are in place to support mining operations. Lihir Operations Papua New Guinea Technical Report Summary Date: February 2026 Page 1-3 Newmont is entitled to 100% of the minerals produced from the mineral tenure subject to the payment of prescribed annual rents and royalties. A 2% royalty is payable to the State of PNG on the realized prices of all gold and silver doré produced. Under the Memorandum of Agreement (MoA), the State is responsible for direct distribution of all royalties derived from the Lihir Operations to Special Mining Lease 6 landowners (20%), Nimamar Local Level Government (30%) and the New Ireland Provincial Government (50%). A production levy of 0.5% is also payable on the gross value of production (i.e., excluding the offsets of treatment and refining charges, payable terms, and freight) to the PNG Minerals Resources Authority. 1.6 Geology and Mineralization The Lihir deposit is considered to be an example of an epithermal gold deposit. Aniolam Island is part of a 250-km long, northwest-trending, alkalic volcanic island chain that sits within an area where several micro-plates (Solomon Sea Plate, South Bismarck Plate and North Bismarck Plate) developed between the converging Australian and South Pacific plates. Aniolam Island comprises five volcanic blocks: • Two Plio–Pleistocene volcanic blocks, Londolovit Block and Wurtol Wedge; • Three Pleistocene volcanic edifices, Huniho, Kinami, and Luise. Areas of hydrothermal alteration occur in each of the volcanic centers. A 10–100 m thick limestone unit overlies and onlaps volcanic units and dips shallowly to the south. The Luise volcano consists of a 4 by 3.5 km wide amphitheater, elongated and breached to the northeast. This is inferred to be a remnant of the original approximately 1.1 km high volcanic cone that underwent sector collapse(s). The Lihir deposit is located in the footwall of the sector collapse detachment surface. Post sector collapse volcanism occurred during the modern geothermal-stage, with the emplacement of several diatreme breccia bodies. The Lihir deposit has dimensions of about 1,500 x 3,000 m and has about 500 m in depth extent. The deposit remains open at depth, along strike, and to the east, where it is currently limited by the Pacific Ocean. Gold is the only metal of economic significance present within the Luise Caldera. Gold mineralization is a complex and refractory assemblage associated mainly with pyrite and marcasite veinlets, disseminations, replacements, and breccia fillings. The sector collapse event(s) superimposed late-stage, gold-rich, alkalic low-sulfidation epithermal mineralization upon early-stage, porphyry-style alteration. Gold occurs as solid solution gold in the crystal structure of pyrite grains. It locally occurs as electrum, as gold tellurides, and as native gold associated with quartz, calcite, and bladed anhydrite. A broad, three-fold vertical alteration zonation within the Lihir deposit consists of: • Surficial, generally barren, steam-heated clay alteration zone that is a product of modern high-temperature geothermal activity; • High-grade (>3 g/t Au), refractory sulfide and adularia alteration zone that represents the ancient epithermal environment; Lihir Operations Papua New Guinea Technical Report Summary Date: February 2026 Page 1-4 • Comparatively low-grade (<1 g/t Au) zone rich in anhydrite ± carbonate, coupled with biotite alteration, that represents the ancient porphyry-style environment. A detailed alteration model was constructed for process planning purposes. The understanding of the Lihir deposit settings, lithologies, mineralization, and the geological, structural, and alteration controls on mineralization is sufficient to support estimation of mineral resources and mineral reserves. 1.7 History and Exploration Prior to Newmont’s Project interest, exploration and mining activity was conducted by PNG Bureau of Mineral Resources and the Geological Survey of PNG, Kennecott Explorations Australia (Kennecott), Niugini Mining Limited (Niugini), Rio Tinto Zinc Corporation (Rio Tinto), Lihir Gold, and Newcrest. Work conducted included geological mapping, geochemical sampling (stream sediment, soil rock chip, hand augers); hand-cut trenches and benches; airborne and ground geophysical surveys; core drilling; mining studies (optimizing pit, stockpiles and waste rock storage and disposal); and process studies (optimizing plant design and equipment). The Lihir deposit was discovered in 1982. A feasibility study was conducted in 1988 and updated in 1992. The mine was constructed following grant of the special mining lease in 1995, and the first gold pour occurred in 1997. A geothermal power plant was built in 2007 and a flotation circuit was installed the same year. Mining commenced with the development of the Minifie pit sector using a conventional truck and shovel operation. Mining of the Lienetz pit sector commenced in 2004, and mining has continued in both areas from a number of subsequent cutbacks. Newmont obtained its Project interest in November, 2023. 1.8 Drilling and Sampling 1.8.1 Drilling Drilling completed to December 31, 2025, comprises primarily RC drilling for short-term planning and core drilling. Drilling was completed for exploration, resource delineation, metallurgical, geotechnical, pit cooling, and geothermal purposes, and totals 23,919 drill holes (1,249,059 m). A total of 2,295 drill holes (449,287 m) is used in mineral resource estimation. Logging and data collection include collar, lithology, discontinuities, point load tests, bulk density, and magnetic susceptibility. Lithology is logged based on the geological unit, with subdivisions created based on alteration and mineralization. Core recovery is generally excellent with core recoveries around 99%. Historical comparison of core data with blast hole data suggests no appreciable bias related to core recovery. Drill collar locations were surveyed using either theodolite or differential global positioning system (DGPS) instruments. A variety of methods were used to measure down-hole deviation (dip and azimuth), including Eastman and electronic single shot instrument; the majority of readings were performed using the Eastman camera. Gyroscopic survey methods are typically used for geotechnical drill holes. Depending on the drill hole purpose, not all drill holes may be down-hole surveyed. Lihir Operations Papua New Guinea Technical Report Summary Date: February 2026 Page 1-5 Drill spacing is variable, as there are limited drill platform sites available due to the rugged topography. Drilling can vary from 40–100 m spacing, depending on the available drill platform locations. Drilling is typically near-vertical. This drill orientation is acceptable for the majority of the mineralization orientation, and results in drilled widths that approximate true widths. 1.8.2 Hydrogeology The Lihir deposit is located within a geothermally active zone. The hydrogeology environment can include both liquid water and steam due to the high temperatures. Hydrogeology data are collected where deemed necessary to provide additional information and to verify pore pressure conditions in the vicinity of open pits. Pore pressures, temperatures, and ground water levels are constantly monitored by using a series of grouted multiple vibrating wire piezometer bores. Site personnel routinely collect data, analyze time-series data on daily, weekly, and monthly reports to support slope design. As required, corporate subject matter experts and/or third-party consultants undertake specialized hydrogeological/geotechnical evaluations. A numerical groundwater flow model (FEFLOW) was developed by third-party consultants for localized areas of liquid water assessment. Numerical geothermal models have been developed by third party consultants to predict the pore pressure and temperature with mining development. A water balance (Goldsim) model was developed for the site water balance. To the Report date, the hydrogeological data collection programs have provided suitable for use in the mining operations and have supported the assumptions used in the active pits. 1.8.3 Geotechnical Geotechnical data are collected where deemed necessary to provide additional information and to verify ground conditions in the vicinity of the open pits and terrestrial dumps. Core drilling methods are used to collect soil and or rock core. Materials encountered are logged, sampled, laboratory tested where required. In addition to information gathered during core drilling, geological structures are mapped and documented continuously as mining progresses in the open pits. This is aided through use of geo- referenced photogrammetry and high-definition point cloud scanning that is used to create digital references of structural modelling. The geological and geotechnical setting of the Lihir operations for both soils and hard rock is well understood and displays consistency in the various operating areas on the site. Additional testing continues to confirm the consistency of material strength properties. As required, corporate subject matter experts and/or third-party consultants undertake specialized hydrogeological/geotechnical evaluations. 1.8.4 Sampling and Assay The nominal core sampling interval is 2 m; however, sampling intervals may vary. In particular, samples taken for metallurgical purposes may be significantly longer than the nominal sample interval. Historical RC holes were drilled to 36 m depth with one sample collected every 6 m rod for a 100 mm diameter hole. Currently, RC holes are drilled vertically to depths ranging from 48–


Lihir Operations Papua New Guinea Technical Report Summary Date: February 2026 Page 1-6 96 m, and samples are taken at 3 m intervals aiming to provide a 3 kg split from the primary port on a cyclone cone splitter. Sonic drill holes completed for metallurgical purposes were sampled at interval lengths ranging from 6–15 m, length to align with compositional variation as determined via Corescan. Sonic drill holes completed for geotechnical purposes were selectively sampled to provide samples for unconfined compressive strength, point load, and other geotechnical tests. Sample security at the Lihir Operations has not historically been monitored. Sample collection from drill point to laboratory relies upon the fact that samples are either always attended to, or stored in the locked on-site preparation facility, or stored in a secure area prior to laboratory shipment. Chain-of-custody procedures consist of sample submittal forms to be sent to the laboratory with sample shipments to ensure that all samples are received by the laboratory. Density determinations use caliper and weighing methods. There is a total of 11,535 determinations available for resource estimation. Density values range from 6.75 t/m3 in fresh rock to 1.01 t/m3 in altered and oxidized material. A number of third-party, independent analytical and sample preparation laboratories were used prior to 1997, and include Pilbara Laboratories (subsequently underwent name change to Analabs, later Genalysis), SGS, Standard and Reference Laboratories and ALS Chemex. There are no accreditation data available in the Project database for the majority of the laboratories at the time of use. Standard and Reference Laboratories was accredited to ISO9001 at the time of use. The original onsite laboratory was constructed in 1997, and was the primary preparation and analytical laboratory to 2025. A new onsite laboratory was constructed in 2025 and will again be the primary laboratory. The original laboratory held no accreditations. There are plans to have the new laboratory ISO17025 certified in 2026. The original onsite laboratory was operated by Lihir Gold until 2010 and then by Newcrest to 2023. Newmont has been the operator since 2023. Standard and Reference Laboratories, located in Perth, Western Australia, was used as a check laboratory in 2012. The laboratory was independent, and accredited to ISO9001 at the time of use. Standard and Reference Laboratories became part of the Inspectorate group, now Bureau Veritas. From 2010, samples were sent to SGS Lae, SGS Townsville, ALS Chemex Brisbane or the Newcrest (now Newmont) Services Laboratory in Orange (NSLO) for check or additional analysis. Any of these laboratories could be used for primary analysis for selected samples. There is no accreditation data available in the Project database for SGS Lae, or SGS Townsville. Both laboratories were independent at the time. ALS Chemex Brisbane and NSLO hold ISO17025 accreditations. ALS Chemex Brisbane is an independent laboratory. NSLO was not independent of Newcrest and is not independent of Newmont. Half-core HQ samples are currently sent to Intertek laboratory in Lae (Papua New Guinea) for sample preparation, and pulp samples flown to Intertek Townsville (Australia) for multi-element geochemistry, LECO, and fire-assay analysis. Intertek Lae and Intertek Townsville were independent of Newcrest and are independent of Newmont. The laboratories hold ISO17025 accreditation for selected analytical techniques. Umpire sample checks are completed at the NSLO. Gold and sulfide sulfur assays on ore control and plant samples are currently performed at the onsite mine laboratory. Samples can be sent to the NSLO; however, this is primarily done for metallurgical samples and samples requiring multi-element analyses. Lihir Operations Papua New Guinea Technical Report Summary Date: February 2026 Page 1-7 1.8.5 Quality Assurance and Quality Control All assays are checked and verified in accordance with quality assurance quality control (QA/QC) and database management procedures. QA/QC procedures were in place for all of the Project legacy drilling programs. The process can involve submission and analysis of standard reference materials (SRMs or standards), blanks, duplicates, replicates, and grind and crush size checks. Data is stored in a SQL server database using acQuire software. Regular reviews of data quality are conducted by Lihir Operations site and Newmont’s corporate teams prior to resource estimation, in addition to external reviews. The database is regularly backed up, and copies are stored both offsite and in Newmont’s facilities. 1.9 Data Verification Recent drilling activity by Newcrest/Newmont has used standard operating procedures that include data verification before data are accepted into the drill hole database. Laboratory inspections are carried out regularly, although older inspection records are no longer available. Inspection periods have varied between monthly and six-monthly intervals. The onsite laboratory and the NSLO participate in third-party round-robin programs on a six-monthly basis, and each has performed within expected industry standards. SRK Consulting (Australasia) Pty Ltd (SRK) performed an independent review of the current resource model in 2018. SRK provided Newcrest with a number of minor recommendations for future modelling efforts and concluded that there were no significant concerns or issues with the reviewed model. Observations made during the QP’s 2025 site visit, in conjunction with discussions with site-based technical staff also support the geological interpretations, and analytical and database quality. The QP’s personal inspection supports the use of the data in mineral resource and mineral reserve estimation, and in mine planning. The QP received reconciliation reports from the operations. Through the review of these reconciliation factors, the QP can accept the use of the data in support of the mineral resource and mineral reserve estimates. 1.10 Metallurgical Testwork Independent laboratories and testwork facilities used during initial metallurgical evaluation included: Sherritt International Corporation (Sherritt), Metso Minerals Process Technology (Metso), Hazen Research Inc. (Hazen), Pocock Industrial (Pocock), IPRC, Lakefield, E.L. Bateman, Eimco, RESCAN, Alberta Research Council, Dorr-Oliver, Lurgi, Davy McKee, and NSR Environmental. Geometallurgical testwork completed from 2012–2025 was primarily conducted at Core Resources Laboratories in Brisbane, and Bureau Veritas in Perth who are independent of Newmont. Metallurgical testwork supporting the original process design included comminution (crushing (impact), rod mill, ball mill, abrasion, MacPherson's semi-autogenous grind (SAG) indices), flotation, pressure oxidation (POX), and mineralogy. Overall, samples selected for metallurgical testing during feasibility, development and expansion studies were representative of the various styles of mineralization within the different mineralized Lihir Operations Papua New Guinea Technical Report Summary Date: February 2026 Page 1-8 zones. Samples were selected from a range of locations within the deposit zones. Sufficient samples were taken, and tests were performed using sufficient sample mass for the respective tests undertaken. The processing facility commenced operations in 1997 at a nominal 2.8 Mt/a, treating high-grade ore with lower-grade ore stockpiled for later processing. The original process plant flow sheet consisted of grinding, whole ore oxidation in pressure autoclaves, followed by gold recovery from washed oxidized slurry using conventional carbon-in-leach (CIL) cyanidation. In 2001, heat- exchangers were installed ahead of the autoclaves to pre-heat slurry prior to oxidation in the autoclaves in response to declining sulfide sulfur head grade. A pebble crushing circuit was installed on the then single, grinding train to increase mill throughput from a nominal 4 Mt/a to 4.6 Mt/a. In May 2007, an additional grinding and flotation plant upgrade (FGO) was commissioned. The additional grinding train increased nominal throughput to 6 Mt/a. This was achieved without a significant change in autoclave throughput enabled by the introduction of flotation, which was primarily used to increase autoclave feed sulfide sulfur grade. This also reduced the mass flow to the autoclaves. In early 2008, a feasibility study on a major plant expansion (the MOPU plant expansion) was approved by Lihir Gold, and works commenced in 2009. Following Newcrest’s takeover of Lihir Gold in 2010, Newcrest completed the outstanding work of the major plant upgrade. The plant upgrade added primary jaw crushers, another grinding circuit (HGO2), another autoclave (AC4), and oxygen plant, as well as a second CIL circuit. The plant expansion was completed and commissioned in January 2013. The nominal plant capacity was 11–12 Mt/a; however, actual throughput was about 9–10 Mt/a. Shortly after commissioning of the MOPU plant expansion, Newcrest installed a second flotation circuit for the original HGO mill, to enable treatment of low-sulfur ores. In December 2014, the operating strategy for the Lihir Operations was changed to using partial pressure oxidation (minimum of 50% sulfide oxidation instead of total pressure oxidation with >98% sulfide oxidized). The switch in strategy was due to the recognition that irrespective of how gold in sulfide sulfur was presented to the autoclave or from which source (ore or flotation concentrate), only a fraction of the refractory sulfide is required to undergo oxidation to unlock the majority of the gold for subsequent recovery. Most of the gold (generally >90%) is associated with arsenian pyrite, which is microcrystalline in nature, highly reactive, and oxidizes fastest in the autoclaves. The other pyrite type, (blocky pyrite) is generally coarser, contains low levels of gold, and is relatively unreactive in acidic conditions. The blocky pyrite requires full oxidation for gold recovery, and it is not economical to specifically target this pyrite if gold-rich arsenian pyrite is available to oxidize. Geometallurgical test work has shown the connection between process plant response and geological alteration. Ore from historical stockpiles also shows lower flotation recovery. This understanding has formed the basis of metallurgical models and assumptions. An SMC based power model is used to predict power draw based on mill feed type and grind size. The model is also set up to optimize grind size based on power availability and throughput. For practical reasons, the model limits grind-size selection and optimization within a range of 125– 212 μm. Future recovery projections for Lihir are based on laboratory test work for future ores in combination with past actual plant performance. This has been found to be sufficiently accurate for the purposes of projecting recovery and hence gold production from Lihir ores. Testwork on porphyry and epithermal ore samples from Phase 24 have been completed, with results Lihir Operations Papua New Guinea Technical Report Summary Date: February 2026 Page 1-9 consistent with, or better than model assumptions. Testwork on Phase 24 argillic ore is in progress. The average metallurgical recovery for gold over the LOM plan is predicted to be 76%. Daily and monthly recovery varies, based on ore grade, the fraction of milled ore sent to flotation, and the amount of stockpiled ore being treated. Although a number of projects aimed at improving plant gold recovery are underway, no recovery uplifts have been included in future production forecasts. Naturally, fine-grained ores (mostly argillic material) and clays (from fresh or stockpile ore) can impact both plant throughput and metallurgical recovery. For the crushing and materials handling areas, wet and sticky ores are managed through blending and on-going mechanical modifications to conveyors and chutes etc. Once in slurry form, these ores can display high and variable non- Newtonian shear-thinning behavior, which can impact the milling, flotation, POX, and CIL circuits. However, dilution has been found effective in controlling slurry rheology to date. The maximum proportion of fines and clays (mainly from argillic ores) that can be treated within the plant is not known with certainty. There are several types of clay minerals with varying impact on plant performance. There is some risk that high proportions of such ore types in plant feed may lead to both lower recovery and throughput, until an adjustment to the mine plan and/or additional plant modifications can be implemented. There are no penalty elements that affect doré sales. Deleterious components in the ore that may affect aspects of plant operation are typically localized, and to date, have had only short- term effects. 1.11 Mineral Resource Estimation 1.11.1 Estimation Methodology The database close-out date for the mineral resource estimate was October 15, 2024. Geological interpretation is supported by core, RC, in-pit mapping, and grade control sampling data (blast hole). Core drilling can include drill holes completed for geotechnical, geothermal, resource definition, and metallurgical purposes, if there are assay data for the drill holes. Not all core holes, if completed for purposes other than resource definition, have analytical data. The alteration model was used as the underlying geological model because alteration (based on mineralogy and chemistry) was found to characterize key processing parameters better than other geological parameters. Five structural domains and three alteration domains were used in estimation. Block density data were estimated via ordinary kriging (OK), based on alteration domains. Gold distributions have outliers that require examination and adjustment. Outliers are capped such that the tail of the distribution is reasonably contiguous. Domain cap limits vary by domain and range from 30-50.9 g/t Au. No capping was applied to sulfide sulfur composites. All core data were composited to 12 m downhole; this composite length corresponds to the mining bench height. Variograms were calculated for gold, sulfide sulfur, arsenic, silver, calcium, carbonate, copper, and molybdenum.


Lihir Operations Papua New Guinea Technical Report Summary Date: February 2026 Page 1-10 Gold and sulfide sulfur were estimated with a non-linear uniform conditioning (UC) method into large 100 x 100 x 12 m panels in their respective domains. The panel uniform conditioning grade– tonnage curve was subdivided (localized) into 20 x 20 x 12 m selective mining unit (SMU) blocks for the final output model. All gold and sulfide sulfur boundaries were semi-soft. Minor elements (silver, copper, arsenic, carbonate, calcium, and molybdenum) were estimated directly into the selective mining unit blocks using ordinary kriging. Hard boundary conditions were used between the argillic, epithermal and porphyry domains. The block model and informing composites were validated using a combination of visual inspection in plan and section, nearest-neighbor model comparison, swath plots, grade–tonnage curves, and direct block simulation. Reconciliation based on blast hole sampling is considered to be acceptable, and the results are adequate to provide validation support for the mineral resource estimate. Mineral resources were classified as indicated or inferred mineral resources, based on a combination of the estimation slope of regression and the variogram-weighted distance. Mineral resources contained within stockpiles are classified as indicated. Mineral resources were constrained within a conceptual pit design. Cost inputs for pit optimization purposes were based on the cost model developed for the 2026 budget (2026BP). Commodity prices used in resource estimation are based on long-term analyst and bank forecasts, supplemented with research by Newmont’s internal specialists. The estimated timeframe used for the price forecasts is the 18-year LOM that supports the mineral reserve estimates (processing ends in 2043). Mineral resources are reported using a marginal cut-off grade. The mineralization and resource model extents continue offshore. A seaward limit was imposed on the resource shell optimization based on an alignment of a conceptual outer seepage barrier to constrain the mineral resource estimate on the eastern extent. The conceptual barrier alignment is to the east of the original shoreline located on the harbor waste platform, and represents the maximum seaward extent of reasonable mining scenarios for open pit mining. 1.11.2 Mineral Resource Statement Mineral resources are reported using the mineral resource definitions set out in SK1300 on a 100% basis. Newmont holds a 100% Project interest. The estimates are current as at December 31, 2025. The reference point for the estimates is in situ or in stockpiles. Mineral resources are reported exclusive of those mineral resources converted to mineral reserves. Mineral resources that are not mineral reserves do not have demonstrated economic viability. Measured and indicated mineral resources are provided in Table 1-1. Inferred mineral resources are shown in Table 1-2. The Qualified Person for the estimate is Mr. Shaun Chanter, RM SME, Head Reserve Governance - Global, a Newmont employee. Lihir Operations Papua New Guinea Technical Report Summary Date: February 2026 Page 1-11 Table 1-1: Measured and Indicated Mineral Resource Statement Mineral Resource Confidence Category Area Tonnage (kt) Grade (g/t Au) Contained Metal (koz Au) Measured — — — Indicated Open pit 36,500 1.99 2,300 Stockpiles 1,000 2.11 100 Total measured and indicated 37,500 1.99 2,400 Table 1-2: Inferred Mineral Resource Statement Mineral Resource Confidence Category Tonnage (kt) Grade (g/t Au) Contained Metal (koz) Inferred 239,800 2.4 18,300 Notes to accompany mineral resource tables: 1. Mineral resources are current as at December 31, 2025. Mineral resources are reported using the definitions in SK1300 on a 100% basis. The Qualified Person responsible for the estimate is Mr. Shaun Chanter, RM SME, Head Reserve Governance - Global, a Newmont employee. 2. The reference point for the mineral resources is in situ or in stockpiles. 3. Mineral resources are reported exclusive of mineral reserves. Mineral resources that are not mineral reserves do not have demonstrated economic viability. 4. Mineral resources that are potentially amenable to open pit mining methods are constrained within a conceptual pit design. Parameters used are shown in Table 11-2. Mineral resources in stockpiles are reported above a 1.0 g/t Au cut-off. 5. Tonnages are metric tonnes. Gold ounces are estimates of metal contained in tonnages and do not include allowances for processing losses. 6. Rounding as required by reporting guidelines may result in apparent differences between tonnes, grade and contained metal content. Tonnes are rounded to the nearest 100,000 tonnes. Ounces are rounded to the nearest 100,000 ounces. 1.11.3 Factors That May Affect the Mineral Resource Estimate Areas of uncertainty that may materially impact the mineral resource estimates include: the lack of stationarity in gold domains; changes to long-term gold price assumptions; changes in local interpretations of mineralization geometry and continuity of mineralized zones; changes to geological shape and continuity assumptions; changes to metallurgical recovery assumptions; changes to the operating cut-off assumptions for open pit mining methods; changes to the input assumptions used to derive the pit shell used to constrain the estimate; changes to the marginal cut-off grade assumptions used to constrain the estimate; variations in geotechnical, geothermal, hydrogeological and mining assumptions; and changes to environmental, permitting and social license assumptions. Lihir Operations Papua New Guinea Technical Report Summary Date: February 2026 Page 1-12 1.12 Mineral Reserve Estimation 1.12.1 Estimation Methodology Mineral reserves are reported using open-pit mining assumptions. Indicated Mineral Resources were classified as probable Mineral Reserves. Inferred Mineral Resources within the mine plan are set to waste. Mineral Reserves have been defined within an optimized open pit shell. Several sequential cutbacks were developed for the Mineral Reserves nested within the ultimate phase design. Cutback designs conform to open pit design procedures established for the Lihir deposit, which include 28–40 m wide ramps at 10% gradients, and a minimum mining width of 40 m. Each cutback has independent ramp access, with secondary egress through the Minifie pit sector void. The Kapit pit designs incorporate provision to diversion drainage around the pit crest to manage run-off from the caldera slopes. The planned final dimensions of the pit are approximately 2,000 x 1,400 m, with a final depth of approximately 350 m below sea level. Cost inputs are based on the 2026 budget cost model and adjusted for LOM application inclusive of long-term economic parameters that were set by Newmont. Mining costs included unit operating costs for drill and blast, load and haul, waste disposal by barge, ancillary equipment, and a mine overheads component. Pit inter ramp angles range from approximately 10–55°. Internal dilution was considered in the resource model. External dilution as a result of sheeting (competent material rehandled back to the pit) was applied. Sheeting estimates were supported by a reconciliation of mine operations over the last several years. A 3% ore loss was applied as a result of blasting and mining efficiency, reflective of the mining method. Processing unit costs were broken down by plant activity to allow a choice of two processing routes (direct to autoclave, or via flotation). The average metallurgical recovery derived from the pit optimization was 76.4%. Fixed costs per period for G&A, plant maintenance, plant overheads, and power were divided by the nominal mill throughput to provide a unit cost per tonne processed for optimization purposes. Sustaining capital costs for fleet replacement, plant maintenance and capital for other sustaining capital projects were also divided by the nominal mill throughput to provide a unit cost per tonne processed for optimization purposes. As the Lihir Operations are constrained by the ore tonnes that can be processed by the mill, only the higher-grade fraction of ore is processed through the mill while the lower-grade fraction is stored in long-term stockpiles. As a result, a period of low-grade stockpile processing is expected at the end of the mine life when mining operations are completed. 1.12.2 Mineral Reserve Statement Mineral reserves are reported using the mineral reserve definitions set out in SK1300 on a 100% basis. Mineral reserves are current as at December 31, 2025. The reference point for the mineral reserve estimate is as delivered to the process facilities. Mineral reserves are reported in Table 1-3. The Qualified Person for the estimate is Mr. Shaun Chanter, RM SME, Head Reserve Governance - Global, a Newmont employee. Lihir Operations Papua New Guinea Technical Report Summary Date: February 2026 Page 1-13 Table 1-3: Proven and Probable Mineral Reserve Statement Mineral Reserve Confidence Classification Area Tonnage (kt) Grade (g/t Au) Contained Metal (koz Au) Proven — — — Probable Open pit 147,900 2.55 12,100 Stockpiles 72,300 1.65 3,800 Total proven and probable 220,200 2.26 16,000 Notes to accompany mineral reserves table: 1. Mineral reserves current as at December 31, 2025. Mineral reserves are reported using the definitions in SK1300 on a 100% basis. The Qualified Person responsible for the estimate is Mr. Shaun Chanter, RM SME, Head Reserve Governance - Global, a Newmont employee. 2. The reference point for the mineral reserves is the point of delivery to the process plant. 3. Parameters used are shown in Table 12-1. Mineral reserves in stockpiles are reported above a 1.0 g/t Au cut-off. 4. Tonnages are metric tonnes. Gold ounces are estimates of metal contained in tonnages and do not include allowances for processing losses. 5. Rounding as required by reporting guidelines may result in apparent differences between tonnes, grade and contained metal content. Tonnes are rounded to the nearest 100,000 tonnes. Ounces are rounded to the nearest 100,000 ounces. 1.12.3 Factors That May Affect the Mineral Reserve Estimate Areas of uncertainty that may materially impact the mineral reserve estimates include: changes to long-term gold price assumptions; changes to exchange rate assumptions; changes to the resource model or changes in the model reconciliation performance including operational mining losses; changes to geometallurgical recovery and throughput assumptions; changes to the input assumptions used to generate the open pit design; changes to operating, and capital assumptions used, including changes to input cost assumptions such as consumables, labor costs, royalty and taxation rates; variations in geotechnical and mining assumptions; including changes to designs, schedules, and costs, changes to geotechnical, hydrogeological, geothermal and engineering data used; changes to assumptions as to pit cooling and seepage barrier development and operation; ability to source sufficient quality water supplies to support process plant operations; changes to the assumed permitting and regulatory environment under which the mine plan was developed; continued ability to use sub-sea waste and tailings disposal methods; ability to maintain mining permits and/or surface rights; and the ability to maintain social and environmental license to operate. Ongoing mining adjacent to, and to the west of, Ailaya Rock will require continued community acceptance. The mine plan in that area uses steep wall mining techniques. Geotechnical monitoring will be a critical control. The cut-off grade used in this mine plan assumes that future cost reductions at the end of the LOM can be achieved. The mine plan assumes that the existing permitting area for marine tailings and waste disposal can be expanded as required in the LOM plan.


Lihir Operations Papua New Guinea Technical Report Summary Date: February 2026 Page 1-14 1.13 Mining Methods The Lihir geotechnical slope model was developed in conjunction with recommendations from external consultants. Slope performances that have been continuously monitored and reviewed were also been considered, verifying the nominated slope recommendation. For design purposes, the geotechnical slope parameters have been divided into 118 contiguous domain that are expected to exhibit similar geotechnical properties. These domains are typically related to the alteration boundaries and further sub-divided based on further geotechnical modelling based on geotechnical properties. The extents of these domains cover the full resource model framework. Within each domain an appropriate inter-ramp angle, batter face angle and berm width configurations for pit designs were nominated. Inter-ramp angles varied from 15–55° with batter angles varying from 25–80º. Extensive prism, pit face radar and geotechnical monitoring of pit slopes and seismic monitoring is undertaken. The Lihir Operations receives on average 4.4 m of annual rainfall with surface water from large- scale rainfall events dominating water inflow (approximately 85%) to be managed within the active mine pit. Groundwater inflow provides lesser contribution to pit void inflows and is proportioned between groundwater interflow via the Luise Caledra from the west and seawater inflows to the east. Currently, both surface water and groundwater inflows and active mine dewatering and depressurization are managed via: • Passive depressurization using horizontal drain holes and steam relief wells; • Active dewatering using in-pit sump surface water management facilities. These systems are incorporated into the LOM and staged pit designs. The Luise Caldera is still geothermally active, with temperature modelling indicating current rock temperatures in some areas within the ultimate pit design exceeding 100oC. The active zone is extensive within the Kapit pit sector area. Areas with rock temperatures >100oC can cause groundwater to instantaneously flash to steam when confining pressure is released by mining, with the potential for rock outburst events to occur. Potential geothermal outburst areas are managed using a combination of geothermal depressurization and pit cooling. Current operational technology allows mining of hot ground temperatures of up to 165ºC, after which the bulk explosive formulation required for production blasting becomes a constraint. Additional projects and trials to mitigate the risk to mining activities in hot ground, and to extend successful blasting and mining of ground with temperatures of >165ºC are under evaluation. Production mining is by conventional open pit method, using a fleet of 600/500 t class (operating weight) hydraulic face shovels loading into 135 t capacity rear-dump haul trucks, with a recently demonstrated mining rate of 30–35 Mt/a ex-pit. Ore and waste are drilled and blasted on 12 m benches and mined in a single pass. Where practicable, walls are drilled with a pre-split to assure stable wall rock conditions. The ground is frequently too hot for conventional explosives, requiring high temperature blasting products and specialized blasting procedures for mining in hot ground. Material above the marginal cut-off grade of 1.0 g/t Au is stored in long-term stockpiles for processing after the end of mine life. The marginal cut-off grade assumes a reduction in sustaining capital and G&A costs at the end of mine life, allowing marginal material to be economically processed. An elevated cut-off strategy is employed, where only high- and medium- grade material is fed to the mill, while the lower-grade fraction is stockpiled for later processing. Lihir Operations Papua New Guinea Technical Report Summary Date: February 2026 Page 1-15 On an annual basis from 2027–2034, an average of approximately 9% of ore mined is sent to long-term low-grade stockpiles. High-grade ore (typically >3 g/t Au) is prioritized to the plant first, while medium-grade ore (1.6–3 g/t Au) is blended to achieve the required feed properties of ore type and sulfur grade. The planned cut-off between medium-grade and low-grade material can be adjusted if needed, depending on ore supply and phase development. The majority of ex-pit ore is allocated by gold and sulfur grade into a blend plan agreed with process plant staff along with existing stockpiled ore. Mill feed is based on the blend plan and can be comprised of reclaimed ore from the ROM stockpiles, direct ex-pit ore, and existing stockpile ore. The current mine production schedule includes several phases that progress through to the Kapit orebody and concludes with mining the remnants of the Minifie orebody. Stockpiled material is reclaimed as required to maximize mill throughput. By 2043, ex-pit and stockpile inventories will be depleted and processed. The ex-pit mining rate ranges from 28–35 Mt/a until 2034, after which it reduces to an average of 16 Mt/a from 2035–2040 as stockpile feed becomes the majority ore source. The Kapit pit sector will require the completion of several initiatives, including the construction of a seepage barrier or cut-off wall, just off the original Kapit shoreline in the shallows of Luise Harbor, construction of a perimeter drainage channel, and geothermal cooling and depressurization to a temperature at which mining can be safely undertaken. Production mining is conducted by Newmont using an Owner-operated equipment fleet and an Owner workforce. A contractor fleet of ancillary equipment is also used for road maintenance and drainage, mobile crushing services, pioneering work, and other minor project work where required. There are a total of 2,320 personnel in mine operations including operations and maintenance. 1.14 Recovery Methods As the gold mineralization is refractory, gold recovery is reliant on the oxidation of gold bearing sulfide sulfur. The plant consists of crushing and grinding followed by partial flotation, pressure oxidation, and then recovery of gold from washed oxidized slurry using conventional cyanidation. The plant was first commissioned in 1997 and has undergone a number of alterations and expansions, which has allowed for improvements in the throughput rate. Metallurgical testwork, in conjunction with operational results, was used to refine plant operations. A throughput rate of approximately 12.5 Mt is targeted in the LOM plan. The plant has two primary crushing circuits. The crushing equipment includes a gyratory crusher and toothed MMD rolls crusher in one circuit and two jaw crushers operating in parallel in the second circuit. Limited ore blending is practiced prior to crushing. This assists in managing the significant variability that exists in the mineralization being mined. There are three grinding circuits. One circuit (HGO2) generally treats high-grade ore that is fed direct to the downstream oxidizing autoclaves. The second and third circuits (FGO circuit and HGO circuit respectively) are generally directed to the flotation plants. All three circuits can be directed to flotation, as necessary, and all three circuits can go “direct” to the autoclaves, as necessary. All three grinding circuits have a primary semi-autogenous grinding (SAG) mill, followed by a secondary ball mill in a closed circuit with classifying hydrocyclones. Pebbles from Lihir Operations Papua New Guinea Technical Report Summary Date: February 2026 Page 1-16 the HGO and HGO2 circuits are combined and directed to two cone pebble crushers. Crushed pebbles are directed back to the HGO circuit via the crushed ore stockpile. Two rougher flotation circuits are installed, nominally treating FGO and a portion of HGO milled ore. Both circuits use simple bulk rougher flotation in a single roughing stage. The older FGO flotation circuit consists of a bank of five 150 m3 flotation tank cells, the second, newer HGO circuit has five 300 m3 flotation tank cells. When downstream capacity allows, some limited additional gold recovery occurs through hydrocyclone separation of flotation tailings, thickening then pumping to the autoclave discharge tanks, effectively bypassing the autoclaves. Thickened ore slurry, which is a mixture of flotation concentrate and whole ore, is pumped to four parallel autoclave circuits via six slurry storage tanks. This buffer between the milling and autoclave circuits helps stabilize autoclave operations. Feed slurry can be first preheated in heat recovery vessels before being pumped under pressure to each of the eight chamber horizontal autoclave vessels. If sulfide sulfur grades are high enough, operation without pre-heating is often practiced. Three operating cryogenic oxygen plants provide oxygen to the autoclaves. Autoclave temperature is controlled via the addition of fresh water. Oxidized slurry (with some fine flotation tailings) passes through two parallel trains of two-stage counter-current decantation (CCD) circuits, where it is washed with process water and seawater, and neutralized with lime. Gold is recovered from the neutralized slurry by cyanide leaching using conventional CIL technology in a series of agitated tanks. Loaded carbon from the CIL circuit is stripped of gold in an elution system. The resulting gold solution is circulated through electro- winning cells where gold is recovered through electrowinning to form a gold sludge. The sludge is dried and then smelted to produce doré bars which are shipped to a refinery. The CIL leach residue tailings are detoxified by the formation of strong metal complexes such as ferrocyanide, and through dilution with seawater (oxygen plant cooling water return). The tailings gravitate to a common disposal system which also collects the flotation tailings, remaining CCD wash water, as well as oxygen plant and power plant cooling water, return streams. The tailings disposal method is by deep sea tailings placement. The combined stream flow discharges through a de-aeration tank to the ocean via a pipeline outfall at a depth of 115 m below sea level. The depth of the outfall discharge is below the surface mixing layer of the ocean. Being denser than the receiving seawater, the tailings gravitate down the steep submarine slope. The average power demand from the process plant is 114 MW, with a peak demand of 130 MW. This is met from heavy fuel oil (HFO) generators. The processing plant uses a combination of seawater, untreated fresh water, and various treated water streams. Key processing consumables are oxygen (generated on site), grinding media, lime, and cyanide. Other minor reagents are caustic and hydrochloric acid for gold recovery, collector and frother for flotation, and flocculent for thickening. The process plant has a personnel count of 2,530 including plant operations and maintenance, excluding shutdown labor. 1.15 Infrastructure Roads connect the mining operation with the village of Put Put, the accommodation center at Londolovit, and the airstrip at Kunaye. Haul roads run between the crushing facilities and ROM stockpiles, the barge-loading dock in Luise Harbor, and the low-grade stockpiles. A wharf was constructed at Put Put for general cargo ships and tankers. Lihir Operations Papua New Guinea Technical Report Summary Date: February 2026 Page 1-17 Mine facilities, including ROM stockpiles, crushing facilities, and mine support facilities, are located in the Ladolam Creek valley, immediately to the east of the ultimate pit boundary. An explosive magazine is located to the west of the ultimate pit boundary. The processing plant is on the northwestern side of Put Put Point on relatively flat land adjacent to the shoreline and on the gentler lower slopes of the eastern end of the Luise Caldera. Support buildings include a main office, laboratory, training building, warehouses, plant workshop, and an emergency and security services building. Facilities for handling and transport of the various fuels, reagents, and consumables required by the processing plant are located near the general ship berth and the processing plant. Port facilities are installed to service oil tankers, general cargo ships, passenger ferries, and work boats. Infrastructure for the workforce includes housing, camp accommodation, and related community facilities. Waste rock from the mine is either used for construction purposes or transported in barges for off-shore submarine disposal. Due to the heavy rainfall typically experienced on Aniolam Island, the lack of suitable area for a tailings storage facility, and the high seismicity of the region, deep sea tailings placement was selected as the preferred tailings placement method for the Lihir Operations. Power is currently produced at site by a combination of heavy fuel oil (HFO) reciprocating engines and geothermal steam turbines. The existing total mine site power demand averages around 115 MW and can peak as high as 130 MW when all equipment is at full capacity (peak usage). 1.16 Markets and Contracts The Lihir Operations consist of an operating mine with refining contracts in place. The Lihir Operations produce gold doré containing 91–97% gold, 2.2–8.24% silver and 0.5–3% base metals, which is securely transported from the mine to a refinery. Product valuation is based on a combination of metallurgical recovery, commodity pricing, and consideration of processing charges. Newmont uses a combination of historical and current contract pricing, contract negotiations, knowledge of its key markets from a long operations production record, short-term versus long- term price forecasts prepared by Newmont’s corporate internal marketing group, public documents, and analyst forecasts when considering long-term commodity price forecasts. Higher metal prices are used for the mineral resource estimates to ensure the mineral reserves are a sub-set of, and not constrained by, the mineral resources, in accordance with industry-accepted practice. The long-term commodity price and exchange rate forecasts are provided in Table 1-4. Table 1-4: Commodity Price and Exchange Rate Forecasts Commodity Units Mineral Reserves Mineral Resources Gold US$/oz 2,000 2,300 Exchange rate US dollar : PNG kina 1:4.00 1:4.00 Newmont’s doré is sold on the spot market, by marketing experts retained in-house by Newmont. The terms contained within the sales contracts are typical and consistent with standard industry practice and are similar to contracts for the supply of doré elsewhere in the world.


Lihir Operations Papua New Guinea Technical Report Summary Date: February 2026 Page 1-18 There are currently eight major contracts in place to support the Lihir Operations. These contracts cover items such as refining, security transport, data management and invoicing, mining contracts, sea freight, catering and accommodations support, air transport, and labor hire. Contracts are negotiated and renewed as needed. Contract terms are in line with industry norms, and typical of similar contracts in Papua New Guinea that Newmont is familiar with. 1.17 Environmental, Permitting and Social Considerations 1.17.1 Environmental Studies and Monitoring Baseline studies were completed in support of permitting and operations. A regulatory-approved Environmental Management and Monitoring Plan is used to manage and monitor the predicted environmental impacts associated with the Project. The Environmental Management and Monitoring Plan is updated every four years for review and endorsement by the PNG Conservation and Environment Protection Authority. In addition, an annual environmental report is prepared and submitted to the PNG Conservation and Environment Protection Authority as well as other national, provincial, and local level government bodies. Environmental management practices are guided by Newmont policies and standards. Acid and metalliferous drainage will be generated from medium-term storage of ore stockpiles prior to processing. This requires management of runoff and drainage to ensure discharges comply with the requirements of the site’s Environment Permits. Regular monitoring is undertaken of water quality for regulatory reporting. Newmont is currently conducting studies to assess appropriate means of managing acid and metalliferous drainage as the basis for an amendment to the Environment Permit for Waste Discharge. Waste rock from the mine is either transferred into 1,500 t capacity barges for off-shore submarine disposal within the boundaries of the Special Mining Lease, tipped at the harbor waste platform (HWP) location, or stockpiled for use as road base, bench sheeting, stemming, or construction fill. Submarine waste disposal is carefully planned and controlled to achieve a continuous rill along the steeply-sloping sea floor and minimize the potential for uncontrolled slumping. Tailings are disposed using deep sea tailings placement. Tailings are discharged from a pipeline that extends from the de-aeration tank through a directionally-drilled hole in the shoreline at Put Put Point to a discharge point beneath the productive euphotic (sunlight-penetrating) zone at a depth of approximately 115 m below the surface. Ongoing monitoring of deep sea tailings placement is conducted under a government-approved Environmental Management and Monitoring Plan. The nearshore soil barrier (NSB) project is required to enable access to the mineral reserves within the Kapit pit sector. The preferred construction method is a high strength reinforced concrete diaphragm wall, spanning 800 m, with a nominal depth of 30.5 m. The operations water demand is currently met by a combination of Londolovit raw water from the weir, caldera extraction via the Kapit Spring and seawater supplement. Fresh water from pit diversion can also be substituted into the plant supply. Prolonged drought conditions are a risk to continued plant operations due to the lack of water. Sea water substitution measures can be implemented in the plant under major drought conditions and can mitigate a portion, but not all, of the drought-related effects on production. Lihir Operations Papua New Guinea Technical Report Summary Date: February 2026 Page 1-19 1.17.2 Closure and Reclamation Considerations In compliance with regulatory requirements, Newcrest commissioned a conceptual mine closure plan in 1995, which was submitted to the PNG government, and which has been updated and refined in subsequent years. A detailed Mine Rehabilitation and Mine Closure Plan is required to be submitted to the regulator a minimum of five years prior to the cessation of operations. There are currently no known requirements to post performance or reclamation bonds. However, new closure policy documentation that is being drafted by the State may introduce bonding requirements. A bond of PGK111,000 was posted prior to the Lihir Operations commencing in 1997. The 2025 undiscounted life of asset (LOA) closure cost is US$0.7 B. 1.17.3 Permitting Newmont currently holds the key applicable permits required to support current operations. Permit renewals are applied for where required. Additional permits will be required as follows: • Nearshore soil barrier (NSB): currently approved with existing approvals but requires sign off by the Chief Inspector of Mines pursuant to the Mining (Safety) Act 1977. The construction of this barrier was previously approved as part of the 2005 Production Improvement Program Environmental Impact Statement; • In March 2023, Newcrest applied to PNG Conservation and Environment Protection Authority and the PNG Mineral Resources Authority for a new lease for mining purposes to host an extension of the existing marine waste rock disposal area. The extension will provide sufficient capacity to support mine waste disposal. Approval of the marine waste rock dump extension is assumed to be granted in early 2026; • Special Mining Lease extension: Special Mining Lease 6 expires March 16, 2035. Subject to outcomes of current study work, additional permits may be required as follows: • Changes to the acid and metalliferous drainage management strategy to manage acid and metalliferous drainage at the source, pathway, and receptor; • Investigation into alternatives for future waste rock disposal. The Lihir Operations are conducted in accordance with the development plans stipulated in the Mine Development Contract and the accompanying Approved Proposal for Development signed between the State and Lihir Gold in 1995. The Mine Development Contract and Approved Proposal for Development represent the principal agreement/contract between the State and Lihir Gold in accordance with that described in the Mining Act 1992 Part IV. The Mine Development Contract and Approved Proposal for Development provide details of the conditions and implementation of the Project’s approved environmental, financial, business, training/localization, land-owner agreements, and infrastructure plans. The operations have an approved Environmental Management and Monitoring Plan. The Environmental Management and Monitoring Plan lists the various monitoring requirements, which arose from the identification of key environmental issues documented in the Environmental Plan and subsequent Environmental Impact Statement documents. Lihir Operations Papua New Guinea Technical Report Summary Date: February 2026 Page 1-20 1.17.4 Social Considerations, Plans, Negotiations and Agreements There are a number of culturally significant sites within the mining area including Ailaya Rock on the edge of the operational pit. Lihirians believe Ailaya Rock to be the portal to the afterlife. There was a cave at the base of the Ailaya prior to disturbance in the 1990s where it was believed that spirits entered and then rose through it to the afterlife. The Ailaya Rock remains a site of deep cultural and religious significance to the majority of Lihirians and the image of the rock is a symbol of Lihirian identity. A 10-m buffer along the Ailaya boundary, following the old walking track, was established through consultations with the tenement landholders (landowners) and stakeholders. This buffer aims to prevent any disturbance to the Ailaya area and reflects the agreed commitment to respecting its boundaries. Separately, a 100-m environmental buffer exists. This buffer is unrelated to the 10- meter buffer and is implemented to meet specific environmental management requirements. The current suite of Customary Landholder Agreements was signed on December 21, 2020 after a review process with Lihir’s tenement landholders and relocation family groups that lasted several years. The full set of agreements were then registered by the PNG Registrar of Tenements on April 30, 2021 in fulfilment of a key requirement of the Mining Act 1992. These agreements have also been registered with the Conservation and Environment Protection Authority to fulfil the requirements of the Environment Act 2000. Newmont also has several local level community type agreements that are listed in the 2020 Lihir Memorandum of Understanding of Parked Issues and Agreements. These agreements have not been registered with the PNG Conservation and Environment Protection Authority and PNG Mineral Resources Authority yet, however, the PNG Mineral Resources Authority is taking lead to engage with the parties on these agreements. All agreements and obligations are registered in the Community, Health, Environment, Safety and Security (CHESS) system. Community Agreements are registered in both the CHESS Obligations register and the Community Agreements register. Environmental Permits, Agreements and Obligations are also registered using the same system. Specific policies, standards, and guidelines are referenced in each of the management plans. Newmont has established generally good working relationships with local communities and although occasional disputes do occur, they are relatively minor in nature. The last disputes that resulted in brief disruptions to operations occurred in 2014–2015. 1.18 Capital Cost Estimates Capital cost estimates are at a minimum at a pre-feasibility level of confidence, having an accuracy level of ±25% and a contingency range not exceeding 15%. As the Lihir Operations are a steady-state operation, sustaining capital costs largely consist of site infrastructure upkeep and mobile equipment replacement costs. An allowance for miscellaneous equipment, small projects, and other minor capital costs was included for mining, processing, and site general. The sustaining capital cost estimate is based current budget level costs, combined with recent average sustaining capital spend. The major project capital included in the mineral reserves is for the nearshore soil barrier. Lihir Operations Papua New Guinea Technical Report Summary Date: February 2026 Page 1-21 Sustaining and development capital costs total US$2.2 B over the anticipated LOM (Table 1-5). Table 1-5: Capital Cost Estimate Capital Description Unit Value Mining (sustaining) US$ billion 0.6 Processing (sustaining) US$ billion 0.7 General and administrative (sustaining) US$ billion 0.4 Development capital US$ billion 0.5 Total Capital US$ billion 2.2 Note: Numbers have been rounded. 1.19 Operating Cost Estimates Operating cost estimates are at a minimum at a pre-feasibility level of confidence, having an accuracy level of ±25% and a contingency range not exceeding 15%. The operating costs used in the financial model were derived from a variety of sources. The mining costs were derived from a purpose-built, activity-based cost model, while ore treatment and G&A costs were based on budgeted numbers adjusted for long-term consumable price forecasts. All operating costs are presented in US$ and reflect 2025 market terms. Inputs in currencies other than US$ were converted at exchange rates as per Newmont’s economic parameters. The projected LOM plan operating costs are summarized in Table 1-6 and Table 1-7, and are anticipated to total US$16.1 B. Table 1-6: Operating Cost Estimate Cost Area Units Value Mining cost US$ billion 4.8 Ore treatment US$ billion 8.2 G&A US$ billion 3.1 Site Costs US$ billion 16.1 Note: Numbers have been rounded.


Lihir Operations Papua New Guinea Technical Report Summary Date: February 2026 Page 1-22 Table 1-7: Operating Unit Cost Estimate Cost Area Units Value Mining cost US$/t ore milled 21.61 Ore treatment US$/t ore milled 37.37 G&A US$/t ore milled 14.03 Total Site Operating Costs US$/t ore milled 73.01 1.20 Economic Analysis 1.20.1 Economic Analysis The financial model that supports the mineral reserve declaration is a standalone model that calculates annual cash flows based on scheduled ore production, assumed processing recoveries, metal sale prices and US$:PNG Kina exchange rate, projected operating and capital costs and estimated taxes. The financial analysis is based on an after-tax discount rate of 10%. All costs and prices are in unescalated “real” dollars. The currency used to document the cash flow is US$. All costs are based on the 2026 budget (26BP). Revenue is calculated from the recoverable metals and long-term metal price and exchange rate forecasts. The Lihir Operations are subject to a corporate income tax rate of 30% on taxable income. The Project is also subject to a mineral royalty of 2% on net smelter returns and a production levy of 0.5% of assessable income. The economic analysis is based on 100% equity financing and is reported on a 100% project ownership basis. The economic analysis assumes constant prices with no inflationary adjustments. The NPV at a discount rate of 10% is US$2.0 B. As cash flows are based on existing operations where all costs are considered sunk to January 1, 2026, considerations of payback and internal rate of return are not applicable. Free cash flow is US$ 3.1 B. The active mining operation ceases in 2040 and processing ceases in 2043; however, closure costs are estimated to 2066. A summary of the financial results is provided in Table 1-8. The table presents the financial results on a 100% basis. Lihir Operations Papua New Guinea Technical Report Summary Date: February 2026 Page 1-23 Table 1-8: Cash Flow Summary Table Item Unit Value Metal price, gold US$/oz 2,000 Tonnage treated Mt 220.2 Gold grade g/t 2.26 Gold ounces, contained Moz 16.0 Capital costs US$ billion 2.2 Direct operating costs US$ billion 16.1 Exchange rate US dollar: PNG kina 1:4.00 Discount rate % 10 Free cash flow US$ billion 3.1 Net present value US$ billion 2.0 Note: Table 1-8 contains “forward-looking statements” within the meaning of Section 27A of the Securities Act of 1933, as amended, and Section 21E of the Securities Exchange Act of 1934, as amended, which are intended to be covered by the safe harbor created by such sections and other applicable laws. Please refer to the note regarding forward-looking information at the front of the Report. The cash flow is only intended to demonstrate the financial viability of the Project. Investors are cautioned that the above is based upon certain assumptions which may differ from Newmont’s long-term outlook or actual financial results, including, but not limited to commodity prices, escalation assumptions, and other technical inputs. For example, Table 1-8 uses the price assumptions stated in the table, including a gold commodity price assumption of US$2,000/oz, which varies significantly from current gold prices and the assumptions that Newmont uses for its long-term guidance. Please be reminded that significant variation of metal prices, costs and other key assumptions may require modifications to mine plans, models, and prospects. Numbers have been rounded. 1.20.2 Sensitivity Analysis The sensitivity of the Project to changes in grades, sustaining capital costs and operating cost assumptions was tested using a range of 25% above and below the base case values. The changes in metal prices are representative of changes in grade. The Project is most sensitive to changes in the gold price and grade, less sensitive to changes in operating costs, and least sensitive to capital cost changes (Figure 1-1). Lihir Operations Papua New Guinea Technical Report Summary Date: February 2026 Page 1-24 Figure 1-1: Sensitivity Analysis Note: Figure prepared by Newmont, 2026. FCF = free cash flow; Sens = sensitivity; OPEX = operating cost estimate; CAPEX = capital cost estimate. 1.21 Risks and Opportunities 1.21.1 Risks Risks that may affect the mineral resource and mineral reserve estimates are identified in Chapter 1.11.3 and Chapter 1.12.3 respectively. The Project is located in a seismically-active area, and is subject to risks associated with earthquakes and tsunamis. If such events were to occur, impacts would include effects on infrastructure, the open pit, mine plans and the capital and operating costs that support the mineral reserves and economic analysis. The mine is proximal to a corrosive marine environment, which can influence built infrastructure. The mine plan assumes asset integrity; however, unforeseen major corrosion could influence the infrastructure, mine plan and the capital and operating costs that support the mineral reserves and economic analysis. The economic outcome in this Report assumes that Special Mining Lease 6, Leases for Mining Purposes 34–40, and Mining Easements 71–73, which expire on March 16, 2035, can be renewed for the remaining post-2035 mine life. Lihir Operations Papua New Guinea Technical Report Summary Date: February 2026 Page 1-25 The current mine plan envisages that mining will be allowed adjacent to, and to the west of, Ailaya Rock. The mine plan assumes steep wall mining techniques, and geotechnical monitoring will be critical to ensure pit wall stability. There is a risk that the technical aspects could result in damage to Ailaya Rock, and result in a significant social issue. The outcome could affect the social license to operate and affect the mine plan and economic forecasts in this Report. The LOM plan assumes that mining is feasible at elevations significantly below sea level, once the seepage, nearshore soil (NSB) and off-shore barriers (OSB) are in place and operational. If these barriers are ineffective or permit seawater ingress, there is a likely effect on the mine plan and economic forecasts in this Report. There is a risk that ongoing work will result in confidence classification changes, such that some of the material now classified as higher-confidence categories will be reclassified to lower confidence categories that cannot support conversion to mineral reserves, or be of such low confidence that they cannot be classified as inferred mineral resources. Changes to modelling methods may also affect confidence classifications. This could affect the mineral resource and mineral reserve estimates, locally affect the mine plan, stockpiling and recovery assumptions, and may affect the economic outcomes as presented in the Report. There is a risk that insufficient understanding of the distribution of the advanced/argillic or lower competency material could result in effects on the materials handling assumptions and equipment. There is a risk that the mill and crushers will be unable to efficiently process significant quantities of these types of materials. The mine plan assumes that deep sea tailings placement can continue for the LOM, and that extensions to the area that is subject to deep sea tailings placement can be extended. There is a risk that if these assumptions are incorrect, there will be an effect on the mine plan and economic forecasts in this Report if the alternatives come at a higher operating or sustaining capital cost and/or reduced productivity. The LOM plan assumes that future cost reductions at the end of the LOM can be achieved to support processing of lower-grade material. The PNG government has announced that it is considering replacing the current PNG Income Tax Act with a new Income Tax Act with limited consultation undertaken to date. The latest draft legislation provides that the new Income Tax Act will come into force from January 1, 2026. It remains uncertain as to whether existing tax attributes for the Lihir Operations will be transitioned under the new law due to the lack of transitional provisions, key regulations, and other key ancillary pieces of legislation. This is a risk to the cash flow analysis that supports the mineral reserves, and the assumptions used when estimating mineral reserves. 1.21.2 Opportunities There is Project upside opportunity if the mineral resources exclusive of mineral reserves can be upgraded to mineral reserves with additional testwork and studies. Newmont through its “Full Potential” programs aims to identify and implement continuous improvements in cost reduction and productivity.


Lihir Operations Papua New Guinea Technical Report Summary Date: February 2026 Page 1-26 1.22 Conclusions Under the assumptions presented in this Report, the Lihir Operations have a positive cash flow, and mineral reserve estimates can be supported. 1.23 Recommendations As Lihir is an operating mine, the QP has no material recommendations to make. Lihir Operations Papua New Guinea Technical Report Summary Date: February 2026 Page 2-1 2.0 INTRODUCTION 2.1 Introduction This technical report summary (the Report) was prepared for Newmont Corporation (Newmont) on the Lihir Operations (Lihir Operations or the Project) located in Papua New Guinea (PNG). The location of the operations is shown in Figure 2-1. Figure 2-1: Project Location Plan Note: Figure from Blackwell (2010). The host island, Aniolam Island, is also known as Niolam Island and Lihir Island, and is the largest of five islands that make up the Lihir Island group (Mali, Mahur, Masehet, Sanambiet and Aniolam). The Lihir Project is 100% owned by Newmont’s wholly-owned subsidiary, Lihir Gold Limited (Lihir Gold). Lihir Operations Papua New Guinea Technical Report Summary Date: February 2026 Page 2-2 2.2 Terms of Reference 2.2.1 Report Purpose The Report was prepared to be attached as an exhibit to support mineral property disclosure, including mineral resource and mineral reserve estimates, for the Lihir Operations in Newmont’s Form 10-K for the year ending December 31, 2025. 2.2.2 Terms of Reference Mineral resources and mineral reserves are reported for the Lihir Project. Mineral resources and mineral reserves are also estimated for material in stockpiles. Mineral resources and mineral reserves are reported using the definitions in Regulation S–K 1300 (SK1300), under Item 1300. All measurement units used in this Report are metric unless otherwise noted, and currency is expressed in United States dollars (US$) as identified in the text. The PNG currency is the kina. Unless otherwise indicated, all financial values are reported in US$ including all operating costs, capital costs, cash flows, taxes, revenues, expenses, and overhead distributions. The Report uses US English. The Report refers to Newmont as the operator from November 2023 onward, to distinguish work conducted by Newmont after the acquisition from work completed by Newcrest prior to the acquisition. 2.3 Qualified Persons This Report was prepared by the following Newmont Qualified Person (QP): • Mr. Shaun Chanter, RM SME, Head Reserve Governance - Global, Newmont. Mr. Chanter is responsible for all Report chapters. 2.4 Site Visits and Scope of Personal Inspection Mr. Chanter visited the Lihir Operations from September 13 to September 14, 2025. During that visit he inspected the open pit operations, including viewing the steep wall mining in Phase 14A of the open pit, viewed the stockpiles, visited the core shed and inspected selected drill core, toured the mill facility, viewed the barge off-loading facility and waste platform, drove through the workshop and mine maintenance facility area. Mr. Chanter had meetings with onsite staff and management discussing aspects of mine plans and costs. 2.5 Report Date Information in this Report is current as at December 31, 2025. Lihir Operations Papua New Guinea Technical Report Summary Date: February 2026 Page 2-3 2.6 Information Sources and References The reports and documents listed in Chapter 24 and Chapter 25 of this Report were used to support Report preparation. 2.7 Previous Technical Report Summaries Newmont has previously filed a technical report summary on the Lihir Operations: • Doe, D., 2024: Lihir Operations, Papua New Guinea, Technical Report Summary: report current at 31 December, 2023.


Lihir Operations Papua New Guinea Technical Report Summary Date: February 2026 Page 3-1 3.0 PROPERTY DESCRIPTION 3.1 Introduction The Project is on Aniolam Island, which is part of the Lihir Group in the Province of New Ireland. The island is located approximately 900 km north–northeast of the national capital, Port Moresby. The Project is located at approximately 3º06’54” S latitude, 152º38’27” E longitude. 3.2 Property and Title in Papua New Guinea 3.2.1 Mineral Title Mineral rights are held by the State of PNG (State), and mining is regulated at the national level. A Special Mining Lease is issued by the Head of State acting on advice from the National Executive Council (Cabinet). Otherwise, mineral titles are issued by the Minister for Mining on recommendation from the Mining Advisory Council (MAC) subject to the Mining Act 1992. The types of licenses are summarized in Table 3-1. Table 3-1: Mineral Title in PNG Title Type Comment Exploration License (EL) Can be granted for a term not exceeding two years, and may be extended for periods not exceeding two years. Cannot exceed 750 sub-blocks in size; requirements as to contiguousness of sub-blocks at application. Alluvial Mining Lease (AML) An Alluvial Mining Lease may only be granted over land that is a riverbed and land that extends no further than 20 m from any riverbed. An Alluvial Mining Lease may be granted for a term not exceeding five years which may be extended for periods not exceeding five years. License cannot be more than 5 ha in area, and must have a rectangular or polygonal shape. Mining Lease (ML) Generally issued for small to medium-scale alluvial and hard rock mining operations. Can be granted for a term not exceeding 20 years, and may be extended for periods not exceeding 10 years. License cannot be more than 60 km2 in area, and must have a rectangular or polygonal shape. Special Mining Lease (SML) Generally issued to an Exploration License holder for large-scale mining operations. The Minister for Mining may also require the Exploration License holder to be a party to a Mining Development Contract with the government. A Special Mining Lease can be granted for a term not exceeding 40 years, which may be extended for periods not exceeding 20 years. Before grant of a Special Mining Lease, the Minister for Mining is required to convene a development forum to consider the views of the persons and authorities whom the Minister believes will be affected by the grant of the Special Mining Lease. Those represented at this forum will include the applicant for the Special Mining Lease; the landholders of the land that is the subject of the application for the Special Mining Lease and other tenements to which the applicant's proposals relate, the State, and the provincial government, if any, in whose province the land the subject of application for the special mining lease is situated. The Head of State, acting on advice from the National Executive Council, is the authority responsible for issuing a Special Mining Lease. Lease for Mining Purpose (LMP) May be granted in connection with mining operations. Covers aspects such as the construction of buildings and other improvements, and operating plant, machinery and equipment; installation of a treatment plant and the treatment of minerals therein; deposition Lihir Operations Papua New Guinea Technical Report Summary Date: February 2026 Page 3-2 Title Type Comment of tailings or waste; housing and other infrastructure required in connection with mining or treatment operations; transport facilities including roads, airstrips and ports; and any other purpose ancillary to mining or treatment operations or to any of the preceding purposes which may be approved by the Minister. The term of a Lease for Mining Purposes is identical to the term of the Special Mining Lease or Mining Lease in relation to which the Lease for Mining Purpose is granted; where there is no associated lease, a term not exceeding 20 years. The term of a Lease for Mining Purpose can be extended. A Lease for Mining Purpose cannot be more than 60 km2 in area, and must have a rectangular or polygonal shape. Mining Easement (ME) Can be granted in connection with mining, treatment or ancillary operations conducted by the applicant for the Mining Easement or some other person for the purpose of constructing and operating one or more of the following facilities: a road; an aerial ropeway; a power transmission line; a pipeline; a conveyor system; a bridge or tunnel; a waterway; any other facility ancillary to mining or treatment or ancillary operations in connection with any of the preceding purposes which may be approved by the Minister. The term of a Mining Easement is identical to the term of the tenement in relation to which the Mining Easement was granted. The area of land over which a Mining Easement may be granted is sufficient for the purpose or purposes for which it was granted and shall be in a rectangular or polygonal shape. The PNG Minerals Resources Authority has overall responsibility for the promotion, management, and regulation of the mining sector under the Mining Act 1992. 3.2.2 Surface Rights The holder of mineral tenure under the Mining Act 1992 is liable to pay compensation to the landholders for all loss or damage suffered or foreseen to be suffered by the landholders from the exploration or mining or ancillary operations (but not for grant of access, nor in respect of the value of any mineral, nor by reference to any rent, royalty, or other amount in respect of mining). 3.2.3 Government Mining Taxes, Levies or Royalties The holder of a Mining Lease must pay a royalty to the State that is equivalent to 2% of the net proceeds of sale of minerals (calculated as either a net smelter return (NSR) or free-on-board (FOB) export value, as appropriate). The State may elect to retain its right to royalty or to distribute it between the provincial government of a mine’s host province and the landholders of the land upon which the mineral resource is mined. Where the State agrees to distribute any royalties, the landholders are entitled to at least 20% of the total amount of royalties paid to the State. A production levy of 0.5% is payable to the PNG Mineral Resources Authority under the MRA Act 2018 on the gross value of production (i.e., excluding the offsets of treatment and refining charges, payable terms, and freight). 3.3 Ownership Newmont indirectly wholly-owns the Lihir Operations. Lihir Operations Papua New Guinea Technical Report Summary Date: February 2026 Page 3-3 3.4 Mineral Title The Project consists of a granted Special Mining Lease, two Mining Leases for which renewals are in process, one Exploration License for which a renewal is in process, five granted Leases for Mining Purposes, and three Mining Easements. The total area under license is approximately 236 km2. The Lihir deposit is located on Special Mining Lease 6. Special Mining Lease 6, Leases for Mining Purposes 34–40, and Mining Easements 71–73 expire on 16 March 2035. Exploration License 485 expired in March 2024 and an application for renewal is in process. Mining Lease 125 and Mining Lease 126 both expired on 20 July 2025 and applications for renewal are in process. Mineral tenure is summarized in Table 3-2, and shown in Figure 3-1. Table 3-2: Mineral Tenure Summary Table Lease Lease Type Lease Status Grant Date Expiry Date Area (km2) EL485 Exploration License Granted 19/06/1983 31/03/2024 renewal lodged 210.0 LMP34 Lease for Mining Purpose Granted 21/07/1995 16/03/2035 3.74 LMP35 Lease for Mining Purpose Granted 21/07/1995 16/03/2035 0.34 LMP38 Lease for Mining Purpose Granted 18/10/1997 16/03/2035 0.04 LMP39 Lease for Mining Purpose Granted 18/10/1997 16/03/2035 0.00 LMP40 Lease for Mining Purpose Granted 18/10/1997 16/03/2035 0.02 ME71 Mining Easement Granted 21/07/1995 16/03/2035 0.06 ME72 Mining Easement Granted 21/07/1995 16/03/2035 0.21 ME73 Mining Easement Granted 21/07/1995 16/03/2035 0.19 ML125 Mining Lease Granted 21/07/1995 20/07/2025 0.48 ML126 Mining Lease Granted 21/07/1995 20/07/2025 0.24 SML6 Special Mining Lease Granted 17/03/1995 16/03/2035 17.39 Total 235.72 Lihir Operations Papua New Guinea Technical Report Summary Date: February 2026 Page 3-4 Figure 3-1: Mineral Tenure Location Plan Note: Figure prepared by Newcrest, 2020.


Lihir Operations Papua New Guinea Technical Report Summary Date: February 2026 Page 3-5 Newmont must lodge annual and bi-annual reports on activities conducted on the mineral tenure. As at 31 December, 2025, all statutory reporting requirements had been met. 3.5 Surface Rights The Project area is situated on land held under customary, State, and private ownership, including under State lease. The bulk of the land that will be affected by Project operations and closure is customarily owned. Newmont has been granted rights to undertake mining and processing of gold and related activities, through negotiations with the state and local government, and landowners in the area. Newmont holds a Special Mining Lease which encompasses all of the area where mineral reserves are estimated. There are some areas of the lease where mineral resources are estimated and where agreements are not yet in place with local landowners or the community. Land within Special Mining Lease 6 is customarily owned and has been divided into blocks of varying sizes. Each block is owned by landowners belonging to one of the six main clan groups: the Tengawom Clan, Lamatlik Clan, Nikama Clan, Nissal Clan, Tinetalgo Clan and Unawos Clan. The landowners that claim ownership over the individual blocks are represented by a nominated clan Block Executive. The Special Mining Lease entitles Newmont to enter and occupy the land for the purpose of mining for which the Mining Lease was granted. 3.6 Water Rights An Environment Permit for Water Extraction is in place to support Project operations and water rights and usage are discussed in Chapter 17.9. 3.7 Royalties Newmont is entitled to 100% of the minerals produced from the mineral tenure subject to the payment of prescribed annual rents and royalties. A 2% royalty is payable to the State of PNG on the realized prices of all gold and silver doré produced. Under the Memorandum of Agreement (MoA), the State is responsible for direct distribution of all royalties derived from the Lihir Operations to Special Mining Lease 6 landowners (20%), Nimamar Local Level Government (30%) and the New Ireland Provincial Government (50%). A production levy of 0.5% is also payable on the gross value of production (i.e., excluding the offsets of treatment and refining charges, payable terms, and freight) to the PNG Mineral Resources Authority. 3.8 Encumbrances There are no known encumbrances. 3.9 Permitting Permitting and permitting conditions are discussed in Chapter 17.11 of this Report. The operations as envisaged in the life-of-mine (LOM) plan are either fully permitted, or the processes Lihir Operations Papua New Guinea Technical Report Summary Date: February 2026 Page 3-6 to obtain permits are well understood and similar permits were granted to the operations in the past. There are no current material violations or fines, as imposed in the mining regulatory context of the Mine Safety and Health Administration (MSHA) in the United States, that apply to the Lihir Operations. 3.10 Significant Factors and Risks That May Affect Access, Title or Work Programs To the extent known to the QP, there are no other significant factors and risks that may affect access, title, or the right or ability to perform work on the Project that are not discussed in this Report. Lihir Operations Papua New Guinea Technical Report Summary Date: February 2026 Page 4-1 4.0 ACCESSIBILITY, CLIMATE, LOCAL RESOURCES, INFRASTRUCTURE AND PHYSIOGRAPHY 4.1 Physiography The mine is located within the Luise Caldera of the Luise Volcano which is located on the east coast of the island. The caldera is an extinct volcanic crater that is geothermally active. It has a 6 x 4 km elliptical crater with steep walls reaching 600 m above sea level. The eastern, seaward, portion of the Luise Caldera has collapsed, sending debris flows 25–40 km eastward. The submerged slope forms Luise Harbor. Natural vegetation on the island is predominantly tropical rain forest. Subsistence-level agriculture is practiced, with typical crops including taro, coconuts, betelnut, and tobacco. Parts of the narrow coastal plain, particularly in the northern and eastern areas, have formed on coral platforms. This includes the regions around the process plant, Londolovit town site, and Kunaye Airport. The general mine area ranges in elevation from 0–200 masl. Mining is conducted at elevations below sea level. 4.2 Accessibility Most travel to and from the island is via aircraft. Access to Aniolam Island is through the Kunaye airport located about 7 km north of the Lihir Operations and approximately 3 km north of the Londolovit town site. Newmont employees are predominantly PNG nationals who are fly-in-fly- out (FIFO) of a number of different PNG communities or residents of Aniolam Island. The majority of senior management roles are residential based on Aniolam Island while most expatriate employees typically are FIFO from the hub of Cairns, in Australia. Daily travel to the mining operations from the Londolovit residential town site is by road. Sea passenger services operate to local islands. Marine facilities are established to service oil tankers, general cargo ships, passenger ferries, and work boats. Additional information on transportation required to support mining operations is provided in Chapter 15. 4.3 Climate Aniolam Island is located at latitude 3° south and does not experience distinct wet or dry seasons. The Lihir Operations experience high rainfall, averaging about 4.4 m per annum, with mean relative humidity of 80%. Periods of rainfall extremes often, but not always, correlate with the El Niño Southern Oscillation. Air temperatures at the Lihir Operations are relatively constant from month to month. Temperatures at the mine site range from 21–34°C while the sea temperature remains relatively constant at approximately 27–28°C throughout the year. Winds close to sea level are generally light and variable, ranging from 0.6–16.6 km/h, with monthly mean wind speeds of <5 knots. There are two wind seasons of variable duration. Between May and September/October, winds are mainly from the southeast and east and between December Lihir Operations Papua New Guinea Technical Report Summary Date: February 2026 Page 4-2 and March, winds are mainly from the north and west. November and April are transitional months. The Luise Caldera has a noticeable effect on wind flow. Mining activities are conducted year-round. Exploration activities may be curtailed by heavy rainfall. 4.4 Infrastructure Prior to the discovery of gold, the population of Aniolam Island was approximately 7,100. The economy was centered on subsistence agriculture and the population lived in many small villages around the island. A mine village was constructed at Londolovit to house mine staff, contractors and families who are not year-round Aniolam Island residents, as the local area is unable to supply the workforce required by the mining operations. The Mining Leases are accessed by sealed road from Londolovit, which is approximately 4 km north of the mine. The Lihir Operations currently either have all infrastructure in place to support mining and processing activities (see also discussions in Chapter 13, Chapter 14, and Chapter 15 of this Report), or the requirements for the LOM are well understood. These Report chapters also discuss water sources, electricity, personnel, and supplies. 4.5 Seismicity Papua New Guinea extends across several major tectonic plate boundaries and is one of the most seismically active regions in the world. Aniolam Island is located in the West Melanesian Arc seismic source zone where earthquakes of up to magnitude eight have been recorded. Most earthquakes in the region result from strike-slip movement but some occur along steeply-dipping reverse faults resulting in a strong vertical motion component and have potential to generate local tsunamis. Both tsunami and earthquake risks were assessed and incorporated into the Project design criteria. Volcanic activity on Aniolam Island is limited to remnant hydrothermal venting in the Luise Caldera in the form of hot springs and fumaroles. Steam and gas (including H2S) naturally discharge within the pit area and along the Kapit beach and near shore region. The hydrothermal reservoir temperatures can reach 100°C at the water table and exceed 200°C at depth. Isolated geothermal activity in the form of hot springs is evident elsewhere on the island, such as within the southern Kinami caldera.


Lihir Operations Papua New Guinea Technical Report Summary Date: February 2026 Page 5-1 5.0 HISTORY A summary of the exploration in the Project area is provided Table 5-1. Table 5-1: Exploration and Development History Summary Table Year Company/Operator Work Program 1969– 1974 PNG Bureau of Mineral Resources and the Geological Survey of PNG Regional exploration. Stream-sediment sampled for porphyry copper-style mineralization, identified areas of hydrothermal alteration and mineralization. 1982 Kennecott Explorations Australia (Kennecott) and Niugini Mining Limited (Niugini) Discovered gold in rock chip samples taken in Luise Harbor. Exploration License applied for and granted. Lihir Management Company was the operator of the Kennecott and Niugini joint venture (JV). 1983– 1984 Kennecott and Niugini Commenced drilling, identified Lienetz zone. Completed semi- detailed mapping, stream sediment and soil samples, rock chips, hand augers, and hand-cut trenches and benches. 1985– 1987 Kennecott and Niugini Drilling and bulldozer trenching identified the Minifie zone in 1986. Further exploration defined several other adjacent and partly overlapping zones during 1987, referred to as the Camp and Kapit areas. Ground magnetic survey in 1985 within Luise Caldera. Airborne aeromagnetic/radiometric survey in 1987. 1988 Kennecott Completed feasibility study; economics not positive. Airborne aeromagnetic/radiometric survey coverage extended island-wide. 1988 Rio Tinto Zinc Corporation (Rio Tinto) Rio Tinto acquired Kennecott from BP Minerals America and took over as the joint venture partner with Niugini. 1990– 1991 Rio Tinto Ground magnetic surveys at Minifie and within Luise Caldera; Time- domain induced polarization (IP) survey at Minifie and within Luise Caldera. Controlled-source audio-frequency magneto-telluric (CSAMT) survey in 1991 1992 Rio Tinto and Niugini Updated feasibility study 1995 Rio Tinto and Niugini Special mining lease granted. Lihir Gold was incorporated for the purpose of acquiring formal ownership of the Project. Lihir Gold listed on Australian Securities Exchange (ASX). 1997 Rio Tinto and Niugini First gold pour 2004 Rio Tinto and Niugini Magneto-telluric (MT) ground geophysical survey 2005 Rio Tinto Divests interests in Lihir Gold. 2005 Lihir Gold Lihir Gold becomes sole mine owner and operator. 2007 Lihir Gold Construction of 20 MW geothermal power plant. MT geophysical survey extended. Commissioning of flotation plant allowing throughput increase to 7 Mt/a capacity; expansion of geothermal power plant to 50 MW capacity. 2008 Lihir Gold Million ounce plant upgrade (MOPU) project commenced 2010– 2023 Newcrest Acquires Lihir Gold in 2010. Completes power station installations and upgrades, throughput upgrades. Lihir Operations Papua New Guinea Technical Report Summary Date: February 2026 Page 5-2 Year Company/Operator Work Program Undertakes geophysical surveys, mapping, soil and rock chip sampling, exploration drilling. Mining studies optimizing pit, stockpiles and waste rock storage and disposal; process studies, optimizing plant design and equipment. 2023 Newmont Acquires Newcrest in November, 2023 Early studies on the Project separated the mineralization into four zones or “orebodies”. The early descriptions are summarized in Table 5-2, and the zone locations are provided in Figure 5-1. Table 5-2: Deposit Zone Descriptions Zone Note Minifie Located in the southern portion of the Luise caldera. Occupied an area of approximately 700 x 400 m and between +50 and -250 masl. Mushroom shape. Shallow-level refractory sulfide ore was associated with pervasive adularia–sulfide alteration, and had a concave, blanket-like geometry. Underlying the refractory sulfide mineralization was quartz–calcite vein stockwork material. Lienetz Located north of Minifie. The two zones were separated by unmineralized, propylitically-altered igneous units and breccias. Lienetz occupied an area of approximately 600 x 300 m and between +140m and -350 masl. Kapit Located between Lienetz and Luise Harbor; approximately 500 m due north of the western limit of Lienetz. Kapit is linked to Lienetz by a sub-horizontal zone of low-grade mineralization (generally <2.0 g/t Au) that reaches 100 m in thickness. Funnel-shaped zone associated with adularia–pyrite alteration and open-space breccias. Coastal Northwesterly-trending, moderately to steeply dipping to the northeast. Mineralization hosted within leached, vuggy breccias as well as more discrete calcite–quartz–pyrite–anhydrite vein/breccias. Remains poorly drilled due to its proximity to Luise Harbor and to the apparent relatively small and narrow nature of the mineralized zones Lihir Operations Papua New Guinea Technical Report Summary Date: February 2026 Page 5-3 Figure 5-1: Zone Locations Note: Figure from Rutter et al., (2008). Lihir Operations Papua New Guinea Technical Report Summary Date: February 2026 Page 5-4 Each zone was interpreted to be localized along north-dipping structural trends separated by about 100–200 m of unmineralized to low-grade (<1.0 g/t Au) altered rocks. This nomenclature has been discontinued with the adoption of an alteration domain model for the Project (refer to discussions on the alteration model in Chapter 6 and Chapter 10). Some research studies refer to the Lihir deposit as the Ladolam deposit; however, for the purposes of this Report, the deposit is referred to as the Lihir deposit. Exploration activities have included geological mapping, geochemical sampling, geophysical surveys, trenching, auger, reverse circulation (RC) and core drilling, hydrogeology, petrology, and mineralogy studies, metallurgical testwork, and mining studies. A feasibility study was completed in 1988, based on open pit mining methods, and updated in 1992. The Special Mining Lease for the Project was granted in 1995, and the first gold pour occurred in 1997. Mining commenced with the development of the Minifie pit sector using a conventional truck and shovel operation. Mining of the Lienetz pit sector commenced in 2004, and mining has continued in both areas from a number of subsequent cutbacks. An internal mining study was conducted in 2016 to evaluate optimization of the mine plan, including mining of the Kapit sector. The life-of-mine (LOM) strategy considered alternative material selection, mine sequencing and process scheduling options, and appropriate mining methods and civil engineering options to potentially improve project economics. The study reviewed the use of a near-shore cut-off wall (seepage barrier) in place of a coffer dam.


Lihir Operations Papua New Guinea Technical Report Summary Date: February 2026 Page 6-1 6.0 GEOLOGICAL SETTING, MINERALIZATION, AND DEPOSIT 6.1 Deposit Type The Lihir deposit is considered to be an example of an epithermal gold deposit. General characteristics of such deposits are provided in Table 6-1, after Corbett (2002). Table 6-1: Deposit Model Features Item Note Global examples Cripple Creek (Colorado, USA), Emperor (Fiji), and Porgera (Papua New Guinea) Setting Areas of thickened continental crust or in island arc environments Host features Calderas, diatremes, hypabyssal intrusive stocks, and volcanic sector-collapse amphitheaters Host rocks Oxidized alkaline igneous rocks to carbonaceous and sulfide-rich sedimentary rocks Textures Quartz and quartz-adularia veins, vein stockworks, disseminated zones and breccias Mineralization characteristics Telluride-rich gold veins associated with quartz, carbonates, adularia, barite–celestite, fluorite (felsic rocks) and roscoelite (mafic rocks) Frequently refractory Alteration characteristics Neutral pH and K-silicate minerals such as adularia, illite, and muscovite. Near-surface zones of advanced argillic alteration (kaolinite–dickite–alunite–quartz) were identified at the Lihir deposit and the Emperor gold mine in Fiji Sulfide associations Pyrite-dominant. Typically, base metal-poor, only containing traces of sphalerite, chalcopyrite, tetrahedrite and molybdenite, and typically containing more Au than Ag Mineralizing fluids Temperature <300°C and are low salinity (less than 10 wt% NaCl eq.) with moderate to high CO₂ concentrations. Fluids must be relatively oxidized, based on the presence of sulfates (anhydrite, barite), hematite, and/or magnetite Isotopes Some stable isotopes (δC, δS, δD and δO) suggest a high magmatic component but some δD values suggest a wider range of sources including groundwater and/or seawater 6.2 Regional Geology Aniolam Island is part of a 250-km long, northwest-trending, alkalic volcanic island chain consisting of the Tabar, Lihir, Tanga and Feni Groups. The island chain sits within an area where several micro-plates (Solomon Sea Plate, South Bismarck Plate and North Bismarck Plate) developed between the converging Australian and South Pacific plates (Figure 6-1). Lihir Operations Papua New Guinea Technical Report Summary Date: February 2026 Page 6-2 Figure 6-1: Regional Tectonic Elements Note: Figure from Blackwell, 2010 The island chain is located in the ~100 km wide, 250 km long, Eocene to Recent New Ireland Basin, which is parallel to, and east of, New Ireland, and consists of a 5 km thick sediment pile. Each island group is localized along submarine ridges that rise from depths of 2,000 m below sea level, are spaced ~75 km apart and are oriented perpendicular to New Ireland. The islands primarily consist of Pliocene to Pleistocene lavas and volcaniclastic deposits fringed by Quaternary limestone. Lihir Operations Papua New Guinea Technical Report Summary Date: February 2026 Page 6-3 6.3 Local Geology The Project geology is summarized from Ageneau (2012), Blackwell (2010), Carman (1994), Davies and Ballantyne (1987), and Sykora (2016). Aniolam Island comprises five volcanic blocks surrounded by limestone (Figure 6-2; Figure 6-3); based on geomorphology, the five volcanic blocks are: • Two Plio–Pleistocene volcanic blocks, Londolovit Block and Wurtol Wedge; • Three Pleistocene volcanic edifices, Huniho, Kinami, and Luise. A 10–100 m thick limestone unit overlies and onlaps volcanic units and dips shallowly to the south. Compositions of the Aniolam Island rocks range from tephrite, basalt, trachybasalt, basaltic trachyandesite, trachyandesite, phonolite tephrite to tephritic phonolite. The volcaniclastic facies on Aniolam Island are dominated by polymictic volcanic breccia; pyroclastic facies are minor. A 10 m thick ash sequence may have been sourced from the Luise volcano. Lavas and hypabyssal rocks are predominantly clinopyroxene- and feldspar-phyric and have a fine- to medium-grained feldspar-dominated groundmass. Plutonic rocks are equigranular to porphyritic, medium-grained monzodiorites. Pyroclastic rocks consist of lapilli and ash tuffs, as well as phreatic and phreatomagmatic breccias. Areas of hydrothermal alteration occur in each of the volcanic centers and locally appear as vegetation anomalies and/or as demagnetized zones. Modern geothermal activity is interpreted to be the waning stages of the ore-forming Luise hydrothermal system and is expressed as structurally-controlled hot mud pools, solfataras, hot springs of neutral chloride and acid sulfate waters, and low-temperature fumaroles. Lihir Operations Papua New Guinea Technical Report Summary Date: February 2026 Page 6-4 Figure 6-2: Volcanic Blocks Comprising Aniolam Island Note: Figure from Sykora (2016). As indicated by grid markers, map north is to top of figure.


Lihir Operations Papua New Guinea Technical Report Summary Date: February 2026 Page 6-5 Figure 6-3: Volcanic Blocks Showing Fringing Limestone Note: Figure from Blackwell (2010). Lihir Operations Papua New Guinea Technical Report Summary Date: February 2026 Page 6-6 6.4 Deposit Geology 6.4.1 Overview The local and deposit geology is summarized from Ageneau (2012), Blackwell (2010), Carman (1994), Davies and Ballantyne (1987), and Sykora (2016). The Luise volcano consists of a 4 by 3.5 km wide amphitheater, elongated and breached to the northeast. This is inferred to be a remnant of the original approximately 1.1 km high volcanic cone that underwent sector collapse(s). The Lihir deposit is located in the footwall of the sector collapse detachment surface. Gold mineralization at the Lihir deposit is a complex and refractory assemblage associated mainly with pyrite and marcasite veinlets, disseminations, replacements, and breccia fillings. The sector collapse event(s) superimposed late-stage, gold-rich, alkalic low-sulfidation epithermal mineralization upon early-stage, porphyry-style alteration. A broad, three-fold vertical alteration zonation is interpreted to represent this evolution. With increasing depth, the alteration zones consist of: • 0.2–Ma, surficial, generally barren, steam-heated clay alteration zone that is a product of modern high-temperature geothermal activity; • 0.6–0.2 Ma, high-grade (> 3 g/t Au), refractory sulfide and adularia alteration zone that represents the ancient epithermal environment; • 0.9–0.3 Ma, comparatively low-grade (< 1 g/t Au) zone rich in anhydrite ± carbonate, coupled with biotite alteration, that represents the ancient porphyry-style environment. Post sector collapse volcanism occurred during the modern geothermal-stage, with the emplacement of several diatreme breccia bodies. Texturally-destructive hydrothermal alteration and mineralization often obscures texture and composition in volcanic and volcaniclastic rocks where these units are cut by multiple diatremes and subvolcanic intrusions. 6.4.2 Lithologies Figure 6-4 is a stratigraphic column through the Luise amphitheater area. Abundant volcaniclastic debris flows (i.e., polymictic, matrix-rich breccias and sandstones) were deposited throughout the succession. The depositional environment may have been sub-aerial, or at least proximal to sub-aerial, as indicated by the presence of accretionary lapilli. Sedimentation was interspersed with the emplacement of dikes, sills and autoclastic facies associated with andesitic and basaltic lavas and/or shallow intrusions. Minor mudstone intercalations may represent sub-aqueous depositional periods. Lava, tuff and volcanic breccias are common in the upper parts of the deposit, and on the deposit margins. Breccias tend to dominate over lavas to the north. Primary pyroclastic rocks consist of agglomerate, pyroclastic breccia, lapilli tuff and tuff. Primary epiclastic facies include breccia, conglomerate, and sandstone. Lihir Operations Papua New Guinea Technical Report Summary Date: February 2026 Page 6-7 The polymictic matrix-rich breccias and sandstone are massive to weakly bedded. The mudstones are laminated to massive, and interbedded with, or transitional to, mud-rich breccias. Andesites and basalts are generally tabular, sub-horizontal bodies that variably grade outwards to monomictic breccias. The basalts are volumetrically dominant over the andesites, and are particularly abundant in the upper portions of the strata, where they occur commonly as sub- horizontal lava flows and sills, and less commonly as sub-vertical dikes. Where in contact with mudstone, the margins of some andesite and basalt lavas are peperitic. Clasts of basalt, andesite, as well as rare mudstone, occur within the polymictic breccias. Multiple intrusive phases are recognized, ranging from coarse equigranular monzonites to porphyritic varieties, and thin, fine-grained dikes. These intrusions cross-cut the volcano– sedimentary strata. The largest and oldest intrusions are monzonite ± microdiorite stocks. Cross- cutting the stocks are a series of <20 m wide sub-vertical porphyritic to aphanitic dikes of syenitic composition that reach higher levels in the strata. A series of matrix-rich, polymictic breccia bodies, interpreted to have formed by phreatomagmatic eruptions, form at least seven large north- to northeast-trending, coalescing, downward-tapering, elliptical pipes. The breccia bodies are both spatially and genetically linked to small (about 10 m wide) sub-vertical andesite dikes. Clasts contained within a fine-grained, rock-flour matrix include charcoal, internally stratified or juvenile volcanic components, as well as anhydrite-, pyrite– kaolinite–dickite- and pyrite-altered clasts. The diatreme breccias rarely contain mineralized clasts but locally have complex relationships with mineralization. Lihir Operations Papua New Guinea Technical Report Summary Date: February 2026 Page 6-8 Figure 6-4: Stratigraphic Column, Luise Area Note: Figure from Sykora (2016).


Lihir Operations Papua New Guinea Technical Report Summary Date: February 2026 Page 6-9 6.4.3 Structure Several structural trends appear important in localizing and confining individual breccia units as well as gold mineralization. The predominant regional orientation of dikes and faults on Aniolam Island are north–northeast-trending (~025°), which is interpreted to be associated with deep- seated tensional faults, and which may have controlled the long axis of the Luise volcanic edifice. Other strong structural trends occurring within the Luise Caldera include: • East–northeast-trending structures dipping moderately (60°) to the north; • Arcuate generally east–west-trending, north-dipping, listric-shaped structures believed to be associated with the collapse of the volcanic edifice; • Sub-vertical northwest-trending structures; • Steeply eastward-dipping north–south-trending structures. East–northeast- and northeast-trending structures are most common, and coincide with aligned offshore islands, aeromagnetic features and elongation of inferred volcanoes and intrusions. The most prominent faults on Aniolam Island are normal faults striking 040° to 050° and dipping 40° to 50° to the northwest. North-, northwest- and west–northwest-trending structures are defined by magnetic lineaments and truncations. 6.4.4 Alteration Intense alteration was intimately associated with ore-forming events. Early-stage potassic alteration occurred as porphyry-style alteration associated with the emplacement of alkalic stocks within the volcanic edifice, with peripheral and broadly contemporaneous propylitic alteration. Sudden collapse of the volcanic edifice is interpreted to have resulted in the rapid depressurizing of the system and subsequent telescoping of epithermal alteration and associated gold mineralization upon the porphyry environment. Argillic and advanced argillic alteration assemblages developed through continued geothermal activity, driven by post mineralization magmatism. Geothermal activity continues to this day. Three alteration styles are recognized: • Clay zone: equates to argillic ± advanced argillic alteration, about 250 m thick, and subparallel to basal topography of amphitheater; represents the modern geothermal system; • Sulfide–adularia zone: equates to epithermal-style low sulfidation alteration; sub-parallel to basal topography of amphitheater with crenulated local downward projecting base, defined by pyrite-cemented breccias, abundant adularia alteration and disseminated pyrite in altered wall rocks, the lower parts of the sulfide–adularia zone transitions gradationally into the biotite- and K-feldspar-altered rocks of the anhydrite zone. The upper parts are typically more adularia ± illite-altered; • Anhydrite zone: equates to porphyry-style potassic alteration; vertically and horizontally extensive basal alteration unit; lateral and lower limits not demarcated, defined by the presence of >1% anhydrite ± calcite ± quartz occurring as veins, breccia cement, and/or intergranular disseminations within wall rocks, it is atypical of calc–alkalic porphyries in terms of lacking well-developed quartz stockwork veining. Lihir Operations Papua New Guinea Technical Report Summary Date: February 2026 Page 6-10 The three alteration zones overprint each other at their basal contacts, and reflect distinct stages in the evolution of the magmatic–hydrothermal system. The intense alteration from the early porphyry-style, late epithermal, and modern high- temperature geothermal system has obscured many of the primary rock types, and extends vertically and laterally beyond the mineralized zones, with poorly-constrained limits. 6.4.5 Mineralization The Lihir deposit has dimensions of about 1,500 x 3,000 m and has about 500 m in depth extent. A long section through the Lihir deposit is included as Figure 6-5. The deposit remains open at depth, along strike, and to the east, where it is currently limited by the Pacific Ocean. Mineralization consists of a number of styles, ranging from early porphyry to late-stage epithermal mineralization. Two of these gold mineralization styles represent economically significant phases. The most important mineralization style is refractory potassium feldspar–sulfide mineralization. In this association, gold occurs as solid solution gold in the crystal structure of sulfide grains. Overall sulfide content is relatively high, with the average sulfide grade of the mineral reserves being above 6%. The main sulfide mineral is pyrite, with accessory marcasite and rare arsenopyrite and chalcopyrite. Gold also occurs as small (less than 100 µm) blebs within fine pyrite crystals. The sulfides are characterized by their fine-grained nature, and were deposited through wholesale flooding and deposition within all host rocks, imparting a sooty, dark-grey coloring to the host rocks. Mineralization is locally associated with strong leaching of the original lithologies, creating pinhole to open, vuggy textures. Cavities as large as 10 m in extent were encountered. This secondary porosity is thought to be the result of dissolution of host rock by hot alkaline fluids, or alternatively as the result of boiling. Gold locally occurs as electrum, gold tellurides, and native gold associated with quartz, calcite, and bladed anhydrite. The second significant style of gold mineralization occurs as a quartz–chlorite–bladed anhydrite association which is more typical of porphyry-style mineralization. This mineralization likely resulted from mixing of magmatic fluids with oxidizing near-surface water. Native gold several millimeters in size has been observed, although it is rare. Lihir Operations Papua New Guinea Technical Report Summary Date: February 2026 Page 6-11 Figure 6-5: Long Sections, Lihir Deposit Note: Figure prepared by Newmont, 2026. Lihir Operations Papua New Guinea Technical Report Summary Date: February 2026 Page 6-12 6.4.6 Oxidation/Weathering Oxidation locally extends to depths of 70 m but is negligible at the mine scale. Oxide has not been used in any resource model domaining, including density. 6.4.7 Alteration Model The alteration model is based on a combination of logging, chemical (multi-element analysis results) and mineralogical (Corescan hyperspectral data) information. An example section through the model is provided in Figure 6-6. Three vertical partitions or alteration groups, namely argillic, epithermal and porphyry, were identified which reflect the different alteration environments that have cumulatively resulted in deposit formation. Nine separate alteration domains were defined (Table 6-2). Table 6-2: Alteration Domains Alteration ‘Group’ Alteration (sub) Domain Distinctive Property (reason for lateral subdivision) Argillic Advanced Argillic (AA) More likely to contain ore grade material than other ‘argillic’ sub-groups. Harder more competent near Ailaya rock but very soft when associated with structures near Kapit. Unit may impact comminution. Upper Argillic (UA) Typically waste. Contains ‘weak’ and ‘swelling’ clay minerals which are likely to impact pit wall stability. Argillic Clay (AC) Clay-bearing material, variable competency. Likely to impact processing (particularly flotation and materials handling) if ‘ore’ grade material mined. Epithermal Upper Epithermal (UE) Strongly altered and mineralized material. All calcium-bearing minerals (carbonate and anhydrite) leached. Higher proportion of ‘micro-crystalline pyrite’ which is likely to reduce flotation Au recovery Silica Breccia (SB) Strongly altered and mineralized material. High silica content results in lower crushing throughput. Lower Epithermal (LE) Less ‘epithermally’ altered material, with some remnant calcium-bearing minerals present. Porphyry Inner Biotite (IB) High temperature core (most intense) area of initial porphyry alteration environment. Anhydrite and biotite dominant. Highest prevalence of dissolution cavities/voids (particularly in upper regions) and permeability. Higher likelihood of non-pyrite Au-bearing minerals Outer Biotite (OB) Typically lower grade than IB. Moderate temperature porphyry alteration environment. Distal Chlorite (DC) Un-mineralized, least altered rock.


Lihir Operations Papua New Guinea Technical Report Summary Date: February 2026 Page 6-13 Figure 6-6: Alteration Model Note: Figure prepared by Newmont, 2024. Lihir Operations Papua New Guinea Technical Report Summary Date: February 2026 Page 7-1 7.0 EXPLORATION 7.1 Exploration 7.1.1 Grids and Surveys All models and drill holes are reported using the Lihir Mine Grid. This grid was established early in the Project history and is based on the Australian Geodetic Datum 1966 (AGD66). This was the principal datum for mapping and survey control in Australia (with a readjustment in some states in 1984) and Papua New Guinea until about 2000. UTM Grid coordinates in AGD66 are referred to as Australian Map Grid 1966 (AMG66) coordinates, with the Lihir deposit lying in Zone 56. 450,000 meters are added to the Lihir Mine Grid eastings to obtain AMG66 Zone 56 eastings and 9,650,000 meters are added to the Lihir Mine Grid northings to obtain AMG66 northings. The Papua New Guinea Geodetic Datum 1994 (PNG94) is the gazetted geodetic datum for Papua New Guinea and is the primary reference system for all cadastral surveys (including customary land surveys), airport surveys, and new resource sector surveys (commencing after 2000) in Papua New Guinea. UTM Grid coordinates in PNG94 are referred to as Papua New Guinea Map Grid 1994 (PNGMG94), with the Lihir deposit lying in Zone 56. Site surveyors have established a set of geodetic datum transformations to support inter-grid conversions. The topographic surface used to constrain the mineral resource and mineral reserve estimates is from a light detection and ranging (LiDAR) survey conducted in 2004. 7.1.2 Geological Mapping As part of early-stage exploration activities, Kennecott conducted ridge-and-spur reconnaissance mapping. The Target B (Kinami prospect) area was mapped by Kennecott at 1:20,000 scale. The 2018 mapping program at Target (B) Kinami conducted by Newcrest was at 1:10,000 scale. Some in-pit mapping has been conducted as part of the research studies listed in Chapter 7.1.8. No regular pit mapping program is in place. 7.1.3 Geochemistry Geochemical sampling was initially performed by Kennecott, who completed an island-wide grassroots reconnaissance program. Soil, rock chip, and stream sediment samples were collected. These samples identified a number of areas of gold anomalism and alteration zones that could be indicative of epithermal-style mineralization. As the work focus quickly shifted to the delineation of the Lihir deposit, the majority of these areas have had limited to no follow up. Newcrest undertook a regional re-assessment of the exploration prospectivity of the island, and commenced limited exploration activities. As part of this program, 427 soil samples were collected during 2018–2019 over the Target B (Kinami) prospect. Sampling covered an area of 4.4 km2, with samples spaced at 100 x 100 m. Infill sampling covered 1.8 km2 at a 50 x 50 m spacing. Creek mapping and sampling were conducted after the soil grid sampling was completed. Nearly all creek drainage within the Kinami caldera were traversed, mapped, and sampled where Lihir Operations Papua New Guinea Technical Report Summary Date: February 2026 Page 7-2 alteration and mineralization were noted. A total of 10.6 km was traversed and a total of 326 samples were collected. Sampling was done mostly as rock chips in the form of 2 m channels in alteration and mineralized zones and selective or single grabs in less altered/mineralized zones. Results are considered to warrant drill testing. 7.1.4 Geophysics The locations of the completed geophysical surveys are provided in Figure 7-1. Figure 7-1: Geophysical Survey Location Plan Note: Figure prepared by Newcrest, 2020. Figure backdrop is the island-wide reduced-to-pole magnetic image. Surveys conducted within the Luise Caldera area include IP, ground magnetics, controlled-source audio-frequency magneto-tellurics and magneto- tellurics. Lihir Operations Papua New Guinea Technical Report Summary Date: February 2026 Page 7-3 7.1.5 Airborne Surveys A heliborne combined aeromagnetic/radiometric survey was flown by Geo Instruments Pty Ltd (Geo Instruments) in 1987, with coverage restricted to the Luise Caldera area and a small area to the north. The sensor was at a 60 m terrain clearance, with flight lines-oriented north–south on 100 m line spacings. In 1988, the survey was extended island wide. Lines were oriented north–south on 150 m line spacings, with a nominal 60 m terrain clearance. Due to levelling problems with the dataset, the survey information was not considered usable with the software available then. World Geoscience Corporation re-leveled the data using new micro-leveling regimes in 1991, which produced usable images. Data interpretation showed a significant magnetic low co-incident with the Minifie pit sector. 7.1.6 Ground Surveys Ground magnetic surveys were conducted in 1985 and 1990–1991. The 1985 orientation survey was within the Luise Caldera area, with readings taken at approximate 50 m spacings along variably-oriented lines following roads, tracks, ridges, spurs, and the coastline. The survey prompted the 1987 airborne survey to be flown. The 1990 survey concentrated on the Minifie area, with 43.7 line-km of data collected on 10 m station spacing. The survey was extended in 1991 to cover much of the remaining Luise Caldera floor, using 100 m spaced lines and readings at 25 m intervals along the lines. The survey was used to determine if the mineralization or alteration had a usable geophysical signature for exploration vectoring and targeting purposes. During 1990, a time-domain induced polarization (IP) survey was undertaken, with the aim of better delineating structures that could potentially localize areas of higher grade. An initial 13 km of data was collected using a northwest–southeast oriented gradient-array survey with lines spaced 50 m apart. A total of 3.3 line km of pole–dipole survey was conducted using the same line orientations, but at 150 m spacing. These surveys were extended in 1991 to cover a total of 43.7 line km of gradient-array and 6.8 km of pole-dipole surveys, corresponding to most of the caldera floor. The surveys identified a resistivity and chargeability boundary along the southern edge of the Minifie pit sector. The Luise Caldera area was subject to a controlled-source audio-frequency magneto-telluric (CSAMT) survey in 1991. The survey covered 12.25 line-km, using a 25 m station spacing and 400 m line spacing. The Minifie and Lienetz pit sector areas showed resistivity highs; and a similar boundary along the southern edge of the Minifie pit sector as identified in the IP data. A 62-station magneto-telluric (MT) survey was conducted in 2004, in an attempt to define the area that had geothermal potential. An additional 57 stations were included in a 2007 survey. The 2007 survey and associated modelling results resulted in an expansion of the inferred geothermal resource to the west and north to that indicated by the 2004 survey. In addition, the 2007 geophysical survey results indicate that areas of warm spring activity evident elsewhere across Aniolam Island are not directly related to a high-temperature geothermal resource, and therefore have no geothermal power-generating potential.


Lihir Operations Papua New Guinea Technical Report Summary Date: February 2026 Page 7-4 7.1.7 Marine and Near-Shore Surveys During 2012, an offshore shallow seismic reflection survey was conducted by Asian Geos Pty Ltd. in support of coffer dam designs, with the following aims: • Determine accurate water depths within the survey site; • Establish seafloor morphology through the survey area including checking for relevant seabed features related to obstructions; • Evaluate sub-bottom (shallow) geological conditions, including the presence of paleo- channels, evidence of anomalous structures (such as shallow faults); • Assess intermediate geological conditions, including the presence of paleo-channels, amplitude anomalies, anomalous structures (such as faults). In January 2017, a trial of a range of geophysical techniques was completed by GBG Australia Pty. Ltd. in and around the inner harbor to investigate the sub-surface materials to better understand the nature of the geology to assist with geotechnical engineering design of the planned seepage barrier to be constructed between Luise Harbor and the open pit crest. Marine hydrographical investigations included side-scan sonar, seismic reflection profiling, and seismic refraction Microtremor methods. Land-based surveys consisted of MASW (a seismic surface wave method for geotechnical applications), resistivity profiling and Tromino (passive seismic) readings. Interpretations of the surveys provided a provisional understanding of the inner harbor geological and geophysical setting, including evidence of a paleochannel and the extent of debris associated with the Kapit landslide. A detailed geophysical survey was undertaken in January 2018 by Marine & Earth Sciences to assist with the site characterization. Work completed included: • Two continuous marine seismic refraction (CSMR) survey lines, oriented approximately north–south within the inner harbor; • Two multi-channel marine seismic reflection survey along the same lines as the CSMR; • Three MASW lines. During April–May 2018, the geophysical survey was expanded to include additional five seismic refraction survey lines which were correlated to borehole data and a bathymetric survey of the inner harbor reflection surveys and three MASW lines. Survey data from the two programs will be subject to interpretation, and used in support of the seepage barrier designs. 7.1.8 Petrology, Mineralogy, and Research Studies Newmont’s predecessor companies encouraged research on the Lihir deposit. A number of public papers on aspects of geology, mining and processing were presented by predecessor company staff, and by consultants working on the Project. The following theses were completed: • Ageneau, M., 2012: Geology of the Kapit Ore Zone and Comparative Geochemistry with Minifie and Lienetz Ore Zones, Ladolam Gold Deposit, Lihir Island, Papua New Guinea: unpublished PhD thesis, University of Tasmania, 269 p.; Lihir Operations Papua New Guinea Technical Report Summary Date: February 2026 Page 7-5 • Blackwell, J.L., 2010: Characteristics and Origins of Breccias in a Volcanic-hosted Alkalic Epithermal Gold Deposit, Ladolam, Lihir Island, Papua New Guinea: unpublished PhD thesis, University of Tasmania, Australia, 203 p.; • Carman, G.D., 1994: Genesis of the Ladolam Gold Deposit, Lihir Island, Papua New Guinea: unpublished PhD thesis, Monash University, Australia, 381 p.; • Cater, G., 2002: Deep Hydrothermal Alteration at the Ladolam Epithermal Gold Deposit, Lihir Island, Papua New Guinea: unpublished MSc thesis, University of Auckland, New Zealand, 94 p.; • Lawlis, E., 2020: Geology and Geochemistry of the Kapit NE Prospect, Lihir Gold Deposit, Papua New Guinea: unpublished PhD thesis, University of Tasmania, Australia.; • Sykora, S., 2016: Origin, Evolution and Significance of Anhydrite-Bearing Vein Arrays and Breccias, Lienetz Orebody, Lihir Gold Deposit, Papua New Guinea: unpublished PhD thesis, University of Tasmania, Australia. Age date and fluid inclusions studies were conducted. 7.1.9 Qualified Person’s Interpretation of the Exploration Information The exploration programs completed to date are appropriate to the style of the Lihir deposit. Lihir Operations Papua New Guinea Technical Report Summary Date: February 2026 Page 7-6 7.1.10 Exploration Potential A desktop review of historical exploration information was undertaken in 2016, which defined the prospective grassroots areas summarized in Table 7-1. Prospect locations are shown in Figure 7-2. Table 7-1: Prospective Areas Prospect Note Prospect A (Upper Londolovit) Potential porphyry target; consists of elevated copper and molybdenum values in rock chip samples with subordinate gold anomalism; elevated molybdenum values in stream sediment sampling, and an overall manganese-zinc depletion anomaly. Co-incident radiometric anomaly and visible surface clay alteration Prospect B (Kinami) Potential epithermal target; consists of anomalous gold and arsenic values in rock chip sampling. Co-incident large outcropping argillic alteration zone Prospect C (Wurtol River) Potential epithermal and porphyry target; consists of anomalous gold, copper, and silver values in rock chip sampling; associated with elevated potassium, tellurium, antimony, and arsenic assays. Anomalous gold, silver, and tellurium values in stream sediment sampling. Co-incident visible argillic and phyllic alteration. Warm springs in vicinity. Visible gold noted in adjacent drainages; soil sampling observed rare veins Prospect D (East Lakakot) Potential porphyry target; consists of low-order copper–molybdenum anomalism in stream sediments; elevated copper, molybdenum, zinc, and manganese assays in soil sampling. Co-incident radiometric anomaly and visible surface clay alteration Prospect E (Huniho) Potential epithermal target; consists of low-order gold–copper anomalism in stream sediment samples; arsenic–antimony anomaly evident from soil sampling. Some evidence of silica alteration associated with northeast-trending structures; weak fracture-controlled argillic alteration Prospect F (Illkot) Potential epithermal target; consists of anomalous gold values in soils and elevated gold and silver values in rock chip samples. Associated with argillic alteration. Surface channel sampling encountered significantly anomalous gold values in association with banded quartz veins that display elevated arsenic, silver, tellurium, and antimony grades. Lihir Operations Papua New Guinea Technical Report Summary Date: February 2026 Page 7-7 Figure 7-2: Prospect Location Plan Note: Figure prepared by Newcrest, 2020.


Lihir Operations Papua New Guinea Technical Report Summary Date: February 2026 Page 7-8 7.2 Drilling 7.2.1 Overview 7.2.1.1 Drilling on Property Drilling completed to December 31, 2025 comprises primarily RC drilling for short-term planning and core drilling. Drilling was completed for exploration, resource delineation, metallurgical, geotechnical, pit cooling, and geothermal purposes, and totals 23,919 drill holes (1,249,059 m). A total of 2,295 drill holes (449,287 m) is used in mineral resource estimation. Table 7-2 summarizes the drilling to 31 December, 2025, by operator; Table 7-3 provides the drill hole totals by purpose, on a Project-wide basis, and Table 7-4 summarizes the drilling used in mineral resource estimation. Drill hole collars are shown in Figure 7-3 for the Project as a whole and in Figure 7-4 for the drill holes supporting the mineral resource estimate. Table 7-2: Drill Summary Table by Operator Company Number of Drill Holes Meters Drilled (m) Kennecott 532 93,514 Lihir Gold 354 90,307 Lihir Gold/Rio Tinto 919 234,846 Newcrest 15,626 614,420 Newmont 2,457 135,517 Unknown 4,031 80,454 Totals 23,919 1,249,059 Note: Unknown = no company name recorded in the current database. Meterage may not sum as totals were rounded to the nearest meter. Lihir Operations Papua New Guinea Technical Report Summary Date: February 2026 Page 7-9 Table 7-3: Drill Summary Table by Drill Purpose Purpose Number of Drill Holes Meters Drilled (m) Exploration 23 4,383 Geotechnical 1,445 144,554 Geothermal 381 58,950 Pit cooling 48 20,347 Resource/mine 1,659 430,487 Metallurgy 11 4,506 Short term ore control 5,495 264,270 Stockpile ore control 14,144 286,736 Unknown 713 34,825 Totals 23,919 1,249,059 Note: Unknown = no purpose recorded in the current database. Meterage may not sum as totals were rounded to the nearest meter. Table 7-4: Drilling Used in Mineral Resource Estimation Company Drill Purpose Number of Drill Holes Meters Drilled (m) Kennecott Geothermal 1 750 Resource/mine 409 83,815 Lihir Gold Geotechnical 1 125 Geothermal 2 800 Resource/mine 165 49,220 Lihir Gold/Rio Tinto Geotechnical 1 1,044 Resource/mine 787 211,730 Newcrest Geotechnical 12 2,411 Geothermal 3 1,150 Resource/mine 176 55,709 Unknown Resource/mine 737 42,532 Totals 2,295 449,287 Note: Meterage may not sum as totals were rounded to the nearest meter. Lihir Operations Papua New Guinea Technical Report Summary Date: February 2026 Page 7-10 Figure 7-3: Project Drill Collar Location Plan Note: Figure prepared by Newmont, 2025 Lihir Operations Papua New Guinea Technical Report Summary Date: February 2026 Page 7-11 Figure 7-4: Drill Collar Locations Supporting Mineral Resource Estimate. Note: Figure prepared by Newcrest, 2025.


Lihir Operations Papua New Guinea Technical Report Summary Date: February 2026 Page 7-12 7.2.1.2 Drilling Excluded For Estimation Purposes The majority of the core holes support mineral resource and mineral reserve estimates. Some old shallow RC drill holes from the Kennecott era are included in estimation; however, these drill holes are located within the mined-out area of the original surface of the Lienetz zone. Drilling not used in estimation support includes Newmont and Newcrest RC drilling, sonic drilling (see Chapter 8.1.4), and blast hole drilling. 7.2.1.3 Drilling Since Database Close-out Date The database close-out date for the mineral resource estimate was October 15, 2024. An additional 1,203 drill holes for 65,105m (Table 7-5) of drilling was completed since the last database closeout to 31 December 2025, principally including short term ore control holes, but also including geotechnical, resource definition, stockpile ore control, and geothermal holes. Of these, a total of 34 new diamond drill holes aimed at improving resource confidence will be included in the next resource update. Resource delineation diamond drilling programs aimed at improving resource confidence were conducted in the Kapit, Kapit Northeast, and Minifie. Drill collar locations for the completed drill holes are shown in Figure 7-5. Table 7-5: Drilling Since Database Close-Out Date Purpose Number of Drill Holes Meters Drilled (m) Geotechnical 47 5,169 Geothermal 1 200 Resource/mine 34 8,256 Short term ore control 1,117 51,306 Stockpile Ore Control 4 174 Totals 1,203 65,105 Note: Drilling from October 15, 2024 until December 31, 2025. Meterage may not sum as totals were rounded to the nearest meter. Lihir Operations Papua New Guinea Technical Report Summary Date: February 2026 Page 7-13 Figure 7-5: Collar Locations, Drilling Completed Since Database Close-Out Date. Note: Figure prepared by Newmont, 2025 Lihir Operations Papua New Guinea Technical Report Summary Date: February 2026 Page 7-14 These drill programs were still in progress at the Report date. Although the newer drilling within the resource modelling area is likely to locally change the grade estimates, overall, the new drilling should have a minimal effect on the average grade of the model. 7.2.2 Drill Methods Core sizes drilled included PQ (84.8 mm core diameter), HQ (63.5 mm core diameter), and NQ (47.6 mm core diameter). Triple tube methods are routinely used for resource definition geotechnical drilling. RC drilling was formerly conducted on low-grade stockpiles for the purpose of constructing run- of-mine (ROM) stockpiles; however, this practice was discontinued during 2023. RC drilling is also completed to support medium-term geology and planning models. The drill pattern is a 20 x 20 m grid with drill hole depths to 48 m. 7.2.3 Logging All data collection and sampling are conducted on site at the Lihir Operations core processing facility, which includes logging sheds, core cutting, and storage areas. Geological logging is performed using acQuire software to record observations made on core and percussion chips into touch screen and laptop computers. The data are then transferred into various database systems depending on desired end use of the data. The drill core logging system consists of seven log sheets (windows) into which data are entered, including: • Collar; • Lithology; • Discontinuities; • Point load tests; • Geotechnical; • Bulk density; • Magnetic susceptibility. 7.2.4 Recovery There are only minor zones of lost core or poor core recovery, which are usually restricted to broken or faulted ground and areas of high clay contents in the upper sections of the deposit. Core recovery is generally excellent with core recoveries around 99%. Historical comparison of core data with blast hole data suggests no appreciable bias related to core recovery. Lihir Operations Papua New Guinea Technical Report Summary Date: February 2026 Page 7-15 7.2.5 Collar Surveys Drill collar locations were surveyed using either theodolite or differential global positioning system (DGPS) instruments. Current drill collars are surveyed using the Lihir Mine grid. Mine surveyors either locate, or lay out design locations for drill collars using DGPS instruments. 7.2.6 Down Hole Surveys A variety of methods were used to measure down-hole deviation (dip and azimuth), including Eastman and electronic single-shot instruments; the majority of readings were performed using the Eastman camera. Gyroscopic survey methods are typically used for geotechnical drill holes. Depending on the drill hole purpose, not all drill holes may be down-hole surveyed. Survey station spacing generally ranges from 30–50 m down-hole intervals, depending on the age of the drill hole and the survey instrument used. However, in some drill holes there can be several hundreds of meters between survey depths. 7.2.7 Grade Control Grade control drilling is carried out at 5 x 6 m spacing, with hole depths of 12–14 m. Holes are completed using Sandvik D55, Atlas Copco PV271 or Atlas Copco D65 blast hole drill rigs. A separate grade control database is maintained at the mine site. 7.2.8 Comment on Material Results and Interpretation The geological model is based on alteration domains. These domains are essentially horizontally layered, with clay-altered argillic materials at the surface, and relic porphyry alteration at depth. A horizon of epithermal-style mineralization exists between these two alteration domains, as epithermal fluids have flooded laterally through porous and fractured host rock. Drilling is typically near-vertical. This drill orientation is acceptable for the majority of the mineralization orientation, and results in drilled widths that approximate true widths. An example drill section showing the relationship of the drilling to the mineralization was provided in Figure 6-5. Drill spacing is variable, as there are limited drill platform sites available due to the rugged topography. Drilling can vary from 40–100 m spacing, depending on the available drill platform locations. Drilling and surveying were conducted in accordance with industry-standard practices at the time the drilling was performed and provide suitable coverage of the zones of gold–silver mineralization. Collar and down hole survey methods used generally provide reliable sample locations. Drilling methods provide good core recovery. Logging procedures provide consistency in descriptions. These data are considered to be suitable for mineral resource and mineral reserve estimation. There are no drilling or core recovery factors in the drilling that supports the estimates that are known to the QP that could materially impact the accuracy and reliability of the results.


Lihir Operations Papua New Guinea Technical Report Summary Date: February 2026 Page 7-16 7.3 Hydrogeology 7.3.1 Overview The Lihir deposit is located within a geothermally active zone. The hydrogeology environment can comprise of both liquid water and steam due to the high temperatures. Hydrogeology data are collected where deemed necessary to provide additional information and to verify pore pressure conditions in the vicinity of open pits. 7.3.2 Sampling Methods and Laboratory Determinations Pore pressure and temperature data is collected via instrumentation comprising of vibrating wire piezometers installed within drill holes at varying depths below ground surface along the perimeter of the pit and within the pit. 7.3.3 Comment on Results Pore pressures, temperatures, and ground water levels are constantly monitored by using a series of grouted multiple vibrating wire piezometer bores. Site personnel routinely collect data, analyze time-series data on daily, weekly, and monthly reports to support slope design. As required, corporate subject matter experts and/or third-party consultants undertake specialized hydrogeological/geotechnical evaluations. 7.3.4 Groundwater Models A numerical groundwater flow model (FEFLOW) was developed by third-party consultants for localized areas of liquid water assessment. Numerical geothermal models have been developed by third party consultants to predict the pore pressure and temperature with mining development. 7.3.5 Water Balance A water balance (Goldsim) model was developed for the site water balance. 7.3.6 Comment on Results To the Report date, the hydrogeological data collection programs have provided data suitable for use in the mining operations, and have supported the assumptions used in the active pit. 7.4 Geotechnical 7.4.1 Overview Geotechnical data are collected to provide additional information and to verify ground conditions in the vicinity of the open pits and terrestrial dumps. Core drilling methods are used to collect soil and or rock core. Materials encountered are logged, sampled, laboratory tested where required. Lihir Operations Papua New Guinea Technical Report Summary Date: February 2026 Page 7-17 In addition to information gathered during core drilling, geological structures are mapped and documented continuously as mining progresses in the open pits. This is aided through use of geo-referenced photogrammetry and high-definition point cloud scanning that is used to create digital references of structural modelling. 7.4.2 Sampling Methods and Laboratory Determinations Laboratory testing includes a variety of tests used to derive engineering characteristics of soils and rock materials. Material testing for strength and material characterization include the following: • Triaxial; • Unconfined compressive strength; • Direct shear strength; • Tensile strength; • Soil strength testing; • Soil material classification. Newmont uses National Associate of Testing Authorities-accredited laboratories to ensure adequate quality and integrity of testing procedures and results. A central database of material logs is maintained to enable orderly access to information. 7.4.3 Comment on Results The geological and geotechnical setting of the Lihir operations for both soils and hard rock is well understood and displays consistency in the various operating areas on the site. Additional testing continues to confirm the consistency of material strength properties. As required, corporate subject matter experts and/or third-party consultants undertake specialized hydrogeological/geotechnical evaluations. Lihir Operations Papua New Guinea Technical Report Summary Date: February 2026 Page 8-1 8.0 SAMPLE PREPARATION, ANALYSES, AND SECURITY 8.1 Sampling Methods 8.1.1 Geochemical Sampling No information on early Kennecott geochemical sampling is available. Soil sampling completed by Newcrest in 2018–2019 used a manual auger drill to sample the C- horizon. 8.1.2 Core Sampling After core logging, the current procedure is to draw a cut-line on the core and photograph the core. Intact and competent drill core is cut in half along the cut-line using a diamond saw. Where the core is too soft to be cut with a diamond saw, a knife is used to cut the core in the core tray. Where the core is too broken or brittle to be cut by the saw, the fragments are manually sampled. The nominal sampling interval is 2 m; however, sampling intervals may vary. In particular, samples taken for metallurgical purposes may be significantly longer than the nominal sample interval. The left-hand half of the core is placed in a calico bag marked with the appropriate sample number and sent to the laboratory for sample preparation and assaying. 8.1.3 RC Sampling Historical RC holes were drilled to 36 m depth with one sample collected every 6 m rod for a 100 mm diameter hole. No sample recovery records are collected for RC drilling. Prior to 2019 the primary RC samples were collected after a straight flush through a cyclone and cone splitter. The sample was transferred by plastic tubs to a multi-deck riffle splitter for the collection of a 3 kg sample split. Post 2021, when RC drilling recommenced, these drill holes are primarily 48–96 m long. Currently, samples are taken at 3 m intervals to provide a 3 kg split from a cyclone cone splitter. Sample splits are weighed and recorded with duplicate splits taken every 20 m. Previously samples were taken at 2 m intervals. A second composite sample of 6m is taken in addition to the primary for spectral scanning and testing in a hardness index tester (HIT) as part of the geometallurgy program. 8.1.4 Sonic Sampling Sonic drill campaigns were completed for metallurgical and geotechnical purposes, and are not used to support mineral resource estimates. Sonic drill holes completed for geotechnical purposes were selectively sampled to provide samples for unconfined compressive strength, point load, and other geotechnical tests. Lihir Operations Papua New Guinea Technical Report Summary Date: February 2026 Page 8-2 Sonic drill holes completed for metallurgical purposes were sampled at interval lengths ranging from 6–15 m, length to align with compositional variation as determined via Corescan. 8.1.5 Ore Control (Blast Hole) Sampling Blast hole sampling is conducted in the open pits on the cone of material produced when drilling an open hole percussion hole, approximately 229 mm diameter to a depth of 14 m. This generates approximately 1.2 t of mixed clay and gravel. During the earlier mining programs, sampling was carried out with a push tube (pipe spear) manually inserted into the blast cone at 5–8 locations and deposited in a calico bag for an approximate 2.5–3 kg sample. From 2012, the sample tube was replaced with an electric auger. Sample weights remained unchanged. Agoratek International completed a review of the sampling that confirmed similar precision in both sampling styles. 8.2 Sample Security Methods Sample security at the Lihir Operations has not historically been monitored. Sample collection from drill point to laboratory relies upon the fact that samples are either always attended to, or stored in the locked on-site preparation facility, or stored in a secure area prior to laboratory shipment. Chain-of-custody procedures consist of sample submittal forms to be sent to the laboratory with sample shipments to ensure that all samples are received by the laboratory. Ore control samples submitted to the site laboratory are retained as 300 g pulps for a period of three months and then discarded. Drill core samples are retained as half core and 300 g sample pulps at the exploration core shed. This incorporates an undercover pallet storage area as well as numerous sea containers. Some of the containers are freezer units for selective samples required for metallurgical testing. 8.3 Density Determinations The physical density determination was undertaken on solid pieces of core, typically, 10 cm in length. Intervals for density determination are selected according to lithology or alteration/mineralization type (as defined by the geologist). The measurements are performed on site as part of the logging process by geological assistants. Measurements are generally taken at 50 m intervals down hole, or more frequently if required. Density is determined by calculating the volume after measuring the diameter and length of the core with a Vernier caliper then weighing the selected interval on a balance. The density is then calculated by the following formula; • Density = weight/(π * (diameter/2)2 * length). There is a total of 11,868 determinations available for resource estimation. Density gravity values range from 3.94 t/m3 in fresh rock to 1.01 t/m3 in altered and oxidized material.


Lihir Operations Papua New Guinea Technical Report Summary Date: February 2026 Page 8-3 8.4 Analytical and Test Laboratories A number of third-party, independent analytical and sample preparation laboratories were used prior to 1997, including Pilbara Laboratories (subsequently underwent name change to Analabs, later Genalysis), SGS, and ALS Chemex. There is no accreditation data available in the Project database for these laboratories at the time of use. The original onsite laboratory was constructed in 1997, and was the primary preparation and analytical laboratory to 2025. A new onsite laboratory was constructed in 2025 and will again be the primary laboratory. The original laboratory held no accreditations. There are plans to have the new laboratory ISO17025 certified in 2026. The original onsite laboratory was operated by Lihir Gold until 2010 and then by Newcrest to 2023. Newmont has been the operator since 2023. Standard and Reference Laboratories, located in Perth, Western Australia, was used as a check laboratory during 2012. The laboratory was independent, and accredited to ISO9001 at the time of use. Standard and Reference Laboratories became part of the Inspectorate group, now Bureau Veritas. From 2010, samples were sent to SGS Lae, SGS Townsville, ALS Chemex Brisbane or the Newcrest (now Newmont) Services Laboratory in Orange (NSLO) for check or additional analysis. Any of these laboratories could be used for primary analysis for selected samples. There is no accreditation data available in the Project database for SGS Lae, or SGS Townsville. Both laboratories were independent at the time. ALS Chemex Brisbane and the NSLO hold ISO17025 accreditations. ALS Chemex Brisbane is an independent laboratory. The NSLO was not independent of Newcrest and is not independent of Newmont. Half-core HQ samples are currently sent to Intertek laboratory in Lae (Papua New Guinea) for sample preparation, and pulp samples flown to Intertek Townsville (Australia) for multi-element geochemistry, LECO, and fire-assay analysis. Intertek Lae and Intertek Townsville were independent of Newcrest and are independent of Newmont. The laboratories hold ISO17025 accreditation for selected analytical techniques. Umpire sample checks are completed at the NSLO. Gold and sulfide sulfur assays on ore control and plant samples are currently performed at the onsite mine laboratory. Samples can be sent to the NSLO; however, this is primarily done for metallurgical samples and samples requiring multi-element analyses. 8.5 Sample Preparation 8.5.1 Legacy Sample preparation procedures for the majority of the legacy data are not recorded in the Project database. Standard and Reference Laboratories used a wet screen sizings at 75 µm, and this was reported as the percentage passing 75 µm. No other information is available. Preparation methodologies for the legacy data are not recorded in the Project database. Lihir Operations Papua New Guinea Technical Report Summary Date: February 2026 Page 8-4 8.5.2 Current The current procedure at the onsite laboratory for ore control samples is: • Samples are dried in an oven at 105°C; • Each 3 kg sample is pulverized using a Labtechnics LM5 pulverizing mill to specified grind parameters of 95% passing 106 µm; • A 150 g sub-sample is collected for analysis and submitted to the assay laboratory. A similar preparation protocol is used at the NSLO. 8.6 Analysis Where known, analytical methods and detection limits are provided in Table 8-1. Table 8-1: Assay Techniques and Detection Limits Laboratory Method Element ALS Chemex ME-ICP41 Hg (1 ppm); K (0.01%); La (10 ppm); Mg (0.01%); Mn (5 ppm); Mo (1 ppm); Na (0.01%); Ni (1 ppm); P (10 ppm); Pb (2 ppm); S (0.01%); Sb (2 ppm); Sc (1 ppm); Th (20 ppm); Ti (0.01%); Tl (10 ppm); U (10 ppm); W (10 ppm); Zn (2 ppm) Onsite laboratory (Lihir Gold) AU25 Au (0.02, 0.1 ppm) * Cu (0.1 ppm) * S (0.01%) Onsite laboratory (Newcrest/Newmont) AU25 Au (0.01 ppm) LECO C (0.01%) * Cu (0.01%) LECO S (0.01%) Intertek Townsville ME48; 4AD; ICP-MS Ag (0.05, 0.1 ppm); Al (0.005 %); As (0.2 ppm); Ba (0.1 ppm); Be (0.05); Bi (0.01 ppm); Cd (0.02); Cs (0.05 ppm); Ga (0.1 ppm); Ge (0.1 ppm); Hf (0.05 ppm); In (0.01 ppm); Li (0.1 ppm); Mo (0.1 ppm); Nb (0.05 ppm); Ni (0.5 ppm); P (0.005%); Pb (0.5 ppm); Rb (0.05 ppm); Re (0.02 ppm); Sb (0.05 ppm); Sc (0.1 ppm); Se (0.5 ppm); Sn (0.1 ppm); Sr (0.05, ppm); Ta (0.01, 1 ppm); Te (0.2 ppm); Th (0.01 ppm); Tl (0.02 ppm); U (0.01 ppm); V (0.01 ppm); W (0.1 ppm); Y (0.05 ppm); Zr (0.1 ppm) FA50 Au (0.01 ppm) LECO C (0.01%, 0.02%; S (0.01%, 0.2%) NSLO MEAD4MS Ag (0.05, 0.1 ppm); As (1 ppm); Ba (0.05, 0.1 ppm); Be (0.1, 0.2 ppm); Bi (0.005, 0.05 ppm); Cd (0.02, 0.05 ppm); Cs (0.005, 0.1 ppm); Ga (0.02, 0.2 ppm); Ge (0.05, 0.2 ppm); Hf (0.01, 0.1 ppm); In (0.005, 0.05 ppm); Li (0.02, 0.1 ppm); Mo (0.02, 0.1 ppm); Nb (0.01, 0.1 ppm); Rb (0.02, 0.1 ppm); Re (0.005, 0.5 ppm); Sb (0.05, 0.1 ppm); Sc (0.05, 0.1 ppm); Se (0.1, 2 ppm); Sn (0.1 ppm); Sr (0.05, 0.5 ppm); Ta (0.01, 1 ppm); Te (0.01, 0.1 ppm); Th (0.005, 0.5 ppm); Tl (0.01, 0.02 ppm); U (0.005. 0.05 ppm); Y (0.01, 0.1 ppm); Zr (0.05, 0.5 ppm) Lihir Operations Papua New Guinea Technical Report Summary Date: February 2026 Page 8-5 Laboratory Method Element MEAD4OES Ag (0.2 ppm); Al (0.01%, 50, 100 ppm); As (2 ppm); Ba (0.5 ppm); Ca (0.01%, 50, 100 ppm); Cd (0.2 ppm); Ce (2 ppm); Co (0.5, 3 ppm); Cr (1, 2 ppm); Cu (2, 3 ppm); Fe (0.01%, 100 ppm); Hf (0.5 ppm); K (0.01%, 40, 100 ppm); La (1 ppm); Mg (0.01%, 20, 100 ppm); Mn (0.5, 1 ppm); Na (0.01%, 50, 100 ppm); Ni (1, 2, 5 ppm); P (5, 10 ppm); Pb (2, 10, 15 ppm); S (0.01%, 50, 100 ppm); Sc (0.2, 5 ppm); Sr (10 ppm); Ta (1 ppm); Ti (0.01%, 50, 100 ppm); V (2, 5 ppm); W (1, 3, 5 ppm); WO3 (0.005%); Y (0.2 ppm); Zn (0., 1, 2 ppm); Zr (0.1 ppm) CUAD5AAS AsCu (10 ppm) FA301 Au (0.01 ppm) LECO C (0.01%, 0.02%; S (0.01%, 0.2%) AAS3A Cu (0.01%) ICP3AO Cu (0.01 ppm) CuCN CuCN (5 ppm) XRFOR1 Fe (0.01%), S (0.01%); SO4 (0.01%, 0.2%) Standard and Reference Laboratories * Ag (1 ppm); As (20 ppm); Ba (1 ppm); Sb (1 ppm) Note: * method not recorded in database. 8.6.1 Legacy Analytical methodologies for the majority of the legacy data are not recorded in the Project database. Information recorded typically consists only of the element and detection limit. Standard and Reference Laboratories used method code FA9 for gold analysis, whereby a gold– silver prill was dissolved in aqua regia and determined instrumentally via AAS. 8.6.2 Current Core samples are analyzed on a 50 g aliquot using a fire assay with an ICP-OES finish for gold, four-acid multi-element analysis via ICP-MS, and sulfur speciation via a LECO instrument using a proprietary technique. Blast hole, RC, and process samples are routinely analyzed for gold, copper, and sulfide sulfur. The onsite laboratory uses a 25 g aliquot that is fire assayed with an AAS finish for gold. Sulfur is assayed via a LECO instrument, using a proprietary LMC technique. The NSLO uses a 30 g aliquot that is fire assayed with an AAS finish for gold. The major analytical focus at the NSLO is multi-element analysis. Results are electronically recorded and sent to the Geology Department to be uploaded to the resource database for checking and validation. Lihir Operations Papua New Guinea Technical Report Summary Date: February 2026 Page 8-6 8.7 Quality Assurance and Quality Control 8.7.1 Procedures All assays are checked and verified in accordance with quality assurance quality control (QA/QC) and database management procedures. QA/QC procedures were in place for all of the legacy drilling programs. A detailed QA/QC program is in place for ongoing assessment of sampling and analytical procedures. The process can involve submission and analysis of some or all of the following: • Blind submissions of standard reference materials (SRMs) to the onsite laboratory; • Duplicates from the LM5 pulverize pulp, assayed during the same batch; • Blind resubmission of pulps to the onsite laboratory; • Replicate submissions of pulps to an alternative laboratory for analysis; • Replicate submissions of coarse duplicates to an alternative laboratory for analysis; • Submission of coarse blank samples (non-Aniolam Island barren rock samples); • Checks on grind and crush size from the sample preparation steps; • Visits to the laboratory for confirmation of actual procedures applied; • Monthly QA/QC meetings with laboratory personnel. A monthly report is prepared for the site Technical Services Manager detailing QA/QC performance, and an annual report is prepared to support the documentation of the mineral resource estimate. 8.7.2 Pre-2012 Performance A history of the QA/QC programs is provided in Table 8-2. Table 8-2: QA/QC History Date QA/QC Type Note Pre- 2012 Standard A total of 14 SRMs were used, labelled as the LMC series, and used until the end of 2008 and the LGL series, used from November 2008–July 2010 Both the LMC and LGL series were matrix-matched to materials from the Lihir deposit. Ore Research and Exploration Pty Ltd prepared the LGL SRMs. Best values for the LGL series were estimated for gold, sulfide sulfur, and total sulfur. Best values for the LMC series may have been estimated for gold only; there are no sulfur best values data in the database and the certificates are not available. SRM performance is generally unacceptable for the evaluation period, largely because of the extreme number of SRMs that appear to have been mislabeled or swapped with routine samples. Blank Blank samples were inserted in the sample stream. There are two groups of blanks, and two different lower detection limits. There are few spikes in the data with the higher


Lihir Operations Papua New Guinea Technical Report Summary Date: February 2026 Page 8-7 Date QA/QC Type Note detection limit. The other data, however, show poorer control, frequent results above 0.2 ppm, and some spikes that appear to be sample swaps. Duplicate The mean bias is +10% suggesting the likely presence of a number of sample swaps. There are 1,137 duplicate samples after November 2009. Precision was 13.7% for the entire data set improving to 8.3% for pair averages of 0.5 ppm or better and 5.3% for pair averages of 2 ppm or better. Check assay Approximately 49,500 samples that were analyzed by the site laboratory between 2000 and 2005 were reanalyzed by Standard and Reference Laboratories. Reanalysis was completed for gold only. There are large discrepancies between the two laboratories’ results for individual samples, but the averages are similar. As far as can be ascertained in a data set with such poor precision, there is an inconsistent, generally positive, bias. In 2010, 167 samples plus eight SRMs were sent to Standard and Reference Laboratories for gold-assay checks. Standard and Reference Laboratories analyzed the samples in duplicate. Agreement between the two laboratories was good. There is no record of any check assays for sulfur for this time period. 2012– Report date Standards SRMs are prepared and certified by the third-party standards provider, OREAS, and are sourced from in-pit blast hole material (matrix-matched). SRMs are stored on site in sealed 30 or 60 g packets. This is only sufficient for one fire assay, so when an SRM is submitted there are two packets supplied. Monthly performance is charted by developing a “Z score” for all of the combined SRM assays in respect to the individual economic and the main deleterious elements. The results are considered acceptable. Blanks Barren flush material is used at the start of every batch or if clay build up is noticed in the pulverizer. Blank samples are inserted with the primary samples at a rate of one in 40. In addition, the laboratory uses a barren flush (not assayed) at the start of every batch, and if pulverizer bowls have residual clay in them. Flushes are prepared from ceramic pots that are broken into the bowls. There have been minimal to no issues indicated from the monitoring of blanks. Grind size Routine grind size checks are completed at a 1:20 frequency. Where a sample does not pass the recommended P95 106 µm value, regrind is completed on 10 samples either side of the failure. Where the grind check is completed after sample analysis has been completed, re- analysis of the regrind pulps is required. There have been minimal to no grind size failures. Crush duplicates Crush duplicates are collected at a 1:20 frequency, and precision for gold is considered within acceptable limits for all laboratories. There have been minimal to no issues indicated from the monitoring of crush duplicates. Pulp duplicates Laboratory duplicates represent two pulp packets collected from the crusher or the pulverizer, a replicate is a repeat analysis from the one pulp packet. There have been minimal to no issues indicated from the monitoring of pulp duplicates. Pulp replicates Laboratory duplicates represent two pulp packets collected from the crusher or the pulverizer, a replicate is a repeat analysis from the one pulp packet. Pulp replicate assays are provided by the laboratory as evidence of internal QA/QC. There were no issues indicated from the monitoring of pulp replicates. Lihir Operations Papua New Guinea Technical Report Summary Date: February 2026 Page 8-8 Historical QA/QC (through 2012) performance was relatively poor (see discussion in Section 12.3), and all control measures used indicate that there were problems at the mine with sample mix-ups, swaps and mislabeling of control samples, and by inference, the routine drill samples. However, in summary: • Accuracy for this time period cannot be reliably estimated because of the erratic assays of standards; • Contamination is low and acceptable for much of the time covered. The later months appear to have numerous sample swaps so no conclusions can be made; • Precision appears to be adequate; • Check assays for gold indicate that gold bias is quite small and acceptable. The gold data suggested there was a systematic negative bias in the onsite laboratory performance for gold of the order of -5%. The data for sulfide sulfur analysis suggests there was a systematic positive bias in the onsite laboratory performance for sulfur of the order of 15–20%. The positive bias is considered to be due to the degradation of the LabFit procedure over time such that it measured total sulfur rather than the sulfide sulfur the procedure was established for, and also the procedure used to generate the expected value of the SRMs. However, the sulfide sulfur assays are used for metallurgical characterization and are not directly applied to mineral resource and mineral reserve estimates. Historical QA/QC results do not suggest there is a serious bias in the performance of the onsite laboratory itself in terms of gold analysis. In the QP’s opinion, the QA/QC data indicates the historical (prior to 2011) sample preparation, security and analytical procedures were adequate and results independently verified and as such the data are considered to be acceptable inputs for mineral resource estimation. 8.7.3 2012–Report Date QA/QC Batches are prepared for gold assaying with 40 primary samples and six laboratory QA/QC (three SRMs, two duplicates, one blank). Field samples are submitted with around 37 primary samples plus three geology QA/QC samples. 8.7.3.1 Short-Term QA/QC Measures and Reporting Weekly monitoring of key metrics including SRMs and blanks have been recorded by the sites on the corporate server since November 2011 and that process was in place as at December 31, 2025. A log of non-compliant laboratory batches with associated actions has been filed on the corporate server since December 2013. This monitoring continued as at December 31, 2025. 8.7.3.2 Longer-Term Control Measures and Reporting From November 2010 to June 2017, the corporate QA/QC specialist prepared monthly consolidated assay reviews that highlighted improvements and issues needing attention. This reporting was accompanied by individual QA/QC reviews of assays used for resource modelling. Lihir Operations Papua New Guinea Technical Report Summary Date: February 2026 Page 8-9 These reports are filed on the corporate server and were reviewed by the QA/QC specialist to investigate any issues requiring improvement actions. From June 2017 to July 2019, the procedure was modified such that all reporting was done by the mine site on a monthly basis. A corporate review of the monitoring was conducted in July 2019. From July 2019, monthly site-based reporting has been undertaken. All reports were filed on the corporate server and were reviewed by the corporate QA/QC specialist. From 2023 onwards, the reports were reviewed by the relevant geologist; e.g. blast hole and RC by the mine geologist, and core by the exploration geologist. 8.7.4 Newcrest Legacy QA/QC Reviews The reviews performed by Newcrest staff are summarized in Table 8-3. Table 8-3: Newcrest QA/QC Reviews Date and Review Type Note 2013 QA/QC review SRMs analyzed at the onsite laboratory were noted to have a negative bias for gold (approximately -5%) and a very strong positive bias for sulfur (in the range +15 to +20%). Standard and Reference Laboratories also returned a negative bias for the SRMs, leaving some doubt as to whether the SRMs were correctly certified. The SRMs showed evidence of sample swaps and/or mislabeled SRMs, which affected as many as one in six of the SRMs. It appears likely that many of the problem results are SRMs swapped with routine samples, which suggests that there are probably also swaps of routine samples for routine samples. Apart from sample swaps, the paired data performed acceptably well at levels of more than about 20 times the detection limit. The Standard and Reference Laboratories data agree with the onsite laboratory data, and suggest that there is not a major difference between the two laboratories. The database contains 349 pulp samples that appear to be resubmissions, which were originally submitted between January 2002 and February 2003. The samples appear to have been selected on a grade basis and there are no samples with an original result <0.31 g/t Au. Gold showed a small positive bias (original relative to check) above about 6 g/t Au and smaller negative bias below that. The overall bias is -1%. Sulfur showed a strong positive bias (original relative to check), particularly between sulfur grades of 3–7% and >10%. Summary population statistics indicate a precision problem with the sulfur analyses. The bias between original and resubmitted results is unlikely to be consistent, and should be considered to be a symptom of the between-job variance in the sulfur analyses, probably because the second set of analyses was undertaken over a relatively short period. Had the resubmissions been spread over a year as was the case for the original assays, it is likely the bias would have been much closer to zero. The review also noted that the majority of the SRMs used were certified for total sulfur or not certified for any sulfur species. Sulfide sulfur assays are used for metallurgical characterization and are not directly applied to mineral resource and mineral reserve estimates. 2014 QA/QC review Gold data from the onsite laboratory tend to be biased by about -5%, relative to the matrix- matched SRMs. Late in the program the bias disappeared. Some samples, apparently from late in the program, were sent to the NSLO for check analyses. These had a median bias of +7% relative to the mean of the onsite laboratory and the NSLO values. This possibly relates to different fluxes in use at the onsite and the NSLO laboratories; Lihir Operations Papua New Guinea Technical Report Summary Date: February 2026 Page 8-10 Date and Review Type Note The sulfide analytical method tends to over-report sulfide above about 5% and may under-report below that figure; Coarse duplicates returned 5% for gold and 9% for sulfide from cleaned data. Laboratory pulp replicates had a cleaned data precision of 6% for gold, and 7% for sulfide. 2014 database validation Minor errors were identified and corrected. Many of the errors are minor inconsistencies in data entry that would not have had a material impact on the current mineral resource estimate. Collar locations, downhole surveys, assay identifiers and data, quality control data, drill hole diameter, and drill interval gaps and overlaps were compared to original data and corrected if found to be in error. Some logging discrepancies were not resolved; however, this was not considered to be material as spectral data and geochemistry were used to develop estimation domains. 2014 pulp checks The results indicated a high degree of imprecision. The onsite laboratory had internal replicate imprecision of 3.4% and the NSLO laboratory had nearly double the imprecision of the onsite laboratory at 8.4%. However, the 24% difference between the laboratories is significantly higher. Potential reasons to this include the following: • Sample swaps when the duplicate batches are prepared; • The mean grade of the inter-laboratory checks (2.2 g/t Au) is higher than the internal onsite laboratory replicate pulp grades (1.65 g/t Au). No similar issues were noted since 2014. The issue is not considered material to the current mineral resource estimate. 2013, 2016 sulfur bias checks In December 2013, a period of time where the sulfide sulfur assay data reported by the onsite laboratory were positively biased (in comparison to SRM values) was identified and documented. This bias was shown to have progressively increased over time, from +10% in 2008 to in excess of 20% at the end of 2012. The bias is most likely attributed to the degradation of the LabFit analytical instrument(s) and adherence to the analysis methodology adopted by the onsite laboratory during this time. After bias recognition, Newcrest developed a set of correction factors for the data. The majority of the 2012–2013 information affected by the bias has been subsequently mined out. During 2016–2017, assays at NSLO showed better precision and a low bias. From March 29, 2018, assays were reported from the onsite laboratory using a newly-commissioned bank of four LECO analyzers. Precision improvements have occurred since September 1, 2018, as the result of the completion of the implementation period and associated system improvements. Sulfide sulfur assays are used for metallurgical characterization as these determine the initial process route. If the sulfide sulfur is low, flotation is required before oxidation in the autoclave. If the sulfide sulfur values are above approximately 4% sulfide sulfur, the material can be sent directly to the autoclaves. As the biases were adjusted using correction factors, and the current methodology uses LECO instrument data, the likelihood of sending material to the wrong process route has been mitigated, and the sulfide sulfur data are considered suitable for process material classification and operational control requirements. 8.8 Database Data are stored in a SQL server database using acQuire software. Assay data and geological data are electronically loaded into acQuire and the database is replicated to a centralized database server. The geological team on-site currently manages all data. Data are collected from geotechnical logging, geological logging and drilling data (collar, survey) and imported/logged directly into the acQuire database. Regular reviews of data quality are


Lihir Operations Papua New Guinea Technical Report Summary Date: February 2026 Page 8-11 conducted by site and corporate teams prior to resource estimation, in addition to external reviews. Exclusive control over the checking and entry of analyses from the laboratory is restricted to database administrator(s) and designated geologists. Login and access permissions are limited to control access to the database and to maintain the integrity of the resource data. Data access is generally limited to project geologists and the database administrators. The database is regularly backed up, and copies are stored both offsite and in Newmont facilities. 8.9 Qualified Person’s Opinion on Sample Preparation, Security, and Analytical Procedures In the opinion of the QP, the sample preparation, analysis, and security practices and results for the Kennecott, Lihir Gold, Rio Tinto and Newcrest/Newmont programs are acceptable, meet industry-standard practice, are adequate to support mineral resource and mineral reserve estimation, and can be used for mine planning purposes. Lihir Operations Papua New Guinea Technical Report Summary Date: February 2026 Page 9-1 9.0 DATA VERIFICATION 9.1 Internal Data Verification 9.1.1 Laboratory Visits Laboratory inspections are carried out regularly, although older inspection records are no longer available. Inspection periods have varied between monthly and six-monthly intervals. Additional measures include laboratory visits performed by the Newmont Geochemists follows: • Intertek Lae: 2013; 2023, 2025 • Intertek Perth: 2013, 2017; • Bureau Veritas Perth: 2013; • Intertek Townsville: 2023, 2025 • Newmont Lihir: 2025 Laboratory visits have also been undertaken on Newmont’s behalf by consultant sampling specialists such as Agoratek International. 9.1.2 Laboratory Checks Round-robin programs are run by Geostats Pty Ltd, an independent third-party organization that undertakes world-wide assay programs. Each program is run quarterly and routinely involves more than 200 laboratories each time. The onsite laboratory and the NSLO participate in Geostats programs on a six-monthly basis, and each has performed within expected industry standards. The most recent program participation report for each laboratory was dated April 2019. Details of each laboratory’s performance are reviewed by the Newmont personnel, and improvement plans put in place if required. 9.1.3 Internal Data Verification Drill hole data for the Project were collected over many years by a number of operators. Resource documentation indicates that at various times the older data were reviewed and compiled into a drill hole database. It is unlikely that original laboratory certificates are available for the older data. More recent drilling activity by Newcrest/Newmont has used standard operating procedures that include data verification before data are accepted into the drill hole database. 9.1.4 Mineral Resource and Mineral Reserve Estimates Newmont established a system of “layered responsibility” for documenting the information supporting the mineral resource and mineral reserve estimates, describing the methods used, and ensuring the validity of the estimates. Lihir Operations Papua New Guinea Technical Report Summary Date: February 2026 Page 9-2 9.1.5 Reconciliation Newmont staff have performed a number of internal studies and reports in support of mineral resource and mineral reserve estimation. These include reconciliation studies, mineability and dilution evaluations, investigations of grade discrepancies between model assumptions and drill hole data, drill hole density evaluations, long-range plan reviews, and mining studies. 9.1.6 Mineral Resource and Mineral Reserve Review Newmont conducts internal audits, termed Reserve and Resource Review (3R) audits, of all its operations. These audits focus on: • Reserves processes: geology and data collection; resource modelling; geotechnical; mine engineering (long term) for open pit and underground operations; mineral processing (development); sustainability and external relations; financial model; • Operations process: ore control; geotechnical and hydrogeology (operational); mine engineering (operational) for open pit and underground operations; mineral processing (operational); reconciliation. The reviews assess these areas in terms of risks to the contained metal content of the mineral resource and mineral reserve estimates, or opportunities to add to the estimated contained metal content. Findings are by definition areas of incorrect or inappropriate application of methodology or areas of non-compliance to the relevant internal Newmont standard (e.g., such as documents setting out the standards that are expected for aspects of technical services, environmental, sustainability and governmental relations) or areas which are materially inconsistent with published Newmont guidelines (e.g., such as guidelines setting out the protocols and expectations for mineral resource and mineral reserve estimation and classification, mine engineering, geotechnical, mineral processing, and social and sustainability). The operation under review is expected to address findings based on the level of criticality assigned to each finding. The most recent Lihir Operations 3R audit was conducted in 2023. 9.1.7 Subject Matter Expert Reviews The QP requested that information, conclusions, and recommendations presented in the body of this Report be reviewed by Newmont experts or experts retained by Newmont in each discipline area as a further level of data verification. Peer reviewers were requested to cross-check all numerical data, flag any data omissions or errors, review the manner in which the data were reported in the technical report summary, check the interpretations arising from the data as presented in the report, and were asked to review that the QP’s opinions stated as required in certain Report chapters were supported by the data and by Newmont’s future intentions and Project planning. Feedback from the subject matter experts was incorporated into the Report as required. 9.2 External Data Verification SRK Consulting (Australasia) Pty Ltd (SRK) performed an independent review of the current resource model (Kentwall and Guibal, 2018). The review initially examined inputs to the model, including the database, QA/QC, drill type, logging, density, and exploration concept model. The Lihir Operations Papua New Guinea Technical Report Summary Date: February 2026 Page 9-3 second part of the review focused on the modelling, and covered modelling, domaining, compositing, declustering, top-cutting, variography, estimation and interpolation. SRK provided Newcrest with a number of minor recommendations for future modelling efforts and concluded that there were no significant concerns or issues with the reviewed model. 9.3 Data Verification by Qualified Person The QP performed a site visit in September 2025 (refer to Chapter 2.4). Observations made during the visit, in conjunction with discussions with site-based technical staff also support the geological interpretations, and analytical and database quality. The QP’s personal inspection supports the use of the data in mineral resource and mineral reserve estimation, and in mine planning. The QP received reconciliation reports from the operations. Through the review of these reconciliation factors, the QP can accept the use of the data in support of the mineral resource and mineral reserve estimates. 9.4 Qualified Person’s Opinion on Data Adequacy Data that were verified on upload to the database, checked using the layered responsibility protocols, and reviewed by subject matter experts are acceptable for use in mineral resource and mineral reserve estimation.


Lihir Operations Papua New Guinea Technical Report Summary Date: February 2026 Page 10-1 10.0 MINERAL PROCESSING AND METALLURGICAL TESTING 10.1 Introduction Independent laboratories and testwork facilities used during initial metallurgical evaluation included: Sherritt International Corporation (Sherritt), Metso Minerals Process Technology (Metso), Hazen Research Inc. (Hazen), Pocock Industrial (Pocock), IPRC, Lakefield, E.L. Bateman, Eimco, RESCAN, Alberta Research Council, Dorr-Oliver, Lurgi, Davy McKee, and NSR Environmental. Geometallurgical testwork completed from 2012–2025 was primarily conducted at Core Resources Laboratories in Brisbane, and Bureau Veritas in Perth; both laboratories are independent of Newmont. Metallurgical testwork supporting the original process design included comminution (crushing (impact), rod mill, ball mill, abrasion, MacPherson's semi-autogenous grind (SAG) indices), flotation, pressure oxidation (POX), and mineralogy. The processing facility commenced operations in 1997 at a nominal 2.8 Mt/a, treating high-grade ore with lower-grade ore stockpiled for later processing. The original process plant flow sheet consisted of grinding, whole ore oxidation in pressure autoclaves, followed by gold recovery from washed oxidized slurry using conventional carbon-in-leach (CIL) cyanidation. In 2001, heat-exchangers were installed ahead of the autoclaves to pre-heat slurry prior to oxidation in the autoclaves in response to declining sulfide sulfur head grade. A pebble crushing circuit was installed on the then single, grinding train to increase mill throughput from a nominal 4 Mt/a to 4.6 Mt/a. In May 2007, an additional grinding and flotation plant upgrade (FGO) was commissioned. The additional grinding train increased nominal throughput to 6 Mt/a. This was achieved without a significant change in autoclave throughput enabled by the introduction of flotation, which was primarily used to increase autoclave feed sulfide sulfur grade. This also reduced the mass flow to the autoclaves. In early 2008, a feasibility study on a major plant expansion (the MOPU plant expansion) was approved by Lihir Gold, and works commenced in 2009. Following Newcrest’s takeover of Lihir Gold in 2010, Newcrest completed the outstanding work of the major plant upgrade. The plant upgrade added primary jaw crushers, another grinding circuit (HGO2), another autoclave (AC4), and oxygen plant, as well as a second CIL circuit. The plant expansion was completed and commissioned in January 2013. The nominal plant capacity was 11–12 Mt/a; however, actual throughput was about 9–10 Mt/a. Shortly after commissioning of the MOPU plant expansion, Newcrest installed a second flotation circuit for the original high-grade ore (HGO) mill, to enable treatment of low-sulfur ores. In December 2014, the operating strategy for the Lihir Operations was changed to using partial pressure oxidation (minimum of 50% sulfide oxidation instead of total pressure oxidation with >98% sulfide oxidized). The switch in strategy was due to the recognition that irrespective of how gold in sulfide sulfur was presented to the autoclave or from which source (ore or flotation concentrate), only a fraction of the refractory sulfide is required to undergo oxidation to unlock the majority of the gold for subsequent recovery. Lihir Operations Papua New Guinea Technical Report Summary Date: February 2026 Page 10-2 Most of the gold (generally >90%) is associated with arsenian pyrite, which is microcrystalline in nature, highly reactive, and oxidizes fastest in the autoclaves. The other pyrite type, (blocky pyrite) is generally coarser, contains low levels of gold, and is relatively unreactive in acidic conditions. The blocky pyrite requires full oxidation for gold recovery, and it is not economic to specifically target this pyrite if gold-rich arsenian pyrite is available to oxidize. 10.2 Metallurgical Testwork 10.2.1 Early Testwork The major focus of the early metallurgical testing programs was the selection of a process for oxidation of pyrite, to make gold particles in the sulfide ore amenable to cyanidation. Investigations included roasting and pressure oxidation (POX), using both whole-ore and pyrite concentrate samples. Biologically assisted oxidation was also investigated. By 1988, POX was identified as the most applicable process. Extensive testing was carried out for ore comminution (crushing and grinding) and on the flotation of a pyrite concentrate. Material handling testwork (including bulk crushed ore handling, rheology, and thickening tests) was also included. Cyanidation of oxidized products for gold recovery was used as a measure of oxidation process performance, and additional cyanidation and carbon adsorption tests were conducted to determine design and operating criteria for the CIL circuit. Oxide ore testwork included material handling and comminution testing, agitation leach-carbon adsorption, and agglomeration and heap leach testwork. Key issues for this approach were the high clay content, high rainfall setting, and moisture content of the ores. 10.2.2 1992 Feasibility Study The metallurgical test program in support of the 1992 design process consumed 58 t of sample (Collins et al., 2011). The POX test program, conducted at Sherritt in Fort Saskatchewan in Canada, included more than 100 batch pressure oxidation and cyanide leach tests and nine continuous pilot plant campaigns, for a total of 889 hours of autoclave operation over a period of three years. Gold extractions >90% were achieved from all ore types in the POX and cyanide leach tests, with extractions of 94–96% being common, provided that chloride was sufficiently washed from the ore prior to autoclave processing. The extent of sulfide sulfur oxidation required to reach 94–96% gold extraction was typically in the range of 98–98.5%. The pilot plant work was relatively extensive, and included consideration of chloride as a deleterious element in the process flowsheet. More than half of the pressure oxidation test program was directed toward defining and mitigating the effects of chloride. 10.2.3 2014 Pilot Plant Pressure Oxidation During 2014, Hazen completed pilot plant POX operations and additional laboratory experiments in support of existing plant operations. The results from this program were used to optimize the operating strategy. Lihir Operations Papua New Guinea Technical Report Summary Date: February 2026 Page 10-3 10.2.4 Geometallurgical Test Program A geometallurgical testwork program has been used at Lihir since 2012. This incorporates the combination of metallurgical test results using standard test procedures, together with traditional analytical and geological data in mine resource modelling. Data from the geometallurgical program is used to develop plant throughput and recovery models, based on the underlying geological properties. Geometallurgical testing is undertaken on ore from all future mining phases to refine metallurgical models and assumptions. Samples for the geometallurgical programs are selected to be spatially and materially representative of the planned mining area(s). Geometallurgical testwork has shown the connection between process plant response and geological alteration. Ore from historical stockpiles also shows lower flotation recovery. This understanding has formed the basis of metallurgical models and assumptions. 10.2.5 Mineralogy Microscopic examination identified pyrite as the dominant opaque mineral, with accessory marcasite. Minor amounts of chalcopyrite, pyrrhotite, sphalerite, galena, covellite and arsenopyrite were also identified, along with the major gangue minerals potassium feldspar, biotite and white mica, and clay. Minor gangue minerals identified include silica, anhydrite, and calcite. Minute gold particles were only occasionally observed, ranging in size from the sub- micrometer detection level to 4 µm. Investigation of pyrite-hosted gold was conducted by Rio Tinto in 2004–2005. The deposit was found to contain different pyrite types, including blocky, fractured/porous, framboidal and disseminated, and the gold tenor differed with each of these pyrite types. Each pyrite type was estimated to exist in the feed materials (hard, medium, and soft blast composites) in similar proportions; however, given the variation in gold grade within the pyrite types, it was estimated that approximately 60% of the pyrite contained 90% of the gold. A combination of optical microscopy, scanning electron microscopy and secondary-ion mass spectrometry established that most of the gold occurs as a nearly atomic dispersion in the pyrite. It was estimated that at least 80% of the gold present in the pyrite grains was <5 nm in diameter. During 2016, a laser ablation inductively-coupled plasma mass spectrometry (LA-ICP-MS) study identified two separate pyrite morphologies, micro-crystalline versus blocky pyrite. These morphologies had varying reactivities due to the changing abundance of elemental impurities, in addition to different gold contents. 10.2.6 Metallurgical Types Lithological, alteration and “ore type” models were developed during the exploration and feasibility stages. Thirteen principal ore types were distinguished on the basis of hardness, alteration, vein intensity, and degree of brecciation: alluvium; oxide (oxide, white rock, and white clay); transition; advanced argillic (referred to as advanced argillic condensate when not at near-surface location); argillic; clay silica; silica clay; siliceous breccia; quartz stockwork; boiling zone; argillic overprinted boiling zone (AOPBZ); anhydrite sealed; and propylitic. The ore type model was selected as the base model for the geostatistical, metallurgical, and geotechnical evaluation of the deposit. Lihir Operations Papua New Guinea Technical Report Summary Date: February 2026 Page 10-4 Initial metallurgical testing was carried out on samples that consisted of multiple drill hole intervals of the same ore type, as well as a lesser number of ore type combination blends, the proportions of which were derived from the mine plan at the time. Over time this, this ore type model has undergone several iterations as well as simplifications for metallurgical purposes and is currently evaluated using the alteration domain model. Most metallurgical parameters are derived using the defined alteration groups with certain limits placed on specific alteration sub domains due to operational constraints. An ore characterization program that commenced in 2012 determined that gold in the fine fraction of the flotation tailings was largely cyanide-soluble. This led to the staged introduction of float tails leach, where a portion of the flotation tailings are directed to the existing CIL circuit to recover cyanide-soluble gold without pressure oxidation. In the first stage of implementation in December 2015, an un-sized split of the HGO flotation tailings stream was directed to the CIL circuit, via CCD, up to the maximum available CCD/CIL circuit capacity. A second stage implementation consisted of a cyclone circuit which recovered the fine, higher cyanide recoverable tailings from both flotation circuits to CIL, thereby increasing the quantity of flotation tails that can be treated. 10.3 Recovery Estimates 10.3.1 Comminution Response The Morrell Power Model, which is an SMC-based power model, is used to predict power draw based on mill feed type and grind size. The model is also set up to optimize grind size based on power availability and throughput. The geometallurgical data indicate that there is not a significant difference between many of the alteration types. Historically, SBX (silica breccia) was noted as being significantly harder when milled; however, there is much less of this alteration type in the LOM plan. The SMC properties of each alteration sub domain, based on geometallurgical testwork results, are used as model inputs, with 50th percentile values used as the basis for the power models. The models were calibrated against plant operating data. 10.3.2 Basis of Recovery Forecast Future recovery projections for Lihir are based on laboratory testwork for future ores in combination with past actual plant performance. This has been found to be sufficiently accurate for the purposes of projecting recovery and hence gold production from Lihir ores. The Kapit area has been metallurgically tested and these data were incorporated into future recovery projections. A description of gold recovery modelling for flotation and neutralization, cyanidation and adsorption (NCA) are provided in the following sub-sections. 10.3.3 Flotation Recovery An analysis of the ore deposit knowledge database and actual plant recoveries were used to determine a set of fixed flotation recovery values for the three alteration groups for fresh and


Lihir Operations Papua New Guinea Technical Report Summary Date: February 2026 Page 10-5 stockpiled material. The plant data were normalized to a mass pull of 30% and a grind P80 of 150 μm. The overall impact of mass pull on flotation gold recovery was determined from an extensive population of plant operating data from 2016–2022. For modelling purposes, sulfur flotation recovery is derived from gold recovery using the plant operating data The flotation recovery is adjusted to allow for the impact of grind size, based on geo- metallurgical testwork flotation response data. The flotation recovery assumptions, normalized to 30% mass recovery, at 150 µm grind size, are summarized in Table 10-1. Table 10-1: Flotation Recovery Forecasts Ore Type Recovery in Fresh Rock (%) Stockpile Recovery (%) Porphyry 94 78 Epithermal 87 75 Argillic 70 60 10.3.4 Neutralization, Cyanidation and Adsorption Recovery The model for the gold extraction from neutralization, cyanidation and adsorption (NCA) solids is based on the relationship with NCA feed sulfide sulfur grade. It has been derived from plant operating data from 2019 to 2023. Based on plant operating data, the NCA solution tail grade is assumed to be 0.01 g/t Au. This is used as the basis for calculation gold losses in solution. 10.3.5 Recovery Uplift Although a number of projects aimed at improving plant gold recovery are underway, no recovery uplifts have been included in future production forecasts. 10.3.6 Final Recoveries The average metallurgical recovery for gold over the LOM plan is predicted to be 76%. Daily and monthly recovery varies, based on ore grade, the fraction of milled ore sent to flotation, and the amount of stockpiled ore being treated. Naturally fine-grained ores (mostly argillic material) and clays (from fresh or stockpile ore) can impact on both plant throughput and metallurgical recovery. For the crushing and materials handling areas, wet and sticky ores are managed through blending and on-going mechanical modifications to conveyors and chutes etc. Once in slurry form, these ores can display high and variable non-Newtonian shear-thinning behavior, which can impact the milling, flotation, POX, and CIL circuits. However, dilution has been found effective in controlling slurry rheology to date. Lihir Operations Papua New Guinea Technical Report Summary Date: February 2026 Page 10-6 The maximum proportion of fines and clays (mainly from argillic ores) that can be treated within the plant is not known with certainty. There are several types of clay minerals with varying impact on plant performance. There is some risk that high proportions of such ore types in plant feed may lead to lower short-term recovery and throughput rates, until an adjustment to the mine plan and/or additional plant modifications can be implemented. 10.4 Metallurgical Variability During 2012 Newcrest conducted an ore variability characterization program to improve the level of orebody knowledge. This involved a combination of re-interpretation of old geology logs, re- logging of existing drill holes where required, and an extensive program of Corescan hyperspectral imaging and multi-element geochemical analysis across typical sections through the deposit. To complement this deposit-scale exercise, bulk samples of material were collected from both in-situ locations and stockpiles. Samples were subjected to optical, mineral liberation analysis, and X-ray diffraction mineralogy, hyperspectral imaging, multi-element geochemical analysis, comminution testing, diagnostic leach, and flotation tests. LA-ICP-MS analysis of pyrite particles was completed on selected samples to revisit the work started by Rio Tinto. By the end of three phases of LA-ICP-MS work, over two million data points detailing pyrite chemistry were collected, covering the full range of material types and grade variations observed within the deposit. Overall, samples selected for metallurgical testing during feasibility, development and expansion studies were representative of the various styles of mineralization within the different mineralized zones. Samples were selected from a range of locations within the deposit zones. Sufficient samples were taken, and tests were performed, using sufficient sample mass for the respective tests undertaken. 10.5 Deleterious Elements There are no penalty elements that affect doré sales. Deleterious components in the ore that may affect aspects of plant operation are typically localized, and to date, have had only short-term effects. These can include: • Copper: elevated copper levels in the plant may cause instances of higher cyanide usage; • Chloride: chloride management in the POX plant requires the use of fresh water to maintain set chloride limits in autoclave discharge; • Clays: can cause isolated or localized effects on the crushing, grinding, POX, and CIL circuits; this is generally managed using water dilution; • Carbonate: can cause excessive venting and oxygen loss in the autoclaves; this is typically managed using blending and flotation. Lihir Operations Papua New Guinea Technical Report Summary Date: February 2026 Page 10-7 10.6 Qualified Person’s Opinion on Data Adequacy The testwork undertaken is of an adequate level to ensure an appropriate representation of metallurgical characterization and the derivation of corresponding metallurgical recovery factors. Initial metallurgical assumptions are supported by 22 years of production data. The average metallurgical recovery for gold over the LOM plan is predicted to be 76%. Daily and monthly recovery varies, based on ore grade, the fraction of milled ore sent to flotation, and the amount of stockpiled ore being treated. Naturally fine-grained ores (mostly argillic material) and clays (from fresh or stockpile ore) can impact on both plant throughput and metallurgical recovery. For the crushing and materials handling areas, wet and sticky ores are managed through blending and on-going mechanical modifications to conveyors and chutes etc. Once in slurry form, these ores can display high and variable non-Newtonian shear-thinning behavior, which can impact the milling, flotation, POX, and CIL circuits. The maximum proportion of fines and clays (mainly from argillic ores) that can be treated within the plant is not known with certainty; however, studies are underway. There is some risk that high proportions of such ore types in plant feed may lead to both lower recovery and throughput, until an adjustment to the mine plan and/or additional plant modifications can be implemented. There are no penalty elements that affect doré sales. Deleterious components in the ore that may affect aspects of plant operation are typically localized, and to date have had short-term effects. Geometallurgical testwork is used to both develop metallurgical assumptions and recovery model, and ensure future ore response is consistent with the defined model. Operating data is used to calibrate metallurgical models and assumptions. Although a number of projects aimed at improving plant gold recovery are underway, no recovery uplifts have been included in future production forecasts. The metallurgical data are acceptable to support mineral resource and mineral reserve estimation and the cash flow analysis that supports the mineral reserves. Lihir Operations Papua New Guinea Technical Report Summary Date: February 2026 Page 11-1 11.0 MINERAL RESOURCE ESTIMATES 11.1 Introduction The database close-out date for the mineral resource estimate was October 15, 2024. Vulcan 2023, Isatis Neo 2023, Leapfrog 2024 and Supervisor 9.0 were the modelling and geostatistical software systems used in modelling and estimation. Geological interpretation is supported by core, RC, in-pit mapping, and grade control sampling data (blast hole). Core drilling can include drill holes completed for geotechnical, geothermal, resource definition, and metallurgical purposes, if there are assay data for the drill holes. Not all core holes, if completed for purposes other than resource definition, have analytical data. The majority of core holes support mineral resource and mineral reserve estimates. Some old shallow RC holes from the Kennecott era are included in estimation; however, these drill holes are located within the mined-out area of the original surface of the Lienetz zone. 11.2 Exploratory Data Analysis Three major drilling types were examined: resource definition drill holes, which were primarily core, medium-term planning RC drill holes, and grade control blasthole samples. The medium- term planning RC spacing is around 20 x 20 m and the grade control blasthole data are closely spaced, averaging 5 x 5 m. The grade control blasthole provided a substantial dataset for calibration and comparison. The three data sets were compared and analyzed for any occurrences of bias. The statistics suggested no material bias between the two data types. Contact plots for all the elements that were estimated were generated for the alteration domain contacts. Contacts were defined as either soft, firm, or hard. The mineralization mean and variance statistics are very sensitive to the declustering approach and the cell size. Isatis Neo cell declustering was used. 11.3 Geological Models The latest update of the alteration model was based on the systematic interpretation of the hyperspectral analysis, multi-element chemical analysis of pre-existing drill core, coarse rejects and pulp material, and core photos. The resultant model reflects the complex evolution of the deposit, with three key alteration domains, including argillic, epithermal and porphyry. The alteration model was used as the underlying geological model because alteration (based on mineralogy and chemistry) was found to characterize key processing parameters better than other geological parameters. Five structural domains and three alteration domains were used in estimation. 11.4 Density Assignment Block density data (dry bulk) were estimated via ordinary kriging (OK), based on alteration domains. Density values <1.5 t/m3 and >3.5 t/m3 were discarded and not used for analysis and estimation.


Lihir Operations Papua New Guinea Technical Report Summary Date: February 2026 Page 11-2 11.5 Grade Capping/Outlier Restrictions Geostatistical evaluations indicate that gold and sulfur are not highly skewed populations. Gold distributions have outliers that required examination and adjustment. Outliers are capped such that the tail of the distribution is reasonably contiguous. Domain cap limits vary by domain and range from 30–50.9 g/t Au. No capping was applied to sulfide sulfur composites. Capping was also applied for minor element composites, including silver, arsenic, calcium, carbonates, copper, and molybdenum. 11.6 Composites All core data were composited on 12 m downhole intervals; this composite length corresponded to the mining bench height. To accommodate sulfide sulfur and minor element estimation, where there can be a lack of contiguous sampling, a Vulcan option was used where all final composites, regardless of length, were retained together with the final composite lengths. The composite lengths were used as an additional weighting variable in statistical analysis and estimation. 11.7 Variography Variography was performed in Supervisor. All data were capped and final declustering weights were used. Variograms were calculated for gold, sulfide sulfur, arsenic, silver, calcium, carbonate, copper, and molybdenum. Gold variograms in real space were unobtainable; hence, Gaussian transforms were used for calculations and modelling. The Gaussian variogram models were back-transformed to real space for panel kriging and gaussian variogram models were utilized to calculated the support correction as part of the uniform conditioning (UC) process. The argillic domains generally had the lowest nuggets (5%, 17%, 15%), while the porphyries had the highest nuggets (22%, 34%, 30%). Sulfide sulfur variograms were calculated and modelled in real Gaussian space and back- transformed for panel kriging and gaussian variogram model were utilized to calculated the support correction as part of the UC process. Density variogram calculation and modelling were performed in real gaussian space with no declustering weight were used, and back-transformed for declustering weights were not used. 11.8 Estimation/interpolation Methods 11.8.1 Kriging Neighborhood Analysis Kriging neighborhood analysis was performed for all uniform conditioning domains (gold and sulfide sulfur) in Supervisor, using the following: • Establish optimum panel size by maximizing the kriging efficiency and slope of regression; Lihir Operations Papua New Guinea Technical Report Summary Date: February 2026 Page 11-3 • Select the minimum and maximum sample limits by maximizing slope of regression while at the same time ensuring that the percentage of negative kriging weights is approximately <2%; • Maximize the search ellipse ensuring that the previously-established slope of regression and negative kriging weight thresholds are not violated. The analysis was not performed for the minor elements (silver, copper, arsenic, carbonate, calcium, and molybdenum) respectively, as the number of samples available was usually insufficient. 11.8.2 Gold and Sulfide Sulfur Grade Estimation Gold and sulfide sulfur were estimated with the non-linear UC method into large 100 x 100 x 12 m panels in their respective domains. The panel UC grade–tonnage curve was subdivided into 20 x 20 x 12 m selective mining unit (SMU) blocks for the final output model. Vulcan and Isatis Neo versions of UC were compared, and checked against the internal UC code. These tests indicated that Isatis was is the preferred software and was used for all UC estimates. Gold and sulfide sulfur boundaries were hard to semi-soft. Local uniform conditioning (LUC) post-processing from the UC panels was performed in Isatis using a proportional panel to the SMU method. 11.8.3 Minor Element Estimation Minor elements (silver, copper, arsenic, carbonate, calcium, and molybdenum) were estimated directly into the blocks using ordinary kriging. All estimations were done in Isatis, and semi soft boundary conditions were used between the argillic, epithermal and porphyry domains. 11.9 Validation The main purpose of comparing input versus output grades was to detect gross errors in estimation parameters or input data. In general, the LUC gold and sulfide sulfur grades were close to the declustered composites . Additionally, the LUC grades were comparable to the declustered composite in swath plots. The metal at risk analysis showed the estimated mean grade when compared to the simulated grade distribution was within acceptable ranges. Validation on the other elements, given the lack of detailed data in comparison to the gold and sulfide sulfur data, were considered acceptable. Overall, the validation results for all estimated variables are considered acceptable. The block model and composites were examined in plan and section views to ensure no obvious errors. No major errors were detected. Means of the declustered composites were compared by model domains, and found to be acceptably similar. A comparison using nearest-neighbor methods to the panel and LUC estimates showed the means of the panels, blocks, and NN declustered composites were comparable. A review of swath plots indicated no major biases. Lihir Operations Papua New Guinea Technical Report Summary Date: February 2026 Page 11-4 Grade–tonnage curves for all models were compared with grade–tonnage curves generated from the theoretical discrete Gaussian model change of support. No material flaws were noted. The direct block simulation methodology available in Isatis 2016.2 was used to generate 100 realizations of the gold grade using the gold domains as per the resource model. The direct block simulations were validated through comparison with actual historical production, and the simulations compared well to the production data. Overall, the validation results for all estimated variables are considered acceptable. 11.10 Reconciliation Reconciliation based on blast hole sampling is considered to be acceptable, and the results are adequate to provide validation support for the mineral resource estimate. 11.11 Confidence Classification of Mineral Resource Estimate 11.11.1 Mineral Resource Confidence Classification Mineral resources were classified as either indicated or inferred mineral resources. According to Newmont guidelines, the average distance of the closest three drill holes is used as the primary criterion for defining classification. In September 2024 the mineral resource classification was updated to align with the Newmont standard based on a drill hole spacing study completed in July 2024. The current confidence classification spacing is shown in Table 11-1. Table 11-1: Resource Classification Spacing Resource Confidence Classification X Y Z (m) (m) (m) Indicated ≤52 ≤52 ≤52 Inferred ≤100 ≤100 ≤100 11.11.2 Uncertainties Considered During Confidence Classification Following the analysis in Chapter 11.11.1 that classified the mineral resource estimates into the indicated and inferred confidence categories, uncertainties regarding the continuity of ore at selective mining unit level were also assessed and an additional risk code was incorporated on top of the defined classification to reduce the operational risk. In addition, sampling and drilling methods, data processing and handling, geological modelling, estimation, geometallurgical and geotechnical risk assessments were incorporated into the overall resource confidence classifications. Lihir Operations Papua New Guinea Technical Report Summary Date: February 2026 Page 11-5 11.12 Reasonable Prospects of Economic Extraction 11.12.1 Input Assumptions Mineral resources were constrained within a conceptual pit shell and reported above a marginal cut-off grade that used the parameter assumptions listed in Table 11-2. Table 11-2: Inputs for Marginal Cut-off Grade (Mineral Resource) Item Unit Value Gold price US$/oz 2,300 Royalty % 2.0 Mining levy % 0.5 Treatment charges/refining charges US$/oz 2.08 Average processing unit cost including stockpile reclaim cost US$/t milled 34.9 G&A & sustaining capital US$/t milled 18.6 Total US$/t milled 53.5 Modelled recovery % 72 Marginal cut-off g/t Au 1.00 Cost inputs for pit optimization purposes were based on the cost model developed for the 2026 budget plan base case scenario. 11.12.2 Commodity Price Commodity prices used in mineral resource estimation are based on long-term analyst and bank forecasts established by Newmont. An explanation of the derivation of the commodity prices is provided in Chapter 16.2. The estimated timeframe used for the price forecasts is the 17-year LOM that supports the mineral reserve estimates. 11.12.3 Cut-off Mineral resources are reported using a marginal cut-off grade, determined using the parameters in Table 11-2. Cost inputs for marginal cut-off grade purposes were based on the cost model developed for the 2026 budget (2026BP) base case scenario. This cost model was derived from the adjusted for LOM plan scheduled activity levels and updated long-term economic parameters. Adjustments were made to reduce general and administrative (G&A), sustaining capital and other overhead costs at the end of the mining period (stockpile feed only period). The costs from the stockpile feed-only period are used to support the marginal cut-off grade. The mineralization and resource model extents continue offshore. A seaward limit was imposed on the resource shell optimization based on an alignment of a conceptual outer seepage barrier to constrain the mineral resource estimate on the eastern extent. The conceptual barrier


Lihir Operations Papua New Guinea Technical Report Summary Date: February 2026 Page 11-6 alignment is to the east of the original shoreline located on the harbor waste platform, and represents the maximum seaward extent of reasonable mining scenarios for open pit mining. 11.12.4 QP Statement The QP is of the opinion that any issues that arise in relation to relevant technical and economic factors likely to influence the prospect of economic extraction can be resolved with further work. The mineral resource estimates are performed for a deposit that is in a well-documented geological setting; the district has seen nearly a decade of active open pit operations conducted by Newmont and tis predecessors; Newmont is familiar with the economic parameters required for successful operations in the PNG area; and Newmont has a history of being able to obtain and maintain permits, social license and meet environmental standards in PNG. There is sufficient time in the 18-year timeframe (processing ends in 2043)considered for the commodity price forecast for Newmont to address any issues that may arise, or perform appropriate additional drilling, testwork and engineering studies to mitigate identified issues with the estimates. 11.13 Mineral Resource Statement Mineral resources are reported using the mineral resource definitions set out in SK1300 on a 100% basis. Newmont holds a 100% Project interest. The estimates are current as at December 31, 2025. The reference point for the estimates is in situ or in stockpiles. Mineral resources are reported exclusive of those mineral resources converted to mineral reserves. Mineral resources that are not mineral reserves do not have demonstrated economic viability. The Qualified Person for the estimate is Mr. Shaun Chanter, RM SME, Head Reserve Governance - Global, a Newmont employee. Measured and indicated mineral resources are provided in Table 11-3. Inferred mineral resources are shown in Table 11-4. Lihir Operations Papua New Guinea Technical Report Summary Date: February 2026 Page 11-7 Table 11-3: Measured and Indicated Mineral Resource Statement Mineral Resource Confidence Category Area Tonnage (kt) Grade (g/t Au) Contained Metal (koz Au) Measured — — — — Indicated Open pit 36,500 1.99 2,300 Stockpiles 1,000 2.11 100 Total Measured and Indicated 37,500 1.99 2,400 Table 11-4: Inferred Mineral Resource Statement Mineral Resource Confidence Category Tonnage (kt) Grade (g/t Au) Contained Metal (koz) Inferred 239,800 2.4 18,300 Notes to accompany mineral resource tables: 1. Mineral resources are current as at December 31, 2025. Mineral resources are reported using the definitions in SK1300 on a 100% basis. The Qualified Person responsible for the estimate is Mr. Shaun Chanter, RM SME, Head Reserve Governance - Global, a Newmont employee. 2. The reference point for the mineral resources is in situ or in stockpiles. 3. Mineral resources are reported exclusive of mineral reserves. Mineral resources that are not mineral reserves do not have demonstrated economic viability. 4. Mineral resources that are potentially amenable to open pit mining methods are constrained within a conceptual pit design. Parameters used are shown in Table 11-2. Mineral resources in stockpiles are reported above a 1.0 g/t Au cut-off. 5. Tonnages are metric tonnes. Gold ounces are estimates of metal contained in tonnages and do not include allowances for processing losses. 6. Rounding as required by reporting guidelines may result in apparent differences between tonnes, grade and contained metal content. Tonnes are rounded to the nearest 100,000 tonnes. Ounces are rounded to the nearest 100,000 ounces. 11.14 Uncertainties (Factors) That May Affect the Mineral Resource Estimate Areas of uncertainty that may materially impact the mineral resource estimates include: • Changes to long-term gold price and exchange rate assumptions; • Changes in local interpretations of mineralization geometry and continuity of mineralized zones; • Changes to geological shape and continuity assumptions; • Changes to metallurgical recovery assumptions; • Changes to the operating cut-off assumptions for open pit mining methods; • Changes to the input assumptions used to derive the pit design used to constrain the estimate; Lihir Operations Papua New Guinea Technical Report Summary Date: February 2026 Page 11-8 • Changes to the marginal cut-off grade assumptions used to constrain the estimate; • Variations in geotechnical, hydrogeological, and mining assumptions; • Changes to environmental, permitting, and social license assumptions. The mineral resource estimate assumes successful completion of an outer seepage barrier (OSB) to support continued mining below sea level. A portion of the mineral resource estimate assumes that mining near Ailaya Rock is feasible and acceptable to the local community. There are no other environmental, legal, title, taxation, socioeconomic, marketing, political or other relevant factors known to the QP that would materially affect the estimation of mineral resources that are not discussed in this Report. Lihir Operations Papua New Guinea Technical Report Summary Date: February 2026 Page 12-1 12.0 MINERAL RESERVE ESTIMATES 12.1 Introduction Mineral reserves are reported using open pit mining assumptions. Indicated mineral resources were converted to probable mineral reserves. Inferred mineral resources within the mine plan are set to waste. 12.2 Mineral Reserve Inputs and Assumptions 12.2.1 Inputs Key inputs and assumptions are based on calendar years, as summarized in Table 12-1. Table 12-1: Inputs for Marginal Cut-off Grade (Mineral Reserve) Item Unit Value Gold price US$/oz 2,000 Royalty % 2.0 Mining levy % 0.5 Overall mining costs (ex-pit) US$/t mined 12.43 Direct costs attributed to ex-pit US$/t mined 7.12 Direct costs attributed to rehandle US$/t mined 7.34 Treatment charges/refining charges US$/oz 2.08 Average processing unit cost including stockpile reclaim cost US$/t milled 37.37 G&A US$/t milled 14.03 Modelled recovery % 76 Marginal cut-off g/t Au 1.00 Average LOM sustaining capital of US$1.8B (US$8.0/t milled) and G&A costs of US$14.0/t milled were included in the optimization. The resulting average metallurgical recovery for the mine life is 76%. Cost inputs are based on the 2026 business plan (2026BP) cost model and adjusted for LOM application inclusive of long-term economic parameters as per Newcrest’s economic parameters. These inputs were accepted by Newmont. Mining costs include; operating costs for drill and blast, load and haul, waste disposal by barge, ancillary equipment, and mining related overheads. Processing unit costs were broken down by plant activity to allow a choice of two processing routes (direct to autoclave, or via flotation). Fixed costs per period for G&A, plant maintenance, plant overheads, and power were divided by the nominal mill throughput to provide a unit cost per tonne processed for optimization purposes.


Lihir Operations Papua New Guinea Technical Report Summary Date: February 2026 Page 12-2 Sustaining capital costs for fleet replacement, plant maintenance and capital for other sustaining capital projects were also divided by the nominal mill throughput to provide a unit cost per tonne processed for optimization purposes. 12.2.2 Pit Optimization Considerations Pit optimization using Whittle software was performed to produce optimized shells on which to assist the final mineral reserves design and intermediate cutbacks. A lateral cutback mining strategy was used to progress into the Kapit zone. This strategy includes considerations for seepage barrier construction, minimizes water management and pit dewatering. Several sequential cutbacks were developed for the mineral reserves contained in the ultimate phase design (Figure 12-1). Cutbacks within the Kapit zone were developed in lateral sequence northwards to facilitate pit cooling and drainage. Allowance was made for a seepage barrier between along the pit eastern crest to effectively reduce seepage into the active pit void. Cutback designs conform to open pit design procedures established for the Lihir deposit, which include 32–40 m wide ramps at 10% gradient, and a minimum mining width of 40 m. The final pit design incorporates provision for diversion drainage around the pit crest to manage run-off from the caldera slopes. The planned final dimensions of the pit are approximately 2,000 x 1,400 m, with a final depth of approximately 350 m below sea level. 12.3 Ore Loss and Dilution Internal dilution was considered in the resource model. External dilution as a result of sheeting (low grade competent material rehandled with active phases) was applied. Sheeting estimates are supported by reconciliation of mine operations over the last several years. A 3% ore loss was applied as a result of blasting and mining efficiency, reflective of the mining method. The figure is based on reconciliation data between the resource model and mill performance. 12.4 Stockpiles As the Lihir Operations are constrained by the ore tonnes that can be processed by the mill, only the higher-grade fraction of ore is processed through the mill while the lower-grade fraction is stored in long-term stockpiles. As a result, a period of low-grade stockpile processing is expected at the end of the mine life when mining operations are completed (see also discussion in Chapter 13.6). Lihir Operations Papua New Guinea Technical Report Summary Date: February 2026 Page 12-3 Figure 12-1: LOM Pit Phase Plan Note: Figure prepared by Newmont, 2025. Lihir Operations Papua New Guinea Technical Report Summary Date: February 2026 Page 12-4 12.5 Mineral Reserve Statement Mineral reserves are reported using the mineral reserve definitions set out in SK1300 on a 100% basis. Mineral reserves are current as at December 31, 2025. The reference point for the mineral reserve estimate is as delivered to the process facilities. Mineral reserves are reported in Table 12-2. The Qualified Person for the estimate is Mr. Shaun Chanter, RM SME, Head Reserve Governance - Global, a Newmont employee. Table 12-2: Proven and Probable Mineral Reserve Statement Mineral Reserve Confidence Classification Area Tonnage (kt) Grade (g/t Au) Contained Metal (koz Au) Proven — — — Probable Open pit 147,900 2.55 12,100 Stockpiles 72,300 1.65 3,800 Total proven and probable 220,200 2.26 16,000 Notes to accompany mineral reserves table: 1. Mineral reserves current as at December 31, 2025. Mineral reserves are reported using the definitions in SK1300 on a 100% basis. The Qualified Person responsible for the estimate is Mr. Shaun Chanter, RM SME, Head Reserve Governance - Global, a Newmont employee. 2. The reference point for the mineral reserves is the point of delivery to the process plant. 3. Parameters used are shown in Table 12-1. Mineral Reserves in stockpiles are reported above a 1.0 g/t Au cut-off. 4. Tonnages are metric tonnes. Gold ounces are estimates of metal contained in tonnages and do not include allowances for processing losses. 5. Rounding as required by reporting guidelines may result in apparent differences between tonnes, grade and contained metal content. Tonnes are rounded to the nearest 100,000 tonnes. Ounces are rounded to the nearest 100,000 ounces. 12.6 Uncertainties (Factors) That May Affect the Mineral Reserve Estimate Areas of uncertainty that may materially impact the mineral reserve estimates include: • Changes to long-term gold price assumptions; • Changes to exchange rate assumptions; • Changes to the resource model or changes in the model reconciliation performance including operational mining losses; • Changes to geometallurgical recovery and throughput assumptions; • Changes to the input assumptions used to generate the open pit design; • Changes to operating, and capital assumptions used, including changes to input cost assumptions such as consumables, labor costs, royalty, and taxation rates; Lihir Operations Papua New Guinea Technical Report Summary Date: February 2026 Page 12-5 • Variations in geotechnical and mining assumptions; including changes to designs, schedules, and costs, as a result of changes to geotechnical, hydrogeological, geothermal, and engineering data used; • Changes to assumptions as to pit cooling, seepage barrier and nearshore soil barrier development and operation; • Ability to source sufficient quality water supplies to support process plant operations; • Changes to the assumed permitting and regulatory environment under which the mine plan was developed; • Continued ability to use sub-sea waste disposal methods; • Ability to maintain mining permits and/or surface rights; • Ability to maintain social and environmental license to operate. Ongoing mining adjacent to, and to the west of, Ailaya Rock will require continued community acceptance. The mine plan in that area uses steep wall mining techniques. Geotechnical monitoring will be a critical control. Cut-off grades used in the mine plan assume that future cost reductions at the end of the LOM can be achieved. The mine plan assumes that the existing permitting area for marine tailings and waste disposal can be expanded as required in the LOM plan. There are no other known environmental, legal, title, taxation, socioeconomic, marketing, political or other relevant factors known to the QP that would materially affect the estimation of mineral reserves that are not discussed in this Report.


Lihir Operations Papua New Guinea Technical Report Summary Date: February 2026 Page 13-1 13.0 MINING METHODS 13.1 Introduction Production mining is conducted by Newmont using Owner-operated equipment fleet and an Owner workforce. A separate mining contractor operation using a smaller pioneering fleet is used to develop new working areas on the steep caldera slopes. Production mining is by conventional open pit method, using a fleet of 600/500 t class (operating weight) hydraulic face shovels loading into 135 t capacity rear-dump haul trucks, with a recently demonstrated mining rate of 30–35 Mt/a ex-pit. Ore and waste are drilled and blasted on 12 m benches and mined in a single pass. Where practicable, walls are drilled with a pre-split to assure stable wall rock conditions. The ground is frequently too hot for conventional explosives, requiring high-temperature blasting products and specialized blasting procedures for mining in hot ground. A majority of ex-pit ore is allocated by gold and sulfur grade into a blend plan agreed with process plant staff along with existing stockpiled ore. Mill feed is based on the blend plan and can be comprised of reclaimed ore from the ROM stockpiles, direct ex-pit ore, and existing stockpile ore. Waste rock from the mine is either placed into 1,500 t capacity barges for off-shore submarine disposal, dumped on a harbor base waste platform, used as in-pit backfill or stockpiled for use as road base, bench sheeting, stemming, or construction fill. Submarine waste disposal is carefully planned and controlled to achieve a continuous rill along the steeply-sloping sea floor and minimize the potential for uncontrolled slumping. 13.2 Geotechnical Considerations The Lihir geotechnical slope model was developed in conjunction with recommendations from external consultants. Slope performances that have been continuously monitored and reviewed were also been considered, verifying the nominated slope recommendation. For design purposes, the geotechnical slope parameters have been divided into 118 contiguous domain that are expected to exhibit similar geotechnical properties. These domains are typically related to the alteration boundaries and further sub-divided based on further geotechnical modelling based on geotechnical properties. The extents of these domains cover the full resource model framework. Within each domain an appropriate inter-ramp angle, batter face angle and berm width configurations for pit designs were nominated. Inter-ramp angles varied from 15–55° with batter angles varying from 25–80º. Geotechnical domains and associated parameters are provided in Table 13-1 with an illustration of the geotechnical domain distribution at the end of the mine life provided in Figure 13-1. Lihir Operations Papua New Guinea Technical Report Summary Date: February 2026 Page 13-2 Table 13-1: Geotechnical Zones Grouped By Inter-Ramp Angle (v10.6) Inter-ramp Angle (º) Bench Height (m) Bench Face Angle (º) Berm Width (m) Number Of Domains 15 12 25 18 1 18 12 25 11 4 20 12 40–25 18–7 18 22 12 28 7 3 24.5 12 40 12 1 25 12 50–35 16–8.6 5 26 12 35 7 5 28 24 35 10 1 29 12 36 5 1 30 12 50–45 11–8.8 4 32 12 50 9.1 2 34 12 48 7 1 35 12 65–45 12–5 14 36 12 50 6.5 3 40 12 65–55 8.5–5.9 2 43 12 80–60 10–6 9 45 24–12 75–60 13–5 14 48 12 63 4.7 1 49 24–12 70–67 12–6 4 50 24–12 70–60 11.5–4.5 4 51 24 67 9 1 53 24–12 80–70 9.5–6.8 2 54 12 75 5.5 1 55 24–12 75–65 10.5–4 17 10–55 12–24 25–80 4–42 118 Lihir Operations Papua New Guinea Technical Report Summary Date: February 2026 Page 13-3 Figure 13-1: Pit Slope Design Inter-Ramp Angles Note: Figure prepared by Newmont, 2024. IRA = inter-ramp angle. Lihir Operations Papua New Guinea Technical Report Summary Date: February 2026 Page 13-4 Extensive prism, pit face radar and geotechnical monitoring of pit slopes and seismic monitoring is undertaken. 13.3 Hydrogeological Considerations The Lihir Operations receives on average 4.4 m of annual rainfall, with surface water from large- scale rainfall events dominating water inflow (approximately 85%) to be managed with the active open pit. Groundwater inflow provides a lesser contribution to pit void inflows and is proportioned between groundwater interflow via the Luise Caledra from the west and seawater inflows to the east. Historically dewatering has involved dedicated dewatering wells. However, the use of these well field ceased in approximately 2017. Currently both surface water and groundwater inflows and active mine dewatering and depressurization are managed via: • Passive depressurization using horizontal drain holes and steam relief wells; • Active dewatering using in-pit sump surface water management facilities These systems are incorporated into the LOM and staged pit designs. The largest challenge for mine dewatering is surface water management, particularly managing the rainfall runoff from the Luise Caldera slopes and catchments. The current design and operational strategies are to intercept and divert surface water runoff via dedicated pit diversion drains, installed around the pit crest perimeter into the Luise Harbor. The current drains and future designs aim to divert and re-purpose ex-pit non-contact surface water (for water supply) as much as possible. All water within the diversion drains, produced from losses from diversion, direct rainfall recharge, seawater seepage and horizontal holes, are managed and extracted using pit floor sumps. A fleet of diesel-powered pumps as used for dewatering within the currently active phase 9 and phase 14 pits. These pumps transfer water to an intermediate transfer station prior to discharge to the main diversion drains, which flow directly to the approved discharge compliance point in the Luise Harbor. 13.4 Geothermal Considerations The Luise Caldera is still geothermally active, with temperature modelling indicating current rock temperatures in some areas within the ultimate pit design exceeding 100oC. The active zone is extensive within the Kapit area. Areas with rock temperatures greater than 100oC can cause groundwater to instantaneously flash to steam when confining pressure is released by mining, with the potential for rock outburst events to occur. Potential geothermal outburst areas are managed using the methods outlined in the following subsections. 13.4.1 Geothermal Depressurization and Pit Cooling Geothermal depressurization for the Kapit area has been underway since 2004, using a program of steam relief and horizontal drain holes. Monitoring systems are in place to check the effectiveness of these systems.


Lihir Operations Papua New Guinea Technical Report Summary Date: February 2026 Page 13-5 Progressive projects and studies continue to test the practicality and effectiveness of additional mining controls to practically achieve planned mining rates through hot mining areas. 13.4.2 Hot Ground Mining Methods Current operational technology allows mining of hot ground to ground temperatures of up to 165ºC, after which the bulk explosive formulation required for production blasting becomes a constraint. The potential for geysering from blast holes, or for geothermal outburst areas is identified through a combination of historical domain performance, blast-hole or probe-hole monitoring, and daily dig-face temperature measurement. A procedure is used to control all mining activities in areas identified as containing potential geothermal outburst areas. This includes specific training, demarcation, minimum distances between working shovels and other equipment or personnel, surface drainage, explosives loading, quarantining of ground after blasting, bullet-proof glass in dig equipment, and other hot ground management practices. In some cases, hot ground must be exposed and left to cool before mining. Additional projects and trials to mitigate the risk to mining activities in hot ground, and to extend successful blasting and mining of ground with temperatures of >170ºC are under evaluation. 13.5 Operational Considerations Development of the Kapit area of the open pit will require the following: • The proximity of the Kapit pit sector to the shoreline requires the construction of a seepage barrier or cut-off wall, just off the original Kapit shoreline in the shallows of Luise Harbor. The nearshore soil barrier (NSB) will be a significant structure and will be engineered to cope with earthquake and tsunami events. The final design is being completed by a specialist engineering firm and will be independently reviewed; • Construction of a perimeter drainage channel around the Kapit pit sector to divert rainfall run-off from the caldera slopes around the pit footprint; • Geothermal cooling and depressurization of the Kapit pit sector to a temperature at which mining can be safely undertaken. 13.5.1 Consideration of Marginal Cut-off Grades Material above the marginal cut-off grade of 1.0 g/t Au is stored in long-term stockpiles for processing after the end of mine life. The marginal cut-off grade assumes a reduction in sustaining capital and G&A costs at the end of mine life, allowing marginal material to be economically processed. The lower recovery reflects the higher proportion of low grade feed in the blend to the mill (Table 13-2). Lihir Operations Papua New Guinea Technical Report Summary Date: February 2026 Page 13-6 Table 13-2: Mineral Reserve Marginal Cut-off Grade Input Assumptions LOM Plan Unit Assumption Gold price US$/oz 2,000 Royalty % 2.0 Mining levy % 0.5 Treatment charges/refining charges US$/oz 2.08 Average processing unit cost including stockpile reclaim US$/t milled 33.3 G&A & sustaining capital US$/t milled 13.8 Total US$/t milled 47.1 Modelled recovery % 72 Marginal cut-off g/t Au 1.0 13.5.2 Operational Cut-off Grades An elevated cut-off strategy is employed, where only high- and medium-grade material is fed to the mill, while the lower-grade fraction is stockpiled for later processing. On an annual basis from 2027–2034, an average of approximately 9% of ore mined will be sent to long-term low-grade stockpiles. High-grade ore (typically >3 g/t Au) is prioritized to the plant first, while medium-grade ore (1.6–3 g/t Au) is blended to achieve the required feed properties of ore type and sulfur grade. The planned cut-off between medium-grade and low-grade material can be adjusted if needed, depending on ore supply and phase development. 13.5.3 Grade Control and Production Monitoring All blast holes in ore zones are sampled and assayed to allow grade control mark-up and to update the grade control model. Dig block inventory is reconciled against the grade control and resource models on a monthly basis to assess resource model performance. When longer-term trends are identified, corrections are undertaken to the resource model if required. 13.6 Production Schedule The mine production schedule includes several phases that first progress through the Kapit ore body after which concluding in the final Minifie pit sector phases. Stockpile material is reclaimed as required to maximize mill throughput. By 2043, ex-pit and stockpile inventories will be depleted and processed. The ex-pit mining rate ranges from 28–35 Mt/a until 2034 and then reduces to an average of 16 Mt/a from 2035– 2040 as stockpile feed becomes the majority ore source. The LOM production schedule is included in the cash flow analysis in Chapter 19. Lihir Operations Papua New Guinea Technical Report Summary Date: February 2026 Page 13-7 13.7 Blasting and Explosives An emulsion plant facility has been constructed on site, significantly enhancing manufacturing capacity and improving mobile processing unit cycle times. In addition, a new mobile processing unit, capable of deploying bulk presplit product, was acquired to support pit operations. A total of three mobile processing units now operate daily to deliver product to the pit. Due to potentially elevated ground temperatures, explosives were not slept in the ground for more than 12 hours, requiring daily blasting. The explosives’ new emulsion formulation introduced to cater for the increased ground temperatures expected in the Kapit pit sector, has a upper operating temperature capability of 165°C. All blasts are remotely initiated via radio control following pit clearance. Additionally, Newmont is strengthening onsite temperature and reactive ground monitoring through procedural changes and expanded laboratory testing programs. 13.8 Mining Equipment The current mining fleet is listed in Table 13-3 (primary) and Table 13-4 (secondary/support). A contractor fleet of ancillary equipment is also used for road maintenance and drainage, mobile crushing services, pioneering work, and other minor project work where required. There are no other material changes to the equipment fleet that are currently planned. Newmont is currently reviewing mining rates, waste disposal options, stockpile feed sequences, processing assumptions including material blend constraints, and the relationship to the planned ex-pit mining sequence. Outcomes from these reviews could lead to changes in mining rate and/or equipment requirements in the future. Table 13-3: Primary Mine Fleet Purpose Equipment Type Units Excavator/face shovels Cat 6020 2 Cat 6060 4 RH200 1 EX2600 2 EX1200 1 Primary trucks Cat 785D 39 Cat 777F 10 Drills D55 Atlas Copco 1 D65 Atlas Copco 4 PV231 2 Barge Aiguool (DA721) 1 Amoroilio (DA722) 1 Alawir (DA723) 1 Amaniel (DA724) 1 Lihir Operations Papua New Guinea Technical Report Summary Date: February 2026 Page 13-8 Table 13-4: Secondary/Support Mine Fleet Purpose Equipment Type Units Dozers D10T 8 D11T 6 Wheel dozers CAT 834 2 Front-end loaders Cat 992k 4 Low loader truck and trailer Cat 785C 1 Grader Cat 18M 5 Support trucks Cat777 Serv 2 Cat773 Serv 2 Cat777 Water truck 2 Support excavators Cat 336G/GC 6 Cat 390 2 Rock breaker Cat 390 2 Tire handler Cat 966 2 13.9 Personnel There are a total of 2,320 personnel in mine operations including operations and maintenance.


Lihir Operations Papua New Guinea Technical Report Summary Date: February 2026 Page 14-1 14.0 PROCESSING AND RECOVERY METHODS 14.1 Process Method Selection As the gold mineralization is refractory, the plant consists of crushing and grinding followed by partial flotation, pressure oxidation, and then recovery of gold from washed oxidized slurry using conventional cyanidation. The plant was first commissioned in 1997 and has undergone a number of alterations and expansions (refer to discussion in Chapter 10), which has allowed for improvements in the throughput rate. The testwork discussed in Chapter 10, in conjunction with operational results, were used to refine plant operations. A throughput rate of approximately 12.5 Mt is targeted in the LOM plan. 14.2 Flowsheet The process flowsheet is provided in Figure 14-1 and Figure 14-2. Lihir Operations Papua New Guinea Technical Report Summary Date: February 2026 Page 14-2 Figure 14-1: Simplified Process Flow Sheet (Part A) Note: Figure prepared by Newcrest, 2020. Lihir Operations Papua New Guinea Technical Report Summary Date: February 2026 Page 14-3 Figure 14-2: Simplified Process Flow Sheet (Part B) Note: Figure prepared by Newcrest, 2020. Lihir Operations Papua New Guinea Technical Report Summary Date: February 2026 Page 14-4 14.2.1 Crushing and Milling Ore is crushed in two primary crushing circuits. The first circuit consists of a 42–65” gyratory crusher and an MMD toothed rolls crusher. Competent ore is crushed in the gyratory crusher and softer ore types in the MMD crusher. Both crushers discharge on to an overland conveyor and then to a radial stacker for stockpiling ahead of the grinding circuits. The second primary crushing circuit, installed during the 2010–2012 MOPU plant expansion, consists of two jaw crushers operating in parallel. Separate overland conveyors are used. There are three grinding circuits. One circuit (HGO2) generally treats high grade ore that is fed direct to the downstream oxidizing autoclaves. The second and third circuits (FGO circuit and HGO circuit) are generally directed to the flotation plants. However, all three circuits can be directed to flotation or direct to the autoclaves as necessary. All three grinding circuits have a primary semi-autogenous grind (SAG) mill followed by a secondary ball mill in closed circuit with classifying hydrocyclones. Pebbles from the HGO and HGO2 circuits are combined and directed to two cone pebble crushers. Crushed pebbles are directed back to the HGO mills. The current capacity of the HGO, FGO and HGO2 mills is approximately 5.0, 4.5 and 5.0 Mt/a respectively. Ground ore is thickened and washed in a one or two stage grinding thickener counter-current decant (CCD) washing circuit with raw water to minimize chloride concentration in the autoclave feed. 14.2.2 Flotation Two rougher flotation circuits are installed. No concentrate cleaning is practiced. In the first, older, flotation circuit, ground ore from the FGO circuit mill is subjected to simple bulk rougher flotation in a single roughing stage consisting of a bank of five 150 m3 flotation tank cells (2007 installation). In the second, newer, (2013 installation) circuit ground flotation ore from the HGO and/or HGO2 circuit mill is processed by five 300 m3 flotation tank cells. The flotation circuit operates with a high mass recovery (pull) to flotation concentrate in the range of 30–45%. Flotation concentrate is directed to the grinding thickeners, and a portion of the flotation tails are directed to cyclones for partial recovery of mainly cyanide-soluble gold. 14.2.3 Flotation Tailings Gold Recovery Partial recovery of gold from flotation tailings is practiced. Following earlier partial recovery of gold in flotation tailings in 2015, a dedicated flotation tailings treatment system was commissioned in 2017. Flotation tailings are directed to two separate hydrocyclone clusters (one for FGO floats and one for HGO floats) where a separation based on size is completed. Gold in recovered fines can be recovered by direct cyanidation at up to 50–75% recovery. A flowsheet showing the process is provided in Figure 14-3.


Lihir Operations Papua New Guinea Technical Report Summary Date: February 2026 Page 14-5 Figure 14-3: Flotation Tailings Gold Recovery Note: Figure prepared by Newcrest, 2020. The fines are recovered at a cut-size of 40 µm and sent to a re-purposed thickener. After thickening to about 30–40% solids, the fines are then pumped to the autoclave discharge tanks, thereby effectively by-passing the autoclaves. Hydrocyclone underflow coarse solids are directed to tailings for disposal. 14.2.4 Pressure Oxidation Oxidation of the gold-bearing pyrite is undertaken via pressure oxidation in autoclaves to render gold particles in the sulfide ore amenable to cyanidation. The operating window is largely set by limits on the autoclave operations as follows: • Minimum feed sulfide sulfur of 5.0% w/w; • Maximum feed sulfide sulfur of 9.5% w/w; • Minimum sulfide sulfur oxidation of 50%; • Minimum oxidation–reduction potential (ORP) of 360 mV (ref Ag–AgCl in flash tank discharge); • “Front end” temperature limitations. Thickened ore slurry is pumped to four parallel autoclave circuits via six slurry storage tanks. The buffer between the milling and autoclave circuits helps stabilize autoclave operations. Conventional gold processing Sherritt autoclave technology at a temperature of 210°C and a total pressure of 2,400 kPag is used. Feed slurry can be first preheated in the heat recovery vessels, before being pumped under pressure to each of the eight agitator horizontal autoclave vessels. Lihir Operations Papua New Guinea Technical Report Summary Date: February 2026 Page 14-6 If sulfide sulfur grades are high enough, operation without pre-heating is possible and is often practiced. Pure oxygen (approximately 98% v/v) from three operating cryogenic oxygen plants is injected into the autoclaves to oxidize approximately 50–90% of the sulfide minerals (predominantly pyrite). Each autoclave has a single stage of slurry temperature and pressure let-down by steam flashing. For the original, smaller, autoclaves 1, 2 and 3, flashed steam can be used in the direct contact pre-heater vessel. Flash steam from the newer autoclave 4 is not recovered for the purposes of slurry pre-heating. 14.2.5 Counter-Current Decant Washing, Neutralization and Gold Recovery Oxidized slurry is washed to reduce acidity, and followed by gold recovery from the solids using conventional CIL technology. Oxidized slurry passes through two parallel trains of two-stage CCD circuits, where gold containing solids are washed with process water and seawater as required, reducing slurry acidity. The washed slurry is neutralized with lime slurry prepared by slaking imported quicklime. Gold is recovered from the neutralized slurry by cyanide leaching using CIL in a series of agitated tanks. The slurry is conditioned with lime in the first tank and cyanide is added to the second tank. The slurry is then agitated with granulated carbon in the absorption tanks and passes through the tanks while the carbon is retained by screens. Loaded carbon from the CIL circuit is stripped of gold in an elution system. The gold is eluted from carbon using hot caustic/cyanide solution and the carbon is then rinsed with water. The resulting gold solution is circulated through electro-winning cells where gold is recovered through electrowinning to form a gold sludge. The sludge is dried and smelted to produce doré bars, which are shipped to a refinery. Barren carbon is regenerated in two rotary kilns. 14.2.6 Residue Tailings The CIL leach residue tailings are detoxified by formation of strong metal complexes such as ferrocyanide, and through dilution with seawater (oxygen plant cooling water return). Under these conditions weakly acid-dissociable cyanide (CNWAD) converts to stable ferrocyanide. The tailings gravitate to a common disposal system which also collects the flotation tailings; remaining CCD wash water as well as oxygen plant and power plant cooling water return streams. The tailings disposal method is by deep sea tailings placement. The combined stream flow discharges through a de-aeration tank to the ocean via a pipeline outfall at a depth of approximately 115 m below sea level. The depth of the outfall discharge is below the surface mixed layer of the ocean. Being denser than the receiving seawater, the tailings gravitate down the steep submarine slope. Lihir Operations Papua New Guinea Technical Report Summary Date: February 2026 Page 14-7 14.3 Blending Strategy Ore blending prior to crushing assists in managing the significant mineralization variability that includes: • Gold and sulfide sulfur grade; • Split of barren (unreactive) and arsenian (reactive) pyrite; • Total carbonates; • Mineralogical variability particularly in terms of clay proportions and speciation; • Copper and other base metal impurities; • Lithology; • Hardness and abrasiveness; • Moisture; • Chlorides; • Sulfates and oxidized ores in general; • “As-blasted” ROM ore particle size. 14.4 Equipment Sizing A list of the key equipment is provided in Table 14-1. Lihir Operations Papua New Guinea Technical Report Summary Date: February 2026 Page 14-8 Table 14-1: Key Process Equipment Area Asset Manufacturer/Supplier Specifications Quantity Crushing Gyratory crusher Fuller Traylor Model 1067 x 1778 TCB OSS 125–200 mm 1 MMD sizer crusher MMD MMD sizer 1150, 300 kW 1 Jaw crushers Thyssen Krupp Model: EB 16-12 /N, Single toggle. Mouth: 1,600 x 1,200 mm 2 HGO SAG mills FLSmidth 5.5 MW, 8.53 m inside diameter (28 ft), 4.1m long (flange to flange), grate discharge, design ball charge of 15%, current target 15% 2 HGO ball mills FLSmidth 5.5 MW, 5.5 m inside diameter (18 ft), 9.75 m long (flange to flange), 13.46 rpm, overflow discharge 2 FGO SAG mill Outokumpu/Outotec 4.3 MW, 7.3 m inside diameter (24 ft), 5.1 m long (flange to flange). 9.5 to 12.7 rpm range, grate discharge, design ball charge of 12%, current target 15% 1 FGO ball mill Outokumpu/Outotec 4.3 MW, 5.5 m inside diameter (18 ft), 8.53 m long (flange to flange), 13.8 rpm, overflow discharge 1 Pebble crushers FLSmidth Raptor 500; second not fully installed 2 Flotation FGO flotation cells Outotec OK150 5 HGO flotation cells Outotec OK300 5 Autoclave feed slurry thickening & storage Grinding thickeners FLSmidth 48 m FLS thickeners, dual E-duct system, max 1,500 t/h (nominal 1,000 t/h), feed flow range 2,500–7,340 m3/hr 2 Autoclave feed slurry storage tank Sun Engineering Dimensions: 16.5 x 17.3 m tank; capacity: 3,500m3; duty: sulfide flotation concentration storage tank. Operating levels: low: 0.5 m, normal: variable between limits; high: 16.8 m, freeboard: 0.5 m. Operating pressure: atmospheric Carbon steel/rubber lined; corrosion allowance 1.6 mm 1 Autoclave feed slurry storage tank CBI Constructors (PNG) Pty Ltd Dimensions: 16.5 x 17.3 m; capacity: 3,527 m3; freeboard: 0.81 m Operating pressure: atmospheric Baffled, open top, mild steel, rubber-lined 5 Pressure oxidation Autoclave feed pre- heaters Hatch Engineering design Dimensions: 5.36 m (ID) x 12.656 m; 5 sets segmented splash baffle plates. 3


Lihir Operations Papua New Guinea Technical Report Summary Date: February 2026 Page 14-9 Area Asset Manufacturer/Supplier Specifications Quantity Design internal pressure: 200 kpa@150oC; normal operating: 13 kPa@103oC; max operating: 180 kPa@134oC Fluid volume >> operating: 64.2 m3, full: 340 m3 Autoclave feed pumps, autoclaves 1, 2 &3 Envirotech/Geho Positive displacement slurry pumps; variable frequency drive; duty Flow (m3/h) >> min: 85, normal: 165, rated: 270 Discharge pressure (kPa.a) >> Normal: 2,750, Rated: 3,100 NPSHA (kPa.a): >200; slurry temperature: 40–95oC; Motor rating/speed: 315 KW/1500 6 Autoclaves Sherritt Gordon 4.5 mID x 31.23 mL, 0.36 m spherical head; operating temperature range: 200–210oC; pressure > nominal: 2580 kPa, max: 2800 kPa; nominal O2 overpressure: 867 kPa (32% O2 overpressure control philosophy) 3 Flash vessels, autoclaves 1, 2 & 3 Evans Deakin Engineering Ltd 5.5 m (I.S) x 6.9 m (tangent to tangent or T–T), 25 mm thick vessel. Carbon steel with bromo-butyl rubber lining and acid brick lining. Design pressure: 200 kPa, design temperature > max: 150oC, min: 90oC 3 Quench vessels, autoclaves 1, 2 & 3 Vertical, 3.5 m dia (I.S) x 5 m T–T with SE heads, carbon steel membrane and acid brick lined. Design exit temperature: 80oC 3 Vent scrubber, autoclaves 1, 2 & 3 Venturi type with cyclonic separator; inlet vol: 5240 Am3/h @ 85oC, outlet vol: 5565 Am3/h @ 65oC; scrubber differential pressure: 10 kPa; cooling water rate: 3.8 L/sec @ 110 kPa 3 Autoclave feed pumps, autoclave 4 Weir Minerals Type: TZPM 1200; max flow: 475 m3/h, max discharge pressure: 3100 kPa, max stroke rate: 50 spm, power: 449 kW 3 Autoclave 4 5.600 m dia IS x 44.820 L T–T; operating volume = 865 m3; operating temperature range: 200–210oC; pressure > nominal: 2580 kPa, max: 2800 kPa; nominal O2 overpressure: 867 kPa (32% O2 overpressure control philosophy) 1 Flash vessels autoclave 4 5.5 m (I.S) x 7 m (T–T), 25 mm thick vessel. Carbon steel with bromo-butyl rubber lining and acid brick lining. Design pressure: 200 kPa, design temperature > max: 150oC, total vol: 197 m3 2 Quench vessels autoclave 4 Vertical, 3.6 m (I.S) x 5 m (T–T) with SE heads, carbon steel membrane and acid brick lined; operating temperature: 90oC, design temp: 150oC; total vol: 62 m3 2 Vent scrubber, autoclave 4 Units: SVS Size 27/60; inlet gas vol: 20,000 m3/h @ 80oC; outlet gas vol: 19,783 m3/h @ 30oC; cooling water rate: 4.5 L/sec @ 80kPa per nozzle, 3 nozzles 2 Lihir Operations Papua New Guinea Technical Report Summary Date: February 2026 Page 14-10 Area Asset Manufacturer/Supplier Specifications Quantity Oxidized slurry transfer tanks Walz Construction Diameter x height: 11.0 m inside x 6.0 m; material SAF2507; sacrificial plate, seal welded; acidic slurry @ 100oC 2 Oxygen plant Air products oxygen plant Air Products 27,929 kW/day; 1,700 t/d GOX capacity 1 Linde oxygen plant Linde CyroPlants 23,000 kW/day; 1,400 t/d GOX capacity 1 Air Liquide oxygen plant Air Liquide 5,000 kW/day; 240 t/d GOX capacity 1 Flotation tailings gold recovery Flotation tailings thickener Supaflo Technologies Pty Ltd Supaflo 26 m dia, high rate thickener, design feed flowrate: 1,556 m3/h, solid flux: 0.167 m2/t/d, 1 Autoclave discharge slurry washing CCD thickeners Supaflo Technologies Pty Ltd Tank diameter: 35.5 m; tank sidewall height: 6.2 m; Freeboard to liquid level, 0.6 m; 35.5 m dia x 6.2 m side wall height thickener, rubber-lined steel, flat bottom, HDPE floor 4 Neutralization, cyanidation, and adsorption (NCA) NCA 1 neutralization tank Diameter x height: 13.7 m inside x 18.0 m; operating temp: 36.8ºC; operating & design pressure: ATM; corrosion allowance: 1. 6 mm; rubber-lined; shell AS3679 GR250 & GR350 1 NCA 1 leach tank Diameter x height: 13.7 m inside x 18.0 m; operating temp: 36.8ºC; operating & design pressure: ATM; corrosion allowance: 1.6 mm; rubber-lined; shell AS3679 GR250 1 NCA 1 CIL tanks Diameter x height: 13.7 m inside x 15.0 m; operating temp: 36.8ºC; operating & design pressure: ATM; corrosion allowance: 1.6 mm; rubber-lined; shell AS3679 GR250 6 NCA 2 neutralization Tank Diameter x height: 14.2 m inside x 18.5 m; operating temp: 35ºC; operating & design pressure: ATM; corrosion allowance: 1.0 mm; shell ASTM A36; rubber- lined 1 NCA 2 leach tank Diameter x height: 14.2 m inside x 18.5 m; operating temp: 35ºC; operating & design pressure: ATM; corrosion allowance: 1.0 mm; shell ASTM A36; rubber- lined. 1 NCA 2 CIL tanks Diameter x height: 14.2 m inside x 18.5 m; operating temp: 35ºC; operating & design pressure: atmospheric; corrosion allowance: 1.0 mm; shell ASTM A36; rubber-lined 6 Carbon elution and regeneration NCA 1 acid wash pressure vessel Morton Engineering Co Pty Ltd Diameter x height mm: 1,620 x 11,900; mat: AS3678-250 plate; hydrotest pressure- 550 kPa; rubber lined – 6 mm; S135 paint spec 2 Lihir Operations Papua New Guinea Technical Report Summary Date: February 2026 Page 14-11 Area Asset Manufacturer/Supplier Specifications Quantity NCA 1 carbon elution column Pinnacle Engineering/Wacol, Brisbane Diameter (m) x height (m): 1,320 ID x 12,150 L; design pressure, kPa (g) / design temperature: °C 350 / 120; carbon elution column, 6 mm 316l SS, with two 316 SS wedge wire bayonet screens, insulation support rings, one wire- reinforced EPDM elastomer flanged chamber 1 NCA 2 acid wash pressure vessel Not applicable Not applicable 2 NCA 2 carbon elution column Pinnacle Engineering/Wacol, Brisbane Diameter (m) x height (m): 1,320 ID x 12,150 L; design pressure, kPa (g) / design temperature: °C 350 / 120; carbon elution column, 6 mm 316l SS, with two 316 ss wedge wire bayonet screens, insulation support rings, one wire- reinforced EPDM elastomer flanged chamber. 1 NCA 2 carbon reactivation kiln Metso Size: length x diameter – 16,121 x 2,781 x 4,417 mm; required motor voltage: 415 volts 1 NCA 1 carbon reactivation kiln Nutec Bickley Type: indirect fired (diesel fuel) rotary; model: RK850X8000; L x W x H (mm): 13,000 x 3,000 x 8,200; live operating capacity: 12 hrs (12 tonnes @ 1,000 kg/hr); 20 years design life 1 Gold room Electrowinning cells Knitted 430 SS; sludge removal type. 3.5 m3; 2 line of 2 cells, with rectifiers 4 Furnace, melting gold room Melting: tilting induction type, 30 L crucible capacity 1 Tailings Tailings de-aeration tank Size: length x diameter = 9.6 x 10 m; segmented; corrosion allowance: 4.0 mm; 12 mm bromo-butyl rubber lining; shell A3678-250 1 Lime production Lime slaking plant LS100 Newell Dunford Size: length x diameter – 2.3 x 2.2 m; required motor voltage: 132 kw; capacity 200 t/d dry lime, max 265 t/d 1 Lime slaking plant LS1100 Bradken Vertical stirred mill slaker, SM6018, 90 kW 1400 L capacity 1 Lime slaking plant LS2100 Lime Systems Size: length x diameter - 4 m diameter x 2.0 m ball mill; rubber-lined; double drive 150kW and 90 kW; mill speed 22.68 rpm; 8 dt/h capacity 1 Lihir Operations Papua New Guinea Technical Report Summary Date: February 2026 Page 14-1 14.5 Power and Consumables 14.5.1 Energy The average power demand from the process plant is 114 MW, with a peak demand of 130 MW. This demand is met from heavy fuel oil (HFO) generating sources. 14.5.2 Water The processing plant uses a combination of seawater, untreated fresh water, and various treated water streams (Table 14-2). The freshwater demand at the mine site is 84,560 m3/day, and process plant raw water supply is the largest demand, accounting for 84,375 m3/day. Processing can be affected by prolonged drought periods. Newmont has developed and implemented a water conservation strategy to support operations during periods of low rainfall. This includes recovery of fresh water from some flotation tailings, minimizing non-essential usage, maximizing use of seawater throughout the process plant, and maintaining a minimum base flow in the Londolovit River. Table 14-2: Water Type Usage Type Use Seawater Used for cooling the oxygen production plants and power station, quenching, and scrubbing in the pressure oxidation areas, and in the post-oxidation CCD circuit. Seawater is drawn from a screened intake chamber in the small boat harbor. The plant currently uses about 21,000 m3/hr of seawater. Untreated fresh water primarily used in the milling circuits and in the grinding thickeners for washing the ground ore and control of ore chloride concentrations. Some fresh water is provided from rainfall collection on site. Most of the fresh water is drawn from a small weir on the Londolovit River, situated approximately 8.4 km north of the process plant, and pumped via pipeline to the plant raw water storage tank and the thickener circuit. The maximum permitted extraction rate from the Londolovit River is 38,016,000 m3 annually. 14.5.3 Process Materials Key processing reagents are oxygen (generated on site), lime, and cyanide. Quick lime is imported in dedicated shipping containers. Cyanide is imported as sodium cyanide briquettes in 1 t bags and then dissolved in water for distribution to the cyanidation circuit. Other minor reagents are caustic and hydrochloric acid for gold recovery, collector and frother for flotation and flocculent for thickening. Grinding balls are imported in sea containers and stored in bunkers. 14.6 Personnel The process plant has a personnel count of 2,530, including plant operations and maintenance, but excluding shutdown labor.


Lihir Operations Papua New Guinea Technical Report Summary Date: February 2026 Page 15-2 15.0 INFRASTRUCTURE 15.1 Introduction The majority of surface infrastructure to support operations is in place, and includes: • One open pit; • Mine facilities: ROM stockpiles, low-grade stockpile, waste rock dumps, crushing facilities, explosives magazine, maintenance workshops, and mine support facilities; • Processing facilities: fuels, reagents, and consumables required by the processing plant; • Site services and administration: main office, laboratory, training building, warehouse and bond store, workshops, and an emergency and security services building; • Port facilities: Put Put wharf, servicing oil tankers, general cargo ships, passenger ferries, and work boats; • Inner harbor for small boats; • Waste rock disposal barges and associated loading and disposal infrastructure; • Tailings pipeline and pipeline outfall; • Water management facilities: stormwater and water storage dams, diversions, culverts and water transfer pumps and pipelines; • Landfill facility; • Power generation, communications, and distribution facilities; • Oxygen production facilities; • Fuel storage facilities; • Airstrip and terminal facilities. An infrastructure layout plan is included as Figure 15-1. Lihir Operations Papua New Guinea Technical Report Summary Date: February 2026 Page 15-3 Figure 15-1: Infrastructure Layout Plan Note: Figure prepared by Newcrest, 2020. KNSP = Kapit North stockpile; KFSP = Kapit Flat stockpile; Ph11 SP = pit phase 11 stockpile; Ph12e SP = pit phase 12 east stockpile; WWSP = western wall stockpile; HB ROM = harbor base run of mine stockpile; IHF = inner harbor fill; HWP = harbor waste platform; NSB = nearshore soil barrier. Additional infrastructure that will be required to support the LOM plan is the nearshore soil barrier, discussed in Chapter 17.8, and shown in Figure 15-1. Infrastructure for the workforce includes housing and camp accommodation, and related community facilities such as a school, medical center, supermarkets, an open market, and a police station, as well as associated messing and recreation facilities, and plants for water and sewerage treatment. Lihir Operations Papua New Guinea Technical Report Summary Date: February 2026 Page 15-4 15.2 Roads and Logistics A public road was constructed from the village of Put Put to the accommodation center at the Londolovit plantation, and from there to the airstrip at Kunaye. Haul roads run between the crushing facilities and ROM stockpiles at Ladolam, the barge loading dock in Luise Harbor, and the low-grade ore stockpiles. A wharf was constructed at Put Put for general cargo ships and tankers for deliveries of heavy fuel oil (HFO) and light fuel oil (LFO or diesel) for mobile fleet, power stations, and other diesel powered equipment. An airstrip and terminal facilities were constructed on the northern portion of the island. The airstrip was certified with the PNG Civil Aviation Authority in 2007 and the airport operates both domestic flights, and international flights to Cairns. 15.3 Stockpiles Stockpiles are discussed in Chapter 12.4 and Chapter 15.3. The stockpile locations are shown on Figure 15-1. 15.4 Waste Storage Facilities Waste rock from the mine is either used for construction purposes or transported in barges for off-shore submarine disposal. Additional information on waste rock storage is provided in Chapter 17.5. 15.5 Tailings Disposal Due to the heavy rainfall typically experienced on Aniolam Island, the lack of suitable area for a tailings storage facility, and the high seismicity of the region, deep sea tailings placement was selected as the preferred tailings placement method for the Lihir Operations. Additional information is provided in Chapter 17.6. 15.6 Built Infrastructure Mine facilities, including ROM stockpiles, crushing facilities, and mine support facilities, are located in the Ladolam Creek valley, immediately to the east of the ultimate pit boundary. The processing plant is on the northwestern side of Put Put Point on relatively flat land adjacent to the shoreline and on the gentler lower slopes of the eastern end of the Luise Caldera. Support buildings include a main site administration office, mine office, projects office, laboratory, and an emergency and security services building. An environmental laboratory was built, and field and laboratory equipment provided for air and water sampling, steam gauging, sediment sampling, fish sampling, weather monitoring, oceanographic monitoring, and industrial hygiene measurements. Facilities for handling and transport of the various fuels, reagents, and consumables required by the processing plant are located near the general ship berth and the processing plant. Lihir Operations Papua New Guinea Technical Report Summary Date: February 2026 Page 15-5 Port facilities are installed to service oil tankers, general cargo ships, passenger ferries, and work boats. The Put Put wharf can berth general cargo ships of 13,000 dead weight tonnes (DWT) capacity, and oil tankers of 12,000 DWT, with draughts to 10 m. Small boats with a draught up to 2 m can berth in the small boat harbor excavated in the coral platform within Special Mining Lease 6. Several small boats are moored at this location and provide a ferry service to Namatanai, pilot boats for the primary port, and vessels for environmental monitoring. Several small boats service the western side of Aniolam Island and the outlying islands of Mahur, Masahet, and Mali. Permanent marine facilities were constructed at these locations for passenger loading and unloading. The Kunaye airstrip has a 1,200 m long runway, and is suitable for use by a variety of small to medium size passenger aircraft. The airstrip includes a taxiway and aircraft parking area for three aircraft. A terminal building next to the aircraft parking area contains arrival and departure facilities and baggage-handling equipment. 15.7 Camp and Accommodation The Londolovit accommodation centers provide housing for senior staff living on site and a number of government employees. Single persons’ quarters are provided for commuting personnel. 15.8 Power and Electrical Power is currently produced at site by a combination of heavy fuel oil (HFO) reciprocating engines. The existing total mine site power demand averages around 115 MW and can peak as high as 130 MW when all equipment is at full capacity (peak usage). The HFO power supply consists of twelve 6.3 MW units (diesel power station) and ten 8.9 MW units (interim power station and two 8.9 MW oil cubes). The site has small backup generators that use light fuel oil. 15.9 Fuel Fuel handling facilities include provision for handling of HFO and diesel fuel (distillate). HFO discharges from oil tankers to two bulk storage tanks using the supplying tanker's pumps. These HFO tanks have a total capacity of 26,500 t. An estimate of average HFO consumption is 205 t/d. Using the supplying tanker's pumps, diesel discharges to two bulk storage tanks that have a total capacity of 6,000 t. Average diesel consumption is estimated at 70 t/d. 15.10 Communications Communications at the site, across the island and within the PNG mainland and overseas are provided through the national telephone network carrier. Internet access for the operation is provided via a dedicated satellite link. Marine and aeronautical radio systems are installed. 15.11 Water Supply Water supply is discussed in Chapter 17.9.


Lihir Operations Papua New Guinea Technical Report Summary Date: February 2026 Page 16-1 16.0 MARKET STUDIES 16.1 Markets The Lihir Operations consist of an operating mine with refining contracts in place. The Lihir Operations produce gold doré containing 91–97% gold, 2.2–8.24% silver and 0.5–3% base metals, which is securely transported from the mine to a refinery. Within the Asia–Pacific region, there are a number of London Bullion Market Association- accredited refineries that have the capacity to refine doré, including the West Australian Mint refinery in Perth, WA, the ABC Refinery in Sydney, NSW, Metalor Technologies in Singapore, W.C Heraeus–Precious Metals in Hong Kong, Logam Mulia in Indonesia, and new refineries in India as well as a number of established refineries in Europe and the Middle East. Currently the West Australian Mint is the preferred refinery. There are no agency relationships relevant to the marketing strategies used. Product valuation is included in the economic analysis in Chapter 19, and is based on a combination of the metallurgical recovery, commodity pricing, and consideration of processing charges. Under the terms of the Lihir mining development contract, Newmont may be required to refine a portion of the Lihir gold production within PNG if certain quality and security requirements are met, and the terms offered are commercially competitive. To date this has not occurred, and Newmont is free to enter into arms-length contracts for refining. 16.2 Commodity Price Forecasts Newmont uses a combination of historical and current contract pricing, contract negotiations, knowledge of its key markets from a long operations production record, short-term versus long- term price forecasts prepared by Newmont’s corporate internal marketing group, public documents, and analyst forecasts when considering long-term commodity price forecasts. Higher metal prices are used for the mineral resource estimates to ensure the mineral reserves are a sub-set of, and not constrained by, the mineral resources, in accordance with industry- accepted practice. The long-term commodity price and exchange rate forecasts are provided in Table 16-1. Table 16-1: Commodity Price and Exchange Rate Forecasts Commodity Units Mineral Reserves Mineral Resources Gold US$/oz 2,000 2,300 Exchange rate US dollar : PNG kina 1:4.00 1:4.00 16.3 Contracts Newmont’s doré is sold on the spot market, by marketing experts retained in-house by Newmont. The terms contained within the sales contracts are typical and consistent with standard industry practice and are similar to contracts for the supply of doré elsewhere in the world. Lihir Operations Papua New Guinea Technical Report Summary Date: February 2026 Page 16-2 There are currently eight major contracts in place to support the Lihir Operations. These contracts cover items such as refining, security transport, data management and invoicing, mining contracts, sea freight, catering and accommodations support, air transport, and labor hire. Contracts are negotiated and renewed as needed. Contract terms are in line with industry norms, and typical of similar contracts in Papua New Guinea that Newmont is familiar with. Lihir Operations Papua New Guinea Technical Report Summary Date: February 2026 Page 17-1 17.0 ENVIRONMENTAL STUDIES, PERMITTING, AND PLANS, NEGOTIATIONS, OR AGREEMENTS WITH LOCAL INDIVIDUALS OR GROUPS 17.1 Introduction Mine development and operations (i.e. processing) at the Lihir Operations commenced in 1997 in accordance with the agreed development plans stipulated in the approved Proposal for Development, which forms the basis of the Mining Development Contract and the subsequently issued Special Mining Lease 6. The original Environmental Plan associated with mine development was completed in 1995 (NSR, 1995) and approved by the PNG Minister of Environment. An Environmental Impact Statement was prepared under the Environment Act 2000 for the Production Improvement Program, which facilitated the subsequent incorporation of the existing Water Use Permits into two new Level 3 Environment Permits (Lihir Gold, 2005). The Environmental Impact Statement was subsequently approved by the PNG Department of Environment and Conservation in 2008, with new environmental permits issued for waste discharge and water abstraction in October 2008 (DEC, 2008a; 2008b). Newcrest completed a major plant upgrade in 2013, which did not require any change to the current rate of mining or to the extent of the pit footprint. Instead, additional ore processing was made possible by increasing the rate of processing for stockpiled low-grade ore and increases to tailing disposal, as part of the MOPU plant project. An Environmental Impact Statement for the expansion was submitted to the PNG Department of Environment and Conservation (Coffey, 2009) and was approved by the PNG Environment Council in February 2011. The waste discharge and water extraction permits were amended in March 2012 and November 2014, respectively. In September 2024, the water extraction permit was further amended to reflect operational updates and ensure alignment with current regulations. No changes were made to permit conditions that would impact operational requirements. A regulatory-approved Environmental Management and Monitoring Plan is used to manage and monitor the predicted environmental impacts associated with the Project. The Environmental Management and Monitoring Plan is updated every four years for review and endorsement by the PNG Conservation and Environment Protection Authority (formerly the PNG Department of Environment and Conservation). In addition, an annual environmental report is prepared and submitted to the PNG Conservation and Environment Protection Authority as well as other national, provincial, and local level government bodies. Environmental management practices are guided by Newmont policies and standards. 17.2 Baseline and Supporting Studies Baseline studies were completed in support of permitting and operations in the period 1988–1992. Additional studies were conducted during the MOPU plant project from 2009–2013. Completed studies included the following major discipline areas: • Vegetation; • Fauna and avifauna (including megapodes); Lihir Operations Papua New Guinea Technical Report Summary Date: February 2026 Page 17-2 • Freshwater and coastal fish; • Marine biological habitat; • Fringing coral reefs; • Bathymetry; • Upper ocean characteristics (e.g. water temperature, salinity, density, dissolved oxygen, light penetration); • Meteorology and hydrology; • Oceanic currents; • Land use; • Marine resources use; • Riparian resources use; • Archaeology and material culture. • Additional surveys, evaluations, and models included: • Waste rock characterization; • Submarine tailings hydraulics and dissolution, tailings dispersal; • Trial waste dumping, plume modelling. 17.3 Environmental Considerations/Monitoring Programs The onsite Environment Department uses and references a number of records, documentation, and information management systems to store assess and review data: • Environmental data monitoring database: water quality criteria and monitoring results; water run-off volumes and quality, stream flows, and suspended sediment flux; • Hydrometeorology: water level, pH, water temperature, and weather information, fresh- water management model for the Londolovit River; • Meteorology: rainfall, evaporation, relative humidity, solar radiation, air temperature, prevailing winds; • Air quality and noise monitoring; • Groundwater monitoring; • Vegetation and soil monitoring; • Megapode monitoring; • Aquatic biomonitoring: fish, shellfish, and seagrass; • Waste rock disposal and submerged waste stockpile dimensions; • Deep sea tailings placement tailings discharge volumes, chemistry; • Ocean physio-chemical monitoring, near shore sedimentation rates and turbidity, water quality;


Lihir Operations Papua New Guinea Technical Report Summary Date: February 2026 Page 17-3 • Land management model: land disturbance and progressive rehabilitation statistics; • Laboratory information management: sample collection, registration, and chain of custody and reporting. Newmont maintains a central compliance system for all sites, including the Lihir Operations, to report environmental incidents, notifications, investigations, tracking of actions, reporting, inspections, and track action completion. 17.4 Stockpiles All low-grade stockpiles, except Kapit North and Wild West, are within the planned final pit boundary, and will need to be consumed or relocated to allow final pit development. All major existing stockpiles are scheduled to be reclaimed during the LOM. The Phase 9 pit void is used for low-grade stockpiling to meet LOM plan requirements. The design includes 10 m berms, 24 m face height, 28 m ramps, batter angle of 35º, and inter-ramp angle of 28º. The stockpile will have a total design capacity of about 40 Mt. Acid and metalliferous drainage will be generated from medium-term storage of ore stockpiles prior to processing. This requires management of runoff and drainage to ensure discharges comply with the requirements of the site’s environment permits. Regular monitoring is undertaken of water quality for regulatory reporting. Newmont is currently conducting studies to assess appropriate means of managing acid and metalliferous drainage as the basis for an amendment to the Environment Permit for Waste Discharge. 17.5 Waste Rock Disposal Waste rock from the mine is either transferred into 1,500 t capacity barges for off-shore submarine disposal within the boundaries of Special Mining Lease 6, tipped at the harbor waste platform, or stockpiled for use as road base, bench sheeting, stemming, or construction fill. Submarine waste disposal is carefully planned and controlled to achieve a continuous rill along the steeply-sloping sea floor and minimize the potential for uncontrolled slumping. In March 2023, Newcrest applied to the PNG Conservation and Environment Protection Authority and the PNG Mineral Resources Authority for a new lease for mining purposes to host an extension of the existing marine waste rock storage facility. The extension will provide sufficient capacity to support mine waste disposal. Approval of the marine waste rock storage facility extension is assumed to be granted in early 2026. 17.6 Tailings Disposal Tailings are disposed using deep sea tailings placement. This disposal process was selected as the preferred tailings management option from an environmental and social point of view because the Lihir Operations have limited space for terrestrial tailings storage and the mine is situated in a seismically active region. Baseline studies were undertaken prior to the approval by PNG environmental authorities and commencement of the deep sea tailings placement. Tailings are discharged from a pipeline that extends from the de-aeration tank through a directionally-drilled hole in the shoreline at Put Put Point to a discharge point beneath the productive euphotic (sunlight-penetrating) zone at a depth of approximately 115 m below the surface. Lihir Operations Papua New Guinea Technical Report Summary Date: February 2026 Page 17-4 The process tailings comprise a dilute mixture of mill feed material and seawater from the cooling water systems and discharged through the deep sea tailings placement system at a depth of approximately 115 m within the boundaries of the Special Mining Lease. Given that the waste rock and tailing materials contain sulfide minerals (including pyrite), submerging these materials prevents oxidation and potential acid and metalliferous drainage generation. Ongoing monitoring of the deep sea tailings placement system is conducted under a government- approved Environmental Management and Monitoring Plan. Detailed seabed and tailings footprint surveys are regularly conducted as per Environmental Management and Monitoring Plan requirements. These surveys include seabed bathymetry, ocean water quality, seabed physio- chemical characterization, and abundance of deep-sea marine fauna. The operation has conducted numerous studies to investigate the performance of the deep sea tailings placement system including potential impacts from mine-derived sediment, waste rock and tailing disposal (CSIRO, 2009). A recent study, based on field work conducted in 2022–2023, is expected to be finalized by the end of 2025 for submission to the PNG Conservation and Environment Protection Authority as per the Environmental Management and Monitoring Plan. The PNG Government also conducted studies on the deep sea tailings placement system independently of Newmont (SAMS, 2008). The studies found that the system performed according to approved environmental permits and regulatory monitoring requirements. In addition, periodic independent technical reviews (e.g. Scottish Association of Marine Science) have been undertaken to assess whether the deep sea tailings placement system is functioning as designed, and to develop ongoing research projects. 17.7 Water Management Pit perimeter diversion drains are installed on a 50 m wide drainage berm sloping at 3% to intercept as much surface runoff as possible from the Luise Caldera, which is diverted around the mining operation and into the ocean. Remaining surface runoff, groundwater seepage and rainfall is collected by 16 m wide drainage berms incorporated into pit designs and directed into sumps. Water is then pumped by in-pit dewatering pumps to the surface drainage system before ocean discharge via a permitted discharge point. 17.8 Nearshore Soil Barrier (NSB) The nearshore soil barrier project is required to enable access to the mineral reserves within the Kapit pit sector. The preferred construction method is a high-strength, reinforced, concrete diaphragm wall, spanning 800 m, with a nominal depth of 30.5 m with maximum depth of 45 m. This design will limit seepage into the pit from the ocean and groundwater through permeable mine waste rock fill and underlying marine sediments. It will also improve pit slope stability through upper layers of fill/soft sediments to allow the pit crest to be located as far east and as close to the wall as practical. The design uses updated conventional pit slopes with corresponding phase pit designs to allow access to the mineral reserves at significantly reduced capital cost, technical risk, and construction time than previously-considered alternatives The project scope includes the following: • Construction of the nearshore soil barrier; Lihir Operations Papua New Guinea Technical Report Summary Date: February 2026 Page 17-5 • Relocation of services/infrastructure (power, water supply, communications, roads) which are within the construction footprint of the nearshore soil barrier wall construction and development of the proposed Kapit pit sector; • Infilling of the Inner Harbor. 17.9 Water Supply 17.9.1 Fresh Water Supply Overview The rugged topography, steep stream gradients and high earthquake risk on Aniolam Island mean that there are few locations suitable for cost effective construction of large volume water storages. Furthermore, those locations most amenable to large dam construction are also those most suitable for human habitation, and have the greatest population density and resource value to the local community. As a consequence, development of water supply yield on the island is necessarily focused on run-of-river and/or groundwater resources. The nearest available source of water in sufficient quantity is the Londolovit River where a 3–4 m high, broad diversion causeway weir scheme and associated pumping station were constructed. Four large turbine pumps supply the process plant via a pipeline from the weir that discharges to both the plant raw water storage tank and the thickener circuit. Water can also be sourced from a natural fresh-water spring within the caldera. The operations water demand is currently met by a combination of Londolovit raw water from the weir, caldera extraction via the Kapit spring and seawater supplement. Fresh water from pit diversion can also be substituted into the plant supply. The catchment area is very small (12 km length and surface catchment area of about 26.1 km2), and flow in the Londolovit River is dependent on rainfall, with the system draining within 3–5 days of rainfall events. Prolonged drought conditions are a risk to continued plant operations due to the lack of water. Sea water substitution measures can be implemented in the plant under major drought conditions and can mitigate a portion, but not all, of the drought-related effects on production. Based on the Aqueduct Water Risk Atlas, which assesses water risk on a five-tiered scale against a series of indicators (including physical quantity, quality, and regulatory and reputational risk) the water risk range rating for the Lihir Operations is “high”, the second-highest risk rating assigned under the scale. Newmont is investigating augmenting freshwater catchment and retention, including: • Improved collection of freshwater from caldera clean water diversions and dewatering bores; • Clean water storage pond. 17.9.2 Fresh Water Supply Water Extraction Permits Extraction from the Londolovit River is governed by PNG government permit under the PNG Environment Act 2000, under permit number WE-L3(143). Two uses are permitted from the Londolovit surface water system by WE-L3 (143): Lihir Operations Papua New Guinea Technical Report Summary Date: February 2026 Page 17-6 • #3: Extraction from the Londolovit weir for use at the Londolovit township and camp(s) at 1,250,000 m3/year or 145 m3/hour; • #5: Extraction from the Londolovit weir for operations use for ore processing at 38,016,000 m3/year, or 4,400 m3/hour. A key condition of the permit is the specification for maintenance of environment flow as a mandatory requirement for extraction at Londolovit Weir. Environmental flow is set at 200 L/second, or 720 m3/hour, which is to be maintained below the extraction point and weir at all times during the extraction of water. Environmental flow is required as a minimum requirement to protect downstream aquatic water quality and ecosystems along the lower reaches of Londolovit River. 17.9.3 Seawater Seawater is sourced from Luise Harbor to supply the back end of the process plant and cooling water for the power stations. The demand at a production rate of 14 Mt/a is 636,375 m3/day. 17.10 Closure Considerations In compliance with regulatory requirements, Newcrest commissioned a conceptual mine closure plan in 1995, which was submitted to the PNG government, and which has been updated and refined in subsequent years. The last update to the plan was in 2023, however additional updates to closure concepts were made in the 2024 closure cost estimates performed in accordance with Newmont standard. A detailed Mine Rehabilitation and Mine Closure Plan is required to be submitted to the regulator a minimum of five years prior to the cessation of operations. Planned closure is divided into three stages: • Cessation of mining and processing; • Active closure; • Maintenance and monitoring. Site rehabilitation and closure will involve dismantling and demolition of infrastructure not intended for subsequent community use, removal of residual materials and remediation of disturbed areas. Community requirements and long-term land use objectives will also be considered. There are currently no known requirements to post performance or reclamation bonds. However, new closure policy documentation that is being drafted by the State may introduce bonding requirements. A bond of PGK111,000 was posted prior to the Lihir Operations commencing in 1997. The 2025 undiscounted life of asset (LOA) closure cost is US$0.7 B. 17.11 Permitting Newmont currently holds the key applicable permits required to support current operations. Permit renewals are applied for where required.


Lihir Operations Papua New Guinea Technical Report Summary Date: February 2026 Page 17-7 Additional permits will be required as follows: • Nearshore soil barrier: currently approved with existing approvals but requires sign off by the Chief Inspector of Mines pursuant to the Mining (Safety) Act 1977. The construction of this barrier was previously approved as part of the 2005 Production Improvement Program Environmental Impact Statement; • In March 2023, Newcrest applied to PNG Conservation and Environment Protection Authority and the PNG Mineral Resources Authority for a new lease for mining purposes to host an extension of the existing marine waste rock disposal area. The extension will provide sufficient capacity to support mine waste disposal. Approval of the marine waste rock dump extension is assumed to be granted in early 2026; • Special Mining Lease extension – Special Mining Lease 6 expires March 16, 2035. Subject to outcomes of current study work, additional permits may be required as follows: • Changes to the acid and metalliferous drainage management strategy to manage acid and metalliferous drainage at the source, pathway, and receptor; • Investigation into alternatives for future waste rock disposal. The Lihir Operations are conducted in accordance with the development plans stipulated in the Mine Development Contract and the accompanying Approved Proposal for Development signed between the State and Lihir Gold in 1995. The Mine Development Contract and Approved Proposal for Development represent the principal agreement/contract between the State and Lihir Gold in accordance with that described in the Mining Act 1992 Part IV. The Mine Development Contract and Approved Proposal for Development provide details of the conditions and implementation of the Project’s approved environmental, financial, business, training/localization, land-owner agreements, and infrastructure plans. The Project’s approved Environmental Plan was prepared in accordance with the Environmental Planning Act 1978, the Water Resources Act 1982, and the Environmental Contaminants Act 1978. The Environment Act 2000, which came into effect in January 2004, allows for existing approvals, permits and licenses issued under the now repealed Environmental Planning, Water Resources and Environmental Contaminant acts to continue to be valid and in force for existing projects such as the Lihir Operations. The operations Environmental Management and Monitoring Plan provides details of the environmental monitoring requirements and reporting commitments to the PNG Conservation and Environment Protection Authority, PNG Mineral Resources Authority, New Island Provincial Government, Nimamar Local Level Government, and community representatives such as the Lihir Mine Area Landholders Association. The Environmental Management and Monitoring Plan lists the various monitoring requirements, which arose from the identification of key environmental issues documented in the Project’s Environmental Plan (NSR, 1992) and subsequent Environmental Impact Statements. The Environmental Management and Monitoring Plan includes statutory monitoring associated with the water extraction permit for the Lihir Operations, which regulates the volume of water extracted from rivers and the ocean to operate the mine, and the waste discharge permit, which limits the volume and concentration of discharged waste streams. Lihir Operations Papua New Guinea Technical Report Summary Date: February 2026 Page 17-8 17.12 Considerations of Social and Community Impacts There are a number of culturally significant sites within the mining area including Ailaya Rock on the edge of the operational pit. Lihirians believe Ailaya Rock to be the portal to the afterlife. There was a cave at the base of the Ailaya prior to disturbance in the 1990s where it was believed that spirits entered and then rose through it to the afterlife. The Ailaya Rock remains a site of deep cultural and religious significance to the majority of Lihirians and the image of the rock is a symbol of Lihirian identity. A 10-m buffer along the Ailaya boundary, following the old walking track, was established through consultations with the tenement landholders (landowners) and stakeholders. This buffer aims to prevent any disturbance to the Ailaya area and reflects the agreed commitment to respecting its boundaries. Separately, a 100-m environmental buffer exists. This buffer is unrelated to the 10-m buffer, and is implemented to meet specific environmental management requirements. There are several cultural sites located within the company’s tenements, including the Special Mining Lease, which are also of cultural importance. These require ongoing management in consultation with local communities, customary landowners and regulators that pose significant risk to company reputation and social license to operate. The current suite of Customary Landholder Agreements were signed on December 21, 2020 after a review process with Lihir’s tenement landholders and relocation family groups that lasted several years. The full set of agreements were then registered by the PNG Registrar of Tenements on April 30, 2021 in fulfilment of a key requirement of the Mining Act 1992. These agreements have also been registered with the Conservation and Environment Protection Authority to fulfil the requirements of the Environment Act 2000. Newcrest and the 10x tenement landholders and relocation 5x family groups agreed to replace the former integrated benefits package agreement regime with a new suite of agreements resulting in the following: • The 1995 integrated benefits package, 2007 revised integrated benefits package, and certain other associated agreements were terminated; • New agreements setting out distinct compensation, relocation and benefits arrangements were implemented in place of the terminated agreements; • Certain existing agreements (e.g., the Lihir Mining Development Contract, 2007 Memorandum of Agreement, and various community agreements) continued without modification. Incorporated within the new regime were: • An Umbrella Transition Deed (which is the framework agreement setting out the structure of the new suite of agreements and terminating the previous integrated benefits package regime); • Three subject-specific agreements (which set out the details of the compensation, relocation, and benefit arrangements in place); • 15x individual agreements with specific landholder and resettled family groups (which record the specific entitlement of each particular group). Lihir Operations Papua New Guinea Technical Report Summary Date: February 2026 Page 17-9 The 2020 Umbrella Termination Deed identifies terminated and continuing agreements. The continuing agreements are detailed further in the 2020 Lihir Memorandum of Understanding of Parked Issues and Agreements that capture a set of issues that were resolved in the previous agreement review as well a set of continuing agreements and arrangements. Several management plans have been approved by the PNG Mineral Resources Authority and the PNG Conservation and Environment Protection Authority, which are critical to the resolution of social issues (including those captured in the 2020 Lihir Memorandum of Understanding of Parked Issues and Agreements) and fulfillment of commitments: • Lihir Mine Closure Plan; • Lihir Mine Plan; • Health and Safety Management Plan; • Local Business Development Plan; • Supply and Procurement Plan; • Employment, Training and Development Plan; • Environmental Management and Monitoring Plan; • Compensation Plan; • Cultural Heritage Management and Monitoring Plan; • Relocation and Resettlement Management and Monitoring Plan; • Foundation Building Management Plan; • Social Development Management Plan; • Socio-economic Impact Monitoring and Management Plan. Agreements and obligations are currently registered in a Community, Health, Environment, Safety and Security (CHESS) system. Community Agreements are currently registered in both the CHESS Obligations register and the Community Agreements register. Environmental Permits, Agreements and Obligations are also currently registered using the same system. Specific policies, standards, and guidelines are referenced in each of the management plans. Newmont has established generally good working relationships with local communities and although occasional disputes do occur, they are relatively minor in nature. The last disputes that resulted in brief disruptions to operations occurred in 2014–2015. 17.13 Qualified Person’s Opinion on Adequacy of Current Plans to Address Issues Damage to Ailaya Rock as a result of mining activities could result in a significant social issue. Continued monitoring and careful planning, along with transparent dialogue with local communities will be necessary. Based on the information provided to the QP by Newmont (see Chapter 25), there are no other material issues known to the QP. The Lihir Operations are mature mining operations and currently have the social license to operate within the local communities. Lihir Operations Papua New Guinea Technical Report Summary Date: February 2026 Page 18-1 18.0 CAPITAL AND OPERATING COSTS 18.1 Introduction Capital and operating cost estimates are at a minimum at a pre-feasibility level of confidence, having an accuracy level of ±25% and a contingency range not exceeding 15%. 18.2 Capital Cost Estimates 18.2.1 Basis of Estimate As the Lihir Operations are a steady-state operation, sustaining capital costs largely consist of site infrastructure upkeep and mobile equipment replacement costs. An allowance for miscellaneous equipment, small projects, and other minor capital costs was included for mining, processing, and site general. The sustaining capital cost estimate is based on current budget level costs, combined with recent average sustaining capital spend. The major project included in the mineral reserves estimate is the nearshore soil barrier. Mine capital costs were based on modelling, using mine plans and schedules, material quantities, equipment data, consumable estimates, and labor schedules. Mining sustaining capital costs are based on the continuation of Owner-operator mining model. Mine sustaining capital estimates were built up from the current detailed budget combined with project to date actual spend, and adjusted using forward production plans and schedules, engineering designs, and equipment strategies. Mining sustaining capital costs were estimated to total $0.6B over the remaining LOM. Process plant sustaining capital estimates were built up from the current detailed budget combined with project-to-date actual expenditure. These are adjusted using forward production plans and schedules, engineering designs, and equipment strategies. Process plant non- sustaining capital expenditure, primarily the power generation project and supporting infrastructure capital, were based on equipment lists and material take-offs from engineering drawings. Process plant sustaining capital costs were estimated to total of US$0.7B over the remaining LOM. Site G&A sustaining capital estimates were built up from the current detailed budget combined with project-to-date actual expenditure and adjusted using forward production plans and schedules, and engineering designs. These costs include major maintenance activities to maintain airport, port, site access roads, camps, and accommodation. These costs were estimated total of US$0.4B over the remaining LOM. Newmont has made allowances for site power and utilities in the sustaining capital estimates. Newmont has made allowances for development capital to pursue a variety of interrelated and inter-dependent studies, that include, but are not limited to, the nearshore soil barrier, hot ground mining and miscellaneous studies aimed at optimizing production outputs. Mining-related development capital costs were estimated at US$0.5B over the remaining LOM.


Lihir Operations Papua New Guinea Technical Report Summary Date: February 2026 Page 18-2 18.2.2 Capital Cost Summary Sustaining capital costs are summarized in Table 18-1. Sustaining and development capital costs total US$2.2 B over the anticipated LOM. Table 18-1: Capital Cost Estimate Capital Description Unit Value Mining (sustaining) US$ billion 0.6 Processing (sustaining) US$ billion 0.7 General and administrative (sustaining) US$ billion 0.4 Development capital US$ billion 0.5 Total Capital US$ billion 2.2 Note: Numbers have been rounded. 18.3 Operating Cost Estimates 18.3.1 Basis of Estimate The operating costs used in the financial model were derived from a variety of sources. The mining costs were derived from a purpose-built, activity-based cost model, while ore treatment and G&A costs were based on budgeted numbers adjusted for Newmont’s long-term consumable price forecasts. All operating costs are presented in US$ and reflect 2025 market terms. Inputs in currencies other than US$ were converted at exchange rates as per Newmont’s economic parameters. Mining operating costs are forecast to average US$12.43/t of material moved or US$21.61/t ore milled, for a total of US$4.8B over the remaining life of mine. These costs are based on an ex-pit mining rate mining of up to 35 Mt/a and total material movement rate of up to 50 Mt/a. Included in the costs are provision for load and haul, barging, drill and blast, ancillary costs, and overheads. Stockpile and re-handle and crushing costs are included with the mining costs. Process operating costs are forecast to average US$37.37/t milled, for a total of US$8.2B at a throughput rate of approximately 12.5 Mt/a over the remaining LOM. Process costs include provision for and grinding, flotation, autoclave, neutralization, cyanidation and adsorption, unallocated power, overheads, and ancillary costs. Infrastructure and other distributable costs (power and utilities) are included in the mining and processing operating costs. General and administrative operating costs are forecast to average US$14.03/t milled, for a total of US$3.1 B over the remaining LOM. Lihir Operations Papua New Guinea Technical Report Summary Date: February 2026 Page 18-3 18.3.2 Operating Cost Summary The projected LOM plan operating costs are summarized in Table 18-2 and Table 18-3, and are anticipated to total US$16.1 B, or US$73.01/t milled. Table 18-2: Operating Cost Estimate Cost Area Units Value Mining cost US$ billion 4.8 Ore treatment US$ billion 8.2 G&A US$ billion 3.1 Site Costs US$ billion 16.1 Note: Numbers have been rounded. Table 18-3: Operating Unit Cost Estimate Cost Area Units Value Mining cost US$/t ore milled 21.61 Ore treatment US$/t ore milled 37.37 G&A US$/t ore milled 14.03 Total Site Operating Costs US$/t ore milled 73.01 Lihir Operations Papua New Guinea Technical Report Summary Date: February 2026 Page 19-1 19.0 ECONOMIC ANALYSIS 19.1 Methodology Used The financial model that supports the mineral reserve declaration is a standalone model that calculates annual cash flows based on scheduled ore production, assumed processing recoveries, metal sale prices and United Staes dollar to New Guinea kina exchange rate, projected operating and capital costs and estimated taxes. The financial analysis is based on an after-tax discount rate of 10%. All costs and prices are in unescalated “real” dollars. The currency used to document the cash flow is US$. All costs are based on the 2026 budget. Revenue is calculated from the recoverable metals and long-term metal price and exchange rate forecasts. 19.2 Financial Model Parameters The economic analysis is based on the metallurgical recovery predictions in Chapter 10.4, the mineral reserve estimates in Chapter 12, the mine plan discussed in Chapter 13.10, the commodity price forecasts in Chapter 16, closure cost estimates in Chapter 17.3, and the capital and operating costs outlined in Chapter 18. Royalties were summarized in Chapter 3.2.5 and Chapter 3.8. Lihir is subject to a corporate income tax rate of 30% on taxable income. It is also subject to a mineral royalty of 2% on net smelter returns and a production levy of 0.5% of assessable income. The economic analysis is based on 100% equity financing and is reported on a 100% project ownership basis. The economic analysis assumes constant prices with no inflationary adjustments. The NPV at a discount rate of 10% is $2.0 B. As cash flows are based on existing operations where all costs are considered sunk to January 1, 2026 considerations of payback and internal rate of return are not applicable. Free cash flow is US$ 3.1 B. A summary of the financial results is provided in Table 19-1. Lihir Operations Papua New Guinea Technical Report Summary Date: February 2026 Page 19-2 Table 19-1: Cash Flow Summary Table Item Unit Value Metal price, gold US$/oz 2,000 Tonnage treated Mt 220.2 Gold grade g/t 2.26 Gold ounces, contained Moz 16.0 Capital costs US$ billion 2.2 Direct operating costs (including G&A) US$ billion 16.1 Exchange rate US dollar : PNG kina 1:4.00 Discount rate % 10 Free Cash Flow US$ billion 3.1 Net Present Value US$ billion 2.0 Note: Table 19-1 contains “forward-looking statements” within the meaning of Section 27A of the Securities Act of 1933, as amended, and Section 21E of the Securities Exchange Act of 1934, as amended, which are intended to be covered by the safe harbor created by such sections and other applicable laws. Please refer to the note regarding forward-looking information at the front of the Report. The cash flow is only intended to demonstrate the financial viability of the Project. Investors are cautioned that the above is based upon certain assumptions which may differ from Newmont’s long-term outlook or actual financial results, including, but not limited to commodity prices, escalation assumptions, and other technical inputs. For example, Table 19-1 uses the price assumptions stated in the table, including a gold commodity price assumption of US$2,000/oz, which varies significantly from current gold prices and the assumptions that Newmont uses for its long-term guidance. Please be reminded that significant variation of metal prices, costs and other key assumptions may require modifications to mine plans, models, and prospects. Numbers have been rounded. An annualized cash flow statement is provided in Table 19-2 and Table 19-3. The tables present the financial results on a 100% basis. Total tonnage and metal may differ from declared values in the mineral reserve table due to the financial model being based on a projected end of year topography. The QP does not consider any differences to be material. In these tables, EBITDA = earnings before interest, taxes, depreciation, and amortization. The active mining operation and processing ceases in 2043; however, closure costs are estimated to 2066.


Lihir Operations Papua New Guinea Technical Report Summary Date: February 2026 Page 19-3 Table 19-2: Annualized Cash Flow (2026–2034) Area Units LOM 2026 2027 2028 2029 2030 2031 2032 2033 2034 Material mined Mt 382.8 28.4 29.0 30.1 35.0 35.0 35.0 33.5 31.8 28.4 Ore processed Mt 220.2 11.8 12.1 12.7 12.3 12.6 12.9 12.8 12.8 12.7 Contained gold, processed Moz 16.0 0.9 0.9 0.9 1.1 1.3 1.4 1.4 1.1 1.0 Contained gold, gold grade g/t 2.26 2.24 2.33 2.11 2.79 3.21 3.39 3.38 2.73 2.53 Recovered gold Moz 12.1 0.6 0.7 0.7 0.9 1.0 1.0 1.0 0.9 0.8 Recovery gold % 76 75 78 77 77 74 73 72 81 81 Net revenue US$ billion 24.2 1.3 1.4 1.3 1.7 1.9 2.1 2.0 1.8 1.7 Cost applicable to sales US$ billion (17.4) (0.9) (1.0) (1.0) (1.1) (1.1) (1.1) (1.1) (1.0) (1.0) EBITDA US$ billion 6.3 0.4 0.4 0.3 0.6 0.8 0.9 0.9 0.8 0.7 Operating cash flow US$ billion 5.4 0.3 0.3 0.2 0.5 0.6 0.7 0.7 0.6 0.5 Total capital US$ billion (2.2) (0.3) (0.4) (0.2) (0.1) (0.1) (0.1) (0.1) (0.1) (0.1) Free Cash Flow US$ billion 3.1 0.1 (0.1) 0.1 0.4 0.5 0.6 0.6 0.5 0.4 Lihir Operations Papua New Guinea Technical Report Summary Date: February 2026 Page 19-4 Table 19-3: Annualized Cash Flow (2035–2040) Area Units 2035 2036 2037 2038 2039 2040 2041 2042 2043 Material mined Mt 21.8 17.6 19.4 12.3 22.8 2.5 0.0 0.0 0.0 Ore processed Mt 12.9 12.8 12.9 12.5 12.3 12.6 12.9 12.7 6.0 Contained gold, processed Moz 0.9 0.8 0.8 0.7 0.8 0.6 0.6 0.5 0.3 Contained gold, gold grade g/t 2.14 1.95 1.90 1.84 1.95 1.49 1.49 1.33 1.31 Recovered gold Moz 0.7 0.6 0.6 0.6 0.6 0.4 0.4 0.4 0.2 Recovery gold % 80 75 74 75 78 74 65 69 88 Net revenue US$ billion 1.4 1.2 1.2 1.1 1.2 0.9 0.8 0.7 0.4 Cost applicable to sales US$ billion (1.0) (0.9) (0.9) (1.0) (1.0) (0.9) (1.0) (1.0) (0.7) EBITDA US$ billion 0.4 0.3 0.2 0.1 0.2 (0.0) (0.2) (0.2) (0.2) Operating cash flow US$ billion 0.3 0.2 0.2 0.2 0.3 0.1 0.1 0.1 (0.1) Total capital US$ billion (0.1) (0.1) (0.2) (0.1) (0.1) (0.1) (0.1) (0.1) (0.0) Free Cash Flow US$ billion 0.3 0.1 0.0 0.1 0.2 0.0 0.1 0.0 (0.1) Note: Table 19-2, and Table 19-3 contain “forward-looking statements” within the meaning of Section 27A of the Securities Act of 1933, as amended, and Section 21E of the Securities Exchange Act of 1934, as amended, which are intended to be covered by the safe harbor created by such sections and other applicable laws. Please refer to the note regarding forward- looking information at the front of the Report. The cash flow is only intended to demonstrate the financial viability of the Project. Investors are cautioned that the above is based upon certain assumptions which may differ from Newmont’s long-term outlook or actual financial results, including, but not limited to commodity prices, escalation assumptions, and other technical inputs. For example, Table 19-2, and Table 19-3 use the price assumptions stated in the table, including a gold commodity price assumption of US$2,000/oz, which varies significantly from current gold prices and the assumptions that Newmont uses for its long-term guidance. Please be reminded that significant variation of metal prices, costs and other key assumptions may require modifications to mine plans, models, and prospects. Numbers have been rounded. Material mined total includes 70.5 Mt of initial stockpiles. Lihir Operations Papua New Guinea Technical Report Summary Date: February 2026 Page 19-5 19.3 Sensitivity Analysis The sensitivity of the Project to changes in grades, sustaining capital costs and operating cost assumptions was tested using a range of 25% above and below the base case values. The changes in metal prices are representative of changes in grade. The mineral reserves are most sensitive to fluctuations in gold price and grade. The Project is less sensitive to changes in operating costs and least sensitive to changes in capital costs, as illustrated in Figure 19-1. Figure 19-1: Sensitivity Analysis Note: Figure prepared by Newmont, 2026. FCF = free cash flow; Sens = sensitivity; OPEX = operating cost estimate; CAPEX = capital cost estimate. Lihir Operations Papua New Guinea Technical Report Summary Date: February 2026 Page 20-1 20.0 ADJACENT PROPERTIES This Chapter is not relevant to this Report.


Lihir Operations Papua New Guinea Technical Report Summary Date: February 2026 Page 21-1 21.0 OTHER RELEVANT DATA AND INFORMATION This Chapter is not relevant to this Report. Lihir Operations Papua New Guinea Technical Report Summary Date: February 2026 Page 22-1 22.0 INTERPRETATION AND CONCLUSIONS 22.1 Introduction The QP notes the following interpretations and conclusions, based on the review of data available for this Report. 22.2 Property Setting The Lihir Operations have a 23-year operating history. As a result, mining-related infrastructure, and the supply of goods available to support mining operations, is well-established. Personnel with experience in mining-related activities are available in PNG and Australia. Aniolam Island has a high rainfall, which can have short-term impacts on open pit operations. Exploration activities may be curtailed by heavy rainfall. The mine is located within the Luise Caldera of the Luise Volcano which is located on the east coast of the island. The caldera is an extinct volcanic crater that is geothermally active, in the form of hot springs and fumaroles. Aniolam Island is located in the West Melanesian Arc seismic source zone where earthquakes of up to magnitude eight have been recorded. Most earthquakes in the region result from strike-slip movement but some occur along steeply-dipping reverse faults resulting in a strong vertical motion component and have potential to generate local tsunamis. Both tsunami and earthquake risks were assessed and incorporated into the Project design criteria. Mining operations are conducted year-round. 22.3 Ownership Newmont indirectly wholly-owns the Lihir Operations. 22.4 Mineral Tenure, Surface Rights, Water Rights, Royalties and Agreements The Project consists of a granted Special Mining Lease, two granted Mining Leases, one granted Exploration License, five granted Leases for Mining Purposes, and three Mining Easements. The total area under license is approximately 236 km2. The Lihir deposit is located on Special Mining Lease 6. Special Mining Lease 6, Leases for Mining Purposes 34–40, and Mining Easements 71–73 expire on March 16, 2035. The Lihir deposit is located on Special Mining Lease 6. Exploration License 485 expired in March 2024 and an application for renewal is in process; Mining Lease 125 and Mining Lease 126 both expire on July 20, 2025. Newmont must lodge annual and bi-annual reports on activities conducted on the mineral tenure. As at December 31, 2025, all statutory reporting requirements had been met. The Project area is situated on land held under customary, State, and private ownership, including under State lease. The bulk of the land that will be affected by Project operations and closure is customary owned. Newmont has been granted rights to undertake mining and processing of gold and related activities, through negotiations with the state and local government, and landowners in the area. Newmont holds a granted Special Mining Lease which encompasses all of the area Lihir Operations Papua New Guinea Technical Report Summary Date: February 2026 Page 22-2 where mineral reserves are estimated. The Special Mining Lease entitles Newmont to enter and occupy the land for the purpose of mining and the ancillary mining purposes for which the Mining Lease was granted. An Environment Permit for Water Extraction is in place to support Project operations. Newmont is entitled to 100% of the minerals produced from the mineral tenure subject to the payment of prescribed annual rents and royalties. A 2% royalty is payable to the State of PNG on the realized prices of all gold and silver doré produced. Under the MoA, the State is responsible for direct distribution of all royalties derived from the Lihir Operations to Special Mining Lease 6 landowners (20%), Nimamar Local Level Government (30%) and the New Ireland Provincial Government (50%). A production levy of 0.5% is also payable on the gross value of production (i.e., excluding the offsets of treatment and refining charges, payable terms, and freight) to the PNG Mineral Resources Authority. 22.5 Geology and Mineralization The Lihir deposit is considered to be an example of an epithermal gold deposit. The geological understanding of the settings, lithologies, and structural and alteration controls on mineralization in the different zones is sufficient to support estimation of mineral resources and mineral reserves. The geological knowledge of the area is also considered sufficiently acceptable to reliably inform mine planning. The mineralization style and setting are well understood and can support declaration of mineral resources and mineral reserves. There is some remaining exploration potential in the Project area, with a number of prospects that may warrant additional investigation. 22.6 History The Lihir Operations have over 24 years of active mining history, and exploration activities date back to 1980 when gold was first discovered. 22.7 Exploration, Drilling, and Sampling The exploration programs completed to date are appropriate for the style of the mineralization within the Project area. Sampling methods, sample preparation, analysis, and security conducted prior to Newcrest’s interest in the operations were in accordance with exploration practices and industry standards at the time the information was collected. Current Newmont/Newcrest sampling methods are acceptable for mineral resource and mineral reserve estimation. Sample preparation, analysis and security for the Newmont/Newcrest programs are currently performed in accordance with exploration best practices and industry standards. The quantity and quality of the lithological, geotechnical, collar and down-hole survey data collected during the exploration and delineation drilling programs are sufficient to support mineral resource and mineral reserve estimation. The collected sample data adequately reflect deposit dimensions, true widths of mineralization, and the deposit style. Sampling is representative of the gold grades in the deposit, reflecting areas of higher and lower grades. Lihir Operations Papua New Guinea Technical Report Summary Date: February 2026 Page 22-3 Density measurements are considered to provide acceptable density values for use in mineral resource and mineral reserve estimation. The sample preparation, analysis, quality control, and security procedures used by the Lihir Operations have changed over time to meet evolving industry practices. Practices at the time the information was collected were industry-standard, and frequently were industry-leading practices. The sample preparation, analysis, quality control, and security procedures are sufficient to provide reliable data to support estimation of mineral resources and mineral reserves. The QA/QC programs adequately address issues of precision, accuracy, and contamination. Modern drilling programs typically included blanks, duplicates, and standard samples. QA/QC submission rates meet industry-accepted standards. 22.8 Data Verification The QP performed a site visit in September 2025. Observations made during the visit, in conjunction with discussions with site-based technical staff also support the geological interpretations, and analytical and database quality. The QP’s personal inspection supports the use of the data in mineral resource and mineral reserve estimation, and in mine planning. The QP receives and reviews monthly reconciliation reports from the mine site. Through the review of these reconciliation factors the QP is able to ascertain the quality and accuracy of the data and its suitability for use in the assumptions underlying the mineral resource and mineral reserve estimates. 22.9 Metallurgical Testwork Industry-standard studies were performed as part of process development and initial mill design. Subsequent production experience and focused investigations guided mill alterations and process changes. Testwork programs, both internal and external, continue to be performed to support current operations and potential improvements. From time to time, this may lead to requirements to adjust cut-off grades, modify the process flowsheet, or change reagent additions and plant parameters to meet concentrate quality, production, and economic targets. Samples selected for testing were representative of the various types and styles of mineralization. Samples were selected from a range of depths within the deposit. Sufficient samples were taken so that tests were performed on sufficient sample mass. Recovery factors estimated are based on appropriate metallurgical testwork, and are appropriate to the mineralization types and the selected process routes. The average metallurgical recovery for gold over the LOM plan is predicted to be 76%. Daily and monthly recovery varies, based on ore grade, the fraction of milled ore sent to flotation, and the amount of stockpiled ore being treated. Although a number of projects aimed at improving plant gold recovery are underway, no recovery uplifts have been included in future production forecasts. Naturally fine-grained ores (mostly argillic material) and clays (from fresh or stockpile ore) can impact on both plant throughput and metallurgical recovery. The maximum proportion of fines and clays (mainly from argillic ores) that can be treated within the plant is not known with certainty. There are several types of clay minerals with varying impact on plant performance. There is some risk that high proportions of such ore types in plant feed may lead to both lower recovery and throughput, until an adjustment to the mine plan and/or additional plant modifications can be implemented.


Lihir Operations Papua New Guinea Technical Report Summary Date: February 2026 Page 22-4 Wet and sticky ores are managed through blending and on-going mechanical modifications to conveyors and chutes etc. Once in slurry form, these ores can display high and variable non- Newtonian shear-thinning behavior, which can impact the milling, flotation, POX, and CIL circuits. However, dilution has been found effective in controlling slurry rheology to date. There are no penalty elements that affect doré sales. Deleterious components in the ore such as clay, chloride, copper, and carbonate content of mill feed materials can affect aspects of plant operation, are typically localized, and to date, have had only short-term effects. 22.10 Mineral Resource Estimates There is a set of protocols, internal controls, and guidelines in place to support the mineral resource estimation process. Vulcan 2023, Isatis Neo 2023, Leapfrog 2024 and Supervisor 9.0 were the modelling and geostatistical software systems used in modelling and estimation. Estimation was performed by Newmont/Newcrest personnel. All mineralogical information, exploration boreholes and background information were provided to the estimators by the geological staff at the operations or by exploration staff. Geological interpretation is supported by core, RC, in-pit mapping, and grade control sampling data (blast hole). Mineral resources are reported using the mineral resource definitions set out in SK1300, and are reported exclusive of those mineral resources converted to mineral reserves. The reference point for the estimate is in situ or in stockpiles. Areas of uncertainty that may materially impact the mineral resource estimates include: the lack of stationarity in gold domains; changes to long-term gold price assumptions; changes in local interpretations of mineralization geometry and continuity of mineralized zones; changes to geological shape and continuity assumptions; changes to metallurgical recovery assumptions; changes to the operating cut-off assumptions for open pit mining methods; changes to the input assumptions used to derive the pit shell used to constrain the estimate; changes to the marginal cut-off grade assumptions used to constrain the estimate; variations in geotechnical, geothermal, hydrogeological and mining assumptions; and changes to environmental, permitting and social license assumptions. 22.11 Mineral Reserve Estimates Mineral reserves were converted from measured and indicated mineral resources. Inferred mineral resources were set to waste. Estimation was performed by Newmont/Newcrest personnel. All current mineral reserves will be exploited using open pit mining methods or are in stockpiles. Pit designs are full crest and toe detailed designs with final ramps. Pit designs honor geotechnical guidelines. Mineral reserves are reported using the mineral reserve definitions set out in SK1300. The reference point for the estimate is the point of delivery to the process plant. Areas of uncertainty that may materially impact the mineral reserve estimates include: changes to long-term gold price assumptions; changes to exchange rate assumptions; changes to the resource model or changes in the model reconciliation performance including operational mining Lihir Operations Papua New Guinea Technical Report Summary Date: February 2026 Page 22-5 losses; changes to geometallurgical recovery and throughput assumptions; changes to the input assumptions used to generate the open pit design; changes to operating, and capital assumptions used, including changes to input cost assumptions such as consumables, labor costs, royalty and taxation rates; variations in geotechnical and mining assumptions; including changes to designs, schedules, and costs, changes to geotechnical, hydrogeological, geothermal and engineering data used; changes to assumptions as to pit cooling and seepage barrier development and operation; ability to source sufficient quality water supplies to support process plant operations; changes to the assumed permitting and regulatory environment under which the mine plan was developed; continued ability to use sub-sea waste and tailings disposal methods; ability to maintain mining permits and/or surface rights; and the ability to maintain social and environmental license to operate. Ongoing mining adjacent to, and to the west of, Ailaya Rock will require continued community acceptance. The mine plan in that area uses steep wall mining techniques. Geotechnical monitoring will be a critical control. Cut-off grades used in the mine plan assume that future cost reductions at the end of the LOM can be achieved. The mine plan assumes that the existing permitting area for marine tailings and waste disposal can be expanded as required in the LOM plan. 22.12 Mining Methods Mining operations are conducted year-round. Operations are Owner-conducted, except for when a smaller, contractor-operated, pioneering fleet is used to develop new working areas on the steep caldera slopes. The open pit mine plans are appropriately developed to maximize mining efficiencies, based on the current knowledge of geotechnical, hydrological, mining and processing information on the Project. Production mining is by a conventional open pit method, using a conventional mining fleet. Mining is being carried out at elevations below sea level. Sea surge inundation is a risk to operations. The Kapit pit sector will require completion of a number of initiatives, including construction of a the nearshore soil barrier, construction of a perimeter drainage channel, and geothermal cooling and depressurization to a temperature at which mining can be safely undertaken. By 2043, ex-pit and stockpile inventories will be depleted and processed. The ex-pit mining rate ranges from 28–35 Mt/a until 2034 and then reduces to an average of 16 Mt/a from 2035–2040 as stockpile feed becomes the majority ore source. Material above the marginal cut-off grade of 1.0 g/t Au is stored in long-term stockpiles for processing after the end of mine life. As part of day-to-day operations, Newmont will continue to perform reviews of the mine plan and consider alternatives to, and variations within, the plan. Alternative scenarios and reviews may be based on ongoing or future mining considerations, evaluation of different potential input factors and assumptions, and corporate directives. Lihir Operations Papua New Guinea Technical Report Summary Date: February 2026 Page 22-6 22.13 Recovery Methods The process plant flowsheet design was based on testwork results, previous study designs, and industry-standard practices. As the gold mineralization is refractory, the plant consists of crushing and grinding followed by partial flotation, pressure oxidation, and then recovery of gold from washed oxidized slurry using conventional cyanidation. The process methods are conventional CIL and pressure oxidation methods. The comminution and recovery processes used in the plant have no significant elements of technological innovation. The plant will produce variations in recovery due to the day-to-day changes in ore type or combinations of ore type being processed. These variations are expected to trend to the forecast recovery value for monthly or longer reporting periods. 22.14 Infrastructure The majority of the key infrastructure to support the mining activities envisaged in the LOM is in place. The nearshore soil barrier project is required to enable access to the mineral reserves within the Kapit pit sector. The preferred construction method is a high strength reinforced concrete diaphragm wall, spanning 800 m, with a nominal depth of 30.5 m. Power is currently produced at site by heavy fuel oil HFO reciprocating engines. The existing infrastructure, staff availability, existing power, water, and communications facilities, and the methods whereby goods are transported to the mine are all in place and well-established, and can support the estimation of mineral resources and mineral reserves. 22.15 Market Studies Newmont’s bullion is sold on the spot market, by marketing experts retained in-house by Newmont. The terms contained within the sales contracts are typical and consistent with standard industry practice and are similar to contracts for the supply of doré elsewhere in the world. Metal price assumptions are provided by Newmont management. Newmont considers analyst and broker price predictions, and price projections used by peers as inputs when preparing the management pricing forecasts. The largest in-place contracts other than for product sales cover items such as refining, security transport, data management and invoicing, mining contracts, sea freight, catering and accommodations support, air transport, and labor hire. Contracts are negotiated and renewed as needed. Contract terms are typical of similar contracts in PNG that Newmont is familiar with. 22.16 Environmental, Permitting and Social Considerations Baseline studies were completed in support of mine permitting. Environmental and social management plans were developed in support of operations. Mine development and operations commenced in 1997 in accordance with the Mine Development Contract. A regulatory-approved Environmental Management and Monitoring Plan is in place. All long-term stockpiles, except Kapit North and Wild West, are within the planned final pit boundary, and will need to be consumed or relocated to allow final pit development. Lihir Operations Papua New Guinea Technical Report Summary Date: February 2026 Page 22-7 Waste rock from the mine is either used for construction purposes or transported in barges for off-shore submarine disposal. Tailings are disposed using a deep sea tailings placement methodology. Water sources include a weir, spring, seawater supplement, and can include pit diversion run-off. Prolonged drought conditions are a risk to continued plant operations due to the lack of water. Sea water substitution measures can be implemented in the plant under major drought conditions, and can mitigate a portion, but not all, of the drought-related effects on production. All major permits and approvals are either in place or Newmont expects to obtain them in the normal course of business. Additional permitting will be required to support the nearshore soil barrier required in the LOM plan. Where permits have specific terms, renewal applications are made of the relevant regulatory authority as required, prior to the end of the permit term. Regular monitoring is undertaken of water quality for regulatory reporting. Newmont is currently conducting studies to assess appropriate means of managing acid and metalliferous drainage as the basis for an amendment to the Environment Permit for Waste Discharge. The 2025 undiscounted life of asset closure cost is US$0.7B. 22.17 Capital Cost Estimates Capital costs were based on recent prices or operating data and are at a minimum at a pre- feasibility level of confidence, having an accuracy level of ±25% and a contingency range not exceeding 15%. Capital costs included allowances for miscellaneous equipment, small projects, and other minor capital costs was included for mining, processing, and site general. The sustaining capital cost estimate is based current budget level costs, combined with recent average sustaining capital expenditures. Sustaining and development capital costs total US$2.2 B over the anticipated LOM. 22.18 Operating Cost Estimates Operating costs were derived from a variety of sources. The mining costs were derived from a purpose-built, activity-based cost model, while ore treatment and G&A costs were based on budgeted numbers adjusted for Newcrest’s long-term consumable price forecasts. Newmont accepted these inputs. The projected LOM plan operating costs are anticipated to total US$16.1 B, or US$73.01/t milled. 22.19 Economic Analysis The NPV at a discount rate of 10% is US$2.0 B. As cash flows are based on existing operations where all costs are considered sunk to January 1, 2026, considerations of payback and internal rate of return are not applicable. Free cash flow is US$ 3.1 B. The active mining operation and processing ceases in 2043; however, closure costs are estimated to 2066. The sensitivity of the Project to changes in grades, sustaining capital costs and operating cost assumptions was tested using a range of 25% above and below the base case values. The


Lihir Operations Papua New Guinea Technical Report Summary Date: February 2026 Page 22-8 changes in metal prices are representative of changes in grade. The Project is most sensitive to changes in the gold price and grade, less sensitive to changes in operating costs, and least sensitive to capital cost changes. 22.20 Risks and Opportunities 22.20.1 Risks Risks that may affect the mineral resource and mineral reserve estimates are identified in Chapter 11.14 and Chapter 12.6 respectively. The Project is located in a seismically-active area, and is subject to risks associated with earthquakes and tsunamis. If such events were to occur, impacts would include effects on infrastructure, the open pit, mine plans and the capital and operating costs that support the mineral reserves and economic analysis. The mine is proximal to a corrosive marine environment, which can have an effect on built infrastructure. The mine plan assumes asset integrity; however, unforeseen major corrosion could have an effect on the infrastructure, mine plan and the capital and operating costs that support the mineral reserves and economic analysis. The economic outcome in this Report assumes that Special Mining Lease 6, Leases for Mining Purposes 34–40, and Mining Easements 71–73, which expire on March 16, 2035, can be renewed for the remaining post-2035 mine life. The current mine plan envisages that mining will be allowed adjacent to, and to the west of, Ailaya Rock. The mine plan assumes steep wall mining techniques, and geotechnical monitoring will be a critical control. There is a risk that the technical aspects could result in damage to Ailaya Rock, and result in a significant social issue. The outcome could affect the social license to operate and affect the mine plan and economic forecasts in this Report. The LOM plan assumes that mining is feasible at elevations significantly below sea level, once the seepage, nearshore soil (NSB) and off-shore (OSB) barriers are in place and operational. If these barriers are ineffective or permit seawater ingress, there is a likely effect on the mine plan and economic forecasts in this Report. There is a risk that ongoing work will result in confidence classification changes, such that some of the material now classified as higher-confidence categories will be reclassified to lower confidence categories that cannot support conversion to mineral reserves, or be of such low confidence that they cannot be classified as inferred mineral resources. Changes to modelling methods may also affect confidence classifications. This could affect the mineral resource and mineral reserve estimates, locally affect the mine plan, stockpiling and recovery assumptions, and may affect the economic outcomes as presented in the Report. There is a risk that insufficient understanding of the distribution of the advanced/argillic or lower competency material could result in effects on the materials handling assumptions and equipment. There is a risk that the mill and crushers will be unable to efficiently process significant quantities of these types of materials. The mine plan assumes that deep sea tailings placement can continue for the LOM, and that extensions to the area that is subject to deep sea tailings placement can be extended. There is a risk that if these assumptions are incorrect, there will be an effect on the mine plan and economic Lihir Operations Papua New Guinea Technical Report Summary Date: February 2026 Page 22-9 forecasts in this Report if the alternatives come at a higher operating or sustaining capital cost and/or reduced productivity. The LOM plan assumes that future cost reductions at the end of the LOM can be achieved to support processing of lower-grade material. The PNG government has announced that it is considering replacing the current PNG Income Tax Act with a new Income Tax Act with limited consultation undertaken to date. The latest draft legislation provides that the new Income Tax Act will come into force from January 1, 2026. It remains uncertain as to whether existing tax attributes for the Lihir Operations will be transitioned under the new law due to the lack of transitional provisions, key regulations, and other key ancillary pieces of legislation. This is a risk to the cash flow analysis that supports the mineral reserves, and the assumptions used when estimating mineral reserves. 22.20.2 Opportunities There is Project upside opportunity if the mineral resources exclusive of mineral reserves can be upgraded to mineral reserves with additional testwork and studies. Newmont intends to introduce its “Full Potential” program to the Lihir Operations. This program seeks to implement continuous improvements in cost reduction and productivity. 22.21 Conclusions Under the assumptions presented in this Report, the Lihir Operations have a positive cash flow, and mineral reserve estimates can be supported. Lihir Operations Papua New Guinea Technical Report Summary Date: February 2026 Page 23-1 23.0 RECOMMENDATIONS As Lihir is an operating mine, the QP has no material recommendations to make. Lihir Operations Papua New Guinea Technical Report Summary Date: February 2026 Page 24-1 24.0 REFERENCES 24.1 Bibliography Ageneau, M., 2012: Geology of the Kapit Ore Zone and Comparative Geochemistry with Minifie and Lienetz Ore Zones, Ladolam Gold Deposit, Lihir Island, Papua New Guinea: unpublished PhD thesis, University of Tasmania, 269 p. Aqueduct Water Risk Atlas: https://www.wri.org/applications/maps/aqueduct-atlas. Asian Geos Pty Ltd., 2012: Geophysical Investigation Report, for Kapit Coffer Dam Offshore Geophysical Investigation, Lihir Island, Offshore Papua New Guinea: draft report prepared for Newcrest, 28 September, 2012, 188 p. Blackwell, J.L., 2010: Characteristics and Origins of Breccias in a Volcanic-hosted Alkalic Epithermal Gold Deposit, Ladolam, Lihir Island, Papua New Guinea: unpublished PhD thesis, University of Tasmania, Australia, 203 p. Blood, A.M., 2015: Approvals and Regulation in Papua New Guinea: article posted to AusIMM website, December 2015. Carman, G.D., 1994: Genesis of the Ladolam Gold Deposit, Lihir Island, Papua New Guinea: unpublished PhD thesis, Monash University, Australia, 381 p. Cater, G., 2002: Deep Hydrothermal Alteration at the Ladolam Epithermal Gold Deposit, Lihir Island, Papua New Guinea: unpublished MSc thesis, University of Auckland, New Zealand, 94 p. Collins, M.J., Hasenbank, A., Parekh, B., and Hewitt, B., 2011: Design of the New Lihir Gold Pressure Oxidation Autoclave: in Davis, B.R. and Kapusta, J.P.T., eds, New Technology Implementation in Metallurgical Processes, Proceedings of the 50th Annual Conference of the Metallurgists of CIM, pp. 101–110. Corbett, G., 2002: Epithermal Gold for Explorationists: AIG Journal, Applied Geoscientific Practice and Research in Australia: Paper 2002-01, February 2002; https://corbettgeology.com/wp-content/uploads/2016/07/Epithermal-Gold-2002.pdf Davies, R.M., and Ballantyne, G.H., 1987: Geology of the Ladolam Gold Deposit, Lihir Island, Papua New Guinea: PACRIM Conference ’87, Gold Coast, 26–29 August, 1987, pp. 943– 949. Department of Environment and Conservation (DEC), 2004: Guideline for Conduct of Environmental Impact Assessment and Preparation of an Environmental Impact Statement: PNG Department of Environment and Conservation. Gardner, K., 2016: Lihir Database Sulphide Sulphur Adjustments: internal Newcrest memorandum, 19 December 2016, 6 p. Gardner, K., 2019: RRSC Note – Lihir Alteration Model: internal Newcrest memorandum, 21 October, 2019, 4 p.


Lihir Operations Papua New Guinea Technical Report Summary Date: February 2026 Page 24-2 Gardner, K., Seaman, D., and O’Callaghan, J., 2017: Ore Deposit Knowledge – the Value of Continuous Improvement: The Conference of Metallurgists hosting World Gold & Nickel Cobalt Proceedings, 27–30 August, 2017, Vancouver, Canada. Garwin, S., Hall, R., and Watanbe, Y., 2005: Tectonic Setting, Geology and Gold and Copper Mineralisation in Cenozoic Magmatic Arcs of Southeast Asia and the West Pacific: Economic Geology 100th Anniversary Volume, pp 891–930. GBG Australia Pty Ltd, 2017: Marine and Land Based Geophysical Investigations Inner Harbour, Newcrest Gold Lihir, Lihir Island, PNG: report prepared for Newcrest, 5 June, 2017, 20 p. Gleeson, K., Butt, S., O’Callaghan, J., and Jones, C., 2020: Lihir Operations, Aniolam Island, Papua New Guinea, NI 43-101 Technical Report: report prepared for Newcrest, effective date 30 June, 2020. Harris, A., 2016: Lihir Island–Island-Scale Exploration Targeting; Review of Historical Data Sets, March 2016: internal Newcrest PowerPoint presentation, 11 March 2016. Hill, K.C., Kendrick, R.D., Crowhurst, P.V., and Gow, P.A., 2002: Copper–Gold Mineralisation in New Guinea: Tectonics, Lineaments, Thermochronology and Structure: Australian Journal of Earth Sciences, v. 49, pp. 737−752. Independent State of Papua New Guinea, 2005: Mine Closure Policy and Guidelines. Independent State of Papua New Guinea, 2019: Mining Project Rehabilitation and Closure Guidelines: Papua New Guinea, September 2019, Intergovernmental Forum on Mining, Minerals, Metals and Sustainable Development. Jones, R., 2013: Lihir Resource Development, QAQC Review: internal Newcrest memorandum, undated. Jones, R., 2013b: Sulphur Bias at Lihir Since 2003: internal Newcrest memorandum, 23 December 2013, 14 p. Jones, R., 2014: QAQC Review to Accompany Resource Statement on Work Carried Out In 2011-12: internal Newcrest memorandum, 11 January, 2014, Kentwell, D., and Guibal, D., 2018: Lihir Mineral Resource Review: report prepared by SRK Consulting (Australasia) Pty Ltd for Newcrest, 20 February 2018, 15 p. Ketchan, V.J., O’Reilly, J.F., and Vardill, W.D., 1993: The Lihir Gold Project; Process Plant Design: Minerals Engineering, 16(8–10), pp. 1037–1065. Knight, P., 2018: PFS Technical Study Report, Lihir Pit Cooling Study, (PFS1): internal Newcrest report, 30 January 2018. Knight, P., 2019: PFS Technical Study Report, Lihir Pit Cooling Study, (PFS2): internal Newcrest report, 23 August 2019. Lawlis, E., 2020: Geology and Geochemistry of the Kapit NE Prospect, Lihir Gold Deposit, Papua New Guinea: unpublished PhD thesis, University of Tasmania, Australia. Malana, E., 2018: Kinami Field Mapping, EL 485 – Lihir Island: internal Newcrest report, 4 June 2018, 16 p. Lihir Operations Papua New Guinea Technical Report Summary Date: February 2026 Page 24-3 Moorhead, C., 2014, Technical Report on the Lihir Property in Papua New Guinea; March 2014, NI 43-101 Technical Report by Newcrest Mining Limited, 88 p. Napier-Munn, T. J., 2014: Statistical Methods for Mineral Engineers - How to Design Experiments and Analyse Data: JKMRC Monograph Series in Mining and Mineral Processing, 627 p. Phillips, G., 2019: QAQC Report for the Period 26/6/2012 to 31/5/2019: internal Newcrest memorandum, June 2019, 9 p. Reynolds, M., 2017, Slope Model 2017 v5.1 Release Notes; 3 September 2017, Newcrest Internal Memorandum Report to Dave Grigg, 3 p. Richards, J.P., 2003: Tectono-Magmatic Precursors for Porphyry Cu-(Mo-Au) Deposit Formation: Economic Geology Vol. 98, 2003, pp. 1515–1533. Seaman, D., and Gardner, K., 2017: Updated Metallurgical Functions – New Alteration Domains: internal Newcrest memorandum, 4 April, 2017, 20 p. Sillitoe, R., 2010: Porphyry Copper Systems: Economic Geology, v. 105, pp. 3–41. Smith, R. I., 1990: Tertiary Plate Tectonic Setting and Evolution of Papua New Guinea, in Carman, G.J., and Carman, Z. eds: Petroleum Exploration in Papua New Guinea: Proceedings of the First PNG Petroleum Convention. Port Moresby, pp. 229–244. Struckmeyer, H.I.M., Young, M., and Pigram, C.J., 1993: Mesozoic and Cainozoic Plate Tectonic and Palaeogeographic Evolution of the New Guinea Region: in Carman, G., J., and Carman, Z., eds: Petroleum Exploration and Development in Papua New Guinea: Proceedings of the Second PNG Petroleum Convention, Port Moresby, pp 261–290. Sykora, S., 2016: Origin, Evolution and Significance of Anhydrite-Bearing Vein Arrays and Breccias, Lienetz Orebody, Lihir Gold Deposit, Papua New Guinea: unpublished PhD thesis, University of Tasmania, Australia. The National, 2017: National Executive Council to Review New Policies: newspaper article, The National, 6 October 2017, accessed at http://www.thenational.com.pg/national-executive- council-review-new-policies/. Tingey, R.J., and Grainger, D.J., 1976: Markham, Papua New Guinea 1:250,000 Geological Series: Bureau of Mineral Resources, Australia, Explanatory Notes, SB/55-10. Lihir Operations Papua New Guinea Technical Report Summary Date: February 2026 Page 24-4 24.2 Abbreviations Abbreviation/Symbol Term AA atomic absorption AMD acid and metalliferous drainage APFD Approved Proposal for Development ARD acid rock drainage B billion CCD counter-current decantation CEPA Conservation and Environment Protection Authority CIL carbon-in-leach CV co-efficient of variation CY calendar year DGPS differential global positioning system DSTP deep sea tailings placement EMMP Environmental Management and Monitoring Plan FA fire assay FGO grinding and flotation plant upgrade FIFO fly-in-fly-out FY financial year G&A general and administrative GPS global positioning system HGO high-grade ore ICP-AES inductively coupled plasma atomic emission spectroscopy ICP-MS inductively coupled plasma–mass spectrometry ICP-OES inductively coupled plasma optical emission spectroscopy ID2 inverse distance to the power of two IFC International Finance Corporation IP induced polarization koz thousand ounces kt thousand tonnes LA–ICP–MS laser ablation inductively-coupled plasma mass spectrometry LBMA London Bullion Market Association (now known simply as LBMA) LECO analyzer designed for wide-range measurement of carbon and sulfur content of mineralization LG Lerchs–Grossmann LME London Metal Exchange LOM life-of-mine LUC local uniform conditioning Lihir Operations Papua New Guinea Technical Report Summary Date: February 2026 Page 24-5 Abbreviation/Symbol Term M million MAC Mining Advisory Council Mlb million pounds MOPU Million Ounce Project Upgrade - major plant expansion from ~2012 MRA Minerals Resources Authority MSHA United States Mine Safety and Health Administration Mt million tonnes MX$ Mexican peso NCA neutralization, cyanidation, and adsorption Newmont Newmont Corporation NN nearest neighbor NPV net present value NSR net smelter return OES optical emission spectrometry PAG potentially acid-generating PC pyrite calcite alteration PGK PNG kina PM10 Particulate matter with a diameter of ≤10 µm, inhalable into lungs PM2.5 Particulate matter with a diameter of ≤2.5 µm, inhalable into lungs PNG Papua New Guinea POX pressure oxide leach QA/QC quality assurance and quality control QP Qualified Person RAB rotary air blast RC reverse circulation ROM run-of-mine RQD rock quality description SAG semi-autogenous grind SG specific gravity SME Society for Mining, Metallurgy and Exploration SMU selective mining unit SRCE standard reclamation cost estimator UC uniform conditioning US United States US$ United States dollar v/v volume/volume


Lihir Operations Papua New Guinea Technical Report Summary Date: February 2026 Page 24-6 24.3 Glossary of Terms Term Definition acid rock drainage/ acid mine drainage Characterized by low pH, high sulfate, and high iron and other metal species. alluvium Unconsolidated terrestrial sediment composed of sorted or unsorted sand, gravel, and clay that was deposited by water. ANFO A free-running explosive used in mine blasting made of 94% prilled aluminum nitrate and 6% No. 3 fuel oil. aquifer A geologic formation capable of transmitting significant quantities of groundwater under normal hydraulic gradients. azimuth The direction of one object from another, usually expressed as an angle in degrees relative to true north. Azimuths are usually measured in the clockwise direction, thus an azimuth of 90 degrees indicates that the second object is due east of the first. ball mill A piece of milling equipment used to grind ore into small particles. It is a cylindrical shaped steel container filled with steel balls into which crushed ore is fed. The ball mill is rotated causing the balls themselves to cascade, which in turn grinds the ore. bullion Unrefined gold and/or silver mixtures that have been melted and cast into a bar or ingot. carbonaceous Containing graphitic or hydrocarbon species, e.g., in an ore or concentrate; such materials generally present some challenge in processing, e.g., preg- robbing characteristics. comminution/crushing/grinding Crushing and/or grinding of ore by impact and abrasion. Usually, the word "crushing" is used for dry methods and "grinding" for wet methods. Also, "crushing" usually denotes reducing the size of coarse rock while "grinding" usually refers to the reduction of the fine sizes. concentrate The concentrate is the valuable product from mineral processing, as opposed to the tailing, which contains the waste minerals. The concentrate represents a smaller volume than the original ore counter-current decantation (CCD) A process where a slurry is thickened and washed in multiple stages, where clean water is added to the last thickener, and overflows from each thickener are progressively transferred to the previous thickener, countercurrent to the flow of thickened slurry. customary Rules and practices that govern an indigenous people of a society in their way of life, and their roles and responsibilities toward each other. customary land A form of collective and inalienable title which adapts and sustains common benefits over many generations. cut-off grade A grade level below which the material is not “ore” and considered to be uneconomical to mine and process. The minimum grade of ore used to establish reserves. data verification The process of confirming that data was generated with proper procedures, was accurately transcribed from the original source and is suitable to be used for mineral resource and mineral reserve estimation density The mass per unit volume of a substance, commonly expressed in grams/ cubic centimeter. Lihir Operations Papua New Guinea Technical Report Summary Date: February 2026 Page 24-7 Term Definition diatreme A volcanic vent or pipe that formed when magma was forced through flat-lying sedimentary rock dilution Waste of low-grade rock which is unavoidably removed along with the ore in the mining process. easement Areas of land owned by the property owner, but in which other parties, such as utility companies, may have limited rights granted for a specific purpose. encumbrance An interest or partial right in real property which diminished the value of ownership, but does not prevent the transfer of ownership. Mortgages, taxes, and judgements are encumbrances known as liens. Restrictions, easements, and reservations are also encumbrances, although not liens. feasibility study A feasibility study is a comprehensive technical and economic study of the selected development option for a mineral project, which includes detailed assessments of all applicable modifying factors, as defined by this section, together with any other relevant operational factors, and detailed financial analysis that are necessary to demonstrate, at the time of reporting, that extraction is economically viable. The results of the study may serve as the basis for a final decision by a proponent or financial institution to proceed with, or finance, the development of the project. A feasibility study is more comprehensive, and with a higher degree of accuracy, than a pre-feasibility study. It must contain mining, infrastructure, and process designs completed with sufficient rigor to serve as the basis for an investment decision or to support project financing. flotation Separation of minerals based on the interfacial chemistry of the mineral particles in solution. Reagents are added to the ore slurry to render the surface of selected minerals hydrophobic. Air bubbles are introduced to which the hydrophobic minerals attach. The selected minerals are levitated to the top of the flotation machine by their attachment to the bubbles and into a froth product, called the "flotation concentrate." If this froth carries more than one mineral as a designated main constituent, it is called a "bulk float". If it is selective to one constituent of the ore, where more than one will be floated, it is a "differential" float. flowsheet The sequence of operations, step by step, by which ore is treated in a milling, concentration, or smelting process. frother A type of flotation reagent which, when dissolved in water, imparts to it the ability to form a stable froth fumarole An opening that emits steam and gases. gangue The fraction of ore rejected as tailing in a separating process. It is usually the valueless portion, but may have some secondary commercial use geothermal Heat generated within the earth gravity concentrator Uses the differences in specific gravity between gold and gangue minerals to realize a separation of the gold from the gangue. heap leaching A process whereby valuable metals, usually gold and silver, are leached from a heap or pad of crushed ore by leaching solutions percolating down through the heap and collected from a sloping, impermeable liner below the pad. indicated mineral resource An indicated mineral resource is that part of a mineral resource for which quantity and grade or quality are estimated on the basis of adequate geological evidence and sampling. The term adequate geological evidence Lihir Operations Papua New Guinea Technical Report Summary Date: February 2026 Page 24-8 Term Definition means evidence that is sufficient to establish geological and grade or quality continuity with reasonable certainty. The level of geological certainty associated with an indicated mineral resource is sufficient to allow a qualified person to apply modifying factors in sufficient detail to support mine planning and evaluation of the economic viability of the deposit. inferred mineral resource An inferred mineral resource is that part of a mineral resource for which quantity and grade or quality are estimated on the basis of limited geological evidence and sampling. The term limited geological evidence means evidence that is only sufficient to establish that geological and grade or quality continuity is more likely than not. The level of geological uncertainty associated with an inferred mineral resource is too high to apply relevant technical and economic factors likely to influence the prospects of economic extraction in a manner useful for evaluation of economic viability. A qualified person must have a reasonable expectation that the majority of inferred mineral resources could be upgraded to indicated or measured mineral resources with continued exploration; and should be able to defend the basis of this expectation before his or her peers. initial assessment An initial assessment is a preliminary technical and economic study of the economic potential of all or parts of mineralization to support the disclosure of mineral resources. The initial assessment must be prepared by a qualified person and must include appropriate assessments of reasonably assumed technical and economic factors, together with any other relevant operational factors, that are necessary to demonstrate at the time of reporting that there are reasonable prospects for economic extraction. An initial assessment is required for disclosure of mineral resources but cannot be used as the basis for disclosure of mineral reserves internal rate of return (IRR) The rate of return at which the Net Present Value of a project is zero; the rate at which the present value of cash inflows is equal to the present value of the cash outflows. life of mine (LOM) Number of years that the operation is planning to mine and treat ore, and is taken from the current mine plan based on the current evaluation of ore reserves. measured mineral resource A measured mineral resource is that part of a mineral resource for which quantity and grade or quality are estimated on the basis of conclusive geological evidence and sampling. The term conclusive geological evidence means evidence that is sufficient to test and confirm geological and grade or quality continuity. The level of geological certainty associated with a measured mineral resource is sufficient to allow a qualified person to apply modifying factors, as defined in this section, in sufficient detail to support detailed mine planning and final evaluation of the economic viability of the deposit. megapode Also known as incubator birds or mound-builders, are stocky, medium-large, chicken-like birds with small heads and large feet in the family Megapodiidae. Their name literally means "large foot" and is a reference to the heavy legs and feet typical of these terrestrial birds. merger A voluntary combination of two or more companies whereby both stocks are merged into one. mill Includes any ore mill, sampling works, concentration, and any crushing, grinding, or screening plant used at, and in connection with, an excavation or mine. Lihir Operations Papua New Guinea Technical Report Summary Date: February 2026 Page 24-9 Term Definition mineral reserve A mineral reserve is an estimate of tonnage and grade or quality of indicated and measured mineral resources that, in the opinion of the qualified person, can be the basis of an economically viable project. More specifically, it is the economically mineable part of a measured or indicated mineral resource, which includes diluting materials and allowances for losses that may occur when the material is mined or extracted. The determination that part of a measured or indicated mineral resource is economically mineable must be based on a preliminary feasibility (pre- feasibility) or feasibility study, as defined by this section, conducted by a qualified person applying the modifying factors to indicated or measured mineral resources. Such study must demonstrate that, at the time of reporting, extraction of the mineral reserve is economically viable under reasonable investment and market assumptions. The study must establish a life of mine plan that is technically achievable and economically viable, which will be the basis of determining the mineral reserve. The term economically viable means that the qualified person has determined, using a discounted cash flow analysis, or has otherwise analytically determined, that extraction of the mineral reserve is economically viable under reasonable investment and market assumptions. The term investment and market assumptions includes all assumptions made about the prices, exchange rates, interest and discount rates, sales volumes, and costs that are necessary to determine the economic viability of the mineral reserves. The qualified person must use a price for each commodity that provides a reasonable basis for establishing that the project is economically viable. mineral resource A mineral resource is a concentration or occurrence of material of economic interest in or on the Earth’s crust in such form, grade or quality, and quantity that there are reasonable prospects for economic extraction. The term material of economic interest includes mineralization, including dumps and tailings, mineral brines, and other resources extracted on or within the earth’s crust. It does not include oil and gas resources, gases (e.g., helium and carbon dioxide), geothermal fields, and water. When determining the existence of a mineral resource, a qualified person, as defined by this section, must be able to estimate or interpret the location, quantity, grade or quality continuity, and other geological characteristics of the mineral resource from specific geological evidence and knowledge, including sampling; and conclude that there are reasonable prospects for economic extraction of the mineral resource based on an initial assessment, as defined in this section, that he or she conducts by qualitatively applying relevant technical and economic factors likely to influence the prospect of economic extraction. net present value (NPV) The present value of the difference between the future cash flows associated with a project and the investment required for acquiring the project. Aggregate of future net cash flows discounted back to a common base date, usually the present. NPV is an indicator of how much value an investment or project adds to a company. net smelter return (NSR) A defined percentage of the gross revenue from a resource extraction operation, less a proportionate share of transportation, insurance, and processing costs.


Lihir Operations Papua New Guinea Technical Report Summary Date: February 2026 Page 24-10 Term Definition open pit A mine that is entirely on the surface. Also referred to as open-cut or open- cast mine. ounce (oz) (troy) Used in imperial statistics. A kilogram is equal to 32.1507 ounces. A troy ounce is equal to 31.1035 grams. overburden Material of any nature, consolidated or unconsolidated, that overlies a deposit of ore that is to be mined. pebble crushing A crushing process on screened larger particles that exit through the grates of a SAG mill. Such particles (typically approx. 50 mm diameter) are not efficiently broken in the SAG mill and are therefore removed and broken, typically using a cone crusher. The crushed pebbles are then fed to a grinding mill for further breakage. phyllic alteration Minerals include quartz-sericite-pyrite plant A group of buildings, and especially to their contained equipment, in which a process or function is carried out; on a mine it will include warehouses, hoisting equipment, compressors, repair shops, offices, mill or concentrator. potassic alteration A relatively high temperature type of alteration which results from potassium enrichment. Characterized by biotite, K-feldspar, adularia. preg-robbing A characteristic of certain ores, typically that contain carbonaceous species, where dissolved gold is re-adsorbed by these species, leading to an overall reduction in gold recovery. Such ores require more complex treatment circuits to maximize gold recovery. preliminary feasibility study, pre- feasibility study A preliminary feasibility study (prefeasibility study) is a comprehensive study of a range of options for the technical and economic viability of a mineral project that has advanced to a stage where a qualified person has determined (in the case of underground mining) a preferred mining method, or (in the case of surface mining) a pit configuration, and in all cases has determined an effective method of mineral processing and an effective plan to sell the product. A pre-feasibility study includes a financial analysis based on reasonable assumptions, based on appropriate testing, about the modifying factors and the evaluation of any other relevant factors that are sufficient for a qualified person to determine if all or part of the indicated and measured mineral resources may be converted to mineral reserves at the time of reporting. The financial analysis must have the level of detail necessary to demonstrate, at the time of reporting, that extraction is economically viable pressure oxidation A process recovery that uses elevated temperatures and pressures in the presence of oxygen to recover valuable elements. probable mineral reserve A probable mineral reserve is the economically mineable part of an indicated and, in some cases, a measured mineral resource. For a probable mineral reserve, the qualified person’s confidence in the results obtained from the application of the modifying factors and in the estimates of tonnage and grade or quality is lower than what is sufficient for a classification as a proven mineral reserve, but is still sufficient to demonstrate that, at the time of reporting, extraction of the mineral reserve is economically viable under reasonable investment and market assumptions. The lower level of confidence is due to higher geologic uncertainty when the qualified person converts an indicated mineral resource to a probable reserve or higher risk in the results of the application of modifying factors at the time when the qualified person converts a measured mineral resource to a probable mineral reserve. Lihir Operations Papua New Guinea Technical Report Summary Date: February 2026 Page 24-11 Term Definition A qualified person must classify a measured mineral resource as a probable mineral reserve when his or her confidence in the results obtained from the application of the modifying factors to the measured mineral resource is lower than what is sufficient for a proven mineral reserve. propylitic Characteristic greenish color. Minerals include chlorite, actinolite and epidote. Typically contains the assemblage quartz–chlorite–carbonate proven mineral reserve A proven mineral reserve is the economically mineable part of a measured mineral resource. For a proven mineral reserve, the qualified person has a high degree of confidence in the results obtained from the application of the modifying factors and in the estimates of tonnage and grade or quality. A proven mineral reserve can only result from conversion of a measured mineral resource. qualified person A qualified person is an individual who is a mineral industry professional with at least five years of relevant experience in the type of mineralization and type of deposit under consideration and in the specific type of activity that person is undertaking on behalf of the registrant; and an eligible member or licensee in good standing of a recognized professional organization at the time the technical report is prepared. For an organization to be a recognized professional organization, it must: (A) Be either: (1) An organization recognized within the mining industry as a reputable professional association, or (2) A board authorized by U.S. federal, state, or foreign statute to regulate professionals in the mining, geoscience, or related field; (B) Admit eligible members primarily on the basis of their academic qualifications and experience; (C) Establish and require compliance with professional standards of competence and ethics; (D) Require or encourage continuing professional development; (E) Have and apply disciplinary powers, including the power to suspend or expel a member regardless of where the member practices or resides; and; (F) Provide a public list of members in good standing. reclamation The restoration of a site after mining or exploration activity is completed. refining A high temperature process in which impure metal is reacted with flux to reduce the impurities. The metal is collected in a molten layer and the impurities in a slag layer. Refining results in the production of a marketable material. resistivity Observation of electric fields caused by current introduced into the ground as a means of studying earth resistivity in geophysical exploration. Resistivity is the property of a material that resists the flow of electrical current rock quality designation (RQD) A measure of the competency of a rock, determined by the number of fractures in a given length of drill core. For example, a friable ore will have many fractures and a low RQD. royalty An amount of money paid at regular intervals by the lessee or operator of an exploration or mining property to the owner of the ground. Generally based on a specific amount per tonne or a percentage of the total production or profits. Also, the fee paid for the right to use a patented process. Lihir Operations Papua New Guinea Technical Report Summary Date: February 2026 Page 24-12 Term Definition run-of-mine (ROM) Rehandle where the raw mine ore material is fed into the processing plant’s system, usually the crusher. This is where material that is not direct feed from the mine is stockpiled for later feeding. Run-of-mine relates to the rehandle being for any mine material, regardless of source, before entry into the processing plant’s system. semi-autogenous grinding (SAG) A method of grinding rock into fine powder whereby the grinding media consists of larger chunks of rocks and steel balls. specific gravity The weight of a substance compared with the weight of an equal volume of pure water at 4°C. tailings Material rejected from a mill after the recoverable valuable minerals have been extracted. triaxial compressive strength A test for the compressive strength in all directions of a rock or soil sample uniaxial compressive strength A measure of the strength of a rock, which can be determined through laboratory testing, and used both for predicting ground stability underground, and the relative difficulty of crushing. Lihir Operations Papua New Guinea Technical Report Summary Date: February 2026 Page 25-1 25.0 RELIANCE ON INFORMATION PROVIDED BY THE REGISTRANT 25.1 Introduction The QP fully relied on the registrant for the information used in the areas noted in the following sub-sections. The QP considers it reasonable to rely on the registrant for the information identified in those sub-sections, for the following reasons: • The registrant has been Owner and operator of the mining operations for about 15 years; • The registrant has employed industry professionals with expertise in the areas listed in the following sub-sections; • The registrant has a formal system of oversight and governance over these activities, including a layered responsibility for review and approval; • The registrant has considerable experience in each of these areas. 25.2 Macroeconomic Trends • Information relating to inflation, interest rates, discount rates, exchange rates, and taxes was obtained from the registrant. This information is used in the economic analysis in Chapter 19. It supports the assessment of reasonable prospects for economic extraction of the mineral resource estimates in Chapter 11, and inputs to the determination of economic viability of the mineral reserve estimates in Chapter 12. 25.3 Markets • Information relating to market studies/markets for product, market entry strategies, marketing and sales contracts, product valuation, product specifications, refining and treatment charges, transportation costs, agency relationships, material contracts (e.g., mining, concentrating, smelting, refining, transportation, handling, hedging arrangements, and forward sales contracts), and contract status (in place, renewals), was obtained from the registrant. This information is used in the economic analysis in Chapter 19. It supports the assessment of reasonable prospects for economic extraction of the mineral resource estimates in Chapter 11, and inputs to the determination of economic viability of the mineral reserve estimates in Chapter 12. 25.4 Legal Matters • Information relating to the corporate ownership interest, the mineral tenure (concessions, payments to retain property rights, obligations to meet expenditure/reporting of work conducted), surface rights, water rights (water take allowances), royalties, encumbrances,


Lihir Operations Papua New Guinea Technical Report Summary Date: February 2026 Page 25-2 easements and rights-of-way, violations and fines, permitting requirements, and the ability to maintain and renew permits was obtained from the registrant. This information is used in support of the property description and ownership information in Chapter 3, the permitting and mine closure descriptions in Chapter 17, and the economic analysis in Chapter 19. It supports the reasonable prospects of economic extraction for the mineral resource estimates in Chapter 11, and the assumptions used in demonstrating economic viability of the mineral reserve estimates in Chapter 12. 25.5 Environmental Matters • Information relating to baseline and supporting studies for environmental permitting, environmental permitting and monitoring requirements, ability to maintain and renew permits, emissions controls, closure planning, closure and reclamation bonding and bonding requirements, sustainability accommodations, and monitoring for and compliance with requirements relating to protected areas and protected species was obtained from the registrant. This information is used when discussing property ownership information in Chapter 3, the permitting and closure discussions in Chapter 17, and the economic analysis in Chapter 19. It supports the reasonable prospects of economic extraction for the mineral resource estimates in Chapter 11, and the assumptions used in demonstrating economic viability of the mineral reserve estimates in Chapter 12. 25.6 Stakeholder Accommodations • Information relating to social and stakeholder baseline and supporting studies, hiring, and training policies for workforce from local communities, partnerships with stakeholders (including national, regional, and state mining associations; trade organizations; fishing organizations; state and local chambers of commerce; economic development organizations; non-government organizations; and, state and federal governments), and the community relations plan was obtained from the registrant. This information is used in the social and community discussions in Chapter 17, and the economic analysis in Chapter 19. It supports the reasonable prospects of economic extraction for the mineral resource estimates in Chapter 11, and the assumptions used in demonstrating economic viability of the mineral reserve estimates in Chapter 12. 25.7 Governmental Factors • Information relating to taxation and royalty considerations at the Project level, monitoring requirements and monitoring frequency, bonding requirements, and violations and fines was obtained from the registrant. This information is used in the discussion on royalties and property encumbrances in Chapter 3, the monitoring, permitting and closure discussions in Chapter 17, and the economic analysis in Chapter 19. It supports the reasonable prospects of economic extraction for the mineral resource estimates in Chapter 11, and the assumptions used in demonstrating economic viability of the mineral reserve estimates in Chapter 12.


Ahafo Complex Ghana Technical Report Summary Report current as at: December 31, 2025 Qualified Person: Mr. Shaun Chanter, RM SME. Ahafo Complex Ghana Technical Report Summary Date: February 2026 Page a NOTE REGARDING FORWARD-LOOKING INFORMATION This Technical Report Summary contains forward-looking statements within the meaning of the U.S. Securities Act of 1933 and the U.S. Securities Exchange Act of 1934 (and the equivalent under Canadian securities laws), that are intended to be covered by the safe harbor created by such sections. Such forward-looking statements include, without limitation, statements regarding Newmont’s expectation for its mines and any related development or expansions, including estimated cash flows, production, revenue, EBITDA, costs, taxes, capital, rates of return, mine plans, material mined and processed, recoveries and grade, future mineralization, future adjustments and sensitivities and other statements that are not historical facts. Forward-looking statements address activities, events, or developments that Newmont expects or anticipates will or may occur in the future and are based on current expectations and assumptions. Although Newmont’s management believes that its expectations are based on reasonable assumptions, it can give no assurance that these expectations will prove correct. Such assumptions, include, but are not limited to: (i) there being no significant change to current geotechnical, metallurgical, hydrological and other physical conditions; (ii) permitting, development, operations and expansion of operations and projects being consistent with current expectations and mine plans, including, without limitation, receipt of export approvals; (iii) political developments in any jurisdiction in which Newmont operates being consistent with its current expectations; (iv) certain exchange rate assumptions being approximately consistent with current levels; (v) certain price assumptions for gold, copper, silver, molybdenum and oil; (vi) prices for key supplies being approximately consistent with current levels; and (vii) other planning assumptions. Important factors that could cause actual results to differ materially from those in the forward- looking statements include, among others, risks that estimates of mineral reserves and mineral resources are uncertain and the volume and grade of ore actually recovered may vary from our estimates, risks relating to fluctuations in metal prices; risks due to the inherently hazardous nature of mining-related activities; risks related to the jurisdictions in which we operate, uncertainties due to health and safety considerations, uncertainties related to environmental considerations, including, without limitation, climate change, uncertainties relating to obtaining approvals and permits, including renewals, from governmental regulatory authorities; and uncertainties related to changes in law; as well as those factors discussed in Newmont’s filings with the U.S. Securities and Exchange Commission, including Newmont’s latest Annual Report on Form 10-K for the period ended December 31, 2025, which is available on newmont.com. Newmont does not undertake any obligation to release publicly revisions to any “forward-looking statement,” including, without limitation, outlook, to reflect events or circumstances after the date of this document, or to reflect the occurrence of unanticipated events, except as may be required under applicable securities laws. Investors should not assume that any lack of update to a previously issued “forward-looking statement” constitutes a reaffirmation of that statement. Continued reliance on “forward-looking statements” is at investors’ own risk. Ahafo Complex Ghana Technical Report Summary Date: February 2026 Page i CONTENTS 1.0 EXECUTIVE SUMMARY ........................................................................................................... 1-1 1.1 Introduction ................................................................................................................................. 1-1 1.2 Terms of Reference ................................................................................................................... 1-1 1.3 Property Setting.......................................................................................................................... 1-1 1.4 Ownership .................................................................................................................................. 1-2 1.5 Mineral Tenure, Surface Rights, Water Rights, Royalties and Agreements .............................. 1-2 1.6 Geology and Mineralization ........................................................................................................ 1-3 1.7 History and Exploration .............................................................................................................. 1-4 1.8 Drilling and Sampling ................................................................................................................. 1-4 1.8.1 Drilling .................................................................................................................................... 1-4 1.8.2 Hydrogeology ......................................................................................................................... 1-5 1.8.3 Geotechnical .......................................................................................................................... 1-5 1.8.4 Sampling and Assay .............................................................................................................. 1-5 1.8.5 Quality Assurance and Quality Control .................................................................................. 1-6 1.9 Data Verification ......................................................................................................................... 1-6 1.10 Metallurgical Testwork ............................................................................................................... 1-7 1.11 Mineral Resource Estimation ..................................................................................................... 1-8 1.11.1 Estimation Methodology ......................................................................................................... 1-8 1.11.2 Mineral Resource Statement .................................................................................................. 1-9 1.11.3 Factors That May Affect the Mineral Resource Estimate .................................................... 1-12 1.12 Mineral Reserve Estimation ..................................................................................................... 1-12 1.12.1 Estimation Methodology ....................................................................................................... 1-12 1.12.1.1 Open Pit ....................................................................................................................... 1-12 1.12.1.2 Underground ................................................................................................................ 1-13 1.12.1.3 Stockpiles ..................................................................................................................... 1-13 1.12.1.4 Commodity Prices ........................................................................................................ 1-13 1.12.2 Mineral Reserve Statement .................................................................................................. 1-13 1.12.3 Factors That May Affect the Mineral Reserve Estimate ...................................................... 1-15 1.13 Mining Methods ........................................................................................................................ 1-15 1.13.1 Open Pit ............................................................................................................................... 1-15 1.13.2 Underground ........................................................................................................................ 1-15 1.14 Recovery Methods ................................................................................................................... 1-16 1.15 Infrastructure ............................................................................................................................ 1-17 1.16 Markets and Contracts ............................................................................................................. 1-17 1.17 Environmental, Permitting and Social Considerations ............................................................. 1-18 1.17.1 Environmental Studies and Monitoring ................................................................................ 1-18 1.17.2 Closure and Reclamation Considerations ............................................................................ 1-18 1.17.3 Permitting ............................................................................................................................. 1-19 1.17.4 Social Considerations, Plans, Negotiations and Agreements .............................................. 1-19 1.18 Capital Cost Estimates ............................................................................................................. 1-19 1.19 Operating Cost Estimates ........................................................................................................ 1-20 1.20 Economic Analysis ................................................................................................................... 1-21 1.20.1 Economic Analysis ............................................................................................................... 1-21 1.20.2 Sensitivity Analysis ............................................................................................................... 1-22 1.21 Risks and Opportunities ........................................................................................................... 1-23 1.21.1 Risks ..................................................................................................................................... 1-23 1.21.2 Opportunities ........................................................................................................................ 1-24 1.22 Conclusions .............................................................................................................................. 1-24 Ahafo Complex Ghana Technical Report Summary Date: February 2026 Page ii 1.23 Recommendations ................................................................................................................... 1-24 2.0 INTRODUCTION ........................................................................................................................ 2-1 2.1 Registrant ................................................................................................................................... 2-1 2.2 Terms of Reference ................................................................................................................... 2-1 2.2.1 Report Purpose ...................................................................................................................... 2-1 2.2.2 Terms of Reference ............................................................................................................... 2-1 2.3 Qualified Persons ....................................................................................................................... 2-4 2.4 Site Visits and Scope of Personal Inspection ............................................................................ 2-4 2.5 Report Date ................................................................................................................................ 2-4 2.6 Information Sources and References ........................................................................................ 2-4 2.7 Previous Technical Report Summaries ...................................................................................... 2-4 3.0 PROPERTY DESCRIPTION ...................................................................................................... 3-1 3.1 Introduction ................................................................................................................................. 3-1 3.2 Property and Title in Ghana ....................................................................................................... 3-1 3.2.1 Mineral Title ............................................................................................................................ 3-1 3.2.2 Surface Rights ........................................................................................................................ 3-2 3.2.3 Royalties ................................................................................................................................. 3-3 3.3 Ownership .................................................................................................................................. 3-3 3.3.1 Ownership History .................................................................................................................. 3-3 3.3.2 Current Ownership ................................................................................................................. 3-4 3.4 Mineral Title ................................................................................................................................ 3-4 3.5 Surface Rights ............................................................................................................................ 3-8 3.6 Water Rights ............................................................................................................................... 3-9 3.7 Forest Reserves ......................................................................................................................... 3-9 3.8 Agreements ................................................................................................................................ 3-9 3.8.1 Investment Agreement ........................................................................................................... 3-9 3.8.2 Government of Ghana Free-Carried Interest ......................................................................... 3-9 3.9 Royalties ................................................................................................................................... 3-10 3.10 Encumbrances ......................................................................................................................... 3-10 3.11 Permitting ................................................................................................................................. 3-10 3.12 Significant Factors and Risks That May Affect Access, Title or Work Programs .................... 3-10 4.0 ACCESSIBILITY, CLIMATE, LOCAL RESOURCES, INFRASTRUCTURE AND PHYSIOGRAPHY ...................................................................................................................................... 4-1 4.1 Physiography .............................................................................................................................. 4-1 4.2 Accessibility ................................................................................................................................ 4-1 4.3 Climate ....................................................................................................................................... 4-2 4.4 Infrastructure .............................................................................................................................. 4-2 5.0 HISTORY ................................................................................................................................... 5-1 6.0 GEOLOGICAL SETTING, MINERALIZATION, AND DEPOSIT ............................................... 6-1 6.1 Deposit Type .............................................................................................................................. 6-1 6.2 Regional Geology ....................................................................................................................... 6-1 6.3 Project Geology .......................................................................................................................... 6-2 6.4 Deposit Descriptions .................................................................................................................. 6-6 6.4.1 Apensu ................................................................................................................................... 6-6 6.4.1.1 Deposit Dimensions ........................................................................................................... 6-6 6.4.1.2 Lithologies .......................................................................................................................... 6-6 6.4.1.3 Structure ............................................................................................................................. 6-8 6.4.1.4 Alteration ............................................................................................................................ 6-8 6.4.1.5 Mineralization ..................................................................................................................... 6-9 6.4.2 Awonsu ................................................................................................................................. 6-10


Ahafo Complex Ghana Technical Report Summary Date: February 2026 Page iii 6.4.2.1 Deposit Dimensions ......................................................................................................... 6-10 6.4.2.2 Lithologies ........................................................................................................................ 6-10 6.4.2.3 Structure ........................................................................................................................... 6-11 6.4.2.4 Alteration .......................................................................................................................... 6-11 6.4.2.5 Mineralization ................................................................................................................... 6-11 6.4.3 Subika .................................................................................................................................. 6-12 6.4.3.1 Deposit Dimensions ......................................................................................................... 6-12 6.4.3.2 Lithologies ........................................................................................................................ 6-13 6.4.3.3 Structure ........................................................................................................................... 6-13 6.4.3.4 Alteration .......................................................................................................................... 6-13 6.4.3.5 Mineralization ................................................................................................................... 6-14 6.4.4 Amoma ................................................................................................................................. 6-14 6.4.4.1 Deposit Dimensions ......................................................................................................... 6-15 6.4.4.2 Lithologies ........................................................................................................................ 6-15 6.4.4.3 Structure ........................................................................................................................... 6-15 6.4.4.4 Alteration .......................................................................................................................... 6-15 6.4.4.5 Mineralization ................................................................................................................... 6-16 6.4.5 Yamfo South ......................................................................................................................... 6-17 6.4.5.1 Deposit Dimensions ......................................................................................................... 6-17 6.4.5.2 Lithologies ........................................................................................................................ 6-17 6.4.5.3 Structure ........................................................................................................................... 6-17 6.4.5.4 Alteration .......................................................................................................................... 6-17 6.4.5.5 Mineralization ................................................................................................................... 6-18 6.4.6 Yamfo Central ...................................................................................................................... 6-19 6.4.6.1 Deposit Dimensions ......................................................................................................... 6-19 6.4.6.2 Lithologies ........................................................................................................................ 6-19 6.4.6.3 Structure ........................................................................................................................... 6-19 6.4.6.4 Alteration .......................................................................................................................... 6-19 6.4.6.5 Mineralization ................................................................................................................... 6-20 6.4.7 Yamfo Northeast .................................................................................................................. 6-21 6.4.7.1 Deposit Dimensions ......................................................................................................... 6-21 6.4.7.2 Lithologies ........................................................................................................................ 6-21 6.4.7.3 Structure ........................................................................................................................... 6-21 6.4.7.4 Alteration .......................................................................................................................... 6-21 6.4.7.5 Mineralization ................................................................................................................... 6-22 6.4.8 Susuan ................................................................................................................................. 6-23 6.4.8.1 Deposit Dimensions ......................................................................................................... 6-23 6.4.8.2 Lithologies ........................................................................................................................ 6-24 6.4.8.3 Structure ........................................................................................................................... 6-24 6.4.8.4 Alteration .......................................................................................................................... 6-24 6.4.8.5 Mineralization ................................................................................................................... 6-24 6.4.9 Subenso South ..................................................................................................................... 6-26 6.4.9.1 Deposit Dimensions ......................................................................................................... 6-26 6.4.9.2 Lithologies ........................................................................................................................ 6-26 6.4.9.3 Structure ........................................................................................................................... 6-26 6.4.9.4 Alteration .......................................................................................................................... 6-27 6.4.9.5 Mineralization ................................................................................................................... 6-27 6.4.10 Subenso North ..................................................................................................................... 6-28 6.4.10.1 Deposit Dimensions ..................................................................................................... 6-28 6.4.10.2 Lithologies .................................................................................................................... 6-29 Ahafo Complex Ghana Technical Report Summary Date: February 2026 Page iv 6.4.10.3 Structure ....................................................................................................................... 6-29 6.4.10.4 Alteration ...................................................................................................................... 6-29 6.4.10.5 Mineralization ............................................................................................................... 6-29 6.4.11 Teekyere West ..................................................................................................................... 6-31 6.4.11.1 Deposit Dimensions ..................................................................................................... 6-31 6.4.11.2 Lithologies .................................................................................................................... 6-31 6.4.11.3 Structure ....................................................................................................................... 6-31 6.4.11.4 Alteration ...................................................................................................................... 6-31 6.4.11.5 Mineralization ............................................................................................................... 6-32 7.0 EXPLORATION ......................................................................................................................... 7-1 7.1 Exploration ................................................................................................................................. 7-1 7.1.1 Grids and Surveys .................................................................................................................. 7-1 7.1.2 Geological Mapping ............................................................................................................... 7-1 7.1.3 Geochemistry ......................................................................................................................... 7-1 7.1.4 Geophysics ............................................................................................................................. 7-5 7.1.4.1 Airborne Geophysics .......................................................................................................... 7-5 7.1.4.2 Ground Geophysics ........................................................................................................... 7-6 7.1.5 Petrology, Mineralogy, and Research Studies ....................................................................... 7-9 7.1.6 Qualified Person’s Interpretation of the Exploration Information ........................................... 7-9 7.1.7 Exploration Potential .............................................................................................................. 7-9 7.2 Drilling ...................................................................................................................................... 7-10 7.2.1 Overview .............................................................................................................................. 7-10 7.2.1.1 Drilling on Property ........................................................................................................... 7-10 7.2.1.2 Drilling Excluded For Estimation Purposes ...................................................................... 7-17 7.2.1.3 Drilling Since Database Close-out Date ........................................................................... 7-17 7.2.2 Drill Methods ........................................................................................................................ 7-20 7.2.3 Logging ................................................................................................................................. 7-20 7.2.4 Recovery .............................................................................................................................. 7-20 7.2.5 Collar Surveys ...................................................................................................................... 7-21 7.2.6 Down Hole Surveys .............................................................................................................. 7-21 7.2.7 Grade Control ....................................................................................................................... 7-21 7.2.8 Comment on Material Results and Interpretation ................................................................ 7-22 7.3 Hydrogeology ........................................................................................................................... 7-22 7.3.1 Sampling Methods and Laboratory Determinations ............................................................. 7-22 7.3.1.1 Ahafo South ...................................................................................................................... 7-22 7.3.1.2 Ahafo North ...................................................................................................................... 7-23 7.3.2 Groundwater Models ............................................................................................................ 7-24 7.3.2.1 Ahafo South ...................................................................................................................... 7-24 7.3.2.2 Ahafo North ...................................................................................................................... 7-24 7.3.3 Water Balance ...................................................................................................................... 7-24 7.3.3.1 Ahafo South ...................................................................................................................... 7-24 7.3.4 Ahafo North .......................................................................................................................... 7-25 7.3.5 Comment on Results ............................................................................................................ 7-25 7.3.5.1 Ahafo South ...................................................................................................................... 7-25 7.3.5.2 Ahafo North ...................................................................................................................... 7-25 7.4 Geotechnical ............................................................................................................................ 7-26 7.4.1 Sampling Methods and Laboratory Determinations ............................................................. 7-26 7.4.1.1 Ahafo South ...................................................................................................................... 7-26 7.4.1.2 Ahafo North ...................................................................................................................... 7-27 7.4.2 Comment on Results ............................................................................................................ 7-28 Ahafo Complex Ghana Technical Report Summary Date: February 2026 Page v 7.4.2.1 Ahafo South ...................................................................................................................... 7-28 7.4.2.2 Ahafo North ...................................................................................................................... 7-28 8.0 SAMPLE PREPARATION, ANALYSES, AND SECURITY ...................................................... 8-1 8.1 Sampling Methods ..................................................................................................................... 8-1 8.2 Sample Security Methods .......................................................................................................... 8-1 8.3 Density Determinations .............................................................................................................. 8-1 8.4 Analytical and Test Laboratories ................................................................................................ 8-2 8.5 Sample Preparation ................................................................................................................... 8-3 8.6 Analysis ...................................................................................................................................... 8-3 8.7 Quality Assurance and Quality Control ...................................................................................... 8-3 8.8 Database .................................................................................................................................... 8-4 8.9 Qualified Person’s Opinion on Sample Preparation, Security, and Analytical Procedures ....... 8-4 9.0 DATA VERIFICATION ............................................................................................................... 9-1 9.1 Internal Data Verification ............................................................................................................ 9-1 9.1.1 Data Validation ....................................................................................................................... 9-1 9.1.2 Reviews and Audits ................................................................................................................ 9-1 9.1.3 Mineral Resource and Mineral Reserve Estimates ................................................................ 9-2 9.1.4 Reconciliation ......................................................................................................................... 9-2 9.1.5 Subject Matter Expert Reviews .............................................................................................. 9-2 9.2 External Data Verification ........................................................................................................... 9-3 9.3 Data Verification by Qualified Person ........................................................................................ 9-3 9.4 Qualified Person’s Opinion on Data Adequacy .......................................................................... 9-3 10.0 MINERAL PROCESSING AND METALLURGICAL TESTING .............................................. 10-1 10.1 Introduction ............................................................................................................................... 10-1 10.1.1 Ahafo South .......................................................................................................................... 10-1 10.1.2 Ahafo North .......................................................................................................................... 10-1 10.2 Metallurgical Testwork ............................................................................................................. 10-1 10.2.1 Ahafo South .......................................................................................................................... 10-1 10.2.2 Ahafo North .......................................................................................................................... 10-2 10.3 Recovery Estimates ................................................................................................................. 10-4 10.3.1 Ahafo South .......................................................................................................................... 10-4 10.3.2 Ahafo North .......................................................................................................................... 10-5 10.4 Metallurgical Variability ............................................................................................................ 10-5 10.5 Deleterious Elements ............................................................................................................... 10-5 10.6 Qualified Person’s Opinion on Data Adequacy ........................................................................ 10-6 11.0 MINERAL RESOURCE ESTIMATES ...................................................................................... 11-1 11.1 Introduction ............................................................................................................................... 11-1 11.2 Exploratory Data Analysis ........................................................................................................ 11-2 11.3 Density Assignment ................................................................................................................. 11-2 11.4 Grade Capping/Outlier Restrictions ......................................................................................... 11-3 11.5 Composites .............................................................................................................................. 11-3 11.6 Variography .............................................................................................................................. 11-3 11.7 Estimation/interpolation Methods ............................................................................................. 11-3 11.8 Validation .................................................................................................................................. 11-4 11.9 Confidence Classification of Mineral Resource Estimate ........................................................ 11-5 11.9.1 Mineral Resource Confidence Classification ....................................................................... 11-5 11.9.2 Uncertainties Considered During Confidence Classification ............................................... 11-5 11.10 Reasonable Prospects of Economic Extraction ....................................................................... 11-6 11.10.1 Input Assumptions ............................................................................................................ 11-6 11.10.2 Commodity Price .............................................................................................................. 11-9 Ahafo Complex Ghana Technical Report Summary Date: February 2026 Page vi 11.10.3 Cut-off ............................................................................................................................... 11-9 11.10.4 QP Statement ................................................................................................................. 11-10 11.11 Mineral Resource Statement .................................................................................................. 11-10 11.12 Uncertainties (Factors) That May Affect the Mineral Resource Estimate .............................. 11-17 12.0 MINERAL RESERVE ESTIMATES ......................................................................................... 12-1 12.1 Introduction ............................................................................................................................... 12-1 12.2 Open Pit Estimates .................................................................................................................. 12-1 12.2.1 Pit Optimization .................................................................................................................... 12-1 12.2.2 Optimization Inputs .............................................................................................................. 12-2 12.2.2.1 Ahafo South .................................................................................................................. 12-2 12.2.2.2 Ahafo North .................................................................................................................. 12-4 12.2.3 Ore Loss and Dilution ........................................................................................................... 12-4 12.3 Underground Estimates ........................................................................................................... 12-6 12.3.1 Mining Zones ........................................................................................................................ 12-6 12.3.2 Stope Designs ...................................................................................................................... 12-6 12.3.3 Ore Loss and Dilution ........................................................................................................... 12-8 12.4 Stockpiles ................................................................................................................................. 12-8 12.5 Commodity Prices .................................................................................................................... 12-8 12.6 Mineral Reserve Statement ...................................................................................................... 12-8 12.7 Uncertainties (Factors) That May Affect the Mineral Reserve Estimate ................................ 12-12 13.0 MINING METHODS ................................................................................................................. 13-1 13.1 Introduction ............................................................................................................................... 13-1 13.2 Ahafo South Open Pits ............................................................................................................. 13-1 13.2.1 Geotechnical Considerations ............................................................................................... 13-1 13.2.2 Hydrogeological Considerations .......................................................................................... 13-2 13.2.3 Operations ............................................................................................................................ 13-2 13.2.4 Grade Control, Blasting and Explosives .............................................................................. 13-2 13.2.5 Equipment ............................................................................................................................ 13-4 13.2.6 Personnel ............................................................................................................................. 13-4 13.3 Ahafo North Open Pits ............................................................................................................. 13-5 13.3.1 Geotechnical Considerations ............................................................................................... 13-5 13.3.2 Hydrogeological Considerations .......................................................................................... 13-6 13.3.3 Operations ............................................................................................................................ 13-7 13.3.4 Blasting and Explosives ..................................................................................................... 13-15 13.3.5 Grade Control ..................................................................................................................... 13-16 13.3.6 Equipment .......................................................................................................................... 13-16 13.3.7 Personnel ........................................................................................................................... 13-16 13.4 Ahafo South Underground ..................................................................................................... 13-17 13.4.1 Geotechnical Considerations ............................................................................................. 13-17 13.4.2 Hydrogeological Considerations ........................................................................................ 13-17 13.4.3 Operations .......................................................................................................................... 13-18 13.4.4 Ventilation ........................................................................................................................... 13-20 13.4.5 Blasting and Explosives ..................................................................................................... 13-21 13.4.6 Ore Control ......................................................................................................................... 13-21 13.4.7 Equipment .......................................................................................................................... 13-22 13.4.8 Personnel ........................................................................................................................... 13-22 13.5 Production Schedule .............................................................................................................. 13-22 14.0 PROCESSING AND RECOVERY METHODS ........................................................................ 14-1 14.1 Process Method Selection ....................................................................................................... 14-1 14.2 Process Plant ........................................................................................................................... 14-1


Ahafo Complex Ghana Technical Report Summary Date: February 2026 Page vii 14.3 Plant Design ............................................................................................................................. 14-4 14.3.1 Ahafo South .......................................................................................................................... 14-4 14.3.2 Ahafo North .......................................................................................................................... 14-5 14.4 Equipment Sizing ..................................................................................................................... 14-6 14.5 Power and Consumables ......................................................................................................... 14-9 14.5.1 Ahafo South .......................................................................................................................... 14-9 14.5.2 Ahafo North .......................................................................................................................... 14-9 14.6 Personnel ................................................................................................................................. 14-9 15.0 INFRASTRUCTURE ................................................................................................................ 15-1 15.1 Introduction ............................................................................................................................... 15-1 15.1.1 Ahafo South .......................................................................................................................... 15-1 15.1.2 Ahafo North .......................................................................................................................... 15-3 15.2 Roads and Logistics ................................................................................................................. 15-5 15.3 Stockpiles ................................................................................................................................. 15-5 15.3.1 Ahafo South .......................................................................................................................... 15-5 15.3.2 Ahafo North .......................................................................................................................... 15-5 15.4 Waste Rock Storage Facilities ................................................................................................. 15-5 15.4.1 Ahafo South .......................................................................................................................... 15-5 15.4.2 Ahafo North .......................................................................................................................... 15-6 15.5 Tailings Storage Facilities ........................................................................................................ 15-7 15.5.1 Ahafo South .......................................................................................................................... 15-7 15.5.2 Ahafo North .......................................................................................................................... 15-7 15.6 Water Management Structures ................................................................................................ 15-8 15.6.1 Ahafo South .......................................................................................................................... 15-8 15.6.2 Ahafo North .......................................................................................................................... 15-8 15.7 Water Supply ............................................................................................................................ 15-8 15.7.1 Ahafo South .......................................................................................................................... 15-8 15.7.2 Ahafo North .......................................................................................................................... 15-8 15.8 Camps and Accommodation .................................................................................................... 15-9 15.9 Power and Electrical ................................................................................................................ 15-9 15.9.1 Ahafo South .......................................................................................................................... 15-9 15.9.2 Ahafo North ........................................................................................................................ 15-10 16.0 MARKET STUDIES AND CONTRACTS ................................................................................. 16-1 16.1 Markets ..................................................................................................................................... 16-1 16.2 Commodity Price Forecasts ..................................................................................................... 16-1 16.3 Contracts .................................................................................................................................. 16-1 17.0 ENVIRONMENTAL STUDIES, PERMITTING, AND PLANS, NEGOTIATIONS, OR AGREEMENTS WITH LOCAL INDIVIDUALS OR GROUPS ................................................................. 17-1 17.1 Introduction ............................................................................................................................... 17-1 17.2 Ahafo South .............................................................................................................................. 17-1 17.2.1 Baseline and Supporting Studies ......................................................................................... 17-1 17.2.2 Environmental Considerations/Monitoring Programs ........................................................... 17-1 17.2.3 Closure and Reclamation Considerations ............................................................................ 17-2 17.2.4 Permitting ............................................................................................................................. 17-2 17.2.5 Social Considerations, Plans, Negotiations and Agreements .............................................. 17-2 17.2.6 Qualified Person’s Opinion on Adequacy of Current Plans to Address Issues.................... 17-3 17.3 Ahafo North .............................................................................................................................. 17-3 17.3.1 Baseline and Supporting Studies ......................................................................................... 17-3 17.3.2 Environmental Considerations/Monitoring Programs ........................................................... 17-3 17.3.3 Closure and Reclamation Considerations ............................................................................ 17-4 Ahafo Complex Ghana Technical Report Summary Date: February 2026 Page viii 17.3.4 Permitting ............................................................................................................................. 17-4 17.3.5 Social Considerations, Plans, Negotiations and Agreements .............................................. 17-5 17.3.6 Qualified Person’s Opinion on Adequacy of Current Plans to Address Issues.................... 17-6 18.0 CAPITAL AND OPERATING COSTS ..................................................................................... 18-1 18.1 Introduction ............................................................................................................................... 18-1 18.2 Capital Cost Estimates ............................................................................................................. 18-1 18.3 Operating Cost Estimates ........................................................................................................ 18-2 19.0 ECONOMIC ANALYSIS .......................................................................................................... 19-1 19.1 Methodology Used ................................................................................................................... 19-1 19.2 Financial Model Parameters .................................................................................................... 19-1 19.3 Sensitivity Analysis ................................................................................................................... 19-9 20.0 ADJACENT PROPERTIES ..................................................................................................... 20-1 21.0 OTHER RELEVANT DATA AND INFORMATION .................................................................. 21-1 22.0 INTERPRETATION AND CONCLUSIONS ............................................................................. 22-1 22.1 Introduction ............................................................................................................................... 22-1 22.2 Property Setting........................................................................................................................ 22-1 22.3 Ownership ................................................................................................................................ 22-1 22.4 Mineral Tenure, Surface Rights, Water Rights, Royalties and Agreements ............................ 22-1 22.5 Geology and Mineralization ...................................................................................................... 22-2 22.6 History ...................................................................................................................................... 22-2 22.7 Exploration, Drilling, and Sampling .......................................................................................... 22-2 22.8 Data Verification ....................................................................................................................... 22-3 22.9 Metallurgical Testwork ............................................................................................................. 22-4 22.10 Mineral Resource Estimates .................................................................................................... 22-4 22.11 Mineral Reserve Estimates ...................................................................................................... 22-5 22.12 Mining Methods ........................................................................................................................ 22-5 22.13 Recovery Methods ................................................................................................................... 22-6 22.14 Infrastructure ............................................................................................................................ 22-6 22.15 Market Studies ......................................................................................................................... 22-7 22.16 Environmental, Permitting and Social Considerations ............................................................. 22-7 22.17 Capital Cost Estimates ............................................................................................................. 22-8 22.18 Operating Cost Estimates ........................................................................................................ 22-9 22.19 Economic Analysis ................................................................................................................... 22-9 22.20 Risks and Opportunities ........................................................................................................... 22-9 22.20.1 Risks ................................................................................................................................. 22-9 22.20.2 Opportunities .................................................................................................................. 22-10 22.21 Conclusions ............................................................................................................................ 22-11 23.0 RECOMMENDATIONS ............................................................................................................ 23-1 24.0 REFERENCES ......................................................................................................................... 24-1 24.1 Bibliography .............................................................................................................................. 24-1 24.2 Abbreviations and Symbols ...................................................................................................... 24-4 24.3 Glossary of Terms .................................................................................................................... 24-6 25.0 RELIANCE ON INFORMATION PROVIDED BY THE REGISTRANT ................................... 25-1 25.1 Introduction ............................................................................................................................... 25-1 25.2 Macroeconomic Trends ............................................................................................................ 25-1 25.3 Markets ..................................................................................................................................... 25-1 25.4 Legal Matters ............................................................................................................................ 25-1 25.5 Environmental Matters ............................................................................................................. 25-2 25.6 Stakeholder Accommodations ................................................................................................. 25-2 25.7 Governmental Factors .............................................................................................................. 25-2 Ahafo Complex Ghana Technical Report Summary Date: February 2026 Page ix TABLES Table 1-1: Measured and Indicated Mineral Resource Statement, Ahafo Complex ......................... 1-10 Table 1-2: Inferred Mineral Resource Statement, Ahafo Complex ................................................... 1-11 Table 1-3: Proven and Probable Mineral Reserve Statement, Ahafo Complex ................................ 1-14 Table 1-4: Commodity Price and Exchange Rate Forecasts ............................................................ 1-18 Table 1-5: Ahafo Complex Capital Cost Estimate ............................................................................. 1-20 Table 1-6: Ahafo Complex Operating Cost Estimate ........................................................................ 1-20 Table 1-7: Ahafo Complex Operating Unit Cost Estimate ................................................................. 1-21 Table 1-8: Cashflow Summary Table, Ahafo Complex ..................................................................... 1-22 Table 3-1: Deposit Centroids ............................................................................................................... 3-1 Table 3-2: Types of Mineral Rights ..................................................................................................... 3-2 Table 3-3: Mineral Tenure Summary Table ......................................................................................... 3-8 Table 5-1: Exploration and Development History Summary Table ..................................................... 5-1 Table 7-1: Geophysical Surveys ......................................................................................................... 7-5 Table 7-2: Project Drill Summary Table ............................................................................................ 7-10 Table 7-3: Drilling Supporting Mineral Resource Estimation, Ahafo South ....................................... 7-11 Table 7-4: Drilling Supporting Mineral Resource Estimation, Ahafo North ....................................... 7-12 Table 8-1: Sample Preparation Procedures ........................................................................................ 8-3 Table 9-1: External Data Verification ................................................................................................... 9-3 Table 10-1: Testwork Results, Ahafo North ........................................................................................ 10-3 Table 10-2: Ahafo South Recovery Estimates .................................................................................... 10-4 Table 10-3: Ahafo North Recovery Estimates ..................................................................................... 10-5 Table 11-1: Modeled Mineralization Envelopes .................................................................................. 11-2 Table 11-2: Input Parameters, Ahafo South Open Pits ....................................................................... 11-6 Table 11-3: Input Parameters, Ahafo North Open Pits ....................................................................... 11-7 Table 11-4: Input Parameters, Underground ....................................................................................... 11-9 Table 11-5: Ahafo South Measured and Indicated Mineral Resource Statement ............................. 11-11 Table 11-6: Ahafo South Inferred Mineral Resource Statement ....................................................... 11-12 Table 11-7: Ahafo North Measured and Indicated Mineral Resource Statement ............................. 11-13 Table 11-8: Ahafo North Inferred Mineral Resource Statement ........................................................ 11-14 Table 11-9: Ahafo Complex Measured and Indicated Mineral Resource Statement ........................ 11-15 Table 11-10: Ahafo Complex Inferred Mineral Resource Statement .............................................. 11-16 Table 12-1: Pit Design Assumptions, Ahafo South ............................................................................. 12-3 Table 12-2: Pit Design Assumptions, Ahafo North .............................................................................. 12-5 Table 12-3: Stope Design Parameters, Subika Underground ............................................................. 12-7 Table 12-4: Input Parameters, Subika Underground .......................................................................... 12-7 Table 12-5: Ahafo South Proven and Probable Mineral Reserve Statement ...................................... 12-9 Table 12-6: Ahafo North Proven and Probable Mineral Reserve Statement .................................... 12-10 Table 12-7: Ahafo Complex Proven and Probable Mineral Reserve Statement ............................... 12-11 Table 13-1: Pit Geotechnical Design Parameters ............................................................................... 13-1 Table 13-2: Equipment List, Ahafo South ............................................................................................ 13-4 Table 13-3: Pit Design Geotechnical Assumptions, Ahafo North ........................................................ 13-5 Table 13-4: Pit Design Parameters, Ahafo North ................................................................................ 13-7 Table 13-5: Pit Phases, Ahafo North ................................................................................................... 13-7 Table 13-6: Equipment List, Ahafo North .......................................................................................... 13-16 Table 13-7: Mining Methods .............................................................................................................. 13-18 Table 13-8: Equipment Requirements, Underground ....................................................................... 13-22 Ahafo Complex Ghana Technical Report Summary Date: February 2026 Page x Table 13-9: Production Schedule, Ahafo South (2026–2034) ........................................................... 13-22 Table 13-10: Production Schedule, Ahafo North (2026–2035) ....................................................... 13-23 Table 13-11: Production Schedule, Ahafo North (2036–2044) ....................................................... 13-23 Table 13-12: Combined Production Schedule, Ahafo Complex (2026–2035) ................................ 13-23 Table 13-13: Combined Production Schedule, Ahafo Complex (2036–2044) ................................ 13-23 Table 14-1: Design Criteria, Ahafo South Process Plant .................................................................... 14-6 Table 14-2: Design Criteria, Ahafo North Process Plant ..................................................................... 14-7 Table 14-3: Ahafo South Plant Equipment .......................................................................................... 14-7 Table 14-4: Ahafo North Plant Equipment ........................................................................................... 14-8 Table 16-1: Commodity Price and Exchange Rate Forecasts ............................................................ 16-1 Table 17-1: Key Permits, Ahafo North ................................................................................................. 17-5 Table 18-1: Capital Cost Estimate ....................................................................................................... 18-1 Table 18-2: Operating Cost Estimate .................................................................................................. 18-2 Table 18-3: Operating Unit Cost Estimate ........................................................................................... 18-2 Table 19-1: Cashflow Summary Table, Ahafo South .......................................................................... 19-2 Table 19-2: Cashflow Summary Table, Ahafo North ........................................................................... 19-2 Table 19-3: Cashflow Summary Table, Ahafo Complex ..................................................................... 19-3 Table 19-4: Annualized Cashflow, Ahafo South (2026–2034) ............................................................ 19-4 Table 19-5: Annualized Cashflow, Ahafo North (2026–2036) ............................................................. 19-5 Table 19-6: Annualized Cashflow, Ahafo North (2037–2046) ............................................................. 19-6 Table 19-7: Annualized Cashflow, Ahafo Complex (2026–2036) ....................................................... 19-7 Table 19-8: Annualized Cashflow, Ahafo Complex (2037–2044) ....................................................... 19-8 FIGURES Figure 1-1: NPV Sensitivity, Ahafo Complex ...................................................................................... 1-23 Figure 2-1: Project Location Plan ......................................................................................................... 2-2 Figure 2-2: Mining Operations Layout Plan .......................................................................................... 2-3 Figure 3-1: Ahafo District Mineral Tenure Map ..................................................................................... 3-5 Figure 3-2: Ahafo South Mineral Licenses Map ................................................................................... 3-6 Figure 3-3: Ahafo North Mineral Licenses Map .................................................................................... 3-7 Figure 6-1: Ahafo Geology Map ........................................................................................................... 6-3 Figure 6-2: Stratigraphic Column Part A ............................................................................................... 6-4 Figure 6-3: Stratigraphic Column Part B ............................................................................................... 6-5 Figure 6-4: Cross-Section Showing Apensu Deeps Zones .................................................................. 6-7 Figure 6-5: Drill Section, Apensu Main and Apensu Deeps ................................................................. 6-9 Figure 6-6: Cross-Section, Awonsu .................................................................................................... 6-12 Figure 6-7: Cross-Section, Subika ...................................................................................................... 6-14 Figure 6-8: Cross-Section, Amoma .................................................................................................... 6-16 Figure 6-9: Cross-Section, Yamfo South ............................................................................................ 6-18 Figure 6-10: Cross-Section Yamfo Central ........................................................................................... 6-20 Figure 6-11: Cross-Section, Yamfo Northeast ...................................................................................... 6-23 Figure 6-12: Cross-Section, Susuan .................................................................................................... 6-25 Figure 6-13: Cross-Section, Subenso South ........................................................................................ 6-28 Figure 6-14: Cross-Section, Subenso North ......................................................................................... 6-30 Figure 6-15: Cross-Section, Teekyere West ........................................................................................ 6-33 Figure 7-1: Stream Sediment Sample Location Map ........................................................................... 7-2 Figure 7-2: Soil Sample Location Map ................................................................................................. 7-3 Figure 7-3: Deep-Sensing Geochemical Sample Location Plan .......................................................... 7-4


Ahafo Complex Ghana Technical Report Summary Date: February 2026 Page xi Figure 7-4: Airborne Geophysical Survey Location Plan ...................................................................... 7-7 Figure 7-5: Ground Geophysical Survey Location Plan ....................................................................... 7-8 Figure 7-6: Ahafo South Drill Collar Location Map (Core, RC, RAB) ................................................. 7-13 Figure 7-7: Ahafo South Drill Collar Location Plan (Aircore) .............................................................. 7-14 Figure 7-8: Ahafo North Drill Collar Location Map (Core, RC, RAB) .................................................. 7-15 Figure 7-9: Ahafo South Drill Collar Location Plan (Aircore) .............................................................. 7-16 Figure 7-10: Ahafo South Drilling Since Database Close-out Date ...................................................... 7-18 Figure 7-11: Ahafo North Drilling Since Database Close-out Date ...................................................... 7-19 Figure 13-1: Final Pit Layout Plan, Ahafo South .................................................................................. 13-3 Figure 13-2: Final Pit Layout, Yamfo South .......................................................................................... 13-8 Figure 13-3: Final Pit Layout, Yamfo Northeast ................................................................................... 13-9 Figure 13-4: Final Pit Layout, Susuan ................................................................................................ 13-10 Figure 13-5: Final Pit Layout, Subenso South .................................................................................... 13-11 Figure 13-6: Final Pit Layout, Subenso North .................................................................................... 13-12 Figure 13-7: Final Pit Layout, Teekyere West .................................................................................... 13-13 Figure 13-8: Ahafo North, Open Pit Mine Schedule ........................................................................... 13-14 Figure 13-9: Ahafo North, Process Schedule ..................................................................................... 13-15 Figure 13-10: Example Level Layout Schematic by Mining Method ................................................ 13-18 Figure 13-11: Final Underground Mine Layout Plan......................................................................... 13-20 Figure 14-1: Process Flowsheet, Ahafo South ..................................................................................... 14-2 Figure 14-2: Process Flowsheet, Ahafo North ...................................................................................... 14-3 Figure 15-1: Infrastructure Layout Plan, Ahafo South .......................................................................... 15-2 Figure 15-2: Infrastructure Layout Plan, Ahafo North ........................................................................... 15-4 Figure 15-3: WRSF Locations, Ahafo North ......................................................................................... 15-6 Figure 19-1: NPV Sensitivity, Ahafo South ........................................................................................... 19-9 Figure 19-2: NPV Sensitivity, Ahafo North ......................................................................................... 19-10 Figure 19-3: NPV Sensitivity, Ahafo Complex .................................................................................... 19-11 Ahafo Complex Ghana Technical Report Summary Date: February 2026 Page 1-1 1.0 EXECUTIVE SUMMARY 1.1 Introduction This technical report summary (the Report) was prepared for Newmont Corporation (Newmont) on the Ahafo Complex (the Project) located in the Republic of Ghana (Ghana). The Ahafo Complex includes the Ahafo South and Ahafo North operations. Newmont has three subsidiaries registered under the laws of Ghana: Newmont Ghana Gold Ltd. (Newmont Ghana), Newmont Golden Ridge Ltd. (Newmont Golden Ridge) and Moydow Limited (Moydow). For the purposes of this Report, the name Newmont is used interchangeably for the subsidiary and parent companies. 1.2 Terms of Reference The Report was prepared to be attached as an exhibit to support mineral property disclosure, including mineral resource and mineral reserve estimates, for the Ahafo Complex in Newmont’s Form 10-K for the year ending December 31, 2025. Mineral resources are reported for Apensu, Awonsu and Subika open pits, and Subika and Apensu underground at Ahafo South, and Yamfo Central, Yamfo Northeast, Yamfo South/Line 10, Subenso South, Subenso North, Susuan, and Teekyere West at Ahafo North. Mineral reserves are reported for Subika and Awonsu open pits and Subika underground at Ahafo South and Yamfo Northeast, Yamfo South/Line 10, Subenso South, Subenso North, Susuan, and Teekyere West at Ahafo North. Mineral reserves are also estimated for material in stockpiles. Unless otherwise indicated, all financial values are reported in United States dollars (US$). “B” is used for billion. Unless otherwise indicated, the metric system is used in this Report. Mineral resources and mineral reserves are reported using the definitions in Regulation S–K 1300 (SK1300), under Item 1300. The Report uses US English. The Report contains forward-looking information; refer to the note regarding forward-looking information at the front of the Report. 1.3 Property Setting The Ahafo Complex is located in western Ghana near the towns of Kenyasi and Ntotroso in the Ahafo Region, about 290 km northwest of Accra. The operations are 107 km northwest of Kumasi, and 40 km south of the regional capital of Sunyani. Road access to the Ahafo South operations is via Route 6, an asphalt-paved road from Accra to the Tepa Junction via Kumasi in the direction of Sunyani, a distance of approximately 300 km. From Tepa Junction, an asphalt-paved road leads west for 39 km through the villages of Tepa and Akyerensua to Hwidiem. The Ahafo North operations are located approximately 20 km east of Sunyani, near the communities of Afrisipakrom and Techire. A paved road then leads northwest for 8 km to the village of Kenyasi. Road access to the Ahafo North area is primarily via the national Route 6. Ahafo Complex Ghana Technical Report Summary Date: February 2026 Page 1-2 Sunyani is a major regional center and is the source of supplies and fuel. Workers live in the surrounding communities. The Project area falls within the wet semi-equatorial climatic zone of Ghana. The Ahafo Complex operations are conducted year-round. The local topography comprises low rounded hills with elevations ranging from 110–540 masl. Two streams, the Subri and the Awonsu, drain from the Project area to the Tano River. The Project shares a boundary with the Bosumkese Forest Reserve, and the Amoma Shelterbelt Forest Reserve bisects the Ahafo mining lease. 1.4 Ownership The Project is held through Newmont Ghana Gold Ltd., an indirectly-wholly owned Newmont subsidiary. 1.5 Mineral Tenure, Surface Rights, Water Rights, Royalties and Agreements The Ahafo mining lease is separated into two areas, where Ahafo South is in Area A, and Ahafo North in Area B. Newmont currently holds four mining licenses, and seven prospecting licenses that in total cover an area of approximately 925 km2: • The mining leases are current until 2031 and can be renewed by negotiation. The total area held under mining licenses is approximately 549 km2; • The prospecting licenses are valid and are in good standing. The total area covered by prospecting licenses is about 376 km2. Under Ghanaian law, only mining leases and prospecting licenses require surveys; reconnaissance license types are delineated by latitude/longitude co-ordinates. All of the Ahafo mining leases were surveyed by Newmont staff. A number of payments are required to keep the licenses/leases in good standing, and include an annual rental that is payable by January of each year, and annual prospecting and mining permit payments, which are payable by January of each year. All required payments have been made as they fall due. Newmont was granted a Plan of Operations (PoO) for the Ahafo Complex, and may use whatever land is necessary for its operations, but must respect the surface rights of other land users in relation to access and loss of crops, timber, or structures. Extensive title searches were conducted over the mining lease areas and no titles exist that would categorically exclude Newmont’s operations on the Project lands. Newmont’s indenture for surface lands will run concurrently with the life of the operations, but will extend for no more than 50 years. Ahafo Complex Ghana Technical Report Summary Date: February 2026 Page 1-3 Newmont holds permits to allow abstraction of groundwater, surface water, and water from the Tano River and discharge of water from its water storage facility. The Government of Ghana has a 10% free-carried, fixed, non-equity, interest in the Ahafo Complex. Newmont pays the Government of Ghana a ninth of the dividend declared to Newmont shareholders. Since December 2015, Newmont has been obligated to pay 0.6% of the operational revenue if the gold price averages US$1,300/oz or higher, as an advance dividend against the one-ninth share. A Revised Investment Agreement (the Agreement) between Newmont and the Government of Ghana defined and fixed, in specific terms, the effective corporate tax and royalty burden the Project would carry during operations. The Agreement established a fixed fiscal and legal regime, including sliding-scale royalty and tax rates for the duration of the Agreement’s stability period. Under the Agreement stability period, which expired at the end of 2025, the tax rate remained at 32.5%. After the cessation of the stability period, the tax rate increased to 35%. During the stability period, Newmont paid gross royalties on gold doré production in accordance with a sliding scale of 3–5%, tied to the gold price. After the Agreement ended, the royalty rate was fixed at 5%. The operations are also subject to a 3% Growth and Sustainability Levy (GSL) based on gross revenue. A net smelter return (NSR) royalty of 2.0% is payable on all ounces produced from the Rank (formerly Ntotroso) concession. The royalty is paid to Franco-Nevada Corporation (Franco- Nevada), which acquired the royalty for US$58 M in November 2009. The majority of the Subika deposit, the northern portion of the Awonsu deposit, and the southern tip of the Amoma deposit fall within the Rank mining lease boundary. Royalties in forest reserves are currently not applicable for the Ahafo Complex. 1.6 Geology and Mineralization The deposits that comprise the Ahafo Complex are considered to be examples of orogenic gold deposits. Mineralization is developed in a Birimian succession that includes the Paleoproterozoic volcano– sedimentary Sefwi Belt, the Sunyani Basin, and the Kumasi Basin. Three granite successions have intruded the Birimian rocks, including Cape Coast granitoids, Dixcove-type granitoids, and post-Tarkwaian granitoids. Dixcove suite or “belt-type” granitoid rocks intrude the contact and are common in the metavolcanic rocks that form more or less elongate bodies parallel to the regional strike. Regional structure is controlled by the Kenyasi Thrust Fault; a northeast- to southwest-trending regional thrust fault that separates the Sefwi Belt from the Sunyani Basin. Mineralization consists of vein- style gold deposits, hosted in shear zones associated with the Kenyasi Thrust Fault. Discrete mineralization styles are recognized within the Ahafo Complex area, which are termed Kenyasi-style (shear-zone hosted), Subika-style (granite hosted), and Subenso-style (associated with fold limb) zones.


Ahafo Complex Ghana Technical Report Summary Date: February 2026 Page 1-4 Gold typically occurs as native gold, associated with pyrite. Alteration associated with the deposits includes silicification, albitization, pyritization, and carbonation. 1.7 History and Exploration Exploration prior to Newmont’s Project interest was conducted by Normandy Mining Ltd. and associated companies. Work completed included geochemical sampling (sediment and soil), geological mapping, prospect evaluation and drilling, and mining studies. Since Project acquisition in early 2002, Newmont has completed exploration drilling, collection of deep-sensing geochemical samples, airborne and ground geophysical surveys, environmental, geotechnical, mining, and metallurgical studies. Open pit mining at Ahafo South commenced in 2006. A permitted underground trial mining program was conducted at Subika from 2012–2013, and commercial production from Subika underground was achieved in November 2018. Ahafo North operations commenced in 2024 and declared commercial production in 2025. The Project area remains prospective both in the immediate mine operating areas, and in the near-mine areas along strike and down-plunge from the deposits. 1.8 Drilling and Sampling 1.8.1 Drilling A total of 20,479 drill holes (approximately 3,211 km) was completed within the Ahafo Operations area to 2025; including 8,748 core holes (approximately 2,339 km) and 6,810 RC holes drill holes (approximately 476 km). Geological logging varies between drill types, but typically includes lithologies, alteration, sulfide content, oxidation states, and presence of water. Core hole logging also records significant contacts, fractures, veins, and faults, core recovery, and rock quality designation (RQD). Except for the first few meters of individual RC holes, where recovery is typically in the 20–40% range, recovery is generally about 95–98%. Core recovery is normally 100% except for very rare times when drilling encounters fault and graphitic shear zones. Drill collar locations have been recorded by surveyors using a number of methods, including optical instruments, or digital global positioning system (GPS) equipment. Downhole survey instrumentation included Welnav cameras, multi-shot Sperry-sun, and Reflex single-shot and multi-shot downhole survey instruments. Depending on the drill type and program date, data were collected at 10–12 m depth, followed by surveys on 30 m intervals. Blasthole spacing at Ahafo South is at approximately 4 x 4.5 m spacing in ore zones and 4.2 x 4.8 m in waste zones. Blast hole spacing at Ahafo North is approximately 3.8 x 3.3 m (spacing and burden) in ore zones and 4 x 3.5 m in waste zones. Ahafo Complex Ghana Technical Report Summary Date: February 2026 Page 1-5 1.8.2 Hydrogeology Water quality monitoring is based on a monitoring plan developed to guide ongoing sampling and analysis of process fluid including groundwater and surface water collected in conjunction with Newmont’s water resources monitoring program to meet operational needs and environmental protection requirements. Sampling conducted under this plan is performed by Newmont personnel and/or contractors under the direction of Newmont staff. Monitoring data are used to quantify water quality such that any mine-related impacts to the environment can be determined and, if necessary, mitigated. To the Report date, the hydrogeological data collection programs have provided data suitable for use in the mining operations, and have supported the assumptions used in the active pits and the Subika underground mine. 1.8.3 Geotechnical The following general information are collected for geotechnical assessment of both open pit and underground excavations: • Rock mass classification and characterization data to estimate the rock quality; • Structural data to determine potential structural-controlled failures; • Damage mapping data to determine stress-related failures. A fall-of-ground register is maintained for all rock events, which provides brief summary of sequence and nature of the rock event. Run-of-mine (ROM) waste rock is used as fill material in the underground excavations. The suitability of the fill material is determined via the mechanical properties of the rock and fragmentation analysis to define material granularity and appropriateness. The geological hard rock setting at the Ahafo Complex is well understood and displays consistency in the various open pits located on site. Additional testing continues to confirm the consistency of material strengths and parameters. 1.8.4 Sampling and Assay RC samples were generally taken on 1 m intervals down hole, split using a Gilson riffle splitter, with quarter samples collected in pre-numbered RC sample bags. Core was cut along marked orientation lines, using a diamond saw. Sample lengths varied from 0.5–1.5 m, with sample intervals selected based on the geological features of the core, including alteration. Density (specific gravity) determinations were typically performed using water displacement methods. Ahafo Complex Ghana Technical Report Summary Date: February 2026 Page 1-6 Umpire laboratories used include ALS Vancouver in Canada, Gencor Laboratories, in Johannesburg, South Africa (Gencor); Inchcape Laboratory in Obuasi, Ghana (Inchcape); Genalysis Laboratories in Perth, Australia (Genalysis); Anglo-American Research Laboratories in Johannesburg (AARL); Omac Laboratories in Ireland (Omac); and Performance Laboratories in Johannesburg (Performance). SGS Tarkwa was the primary laboratory for all drill programs for the period June 2003 to 2010. In addition to SGS Tarkwa, ALS Chemex (ALS) has provided laboratory services to Newmont Ghana from 2010 to the Report date, and has used branch laboratories in various locations, including ALS Kumasi, ALS Vancouver, and ALS Johannesburg. Both the parent SGS and ALS are independent laboratory groups that operate globally, and the SGS/ALS laboratories used for the Project are accredited to ISO/IEC17025 for selected sample preparation and analytical techniques. Currently, ALS Kumasi and SGS Tarkwa are the primary laboratories used for all Ahafo exploration samples. Until April 2023, all Ahafo South grade control and metallurgical samples were analyzed at the on-site mine laboratory, which was managed by SGS. Following the fire incident that destroyed the laboratory, the samples were analyzed at the SGS Akyem mine laboratory. Currently, these samples are being analyzed at SGS Tarkwa, following the divestiture of the Akyem mine in early 2025. Ahafo North grade control samples are currently being analyzed at ALS-Kumasi whilst the analyses of metallurgical samples are being performed at SGS-Tarkwa. Sample preparation procedures varied by sample type. Soil, rock chip, pit, aircore, and RC samples were crushed to either a nominal 90% passing -2 mm size fraction or a nominal 90% passing -3 mm size fraction. All samples were pulverized to a nominal 90% passing -75 µm. Core samples were crushed to a nominal 90% passing -2 mm size fraction, then pulverized to a nominal 95% passing 75 µm. Analytical methods employed included inductively-coupled plasma mass spectrometry (ICP-MS), atomic absorption spectrometry (AAS), and fire assay with an AAS finish. 1.8.5 Quality Assurance and Quality Control Newmont has considerably modified the quality assurance and quality control (QA/QC) program at the Ahafo Complex from that used prior to 2004. Newmont maintains a QA/QC program for the Ahafo Complex. This includes regular submissions of blank, duplicate, and standard reference materials (standards) in samples sent for analysis. Results are regularly monitored. Data for all three duplicate types indicates that the data are acceptably precise at both primary laboratories. 1.9 Data Verification Newmont personnel regularly visit the laboratories that process Newmont samples to inspect sample preparation and analytical procedures. The database that supports mineral resource and mineral reserve estimates is checked using electronic data scripts and triggers. Newmont also conducted a number of internal data verification programs since obtaining its Project interest. Newmont also conducts internal audits, termed Reserve and Resource Review (3R) audits, of all its operations. The most recent Ahafo Ahafo Complex Ghana Technical Report Summary Date: February 2026 Page 1-7 Complex 3R audits were conducted in 2012, 2014, 2016, 2018, 2020 and 2025. Earlier audits, known as Five Star reviews, were undertaken in 2005 and 2006. The 2025 3R audit found that the Ahafo Complex was generally adhering to Newmont’s internal standards and guidelines with respect to the estimation of mineral resources and mineral reserves. Data verification was performed by external consultants in support of mine development and operations. No material issues were identified in the reviews. The QP receives and reviews monthly reconciliation reports from the mine site. These reports include the industry standard reconciliation factors for tonnage, grade, and metal. Through the review of these reconciliation factors the QP is able to ascertain the quality and accuracy of the data and its suitability for use in the assumptions underlying the mineral resource and mineral reserve estimates. 1.10 Metallurgical Testwork Metallurgical testwork for Ahafo South was conducted at the Newmont Metallurgical Services facility in Denver, and Hazen Research in Golden, Colorado, under the direction of Newmont personnel. An earlier phase of testwork in 2000 was completed under the direction of, and interpreted by, Lycopodium Pty Ltd., in Perth, Western Australia. All recent testwork was completed by Newmont Metallurgical Services. Newmont Metallurgical Services is an in-house metallurgical testing and research and development laboratory. Hazen Research and Lycopodium Pty Ltd are independent commercial metallurgical testing facilities. There is no international standard of accreditation provided for metallurgical testing laboratories or metallurgical testing techniques. Each year, samples are selected to represent the next three years of production in mine-to-mill testing, to ensure there sufficient current testwork to support knowledge of the mill feed materials, and support process assumptions. Metallurgical testwork for Ahafo North was initially conducted at Lycopodium in 2003 and later at Newmont Metallurgical Services. All recent testwork was completed by Newmont Metallurgical Services. Samples selected for metallurgical testing during feasibility and development studies were representative of the various styles of mineralization within the different deposits. Samples were selected from a range of locations within the deposit zones. Sufficient samples were taken and tests were performed using sufficient sample mass for the respective tests undertaken. Each year, samples are selected to represent the next three years of production in mine-to-mill testing, to ensure there sufficient current testwork to support knowledge of the mill feed materials, and support process assumptions. Samples are currently selected for every 300,000 t of ore to be processed, using a grade/tonnage table, and used in mine-to-mill testing. Work completed included mineralogy, chemical analysis; comminution testwork (crushing index, unconfined compressive strength, Bond rod and ball mill, abrasion index, JKTech drop weight comminution parameters); grind size assessments; heap leaching; gravity concentration and gravity-recoverable gold tests; flash and conventional flotation tests; variability leach tests, evaluation of leaching retention times; reagent consumption, determination of thickening and slurry pumping characteristics, tailings characterization and geochemistry; and cyanide destruction testwork.


Ahafo Complex Ghana Technical Report Summary Date: February 2026 Page 1-8 The Ahafo South process plant is currently fed with primary ores. However, from 2027–2030, a portion of the plant feed will be from oxide ores. The LOM plan assumes an average 10 Mt/a throughput rate from 2026–2037. Recovery models for the Ahafo North deposits were derived at a grind size of P80 passing 53 µm, based on testwork. Plant recovery is expected to be 95–96% for oxide ore and 86–93% for primary ore. The Ahafo Complex ores are generally clean ores containing low levels of problematic elements. No appreciable levels of rich-solution-robbing materials are present in the majority of the ores. The ores contain low sulfide sulfur, and low concentrations of primary cyanide consumers (copper, nickel, and zinc). 1.11 Mineral Resource Estimation 1.11.1 Estimation Methodology Database closeout dates varied by deposit. Geological models were constructed using Leapfrog and Vulcan geological modeling software. Block models were built with cell dimensions that were appropriate to the deposit style, orientation, and dimensions of the mineralization. Exploratory data analysis made use of tools such as descriptive statistics, histograms, cumulative probability plots, box plots, and contact analysis of raw assays to guide the construction of the block model and the development of estimation plans. Specific gravity values were typically assigned to the block model based on oxidation surfaces; however, density values were estimated in the Subika and Apensu underground models and the Subika open pit model. Grade caps were determined from raw assay or composite statistics for each geology domain. Composite lengths vary by deposit, and range from 2–8 m. Spatial variability of the gold grades was examined using correlograms and/or variograms. All deposits were estimated using ordinary kriging (OK) interpolation methods. Grade estimations were selective by mineralization domains in most cases and restricted within a lower value mineralization domain. A multi-pass search strategy was used to estimate each domain. Each domain used a minimum of 1–12 samples, a maximum of 8–60 samples, and a maximum of 2–4 samples per drill hole for the estimation of the passes. The search distances for the first pass used the range of the second structure of the modelled variogram, or a shorter range. Subsequent passes were introduced with very large search distances to estimate the majority of blocks that were not estimated in the first pass due to limited drill data. In some cases, an outlier restriction method was employed during estimation to avoid smearing high-grade samples when estimating distant blocks. In open pit models where grade control information (blastholes) was available, the grade estimation parameters were determined through calibration against a grade–tonnage curve derived from grade control models. Ahafo Complex Ghana Technical Report Summary Date: February 2026 Page 1-9 For underground resource models where no grade control information was available (Apensu and Subika underground), estimation focused on minimizing conditional bias and generation of a high- quality local estimate. Validation used Newmont-standard methods, including a combination of visual checks, swath plots, global statistical bias checks against input data, alternate estimation methods, and reconciliation with historical mine/plant performance. The validation procedures indicated that the geology and resource models used are acceptable to support the mineral resource estimation. Mineral resource classification was undertaken based primarily on drill spacing and number of drill holes used in the estimate. Mineral resources were classified as measured, indicated, and inferred. A quantitative assessment of geological risk was undertaken using Newmont-standard methods and applied on a block by block basis. Primary risks to resource quality include quantity and spacings of drill data, geological knowledge, geological interpretation, and grade estimates. All identified risks are within acceptable tolerances with associated management plans. Mineral resources considered potentially amenable to open pit mining methods are reported within a Lerchs–Grossmann pit shell. Variable incremental cut-off grades for Ahafo South range from 0.36–0.37 g/t Au in saprolite to 0.49–0.52 g/t Au in transition/fresh material were used in the inputs. Ahafo North’s cut-off grades range from 0.49–0.50 g/t Au in saprolite to 0.63–0.71 g/t Au in transition/fresh material. Mineral resources considered potentially amenable to underground mining methods are reported within underground stope designs. Variable incremental cut-off grades that range from 1.8–2.2 g/t Au were used in the inputs. Commodity prices used in resource estimation are based on Newmont’s internal economic guidelines which are issued annually. Prices are based on long-term analyst and bank forecasts, supplemented with research by Newmont’s internal specialists. The estimated timeframe used for the price forecasts is the 19-year LOM (processing and mining end in 2044 at Ahafo North) that supports the mineral reserve estimates. 1.11.2 Mineral Resource Statement Mineral resources are reported using the definitions set out in SK1300. The reference point for the estimate is in situ. Mineral resources are current as at December 31, 2025. Mineral resources are reported exclusive of those mineral resources converted to mineral reserves. Mineral resources that are not mineral reserves do not have demonstrated economic viability. Mineral resources are reported on a 100% basis. The Government of Ghana has a 10% free- carried interest in the Project. Newmont has a 90% interest. The measured and indicated mineral resource estimates for the Ahafo Complex are summarized in Table 1-1. The inferred mineral resource estimates are summarized in Table 1-2. The Qualified Person for the estimate is Mr. Shaun Chanter, RM SME, Head Reserve Governance – Global, a Newmont employee. Ahafo Complex Ghana Technical Report Summary Date: February 2026 Page 1-10 Table 1-1: Measured and Indicated Mineral Resource Statement, Ahafo Complex Area Measured Mineral Resources Indicated Mineral Resources Measured and Indicated Mineral Resources Tonnage (x 1,000 t) Grade (g/t Au) Cont. Gold (x 1,000 oz) Tonnage (x 1,000 t) Grade (g/t Au) Cont. Gold (x 1,000 oz) Tonnage (x 1,000 t) Grade (g/t Au) Cont. Gold (x 1,000 oz) Ahafo South Open Pit 1,000 1.13 0 5,000 0.72 100 6,100 0.79 200 Ahafo South Underground 1,200 3.69 100 41,400 3.84 5,100 42,500 3.84 5,200 Ahafo South Stockpiles — — — — — — — — — Ahafo South Subtotal 2,200 2.49 200 46,400 3.51 5,200 48,600 3.46 5,400 Ahafo North Open Pit 6,600 1.44 300 36,300 1.74 2,000 42,900 1.69 2,300 Ahafo North Stockpiles — — — — — — — — — Ahafo North Subtotal 6,600 1.44 300 36,300 1.74 2,000 42,900 1.69 2,300 Ahafo Complex Total 8,700 1.70 500 82,700 2.73 7,300 91,400 2.63 7,700 Ahafo Complex Open Pits 7,600 1.40 300 41,300 1.61 2,100 48,900 1.58 2,500 Ahafo Complex Underground 1,200 3.69 100 41,400 3.84 5,100 42,500 3.84 5,200 Ahafo Complex Stockpiles — — — — — — — — — Ahafo Complex Total 8,700 1.70 500 82,700 2.73 7,300 91,400 2.63 7,700 Ahafo Complex Ghana Technical Report Summary Date: February 2026 Page 1-11 Table 1-2: Inferred Mineral Resource Statement, Ahafo Complex Area Inferred Mineral Resources Tonnage (x 1,000 t) Grade (g/t Au) Cont. Gold (x 1,000 oz) Ahafo South Open Pit 3,200 1.1 100 Ahafo South Underground 19,500 2.9 1,800 Ahafo South Stockpiles — — — Ahafo South Subtotal 22,700 2.7 2,000 Ahafo North Open Pit 18,100 1.6 900 Ahafo North Stockpiles — — — Ahafo North Subtotal 18,100 1.6 900 Ahafo Complex Total 40,900 2.2 2,900 Open Pits 21,400 1.5 1,100 Underground 19,500 2.9 1,800 Stockpiles — — — Ahafo Complex Total 40,900 2.2 2,900 Notes to Accompany Mineral Resource Tables: 1. Mineral resources are current as at December 31, 2025. Estimates are reported using the definitions in SK1300. The Qualified Person responsible for the estimate is Mr. Shaun Chanter, RM SME, Head Reserve Governance – Global, a Newmont employee. 2. The reference point for the mineral resource estimate is in situ. 3. Mineral resources are reported on a 100% basis. Newmont holds a 90% interest and the Government of Ghana has a 10% free-carried interest. 4. Mineral resources are reported exclusive of mineral reserves. Mineral resources that are not mineral reserves do not have demonstrated economic viability. 5. Mineral resources that are potentially amenable to open pit mining methods are constrained within a designed pit shell. Mineral resources that are potentially amenable to underground mining methods are constrained within conceptual stope designs. Parameters used are summarized in Table 11-2 and Table 11-3 (open pit) and Table 11-4 (underground). 6. Tonnages are metric tonnes rounded to the nearest 100,000. Gold grade is rounded to the nearest 0.01 gold grams per tonne. Gold ounces are estimates of metal contained in tonnages and do not include allowances for processing losses. Contained (cont.) gold ounces are reported as troy ounces, rounded to the nearest 100,000. 7. Rounding of tonnes and contained metal content as required by reporting guidelines may result in apparent differences between tonnes, grade and contained metal content. In instances where tonnage and grade are presented but metal is shown as “0”, this is due to the metal contained falling below the metal rounding limit. Totals may not sum due to rounding.


Ahafo Complex Ghana Technical Report Summary Date: February 2026 Page 1-12 1.11.3 Factors That May Affect the Mineral Resource Estimate Factors that may affect the mineral resource estimate include: changes to long-term metal price assumptions; changes in local interpretations of mineralization geometry and continuity of mineralized zones; changes to geological and grade shape and geological and grade continuity assumptions; changes to input parameters used in the pit shells and stope outlines constraining the mineral resources; changes to the cut-off grades used to constrain the estimates; variations in geotechnical, mining, and processing recovery assumptions; and changes to environmental, permitting and social license assumptions. 1.12 Mineral Reserve Estimation 1.12.1 Estimation Methodology Measured and indicated mineral resources were converted to mineral reserves. All Inferred blocks are classified as waste in the cash flow analysis that supports mineral reserve estimation. 1.12.1.1 Open Pit For mineral reserves, Newmont applies a time discount factor to the dollar value block model that is generated in the Lerchs–Grossmann pit-limit analysis, to account for the fact that a pit will be mined over a period of years, and that the cost of waste stripping in the early years must bear the cost of the time value of money. In some deposits, where mineralization is uniformly distributed throughout the pit, or where the pit is shallow, discounting has little effect on the economic pit limit. For the Awonsu, Apensu South and Ahafo North deposits, where upper benches contain a high percentage of the waste, and mineralization quantities and/or grade increase with depth, discounting provides a smaller pit limit upon which mine designs are based. Pit discounting is accomplished by running the pit-limit “dollar” model through a program that discounts the dollar model values at a compound rate based on the depth of the block. In this manner, discounting is applied to future costs as well as future revenues, to represent the fact that mining proceeds from the top down within a phase. Optimization work involved floating pit shells at a series of gold prices. The generated nested pit shells were evaluated using the mineral reserve gold price of US$2,000/oz and an 8% discount rate. An average of eight benches per year of vertical advance was assumed for Ahafo South and 10 benches for Ahafo North. The pit shells with the highest net present value were selected for detailed engineering design work. Mining unit costs for pit designs were based on the 2026 business plan (BP26) budget assumptions and represent the average LOM operating costs, including sustaining capital for mine operations, mine maintenance and mine technical services functions. Sustaining capital Ahafo Complex Ghana Technical Report Summary Date: February 2026 Page 1-13 was included for all mining fleets commissioned after the start of production, plus capital for the associated support areas and minor equipment for the Ahafo complex projects. Royalties on production payable to the Ghanaian Government at a 5% rate were used as per the Investment Agreement. 1.12.1.2 Underground The mine plan assumes two mining methods: • Sub-level shrinkage (SLS); • Long-hole open stoping (LHOS). Stopes were created using Deswik Stope Optimizer software at the required stope height, length and cut-off criteria based on the mine area. The stope widths depend on the stope cut-off and dilution (over-break) added to stope design, and the mining method used. A stope recovery of 90% is expected in the long-hole open stoping mining areas and the sub-level shrinkage stoping is 100% based on the fixed draw strategy. Dilution is projected to average of 10% for long-hole open stoping and 22% for the sub-level shrinkage stoping area. 1.12.1.3 Stockpiles Stockpile estimates were based on mine dispatch data; the grade comes from closely-spaced blasthole sampling and tonnage sourced from truck factors. The stockpile volumes were typically updated based on monthly surveys. The average grade of the stockpiles was adjusted based on the material balance to and from the stockpile. 1.12.1.4 Commodity Prices Commodity prices used in resource estimation are based on Newmont’s internal economic guidelines which are issued annually. Prices are based on long-term analyst and bank forecasts, supplemented with research by Newmont’s internal specialists. The estimated timeframe used for the price forecasts is the 19-year LOM that supports the mineral reserves estimate. 1.12.2 Mineral Reserve Statement Mineral reserves have been classified using the definitions set out in SK1300. The reference point for the mineral reserve estimate is the point of delivery to the process facilities. Mineral reserves are current as at December 31, 2025. Mineral reserves are reported on a 100% basis. The Government of Ghana has a 10% free-carried interest in the Project. Newmont has a 90% interest. Mineral reserves for the Ahafo Complex are summarized in Table 1-3. Tonnages in the table are metric tonnes. The Qualified Person for the estimate is Mr. Shaun Chanter, RM SME, Head Reserve Governance – Global, a Newmont employee. Ahafo Complex Ghana Technical Report Summary Date: February 2026 Page 1-14 Table 1-3: Proven and Probable Mineral Reserve Statement, Ahafo Complex Area Proven Mineral Reserves Probable Mineral Reserves Proven and Probable Mineral Reserves Tonnage (x 1,000 t) Grade (g/t Au) Cont. Gold (x 1,000 oz) Tonnage (x 1,000 t) Grade (g/t Au) Cont. Gold (x 1,000 oz) Tonnage (x 1,000 t) Grade (g/t Au) Cont. Gold (x 1,000 oz) Ahafo South Open Pit 2,500 1.16 100 40,900 1.48 1,900 43,400 1.46 2,000 Ahafo South Underground 9,400 2.51 800 10,000 2.23 700 19,400 2.37 1,500 Ahafo South Stockpiles 18,500 0.94 600 — — — 18,500 0.94 600 Ahafo South Subtotal 30,400 1.44 1,400 50,900 1.63 2,700 81,300 1.56 4,100 Ahafo North Open Pit — — — 64,600 2.24 4,700 64,600 2.24 4,700 Ahafo North Stockpiles — — — 900 1.29 0 900 1.29 0 Ahafo North Subtotal — — — 65,500 2.23 4,700 65,500 2.23 4,700 Ahafo Complex Total 30,400 1.44 1,400 116,500 1.97 7,400 146,900 1.86 8,800 Open Pits 2,500 1.16 100 105,500 1.95 6,600 108,000 1.93 6,700 Underground 9,400 2.51 800 10,000 2.23 700 19,400 2.37 1,500 Stockpiles 18,500 0.94 600 900 1.29 0 19,500 0.96 600 Ahafo Complex Total 30,400 1.44 1,400 116,500 1.97 7,400 146,900 1.86 8,800 Notes to Accompany Mineral Reserves Tables: 1. Mineral reserves are current as at December 31, 2025. Mineral reserves are reported using the definitions in SK1300. The Qualified Person responsible for the estimate is Mr. Shaun Chanter, RM SME, Head Reserve Governance – Global, a Newmont employee. 2. The reference point for the mineral reserve estimates is the point of delivery to the process plant. 3. Mineral reserves are reported on a 100% basis. Newmont holds a 90% interest and the Government of Ghana has a 10% free-carried interest. 4. Mineral reserves that are estimated using open pit mining methods are constrained within a pit design based on an optimized Lerchs–Grossmann pit shell. Parameters used are shown in Table 12-1 and Table 12-2 for the open pit mineral reserves and Table 12-3 and Table 12-4 for the underground mineral reserves. 5. Tonnages are metric tonnes rounded to the nearest 100,000. Gold grade is rounded to the nearest 0.01 gold grams per tonne. Gold ounces are estimates of metal contained in tonnages and do not include allowances for processing losses. Contained (cont.) gold ounces are reported as troy ounces, rounded to the nearest 100,000. 6. Rounding of tonnes and contained metal content as required by reporting guidelines may result in apparent differences between tonnes, grade and contained metal content. In instances where tonnage and grade are presented but metal is shown as “0”, this is due to the metal contained falling below the metal rounding limit. Totals may not sum due to rounding. Ahafo Complex Ghana Technical Report Summary Date: February 2026 Page 1-15 1.12.3 Factors That May Affect the Mineral Reserve Estimate Factors that may affect the mineral reserve estimates include: changes to long-term metal price assumptions; changes in local interpretations of mineralization geometry and continuity of mineralized zones; changes to geological and grade shape and geological and grade continuity assumptions; changes to input parameters used in the pit shells and stope outlines constraining the mineral reserves; changes to the cut-off grades used to constrain the estimates; variations in geotechnical, mining, and processing recovery assumptions; and changes to environmental, permitting and social license assumptions. 1.13 Mining Methods 1.13.1 Open Pit Open pit mining is conducted using conventional techniques and an Owner-operated conventional truck and shovel fleet. Open pit design uses defined geotechnical domains together with rock mass quality ratings for the principal lithologies and appropriate pit design criteria that reflect expected conditions and risk. Inter-ramp angles vary by deposit and pit wall lithology, and range from 30–55º for Ahafo South deposits and 50–70º for Ahafo North deposits. The active pits are currently mining below the water table. Pit dewatering uses a combination of perimeter and in-pit dewatering wells, in-pit sumps, and horizontal drains. A network of monitoring piezometers is installed around all of the operating pits. The surface LOM plan for Ahafo South currently envisages mining at an average rate of approximately 24 Mt/a for seven years and peaking at 32.5 Mt/a in 2026 with a maximum rate of advance by pit stage of eight benches per annum. The open pit mine runs to 2032 with Awonsu phase 4 mining ending in 2031 whiles Apensu South commences in 2029 and ends in 2032. Milling will cease in 2034 after treatment of stockpiled ore and Subika Underground material. The Surface LOM plan for Ahafo North currently envisages mining at an average rate of approximately 22 Mt/a for 19 years and peaking at 24.0 Mt/a in 2028. Mining operations at Ahafo North commenced in 2024 and commercial production was declared in 2025. Initial mining activities targeting the Subenso South and Susuan deposits through to the end of 2025. The mine plan schedules the Subenso South, Teekyere West and Susuan deposits during 2026 and 2027. Subsequent phases of mining will progress into the Yamfo Northeast deposit, followed by development of Yamfo South and Subenso North. 1.13.2 Underground Underground mining is currently conducted using conventional stoping methods, and conventional mechanized equipment. Underground mining is conducted by a contractor. Mining levels are based on the mining method to be used, which varies by depth from surface. A set of twin spiral declines was developed off the existing main haulage decline. Level accesses were created off the decline at 20–25 m intervals, depending on mine elevation to intersect the ore zone. The ore drives have been driven to the extents of the defined mining corridor and stoping being retreated from the end of the orebody towards the accesses. These stopes are being mined top-down.


Ahafo Complex Ghana Technical Report Summary Date: February 2026 Page 1-16 Mining was initially envisaged as long-hole open stoping mining method; however, an improved understanding of the geotechnical setting led to the selection of sub-level shrinkage stoping in preference. A transition zone between mining methods at 450 m below surface was required to migrate the different stoping types. The mine will completely transition to the sub-level shrinkage mining method when the long-hole open stopes are complete, but currently the two mining methods are being used together. Groundwater inflows are estimated at 140 L/s, with an additional 25 L/s required for service-water supply to the underground workings. The ventilation system for Subika includes refrigeration, primary and secondary fans and intake and return ventilation raises. Trucks will be loaded from the level below the mining extraction level via the material placed in the ore pass. When stope mining is completed, the stopes will be backfilled with unconsolidated waste rock. Underground infrastructure includes an electrical ring main, sumps, pumps and pump stations, cooling system, communications, and telemetry system, mine control room, and two vehicle service bays. 1.14 Recovery Methods The process plant designs were based on a combination of metallurgical testwork, previous study designs and industry standard practices for handling combinations of fresh rock and saprolite. The designs are conventional to the gold industry and has no novel parameters. Debottlenecking and optimization activities were also completed once the Ahafo South mill was operational. Commercial production was declared for the Ahafo North mill in October, 2025. The Ahafo South process plant started operations in 2006 and was designed to treat 7.5 Mt/a using a blend of 27:73 oxide to primary ore. The plant was expanded in 2019 to treat an additional 3.0 Mt/a of primary ore. The planned throughput for the remaining LOM is projected to vary from 9.8–10.2 Mt/a (1.200–1,300 t/h), depending on the ore blend from the pits and underground operations. The process consists of: primary crushing, semi-autogenous grind (SAG) milling, carbon-in-leach (CIL), Anglo American Research Laboratory method (AARL) elution circuit to strip gold from loaded carbon, smelting to produce doré, and counter-current decantation to recover cyanide from CIL tailings prior to discharge to the tailings storage facility (TSF). Power is sourced from the local grid. The main water sources for the process plant are from stored water in the mined out Apensu open pit and the TSF. Consumables used include grinding media, reagents, and high- and low-pressure air. The Ahafo North plant capacity is 3.7 Mt/a when treating saprolite and 3.4 Mt/a when treating primary ores. The process consists of: primary crushing, a SAG mill operating in a closed circuit with a pebble crusher and a ball mill operating in closed circuit with hydrocyclones, a CIL circuit, an AARL elution circuit to strip gold from loaded carbon, smelting to produce doré, and counter- current decantation to recover cyanide from CIL tailings prior to discharge to the TSF. Power is sourced from the local grid. The primary source of raw water is pit dewatering, supplemented by runoff from the local catchments. Consumables used include reagents (cyanide, lime, acid, caustic, grinding media, high- and low-pressure air and oxygen). Ahafo Complex Ghana Technical Report Summary Date: February 2026 Page 1-17 1.15 Infrastructure Key infrastructure to support the Ahafo Complex mining activities envisaged in the LOM is in place. The Awonsu Phase 4 pit will be used for tailings deposition post mining in 2031. Personnel commute from surrounding settlements or live in purpose-built accommodations villages. A stockpiling strategy is practiced to defer lower-grade ores to the end of the mine life. All stockpile inventories are calculated and reported monthly. Inventories are based on truck counts of material added to and removed from stockpiles, multiplied by truck tonnage factors. The Ahafo South LOM plan assumes that only two WRSFs, at Apensu South and Awonsu, will be active for the remainder of the Ahafo South mine life. At Ahafo North, WRSFs are constructed at three locations that are in close proximity to the main mining areas. The Ahafo South TSF is operated as a zero-discharge facility; all water is returned to the process facility for reuse. TSF capacities meet the required capacities for the present LOM. A raise to Cell 1 will allow operations to 2031 followed by deposition into the mined Awonsu Phase 4 open pit will support the operations to the end of the LOM. The TSF expansions, Cell 1 that would be expanded to a maximum capacity of 220 Mt and the Awonsu Phase 4 in pit tailing deposition has an additional 89 Mt capacity. The fully lined TSF will be developed in eight phases, with phases 1 and 2 already completed and currently supporting ongoing milling operations. The remaining will be constructed in a phased manner to provide a total capacity of 76.4 Mt, aligned with the mine plan and tailings production schedule. Construction of the remaining phases is planned to commence with phase 3 in 2026 and progress through to phase 8 by 2042. Water management infrastructure for Ahafo Complex mine operations includes pit runoff, surface water, and groundwater management infrastructure. Reverse osmosis water treatment plants are operational. Newmont Africa in Ghana receives power purchased from the Volta River Authority’s grid. Power is delivered to the Ahafo Complex via three 161 kV transmission lines. Newmont has also installed emergency power generating capacity. 1.16 Markets and Contracts Newmont has established contracts and buyers for the doré products from the Ahafo Complex, and has an internal marketing group that monitors markets for its key products. Together with public documents and analyst forecasts, these data support that there is a reasonable basis to assume that for the LOM plan, that the key products will be saleable at the assumed commodity pricing. The doré is not subject to product specification requirements. Newmont uses a combination of historical and current contract pricing, contract negotiations, knowledge of its key markets from a long operations production record, short-term versus long- term price forecasts prepared by the company’s internal marketing group, public documents, and analyst forecasts when considering long-term commodity price forecasts. Higher metal prices are used for the mineral resource estimates to ensure the mineral reserves are a sub-set of, and not constrained by, the mineral resources, in accordance with industry-accepted practice. The forecast prices and exchange rates are shown in Table 1-4 Ahafo Complex Ghana Technical Report Summary Date: February 2026 Page 1-18 Table 1-4: Commodity Price and Exchange Rate Forecasts Commodity Units Mineral Reserves Mineral Resources Gold $US/oz 2,000 2,300 Exchange rate US$:Gh$ 1:12.00 1:12.00 Newmont’s doré is sold on the spot market, by marketing experts retained in-house by Newmont. The terms contained within the sales contracts are typical and consistent with standard industry practice and are similar to contracts for the supply of doré elsewhere in the world. The largest in-place contracts other than for product sales cover items such as bulk commodities, operational and technical services, mining and process equipment, and administrative support services. Contracts are negotiated and renewed as needed. Contract terms are typical of similar contracts in Ghana. 1.17 Environmental, Permitting and Social Considerations 1.17.1 Environmental Studies and Monitoring Baseline and supporting environmental studies were completed to assess both pre-existing and ongoing site environmental conditions, as well as to support decision-making processes during operations start-up. Characterization studies were completed for climate, air quality, hydrology and surface water quality, hydrogeology, flora, fauna, soils, agriculture and land use, and the socioeconomic environment. Plans were developed and implemented to address aspects of operations such as waste and fugitive dust management, air quality, spill prevention and contingency planning, water management, and noise levels. The primary environmental resource monitored at Ahafo is water – both surface water and groundwater. Other resource monitoring being conducted by Newmont includes fugitive dust, point source emission, meteorological parameters, noise and vibration, revegetation progress, surface water run-off quantity, and quality, mine pit conditions, waste rock disposal, TSF decant water quantity and quality, and environmental geochemistry of ore, waste rock, and tailings. 1.17.2 Closure and Reclamation Considerations In 2003, Newmont developed a conceptual closure and reclamation plan for the Ahafo South Mine Project Environmental Impact Statement (EIS) in compliance with requirements of the Environmental Protection Agency (EPA). The EIS was approved by the EPA in April 2005. A Draft Reclamation Plan to begin the process of formalizing the conceptual plan presented in the EIS was undertaken later in 2005. Under EPA requirements, Newmont is required to provide updates to the reclamation plan as mine development proceeds. An updated Closure and Reclamation Plan was developed in 2019 that covers closure of the Subika Underground and ancillary infrastructure as well as the prior existing facilities. A Reclamation Security Agreement (RSA) between the EPA and Newmont was signed in April 2008 to outline the various objectives and targets as guidance for the plan. The EPA requires a Reclamation Bond to be posted as part of any mine permitting process. The bond is required to provide financial surety against non-compliance under the approved Closure and Reclamation Ahafo Complex Ghana Technical Report Summary Date: February 2026 Page 1-19 Plan and is required within six months after the start of operations. As part of the reclamation and security agreement (environmental bond) with the Ghanaian Government, Newmont has provided a cumulative (project to date) cash deposit of US$14 M. The closure cost estimate for Ahafo South is US$0.2 B. A definitive closure and reclamation plan, which will address stockpiling of topsoils and concurrent reclamation, was developed for Ahafo North. The closure cost estimate for Ahafo North is approximately US$0.1B. 1.17.3 Permitting All major permits and approvals are either in place or Newmont expects to obtain them in the normal course of business. Where permits have specific terms, renewal applications are made of the relevant regulatory authority as required, prior to the end of the permit term. 1.17.4 Social Considerations, Plans, Negotiations and Agreements Newmont developed a public consultation and disclosure plan (PCDP) for the Ahafo Complex using guidelines and policies developed by the International Finance Corporation (IFC). The IFC requires public consultation as an on-going process to be conducted during the construction and operational phases of any project. Newmont has well-established relationships, issue management approaches, engagement forums, and a suite of integrated social impact and opportunity-aligned strategic investment partnerships. Newmont understands and accepts the importance of proactive community relations as an overriding principle in its day-to-day operations as well as future development planning. The company therefore structures its community relations activities to consider the concerns of the local people and endeavors to communicate and demonstrate its commitment in terms that can be best appreciated and understood to maintain the social license to operate. 1.18 Capital Cost Estimates Capital cost estimates are at a minimum at a pre-feasibility level of confidence, having an accuracy level of ±25% and a contingency range not exceeding 15%. Capital costs are based on recent prices or operating data. Capital costs include funding for infrastructure, pit dewatering, development drilling, and permitting as well as miscellaneous expenditures required to maintain production. Mobile equipment re-build/replacement schedules and fixed asset replacement and refurbishment schedules are included. Sustaining capital costs reflect current price trends. The overall capital cost estimate for Ahafo South LOM is US$0.7 B and Ahafo North LOM is US$0.9 B as summarized in Table 1-5. The total capital cost for the Ahafo Complex is US$1.6 B.


Ahafo Complex Ghana Technical Report Summary Date: February 2026 Page 1-20 Table 1-5: Ahafo Complex Capital Cost Estimate Area Unit Ahafo South Ahafo North Ahafo Complex Mining, open pit US$ Billion 0.2 0.3 0.5 Mining, underground US$ Billion 0.2 0.3 0.5 Process US$ Billion 0.3 0.3 0.6 Total US$ Billion 0.7 0.9 1.6 Note: numbers have been rounded; totals may not sum due to rounding. 1.19 Operating Cost Estimates Operating cost estimates are at a minimum at a pre-feasibility level of confidence, having an accuracy level of ±25% and a contingency range not exceeding 15%. Operating costs are based on actual costs seen during operations and are projected through the LOM plan. Historical costs are used as the basis for operating cost forecasts for supplies and services unless there are new contract terms for these items. Labor and energy costs are based on budgeted rates applied to headcounts and energy consumption estimates. Operating costs (mining, processing, and general and administrative (G&A) for Ahafo South and Ahafo North LOM are estimated at US$4.0 B and US$3.3 B, respectively, as summarized in Table 1-6. The total operating costs for the Ahafo Complex are estimated at US$7.3 B, as also summarized in Table 1-6. Table 1-6: Ahafo Complex Operating Cost Estimate Cost Element Unit Ahafo South Ahafo North Ahafo Complex Open pit mining costs US$ billion 0.7 1.4 2.1 Underground mining costs US$ billion 1.2 — 1.2 Processing costs US$ billion 1.4 1.2 2.6 G&A costs US$ billion 0.7 0.7 1.4 Total Operating Costs US$ billion 4.0 3.3 7.3 Note: numbers have been rounded; totals may not sum due to rounding. The estimated LOM open pit mining cost is US$4.37/t and the underground mining cost is US$62.32/t for Ahafo South. The estimated LOM open pit mining cost for Ahafo North is US$3.27/t. Base processing costs are estimated at US$16.93/t for Ahafo South and US$18.16/t (Table 1-7). Ahafo Complex Ghana Technical Report Summary Date: February 2026 Page 1-21 Table 1-7: Ahafo Complex Operating Unit Cost Estimate Cost Element Unit Ahafo South Ahafo North Ahafo Complex Open pit mining costs US$/t mined 4.37 3.27 3.59 Underground mining costs US$/t mined 62.32 — 62.32 Processing costs US$/t processed 16.93 18.16 17.48 G&A costs US$/t processed 8.63 11.41 9.87 Note: numbers have been rounded; totals may not sum due to rounding. 1.20 Economic Analysis 1.20.1 Economic Analysis The financial model that supports the mineral reserve declaration is a standalone model that calculates annual cash flows based on scheduled ore production, assumed processing recoveries, metal sale prices and US$/Gh$ exchange rate, projected operating and capital costs and estimated taxes. The financial analysis is based on an after-tax discount rate of 8%. All costs and prices are in unescalated “real” dollars. The currency used to document the cash flow is the US$. All costs are based on the 2026 budget. Revenue is calculated from the recoverable metals and long-term metal price and exchange rate forecasts. Taxes are based on Newmont’s existing agreement with the Government of Ghana. The economic analysis is based on 100% equity financing and is reported on a 100% project ownership basis. The Government of Ghana has a 10% free-carried interest in the Project. Newmont has a 90% interest. The economic analysis assumes constant prices with no inflationary adjustments. The NPV8% for the overall Ahafo Complex is US$1.7 B. As the cash flows are based on existing operations where all costs are considered sunk to January 1, 2026, considerations of payback and internal rate of return are not relevant. Free cash flow for the complex is US$ 2.7 B. A summary of the financial results is provided in Table 1-8. In this table, EBITDA = earnings before interest, taxes, depreciation, and amortization. The active mining operation ceases in 2044; however, closure costs are estimated to 2078. Ahafo Complex Ghana Technical Report Summary Date: February 2026 Page 1-22 Table 1-8: Cashflow Summary Table, Ahafo Complex Item Unit Value Metal prices Gold US$/oz 2,000 Milled ore Tonnage Million tonnes 147 Gold grade g/t 1.86 Gold ounces Million ounces 8.8 Capital costs US$ billion 1.6 Costs applicable to sales US$ billion 8.6 Discount rate % 8 Exchange rate United States dollar:Ghanaian cedi (USD:GHS) 1:12.00 Free cash flow US$ billion 2.7 Net present value US$ billion 1.7 Note: The economic analysis is based on 100% equity financing and is reported on a 100% project ownership basis. The Government of Ghana has a 10% free-carried interest in the Project. Newmont has a 90% interest. The economic analysis assumes constant prices with no inflationary adjustments. Table 1-8 contains “forward-looking statements” within the meaning of Section 27A of the Securities Act of 1933, as amended, and Section 21E of the Securities Exchange Act of 1934, as amended, which are intended to be covered by the safe harbor created by such sections and other applicable laws. Please refer to the note regarding forward-looking information at the front of the Report. The cash flow is only intended to demonstrate the financial viability of the Project. Investors are cautioned that the above is based upon certain assumptions which may differ from Newmont’s long-term outlook or actual financial results, including, but not limited to commodity prices, escalation assumptions, and other technical inputs. For example, Table 1-8 uses the price assumptions stated in the table, including a gold commodity price assumption of US$2,000/oz, which varies significantly from current gold prices and the assumptions that Newmont uses for its long-term guidance. Please be reminded that significant variation of metal prices, costs and other key assumptions may require modifications to mine plans, models, and prospects. Numbers have been rounded; totals may not sum due to rounding. 1.20.2 Sensitivity Analysis The sensitivity of the Project to changes in metal prices, exchange rate, sustaining capital costs and operating cost assumptions was tested using a range of 25% above and below the base case values. Each of Ahafo South, Ahafo North and the overall Ahafo Complex is most sensitive to gold price changes, less sensitive to changes in operating costs, and least sensitive to changes in capital costs. The sensitivity to gold grade mirrors the sensitivity to the gold price. The sensitivity analysis for the Ahafo Complex is shown in Figure 1-1. Ahafo Complex Ghana Technical Report Summary Date: February 2026 Page 1-23 Figure 1-1: NPV Sensitivity, Ahafo Complex Note: Figure prepared by Newmont, 2026. FCF = free cash flow; op cost = operating cost; cap cost = capital cost; NPV = net present value. 1.21 Risks and Opportunities Factors that may affect the mineral resource and mineral reserve estimates are summarized in Chapter 1.11.3 and Chapter 1.12.3. 1.21.1 Risks The risks associated with the Ahafo Complex are generally those expected with open pit and underground mining operations and include the accuracy of the resource model, unexpected geological features that cause geotechnical issues, and/or operational impacts. Other risks noted include: • The mineral reserve estimates are sensitive to metal prices. Lower metal prices than forecast in the LOM plan may require revisions to the mine plan, with impacts to the mineral reserve estimates and the economic analysis that supports the mineral reserve estimates; • Labor cost increases or productivity decreases could also impact the stated mineral reserves and mineral resources; • Geotechnical and hydrological assumptions used in mine planning are based on historical performance, and to date historical performance has been a reasonable predictor of current


Ahafo Complex Ghana Technical Report Summary Date: February 2026 Page 1-24 conditions. Any changes to the geotechnical and hydrological assumptions could affect mine planning, affect capital cost estimates if any major rehabilitation is required due to a geotechnical or hydrological event, affect operating costs due to mitigation measures that may need to be imposed, and impact the economic analysis that supports the mineral reserve estimates; • Expectations as to the performance of the Subika underground mining method. If the expectations are not met, this could have an effect on the mineral reserve estimates, the operating cost estimates, and the economic analysis that supports the mineral reserve estimates; • Galamsey (artisanal mining) activity can impact mine safety and operations; • Changes in climate could result in drought and associated potential water shortages that could impact operating costs and the ability to operate; • Political risk from changes to the fiscal or royalty regime. Such changes could have impacts to the mineral reserve estimates and the economic analysis that supports the mineral reserve estimates; • Political risk from challenges to mining licenses and/or Newmont’s right to operate. These could affect the assumptions in the economic analysis that supports the mineral reserve estimates, and the ability to operate. 1.21.2 Opportunities Opportunities include: • Conversion of some or all of the measured and indicated mineral resources currently reported exclusive of mineral reserves to mineral reserves, with appropriate supporting studies; • Upgrade of some or all of the inferred mineral resources to higher-confidence categories, such that such better-confidence material could be used in mineral reserve estimation; • Higher metal prices than forecast could present upside sales opportunities and potentially an increase in predicted Project economics; • Potential for new underground operations proximal to the current mineral resource and mineral reserve estimates, with the support of additional studies. 1.22 Conclusions Under the assumptions presented in this Report, the Ahafo Complex has a positive cash flow, and mineral reserve estimates can be supported. 1.23 Recommendations As the Ahafo Complex is based on operating mines, the QP has no material recommendations to make. Ahafo Complex Ghana Technical Report Summary Date: February 2026 Page 2-1 2.0 INTRODUCTION 2.1 Registrant This technical report summary (the Report) was prepared for Newmont Corporation (Newmont) on the Ahafo Complex (the Project) located in the Republic of Ghana (Ghana). The Ahafo Complex includes the Ahafo South and Ahafo North operations. The location of the operations is shown in Figure 2-1. Newmont has three subsidiaries registered under the laws of Ghana: Newmont Ghana Gold Ltd. (Newmont Ghana), Newmont Golden Ridge Ltd. (Newmont Golden Ridge) and Moydow Limited (Moydow). For the purposes of this Report, the name Newmont is used interchangeably for the subsidiary and parent companies. 2.2 Terms of Reference 2.2.1 Report Purpose The Report was prepared to be attached as an exhibit to support mineral property disclosure, including mineral resource and mineral reserve estimates, for the Ahafo Complex in Newmont’s Form 10-K for the year ending December 31, 2025. 2.2.2 Terms of Reference Mineral resources are reported for Apensu, Awonsu and Subika open pits, and Subika and Apensu underground at Ahafo South, and Yamfo Central, Yamfo Northeast, Yamfo South/Line 10, Subenso South, Subenso North, Susuan, and Teekyere West at Ahafo North. Mineral reserves are reported for Subika and Awonsu open pits and Subika underground at Ahafo South and Yamfo Northeast, Yamfo South/Line 10, Subenso South, Subenso North, Susuan, and Teekyere West at Ahafo North. Mineral reserves are also estimated for material in stockpiles. Mining commenced in 2006 from open pit sources. Figure 2-2 shows the location of the current and mined-out open pits, and prospects. Unless otherwise indicated, all financial values are reported in United States (US) currency (US$) and the metric system is used. “B” is used for billion. The Report uses US English. Mineral resources and mineral reserves are reported using the definitions in Regulation S–K 1300 (SK1300), under Item 1300. The Report contains forward-looking information; refer to the note regarding forward-looking information at the front of the Report. Ahafo Complex Ghana Technical Report Summary Date: February 2026 Page 2-2 Figure 2-1: Project Location Plan Ahafo Complex Ghana Technical Report Summary Date: February 2026 Page 2-3 Figure 2-2: Mining Operations Layout Plan Note: Figure prepared by Newmont, 2025. At Ahafo North: OP01 = Subenso South, OP03 = Teekyere West; OP05= Susuan; OP-6= Yamfo South/Line 10; OP7 = Subenso North; OP9 = Yamfo Northeast


Ahafo Complex Ghana Technical Report Summary Date: February 2026 Page 2-4 2.3 Qualified Persons The following Newmont employee serves as the Qualified Person (QP) for the Report: • Mr. Shaun Chanter, RM SME, Head Reserve Governance - Global, Newmont. Mr. Chanter is responsible for all Report Chapters. 2.4 Site Visits and Scope of Personal Inspection Mr. Chanter has visited the Ahafo Complex on several occasions, most recently from July 28 to August 7, 2025. During this site visit, Mr. Chanter inspected the operating open pits, and examined the underground operations. He visited the core shack and inspected drill core. Mr. Chanter also viewed the Ahafo process plants and associated general site infrastructure, including the current tailings storage facility (TSF) operations. While on site, he typically discusses aspects of the operation with site-based staff. These discussions include the overall approach to the mine plan, anticipated mining conditions, selection of the production target and potential options for improvement, as well as reconciliation study results. Other areas of discussion include plant operation and recovery forecasts and plans for the expanded TSF. Mr. Chanter reviews capital and operating forecasts with site staff. Mr. Chanter also reviews Newmont’s processes and internal controls on those processes at the mine site with operational staff on the work flow for determining mineral resource and mineral reserve estimates, mineral process performance, production forecasts, mining costs, and waste management. 2.5 Report Date Information in the Report is current as at December 31, 2025. 2.6 Information Sources and References The reports and documents listed in Chapter 24 and Chapter 25 of this Report were used to support Report preparation. 2.7 Previous Technical Report Summaries Newmont previously filed a technical report summary on the Project: • Doe, D., 2023: Ahafo Operations, Ghana, Technical Report Summary: report prepared for Newmont Corporation, dated December 31, 2023; • Doe, D., 2021: Ahafo Operations, Ghana, Technical Report Summary: report prepared for Newmont Corporation, dated December 31, 2021. Ahafo Complex Ghana Technical Report Summary Date: February 2026 Page 3-1 3.0 PROPERTY DESCRIPTION 3.1 Introduction The Ahafo Complex is located in western Ghana near the towns of Kenyasi and Ntotroso in the Ahafo Region, about 290 km northwest of Accra. The Ahafo South operations are situated 120 km northwest of Kumasi, and 30 km east of the regional capital of Goaso. The Ahafo North operations are located 20 km east of the Bono regional capital of Sunyani. The Ahafo Complex is centered at about 2º18’51” west longitude, and 7º06’01” north latitude, The Ahafo South plant site is located at 2º20’42” longitude and 7º02’13” latitude. The Ahafo North plant site is located at 2º11’30” longitude and 7º15’03” latitude. The centroid locations, in latitude/longitude, of the deposits that have mineral resource estimates are provided in Table 3-1. Table 3-1: Deposit Centroids Deposit Name Latitude (north) Longitude (west) Subika 6°59'51" 2°21'49" Apensu 7°01'17" 2°21'44" Awonsu 7°02'15" 2°20'58" Amoma 7°05'18" 2°18'15" Yamfo South 7˚12'55'' 2˚14'42'' Yamfo Central 7˚13'10'' 2˚13'02'' Yamfo Northeast 7˚15'14'' 2˚10'49'' Susuan 7˚13'54'' 2˚11'53'' Subenso South 7˚14'43'' 2˚10'30'' Subenso North 7˚15'19'' 2˚09'15'' Teekyere West 7˚14'08'' 2˚11'17'' 3.2 Property and Title in Ghana 3.2.1 Mineral Title Mineral exploration and mining are administered in Ghana under the Minerals and Mining Act, 2006 (Act 703) and relevant Regulations that came into force in June 2012. These are Minerals and Mining (General) Regulations, Minerals and Mining (Licensing) Regulations, Minerals and Mining (Support Services) Regulations, Minerals and Mining (Compensation and Resettlement) Regulations, Minerals and Mining (Explosives) Regulations and the Minerals and Mining (Health, Ahafo Complex Ghana Technical Report Summary Date: February 2026 Page 3-2 Safety and Technical) Regulations. The State is the owner of all minerals occurring in their natural state within Ghana's land and territorial sea, including its exclusive economic zone but is vested in the President on behalf of and in trust for the people of Ghana. Three types of mineral rights can be granted after the applicant’s fiscal and technical ability to perform effective exploration or mining is verified: reconnaissance and prospecting licenses, and mining leases (Table 3-2). Table 3-2: Types of Mineral Rights Mineral Right Name Comment Reconnaissance License Granted for a maximum area of 1,050 km2 in aggregate. Allows for non-intrusive reconnaissance exploration such as remote sensing, surface geology, and geochemical sampling (no excavation or drilling) and confers exclusive rights to the holder to undertake reconnaissance for the specific granted mineral(s) for a year. License is renewable for another 12 months provided that notification of the intention to extend the term of the license is provided not later than 90 days before the expiration of the initial term of the license. Renewals must be supported by a professional technical terminal report. Prospecting License Confers exclusive rights to the holder to prospect for granted mineral(s). Licenses may not exceed 157.5 km2 in aggregate. Granted for an initial period not exceeding three years with the ability to renew for an additional period of not more than three years. Notification of intention to renew the term of the license must be received not later than 90 days before the expiration of the initial term of the license. Renewals must be supported by a professional terminal report. License holder is required to relinquish not less than half of the original license area after the expiration of the first three-year term Mining Lease Required to commence mining operations. Requires the applicant to submit a feasibility report in accordance with the Minerals Commission’s guidelines, stating how the planned mining operation is to be carried out. The lease area is limited to a maximum area of 63 km2; however, an enlargement of the lease area may be granted by the Minister responsible for mines if satisfied on reasonable grounds that the additional area is required for the holder’s operations. Granted for a maximum 30-year term, and renewable thereafter upon negotiated terms. 3.2.2 Surface Rights A mineral right holder is required to exercise their rights so that impacts on the interests of any lawful owner or occupier of the land are minimized. The lawful owner or occupier retains the right to graze livestock and cultivate the land in so far as such activities do not interfere with the mineral operations. The owner or occupier may apply to the mineral right holder for compensation for any disturbance of their rights, for damage to buildings, improvements, livestock, crops, or trees. Assessment of compensation eligibility and amount payable, in practice, requires extensive stakeholder engagement including affected landowners, the Land Valuation Division and cooperation of traditional authorities. Lawful owners or occupiers of land must obtain permission from a mining company to erect any building or structure on the land in an area of the lease declared a Mining Area by the mineral right holder. Ahafo Complex Ghana Technical Report Summary Date: February 2026 Page 3-3 Although some parts of the Ghanaian land law are derived from English common law and equity, the fundamental principles of land ownership are distinct from that of the English law of real property. The basis of English law of real property is that the Crown owns all land; however, in Ghana land is owned by various Stools, families, or clans (the owners). The Government of Ghana may only hold land by acquisition from these traditional owners, if necessary, in the interest of defense, public safety, public order, public morality, public health, town and country planning or the development or utilization of property in such a manner as to promote the public benefit and fair and adequate compensation is paid. Traditionally, the owners of non-vested Stool lands enjoy much wider rights than is the case for vested lands, but in practice traditional authorities and privileges are similar to those due to the Crown and generally result in a similar outcome. The ability of the traditional Stool owners to exercise exclusive rights depends on ancestral links and the individuals’ standing within the community. Land-use rights vary between landlords and tenants. Generally, a landlord is a property holder who has exclusive rights to use or to dispose of use rights to land. Land use rights are typically acquired from traditional rulers and family heads or by inheritance and are disposed otherwise by contracts for sharecropping or lease. A given householder may be a landlord of one farm field, a sharecropper on another and a caretaker on a third. Largely, with respect to land within the area affected, the original (traditional) owners retain the surface rights, as in the Asutifi North District where the Ahafo South operations are located, unless their rights are curtailed by Newmont being awarded a mining lease and paying the appropriate compensation. The grant of a mining lease by the Government of Ghana may curtail the interest of traditional owners. Thus, the lease agreement requires the payment of revenue to the affected owner in the form of ground rent which for traditional owners are managed by the Office of the Administrator of Stool Lands for the benefit of the traditional owners and the District within which the mineral rights sits. 3.2.3 Royalties The Government of Ghana levies royalties on mining projects, including the Ahafo Complex. A Tax Stability Agreement with the Government expired on December 31, 2025. Upon expiration, the Mineral Royalty Rate was moved from the sliding scale system to a flat rate of 5%. 3.3 Ownership 3.3.1 Ownership History In 1993, a joint venture (JV) agreement was signed between the French governmental organization Bureau Recherché Geologiques et Minieres (BRGM) and the South African company Gencor Ltd (Gencor) to explore in Ghana and Cote d’Ivoire. In 1994, the JV signed an option agreement with Ghanaian company Minconsult over the Yamfo license and formed the Centenary Gold Mining Company (41% BRGM, 41% Gencor, 8% Minconsult, and 10% Ghanaian Government). In the same year, La Source Compagnie Miniere SAS (La Source) was established with Normandy Mining Limited (Normandy) holding 60%, and BRGM 40%. La Source took over


Ahafo Complex Ghana Technical Report Summary Date: February 2026 Page 3-4 BRGM’s West African exploration and mining assets. In 1998, La Source consolidated its position when it acquired the former Gencor and Minconsult interests in Yamfo. In 2000, the name Centenary Gold Mining Company Limited was changed to Normandy Ghana Gold Limited (Normandy Ghana Gold). The Ntotroso license area (formerly the Rank Mining Concession) was acquired in 1997 when La Source purchased a 40% share in Rank Mining Company Limited (Rank). Rank held a 40% interest in the Rank JV Farm-In Agreement with Moydow Mines International Inc (Moydow; 60% interest), that covered the Ntotroso concessions. La Source increased its holding in Rank, and thus the JV, to 50% in 2001, by funding exploration and development in accordance with the agreement. Newmont acquired Normandy and the Ghanaian projects in early 2002. In December 2003, Newmont acquired the remaining 50% interest in Rank. The same month, Newmont and the Government of Ghana signed an investment agreement guaranteeing Newmont certain financial and operating rights over a period of 30 years for its projects in Ghana. Newmont renamed the Sefwi and Ntotroso projects to Ahafo, and then separated the area into two sections, Ahafo North and Ahafo South, based on location north or south of the Shelterbelt Forest Reserve. 3.3.2 Current Ownership The Project is held through Newmont Ghana Gold Ltd., an indirectly-wholly owned Newmont subsidiary. 3.4 Mineral Title Newmont currently holds four mining licenses, and seven prospecting licenses that in total cover an area of approximately 925 km2: • The mining leases are current until 2031 and can be renewed by negotiation. The total area held under mining licenses is approximately 549 km2; • The prospecting licenses are valid and are in good standing. The total area covered by prospecting licenses is about 376 km2. The Ahafo mining lease is separated into two areas, where Ahafo South is in Area A, and Ahafo North in Area B (Figure 3-1). The licenses within the Ahafo South area are shown in Figure 3-2. The licenses within the Ahafo North area are shown in Figure 3-3. A summary of the mineral tenure that makes up the Ahafo Complex is provided in Table 3-3. Ahafo Complex Ghana Technical Report Summary Date: February 2026 Page 3-5 Figure 3-1: Ahafo District Mineral Tenure Map Note: Figure prepared by Newmont, 2025. Ahafo Complex Ghana Technical Report Summary Date: February 2026 Page 3-6 Figure 3-2: Ahafo South Mineral Licenses Map Note: Figure prepared by Newmont, 2025. Ahafo Complex Ghana Technical Report Summary Date: February 2026 Page 3-7 Figure 3-3: Ahafo North Mineral Licenses Map Note: Figure prepared by Newmont, 2025. At Ahafo North: OP01 = Subenso South, OP03 = Teekyere West; OP05= Susuan; OP-6= Yamfo South/Line 10; OP7 = Subenso North; OP9 = Yamfo Northeast


Ahafo Complex Ghana Technical Report Summary Date: February 2026 Page 3-8 Table 3-3: Mineral Tenure Summary Table Concession License Type License Number Size (km2) Grant Date Expiry Date Ahafo (Area A) Mining Lease LVB 7523/2001 272.58 1/22/2001 6/12/2031 Ahafo (Area B) Mining Lease LVB 7523/2001 187.53 1/22/2001 6/12/2031 Ntotroso (Rank Mining) Mining Lease LVB 7524/2001 76.65 6/13/2001 6/12/2031 Goa Mining Lease 1809/2005; LVB13908/05 11.97 10/7/2001 10/06/2031 Dekyem Prospecting PL7/82; LVB 3080/05 36.75 6/17/2019 10/6/2027 Dekyem South Prospecting PL7/122 42.63 6/30/2020 3/9/2027 Goa Prospecting RL 7/36; LVB 3082/05 92.19 6/10/2019 10/6/2027 Goaso Prospecting PL 7/31 29.61 1/23/2019 10/6/2027 Mampehia Prospecting PL (7/85); LVB 5014/2006 36.12 7/18/2019 3/9/2027 Mankraho Prospecting PL 7/87; LVB 10714/03 103.53 6/4/2019 6/12/2031 Tanoso Prospecting PL 7/84 35.07 1/23/2019 10/6/2027 Total 924.63 Note: All dates in month/day/year format. Under Ghanaian law, only mining leases and prospecting licenses require surveys; reconnaissance license types are delineated by latitude/longitude co-ordinates. All of the Ahafo mining leases were surveyed by Newmont staff, using global positioning system (GPS) readings and identifiable benchmarks on topographic maps to locate the boundary pillars on the ground from site plans. A number of payments are required to keep the licenses/leases in good standing, and include: • Annual rental: payable by January of each year; • Annual prospecting and mining permit payments: payable by January of each year. All required payments have been made as they fall due. 3.5 Surface Rights Newmont was granted a Plan of Operations (PoO) for the Ahafo Complex, and may use whatever land is necessary for its operations but must respect the surface rights of other land users in relation to access and loss of crops, timber, or structures. Extensive title searches were conducted over the mining lease areas and no titles exist that would categorically exclude Newmont’s operations on the Project lands. Newmont’s indenture for surface lands will run concurrently with the life of the operations, but will extend for no more than 50 years. The Ahafo Complex covers an area of approximately 55,532 ha for the mining lease concessions, with a current total mining area of approximately 5,543 ha. Of this holding, approximately 4,539 Ahafo Complex Ghana Technical Report Summary Date: February 2026 Page 3-9 ha has been fully compensated, and Newmont is in the process of resettling inhabited households on approximately 409 ha. The remaining 1,004 ha had not been fully compensated for at the Report date. 3.6 Water Rights Newmont holds permits to allow abstraction of groundwater, surface water, and water from the Tano River and discharge of water from the water storage facility (see Chapter 17 for additional details). 3.7 Forest Reserves Areas of productive Forest Reserves were designated in the vicinity of the Ahafo Complex. These areas include the Bosumkese Forest Reserve and the Amoma Shelterbelt Forest Reserve (refer to Figure 3-1). Potential impacts on the Forest Reserves include roads, powerline access, and the general proximity of the mining operations to the Forest Reserve areas. 3.8 Agreements 3.8.1 Investment Agreement The Revised Investment Agreement (the Agreement) between Newmont and the Government of Ghana defined and fixed, in specific terms, the effective corporate tax and royalty burden the Project (including Ahafo South and Ahafo North) would carry during operations. The Agreement established a fixed fiscal and legal regime, including sliding-scale royalty and tax rates for the duration of the Agreement’s stability period. The Agreement was re-negotiated and ratified in December, 2015. Under the Agreement stability period, which expired at the end of 2025, the tax rate was 32.5%. After the cessation of the stability period, the tax rate increased to 35%. During the stability period, Newmont paid gross royalties on gold doré production in accordance with a sliding scale of 3–5%, tied to the gold price. After the Agreement ended, the royalty rate was fixed at 5%. With the expiry of the stability agreement, the operation is also subject to the Growth and Sustainability Levy (GSL) of 3% based on gross revenue. An additional 0.6% may payable as a special fee for gold doré production from designated Forest Reserves (see discussion in Chapter 3.9). 3.8.2 Government of Ghana Free-Carried Interest The Government of Ghana has a 10% free-carried interest in the Ahafo Complex. Newmont pays the Government of Ghana a ninth of the dividend declared to Newmont shareholders. Since December 2015, Newmont has been obligated to pay 0.6% of the operational revenue if the gold price averages US$1,300/oz or higher, as an advance dividend against the one-ninth share. Ahafo Complex Ghana Technical Report Summary Date: February 2026 Page 3-10 3.9 Royalties A net smelter return (NSR) royalty of 2.0% is payable on all ounces produced from the Rank (formerly Ntotroso) concession. The royalty is paid to Franco-Nevada Corporation (Franco- Nevada), which acquired the royalty for US$58 M in November 2009. The majority of the Subika deposit, the northern portion of the Awonsu deposit, and the southern tip of the Amoma deposit fall within the Rank mining lease boundary. Royalties in forest reserves are currently not applicable for the Ahafo Complex. 3.10 Encumbrances There are no known encumbrances. 3.11 Permitting Permitting and permitting conditions are discussed in Chapter 17.9 of this Report. There are no relevant permitting timelines that apply; the operations as envisaged in the LOM plan are either fully permitted, or the processes to obtain permits are well understood and similar permits have been granted to the operations in the past, such as tailings storage facility (TSF) raises. There are no current material violations or fines, as imposed in the mining regulatory context of the Mine Safety and Health Administration (MSHA) in the United States, that apply to the Ahafo Complex. 3.12 Significant Factors and Risks That May Affect Access, Title or Work Programs Newmont’s Ahafo concession started in 2008 at Kenyasi (Ahafo South) and spread to the Ahafo North communities. However, Newmont embarked on a series of facilitated interventions in collaboration with the communities and National Security to drastically discourage illegal mining. Notwithstanding this, the activity intermittently continued until the Government of Ghana implemented an ‘operations-stop-galamsey’ policy which has brought illegal mining to a temporary halt both in the Newmont concessions and elsewhere in Ghana. The surge in galamsey (illegal mining) activities in the last few years within the mining area has been identified as a major risk to Newmont’s short-, medium- and long-term sustainability and has the potential to drive community conflict due to encroachment on farmlands and its attendant social vices. Newmont has seen increases in violent confrontations between illegal galamsey operatives and public/private security and use of illegal explosives within the Mine Take area, invasion of active mining pits and run-of-mine (ROM) pad, among others. Newmont is implementing the Ahafo Dome Project that involves increased aerial surveillance, coupled with a dedicated Mobile Response Unit consisting of several teams within the area that has been designated as having restricted access (mine take area). Measures that include immediate and responsible removal of galamsey operators within the mine take can be conducted per an established protocol with the support of security and the social and environmental departments. Such measures, performed in collaboration with the relevant government, public Ahafo Complex Ghana Technical Report Summary Date: February 2026 Page 3-11 security officials and traditional authorities, has resulted in significant reduction in the numbers in key areas that pose a threat to the mine. Newmont continues to pursue implementation of the livelihood approach under Newmont’s Regional galamsey strategy which complements galamsey operative removals from the mining areas. This involves identification of community workers in the galamsey value chain who are interested in pursuing alternative livelihood opportunities. Despite the above, the threat of illegal mining still exists, except that frequent monitoring as mentioned, currently wards off such incursions. To the extent known to QP, there are no other known significant factors and risks that may affect access, title, or the right or ability to perform work on the properties that comprise the Ahafo Complex that are not discussed in this Report.


Ahafo Complex Ghana Technical Report Summary Date: February 2026 Page 4-1 4.0 ACCESSIBILITY, CLIMATE, LOCAL RESOURCES, INFRASTRUCTURE AND PHYSIOGRAPHY 4.1 Physiography The Ahafo Complex area comprises low rounded hills with elevations ranging from 110 m to 540 masl. The upper part of the Tano River basin is drained by a number of seasonal streams that are tributaries of the Tano River. Two streams, the Subri and the Awonsu, drain from the Project area to the Tano River. The Project shares a boundary with the Bosumkese Forest Reserve, and the Amoma Shelterbelt Forest Reserve bisects the Ahafo mining lease. The Ahafo Complex area consists primarily of subsistence farms with small-scale commercial farming intermingled with areas of forest regrowth and remnants of secondary forest. The major agricultural land uses are cocoa, food crops, and rice farming. South of the Bosumkese Forest Reserve, cocoa farming is the major activity, while to the north, maize farming dominates. 4.2 Accessibility Road access to the Ahafo South area is via national Route 6, an asphalt-paved road from Accra to the Tepa Junction via Kumasi in the direction of Sunyani, a distance of approximately 300 km. From Tepa Junction, an asphalt-paved road leads west for 39 km through the villages of Tepa and Akyerensua to Hwidiem. A paved road then leads northwest for 8 km to the village of Kenyasi. Newmont constructed a bypass north of Kenyasi to facilitate supply deliveries, and route traffic around the town for safety reasons. Road access to the Ahafo North area is primarily via the national Route 6, which runs from Accra through Kumasi toward Sunyani. The Ahafo North mine is located approximately 20 km east of Sunyani, near the communities of Afrisipakrom and Techire. As part of mine development, a segment of the main highway connecting Afrisipakrom and Techire on the Sunyani–Kumasi route was realigned and diverted to accommodate mine infrastructure. The primary access road to the Ahafo North mine was integrated into this diverted highway, providing controlled and safe entry for supply deliveries and operations. Newmont upgraded sections of the surrounding local road network to support efficient logistics while minimizing heavy equipment movement through the surrounding communities and enhancing road safety. Connectivity between Ahafo North and Ahafo South is provided via the N12 highway, with a travel distance of approximately 70 km between the two sites. Ahafo Complex Ghana Technical Report Summary Date: February 2026 Page 4-2 4.3 Climate The Project area falls within the wet semi-equatorial climatic zone of Ghana that is characterized by an annual double maxima rainfall pattern, occurring in the months of May to July and from September to October. Mean annual rainfall for the Project area is between 1,354–1,400 mm. Typically, minimal rainfall is experienced from December to the end of February, with January as the driest month. Mean monthly temperatures within the area range from 23.9–28.4°C. The Ahafo Complex operations are conducted year-round. 4.4 Infrastructure The Project lies within two Administrative Districts, Tano North in the north and Asutifi North in the south. Each district has its own central government-based District Council as well as a number of Traditional Government Paramount Chieftaincies. Sunyani is a major regional center and is the source of supplies and fuel. There are adequate schools, medical services, and businesses to support the work force. A skilled and semi-skilled mining workforce has been established in the region as a result of on-going mining activities. Workers live in the surrounding communities. The Ahafo Complex currently has all infrastructure in place to support mining and processing activities at Ahafo North and Ahafo South (see also discussions in Chapter 13, Chapter 14, and Chapter 15 of this Report). These Report chapters also discuss water sources, electricity, personnel, and supplies. Ahafo Complex Ghana Technical Report Summary Date: February 2026 Page 5-1 5.0 HISTORY The exploration and development history of the Ahafo Complex is summarized in Table 5-1. Table 5-1: Exploration and Development History Summary Table Year Company Note 1989– 1991 Ghanaian–German mineral prospecting project Identified a gold-in-soil anomaly that had a strike-length of 1.2 km situated about 1 km east of Yamfo 1992 Minconsult Soil sampling on 50 m x 400 m grid; confirmed the anomalous gold values identified during 1989–1991 1993– 1995 BRGM and Gencor/Centenary Mining Company Stream sediment sampling, soil sampling, trenching, pitting, rotary air blast (RAB), reverse circulation (RC) and core drilling and an initial mineral resource estimate 1996 BRGM and Gencor/Centenary Mining Company Scoping study evaluated the Teekyere West, Yamfo Central and Line 10 deposits (now within the Ahafo North area) Moydow Mines International Inc. (Moydow) Identified eight major gold-in-soil anomalies in the Ntotroso Prospecting License (Rank Concession) 1997 BRGM and Gencor/Centenary Mining Company Feasibility study based on an updated resource estimate commenced but halted due to falling commodity prices Moydow RC drilling program completed on Areas A (now the Apensu–Awonsu area), C (now Amoma) and E (now Subika). Resource estimates for Areas A and C 1998 Normandy BRGM, La Source and Normandy joint venture dissolved; Normandy takes over operations. Commenced major drill program 1999 Completed pre-feasibility study 2000 Normandy Completed feasibility study Moydow Resource estimate at Subika. Rank Development and Production Agreement signed by La Source and Moydow, to allow for treatment of mineralization from the Rank Concession deposits through a common plant. Feasibility study on the Subika and Area A deposits 2002 Newmont Merges with Normandy, renames area to Ahafo 2003 Feasibility study on Ahafo North and South deposits Purchases Moydow properties, Moydow retains 2% NSR royalty, covering covers 78 km2 of the southeastern end of the Project area 2006 Constructed process plant. Commenced open pit mining at the Apensu deposit Commercial production at Ahafo South Discovered of Susuan deposit at Ahafo North Ahafo Complex Ghana Technical Report Summary Date: February 2026 Page 5-2 Year Company Note 2008 Identified mineralization that could be mined by underground mining methods at Subika 2009 Franco Nevada Franco Nevada purchases Moydow 2% NSR royalty 2012– 2013 Newmont Underground trial mining program at Subika 2014 Identified Apensu Deeps area 2016 Extension of mineralization to the north of Apensu identified. Apensu open pit mined out 2017 Amoma open pit mined out 2018 Commercial production from Subika underground Commenced Subika Growth study to identify mineralization to the north and south of the Subika open pit 2019 Initiated studies to change mining method at Subika underground to sub- level shrinkage stoping 2020– 2021 Change in Subika underground mining method from long-hole open stoping to sub-level shrinkage Funding approval for mining operations at Ahafo North 2022– 2023 Ahafo North mine construction 2024 Commenced open pit mining at Subenso South (Pit 01) and Susuan (Pit 05) 2025 Subika open pit mined out Ahafo North achieved commercial production


Ahafo Complex Ghana Technical Report Summary Date: February 2026 Page 6-1 6.0 GEOLOGICAL SETTING, MINERALIZATION, AND DEPOSIT 6.1 Deposit Type The deposits that comprise the Ahafo Complex are considered to be examples of orogenic gold deposits. Such deposits have many synonyms including mesothermal, mesozonal and hypozonal deposits, lode gold, shear zone-related quartz–carbonate deposits, or gold-only deposits (Groves et al., 1998). Orogenic gold deposits occur in variably deformed metamorphic terranes formed during Middle Archean to younger Precambrian, and continuously throughout the Phanerozoic. The host geological environments are typically volcano–plutonic or clastic sedimentary terranes, but gold deposits can be hosted by any rock type. There is a consistent spatial and temporal association with granitoids of a variety of compositions. Host rocks are metamorphosed to greenschist facies, but locally can achieve amphibolite or granulite facies conditions. Gold deposition occurs adjacent to first-order, deep-crustal fault zones. Economic mineralization typically formed as vein fill of second- and third-order shears and faults, particularly at jogs or changes in strike along the crustal fault zones. Mineralization styles vary from stockworks and breccias in shallow, brittle regimes, through laminated crack-seal veins and sigmoidal vein arrays in brittle-ductile crustal regions, to replacement- and disseminated-type orebodies in deeper, ductile environments. Quartz is the primary constituent of veins, with lesser carbonate and sulfide minerals. Sulfide minerals can include pyrite, pyrrhotite, chalcopyrite, galena, sphalerite, and arsenopyrite. Gold is usually associated with sulfide minerals, but native gold can occur. 6.2 Regional Geology The West African craton is sub-divided into two domains, the Archean Reguibat Shield, in Mauritania to the north, and the Paleo-Proterozoic Man Shield in the south between Ghana and Senegal. The Man Shield is divided into two sectors, a western portion consisting of rocks of Liberian age (3.0–2.5 Ga) and an eastern terrain underlain by Paleoproterozoic Birimian rocks. The Birimian rocks consist of five evenly-spaced tholeiitic to acidic composition volcanic belts trending northeast–southwest. Three granite successions intrude the Birimian rocks. Basins between the volcanic belts are filled by predominantly turbiditic sedimentary rocks. The transition zones between the volcanic rocks and the sedimentary rocks are filled with chemical sedimentary rocks. All the units are contemporaneous and may be laterally equivalent facies. The Ahafo deposits are located in the Sefwi Belt, one of the five Birimian volcanic belts. Volcanic rocks in the belt are mainly basaltic and are metamorphosed to varying degrees from lower greenschist to lower amphibolite facies with elongate hornblende-bearing granite plutons of the Dixcove suite. The sedimentary succession consists mainly of fine to medium-grained lithologies Ahafo Complex Ghana Technical Report Summary Date: February 2026 Page 6-2 (argillites and wackes) with variable amounts of volcaniclastic material. Cape Coast-type two- mica granites intrude the metasedimentary rocks. Faults and associated structures display a complex history of movement including thrust faulting and shearing with both normal and strike–slip motion and have played a major role in emplacement of mesothermal gold mineralization. Regional structure is controlled by the Kenyasi Thrust Fault, a northeast to southwest trending regional thrust complex. 6.3 Project Geology The Ahafo Complex area includes the Ahafo South (Apensu, Awonsu, Amoma, and Subika) and Ahafo North (Yamfo South, Yamfo Central, Yamfo_NE, Subenso South, Teekyere West, Susuan and Subenso North) deposits, which are localized along multiple northeast-striking structural zones (Figure 6-1). A stratigraphic column for the district is provided in Figure 6-2 and Figure 6-3. Discrete mineralization styles are recognized within the Ahafo Complex area, which are termed Kenyasi-style (shear-zone hosted), Subika-style (granite hosted), and Subenso-style (associated with fold limb) zones. Mineralization in Kenyasi-style deposits is associated with mixed (meta)-pelitic sedimentary rocks and (meta)-mafic volcanic units along the footwall of the Kenyasi Thrust Fault. Dixcove Suite granitoids form the hanging wall to the thrust, and appear to be overthrust onto the volcano– sedimentary sequence. Multiple thrust fault duplexes developed along the thrust contact between the granitoids in the hanging wall and volcano/sedimentary rocks in the footwall and are favorable sites for gold deposition. In Subika-style deposits, mineralization is hosted in Dixcove Suite granitoids. The granitoids are cut by multiple mylonite zones that occur as imbricate thrusts and vary in thickness from <1 m to as much as 10 m. Zones of brittle fracturing and dilatant breccias are commonly developed over the mylonite zones and are favorable loci for gold deposition. Lithologies in the Subenso-style zones are localized along the northern limb of a northeast- trending, northerly-plunging anticlinorium in multiple northeast-trending, southwest-dipping structural zones. Tectonic and dilatant breccias formed during brittle faulting along multiple northeast-striking southeast-dipping structural zones, which developed intense folding and discrete fault zones where physical abrasion develops wall rock fragments in a matrix of finely ground wall rock (tectonic breccia). Ahafo Complex Ghana Technical Report Summary Date: February 2026 Page 6-3 Figure 6-1: Ahafo Geology Map Note: Figure prepared by Newmont, 2025 Ahafo Complex Ghana Technical Report Summary Date: February 2026 Page 6-4 Figure 6-2: Stratigraphic Column Part A Note: Figure prepared by Newmont, 2021


Ahafo Complex Ghana Technical Report Summary Date: February 2026 Page 6-5 Figure 6-3: Stratigraphic Column Part B Note: Figure prepared by Newmont, 2021. Ahafo Complex Ghana Technical Report Summary Date: February 2026 Page 6-6 6.4 Deposit Descriptions 6.4.1 Apensu Mineralization at Apensu is both near-surface and extends at depth. Near-surface material was exploited in the Apensu open pit. Mineralization within the Apensu Deeps represents a series of steeply-dipping, structurally- controlled, high-grade shoots beneath the former Apensu open pit. The Apensu Deeps area is subdivided into four zones, Apensu South, Apensu Gap, Apensu Main, and Apensu North (Figure 6-4). Mineralization remains open at depth in all zones, and to the north in Apensu North. 6.4.1.1 Deposit Dimensions The mineralization at surface had horizontal dimensions of approximately 4,800 x 600 m. Apensu Deeps, the continuation of the Apensu mineralization at depth, has dimensions of 2,700 x 200 m and is drill tested to about 1.2 km vertical depth. The shear zone varies in width from about 10–75 m in true width, with gold mineralization grading >0.5 g/t Au and varying from 30–150 m in width. Higher gold grades (>5 g/t Au) are hosted in, or immediately adjacent to, strongly-altered quartz–calcite veined cataclasite. The veins range from veinlets of 0.1–3.0 cm in width to silica-rich veins that range from 2–10 cm in width. Mineralization remains open at depth in the Apensu Deeps area, and towards the south along strike. 6.4.1.2 Lithologies The Apensu deposit, a Kenyasi-style deposit, is located on the main Kenyasi Thrust Fault zone at the southern edge of the Ahafo trend. Footwall rocks comprise strongly foliated, metamorphosed volcano-sedimentary rocks (siltstones, argillites, volcaniclastic rocks, and mafic to intermediate volcanic rocks). The hanging-wall rocks consist of metamorphosed granodiorite. Abundant 1–5 m thick, low-angle mafic dikes intruded the hanging wall granodiorite. A mafic chonolith, ranging from 3–90-m thick is recognized at depth (below current open pit levels) throughout Apensu South, Main, North, and Awonsu. It intruded along the Kenyasi–Yamfo structure and contains partially assimilated granodiorite. The Apensu Gap area is different to the Apensu South and Apensu Main zones, as the area lacks the mafic unit that is associated with Apensu South, and the cataclasis is very weak. In this area, it appears that low-angle faults control and limit the extent of better grade gold mineralization. Apensu North is developed in a structural jog repetition on the Kenyasi Fault beneath the Apensu Main deposit. Ahafo Complex Ghana Technical Report Summary Date: February 2026 Page 6-7 Figure 6-4: Cross-Section Showing Apensu Deeps Zones Note: Figure prepared by Newmont, 2025. Ahafo Complex Ghana Technical Report Summary Date: February 2026 Page 6-8 6.4.1.3 Structure Six structural components were identified, from oldest to youngest: • A zone of plastic deformation in the footwall mixed mylonite zones, graphitic and meta- volcano–sedimentary units; • Three hanging wall splays off the Kenyasi Thrust, S1, S2 and S3, which form zones of mylonite that display brittle reactivation; • A splay fault in the footwall that is interpreted as a plastically-deformed, locally anastomosing shear zone and is marked with graphite; • A cataclasite unit that is formed by brittle deformation and re-activation of the rigid granitoid forms finely-crushed rock with local tectonic breccias. The Apensu Deeps zones are hosted and aligned with the Kenyasi Fault and secondary splays and typically have moderate to steep dip towards the southeast. High-grade mineralization plunges vary from sub-vertical (Apensu South) to moderate southwesterly (Apensu Main and lower areas of Apensu North) and shallow southwesterly (upper areas of Apensu North). Shear zone fabrics and fault geometries were inherited from early compressional deformation and include a strong cataclastic deformation of the hanging wall granitoids interpreted to be analogous to a crush breccia. Mineralized hanging wall splay faults are evident in the Apensu Main pit, and are well documented in drill core from Apensu Deeps. The intersection of these faults with the Kenyasi thrust appears to exert a primary control on the higher-grade ore-shoots as shown in Figure 6-5. The block model grades are used to highlight the structural controls and orientation of the higher-grade mineralization in Figure 6-5, with red representing grades >4 g/t Au. 6.4.1.4 Alteration Four types of silica–albite alteration were recognized and assigned logging codes, from least to most altered: • Code SA0: characterized by unaltered rock with greenschist minerals including chlorite, calcite, and rare pyrite but no evidence of hydrothermal alteration; Primary textures are observed; • Code SA1: slightly bleached due to the alteration of some chlorite to paler micas; contains ankerite and rare siderite plus calcite veinlets and patches of pyrite (<1%) and rare thin milky quartz veins (1–3 cm width) with occasional associated visible gold; • Code SA2: grayish to yellowish massive silica and sericite patches that are 1–10 cm in width and are controlled by small brittle shears or mylonitic zones; A minimum of 50% of the rock volume is altered; • Code SA3: pervasively silicified rock with strong sericite, rare iron carbonate veinlets, local albite as disseminated crystals, and the complete destruction of chlorite.


Ahafo Complex Ghana Technical Report Summary Date: February 2026 Page 6-9 • Alteration intensity is well correlated with mineralization, with more intensely altered rock being better mineralized. Figure 6-5: Drill Section, Apensu Main and Apensu Deeps Note: Figure prepared by Newmont, 2025. SA2 = alteration code, see Chapter 6.4.1.4. 6.4.1.5 Mineralization Mineralization is characterized by an association of silica–albite–carbonate–white mica–pyrite alteration, quartz veining, and brittle chlorite-filled fractures. Better gold mineralization is developed in quartz–calcite veins associated with pyrite grains that can vary from fine disseminations to 1.5 mm in size. Gold occurs as single grains 1–20 µm in diameter but also commonly occurs in clusters of grains from 5–10 µm. There does not appear to be an association of gold with either arsenopyrite or rutile, and the gold is generally silver-poor, with <5 ppm Ag. Ahafo Complex Ghana Technical Report Summary Date: February 2026 Page 6-10 Visible gold occurs in the veined cataclasite. Locally, 0.2–2.0 cm wide quartz veins can return assays with more than 32 g/t Au from coarse gold. In the oxide zone, gold is associated with coarse goethite pseudomorphs after euhedral pyrite. Gold grains in the oxidized zone range from 5–10 µm. Manganese oxides are also observed in oxide mineralization. The general geology of the Apensu area was shown in Figure 6-1. A cross-section through the Apensu deposit was provided in Figure 6-5. 6.4.2 Awonsu 6.4.2.1 Deposit Dimensions The Awonsu deposit has horizontal dimensions of approximately 4,100 x 150 m, and has been drill tested to 600 m vertical depth. It has been mined by open pit methods. The mineralization remains open at depth and towards the north along strike. 6.4.2.2 Lithologies The Awonsu deposit, a Kenyasi-type deposit, developed on the sheared contact between mafic volcanic rocks, metasedimentary rocks, and Dixcove granites. It is a continuation of the Amoma deposit, with the two mineralized zones separated by a zone of lower-grade, sub-economic mineralization. Footwall to the mineralization is a mixture of mafic volcanic and pelitic to turbiditic sedimentary units. The hanging wall is composed of granodiorite. Mixed mylonitic and cataclasite units and dilatant breccias, developed during plastic and ductile deformation occur in the sheared contact between the footwall and hanging wall. Awonsu mineralization was typically more disseminated than that at Apensu. The shear zone varied in true width from 5–100 m, with gold mineralization >0.5 g/t Au ranging from 5–150 m in width. Higher gold grades (>1.5 g/t Au) were hosted in, or immediately adjacent to, strongly-altered cataclasite, forming zones from 5–60 m in width. Grades >5 g/t Au were rare, but high-grade zones could be as much as 30 m wide. Gold grades of 0.5–1.5 g/t Au were more commonly developed in the fractured, moderately-altered hanging wall granodiorite. Lower-grade material typically formed a halo of 2–50 m in thickness. Locally, particularly on the northern side of the deposit, higher-grade areas within the hanging wall alteration zone occurred in discontinuous mylonite zones, and in fine stringer quartz veins. A narrower low-grade halo, ranging in width from 5–30 m, occurred in the footwall. As with Apensu, higher-grade shoots were associated with a southward plunge. Typically, the shoots averaged about 2–5 g/t Au versus >5 g/t Au in Apensu. Ahafo Complex Ghana Technical Report Summary Date: February 2026 Page 6-11 6.4.2.3 Structure Five structural domains were logged. The oldest is the Kenyasi Thrust Fault. Two hanging wall duplex splays off the thrust, Kenyasi Splay 1 Fault and Kenyasi Splay 2 Fault are characterized by locally anastomosing zones of mylonite in granodiorite. The Kenyasi Footwall Splay Fault is distinguished as a plastically deformed, locally anastomosing shear zone marked by graphite. The youngest structure is the cataclasite unit, which may be a later brittle sinistral re-activation of the Kenyasi Thrust Fault. 6.4.2.4 Alteration Alteration was similar to that described for the Apensu deposit but was typically less intense. Two additional codes were used at Awonsu, alteration codes 4 and 5, which differentiated areas of stockwork veining (Code 4) and milky sheeted veins (Code 5). 6.4.2.5 Mineralization Awonsu is the only deposit within the Ahafo Complex where multiple generations of cross-cutting milky to opaque quartz veinlets with open-space filling of minor pyrite and gold mineralization were observed. Distinct, sheeted, sub-parallel milky quartz veins, 0.1–2 cm in width, with minor pyrite and occasional coarse gold, cross-cut fresh to weakly-altered hanging wall granodiorite. The milky veins generally occurred in sets of 2–10 veinlets that were separated by 10 cm to 1 m. The general geology of the Awonsu area was shown in Figure 6-1. A cross-section through the deposit is provided as Figure 6-6. Ahafo Complex Ghana Technical Report Summary Date: February 2026 Page 6-12 Figure 6-6: Cross-Section, Awonsu Note: Figure prepared by Newmont, 2025. SA2 = alteration code, see Chapter 6.4.1.4. 6.4.3 Subika Mineralization at Subika is both near-surface and extends at depth. Near-surface material was exploited in the Subika open pit. 6.4.3.1 Deposit Dimensions The portion of the Subika deposit that was exploited in the open pit had horizontal dimensions of approximately 2.2 km x 400 m. The portion of the deposit currently being exploited from underground is the continuity of mineralization below the open pit. This portion of the deposit has horizontal dimensions of approximately 3.7 km x 400 m, and is tested to about 1,600 m in vertical depth. Subika mineralization remains open at depth and along strike to the north and south.


Ahafo Complex Ghana Technical Report Summary Date: February 2026 Page 6-13 6.4.3.2 Lithologies The Subika deposit, to date the only example of Subika-style mineralization, developed in the hanging wall of the Kenyasi Thrust Fault but lies on a separate and parallel fault zone to the thrust fault complex that hosts the Kenyasi-style deposits. Four granitoid subset lithologies are recognized: diorite, gabbro, microdiorite, and diorite–gabbro mixed. Aplite and pegmatite dikes cross-cut the granitoid material. 6.4.3.3 Structure Four structural zones are defined: • The Victor Fault, on the southern end of the Subika deposit, is a major shear zone, 2–6 m wide, striking N60ºE, and dipping approximately 20–30º to the southeast. It locally anastomoses into three branches (Victor, Victor A, and Victor Lower Faults). It is cross-cut by dilatant breccias and brittle shears throughout, and displaces the Subika mineralization by as much as 40 m in an apparent left-lateral sense; • The Kaalbas Fault lies just oblique to the overlying Victor fault, with a slightly more easterly trend and shallower dip; • The Hatch Zone appears to be an anastomosing, almost east–west-trending structure, with two to three individual planes, each with 1 m to 3 m thickness developed within an overall 6– 25 m wide structural zone. Mineralization appears to be displaced by about 50 m in the zone; • The Deep One shear is apparently confined to the northern end of the deposit. Better grades of gold mineralization occur in dilatant zones such as the “Magic Fracture Zone” (MFZ), ranging in width from 1–60 m. Hanging wall lower-grade mineralization tends to extend only about 30 m from the dilatant zones. Higher grade shoots within the dilatant zones plunge south at 20º to 70º. The high-grade zones appear to be controlled by dilatant left jogs in the MFZ created by offsets across the mylonite zones. 6.4.3.4 Alteration Alteration associated with the Subika deposit is chemically similar to that in the Kenyasi-style deposits, and is controlled by the 5–40 m wide MFZ, a continuous zone of quartz–albite–sericite– carbonate–pyrite alteration. The silica–albite alteration is classified as: • Distal, code SA1: characterized by chlorite–sericite–pyrite, and gold grades that can range from about 0.1–1 g/t Au; • Intermediate, code SA2: characterized by chlorite–sericite–pyrite–albite–iron carbonate– silica, and gold grades that can range from about 1–3 g/t Au; • Proximal, code SA3: characterized by silica–iron carbonate–albite–pyrite and abundant quartz–carbonate veining, and gold grades that are commonly >3 g/t Au. Ahafo Complex Ghana Technical Report Summary Date: February 2026 Page 6-14 6.4.3.5 Mineralization Mineralization is hosted in the MFZ, which typically contains >2–5 g/t Au over widths of 5–50 m. Quartz and carbonate veinlets are common with thickness between 1–50 mm. They form stockworks in some instances. Most of the veins are impregnated with pyrite, and in some cases display sparse visible gold at the contact with the host rock. The general geology of the Subika area was shown in Figure 6-1. A cross-section through the deposit is provided as Figure 6-7. Figure 6-7: Cross-Section, Subika Note: Figure prepared by Newmont, 2025. Pit outline shown is mined out. SA1 and SA2–3 are alteration codes, see Chapter 6.4.3.4. 6.4.4 Amoma The Amoma deposit is the furthest north of the Ahafo South deposits about 11 km northeast of the Apensu deposit and at the southern end of the Bosumkese Forest Reserve. Ahafo Complex Ghana Technical Report Summary Date: February 2026 Page 6-15 6.4.4.1 Deposit Dimensions The deposit has horizontal dimensions of 1,500 x 170 m, and has been tested to approximately 300 m vertical depth. Mineralization remains open at depth. 6.4.4.2 Lithologies The deposit occurs in a lithostratigraphic setting equivalent to that of Apensu and Awonsu. Footwall successions comprise strongly foliated, metamorphosed volcano-sedimentary rocks, whereas hanging-wall rocks consist of metamorphosed granodiorite. The granitoids have been overthrust onto the volcano-sedimentary units, producing a number of different plastically- deformed and mixed granitoid and volcano-sedimentary units, termed mixed mylonites. A notable difference is that no obvious mafic dikes were mapped either within the Kenyasi-Yamfo shear zone or in hanging-wall granodiorite. Overlying the deposit is a layer of duricrust, which can reach 8 m in thickness, comprising iron pisolites and transported alluvial cobbles. Saprolite is 20–50 m thick. 6.4.4.3 Structure Four structural events were identified. The earliest is the Kenyasi Thrust Fault. The Footwall Fault may be contemporaneous with, or part of, the Kenyasi Thrust Fault. It is a locally anastomosing ductile shear zone marked by graphite in the footwall of the Kenyasi Thrust Fault. Later hanging wall duplex splay faults, Splay 1 and Splay 2 Faults, are sub-parallel to the Kenyasi Thrust Fault. These splays are locally marked by anastomosing zones of mylonite and dilatant breccia. The latest event is the development of a cataclasite unit, which represents later brittle sinistral reactivation of the Kenyasi Thrust Fault. The local strike of the Kenyasi-Yamfo shear zone in the Amoma open pit deviates from its regional orientation (clockwise rotation; right-hand bend). The structure is strikes north at 42º and dips at 65º to the southwest at Amoma, whereas, more typically across the Ahafo region, the structure strikes at 40º, and dips to the southeast at 60º. 6.4.4.4 Alteration Alteration is characterized by silicification, zones of albitization, and as much as 5% fine to medium-grained pyrite. Proximal hydrothermal alteration assemblages are similar to those identified at Subika and Apensu and consist of silica–iron carbonate–pyrite–albite–sericite. Brittle deformation overprints the pervasive alteration and is characterized by cross-cutting chlorite. Ahafo Complex Ghana Technical Report Summary Date: February 2026 Page 6-16 6.4.4.5 Mineralization Gold mineralization at Amoma is hosted by fault breccias (crackle and mosaic breccias) quartz- carbonate stockwork veins and bleached wall rocks, and, to a lesser extent, proto-cataclasite after granodiorite. As an empirical rule, the stronger the brecciation, the higher the grade. The presence of thin 1–5 cm thick quartz–carbonate veins also appears to be a robust visual proxy to higher-grade mineralization. Mineralized zones that host gold grades >0.5 g/t Au range in width from 10–110 m. Higher-grade material (>1.5 g/t Au) is developed in the breccias and cataclasite unit, but lower-grade (0.5– 1.5 g/t Au) mineralization can occur as a 20–50 m wide halo in the hanging wall granitoids. A narrower, lower-grade halo also occurs in the footwall mixed mylonite units, ranging from 0–30 m in width. The general geology of the Amoma area was shown in Figure 6-1. A cross-section through the deposit is provided as Figure 6-8. Figure 6-8: Cross-Section, Amoma Note: Figure prepared by Newmont, 2025. SA2 is an alteration code, see Chapter 6.4.1.4.


Ahafo Complex Ghana Technical Report Summary Date: February 2026 Page 6-17 6.4.5 Yamfo South The Yamfo South deposit is located in Ahafo North, approximately 21 km to the southeast of Sunyani Township. It consists of three discrete sub-parallel zones, Yamfo South, Yamfo Southeast, and Line 10. 6.4.5.1 Deposit Dimensions The deposit extends for roughly 3.0 km along strike and about 700 m across strike. Drilling has confirmed mineralization to depths of approximately 200 m at Yamfo South and Yamfo Southeast, and 150 m at Line 10. Mineralization remains open at depth and along strike, particularly toward the southwest at the Yamfo Southeast zone. 6.4.5.2 Lithologies The Yamfo South deposit is hosted predominantly within a sequence of metavolcanic and metasedimentary rocks, intruded locally by granitoid bodies typical of the Ahafo corridor. The Yamfo South and Line 10 zones are developed within sheared and altered metavolcanic units. The Yamfo Southeast zone lies adjacent to a major sub-parallel shear zone marking the boundary with a large granitoid intrusive domain. The host rocks commonly display intense deformation, sericite alteration, and finely disseminated sulfides. 6.4.5.3 Structure The Yamfo South deposit exhibits characteristics of Kenyasi-style mineralization. The deposit is defined by three sub-parallel mineralized zones separated by cross-cutting faults that have displaced mineralization in a northwest–southeast direction. These cross-faults, together with localized shearing and folding, have played a key role in controlling mineralization continuity and geometry. The main shear zones provided the pathways for hydrothermal fluids responsible for gold deposition. 6.4.5.4 Alteration Alteration within the Yamfo South deposit is dominated by strong silicification and pervasive carbonate alteration, locally accompanied by sericite and minor chlorite development. Silicification is commonly concentrated along shear planes and within the more intensely deformed metavolcanic rocks. Carbonate alteration is widespread and closely associated with gold and pyrite mineralization. In the oxidized profile, pyrite is replaced by goethite, and limonitic zones are common near surface. Notably, quartz veining, typical of many shear zone-hosted gold systems in Ghana, is relatively scarce at Yamfo South, suggesting mineralization is more disseminated and alteration-hosted than vein-controlled. Ahafo Complex Ghana Technical Report Summary Date: February 2026 Page 6-18 6.4.5.5 Mineralization Gold mineralization at Yamfo South is closely associated with fine-grained disseminated pyrite, with oxidation producing secondary goethite. Gold occurs both as fine inclusions within carbonate and pyrite and as free grains or micro-veinlets (1–10 µm) within fractures in pyrite. The strong correlation between gold, carbonate, and pyrite suggests that mineralization is syn- to late-deformation and linked to carbonate-silica hydrothermal alteration events. The deposit style aligns with the broader Ahafo Trend mineralization model—structurally controlled, disseminated, and carbonate-altered systems forming within second-order shear zones adjacent to the main Kenyasi Thrust corridor. The general geology of the Yamfo South area was shown in Figure 6-1. A cross-section through the deposit is provided as Figure 6-9. Figure 6-9: Cross-Section, Yamfo South Note: Figure prepared by Newmont, 2025. Ahafo Complex Ghana Technical Report Summary Date: February 2026 Page 6-19 6.4.6 Yamfo Central The Yamfo Central deposit is located halfway between Yamfo South and Yamfo Northeast, about 3 km southwest of Yamfo Northeast. Yamfo Central represents one of the more laterally extensive mineralized systems within the Ahafo North corridor. 6.4.6.1 Deposit Dimensions The deposit extends along a strike length of approximately 6 km, with mineralized zones ranging from 5–30 m in thickness. Drilling has tested mineralization to vertical depths of about 120 m, and the deposit remains open at depth. 6.4.6.2 Lithologies The Yamfo Central deposit is hosted predominantly within a sequence of sheared mafic volcanic rocks interbedded with metasedimentary units along a corridor characterized by multiple, sub- parallel mineralized zones. These mineralized zones are aligned with the main Yamfo Central shear system and are separated locally by narrow, weakly mineralized or barren horizons. The host sequence forms part of the Kenyasi shear-related stratigraphy and is locally intruded by narrow granitic to granodiorite. The mafic and metasedimentary units display moderate to strong deformation fabrics, pervasive foliation, and localized recrystallization resulting from hydrothermal alteration and successive structural overprinting events. These deformation and alteration features collectively define the structural architecture that controls the distribution of gold mineralization within the parallel lodes at Yamfo Central. 6.4.6.3 Structure Yamfo Central is structurally characterized as a Kenyasi-style deposit, hosted within a major shear zone similar to those controlling mineralization elsewhere along the Ahafo trend. The mineralized zones are aligned parallel to foliation within the shear zone, with the intervening gneissic unit representing a late structural or intrusive feature that disrupted the mineralized continuity. The oblique orientation of this gneiss body suggests post-mineralization deformation. The overall geometry of the deposit and its strong structural control imply that mineralization is syn- to late-deformational, associated with compressional to transpressional shearing along second-order splays off the main Kenyasi Thrust system. 6.4.6.4 Alteration Alteration within the Yamfo Central deposit is dominated by chloritization of the host greywackes, accompanied by well-developed quartz–feldspar–carbonate–pyrite veinlets. These veinlets, typically up to one centimeter wide, occur parallel to foliation and may form irregular patches or more massive, continuous bands within the host rocks. This vein-style or “intrusive-like” alteration contrasts with the more pervasive, diffuse alteration styles observed in other deposits such as Teekyere West. Ahafo Complex Ghana Technical Report Summary Date: February 2026 Page 6-20 Carbonate and chlorite alteration halos are closely associated with gold-bearing zones, reflecting fluid–rock interaction during mineralization. 6.4.6.5 Mineralization Gold mineralization at Yamfo Central is intimately associated with fine, crystalline disseminations of pyrite within altered greywackes and within quartz–carbonate–pyrite veinlets. The spatial relationship between gold, carbonate alteration, and pyrite indicates a strong hydrothermal control. Gold is interpreted to occur both as microscopic inclusions within pyrite and as fine- grained free gold associated with carbonate and quartz vein material. The general geology of the Yamfo Central area was shown in Figure 6-1. A cross-section through the deposit is provided as Figure 6-10. Figure 6-10: Cross-Section Yamfo Central Note: Figure prepared by Newmont, 2025.


Ahafo Complex Ghana Technical Report Summary Date: February 2026 Page 6-21 6.4.7 Yamfo Northeast The Yamfo Northeast deposit is located along the northern extent of the Yamfo mineralized corridor within the Ahafo North district. It is approximately 700 m northwest of the Subenso South deposit. 6.4.7.1 Deposit Dimensions The deposit has an overall strike length of approximately 2.0 km and a variable width from 5– 30 m. Drilling has defined mineralization to vertical depths of about 170 m, with mineralization remaining open both down-dip and along strike. 6.4.7.2 Lithologies The Yamfo Northeast deposit is hosted within a sequence of sheared mafic volcanic and metasedimentary rocks that are also characteristic of the Yamfo South, Line 10, and Yamfo Central stratigraphy. The deposit is spatially associated with a granitoid intrusive domain that becomes increasingly voluminous with depth, likely acting as a structural and thermal focus for hydrothermal fluid flow and subsequent gold mineralization. The mafic and metasedimentary units exhibit strong foliation, pervasive shearing, and well- developed deformation fabrics related to the regional shear system controlling mineralization. Occasional occurrences of granitoid fragments and narrow intrusive dikes interleaved within the mineralized zones suggest late-stage intrusive activity and continued tectono-magmatic interaction during the mineralizing event. Granitoid intrusions become more prominent with depth, and drilling to date indicates that gold grades tend to improve within these deeper zones. 6.4.7.3 Structure The host structure at Yamfo Northeast represents a classic Kenyasi-style mineralization setting, characterized by an east-dipping shear zone that served as a conduit for hydrothermal fluids. The mineralized zones are closely aligned with foliation and are structurally continuous along strike, with minor cross-faulting and shearing controlling local variations in grade and thickness. The 45º eastward dip of the structure and mineralization and the observed increase in granitoid material at depth are consistent with structural thickening and fluid channeling along the lower portions of the shear zone. The geometry and fabric of the deposit suggest syn- to late- deformational gold emplacement during transpressional shearing along the Ahafo trend. 6.4.7.4 Alteration Alteration within the Yamfo Northeast deposit is defined by a chlorite–graphite–quartz assemblage within the main shear zones, overprinted by strong silicification and discrete carbonate–albitization–chlorite alteration halos. Ahafo Complex Ghana Technical Report Summary Date: February 2026 Page 6-22 Quartz, carbonate, and feldspar minerals are commonly intergrown, forming foliation-parallel veinlets as well as irregular replacement zones. Secondary chlorite occurs as fine stringers parallel to foliation, and sericite appears as disseminated flecks throughout the altered host rock. In the oxide zone, the alteration mineralogy is largely obscured: carbonate minerals are leached, feldspar is weathered to kaolin, and pyrite has been replaced by limonite and goethite. The resultant oxide mineral assemblage consists predominantly of quartz, kaolin, and limonite. 6.4.7.5 Mineralization Gold mineralization at Yamfo Northeast is closely associated with disseminated and clustered pyrite within the sheared metasediments. In primary mineralization, gold occurs mainly as fine inclusions (3–20 µm) within or along the margins of pyrite grains, which vary in size from <50 µm to 1 mm and often form grid-like networks or aggregates. Minor marcasite and rare chalcopyrite veinlets occur within or adjacent to pyrite, indicating a reduced, sulfide-dominant hydrothermal system. In oxidized zones, gold occurs primarily with goethite as fine grains (1–15 µm) following the weathering of sulfides. The strong spatial association of gold with pyrite, carbonate, and silica alteration indicates that mineralization is hydrothermal and structurally controlled, consistent with other Kenyasi-style deposits along the Ahafo North mineralized corridor. The general geology of the Yamfo Northeast area was shown in Figure 6-1. A cross-section through the deposit is provided as Figure 6-11. Ahafo Complex Ghana Technical Report Summary Date: February 2026 Page 6-23 Figure 6-11: Cross-Section, Yamfo Northeast Note: Figure prepared by Newmont, 2025. 6.4.8 Susuan The Susuan deposit is situated 12 km east of the township of Sunyani. 6.4.8.1 Deposit Dimensions The Susuan deposit extends approximately 1.2 km along strike and is about 300 m wide. Mineralization has been defined to a vertical depth of around 250 m. Ahafo Complex Ghana Technical Report Summary Date: February 2026 Page 6-24 6.4.8.2 Lithologies It is a typical of a Subenso-style deposit, and has strongly developed tectonic and dilatant breccias. The deposit is situated along a contact between metamorphosed footwall pelitic sedimentary rocks, mafic volcanic rocks and hanging wall granodiorite. The contact has been extensively mylonitized, producing plastically-deformed, mixed granitoid and volcano–sedimentary units. Tectonic and dilatant breccias formed from these pre-existing units during latter brittle faulting along multiple northeast-striking, 60º southeast-dipping structural zones. Dikes, including porphyry dikes, cross-cut lithologies in the barren hanging wall of the deposit. Overlying the deposit is a 0–5 m layer of duricrust. Weathering is intense to a depth of 40 m, and saprolite development can range from 20–50 m in thickness. 6.4.8.3 Structure The structural framework of the deposit is dominated by multiple northeast-trending, southeast- dipping (approximately 60°) fault zones. These structures host mylonitic and brecciated rocks produced through several deformation phases. Three main structural events have been recognized: • Early ductile deformation, generating pervasive foliation in both metavolcanic and metasedimentary units; • Subsequent folding and foliation development, accompanied by mylonitization of granitoid and mixed lithologies, producing phyllonitic and metavolcanic fabrics; • Late brittle deformation, which resulted in tectonic and dilatant breccia zones that acted as primary conduits for mineralizing fluids. 6.4.8.4 Alteration Hydrothermal alteration is closely associated with gold mineralization and varies systematically in intensity. This alteration intensity serves as a reliable indicator of gold grade distribution. Strong alteration is localized within and adjacent to the tectonic breccia zones, typically forming 1–10 m wide zones of intense sericite, silica, and carbonate replacement. Moderate alteration halos, 2–30 m wide, envelop the core zones and consist of pervasive bleaching, chloritization, and carbonate veining. Weak alteration is characterized by diffuse bleaching and minor calcite veining extending further into the host rocks. 6.4.8.5 Mineralization Gold mineralization at Susuan occurs predominantly within tectonic and dilatant breccia zones, similar to that seen at Subenso South and Teekyere West. Mineralized zones range from 1–40 m in width, with narrow, lower-grade halos (0.5–3.5 g/t Au) extending into the hanging wall and footwall granitoids where fracturing permits fluid infiltration. Higher-grade shoots are commonly associated with intersections of breccia zones, jogs, and bends in the fault system.


Ahafo Complex Ghana Technical Report Summary Date: February 2026 Page 6-25 Gold is hosted within pyrite in unoxidized zones and occurs as free gold grains and clusters, typically sub-micrometer to a few micrometers in diameter. Oxide zones contain gold associated with goethite, reflecting secondary alteration. Minor sulfide minerals, including chalcopyrite, sphalerite, pyrrhotite, glaucodot [(Co, Fe)AsS], and ullmannite [SbNiS], occur locally as inclusions within pyrite or ankerite. The dominant gangue mineral assemblage includes plagioclase, quartz, muscovite, and chlorite, with locally present amphibole and elevated titanium values. Silicification and carbonatization are strongly developed, while well-developed quartz vein structures are sparse, indicating a deformation-dominated, ductile-brittle emplacement environment. The general geology of the Susuan area was shown in Figure 6-1. A cross-section through the deposit is provided as Figure 6-12. Figure 6-12: Cross-Section, Susuan Note: Figure prepared by Newmont, 2025. Ahafo Complex Ghana Technical Report Summary Date: February 2026 Page 6-26 6.4.9 Subenso South The Subenso South deposit is about 12 km east–northeast of Sunyani. The main Kumasi– Sunyani Highway traverses the southwestern portion of the deposit area. 6.4.9.1 Deposit Dimensions The Subenso South deposit extends for approximately 3.0 km along strike and 350 m across strike, with drilling defining mineralization to nearly 420 m vertical depth. Mineralization remains open at depth. 6.4.9.2 Lithologies It is classified as a Subenso-style deposit. The deposit is hosted along the contact between moderately to strongly foliated metapelites and metavolcanic rocks of the Birimian succession in the footwall and granodioritic to dioritic rocks of the Dixcove suite in the hanging wall. The granitoid–volcano-sedimentary contact has been extensively mylonitized, generating plastically deformed mixed rock types from both lithologies. Late-stage brittle faulting produced tectonic and dilatant breccias from these pre-existing units. Porphyry dikes cross-cut all lithologies and intrude the breccia zones, representing the youngest lithological phase within the deposit. Near-surface regolith development includes duricrust up to 8 m thick and a saprolite zone ranging from 20–50 m in thickness overlying the primary bedrock. 6.4.9.3 Structure In the southern portion of Subenso South, mineralization occurs within a series of parallel shear zones. In the central portion of Subenso South, mineralization is confined to a hanging wall and a parallel, stronger, footwall zone, both of which are constrained by footwall and hanging wall shears. The dominant footwall zone broadens at depth and thins towards surface where the geochemical expression is generally subdued. The shear zone steepens to the north; this is attributed to over-steepening caused by an inferred parallel thrust fault structure to the west. The structure also broadens at depth at the northern end of the deposit where it comprises the largest mineralized pod in the Subenso Main deposit. Small-scale duplex structures with a sense of vergence that is east over west are observed in drill core. The duplexes may mirror larger duplex structures, which are considered to be the cause of the apparent lenticular shape of the mineralized pods at depth. Ductile tight to isoclinal folding is also present, adjacent to both the footwall and hanging wall shear zones in this area. Ahafo Complex Ghana Technical Report Summary Date: February 2026 Page 6-27 6.4.9.4 Alteration A high-grade core of mineralization is present in Subenso South, constrained to hydrothermally altered rocks showing brittle/ductile deformation with later quartz veining. Strong alteration is focused in, and directly adjacent to, the tectonic breccias in one or more multiple zones from 1 m to 45 m wide. Moderate alteration forms a halo around the strongly altered zone between 2 m and 40 m wide. Weak alteration is formed as a broad halo around the other alteration zones, displaying weak bleaching and minor calcite veining. Alteration intensity can be a reasonable predictor of gold grades, with the more intense alteration associated with elevated grades. 6.4.9.5 Mineralization Gold mineralization is hosted in the breccia units. Elevated gold grades can form zones of one to 40 m width that assay over 5 g/t Au. Lower-grade (0.5 g/t Au to 1.5 g/t Au) halo-type mineralization as wide as 10 m in the hanging wall granitoids is not well developed. Mineralization appears to be controlled by the intersection of the tectonic breccia zones with cross-cutting north– south-trending structures. Other zones are clearly related to sharp changes in dip or strike associated with structures deflecting around granitoid bodies. Still others appear to be controlled by small left jogs in the brittle fault zones or by combinations of all factors. Subenso South has free gold associated with pyrite as single grains and clusters of grains and the gold particles have an average diameter of 2.3 µm. Scanning electron microscopy noted sparse, very fine-grained chalcopyrite occurring as inclusions in pyrite, and identified ullmanite [SbNiS], locked with the pyrite. Other sulfide phases noted from the microscopy as locked either with pyrite or ankerite, were sphalerite, pyrrhotite, and glaucodot [(Co, Fe) AsS]. The general geology of the Subenso South area was shown in Figure 6-1. A cross-section through the deposit is provided as Figure 6-13. Ahafo Complex Ghana Technical Report Summary Date: February 2026 Page 6-28 Figure 6-13: Cross-Section, Subenso South Note: Figure prepared by Newmont, 2025. 6.4.10 Subenso North Subenso North is interpreted as the northern extension of the Subenso South deposit, separated by a zone of lower-grade, sub-economic mineralization. 6.4.10.1 Deposit Dimensions The deposit extends approximately 1.7 km along strike with a width ranging from 3–25 m. Drilling has defined mineralization to vertical depths of about 200 m, and the deposit remains open at depth.


Ahafo Complex Ghana Technical Report Summary Date: February 2026 Page 6-29 6.4.10.2 Lithologies It is classified as a Subenso-style deposit. The deposit has very similar characteristics to Subenso South; however mineralized zones in Subenso North are generally more tightly constrained than in Subenso South, resulting in slightly higher gold grades. Porphyry dikes and sills are present in both Subenso North and Subenso South, where they respectively crosscut and parallel the S2 orientation. An additional intrusive has been intersected immediately adjacent to the footwall shear in the northeast. Limited gold remobilization and enrichment appears to have occurred on the margins of these intrusive rocks, but the contacts are generally sharp with occasional evidence of shear fabric and they are interpreted to be late- stage events and to post-date mineralization. 6.4.10.3 Structure Structural controls to the mineralization at Subenso North are essentially the same as at Subenso South. The footwall and hanging wall shears are, however, better defined, the mineralization more tightly constrained, and the resulting grades slightly higher. This is thought to be in part due to the higher metamorphic grade of the host rocks in the north, which approach amphibolite facies, and in part due to their competency. Aeromagnetic data suggests that, to the north, the shear zone changes strike towards the northeast, and that it is also offset to the east, most likely by transfer faults. The drilling density is, however, low in this area. 6.4.10.4 Alteration Hydrothermal alteration is closely associated with gold mineralization and includes secondary chlorite, graphite, and quartz development near mineralized zones. Strong alteration is concentrated within and immediately adjacent to the breccias and shears, forming 1–40 m wide zones. Moderate halos extend 2–40 m around the strongly altered zones, and weak alteration forms broad halos exhibiting minor bleaching and calcite veining. Alteration intensity is a reliable indicator of gold distribution, with stronger alteration correlating with higher-grade cores. 6.4.10.5 Mineralization A mineralogical examination of metallurgical samples from Subenso North confirmed that about 90% of gold in the primary material is associated with pyrite, generally as inclusions in coarse (>0.5 mm) grains, and ranges in diameter from 2–20 µm. Additional gold is associated with albite or carbonate and ranges in size from 5–15 µm. In oxidized material, gold is associated with goethite and occurs as fine disseminations ranging from 5–15 µm. Pyrite is the dominant sulfide phase with a range of sizes from sub-50 µm disseminations to single cubes as large as 2 mm and occurs as networks intergrown with silicate–carbonate and as minor Ahafo Complex Ghana Technical Report Summary Date: February 2026 Page 6-30 banding. Fractured pyrite is rare. Other sulfide phases present include marcasite, pyrrhotite, and chalcopyrite. Traces of sphalerite, galena, and arsenopyrite also occur. Weathered samples contain ilmenite and associated alteration products including leucoxene and rutile. Goethite and magnetite are common and may display some alteration to hematite. Secondary chlorite, graphite, and quartz are commonly developed in the immediate vicinity of the gold mineralization. The general geology of the Subenso North area was shown in Figure 6-1. A cross-section through the deposit is provided as Figure 6-14. Figure 6-14: Cross-Section, Subenso North Note: Figure prepared by Newmont, 2025. Ahafo Complex Ghana Technical Report Summary Date: February 2026 Page 6-31 6.4.11 Teekyere West The Teekyere West deposit is approximately 26 km to the southeast of Sunyani Township. 6.4.11.1 Deposit Dimensions Mineralization extends along strike for approximately 2.7 km, with drilling confirming continuity to a lateral depth of around 300 m. Mineralized zones vary in width from 1–40 m, with higher-grade intervals averaging roughly 5 m. The deposit remains open both along strike and at depth, although its overall horizontal extent is smaller than that of the larger Kenyasi-style deposits within the Ahafo North district. 6.4.11.2 Lithologies Teekyere West is a relatively narrow, structurally controlled gold deposit that is considered to be a Subenso-style system. It is hosted entirely within strongly sheared and folded sedimentary rocks of the Birimian succession. The rocks are competent and relatively impermeable, favoring ductile deformation over brittle fracturing and limiting the development of open fractures. The deposit displays many characteristics similar to Subenso South. Porphyry dikes and sills intrude the sequence, both cross-cutting and locally paralleling the S2 foliation. An additional intrusive has been intersected immediately adjacent to the footwall shear in the northeast. These intrusions are interpreted as late-stage, post-mineralization events, with generally sharp contacts and only limited evidence of shear fabric or local gold remobilization along their margins. 6.4.11.3 Structure Mineralization occurs within southeast-dipping duplex structures developed along the Teekyere– Subenso Shear. The deposit has a sharp footwall contact and a more diffuse hanging wall contact, with minor mineralization extending into the hanging wall. Higher-grade shoots are structurally localized: the two southern occurrences align with gentle right jogs in the main shear, while the northernmost, largest shoot correlates with a near north–south-striking cross fault, locally referred to as the Revelation fault. Ductile deformation is the most common structural style, with stress accommodated primarily along foliation planes rather than through brittle fracturing. 6.4.11.4 Alteration Hydrothermal alteration is strong and pervasive, often obliterating the primary rock fabric. Silicification and carbonatization are particularly well-developed, while quartz veining is minimal, reflecting the relatively deep emplacement level of mineralization. Alteration intensity is a strong indicator of gold concentration, with the most intensely altered zones coinciding with the tectonic and dilatant breccias that host higher-grade gold values. Ahafo Complex Ghana Technical Report Summary Date: February 2026 Page 6-32 6.4.11.5 Mineralization The Teekyere West mineralized zone is very narrow. Higher grade (>2 g/t Au) gold mineralization is limited to the tectonic breccia and dilatant breccia zones, occurring as zones from 1–40 m wide, averaging 5 m wide. Focused mineralization at Teekyere West is generally higher grade than that observed in the Kenyasi-style systems, averaging >5 g/t Au. Lower grade (0.5 g/t to 2 g/t Au) halos at Teekyere West are limited due the extreme impermeability of the host rock and resistance to fracturing (stress is accommodated by movement on the foliation planes versus brittle fractures). At least three higher-grade (>4 g/t Au) mineralized shoots occur at Teekyere West. The two southern occurrences appear to be gentle right jogs in the Teekyere fault system, whereas the northernmost, largest zone appears to be related to an almost north–south-striking cross fault locally termed the Revelation Fault. Gold is associated with pyrite in unoxidized, primary mineralization, and goethite in the oxide zone. Silicification and carbonatization are strongly developed, and, as with Yamfo South, there is little evidence of well-developed quartz vein structures. The lack of open fracture quartz veining and the dominance of ductile deformation over brittle fracture may indicate that the mineralization is representative of a relatively deep level of emplacement. Typical gangue minerals are plagioclase, quartz, muscovite, and chlorite. Amphibole is present, as are high titanium values. Arsenic values are as high as 347 ppm and As may be present as trace arsenopyrite. The general geology of the Teekyere West area was shown in Figure 6-1. A cross-section through the deposit is provided as Figure 6-15.


Ahafo Complex Ghana Technical Report Summary Date: February 2026 Page 6-33 Figure 6-15: Cross-Section, Teekyere West Note: Figure prepared by Newmont, 2025. Ahafo Complex Ghana Technical Report Summary Date: February 2026 Page 7-1 7.0 EXPLORATION 7.1 Exploration 7.1.1 Grids and Surveys In 2006, Newmont implemented the Ahafo Unified Ghana National Grid, a coordinate reference system developed through Rigid Survey control networks and GPS static observations to establish a unified framework across all various projects within Ahafo. A 1,000 m vertical adjustment was applied to standardize and eliminate negative values in mining elevation values, particularly underground. All of the geospatial datasets use this grid. The digital terrain model and topographic surface used for estimation is based on a 2017 LiDAR survey. 7.1.2 Geological Mapping Regional mapping was conducted at 1:50,000 scale to delineate areas of outcrop, alteration, faulting, and silicification that could act as additional vectors to mineralization and to support drill targeting. All open pit and underground exposures are mapped as they become available, with emphasis on lithology, structural relationships, and alteration, to help support folio development and understanding of key mineralization controls. These data are further applied to resource model development as well as exploration targeting. Open pit mapping is performed at a scale of 1:3,000. Underground mapping is completed using either high-resolution overlapping photographs of development walls and faces (taken with reference to the drive dimensions), or using ScanInverse software from Hivemap for underground development walls, backs, and headings to generate 3D images. 7.1.3 Geochemistry Stream sediment sampling was used during the 1990s to vector into mineralized areas. There are no data on the numbers of samples taken, and many of these samples were taken outside the Ahafo Complex mineral tenure area. Sample locations that are known are shown in Figure 7-1. Soil sampling was primarily conducted in the 1990s and early 2000s. Over 50,000 samples were collected. Many of these samples were taken outside the current Ahafo Complex tenure area. Sample locations that are known are shown in Figure 7-2. Since 2017, deep-sensing geochemical samples have been collected (Figure 7-3). This is a proprietary Newmont technology that is applied in areas where there is no outcrop exposure due to extensive cover. Following the surveys, a “score” is applied to the area investigated, based on geological aspects of interest (e.g., lithology, alteration, mineralization). Collected data were processed to generate products for data integration and targeting. Ahafo Complex Ghana Technical Report Summary Date: February 2026 Page 7-2 Figure 7-1: Stream Sediment Sample Location Map Note: Figure prepared by Newmont, 2025. Ahafo Complex Ghana Technical Report Summary Date: February 2026 Page 7-3 Figure 7-2: Soil Sample Location Map Note: Figure prepared by Newmont, 2025.


Ahafo Complex Ghana Technical Report Summary Date: February 2026 Page 7-4 Figure 7-3: Deep-Sensing Geochemical Sample Location Plan Note: Figure prepared by Newmont, 2025. Ahafo Complex Ghana Technical Report Summary Date: February 2026 Page 7-5 Pits and trenches are excavated in areas highlighted as having anomalous assay results from soil sampling. The intent when pitting is to make contact with bedrock, or at least saprolite, for sampling and logging purposes. The initial cut is often to chest height for safety reasons. If additional depth is needed, then a safety layback is cut on at least one side of the trench. Samples are normally taken from the side or bottom of the trench on spacings of every 2 m or less as designated by the supervising geologist. A geological map of lithology, veins, structures, and alteration is made for each excavation before the excavation is backfilled. 7.1.4 Geophysics 7.1.4.1 Airborne Geophysics Airborne geophysical surveys were conducted in 1994, 2005, 2007, 2016 and 2020 (Table 7-1; Figure 7-4). The surveys extend across the Ahafo district, and include areas outside of the Ahafo Complex operations area. Table 7-1: Geophysical Surveys Survey Type Date Operator Note Airborne 2004 Gencor Focused on western contact of the Sefwi belt with the Sunyani basin, where the contact fell within the Project area. 200 m line spacing; total area of about 1,450 km2. 2005 Fugro Airborne Surveys 100 m line spacing, for 1,124 line-km; covered 96.9 km2 of Ahafo central. 2007 Fugro Airborne Surveys Airborne magnetic survey (Midas). Altitude of 40 m at 100 m line separations. Total 3,940 line-km; survey area covered 349.6 km2. 2016 GeoTech Surveys Airborne magnetic survey. 56 m altitude at 100 m line separations. Total 4,182 line-km; survey area covered 380 km2. 2020 Bell Geospace Airborne gravity gradiometry survey, 60 m altitude at 200 m line separations. Airborne magnetics survey, 60 m altitude at 100 m line spacing. Total 7,806 line-km; survey area covered 466 km2. Ground 1999 SJ Geophysics Induced polarization (IP)/resistivity surveys on the Ntotroso License. Dipole-dipole spacings were 50 m, and the very low frequency (VLF) survey was at 25 m spacings. The company also completed a ground magnetics survey (10 m spacings) over the Subika and Area F prospects. 2003 Newmont IP/resistivity (gradient array on 25 x 50 m stations; pole-dipole and dipole- dipole on 50 m centers), total domain electromagnetics (TDEM), ground magnetics (5 x 50 m stations), and ground gravity (50 x 50 m stations) on the Yamfo South and Subenso deposits in Ahafo North. 2004– 2008 Ahafo North and Ahafo South. Typically pole–dipole IP data were collected on 50 m centers, whereas the gravity array was on 25 x 50 m spacings. Ground magnetics data (5 x 50 m stations) also routinely collected 2006 Orientation gravity survey Ahafo Complex Ghana Technical Report Summary Date: February 2026 Page 7-6 2006– 2008 Semi-regional ground gravity survey trialed at Ahafo IP/resistivity (gradient array on 25 x 50 m stations; pole-dipole 50 m separation) conducted on Nanapof, Amoma, Awonsu, Apensu, Subika and Mampehia 2009– 2014 Offset pole–dipole IP survey data were collected at Subika. Two lines of transient electromagnetic (TEM) data completed at Amoma. Ground magnetic surveys conducted at Mampehia prospect 2016– 2025 IP/resistivity (gradient array on 25 x 50 m stations; pole-dipole 50 m separation) conducted at Subika, Subika-East, Nanapof, Mampehia, Mehame, Bisi, Rubiso Tanoso, and Mankraho The high-resolution airborne surveys were useful in mapping the structures controlling mineralization in the Ahafo district on a detailed and refined scale. The data were used to enhance the existing geological interpretations over the area. Magnetic inversions performed using the datasets were useful in the generation of quality targets within the Ahafo district. 7.1.4.2 Ground Geophysics Ground geophysical surveys were conducted from 1999–2025 (Table 7-1; Figure 7-5). The surveys extend across the Ahafo district, and include areas outside of the current Ahafo Complex area that Newmont no longer holds under mineral tenure. Gradient array and pole–dipole IP/resistivity were identified as the most promising techniques. The resistivity data appeared to map silica alteration which tends to be closely associated with mineralization. Results of the semi-regional ground gravity survey indicate that the method may be a valid exploration tool for the Ahafo area. The main Ahafo deposits were located within gravity gradients. Ahafo Complex Ghana Technical Report Summary Date: February 2026 Page 7-7 Figure 7-4: Airborne Geophysical Survey Location Plan Note: Figure prepared by Newmont, 2021.


Ahafo Complex Ghana Technical Report Summary Date: February 2026 Page 7-8 Figure 7-5: Ground Geophysical Survey Location Plan Note: Figure prepared by Newmont, 2025. Ahafo Complex Ghana Technical Report Summary Date: February 2026 Page 7-9 7.1.5 Petrology, Mineralogy, and Research Studies A number of structural, petrology, mineralogy, lithogeochemical, and research studies have been completed in the Ahafo Complex area since 1991. An MSc. thesis was completed on the structural evolution of the Subika deposit in 2011 by Emmanuel Baah-Danso. A PhD thesis completed in 2017 by Helen MacFarlane on the Sefwi Belt included some information from Newmont’s Ahafo exploration databases. 7.1.6 Qualified Person’s Interpretation of the Exploration Information The Ahafo Complex operations are a mature site, and the initial exploration information collected using geochemical and geophysical methods is superseded by drill and mining data. The exploration information was used to successfully vector into areas of gold anomalism that were able to support mineral resource estimation and subsequent open pit and underground mining operations. 7.1.7 Exploration Potential Within the immediate mining area, exploration potential includes the following: • Subika: testing for extensions of the mineralization to the northeast, and down plunge of the currently-defined limits of the deposit; • Apensu: drill testing of the northern strike and plunge extensions to the Apensu North mineralized shoot and Gap area depth potential. • Subika–Apensu Link: potential mineralization along the deep linking structures between Subika Underground and Apensu Deeps; • Awonsu: potential mineralization extents below the existing pit; • Yamfo South: drill testing near-surface “wing-span” mineralization (mineralization along either side of a mineralized zone with defined pit areas, shear zone, or structural corridor) and extensions of high-grade plunges at Yamfo Southeast and Yamfo Line 10; • Gap drilling at Yamfo Northeast: drill testing the mineralization continuity between Yamfo South and Yamfo Central Gap and Yamfo Central and Yamfo Northeast; • Subenso South, Teekyere West and Susuan: potential high-grade mineralization at depth; • Gap between Subenso South and Subenso North: drill testing mineralization continuity between Subenso South and Subenso North. Near-mine exploration is planned to include: • Evaluating structurally-favorable zones and potential repetitions along and down-plunge of the Kenyasi Thrust between the Apensu South and Awonsu deposits; • Testing down plunge depth extensions to Subika; • Amoma: potential for mineralization extensions below the existing pit. • Drill testing of Subika structures and adjacent parallel fault trends defined by aeromagnetic, gradient array resistivity, 3D gravity models, geochemical datasets, and projections of the important, secondary, shallow-angle, low permeability faults which focus mineralization; Ahafo Complex Ghana Technical Report Summary Date: February 2026 Page 7-10 • Drill testing potential high-grade plunges at depth at Subenso North, Subenso South, Teekyere West and Susuan; • Evaluating jogs and flexure zones at Yamfo Southand Yamfo Central along structurally- favorable corridors characterized by coincident geophysical and geochemical anomalies; • Drill testing previously-identified geochemical and geophysical anomalies where these are potentially within trucking distance of the Ahafo process plant; • Drill testing mineralization along coincident geophysics (resistivity and chargeability) and soil anomalies at Bisi (refer to Figure 6-1). 7.2 Drilling 7.2.1 Overview 7.2.1.1 Drilling on Property A total of 20,479 drill holes (approximately 3,211 km) was completed within the Ahafo Operations area to 2025; including 8,748 core holes (approximately 2,339 km) and 6,810 RC holes drill holes (approximately 476 km). Drilling is summarized in Table 7-2. Drilling for areas that have current mineral resource estimates are summarized in Table 7-3 (Ahafo South) and Table 7-4 (Ahafo North). Table 7-2: Project Drill Summary Table Drill Type Ahafo South Ahafo North Ahafo Complex Number of Drill Holes Meters Number of Drill Holes Meters Number of Drill Holes Meters (m) Aircore 1,154 34,393 161 5,813 1,315 40,206 Core 6,456 1,951,525 2292 387,713 8,748 2,339,238 RC/Core tail 765 210,724 571 101,498 1,336 312,222 RAB 1,896 31,216 374 12,754 2,270 43,970 RC 3,724 244,704 3086 230,815 6,810 475,519 Total 13,995 2,472,563 6484 738,593 20,479 3,211,156 Note: Table excludes grade control drilling. Metreage has been rounded to the nearest meter; totals may not sum due to rounding. Ahafo Complex Ghana Technical Report Summary Date: February 2026 Page 7-11 Table 7-3: Drilling Supporting Mineral Resource Estimation, Ahafo South Project Deposit Drill Type Number Of Drill Holes Meters Drilled (m) Ahafo South Amoma Core 195 53,668 Core/RC 95 13,007 RC 230 15,073 Subtotal 520 81,748 Apensu Core 1,264 460,707 Core/RC 189 40,411 RC 429 22,058 Subtotal 1,882 523,175 Awonsu Core 594 132,398 Core/RC 210 38,731 RC 376 31,017 Subtotal 1,180 202,147 Subika RC 210 25,354 Subtotal 210 25,354 Subika underground Core 2,263 890,408 Core/RC 213 112,723 RC 37 5,902 Subtotal 2,513 1,009,033 Subika underground grade control Core 1,918 382,985 Subtotal 1,918 382,985 Note: Subika total includes grade control drill holes. Metreage has been rounded to the nearest meter; totals may not sum due to rounding. The table includes drill holes completed post resource estimation database closure.


Ahafo Complex Ghana Technical Report Summary Date: February 2026 Page 7-12 Table 7-4: Drilling Supporting Mineral Resource Estimation, Ahafo North Project Deposit Drill Type Number Of Drill Holes Meters Drilled (m) Ahafo North Subenso North Core 169 22,760 Core/RC 51 6,274 RC 91 4,627 Subtotal 311 33,662 Subenso South Core 623 14,0945 Core/RC 179 35,408 RC 196 16,274 Subtotal 998 192,627 Susuan Core 182 32,348 Core/RC 58 14,211 RC 86 11,567 Subtotal 326 58,125 Teekyere West Core 280 63,632 Core/RC 166 26,194 RC 373 21,520 Subtotal 819 111,345 Yamfo Central Core 212 22,772 Core/RC 69 9,661 RC 331 22,246 Subtotal 612 54,678 Yamfo NE Core 188 22,270 Core/RC 2 155 RC 290 1,8574 Subtotal 480 41,000 Yamfo South CORE 530 63,373 CORE/RC 17 4,999 RC 117 11,689 Subtotal 664 80,062 Note: Metreage has been rounded; totals may not sum due to rounding. The table includes drill holes completed post resource estimation database closure. A drill collar location plan for Ahafo South is provided in Figure 7-6 for the core, RC, and RAB drilling, and Figure 7-7 shows the aircore drilling completed at Ahafo South. Figure 7-8 shows the core, RC, and RAB drilling completed at Ahafo North. Aircore drilling at Ahafo North is provided in Figure 7-9. Ahafo Complex Ghana Technical Report Summary Date: February 2026 Page 7-13 Figure 7-6: Ahafo South Drill Collar Location Map (Core, RC, RAB) Note: Figure prepared by Newmont, 2025. Ahafo Complex Ghana Technical Report Summary Date: February 2026 Page 7-14 Figure 7-7: Ahafo South Drill Collar Location Plan (Aircore) Note: Figure prepared by Newmont, 2025. Ahafo Complex Ghana Technical Report Summary Date: February 2026 Page 7-15 Figure 7-8: Ahafo North Drill Collar Location Map (Core, RC, RAB) Note: Figure prepared by Newmont, 2025.


Ahafo Complex Ghana Technical Report Summary Date: February 2026 Page 7-16 Figure 7-9: Ahafo South Drill Collar Location Plan (Aircore) Note: Figure prepared by Newmont, 2025. Ahafo Complex Ghana Technical Report Summary Date: February 2026 Page 7-17 Between 1992 and 2002, drilling was completed primarily for early-stage, exploration-focused programs and for initial resource estimates. From 2002, drilling was used to support advanced- stage project evaluation, deposit, pit, and underground delineation. Drilling was also completed for geotechnical, hydrogeological evaluations, metallurgical and condemnation purposes. 7.2.1.2 Drilling Excluded For Estimation Purposes RAB and aircore drilling are not used to support estimation of either mineral resources or mineral reserves. In addition, drill holes with failed quality control checks for data such as down hole survey, collar, and assays are excluded from the final data extraction used for resource/reserve estimation. Only approved drill holes are used in estimation. 7.2.1.3 Drilling Since Database Close-out Date Since the database close-out at Ahafo South, an additional 126 diamond core drill holes totaling 64,610 m have been completed. Drilling comprised: • Surface: 57 holes for 33,502 m; • Underground: 69 holes for 31,108 m. The post–close-out drilling is expected to introduce localized grade variability within the resource model; however, it is not anticipated to have a material impact on the overall average grade. The additional data may support upgrades in resource confidence subject to final validation and modeling (Figure 7-10). For Ahafo North, since the respective database close-out dates for the Yamfo Central, Yamfo South, and STS deposits (Subenso South, Teekyere West, and Susuan), a total of 66 additional diamond core holes, comprising 19,469 m, were completed across Ahafo North. Drilling was distributed as follows: • Yamfo South: 27 holes for 5,822 m; • Yamfo Central: 16 holes for 2,491 m; • STS: 23 holes for 11,156 m. The post–close-out drilling is expected to result in localized grade variability within the resource model; however, it is not anticipated to materially impact the overall average grade. The additional data may support upgrades in resource confidence subject to final validation and modeling (Figure 7-11). Ahafo Complex Ghana Technical Report Summary Date: February 2026 Page 7-18 Figure 7-10: Ahafo South Drilling Since Database Close-out Date Note: Figure prepared by Newmont, 2025. Ahafo Complex Ghana Technical Report Summary Date: February 2026 Page 7-19 Figure 7-11: Ahafo North Drilling Since Database Close-out Date Note: Figure prepared by Newmont, 2025.


Ahafo Complex Ghana Technical Report Summary Date: February 2026 Page 7-20 7.2.2 Drill Methods Aircore drilling was primarily used as a first-pass evaluation tool of soil sample anomalies to bedrock. Drilling was completed by multiple contractors during Normandy’s tenure, all of which used aircore-only drill rigs. The primary drill contractor for the aircore programs completed by Newmont was African Mining Services (AMS), who used an ED100-type drill rig. RC drilling was used as a resource delineation tool from 1995–2012. Drill contractors included Boart Longyear (BLY), AMS, and Geodrill. The drilling firms used both dedicated RC and multipurpose-type drill rigs, including ED703, ED704, ED045, ED062, KL900, KL200, and LF4252 rig types. Between 2012–2025 BLY, AMS, African Underground Mining Services(AUMS),Underground Mining Alliance (UMA), Westfield Drilling, JODI Drilling and GTS Drilling were used. Underground operations primarily used Atlas Copco Diamec 262,LM90 and LM110 rigs, while surface drilling employed LF160, LF230, LF90, DE740, DE710, DRA800, MP1200, ED2000, DE840, KL1200. Core drilling is used to support resource estimates, and to infill in areas of predominantly RC drilling. Core drilling was completed in phases, from 1995 to the Report date. Drill holes classified as core-drilled include both RC pre-collared holes and those wholly drilled as core holes. 7.2.3 Logging Aircore drill hole logging included lithologies, alteration, oxidation states, and presence of aquifers. Geological logging of RC drill data included lithology, alteration state, oxidation, and presence of water. Logging used pre-set codes. Drill chips were logged at the drill site, and a chip tray record of each 1 m interval retained for reference. Detailed geological logging is carried out on all core holes, and focuses on descriptions and graphical logging of geological relationships, characteristics, and mineralization. Lithology, alteration, veining, sulfide content, oxidation type, and structural information are consistently captured digitally using a tablet personal computer via Visual Logger application and loaded to a global exploration database (GED) for storage. The Visual Logger application contains the standard geologic codes for the logging. The senior project geologist for a particular project performs a minimum of 20% quality checks on all geological logging and documents the findings. Historically, geotechnical logging of core was performed on selected drill holes from infill drilling programs to capture core recovery and rock quality designation (RQD). The selected interval for geotechnical logging was largely dependent on the observed geotechnical features. This practice was replaced by performing the geotechnical logging run by run or block to block for the entire length the hole and for all the drilled holes. Geologists log core recovery, RQD, joint condition rating, fracture frequency, and strength. Information captured using Visual Logger and loaded into the GED. More specialized geotechnical logging is done by geotechnical engineers for the holes drilled specifically for geotechnical purposes. 7.2.4 Recovery Recovery was not usually recorded for the aircore drill programs but is typically very high. Ahafo Complex Ghana Technical Report Summary Date: February 2026 Page 7-21 Except for the first few meters of individual RC holes, where recovery is typically in the 20–40% range, recovery is generally about 95–98%. Core recovery is normally 100%, except for very rare times when faults and/or graphitic shear zones are encountered. The mineralized zone, which is silicified and brecciated, is a solid rock and recovery is almost always 100% in mineralization. 7.2.5 Collar Surveys Aircore drill hole collars were located by the survey department and verified by geology personnel. Collars of drill holes completed prior to 2005 were surveyed by surveyors, using optical instruments and in the local mine grid coordinate system. In September 2006, Newmont transformed all the spatial data at the Ahafo Complex to a common and unified survey grid based on the projection of the Ghana National Grid. A vertical offset was added to elevations referenced to mean sea level to avoid negative values. The unified grid was called the Ahafo Unified Ghanaian National Grid. Collars of drill holes completed afterwards were surveyed by Newmont surveyors, using global positioning system (GPS) equipment and in the Ahafo Unified Ghanaian National Grid coordinate system. Data are electronically sent to the database manager. 7.2.6 Down Hole Surveys Aircore drill holes were not down-hole surveyed. A Welnav downhole survey camera was used for RC drill holes. Core hole downhole surveys were performed with a variety of instruments, including multi-shot Sperry-Sun, Welnav, Reflex EZ-Shot and Reflex Multishot tools. All surveys were performed by the drilling company, then checked and approved by geological staff. Magnetic declinations are adjusted for drift. The declination factor is subtracted from the magnetic reading provided by the drilling services contractor. Quality control is completed for 5% of the holes drilled at the Ahafo Complex. 7.2.7 Grade Control The open pit operations at Ahafo South use five active Drilltech D45 blast hole rigs, which drill 9.2 m vertical blast holes (i.e., 8 m bench plus 1.2 m sub-drill) for grade control sampling in fresh rock. Blasthole spacing is at approximately 4 x 4.5 m spacing in ore zones and 4.2 x 4.8 m in waste zones. The open pit operations at Ahafo North use four CATMD6200 drill rigs for blast holes for 6 m bench-drilling (plus 1.3 m sub-drill), and three Pantera DP1500i drill rigs for presplit drilling. Blast hole spacing is approximately 3.8 x 3.3 m (spacing and burden) in ore zones and 4 x 3.5 m in waste zones. At Subika Underground, two LM90 diamond drill rigs are used for indicated to measured conversion drilling. Drill patterns are based on the mining method, with 12.5 m spacing for long- hole stoping areas and 17 m spacing for sub-level shrinkage zones. All core is fully sampled, and the resulting assay data is used for constructing grade control block models. Ahafo Complex Ghana Technical Report Summary Date: February 2026 Page 7-22 7.2.8 Comment on Material Results and Interpretation Drill holes are oriented with an inclination ranging from -45º to -88º for surface holes and -74º to -32º for underground holes to accommodate the steeply-dipping nature (typically -55º to -75º) of the deposits, resulting in an intersection generally representing 75–85% of true width. Drilling is generally orientated perpendicular (300–330º) to the strike of the orebodies (040º –050º) for surface drill holes. Underground drill holes are typically collared from the footwall into the hanging wall of the orebody, the opposite direction to the surface drill holes. Local variation in drill orientations may be present to accommodate infrastructure constraints. 7.3 Hydrogeology Water quality monitoring is based on a monitoring plan developed to guide ongoing sampling and analysis of process fluid including groundwater and surface water collected in conjunction with Newmont’s water resources monitoring program to meet operational needs and environmental protection requirements. Sampling conducted under this plan is performed by Newmont personnel and/or contractors under the direction of Newmont staff. Monitoring data are used to quantify water quality such that any mine-related impacts to the environment can be determined and, if necessary, mitigated. 7.3.1 Sampling Methods and Laboratory Determinations 7.3.1.1 Ahafo South Surface and ground water monitoring routinely conducted, with sample intervals, depending on what is being monitored, that can be daily, weekly, monthly, quarterly, or annual. Samples of surface water are analyzed in the field using hand-held instruments for the following parameters: pH, specific conductivity, dissolved oxygen, water temperature, and turbidity. The color of the water is also recorded on the field form. Community water supply wells are sampled using existing well pumps. Field parameters including pH, SC, temperature, dissolved oxygen, and turbidity are collected. Standpipes and vibrating wire piezometers (VWPs) are installed in the perimeter of the pits to monitor groundwater levels and pore pressures for the purpose of slope stability. Stream flow at designated stations is measured using a current meter (electromagnetic, and/or equivalent-type). Water sample analyses are conducted by SGS or the mine site laboratory. SGS is an accredited environmental laboratory in Ghana and appropriate certifications for chemical analysis of hydrological samples. The Newmont mine laboratory is used for selected analyses, such as physical parameters, microbiology, and particular nutrients. Full suite parameters, such as nutrients and other chemicals, total and dissolved metals are assayed at one of SGS, ALS, or Intertek in Ghana. These laboratories may be used to analyze split samples as part of the QC process. All laboratories use designated analytical methods or a comparable method, and meet specific QC requirements. The laboratories hold ISO17025 accreditations for selected chemical analytical techniques. Ahafo Complex Ghana Technical Report Summary Date: February 2026 Page 7-23 Laboratory analytical methods used are based on the most recent edition of the American Public Health Association’s (APHA) “Standard Methods for the Examination of Water and Wastewater”, and standards from the International Standards Organization. Quality assurance and quality control (QA/QC) measures can include: • Ensuring sites selected are representative; • Reviewing field forms for adherence to proper calibration and sample collection procedures • Achieving completeness goals of 90%, where completeness is calculated as the number of valid measurements divided by the total number of planned measurements, expressed as a percentage; • Inserting field duplicates, laboratory duplicates, matrix spike duplicates, or laboratory control sample duplicates; • Inserting field blanks, matrix spikes, laboratory control samples, and surrogate spikes • Using USEPA-accepted analytical methods, where available and as appropriate; • Checking the comparability of data collected. 7.3.1.2 Ahafo North Vibrating wire piezometers were installed in six oxide definition drill holes in the northern part of the project area. Three piezometer sensors were installed at each location, with one sensor in the primary rock a second in the saprock and the third in the saprolite. Two monitoring wells were constructed using PVC and screened in saprolite near the planned Line 10 pit at Yamfo South. Deep and shallow conventional PVC monitoring wells were also installed at two locations in the area of the Yamfo S-SE and Yamfo S-SW pits. A conventional monitoring well was installed at a potential plant site location. Groundwater monitoring wells were installed both upstream and downstream of the planned TSF location. These installations are intended as groundwater sampling and water-level monitoring locations; initially to provide pre-mining background data, but thereafter to provide performance data during the operation of the facility. Hydrogeological data indicated that a substantial thickness of saturated oxide sequence would be encountered during open pit mining. Drilling was completed in support of defining the groundwater surface and the oxide–primary boundary in the pit areas. The surface of the top of primary rock was an important pit slope design sector boundary, as it separates lower-strength materials above from higher strength primary rock below. Water quality samples were collected to provide an initial indication of the water quality in the Ahafo North area, and analyzed at ACZ laboratories in Steamboat Springs, Colorado. groundwater quality in the Ahafo North Project Area is generally good. Given the very low acid generating potential of both the saprolite and primary rock, impacts to water quality are only expected to occur where highly mineralized materials are exposed.


Ahafo Complex Ghana Technical Report Summary Date: February 2026 Page 7-24 7.3.2 Groundwater Models 7.3.2.1 Ahafo South A groundwater model was developed in 2016 by Golder Associates for the Ahafo South mines, primarily to support the open pit mines and the planned Subika underground mine. Evaluations of the potential to also underground mine adjacent to the Apensu open pit required updates to the groundwater model. The existing FEFLOW-hosted Ahafo regional groundwater flow model was recalibrated to better represent the inflows and groundwater levels monitored in proximity of the various mines. The 2015–2016 model assumptions resulted in higher predicted groundwater inflows to the underground mine than that recorded over the 2017–2019 period, and consequently the associated drawdown cones predicted were larger than those measured based on available borehole water levels. As a result, the hydraulic conductivities assigned to the saprock, fractured and fresh bedrock zones were reduced. Lower hydraulic conductivity values and lower groundwater ingress rates were modeled to match the data collected, and the cone of depression extent was reduced. 7.3.2.2 Ahafo North The initial version of the regional numerical groundwater flow model, developed in 2007, was based on a network of regional monitoring wells for which historical groundwater levels, geochemistry, and aquifer (slug) testing were available. A hydrogeological characterization study was completed in 2012 for the Susuan, Teekyere West, and Subenso South pits, and for the Yamfo Northeast and Subenso North pits in 2014. These studies involved the installation of test wells and monitoring wells, short-duration pumping tests and borehole slug tests at well locations within each proposed pit area. The conceptual hydrogeological model for Ahafo North includes four hydrogeological units. Groundwater flow in the primary rock and saprock is fracture controlled. Direct infiltration of precipitation is the primary source of groundwater recharge and is estimated to range between 1–15% of annual rainfall. Natural discharge of groundwater primarily occurs as a combination of evapotranspiration in wetlands and riparian zones, coupled with baseflow to the Tano River and its perennial tributaries. The potentiometric surface typically first occurs in the saprolite, except in local areas where saprock or fresh bedrock is exposed at the surface. 7.3.3 Water Balance 7.3.3.1 Ahafo South The Ahafo South site-wide Goldsim model has been in use for over a decade as an operational support and long-term planning tool for mine water management at the operations. Calibration of the model is performed at least once annually through the collation and entry into the model of empirical monitoring/operational reporting data spanning a minimum of 12 months prior to the date of each calibration exercise. Data inputs used in the calibration process included mined tonnages, mill throughput, pit dewatering rates, tailings densities, TSF reclaim rates and other factors that are likely to influence Ahafo Complex Ghana Technical Report Summary Date: February 2026 Page 7-25 the physical water balance. Deterministic model simulations were then performed, with results relating to flows and/or storage inventories compared against measured values at key calibration locations across the model domain. Updates of the Goldsim site-wide water balance model for Ahafo was completed during Q3 of 2020 and included Ahafo’s 2021 mine plan and production schedule. Historical and projected inflows to the Subika Underground as defined by 2020 numerical groundwater modelling were incorporated into the Goldsim model. In parallel with the model update and calibration process completed in Q3 2020, the Goldsim model was used to support investigations performed under the Ahafo Site Water Management Study, primarily on the LOM dewatering strategy around the Apensu pit, and the decision on the need for and timing of additional treatment capacity, and the requirement of an impacted water pond. 7.3.4 Ahafo North Water demand at the mill is met from other facilities at the mine, if available, and from outside fresh water sources if not. Outside river intake is not required at the mill under median conditions, and was only found to be necessary during the spring months of particularly dry years. This assumes that the 10 sediment control structures will be able to supply water for any shortages of dust control needs. After production begins, water collected in the sediment control structures will primarily only be required during the drier spring months of each year, with annual peaks occurring in January. Water from the water storage facility will be needed for process requirements only during the spring months, when less water is available from the TSF. 7.3.5 Comment on Results 7.3.5.1 Ahafo South To the Report date, the hydrogeological data collection programs have provided data suitable for use in the mining operations, and have supported the assumptions used in the active pits and underground operations. 7.3.5.2 Ahafo North Groundwater is encountered in the oxide sequence, and a significant portion of the saprolite is currently saturated. The depth to the groundwater surface varies from just a few meters in lower lying regions of the project area adjacent to the principal surface water drainage features, to between 20–25 m beneath the topographic highs. While artesian conditions have not been encountered at Ahafo North, to a limited extent they could be expected to occur at lower-lying groundwater discharge sites. On a local scale, groundwater flow is typically a subdued reflection of topography; but at a regional scale, groundwater flow is toward the southeast, parallel to the strike of the Kenyasi Fault. The matrix permeability of the saprolite is typically low, although remnant quartz veins can provide discrete structures with higher permeability. The highest permeability unit in the project area is the generally thin (2-10m thick) saprock horizon which identifies the top of the bedrock surface. Ahafo Complex Ghana Technical Report Summary Date: February 2026 Page 7-26 Groundwater flow in the primary rocks is fracture controlled; the permeability of the un-fractured bedrock is very low. Piezometer data indicate that variations exist in the thickness of the saturated saprolite and the oxide sequence overall. On average, the lower 15–25 m of the oxide sequence is likely saturated, with saprolite making up most of that thickness. 7.4 Geotechnical The following general information is collected for geotechnical assessment of both open pit and underground excavations: • Rock mass classification and characterization data to estimate the rock quality; • Structural data to determine potential structural-controlled failures; • Damage mapping data to determine failure mechanisms; • Stress testing to determine the in-situ rock stress environment. 7.4.1 Sampling Methods and Laboratory Determinations 7.4.1.1 Ahafo South Rock mass and hydrogeology data are used for structural characterizations to support pit walls and underground excavations. The strength and elastic properties of the oxide and fresh rocks have been characterized from laboratory testing of samples and cores. Examples of tests done to determine the mechanical properties of fresh rocks are tensile strength, uniaxial compressive strength, Young’s Modulus, Poisson’s Ratio, triaxial compressive tests, and direct shear tests. Core samples are sent to a laboratory for various geotechnical purposes, such as determining the mechanical properties and estimating the in-situ stress field of the rock. Core samples are selected for laboratory purposes, and based on information such as the core integrity, core quality, and geological variability. The samples are carefully selected at different depths, with rock sample lengths and dimensions based on the International Society for Rock Mechanics guidelines for various tests. Current testing facilities include Rocklab in Pretoria, South Africa; E-Precision in Bibra Lake, Western Australia; the West Australian School of Mines in Kalgoorlie, Western Australia; and the University of Mines and Technology laboratories in Ghana, all of which are accredited. The laboratories are independent of Newmont. Geotechnical laboratory test work is conducted according to industry-accepted standards such as the International Society for Rock Mechanics, American Society of Testing and Materials, or international equivalents. For in-situ stress testing, a comprehensive database of stress measurements has been collected at the Ahafo South operations, including the Subika and Apensu orebodies. The dataset consists of 13 West Australian School of Mines acoustic emission tests at Ahafo South conducted in 2011, 2021 and 2024, and six full stress tensor CSIRO hollow-inclusion cell measurements at Subika underground, conducted in 2018 and 2022. For acoustic emission testing, core samples were selected at varying sample depths, and the hollow-inclusion cell tests were conducted at roughly 200, 400, and 600 m below the surface. Ahafo Complex Ghana Technical Report Summary Date: February 2026 Page 7-27 Scanline, window, spot, and digital mapping techniques are used to characterize the various discontinuity sets within the rock mass, which aids in defining potential failure modes likely to occur in the stope and pit walls. Several aspects, such as rock mass condition, stope geometry, structural fabric, stress conditions, and slope performance are considered during stope designs. Good oversight of drillers is maintained during drilling programs to verify that processes are carried out correctly. New geologists are trained by the Senior Geologist/Senior Geotechnical Engineer in data collection programs. The Senior Geologist/Senior Geotechnical Engineer in charge of the drilling program periodically reviews the final log data to ensure all geotechnical features have been included and accurately captured. Run-of-mine (ROM) and development waste rock are used as fill material in the underground excavations. The suitability of the fill material is determined by using the mechanical properties of the rock and fragmentation analysis to define material granularity and appropriateness. The fragmentation analysis is conducted by a qualified backfill engineer. For the open pits, blasts are measured with a geophone system to quantify the effect of vibrations on the rock mass. There are prism arrays on the pit walls to measure slope displacements. Radars are also employed to monitor slope movements in real time. A micro-seismic monitoring system is used for monitoring seismic activities in the rock mass. Extensometers, stressmeters and sloughmeters are used for displacement monitoring of some selected underground excavations. In August 2019, a seismic network was commissioned for underground workings. The initial seismic sensor array underwent improvements in 2021, 2024, and 2025, increasing the number of geophones to 12, 15, and 19, respectively. These upgrades were implemented to enhance the location sensitivity and accuracy of seismic events, using a total of 19 triaxial seismic sensors operating at frequencies of 4.5 Hz and 14 Hz. A register is maintained for all Fall of Ground and seismic trigger events, which provides a summary of the sequence and nature of the event, remediation and lessons learnt. 7.4.1.2 Ahafo North The following general information is collected for geotechnical assessment of open pit excavations: • Rock mass classification and characterization data to estimate the rock quality; • Geological and structural data to determine potential structural-controlled failures; • Hydrogeological data to determine the groundwater pressure and surface water flow. Rock mass and hydrogeology data are used for structural characterizations to support pit walls. The strength and elastic properties of the oxide and fresh rocks have been characterized from laboratory testing samples from test pits and cores. During drilling of the boreholes, standard penetration testing and undisturbed sampling were carried out in laterite and saprolite sections. Examples of tests done to determine the mechanical properties of rocks and soils are tensile strength, uniaxial compressive strength, triaxial compressive tests, direct shear tests, elastic constants, sieve analysis, Atterberg limits, natural moisture, standard Proctor, consolidation, and permeability tests. Core samples are sent to a laboratory for various geotechnical purposes, such as determining the mechanical properties of the rock. Core samples are selected for laboratory purposes based


Ahafo Complex Ghana Technical Report Summary Date: February 2026 Page 7-28 on information such as core integrity, core quality, and geological variability. Selection of samples is done to limit bias as far as practicable. The samples are carefully selected at different depths and orientations, considering different scales of discontinuities, with sample lengths based on the International Society for Rock Mechanics recommendation for various tests. Core samples for laboratory testing are wrapped with clean cloth and placed in either wooden or metal boxes that are lined with visco-elastic foam to minimized disturbances during shipment. Current testing facilities include Rocklab in Pretoria, Civilab in South Africa, University of Mines and Technology and Conterra laboratories in Ghana, all of which are accredited. The laboratories are independent of Newmont. Geotechnical laboratory test work is conducted according to industry acceptable standards such as the International Society for Rock Mechanics, American Society of Testing and Materials, or international equivalents. Good oversight of drillers is maintained during drilling programs to verify that processes are carried out correctly. New geologists are trained by the Senior Geologist/Senior Geotechnical Engineer in data collection programs. The Senior Geologist/Senior Geotechnical Engineer in charge of the drilling program periodically reviews the final log data to ensure all geotechnical features have been included and accurately captured. Pit wall mapping techniques such as scanline, window, spot, and digital mapping are used to characterize the various discontinuity sets within the rock mass, to aid in defining potential failure modes likely to occur in the pit walls as the pits are opened up. Structural data from geotechnical core logging will be inferred from field mapping to deduce their correlation. Prisms are employed to monitor slopes as benches are exposed. Plans are underway to purchase and commission slope monitoring radars. There is continuous collection and interpretation of groundwater monitoring data from monitoring bores and vibrating wire piezometers in the area. 7.4.2 Comment on Results 7.4.2.1 Ahafo South The geological hard rock setting at the Ahafo South is well understood and displays consistency across the various open pits and the underground mine located on site. Additional testing continues to confirm the consistency of material strengths and parameters. As of the Report date, geotechnical data collection programs have generated data that is suitable for mining operations and have validated the assumptions used in the active pits and underground operations. 7.4.2.2 Ahafo North Modelling of lithological and structural units by Exploration Geology is ongoing for some of the deposits. The large-scale faults have not been modeled explicitly, but they can be inferred from the orientations of modeled ore shapes that occur along the faults; and by foliation orientations from oriented core and televiewers data. The geotechnical model is reasonably understood, and has supported the assumptions used in the open pits based on the interpretation of the best currently available data. Additional data need to be collected through pit wall mapping, geotechnical drilling, observations, and slope Ahafo Complex Ghana Technical Report Summary Date: February 2026 Page 7-29 performance as the pits are developed to confirm the consistency of material strengths and parameters. As mining occurs, rock mass properties will likely be modified or refined based on local mining experience, slope performance, and an improved understanding of the conditions. To the Report date, the geotechnical data collection programs have provided suitable data and have supported the assumptions used in the pit designs. Ahafo Complex Ghana Technical Report Summary Date: February 2026 Page 8-1 8.0 SAMPLE PREPARATION, ANALYSES, AND SECURITY 8.1 Sampling Methods BLEG samples were collected from suitable drainages, as 2–5 kg samples, and placed in pre- numbered calico bags. The sample location was recorded, typically on aerial photographs. Soil samples were collected as 2 kg samples from 15–20 cm depths in the soil profile, a description recorded, then samples were placed in a pre-numbered calico bag. Rock chip samples were typically collected as 2–5 kg of grab samples from surface outcrops. Sample locations were recorded, together with a geological description. Trench and pit samples were normally collected from the side or bottom of the trench on about 2 m spacings, or as designated by the supervising geologist. Samples ranged from 2–5 kg, and each sample position was recorded with a geological description. Aircore drill samples were typically taken on 2 m intervals down hole. RC samples were generally taken on 1 m intervals down hole, split using a Gilson riffle splitter, with quarter samples collected in pre-numbered RC sample bags. Core was cut along marked orientation lines, using a diamond saw. Sample lengths varied from 0.5–1.5 m, with sample intervals selected based on the geological features of the core, including alteration. 8.2 Sample Security Methods Sample collection, preparation, and transportation have always been performed by Newmont personnel using Newmont vehicles, or by the relevant commercial laboratory vehicle. Chain-of- custody procedures consist of sample submittal forms sent to the laboratory with sample shipments to make certain that all samples are received by the laboratory. 8.3 Density Determinations Newmont’s protocols for specific gravity determination require that a minimum of 30 samples per material type (domain) are collected at the initiation stage and identification stage of any project. For more advanced projects, specific gravity samples are typically collected at approximately 25 m intervals per lithological and alteration domains. Specific gravity determinations were completed by the Normandy-operated Ahafo Mobile Sample Preparation Unit (MSPU) and the SGS laboratory in Tarkwa (SGS Tarkwa). In all cases, specific gravity values were measured by water displacement methods. Currently, determinations are performed onsite by Newmont geologists and technicians. Specific gravity values range from 1.76 in saprolitic material to 2.79 in fresh rock for Ahafo South, and 1.7 in saprolite to 2.86 in fresh rock for Ahafo North. Ahafo Complex Ghana Technical Report Summary Date: February 2026 Page 8-2 Quality control (QC) measurements are performed on a minimum of 5% of samples by an independent external laboratory. These are currently completed at ALS Kumasi. Prior to April 2023, the determinations were conducted at the SGS Ahafo onsite laboratory. Quality assurance and quality control (QA/QC) measurements are validated by Newmont senior geological staff. 8.4 Analytical and Test Laboratories A number of independent laboratories have been used since 1993. During the Normandy operating period, the primary laboratories were Transworld Laboratories, in Tarkwa, Ghana, and SGS Kumasi and SGS Tarkwa. Newmont used UltraTrace Laboratory Pty Ltd (UltraTrace) for BLEG geochemical sampling. Umpire laboratories used include ALS Vancouver in Canada, Gencor Laboratories, in Johannesburg, South Africa (Gencor); Inchcape Laboratory in Obuasi, Ghana (Inchcape); Genalysis Laboratories in Perth, Australia (Genalysis); Anglo-American Research Laboratories in Johannesburg (AARL); Omac Laboratories in Ireland (Omac); and Performance Laboratories in Johannesburg (Performance). SGS Tarkwa was the primary laboratory for all drill programs for the period June 2003 to 2010. In addition to SGS Tarkwa, ALS Chemex (ALS) has provided laboratory services to Newmont Ghana from 2010 to the Report date, and has used branch laboratories in various locations, including ALS Kumasi, ALS Vancouver, and ALS Johannesburg. Both the parent SGS and ALS are independent laboratory groups that operate globally, and the SGS/ALS laboratories used for the Project are accredited to ISO/IEC17025 for selected sample preparation and analytical techniques. Currently, ALS Kumasi and SGS Tarkwa are the primary laboratories used for all Ahafo exploration samples. Until April 2023, all Ahafo South grade control and metallurgical samples were analyzed at the on-site mine laboratory, which was managed by SGS. Following the fire incident that destroyed the laboratory, the samples were analyzed at the SGS Akyem mine laboratory. Currently, these samples are being analyzed at SGS Tarkwa, following the divestiture of the Akyem mine in early 2025. Ahafo North grade control samples are currently being analyzed at ALS-Kumasi whilst the analyses of metallurgical samples are being performed at SGS-Tarkwa.


Ahafo Complex Ghana Technical Report Summary Date: February 2026 Page 8-3 8.5 Sample Preparation Sample preparation methods for the various major sampling types is summarized in Table 8-1. Table 8-1: Sample Preparation Procedures Laboratory Sample Type Preparation Procedure Newmont, UltraTrace Stream sediment None required ALS Kumasi Soil Dried, crushed to nominal 90% passing -2 mm, pulverized to 90% passing -75 µm SGS Ahafo, ALS Kumasi Rock chip; pit/trench; aircore; RC Dried, crushed to nominal 90% passing −3 mm, pulverized to nominal 90% passing -75 µm SGS Ahafo, SGS Tarkwa, ALS Kumasi Core Dried, crushed to nominal 90% passing -2 mm, pulverized to 90% passing -75 µm 8.6 Analysis The following analytical methods have been used: • Au by fire assay and atomic absorption spectroscopy (AAS); • Multi-element Ag, As, Bi, Ca, Cd, Cu, Fe, Hg, In, Mn, Mo, Ni, Pb, Sb, Te, Tl, U, W, Y, and Zn; aqua regia digest followed by ICP-MS finish; • S and C analysis via LECO. Various lithochemical, trace element and total rock analyses are performed on selected sample pulps returned from the assay laboratories. These are typically analyzed at UltraTrace. 8.7 Quality Assurance and Quality Control Newmont has considerably modified the QA/QC program at Ahafo South and Ahafo North from that used prior to 2004. Newmont maintains a QA/QC program for the Ahafo Complex. This includes regular submissions of blank, duplicate, and standard reference materials (standards) in samples sent for analysis. Blanks were created from previously analyzed sterile quarry material. Standards are commercially prepared, sourced from Geostats Pty Ltd and African Mineral Standards. Duplicates are samples collected, prepared, and assayed in an identical manner as an original sample, and can include field, preparation, and pulp duplicates. Results are regularly monitored. Standard results indicate that assays from each of the laboratories, SGS Tarkwa and ALS Kumasi, are sufficiently accurate to support mineral resource and mineral reserve estimation and mine planning. In early programs, the number of outliers was on the high side; however, after investigation, the majority of the issues were found to be caused Ahafo Complex Ghana Technical Report Summary Date: February 2026 Page 8-4 by mislabeling and sample swapping. Sample labelling and handling procedures were improved during 2012, reducing the number of failed standards in later campaigns. Blank results indicate that contamination is not a significant concern. Data for field, preparation and pulp duplicate types indicates that the data are acceptably precise at the primary laboratories. The number of failures due to mixed and mislabeled samples was a concern in early programs; however, procedures for inserting and tracking duplicate samples were significantly upgraded. Approximately 5% of pulp samples analyzed at the primary laboratory were routinely submitted to an umpire laboratory. Umpire laboratory results typically compare well with the original assay results, with the precision and bias within acceptable quality ranges. There were consistent laboratory audits conducted by various Newmont personnel and laboratories were found to have all required industry standard procedures in place to produce quality results. The main laboratories use essentially the same preparation procedures and analytical methods. 8.8 Database All drilling-related data are stored on a Microsoft SQL server engine which supports multi-user access. Assays, downhole surveys, and collar surveys are stored in the same file as the geologic logging information. In addition, sample preparation and laboratory assay protocols from the laboratories are kept on file. The database is administered by a dedicated database manager. Security and access to the database is achieved through Microsoft Windows server technology authentication and file permissions. These are administered by the onsite Information Technology department. All historic paper records are filed in a manner that allows for quick location and retrieval of any information desired. Digital data are regularly backed up. Copies of the digital database are securely stored offsite. 8.9 Qualified Person’s Opinion on Sample Preparation, Security, and Analytical Procedures The sample preparation, analysis, quality control, and security procedures used by the Ahafo Complex have changed over time to meet evolving industry practices. Practices at the time the information was collected were industry-standard, and frequently were industry-leading practices. The Qualified Person is of the opinion that the sample preparation, analysis, quality control, and security procedures are sufficient to provide reliable data to support estimation of mineral resources and mineral reserves: • Drill collar data are typically verified prior to data entry into the database, by checking the drilled collar position against the planned collar position; Ahafo Complex Ghana Technical Report Summary Date: February 2026 Page 8-5 • The sampling methods are acceptable, meet industry-standard practice, and are adequate for mineral resource and mineral reserves estimation and mine planning purposes; • The density determination procedure is consistent with industry-standard procedures. A check of the density values for lithologies across the different deposits indicates that there are no major variations in the density results; • The quality of the analytical data is reliable, and that sample preparation, analysis, and security are generally performed in accordance with exploration best practices and industry standards; • Newmont has used a QA/QC program comprising blank, standard and duplicate samples. Newmont’s QA/QC submission rate meets industry-accepted standards of insertion rates; • Verification is performed on all digitally-collected data on upload to the main database, and includes checks on surveys, collar co-ordinates, lithology, and assay data. The checks are appropriate, and consistent with industry standards. Ahafo Complex Ghana Technical Report Summary Date: February 2026 Page 9-1 9.0 DATA VERIFICATION 9.1 Internal Data Verification 9.1.1 Data Validation Newmont personnel regularly visit the laboratories that process Newmont samples to inspect sample preparation and analytical procedures. Observations not in conformity with Newmont procedures are recorded in Project files and communicated to the appropriate laboratory for corrective action to be taken. The database is checked using electronic data scripts and triggers (see discussion in Chapter 8.8). Newmont has conducted a number of internal data verification programs since 2002, which included the following reviews: • Logging consistency, down hole survey, collar coordinate, and assay QA/QC data; • Geological procedures, resource models, and drill plans; • Sampling protocols, flow sheets, and data storage; • Check assay program results; • SG data. 9.1.2 Reviews and Audits Newmont conducts internal audits, termed Reserve and Resource Review or 3R audits, of all its operations. These audits focus on: • Reserves processes: geology and data collection; resource modelling; geotechnical; mine engineering (long term) for open pit and underground operations; mineral processing (development); sustainability and external relations; financial model; • Operations process: ore control; geotechnical and hydrogeology (operational); mine engineering (operational) for open pit and underground operations; mineral processing (operational); reconciliation. The reviews assess these areas in terms of risks to the contained metal content of the mineral resource and mineral reserve estimates, or opportunities to add to the estimated contained metal content. Findings are by definition areas of incorrect or inappropriate application of methodology or areas of non-compliance to the relevant internal Newmont standard (e.g., such as documents setting out the standards that are expected for aspects of technical services, environmental, sustainability and governmental relations) or areas which are materially inconsistent with published Newmont guidelines (e.g., such as guidelines setting out the protocols and expectations for mineral resource and mineral reserve estimation and classification, mine engineering, geotechnical, mineral processing, and social and sustainability). The operation under review is expected to address findings based on the level of criticality assigned to each finding. Ahafo Complex 3R audits were conducted in 2012, 2014, 2016, 2018, 2020 and 2025. Earlier audits, known as Five Star reviews, were undertaken in 2005 and 2006.


Ahafo Complex Ghana Technical Report Summary Date: February 2026 Page 9-2 The 2025 3R audit found that the Ahafo Complex was generally adhering to Newmont’s internal standards and guidelines with respect to the estimation of mineral resources and mineral reserves. The review team identified no material issues with the mineral resource and mineral reserve estimation processes. The team made a number of recommendations for site-based improvements; however, none of these recommendations were considered critical to implement. Recommendations included suggestions for improvement in the modelling process, review of site- wide cut-off grade strategies, and review of contact water management. 9.1.3 Mineral Resource and Mineral Reserve Estimates Newmont established a system of “layered responsibility” for documenting the information supporting the mineral resource and mineral reserve estimates, describing the methods used, and ensuring the validity of the estimates. Mineral reserve and mineral resource estimates are prepared and certified by QPs at the mine site level, and are subsequently reviewed by QPs in the Newmont-designated “region”, and finally by corporate QPs based in Newmont’s Denver head office. 9.1.4 Reconciliation Newmont staff perform a number of internal studies and reports in support of mineral resource and mineral reserve estimation for the various Ahafo Complex mines. These include reconciliation studies, mineability and dilution evaluations, investigations of grade discrepancies between model assumptions and probe data, drill hole density evaluations, long-range plan reviews, and mining studies to meet internal financing criteria for project advancement. 9.1.5 Subject Matter Expert Reviews The QP requested that information, conclusions, and recommendations presented in the body of this Report be reviewed by Newmont experts or experts retained by Newmont in each discipline area as a further level of data verification. Peer reviewers were requested to cross-check numerical data, flag any data omissions or errors identified, review the manner in which the data were summarized and reported in the technical report summary, and check the interpretations arising from the data as presented in the Report. Reviewers were also asked to check that the QP’s opinions stated as required in certain Report chapters were supported by the data and by Newmont’s future intentions and Project planning. Feedback from the subject matter experts was incorporated into the Report as required. Ahafo Complex Ghana Technical Report Summary Date: February 2026 Page 9-3 9.2 External Data Verification Data verification by external consultants in support of mine development and operations is summarized in Table 9-1. No material issues were identified in the reviews. Table 9-1: External Data Verification Year Company Note 2003 AMEC Americas Ltd Audited database 2014 Optiro Pty Ltd Review of Subika resource model 2016 AMEC Americas Ltd Review of resource models; geology and data collection; mineral resource estimates; mineral reserve estimates; mine planning; geotechnical data (mining, infrastructure); metallurgy and mineral processing; financial analysis 2025 Mine Technical Services External reviewers participated in the 2025 Reserve and Resource Review. External reviewers examined the Open Pit Mine Engineering, Underground Mine Engineering, and the Underground Geotechnical practices 9.3 Data Verification by Qualified Person The QP performed site visits as discussed in Chapter 2.4. Observations made during the visits, in conjunction with discussions with site-based technical staff also support the geological interpretations, and analytical and database quality. The QP’s personal inspection supports the use of the data in mineral resource and mineral reserve estimation, and in mine planning. The QP participated in the 3R audit in 2025, with responsibilities as the audit team lead. The QP receives and reviews monthly reconciliation reports from the mine site. These reports include the industry standard reconciliation factors for tonnage, grade, and metal; F1 (reserve model compared to ore control model), F2 (mine delivered compared to mill received) and F3 (F1 x F2) along with other measures such as compliance of actual production to mine plan and polygon mining accuracy. The reconciliation factors are recorded monthly and reported in a quarterly control document. Through the review of these reconciliation factors the QP is able to ascertain the quality and accuracy of the data and its suitability for use in the assumptions underlying the mineral resource and mineral reserve estimates. 9.4 Qualified Person’s Opinion on Data Adequacy Data that were verified on upload to the database, checked using the layered responsibility protocols, and reviewed by subject matter experts, are acceptable for use in mineral resource and mineral reserve estimation. Ahafo Complex Ghana Technical Report Summary Date: February 2026 Page 10-1 10.0 MINERAL PROCESSING AND METALLURGICAL TESTING 10.1 Introduction 10.1.1 Ahafo South Metallurgical testwork was conducted at the Newmont Metallurgical Services facility in Denver, and Hazen Research in Golden, Colorado, under the direction of Newmont personnel. An earlier phase of testwork in 2000 was completed under the direction of, and interpreted by, Lycopodium Pty Ltd., in Perth, Western Australia. All recent testwork was completed by Newmont Metallurgical Services. Newmont Metallurgical Services is an in-house metallurgical testing and research and development laboratory. Hazen Research and Lycopodium Pty Ltd are independent commercial metallurgical testing facilities. There is no international standard of accreditation provided for metallurgical testing laboratories or metallurgical testing techniques. Each year, samples are selected to represent the next three years of production in mine-to-mill testing, to ensure there sufficient current testwork to support knowledge of the mill feed materials, and support process assumptions. 10.1.2 Ahafo North Metallurgical testwork was initially conducted at Lycopodium in 2003 and later at Newmont Metallurgical Services. All recent testwork was completed by Newmont Metallurgical Services. 10.2 Metallurgical Testwork 10.2.1 Ahafo South Work completed included mineralogy, chemical analysis; leaching; leach characterization (as well as determination of cyanide and lime consumptions); comminution characterization for various grind sizes; Bond rod and ball mill work indices, abrasion indices and JKTech drop weight comminution parameters; grindability work; heap leach testwork; gravity concentration tests; determination of thickening and slurry pumping characteristics; rheology; tailing characterization and tailings geochemical tests; and oxygen addition. These tests were used to design the plant, which commenced operations in 2006, and support ongoing plant operations. Results from the test work program prior to 2006 were used to develop equations to forecast throughput, recovery, and cost for each ore type. The throughput, recovery and cost models have subsequently been validated and updated using results of mine-to-mill test work conducted after plant startup, and the actual process plant throughput and recovery performance. Ahafo Complex Ghana Technical Report Summary Date: February 2026 Page 10-2 The current mineral reserve and mineral resource metallurgical recovery assumptions have not changed significantly since plant start-up. The Ahafo Mill Expansion (AME; also referred to as Line 2) was commissioned in September 2019. It entailed a separate crushing/grinding circuit, and three additional leach tanks and tailings pumps. Line 2 is adding approximately 50% more capacity to the Ahafo processing plant. The Line 2 design throughput rate is 420t/hr, which was achieved in 2022, and the line is currently operating above the designed rate. Recent testwork was completed on samples from the Apensu underground, Subika underground, and the Subenso and Apensu open pit areas. The work indicated that a new tertiary milling circuit would have recovery benefits and is being assessed as part of the Recovery Enhancement Project (REP). 10.2.2 Ahafo North Metallurgical testwork completed included mineralogy, chemical analysis; comminution testwork (crushing index, unconfined compressive strength, Bond rod and ball mill, abrasion index, JKTech drop weight comminution parameters), optimal grind size tests, gravity recoverable gold tests, flash and conventional flotation tests; variability leach tests, evaluation of leaching retention times; optimizing reagent conditions; oxygen addition; rheology and thickening tests; tailings characterization; cyanide destruction testwork; and settling and drying tests. Testwork results are summarized in Table 10-1.


Ahafo Complex Ghana Technical Report Summary Date: February 2026 Page 10-3 Table 10-1: Testwork Results, Ahafo North Testwork Type Note Chemical analyses and mineralogy Primary ores are not generally preg-robbing; cyanide consuming species are low; Hg and As values are typically low; total S is low. Primary minerals include quartz, plagioclase, ankerite and sericite, with lesser amounts of chlorite, pyrite, rutile, and siderite. A portion of the ore at Yamfo Southeast is refractory. Saprolite ores are not generally preg-robbing; cyanide consuming species are low; Hg and As values are typically low; total S is low. Primary minerals include quartz, plagioclase, kaolinite, goethite, and sericite, with lesser amounts of rutile. Pyrite was absent. Comminution Yamfo South and Yamfo Northeast will most likely be ball mill limiting due to the high BWi; Teekyere West and Subenso North will most likely be semi-autogenous grind (SAG) mill limiting due to the high DWi; although modelling show that Subenso South and Susuan is also SAG mill limiting, the deposits are almost in balance from a SAG mill and Ball mill limiting perspective. As expected, the saprolite is less competent than the primary ore. Flotation Pre-concentration by gravity and flash flotation as well as coarser grind flotation were tested. The improvement in recovery after concentration was generally insufficient to justify the increased process complexity, and financial analysis did not present an attractive economic outcome. Leaching A grind size of P80 -53 µm, leach retention time of 24 hours and the addition of oxygen maximizes gold extraction. Installing a CIL circuit is the best configuration since some of the material from the various Ahafo North deposits could be mildly preg robbing in nature. Rheology Primary ores did not present any mixing or pumping problems in the proposed operating density range. Tailings characterization Tailings samples have significant acid neutralizing capabilities and are non-acid generating. Leach testing of the samples indicate that there is little liberation of metals and other constituents of concern in oxidative conditions and when contacted with rainfall. Waste characterization There is little liberation of metals in oxidative conditions and with rainfall contact. Contact with synthetic rainfall indicates the potential for elevated pH levels. Limits were exceeded for some constituents for example aluminum, chromium, copper, iron, manganese, nickel, zinc, and hardness in acidic conditions. Toxicity leach testing methods indicate that the waste rock samples would not be classified as hazardous waste if disposed of in a US municipal landfill. The mineralization is amenable to treatment through a conventional process plant based on conventional equipment. Ahafo Complex Ghana Technical Report Summary Date: February 2026 Page 10-4 10.3 Recovery Estimates 10.3.1 Ahafo South The process plant is currently fed with primary ores. However, from 2027–2030, a portion of the plant feed will be from oxide ores. The LOM plan assumes an average 10 Mt/a throughput rate from 2026–2034. Recovery models were derived at a grind size of P80 passing 106 µm, based on actual testwork conducted at current plant conditions, for the various deposits. These equations were used to determine the block by block recovery and the individual blocks recoveries were coded into the model for floating pit shells. Stockpiled material is tracked by pit source and is assigned the same metallurgical recovery as the deposit it is sourced from. Underground recoveries are applied during the scheduling process and are derived from the recovery equation specific to each underground deposit, based on the average mined grade per period. Forecast recoveries for the deposits to be treated through the Ahafo South process plant are provided in Table 10-2. Table 10-2: Ahafo South Recovery Estimates Deposit/Zone Metallurgical Recovery (%) Apensu Deeps (underground) 90 Apensu open pit 84 Awonsu open pit 88 Subika Open Pit Stockpiles 93 Subika underground 94 Note: all recoveries presented on an average LOM projected grade basis. Ahafo Complex Ghana Technical Report Summary Date: February 2026 Page 10-5 10.3.2 Ahafo North Recovery models were derived at a grind size of P80 passing 53 µm, based on testwork. Recovery equations were derived for each of the deposits. Forecast recoveries for the deposits to be treated through the Ahafo North process plant are provided in Table 10-3. Table 10-3: Ahafo North Recovery Estimates Deposit/Zone Metallurgical Recovery (%) Yamfo South/Line 10 89 Yamfo Central 95 Yamfo Northeast 93 Susuan 92 Subenso South 89 Subenso North 87 Teekyere West 89 Plant recovery is expected to be 95–96% for oxide ore and 86–93% for primary ore. 10.4 Metallurgical Variability Samples selected for metallurgical testing during feasibility and development studies were representative of the various styles of mineralization within the different deposits. Samples were selected from a range of locations within the deposit zones. Sufficient samples were taken and tests were performed using sufficient sample mass for the respective tests undertaken. Samples for testing through the Ahafo South process plant are currently selected for every 300,000 t of ore to be processed, using a grade/tonnage table, and used in mine-to-mill testing. 10.5 Deleterious Elements The Ahafo South ores are clean ores containing low levels of problematic elements. The ores do not contain significant amounts of arsenic, selenium, and mercury to indicate health or environmental risks. No appreciable levels of rich-solution-robbing materials are present in the ores. The ores contain low sulfide sulfur, and low concentrations of primary cyanide consumers (copper, nickel, and zinc). The Ahafo North ores are also clean ores containing low levels of problematic elements. The ores do not contain significant amounts of arsenic, selenium, and mercury. Metallurgical testing Ahafo Complex Ghana Technical Report Summary Date: February 2026 Page 10-6 indicated that a portion of the material in the southwestern end of the Yamfo Southeast pit may be refractory as gold extraction decreases with increased levels of arsenic concentrations. Some test samples returned had preg-rob numbers >0.15, but <1, indicating that some material might be mildly preg-robbing. The concentrations of primary cyanide consumers (Cu, Ni and Zn) were low and did not raise concerns of potentially high cyanide consumption rates. 10.6 Qualified Person’s Opinion on Data Adequacy The QP notes: • Metallurgical testwork completed on the Project is appropriate to establish optimal processing for the different deposits that comprise the Ahafo Complex; • Testwork was completed on mineralization that is typical of the deposit styles. The testwork indicates that mineralization typically becomes harder with depth, and that in the primary ore gold is associated with fine pyrite mineralization or silicates; • The mill throughput and associated recovery factors are considered appropriate to support mineral resource and mineral reserve estimation, and mine planning.


Ahafo Complex Ghana Technical Report Summary Date: February 2026 Page 11-1 11.0 MINERAL RESOURCE ESTIMATES 11.1 Introduction The close-out date for the databases used in the various mineral resource estimates are as follows: • Ahafo South models: o Subika underground: August 13, 2025; o Awonsu open pit: May 30, 2024; o Apensu South open pit: May 16, 2023; o Apensu underground: September 6, 2024; • Ahafo North models: o Subenso South/ Teekyere West/Susuan: July 5, 2025; o Yamfo South: July 17, 2025; o Yamfo North: July 21, 2023; o Subenso North: August 9, 2024; o Yamfo Central: May 1, 2025. The data used for the resource model work were approved drill holes extracted from the database. The data included approved assay, collar, downhole survey, and geological logging data. These were validated using Vulcan ISIS validation tools and on-screen visualization. • Collars significantly above or below topography; • Assay values repeated downhole; • Null or zero assay values; • Azimuth or inclination deviations greater than 5° between adjacent measurements; • Assays/logged information not extending to total depth; • No downhole survey data. Geological models incorporated various combinations of lithology, structure, alteration, mineralization, and metallurgical characteristics. The geology models were constructed using Leapfrog and Vulcan geological modeling software. At Ahafo South, the high silica or albite alteration intensities 2 and 3 (SA2&3) form the main mineralization hosts. A 0.2 g/t Au grade shell was constructed to form a halo around the main mineralization for those deposits (Table 11-1). Ahafo Complex Ghana Technical Report Summary Date: February 2026 Page 11-2 Table 11-1: Modeled Mineralization Envelopes Deposit Main Mineralization Halo Ahafo South Apensu/Awonsu open pit SA 2&3 0.2 g/t Au grade shell Apensu underground SA 2&3 0.2 g/t Au grade shell Subika underground SA 2&3 SA1 and 0.2 g/t Au grade shell Ahafo North Yamfo South BX or 1.0 g/t grade shell WMY or 0.3 g/t grade shell Yamfo Central 1.0 g/t Au grade shell 0.2 g/t Au grade shell Yamfo North 1.0 g/t Au grade shell 0.2 g/t Au grade shell Subenso North BX 0.2 g/t Au grade shell Subenso South/Teekyere West/Susuan BX 0.2 g/t Au grade shell Mineralization in Ahafo North is primarily hosted in the brecciated (BX) geological units and haloed by low-grade, weakly-altered mylonites (WMY) or falls within the 0.2 g/t Au grade shell (refer to Table 11-1). Yamfo North and Yamfo Central were constrained within a 1.0 g/t Au grade shell to capture the main mineralization zones. Block models were built with cell dimensions that were appropriate to the deposit style, and mineralization orientation and dimensions. Selectivity during mining, mining method, equipment size, and bench height were also taken into account when determining parent cell size. Sub-cells were used to better represent volumes of thin mineralization in some deposits. Open pit models were regularized to the selective mining unit size for mining purposes. 11.2 Exploratory Data Analysis Exploratory data analysis made use of tools such as descriptive statistics, histograms, cumulative probability plots, box plots, and contact analysis of raw assays to guide the construction of the block model and the development of estimation plans. Most boundaries were considered hard for mineral resource estimation purposes, except at Apensu, Awonsu, Subika, Subenso South/Teekyere West/Susuan, and Yamfo South open pits where some domains were combined to produce soft contacts. 11.3 Density Assignment Specific gravity values were assigned to the combined Apensu–Awonsu block model based on oxidation surfaces interpreted by site geologists. The bottom of saprolite and the top of fresh (not oxidized) material were used to assign specific gravity values to oxidized, partially oxidized, and fresh (non-oxidized) material. Density values were estimated in the Subika and Apensu underground models and the Subika open pit model to define local variability. Ahafo Complex Ghana Technical Report Summary Date: February 2026 Page 11-3 Specific gravity values for the Ahafo North models are assigned in the block model, by modeled oxidation, based on the naïve mean of the density data. Only the Subenso South/Teekyere West/Susuan model had the density estimated from actual data. 11.4 Grade Capping/Outlier Restrictions Grade caps were determined from raw assay or composite statistics for each geology domain. In most cases, caps were determined from cumulative probability graphs of raw assays or composite, indicated correlation, and verified independently by the decile or Parrish methods and/or the hi-risk approach which assesses the amounts of metal at risk in each domain. 11.5 Composites Composite lengths vary by deposit, and range from 2–8 m, broken at geological contacts. The composites were coded for lithology, oxidation state, and grade shell using the 50% rule when using MineSight software and the centroid rule when Vulcan was used for grade estimation. 11.6 Variography Variograms were computed by lithological domain in Snowden Supervisor software (correlograms/normal score transform) and were calculated in the rotated plane of the mineralization as determined from variogram contours/maps. Directional increments were used to determine principal directions in each mineralized domain. The nugget effect was determined and modelled from the down the hole variograms. Usually, two spherical or exponential structures were fitted in most cases using geological interpretation. In the case of normal score transform, the final result is then back transformed to original data unit. 11.7 Estimation/interpolation Methods Newmont has a standardized protocol for resource modelling and estimation, which includes the following steps: • A cross-functional model planning meeting is held to define the purpose of the Resource model; • Data quality and suitability are verified during database extraction process; • Appropriate geological frameworks are constructed during the geological modeling phase; • Regular progress meetings and a handover meeting of the geological model to the Resource estimation personnel are convened. A geostatistician is involved in the geological modelling process; • Exploratory data analysis is undertaken as per the relevant internal Newmont guidelines; • The estimation plan is consistent with the data analysis and mineralization style, change of support is investigated and where possible the model calibrated with production data; • Resource is classified in conformance with Newmont’s internal Resource Classification Guideline; Ahafo Complex Ghana Technical Report Summary Date: February 2026 Page 11-4 • Resource risk is assessed in accordance with Newmont’s internal Resource Risk Assessment Guideline; • A face to face or virtual meeting and presentation is held with Mine Engineering for each Resource model released; • Model documentation is completed in conformance with Newmont’s internal Resource Model Documentation Guideline. All deposits were estimated using ordinary kriging (OK) interpolation methods. Grade estimations were selective by mineralization domains in most cases and restricted within a lower value mineralization domain. A multi-pass search strategy was used to estimate each domain. Each domain used a minimum of 1–12 samples, a maximum of 8–60 samples, and a maximum of 2–4 samples per drill hole for the estimation of the passes. The search distances for the first pass used the range of the second structure of the modelled variogram, or a shorter range. Subsequent passes were introduced with very large search distances to estimate the majority of blocks that were not estimated in the first pass due to limited drill data. In some cases, an outlier restriction method was employed during estimation to avoid smearing high-grade samples when estimating distant blocks. In open pit models where grade control information (blastholes) was available, the grade estimation parameters were determined through calibration against a grade–tonnage curve derived from grade control models. For underground resource models where no grade control information was available (Apensu and Subika underground), estimation focused on minimizing conditional bias and generation of a high- quality local estimate. 11.8 Validation Validation used Newmont-standard methods, which included: • An on-screen check of geological domain assignment; • An on-screen check of composite selections; • An on-screen, visual inspection of OK blocks in plan and section and a comparison with the composite input data; • A check on global grade bias by comparing the statistics of OK and nearest neighbor grade estimates, usually by domains; • An on-screen check of model block density assignments and estimates; • Hermitian correction (Herco) to account for change of (composite and block) support; • Swath plots along the major dimensions of the deposits, comparing OK, inverse distance, and nearest neighbor estimates together with tonnage by domains; • Calibration to historical production for deposits with available blasthole data.


Ahafo Complex Ghana Technical Report Summary Date: February 2026 Page 11-5 These validation procedures indicated that the geology and resource models used are acceptable to support mineral resource estimation. 11.9 Confidence Classification of Mineral Resource Estimate 11.9.1 Mineral Resource Confidence Classification Resource classification parameters were based on the results of drill hole spacing studies for Subika, Apensu and Awonsu. A drill spacing study conducted for Subenso South/Teekyere West/Susuan in 2012 was used for the Ahafo North mineral resource confidence classifications. Yamfo Central drill hole spacing study was completed in 2025 and used for its mineral resource classification. Mineral resource classification was undertaken based primarily on drill spacing and number of drill holes used in the estimate: • Ahafo South: o Measured: variable by deposit; drill spacing ranges from 12.5 x 12.5 m to 25 x 25 m; o Indicated: variable by deposit; drill spacing ranges from 25 x 25 m to 35 x 35 m; o Inferred: variable by deposit; drill spacing ranges from 50 x 50 m to 70 x 70 m; • Ahafo North: o Measured: drill spacing of ≤25 m; o Indicated: drill spacing of ≤35 m; o Inferred: drill spacing of ≤50 m. A quantitative assessment of geological risk was undertaken and applied on a block-by-block basis. Primary risks to resource quality include quantity and spacings of drill data, geological knowledge, geological modelling, grade estimates, geometallurgy, and geotechnical risk. All identified risks are within acceptable tolerances with associated management plans. 11.9.2 Uncertainties Considered During Confidence Classification Following the analysis in Chapter 11.9.1 that classified the mineral resource estimates into the measured, indicated, and inferred confidence categories, uncertainties regarding sampling and drilling methods, data processing and handling, geological modelling, and estimation were incorporated into the classifications assigned. The areas with the most uncertainty were assigned to the inferred category, and the areas with fewest uncertainties were classified as measured. Ahafo Complex Ghana Technical Report Summary Date: February 2026 Page 11-6 11.10 Reasonable Prospects of Economic Extraction 11.10.1 Input Assumptions For each resource estimate, an initial assessment was undertaken that assessed likely infrastructure, mining, and process plant requirements; mining methods; process recoveries and throughputs; environmental, permitting, and social considerations relating to the proposed mining and processing methods, and proposed waste disposal, and technical and economic considerations in support of an assessment of reasonable prospects of economic extraction. Mineral resources considered potentially amenable to open pit mining methods are reported within a Lerchs–Grossmann pit shell that uses the parameters set out in Table 11-2 (Ahafo South) and Table 11-3 (Ahafo North). Table 11-2: Input Parameters, Ahafo South Open Pits Parameters Oxidation State Units Awonsu Apensu South Gold price — US$/oz 2,300 2,300 Royalty rate — % 6 5 Refinery and carbon handling — US$/oz 3.24 3.24 Discount rate — % — — Mining cost Saprolite US$/t mined 4.38 4.64 Transition + fresh rock US$/t mined 5.63 5.88 Mining cost incremental Saprolite US$/t mined/bench 0.03 0.03 Transition + fresh rock US$/t mined/bench 0.03 0.03 Waste rehabilitation cost — US$/t mined 0.12 0.12 Process and general and administrative costs Saprolite US$/t processed 24.57 24.57 Transition + fresh rock US$/t processed 29.86 29.12 Metallurgical recovery Saprolite % 96 96 Transition + fresh rock % 87 86 Pit slope angles (IRA) Saprolite + transition degrees 30 30 Fresh rock footwall degrees 41 45 Fresh rock hanging wall degrees 41 50 Cut-off grades Saprolite g/t Au 0.37 0.36 Transition + fresh rock g/t Au 0.52 0.49 Ahafo Complex Ghana Technical Report Summary Date: February 2026 Page 11-7 Table 11-3: Input Parameters, Ahafo North Open Pits Parameters Oxidation State Units Subenso South Teekyere West Susuan Yamfo South Subenso North Yamfo North Yamfo Central Gold price — US$/oz 2,300 2,300 2,300 2,300 2,300 2,300 2,300 Royalty rate — % 5 5 5 5 5 5 5 Refinery and carbon handling — US$/oz 3.24 3.24 3.24 3.24 3.24 3.24 3.24 Discount rate — % — — — — — — — Mining cost Saprolite US$/t mined 3.51 3.54 3.71 3.62 3.74 3.47 3.62 Transition + fresh rock US$/t mined 4.17 4.42 4.33 5.27 4.30 3.96 5.27 Mining cost incremental Saprolite US$/t mined/bench 0.01 0.01 0.02 0.01 0.01 0.01 0.01 Transition + fresh rock US$/t mined/bench 0.01 0.01 0.01 0.01 0.01 0.01 0.01 Waste rehabilitation cost — US$/t mined 0.12 0.12 0.12 0.12 0.12 0.12 0.12 Process & G&A costs Saprolite US$/t processed 31.95 31.95 32.09 32.98 32.18 32.09 32.53 Transition + fresh rock US$/t processed 37.05 34.62 36.44 38.09 37.68 36.47 36.86 Metallurgical recovery Saprolite % 93 93 93 94 94 94 94 Transition + fresh rock % 86 84 90 86 87 92 86 Pit slope angles (IRA) Saprolite + transition degrees 30 30 30 30 30 30 30 Fresh rock footwall degrees 47 47 47 47 47 42 47 Fresh rock hanging wall degrees 51 51 51 51 51 51 51 Ahafo Complex Ghana Technical Report Summary Date: February 2026 Page 11-8 Parameters Oxidation State Units Subenso South Teekyere West Susuan Yamfo South Subenso North Yamfo North Yamfo Central Cut-off grades Saprolite g/t Au 0.49 0.49 0.49 0.50 0.49 0.49 0.50 Transition + fresh rock g/t Au 0.61 0.59 0.58 0.63 0.62 0.56 0.61


Ahafo Complex Ghana Technical Report Summary Date: February 2026 Page 11-9 Variable incremental cut-off grades for Ahafo South range from 0.36–0.37 g/t Au in saprolite to 0.49–0.52 g/t Au in transition/fresh material were used in the inputs. Ahafo North’s cut-off grades range from 0.49–0.50 g/t Au in saprolite to 0.63–0.71 g/t Au in transition/fresh material. Mineral resources considered potentially amenable to underground mining methods are reported within underground stope designs, using the parameters in (Table 11-4). Variable incremental cut-off grades that range from 1.8–2.2 g/t Au were used in the inputs. Table 11-4: Input Parameters, Underground Economic Parameters Zone Units Apensu Deeps Subika Gold price — US$/oz 2,300 2,300 Royalty rate — % 5.0 7.0 Refinery and carbon handling — US$/oz 3.24 3.24 Discount rate — % 0 0 Mining cost — US$/t mined 65.55 62.89 Process cost — US$/t processed 23.22 20.26 G&A cost — US$/t processed 8.45 8.96 Metallurgical recovery Main zone % 90 — Central zone — 94 North zone 89 94 South zone 90 94 Cut-off grade — g/t Au 2.20 2.40 Note: Metallurgical recovery figure is the percentage used in stope design and differs slightly from the LOM plan percentage assumption. G&A = general and administrative 11.10.2 Commodity Price Commodity prices used in resource estimation are based on long-term analyst and bank forecasts, supplemented with research by Newmont’s internal specialists. An explanation of the derivation of the commodity prices is provided in Chapter 16.2. The estimated timeframe used for the price forecasts is the 19-year cash flow forecast that supports the mineral resource and mineral reserve estimates. 11.10.3 Cut-off The mineral resources are reported at varying cut-off grades, which are based primarily on the material type being mined, and the mining method. Process and general and administrative costs are based on the assumption that all material is treated through either the Ahafo South or Ahafo North process plants, and that the costs vary by material type. Ahafo Complex Ghana Technical Report Summary Date: February 2026 Page 11-10 11.10.4 QP Statement The QP is of the opinion that any issues that arise in relation to relevant technical and economic factors likely to influence the prospect of economic extraction can be resolved with further work. The mineral resource estimates are performed for deposits that are in a well-documented geological setting; the district has seen nearly two decades of active open pit operations and four years of underground mining operations conducted by Newmont; Newmont is familiar with the economic parameters required for successful operations in the Ahafo area; and Newmont has a history of being able to obtain and maintain permits, social license and meet environmental standards in Ghana. There is sufficient time in the 19-year timeframe considered for the commodity price forecast for Newmont to address any issues that may arise, or perform appropriate additional drilling, testwork and engineering studies to mitigate identified issues with the estimates. 11.11 Mineral Resource Statement Mineral resources are reported using the mineral resource definitions set out in SK1300, and are reported in situ. Mineral reserves are reported on a 100% basis. The Government of Ghana has a 10% free- carried interest in the Project. Newmont has a 90% interest. Mineral resources are current as at December 31, 2025. Mineral resources are reported exclusive of those mineral resources converted to mineral reserves. Mineral resources that are not mineral reserves do not have demonstrated economic viability. The measured and indicated mineral resource estimates for Ahafo South are provided in Table 11-5. The inferred mineral resource estimates are included in Table 11-6. The measured and indicated mineral resource estimates for Ahafo North are provided in Table 11-7. The inferred mineral resource estimates are included in Table 11-8. The measured and indicated mineral resource estimates for the total Ahafo Complex are provided in Table 11-9. The inferred mineral resource estimates are included in Table 11-10. These tables are not additive to Table 11-5, Table 11-6, Table 11-7 and Table 11-8. Ahafo Complex Ghana Technical Report Summary Date: February 2026 Page 11-11 Table 11-5: Ahafo South Measured and Indicated Mineral Resource Statement Area Measured Mineral Resources Indicated Mineral Resources Measured and Indicated Mineral Resources Tonnage (x 1,000 t) Grade (g/t Au) Cont. Gold (x 1,000 oz) Tonnage (x 1,000 t) Grade (g/t Au) Cont. Gold (x 1,000 oz) Tonnage (x 1,000 t) Grade (g/t Au) Cont. Gold (x 1,000 oz) Awonsu — — — 3,700 0.55 100 3,700 0.55 100 Apensu 1,000 1.13 0 1,300 1.18 100 2,400 1.16 100 Ahafo South Open Pit Total 1,000 1.13 0 5,000 0.72 100 6,100 0.79 200 Subika Underground 1,200 3.69 100 16,200 3.60 1,900 17,400 3.61 2,000 Apensu Deeps — — — 25,100 4.00 3,200 25,100 4.00 3,200 Ahafo South Underground Total 1,200 3.69 100 41,400 3.84 5,100 42,500 3.84 5,200 Ahafo South Stockpile — — — — — — — — — Ahafo South Total 2,200 2.49 200 46,400 3.51 5,200 48,600 3.46 5,400 Ahafo Complex Ghana Technical Report Summary Date: February 2026 Page 11-12 Table 11-6: Ahafo South Inferred Mineral Resource Statement Area Inferred Mineral Resources Tonnage (x 1,000 t) Grade (g/t Au) Cont. Gold (x 1,000 oz) Awonsu 3,200 1.1 100 Apensu 100 1.1 0 Ahafo South Open Pit Total 3,200 1.1 100 Subika Underground 6,200 3.3 700 Apensu Deeps 13,300 2.8 1,200 Ahafo South Underground Total 19,500 2.9 1,800 Ahafo South Stockpile — — — Ahafo South Total 22,700 2.7 2,000


Ahafo Complex Ghana Technical Report Summary Date: February 2026 Page 11-13 Table 11-7: Ahafo North Measured and Indicated Mineral Resource Statement Area Measured Mineral Resources Indicated Mineral Resources Measured and Indicated Mineral Resources Tonnage (x 1,000 t) Grade (g/t Au) Cont. Gold (x 1,000 oz) Tonnage (x 1,000 t) Grade (g/t Au) Cont. Gold (x 1,000 oz) Tonnage (x 1,000 t) Grade (g/t Au) Cont. Gold (x 1,000 oz) Yamfo Central 700 1.96 0 2,800 1.40 100 3,600 1.51 200 Yamfo Northeast 400 0.79 0 400 0.87 0 800 0.83 0 Yamfo South/Line 10 1,100 1.16 0 5,900 1.54 300 7,000 1.48 300 Subenso South 3,000 1.52 100 22,700 1.84 1,300 25,600 1.80 1,500 Subenso North 200 1.76 0 1,300 2.09 100 1,500 2.05 100 Susuan 100 0.73 0 200 0.74 0 300 0.73 0 Teekyere West 1,100 1.34 0 3,000 1.70 200 4,100 1.60 200 Ahafo North Open Pit Total 6,600 1.44 300 36,300 1.74 2,000 42,900 1.69 2,300 Ahafo North Stockpile — — — — — — — — — Ahafo North Total 6,600 1.44 300 36,300 1.74 2,000 42,900 1.69 2,300 Ahafo Complex Ghana Technical Report Summary Date: February 2026 Page 11-14 Table 11-8: Ahafo North Inferred Mineral Resource Statement Area Inferred Mineral Resources Tonnage (x 1,000 t) Grade (g/t Au) Cont. Gold (x 1,000 oz) Yamfo Central 2,900 1.3 100 Yamfo Northeast 300 1.0 0 Yamfo South/Line 10 3,600 1.5 200 Subenso South 9,200 1.7 500 Subenso North 300 1.5 0 Susuan 400 1.8 0 Teekyere West 1,400 2.0 100 Ahafo North Open Pit Total 18,100 1.6 900 Ahafo North Stockpile — — — Ahafo North Total 18,100 1.6 900 Ahafo Complex Ghana Technical Report Summary Date: February 2026 Page 11-15 Table 11-9: Ahafo Complex Measured and Indicated Mineral Resource Statement Area Measured Mineral Resources Indicated Mineral Resources Measured and Indicated Mineral Resources Tonnage (x 1,000 t) Grade (g/t Au) Cont. Gold (x 1,000 oz) Tonnage (x 1,000 t) Grade (g/t Au) Cont. Gold (x 1,000 oz) Tonnage (x 1,000 t) Grade (g/t Au) Cont. Gold (x 1,000 oz) Ahafo South Open Pit 1,000 1.13 0 5,000 0.72 100 6,100 0.79 200 Ahafo South Underground 1,200 3.69 100 41,400 3.84 5,100 42,500 3.84 5,200 Ahafo South Stockpiles — — — — — — — — — Ahafo South Subtotal 2,200 2.49 200 46,400 3.51 5,200 48,600 3.46 5,400 Ahafo North Open Pit 6,600 1.44 300 36,300 1.74 2,000 42,900 1.69 2,300 Ahafo North Stockpiles — — — — — — — — — Ahafo North Subtotal 6,600 1.44 300 36,300 1.74 2,000 42,900 1.69 2,300 Ahafo Complex Total 8,700 1.70 500 82,700 2.73 7,300 91,400 2.63 7,700 Open Pits 7,600 1.40 300 41,300 1.61 2,100 48,900 1.58 2,500 Underground 1,200 3.69 100 41,400 3.84 5,100 42,500 3.84 5,200 Stockpiles — — — — — — — — — Ahafo Complex Total 8,700 1.70 500 82,700 2.73 7,300 91,400 2.63 7,700 Ahafo Complex Ghana Technical Report Summary Date: February 2026 Page 11-16 Table 11-10: Ahafo Complex Inferred Mineral Resource Statement Area Inferred Mineral Resources Tonnage (x 1,000 t) Grade (g/t Au) Cont. Gold (x 1,000 oz) Ahafo South Open Pit 3,200 1.1 100 Ahafo South Underground 19,500 2.9 1,800 Ahafo South Stockpiles — — — Ahafo South Subtotal 22,700 2.7 2,000 Ahafo North Open Pit 18,100 1.6 900 Ahafo North Stockpiles — — — Ahafo North Subtotal 18,100 1.6 900 Ahafo Complex Total 40,900 2.2 2,900 Open Pits 21,400 1.5 1,100 Underground 19,500 2.9 1,800 Stockpiles — — — Ahafo Complex Total 40,900 2.2 2,900 Notes to Accompany Mineral Resource Tables: 1. Mineral resources are current as at December 31, 2025. Estimates are reported using the definitions in SK1300. The Qualified Person responsible for the estimate is Mr. Shaun Chanter, RM SME, Head Reserve Governance – Global, a Newmont employee. 2. The reference point for the mineral resource estimate is in situ. 3. Mineral resources are reported on a 100% basis. Newmont holds a 90% interest and the Government of Ghana has a 10% free-carried interest. 4. Mineral resources are reported exclusive of mineral reserves. Mineral resources that are not mineral reserves do not have demonstrated economic viability. 5. Mineral resources that are potentially amenable to open pit mining methods are constrained within a designed pit shell. Mineral resources that are potentially amenable to underground mining methods are constrained within conceptual stope designs. Parameters used are summarized in Table 11-2 and Table 11-3 (open pit) and Table 11-4 (underground). 6. Tonnages are metric tonnes rounded to the nearest 100,000. Gold grade is rounded to the nearest 0.01 gold grams per tonne. Gold ounces are estimates of metal contained in tonnages and do not include allowances for processing losses. Contained (cont.) gold ounces are reported as troy ounces, rounded to the nearest 100,000. 7. Rounding of tonnes and contained metal content as required by reporting guidelines may result in apparent differences between tonnes, grade and contained metal content. In instances where tonnage and grade are presented but metal is shown as “0”, this is due to the metal contained falling below the metal rounding limit. Totals may not sum due to rounding. 8. Table 11-9 and Table 11-10 are not additive to Table 11-5, Table 11-6, Table 11-7, and Table 11-8.


Ahafo Complex Ghana Technical Report Summary Date: February 2026 Page 11-17 11.12 Uncertainties (Factors) That May Affect the Mineral Resource Estimate Areas of uncertainty that may materially impact all of the mineral resource estimates include: • Changes to long-term metal price and exchange rate assumptions; • Changes in local interpretations of mineralization geometry such as pinch and swell morphology, extent of brecciation, presence of unrecognized mineralization off-shoots; faults, dikes, and other structures; and continuity of mineralized zones; • Changes to geological and grade shape, and geological and grade continuity assumptions; • Changes to unfolding, variographical interpretations and search ellipse ranges that were interpreted based on limited drill data, when closer-spaced drilling becomes available; • Changes to metallurgical recovery assumptions; • Changes to the input assumptions used to derive the potentially-mineable shapes applicable to the assumed underground and open pit mining methods used to constrain the estimates; • Changes to the forecast dilution and mining recovery assumptions; • Changes to the cut-off values applied to the estimates; • Variations in geotechnical (including seismicity), hydrogeological and mining method assumptions; • Changes to environmental, permitting, and social license assumptions. To the extent known to the QP, there are no other known environmental, permitting, legal, title related, taxation, socio-political or marketing issues that could materially affect the mineral resource estimate that are not discussed in this Report. Ahafo Complex Ghana Technical Report Summary Date: February 2026 Page 12-1 12.0 MINERAL RESERVE ESTIMATES 12.1 Introduction Measured and indicated mineral resources were converted to mineral reserves. All Inferred blocks are classified as waste in the cash flow analysis that supports mineral reserve estimation. Mineral reserves in the Ahafo South area are estimated for the Subika, Apensu South and Awonsu deposits. Apensu South and Awonsu deposits assuming open pit mining, and for Subika, assuming underground mining. Stockpiled material is also included in the mineral reserves estimates. The Geovia Whittle pit optimization program (Whittle 2022) was used to perform a Lerchs–Grossmann optimization in support of mineral reserves reporting for mineralization amenable to open pit mining methods. A safety crown pillar of 25 m is left between the base of the Subika Phase 4 pit which is depleted and the top of the Subika underground stopes. This pillar will not be mined and thus makes Phase 4 the final open pit limit for the Subika deposit. Mineral reserves in the Ahafo North area are estimated for the Yamfo South, Yamfo Northeast, Susuan, Subenso South, Subenso North and Teekyere West deposits. The Lerchs–Grossmann algorithm in Whittle was used to determine economic mining limits for the different deposits. MineSight MS3D was used to define ultimate pit designs and pit phases based on the Whittle outcomes. MS3D was also used as a primary tool to define outlines for waste rock facilities, stockpiles, and to produce physical features required for mine planning. 12.2 Open Pit Estimates 12.2.1 Pit Optimization For mineral reserves, Newmont applies a time discount factor to the dollar value block model that is generated in the Lerchs–Grossmann pit-limit analysis, to account for the fact that a pit will be mined over a period of years, and that the cost of waste stripping in the early years must bear the cost of the time value of money. In some deposits, where mineralization is uniformly distributed throughout the pit, or where the pit is shallow, discounting has little effect on the economic pit limit. For the Awonsu, Apensu South and Ahafo North deposits, where upper benches contain a high percentage of the waste, and mineralization quantities and/or grade increase with depth, discounting provides a smaller pit limit upon which mine designs are based. Pit discounting is accomplished by running the pit-limit “dollar” model through a program that discounts the dollar model values at a compound rate based on the depth of the block. In this manner, discounting is applied to future costs as well as future revenues, to represent the fact that mining proceeds from the top down within a phase. Optimization work involved floating pit shells at a series of gold prices. The generated nested pit shells were evaluated using the mineral reserve gold price of US$2,000/oz and an 8% discount Ahafo Complex Ghana Technical Report Summary Date: February 2026 Page 12-2 rate. The pit shells with the highest net present value were selected for detailed engineering design work. A realistic schedule was developed in order to determine the optimal pit shell for each deposit; schedule inputs include the minimum mining width, and vertical rate of advance, mining rate, and mining sequence. Whittle analysis indicated a two-stage pit development was the best option for Awonsu, using a minimum mining width of 50 m, and one-stage pit development was optimal for Apensu South. The Ahafo North Whittle analysis indicates staged pit development was appropriate for the majority of the mineral reserve pits. These are shown on the figures included in Chapter 13.3. 12.2.2 Optimization Inputs 12.2.2.1 Ahafo South Operating costs for mining, processing, site, and Accra administration were developed as part of the 2026 business plan (BP26) process. The costs build-up for the LOM in that plan included assumptions based on a number of projected cost-saving measures and efficiency gains. Costs were un-escalated. Input parameters used in the constraining pit shells are summarized in Table 12-1. Geotechnical assumptions are discussed in Chapter 13.2.1. The costs developed as part of the LOM plan were based on a three-shovel mining fleet through to the end of the mine life. Truck and drill quantities were forecast and budgeted during the business planning process based on detailed studies. MineSight’s MSHaulage software was used to generate haulage distances and travel times based on truck field studies and site-based speed tables. The travel times were input into XERAS software, together with the mining and process schedule, to generate the required truck quantities per period. Drill quantities were forecast based on mining rates, pattern size, and pit specific penetration rates. Process costs were determined for each pit and material type (oxide and primary) using BP26 and results of internal studies. The theoretical process cost per tonne was determined for each material type from both the BP26 costs and the forecast ore feed blend. Reclamation and closure costs were estimated based on site environmental calculations. Mine operating costs are sensitive to the cost of diesel fuel. Mineral reserves assume US$0.93/L diesel for Brent pricing as per Newmont’s internal corporate guidance and account for Ghanaian taxes and local delivery. Mill operating costs are sensitive to the cost of electrical power. The mineral reserves assume a power cost of US$0.125 per kWh based on Newmont’s estimate of long-term power costs. An average profile of 27 Mt/a mined and processing rates of 10 Mt were used for Ahafo South. Ahafo Complex Ghana Technical Report Summary Date: February 2026 Page 12-3 Table 12-1: Pit Design Assumptions, Ahafo South Parameters Oxidation Units Apensu South Awonsu Gold price US$/oz 2,000 2,000 Royalty rate % 5 6 Royalty US$/oz 100 120 Refinery and carbon handling US$/oz 3.24 3.24 Discount rate % 8 8 Mining cost Saprolite US$/t mined 4.64 4.38 Transition + fresh rock US$/t mined 5.88 5.63 Mining cost incremental Saprolite US$/t mined/bench 0.03 0.03 Transition + fresh rock US$/t mined/bench 0.03 0.03 Waste rehabilitation cost US$/t mined 0.12 0.12 Process & G&A cost Saprolite US$/t processed 24.57 24.57 Transition + fresh rock US$/t processed 29.12 29.86 Metallurgical recovery Saprolite % 96 96 Transition + fresh rock % 84 84 Pit slope angles (IRA) Saprolite + transition degrees 28 27 Fresh rock footwall degrees 44 41 Fresh rock hanging wall degrees 36 45 Cut-off grade Saprolite g/t 0.41 0.42 Transition/primary g/t 0.56 0.59 Note: G&A = general and administrative, IRA = inter-ramp angle


Ahafo Complex Ghana Technical Report Summary Date: February 2026 Page 12-4 12.2.2.2 Ahafo North Input parameters used in pit designs are summarized Table 12-2. Geotechnical parameters are discussed in Chapter 13.3.1. The mining unit cost was calculated separately for each pit at Ahafo North to account for the variation in the distance for hauling from each mining phase to the process plant, stockpile, or nearest waste rock facility. Mining unit costs for pit designs were based on the BP26 budget assumptions and represent the average LOM operating costs, including sustaining capital for mine operations, mine maintenance and mine technical services functions. Sustaining capital was included for all mining fleets commissioned after the start of production, plus capital for the associated support areas and minor equipment for the Ahafo complex projects. Royalties on production payable to the Ghanaian Government at a 5% rate were used as per the Investment Agreement. A discount rate of 8% was applied to the block value used in the Lerchs–Grosmann pit limit analysis. An average of 8 benches per year of vertical advance was assumed for Ahafo South and 10 benches for Ahafo North. For each deposit, inter-ramp slopes were set for saprolite and transition material at 30° for all azimuths, while primary material was given 47° in the footwall and 51° in the hanging wall. Yamfo Northeast contains the only exception as its footwall slopes in primary material were recommended to use 42°. Slope angles were controlled by zone, using the oxidation model. The overall pit slopes used in the Lerchs–Grosmann analysis were reduced to allow for ramps. Design work for ultimate pit limits focused on fitting the designs close to ‘optimum’ pit shells, while allowing for access roads, smoothed walls, and adequate safe operating room on all benches. An average profile of 24 Mt/a mined and processing rates of 3.7 Mt were used for Ahafo North. 12.2.3 Ore Loss and Dilution All operating pits at Ahafo South are mined on 8 m benches. Block models for Apensu South and Awonsu assume 12 x 12 x 8 m block dimensions. Ahafo North pits are mined on 6 m benches. Block models are produced using 10 x 10 x 6 m block dimensions to reflect the increased selectivity in ore zones. The block models were developed to incorporate anticipated dilution arising from mining methods, bench height, and other relevant factors, with current mine and process reconciliation supporting these assumptions. No dilution factors were directly applied to the Ahafo South block model; however, a contact dilution script is executed on the model blocks prior to end-of-year reserve and resource estimation to account for dilution or Ahafo North. This approach is adopted as there is insufficient historical data available for Ahafo North. Ahafo Complex Ghana Technical Report Summary Date: February 2026 Page 12-5 Table 12-2: Pit Design Assumptions, Ahafo North Note: G&A = general and administrative, IRA = inter-ramp angle Parameters Oxidation Units Subenso South Teekyere West Susuan Yamfo South Subenso North Yamfo North Gold price — US$/oz 2,000 2,000 2,000 2,000 2,000 2,000 Royalty rate — % 5 5 5 5 5 5 Refinery and carbon handling — US$/oz 3.24 3.24 3.24 3.24 3.24 3.24 Discount rate — % 8 8 8 8 8 8 Mining cost Saprolite US$/t mined 3.49 3.52 3.68 3.60 3.72 3.45 Transition + fresh rock US$/t mined 4.15 4.40 4.31 5.24 4.28 3.94 Mining cost incremental Saprolite US$/t mined/bench 0.01 0.01 0.02 0.01 0.01 0.01 Transition + fresh rock US$/t mined/bench 0.01 0.01 0.01 0.01 0.01 0.01 Waste rehabilitation cost — US$/t mined 0.12 0.12 0.12 0.12 0.12 Process & G&A cost Saprolite US$/t processed 31.21 31.21 31.34 32.23 31.43 31.43 Transition + fresh rock US$/t processed 36.30 33.88 35.69 37.35 36.94 35.72 Metallurgical recovery Saprolite % 94 94 94 94 94 94 Transition + fresh rock % 86 84 90 86 87 92 Pit slope angles (IRA) Saprolite + transition degrees 30 30 30 30 30 30 Fresh rock footwall degrees 47 47 47 47 47 42 Fresh rock hanging wall degrees 51 51 51 51 51 51 Cut-off grade Saprolite g/t 0.54 0.54 0.54 0.56 0.55 0.54 Transition/primary g/t 0.68 0.65 0.65 0.71 0.69 0.63 Ahafo Complex Ghana Technical Report Summary Date: February 2026 Page 12-6 12.3 Underground Estimates 12.3.1 Mining Zones The underground mining operations are split into two areas: • The Upper mining zone, above the 840 relative level (RL); also referred to as the upper Yoda area; • The Central mining zone (corridor) below the 840 RL; also referred to as the Central area. 12.3.2 Stope Designs The mine plan assumes use of two different mining methods: • Sub-level shrinkage (SLS); • Long-hole open stoping (LHOS). Stope designs for underground operations are based on the parameters in Table 12-3. Additional input parameters to the underground mineral reserves estimate are shown in Table 12-4. Chapter 13.3 provides details on mine designs and cut-off grades. A 25 m thick crown pillar will be left between the base of the Subika open pit, and the underground operations. An exclusion zone was created for the region under the final pit shape. Stopes within the exclusion zone that could not be adequately supported with additional ground support were removed from the mine plan. Stopes were created using Deswik Stope Optimizer software at the required stope height, length and cut-off criteria based on the mine area. The stope widths depend on the stope cut-off and dilution (over-break) added to stope design, and the mining method used. Ahafo Complex Ghana Technical Report Summary Date: February 2026 Page 12-7 Table 12-3: Stope Design Parameters, Subika Underground Parameter Unit SLS LHOS Stoping incremental cut-off g/t Au 1.5 1.5 Dilution hanging wall m 0 0.5 Dilution footwall m 0 0 Dilution development % 12 12 Stope width minimum m 15 5 Stope width maximum m 15 35 Level spacing LHOS m 25 25 Min stope length m 15 >15 Max stope length (excluding pillar) m 60 40 Stope-pillar extraction % — 0 Minimum pillar ratio ratio — 1:3 Fill assumption % 65 70 Pillar lengths m — 20–35 Crown pillar m approx 50 approx 30 Footwall angle degrees 100 110 Hanging wall angle degrees 70 70 Minimum pillar between stopes m 0 20 Stope recovery % 90 90 Mill recovery % 94 94 Note: LHOS = long-hole open stoping , SLS = sub-level shrinkage Table 12-4: Input Parameters, Subika Underground Economic Parameters Units Values Gold price US$/oz 2,000 Royalty rate % 5 Refinery and carbon handling US$/oz 3.24 Discount rate % 8 Mining cost US$/t mined 62.32 Process cost US$/t processed 20.26 G&A cost + site sustaining US$/t processed 8.96 Cut-off grade g/t Au LHOS 1.7; SLS 1.8 Note: G&A = general and administrative.


Ahafo Complex Ghana Technical Report Summary Date: February 2026 Page 12-8 12.3.3 Ore Loss and Dilution A stope recovery of 90% is expected in the LHOS mining areas and the SLS is 100% based on the fixed draw strategy. Dilution is projected to average of 10% for LHOS and 22% for the SLS area. 12.4 Stockpiles Stockpile estimates were based on mine dispatch data; the grade comes from closely-spaced blasthole sampling and tonnage sourced from truck factors. The stockpile volumes were typically updated based on monthly surveys. The average grade of the stockpiles was adjusted based on the material balance to and from the stockpile. 12.5 Commodity Prices Commodity prices used in mineral reserve estimation are based on long-term analyst and bank forecasts, supplemented with research by Newmont’s internal specialists. The estimated timeframe used for the price forecasts is overall 19-year mine life for the Ahafo Complex. 12.6 Mineral Reserve Statement Mineral reserves have been classified using the mineral reserve definitions set out in SK1300. The reference point for the mineral reserve estimate is the point of delivery to the process facilities. Mineral reserves are reported on a 100% basis. The Government of Ghana has a 10% free- carried interest in the Project. Newmont has a 90% interest. Mineral reserves are reported in Table 12-5 (Ahafo South), Table 12-6 (Ahafo North) and Table 12-7 (Ahafo Complex) and are current as at December 31, 2025. Table 12-7 is not additive to Table 12-5 and Table 12-6. Tonnages in the table are metric tonnes. Mineral reserves are reported using the mineral reserve definitions set out in SK1300. Ahafo Complex Ghana Technical Report Summary Date: February 2026 Page 12-9 Table 12-5: Ahafo South Proven and Probable Mineral Reserve Statement Area Proven Mineral Reserves Probable Mineral Reserves Proven and Probable Mineral Reserves Tonnage (x 1,000 t) Grade (g/t Au) Cont. Gold (x 1,000 oz) Tonnage (x 1,000 t) Grade (g/t Au) Cont. Gold (x 1,000 oz) Tonnage (x 1,000 t) Grade (g/t Au) Cont. Gold (x 1,000 oz) Awonsu — — — 39,600 1.49 1,900 39,600 1.49 1,900 Apensu 2,500 1.16 100 1,300 1.17 0 3,800 1.17 100 Ahafo South Open Pit Total 2,500 1.16 100 40,900 1.48 1,900 43,400 1.46 2,000 Subika Underground 9,400 2.51 800 10,000 2.23 700 19,400 2.37 1,500 Apensu Deeps — — — — — — — — — Ahafo South Underground Total 9,400 2.51 800 10,000 2.23 700 19,400 2.37 1,500 Ahafo South Stockpile Total 18,500 0.94 600 — — — 18,500 0.94 600 Ahafo South Total 30,400 1.44 1,400 50,900 1.63 2,700 81,300 1.56 4,100 Ahafo Complex Ghana Technical Report Summary Date: February 2026 Page 12-10 Table 12-6: Ahafo North Proven and Probable Mineral Reserve Statement Area Proven Mineral Reserves Probable Mineral Reserves Proven and Probable Mineral Reserves Tonnage (x 1,000 t) Grade (g/t Au) Cont. Gold (x 1,000 oz) Tonnage (x 1,000 t) Grade (g/t Au) Cont. Gold (x 1,000 oz) Tonnage (x 1,000 t) Grade (g/t Au) Cont. Gold (x 1,000 oz) Yamfo Central — — — — — — — — — Yamfo Northeast — — — 4,900 1.88 300 4,900 1.88 300 Yamfo South/Line 10 — — — 9,300 1.84 500 9,300 1.84 500 Subenso South — — — 24,100 2.43 1,900 24,100 2.43 1,900 Subenso North — — — 3,200 2.47 300 3,200 2.47 300 Susuan — — — 10,500 2.21 700 10,500 2.21 700 Teekyere West — — — 12,600 2.30 900 12,600 2.30 900 Ahafo North Open Pit Total — — — 64,600 2.24 4,700 64,600 2.24 4,700 Ahafo North Stockpile — — — 900 1.29 0 900 1.29 0 Ahafo North Total — — — 65,500 2.23 4,700 65,500 2.23 4,700 Ahafo Complex Ghana Technical Report Summary Date: February 2026 Page 12-11 Table 12-7: Ahafo Complex Proven and Probable Mineral Reserve Statement Area Proven Mineral Reserves Probable Mineral Reserves Proven and Probable Mineral Reserves Tonnage (x 1,000 t) Grade (g/t Au) Cont. Gold (x 1,000 oz) Tonnage (x 1,000 t) Grade (g/t Au) Cont. Gold (x 1,000 oz) Tonnage (x 1,000 t) Grade (g/t Au) Cont. Gold (x 1,000 oz) Ahafo South Open Pit 2,500 1.16 100 40,900 1.48 1,900 43,400 1.46 2,000 Ahafo South Underground 9,400 2.51 800 10,000 2.23 700 19,400 2.37 1,500 Ahafo South Stockpiles 18,500 0.94 600 — — — 18,500 0.94 600 Ahafo South Subtotal 30,400 1.44 1,400 50,900 1.63 2,700 81,300 1.56 4,100 Ahafo North Open Pit — — — 64,600 2.24 4,700 64,600 2.24 4,700 Ahafo North Stockpiles — — — 900 1.29 0 900 1.29 0 Ahafo North Subtotal — — — 65,500 2.23 4,700 65,500 2.23 4,700 Ahafo Complex Total 30,400 1.44 1,400 116,500 1.97 7,400 146,900 1.86 8,800 Open Pits 2,500 1.16 100 105,500 1.95 6,600 108,000 1.93 6,700 Underground 9,400 2.51 800 10,000 2.23 700 19,400 2.37 1,500 Stockpiles 18,500 0.94 600 900 1.29 0 19,500 0.96 600 Ahafo Complex Total 30,400 1.44 1,400 116,500 1.97 7,400 146,900 1.86 8,800 Notes to Accompany Mineral Reserves Tables: 1. Mineral reserves are current as at December 31, 2025. Mineral reserves are reported using the definitions in SK1300. The Qualified Person responsible for the estimate is Mr. Shaun Chanter, RM SME, Head Reserve Governance – Global, a Newmont employee. 2. The reference point for the mineral reserve estimates is the point of delivery to the process plant. 3. Mineral reserves are reported on a 100% basis. Newmont holds a 90% interest and the Government of Ghana has a 10% free-carried interest. 4. Mineral reserves that are estimated using open pit mining methods are constrained within a pit design based on an optimized Lerchs–Grossmann pit shell. Parameters used are shown in Table 12-1 and Table 12-2 for the open pit mineral reserves and Table 12-3 and Table 12-4 for the underground mineral reserves. 5. Tonnages are metric tonnes rounded to the nearest 100,000. Gold grade is rounded to the nearest 0.01 gold grams per tonne. Gold ounces are estimates of metal contained in tonnages and do not include allowances for processing losses. Contained (cont.) gold ounces are reported as troy ounces, rounded to the nearest 10,000. 6. Rounding of tonnes and contained metal content as required by reporting guidelines may result in apparent differences between tonnes, grade and contained metal content. In instances where tonnage and grade are presented but metal is shown as “0”, this is due to the metal contained falling below the metal rounding limit. Totals may not sum due to rounding. 7. Table 12-7 is not additive to Table 12-5 and Table 12-6.


Ahafo Complex Ghana Technical Report Summary Date: February 2026 Page 12-12 12.7 Uncertainties (Factors) That May Affect the Mineral Reserve Estimate Areas of uncertainty that may materially impact all of the mineral reserve estimates include: • Changes to long-term metal price and exchange rate assumptions; • Changes to metallurgical recovery assumptions; • Changes to the input assumptions used to derive the mineable shapes applicable to the assumed underground and open pit mining methods used to constrain the estimates; • Changes to the forecast dilution and mining recovery assumptions; • Changes to the cut-off values applied to the estimates; • Variations in geotechnical (including seismicity), hydrogeological and mining method assumptions; • Changes to environmental, permitting, and social license assumptions. There are no other known environmental, legal, title, taxation, socioeconomic, marketing, political or other relevant factors known to the QP that would materially affect the estimation of mineral reserves that are not discussed in this Report. Ahafo Complex Ghana Technical Report Summary Date: February 2026 Page 13-1 13.0 MINING METHODS 13.1 Introduction Open pit mining is conducted using conventional techniques and an Owner-operated conventional truck and shovel fleet. Underground mining is currently conducted using conventional stoping methods, and conventional mechanized equipment. Underground mining is conducted by a contractor. 13.2 Ahafo South Open Pits 13.2.1 Geotechnical Considerations Open pit design uses defined geotechnical domains together with rock mass quality ratings for the principal lithologies and appropriate pit design criteria that reflect expected conditions and risk. Inter-ramp angles vary by deposit and pit wall lithology, and range from 30–55º (Table 13-1). Table 13-1: Pit Geotechnical Design Parameters Pit Rock Type Slope Direction (º) Inter Ramp Angle (º) Bench Face Angle (º) Berm Width (m) Bench Height (m) Ramp Width (m) Ramp Gradient (%) Awonsu Oxide 0–360 30 65 10 8 30 10 Primary graphite/metavolcanic 38–220 FW 41 55 7 16 30 10 Primary GVM 38–220 FW 41 55 7 16 30 10 Cataclasites/mylonites 38–220 FW 41 55 7 16 30 10 Primary 220–37 HW 41 55 7 16 30 10 Apensu South Oxide 0–360 30 65 10 8 30 10 Metasediments 38–220 FW 45 65 8.5 16 30 10 Foliated rocks 38–220 FW 45 65 8.5 16 30 10 Granodiorite 220–37 HW 50 80 17.2 24 30 10 Note: GVM = mylonitized volcanic–granitoid; FW = footwall; HW = hanging wall Both Newmont’s Geotechnical Engineering Department and external consultants have completed geotechnical studies and provided the geotechnical recommendations that form the basis for pit designs. A ground control management plan was developed, and is updated on an annual basis. Ahafo Complex Ghana Technical Report Summary Date: February 2026 Page 13-2 13.2.2 Hydrogeological Considerations Pit dewatering uses a combination of perimeter and in-pit dewatering wells, in-pit sumps, and horizontal drains. A network of monitoring piezometers is installed around all of the operating pits. 13.2.3 Operations The Ahafo South open pit LOM plan currently envisages mining at an average rate of approximately 24 Mt/a for seven years and peaking at 32.5 Mt/a in 2026 with a maximum rate of advance by pit stage of eight benches per annum. The open pit mine life will extend to 2032 with Awonsu phase 4 mining ending in 2031 whilst Apensu South commences in 2029 and ends in 2032. Underground mining and Milling will cease in 2034 after treatment of stockpiled ore and Subika Underground material. A final pit layout plan showing the pit phases for each of the Ahafo South open pits is provided in Figure 13-1. Pit design assumptions include haul road widths for two-way travel of 30 m, maximum ramp grades of 10% and minimum pit-bottom widths of 30 m in deep pits as a safety measure. In selected pit-bottom benches where good grades are located, the haul road widths are reduced to 21 m wide one-way traffic to allow for maximum mining recovery. 13.2.4 Grade Control, Blasting and Explosives Production drilling and blasting for the open pits is conducted on 8 m benches with a subdrill of 1.2 m, using a 165 mm diameter bit. The pattern for production drilling is 4.2 x 4.8 m in both ore and waste, with powder factors varying by material type and geological conditions. Bulk emulsion is loaded into both production and buffer holes; the stemming length varies according to rock type and other geologic conditions but it is generally at 3.5 m. Pre-splitting is conducted on all pit wall areas with power-split explosives supplied by the explosives provider, Orica. Samples from blast hole drilling in the open pit are analyzed and assay results used to generate grade control polygons that are demarcated on the ground for ore and waste zone mining. Ahafo Complex Ghana Technical Report Summary Date: February 2026 Page 13-3 Figure 13-1: Final Pit Layout Plan, Ahafo South Note: Figure prepared by Newmont, 2025.


Ahafo Complex Ghana Technical Report Summary Date: February 2026 Page 13-4 13.2.5 Equipment All Ahafo South open pit equipment is Owner-operated and owned. An equipment summary is provided in Table 13-2. Table 13-2: Equipment List, Ahafo South Item/Purpose Equipment Type Peak Number Production drills D45KS 7 Presplit drills D560 3 Production shovels Liebr9400 4 Haul trucks CAT 785C 29 Graders CAT16H&M 5 Loaders CAT 992K&G 5 13.2.6 Personnel The life-of-mine (LOM) workforce requirements estimate that approximately 473 personnel will be required to sustain the Ahafo South open pit mining operations. Ahafo Complex Ghana Technical Report Summary Date: February 2026 Page 13-5 13.3 Ahafo North Open Pits 13.3.1 Geotechnical Considerations For each pit, the design sectors consisted of the oxide sequence, primary rock footwall, and primary rock hanging wall and end-walls. Since mineralization occurs in the immediate hanging wall of the large-scale faults, the Ahafo North open pits will have relatively long hanging wall and footwall slopes aligned with the faults; and tight end-walls. The faults and the foliation represent potential structural controls that need to be considered in the pit slope designs, particularly for the primary rocks (note that relict structure can also affect slope performance in the oxide sequence, but this aspect is less of a concern because of flatter inter-ramp angles). Foliation will be in- dipping along the footwall slopes, and presents a potential control of achievable bench configurations. To account for the tendency for bench faces to break back to foliation, design bench face angles for most pits were defined at 65.3° for footwall slopes, and bench widths at 8.5 m (Table 13-3). Table 13-3: Pit Design Geotechnical Assumptions, Ahafo North Pit Rock Type Slope Direction (º) Inter Ramp Angle (º) Bench Face Angle (º) Berm Width (m) Bench Height (m) Ramp Width (m) Ramp Gradient (%) Subenso South Oxide 0–360 30 53.8 6 6 30 10 Primary 65–245 FW 47 65.3 8.5 18 30 10 Primary 65–245 HW 51 70 8 18 30 10 Teekyere West) Oxide 0.–360 30 53.8 6 6 30 10 Primary 55–235 FW 47 65.3 8.5 18 30 10 Primary 55–235 HW 51 70 8 18 30 10 Susuan (SU) Oxide 0–360 30 53.8 6 6 30 10 Primary 45–225 FW 47 65.3 8.5 18 30 10 Primary 45–225 HW 51 70 8 18 30 10 Yamfo South Oxide 0–360 30 53.8 6 6 30 10 Primary 50–235 FW 47 65.3 8.5 18 30 10 Primary 50–235 HW 51 70 8 18 30 10 Subenso North Oxide 0–360 30 53.8 6 6 30 10 Primary 75–245 FW 47 65.3 8.5 18 30 10 Primary 75–245 HW 51 70 8 18 30 10 Yamfo North Oxide 0–360 30 53.8 6 6 30 10 Primary 40–220 FW 42 50 5 18 30 10 Primary 40–220 HW 51 70 8 18 30 10 Ahafo Complex Ghana Technical Report Summary Date: February 2026 Page 13-6 Exceptions were: • Yamfo Northeast: the design bench face angle was defined at 50° to correspond with foliation. With an expected primary rock exposure height of about 40 m, a narrower 5 m catch bench width was used; • Subenso North: the 65° design bench face angle, and 8.5 m catch benches were applied in the footwall design for primary rock. However, this design bench face angle will undercut foliation, and some breakage along foliation will occur. This will reduce bench face angles in the primary rock exposures in the footwall slope where open fractures occur along foliation. However, with limited 30–35 m vertical exposure of primary rock, and some flexibility in the design [e.g., to the catch bench width, the provision of a 10 m step-out at the base of the saprolite, or to the ramp width], a relatively steep bench configuration was considered to be acceptable. In hanging wall and end-wall slopes, 70° bench face angles and 8 m benches were used for primary rock exposures in all pits. These parameters were selected based on a lack of structural control indicated in the oriented core data and a lack of significant structural control in these walls in the existing Ahafo South open pits. 13.3.2 Hydrogeological Considerations All of the proposed pits at Ahafo North are planned to extend below the pre-mining groundwater table; therefore, dewatering will be required during pit development. Given the limited effectiveness expected of dewatering wells, a network of in-pit sumps is the dewatering strategy that that will be employed. Inflows will vary between individual pits, with the mining depth below the original rest water level typically the key driver. In general, groundwater inflow rates per pit are expected to be very low and perhaps even absent at the Yamfo South pits. Inflow rates are generally expected to range from 10–20 L/sec in each of the Ahafo North pits, with the Susuan pit likely to have the highest maximum groundwater inflow rate, at approximately 45 L/sec. The low permeability of the oxide sequence and the primary rock will also affect the ability to depressurize pit slopes. For the oxide sequence, horizontal drains or production wells would be expected to have a limited and only localized depressurization effect, and the most pragmatic approach to managing the effects of pore pressures on oxide slope stability is likely a slow vertical advance rate, while mining through the saturated saprolite. Slower vertical advance will allow for pore pressures to dissipate via seepage faces as the pit slopes advance both laterally and with depth. Natural drain-down will also produce limited depressurization of primary rock masses during mining. In-pit water management will require: • Sump, pumps, and booster pumps; • Pipelines from individual pits; Ahafo Complex Ghana Technical Report Summary Date: February 2026 Page 13-7 • A south-to-north pipeline to convey dewatering flows from southern Ahafo North area pits to the north to a water management pond; • Trunk pipeline to collect dewatering flows from individual northern Ahafo North area pits; • Ancillary fleet and personnel to support water management activities. 13.3.3 Operations Pit design parameters are provided in Table 13-4. Pit phases by deposit are provided in Table 13-5. Final pit designs are illustrated in Figure 13-2 to Figure 13-7. Table 13-4: Pit Design Parameters, Ahafo North Parameter Design Bench height 6 m for a single bench configuration in saprolite, and stacked on a triple bench configuration in primary rock Catch bench width 6 m for a single bench height, and 8 m and 8.5 m respectively for hanging wall and footwall triple bench heights. 20 m catch bench shall be placed (e.g., half way up the primary wall) between intermediate pit phases to prevent potential rock falls into lower active mining areas, when two phases are anticipated to be mined simultaneously. A transition berm of 10m wide will be placed at a bench elevation below the saprolite zone and within the transitional material. Ramps 10% maximum grade Haul roads Two-way in-pit haul roads of 30 m, with a 21.4 m running width to accommodate 91-ton class haul trucks. The running road width, excluding a drainage ditch and safety berm, is approximately 3.5 times the truck width. A 21 m width road (includes berms and ditches) will be considered for designs when a one-way road is required. Five benches is considered the maximum number of benches above the pit bottom that can be designed as a single lane road with minimal impact to productivity. Haul roads were located on the hanging wall side of pits, when possible, to enable facing up the ore zone from the hanging wall side. Table 13-5: Pit Phases, Ahafo North Deposit Pit Phases Yamfo South The Yamfo South pit design includes three separate pits, with a small amount of overlap between the SW and SE pits. Yamfo South represents 14% of the total ore tonnes and 11% of the total material planned to be moved from all pits. Yamfo Northeast Yamfo Northeast has one phase. The final ramp primarily approaches ore from the hanging wall side of the pit. Yamfo Northeast represents 7% of the total ore tonnes and 7% of the total material planned to be moved from all pits. Susuan Two phases. The final ramp is mostly within the hanging wall zone, which allows good access to ore faces. Susuan represents 17% of the total ore tonnes and 20% of the total material planned to be moved from all pits.


Ahafo Complex Ghana Technical Report Summary Date: February 2026 Page 13-8 Deposit Pit Phases Subenso South Four phases. The final ramp starts in the footwall zone but mostly approaches ore from the hanging wall side of the pit. Subenso South represents 37% of the total ore tonnes and 32% of the total material planned to be moved from all pits. Subenso North The Subenso North pit design includes one big pit with the advantage to be mined in two stages/phase. Subenso North represents 5% of the total ore tonnes and 7% of the total material planned to be moved from all pits. Teekyere West Four phases. The final ramp starts in the footwall zone, but much of the access was designed as slot ramps to minimize stripping ratio. Teekyere West represents 19% of the total ore tonnes and 20% of the total material planned to be moved from all pits. Figure 13-2: Final Pit Layout, Yamfo South Note: Figure prepared by Newmont, 2025. Ahafo Complex Ghana Technical Report Summary Date: February 2026 Page 13-9 Figure 13-3: Final Pit Layout, Yamfo Northeast Note: Figure prepared by Newmont, 2025. Ahafo Complex Ghana Technical Report Summary Date: February 2026 Page 13-10 Figure 13-4: Final Pit Layout, Susuan Note: Figure prepared by Newmont, 2025. Ahafo Complex Ghana Technical Report Summary Date: February 2026 Page 13-11 Figure 13-5: Final Pit Layout, Subenso South Note: Figure prepared by Newmont, 2025.


Ahafo Complex Ghana Technical Report Summary Date: February 2026 Page 13-12 Figure 13-6: Final Pit Layout, Subenso North Note: Figure prepared by Newmont, 2025. Ahafo Complex Ghana Technical Report Summary Date: February 2026 Page 13-13 Figure 13-7: Final Pit Layout, Teekyere West Note: Figure prepared by Newmont, 2025. Ahafo Complex Ghana Technical Report Summary Date: February 2026 Page 13-14 Mining operations at Ahafo North commenced in 2024, with initial mining activities targeting the Subenso South and Susuan deposits through to the end of 2025. The mine plan schedules continued extraction from the STS deposits—comprising Subenso South, Teekyere West and Susuan—during 2026 and 2027. Subsequent phases of mining will progress into the Yamfo Northeast deposit, followed by development of Yamfo South and Subenso North. Detailed production forecasts and mill feed profiles are presented in Figure 13-8 and Figure 13-9. Figure 13-8: Ahafo North, Open Pit Mine Schedule Note: Figure prepared by Newmont, 2025. YN = Yamfo North, SN = Subenso North, YS = Yamfo South, Su = Susuan, TW = Teekyere West, SS = Subenso South, 0.0 5.0 10.0 15.0 20.0 25.0 30.0 M ill io ns (M t) Total Mined YN SN YS SU TW SS Ahafo Complex Ghana Technical Report Summary Date: February 2026 Page 13-15 Figure 13-9: Ahafo North, Process Schedule Note: Figure prepared by Newmont, 2025. All saprolite material is planned to be processed at the maximum throughput rate, while the throughput rate for primary material is dependent on the percentage of saprolite included in the blend. The maximum throughput rate is 462.5 t/hr. A stockpiling strategy is used. Sufficient capacity was designated at a location near the crusher to accommodate approximately 4 Mt of saprolites and 2.8 Mt of primary rock. 13.3.4 Blasting and Explosives Production drilling and blasting in the open pits are carried out on 6 m high benches with an additional 1.3 m of subdrill using 1 127 mm diameter drill bits and 110 mm bit size for wall control drilling. Blast holes are laid out in a 3.3 m x 3.8 m pattern and 3.5 m x 4 m pattern for ore and waste material respectively, with powder factors adjusted according to rock type and geological conditions. Bulk emulsion explosives are loaded into both production and buffer holes, and the stemming length—which confines the explosive energy—is typically about 2.8 m, varying with 0 0.5 1 1.5 2 2.5 3 3.5 4 2026 2027 2028 2029 2030 2031 2032 2033 2034 2035 2036 2037 2038 2039 2040 2041 2042 2043 2044 2045 M ill io ns (M t) Total Ore Processed at Mill Mine to Mill Stk to Mill Sap Ore to Mill


Ahafo Complex Ghana Technical Report Summary Date: February 2026 Page 13-16 rock characteristics. Controlled pre-splitting is applied to all pit wall faces using power-split products supplied by Orica. 13.3.5 Grade Control At the Ahafo North open pit, systematic blast hole sampling is used for grade control to define ore and waste boundaries before mining. Geologists collect cuttings from the blastholes and send these samples for assay. Results are used to construct detailed grade control models that guide selective mining. 13.3.6 Equipment The primary loading fleet at Ahafo North consist of three 16.5 m3 hydraulic CAT 6030 loading units (one excavator and two front shovels) used to load ore and waste into 91-ton class haul trucks. The haul trucks are used to transport ore and waste from the mining area. Front end loaders (11.5 m3) are used to provide back-up for the hydraulic excavators, but will primarily be dedicated to loading haul trucks from stockpiles and occasionally to directly feed the crusher. One track dozer per prime hydraulic excavator and two track dozers for dump maintenance are used in the mine plan. A total of two rubber-tired dozers were included for duties such as loading area cleanup and haul road patrol. Ancillary equipment will include trackhoes, low bed, articulated trucks, units required to support mine maintenance, supply pit lighting, and generator sets. An equipment list for the key equipment requirements for the Ahafo North LOM is provided in Table 13-6. Table 13-6: Equipment List, Ahafo North Item/Purpose Equipment Type Peak Number Production drills MD6200 4 Presplit drills DP 1500i 3 Production shovels CAT 6030 BH&FS 3 Haul trucks CAT 777 G 24 Graders CAT 16M & 14M 4 Loaders CAT 966FEL, 930K FEL, 992K, 226B 11 13.3.7 Personnel The workforce for mining operations at Ahafo North totals 317 persons. Ahafo Complex Ghana Technical Report Summary Date: February 2026 Page 13-17 13.4 Ahafo South Underground 13.4.1 Geotechnical Considerations Geotechnical data collection is outlined in Chapter 7.4. The baseline geotechnical dataset initially informed the early underground mine designs when long-hole open stoping was the preferred mining method. As mining advanced and a more detailed understanding of the Subika Underground geotechnical environment was developed including elevated and adverse in-situ stress conditions, spatial variability in rock mass quality, the influence of the major principal stress acting obliquely to the orebody, and observed seismic responses led to a reassessment of the mining method. This improved geotechnical knowledge supported the transition to sublevel shrinkage stoping as the more suitable method over long-hole open stoping. Sub-level shrinkage stoping mitigates the key geotechnical risks associated with the initial long-hole open stoping design. A defined transition zone between mining methods was established at approximately 450 m below surface to effectively manage the operational and geotechnical differences between long-hole open stoping and sub-level shrinkage stoping, ensuring a controlled and safe changeover in extraction methodology. As part of these ground control improvements, the support regime within the slot domain was upgraded from static bolts to dynamic bolts to better manage elevated seismicity and high-stress demand, significantly improving energy absorption capacity and excavation resilience. The Emperor mining domain, using the southern Subika sub-level shrinkage stoping mining method, has experienced progressive overbreak of the sill pillar, which acts as a separator between the upper section of the sub-level shrinkage stoping method and the lower section of the open stoping area. The observed deterioration of the sill pillar is attributed to geological structures that were defined and modelled by both Newmont subject matter experts and third-party consultants, BECKEng. Their findings indicate a necessary modification to the mining strategy, allowing for the transition of the Subika open pit as it approaches completion. Consequently, it is recommended to shift the mining operations within the Emperor block from the sub-level shrinkage stoping method to the sub-level caving method, while the Yoda area continues using the sub-level shrinkage stoping mining technique until further evaluations prompt additional recommendations. 13.4.2 Hydrogeological Considerations Groundwater inflows are estimated at 140 L/s, with an additional 25 L/s required for service-water supply to the underground workings. The current Subika dewatering system at the 945 Level pump station provides a design capacity of approximately 120 L/s. The proposed 80 L/s dewatering system at the new 700 Level pump station will manage a portion of the total dewatering demand, with the remaining load handled by the existing 945 Level station. Ahafo Complex Ghana Technical Report Summary Date: February 2026 Page 13-18 13.4.3 Operations Mining levels are based on the mining method to be used, which varies by depth from surface (Table 13-7; Figure 13-10). Table 13-7: Mining Methods Mining Method Interval Comment Sub level shrinkage stoping (SLS) Below 700 RL 20 and 25 m levels. Mined using a top-down mining method. Long-hole open stoping (LHOS) Above 750 RL 25 m levels. Mined using top-down methods. Figure 13-10: Example Level Layout Schematic by Mining Method Note: Figure prepared by Newmont, 2021. Ahafo Complex Ghana Technical Report Summary Date: February 2026 Page 13-19 Stopes in the central mining zone, 800–700 RL, are being mined using the sub-level open stoping mining method through a set of twin spiral declines that were developed off the existing main haulage decline. Level accesses were created off the decline at 25 m intervals to intersect the ore zone. The ore drives were driven to the extents of the defined mining corridor and stoping is being retreated from the end of the orebody towards the accesses. These stopes are being mined top- down. The stopes were mined in panel with the maximum span up to 100 m vertical distance. Stopes were mined using a combination of longitudinal and transverse retreat methods in 25 m sublevels. A section of the mining area on the 800–750 RL will be mined in 50 m panels to increase productivity. Stopes were mucked using a combination of free and remote bogging. The ore on these levels was loaded directly from the mining extraction level to trucks or/and stockpiles, hauled up through a designated(one-way) main decline to surface, and placed on the run-in-mine (RIM) pad. Surface haulage trucks transported material from the RIM pad to the process plant ROM pad. The open stopes were backfilled with unconsolidated rock once the stope panel was completed. The declines were connected via a link drive that acted as a ventilation, escapeway and haulage connection between the two declines. To increase productivity, there was a one-way traffic in and out of the mine with the aid of the two declines and decline links. Below the 725 RL, the access drive from the decline connected to a footwall drive that was offset from the ore zone by 30 m. Stope access drives were driven off the footwall drives to develop the stopes in the mineralized zone. The footwall drives were used for infrastructure to connect ventilation returns, fresh air, sumps, and other infrastructure to support mining on the levels. The second mining method being used was the sub-level shrinkage method. This started from the 680 RL. The mine will totally transition to the sub-level shrinkage mining method in a few years when the open stopes are complete, but currently, the two mining methods are being used together. A 50 m sill pillar was established from the 750–700 RL to separate the two mining methods. The sill pillar houses infrastructure such as the 15 fill passes for backfilling and the geotechnical instrumentation monitors. The first two levels, 680 RL and 660 RL, have 20 m sublevels and from 635 RL, the sublevels are every 25 m. Apart from the 680 RL that is using the longitudinal mining approach, the rest of the levels are/will be mined using the transverse method. Mining commences from the center of the orebody out towards the draw point extremities, thus splitting the mining fronts into two halves. Production rings are being fired adopting the chevron mining pattern. This will ensure the mine achieves multiple mining fronts to maximize production.


Ahafo Complex Ghana Technical Report Summary Date: February 2026 Page 13-20 A structured draw percentage strategy by level was used for the extraction of the blasted material which started from 45% draw in high-grade rings and 30% draw in low-grade rings on the 680 RL. Current plans are to mine two sublevels concurrently due to geotechnical seismicity guidelines. Unconsolidated backfill material are introduced through the fill passes to ensure wall stability and maintain the integrity of the sill pillar. The backfill material is currently being sourced from the underground waste development headings. A final mine layout plan is provided in Figure 13-11. Figure 13-11: Final Underground Mine Layout Plan Note: Figure prepared by Newmont, 2026. EMP = Emperor mining zone; VR = ventilation raise. Grey blocks are mined out. 13.4.4 Ventilation The ventilation system for Subika includes refrigeration, primary and secondary fans and intake and return ventilation raises. The design of the ventilation and cooling systems is based on the mine design and production schedule. Ventilation and cooling requirements are firstly determined by means of first principal calculations considering climate conditions, mining depth, surrounding rock, virgin rock temperature, diesel, and electrical equipment as per the mine design. Design criteria and production assumptions applied to determine heat loads and ventilation requirements are based on best practice principles that comply with Newmont’s internal standards Ahafo Complex Ghana Technical Report Summary Date: February 2026 Page 13-21 and Ghanaian legislation. The installed maximum ventilation capacity at Subika is 1,200 m³/s from surface and underground fan stations. The current operational cooling system at Subika mine consists of two surface cooling stations with the capacity of 14 megawatt cooling (MWc) and 7.0 MWc respectively. The south cooling station is operating at maximum capacity, and the north cooling station is being upgraded to 14 MWc. Provision was made in the original design to accommodate this upgrade. The Subika mine ventilation system has sufficient capacity to adequately ventilate the production plan over the LOM. 13.4.5 Blasting and Explosives The powder factor for both open stopes and the sub-level stoping ranges from 0.4–0.60 kg/t for the production rings. Slot firing powder factors vary. For optimal drilling efficiency a burden of 2.8 m with ring toe spacing of 3.2 m is used for open stopes. The ring burden is 2.5 m for the sub-level shrinkage stopes. Currently the emulsion density is 1.2 g/cm3 with 403 and 406 gassers for up-holes and down-holes respectively. 13.4.6 Ore Control Underground or control drilling is at 12.5 m and 17 m spacing for long-hole open stoping and sub- level shrinkage mining methods respectively, targeting at least two levels ahead of mining. Full core samples generated from the ore control drilling were logged and assayed, and the resultant data together with mapping data from development headings, were used to the build geologic model, which then feeds into the block model constructed for mine production, delineating ore, and waste zones in the process. Ahafo Complex Ghana Technical Report Summary Date: February 2026 Page 13-22 13.4.7 Equipment Table 13-8 summarizes equipment requirements for the LOM plan. Table 13-8: Equipment Requirements, Underground Item/Purpose Peak Number Production drills 4 Jumbos/bolters 6 IT 6 Spraymec 1 Raise borers (Rhino) 1 Load–haul–dump vehicles 6 Underground trucks 15 Normet Charmec 6 Agitator truck 2 Graders 2 13.4.8 Personnel The Subika underground operation will require an estimated 288 personnel. 13.5 Production Schedule The combined open pit and underground production schedule for Ahafo South is provided in Table 13-9. The open pit schedule for Ahafo North is included as Table 13-10 and Table 13-11. The combined open pit and underground schedule for the Ahafo Complex is presented in Table 13-12 and Table 13-13. Table 13-9: Production Schedule, Ahafo South (2026–2034) Item Unit Total 2026 2027 2028 2029 2030 2031 2032 2033 2034 Material mined M tonnes 208.6 34.8 33.2 30.6 32.6 33.2 19.3 3.2 2.2 1.0 Ore processed M tonnes 81.3 10.1 9.8 9.6 9.8 9.8 9.9 9.8 9.8 2.6 Material mined total includes 18.5Mt of initial stockpiles. Ahafo Complex Ghana Technical Report Summary Date: February 2026 Page 13-23 Table 13-10: Production Schedule, Ahafo North (2026–2035) Item Unit Total 2026 2027 2028 2029 2030 2031 2032 2033 2034 2035 Material mined M tonnes 414.9 23.5 23.4 24.0 24.0 24.0 24.0 24.0 24.0 24.0 24.0 Ore processed M tonnes 65.5 3.6 3.7 3.7 3.7 3.7 3.7 3.7 3.7 3.7 3.7 Material mined total includes 1.0Mt of initial stockpiles. Table 13-11: Production Schedule, Ahafo North (2036–2044) Item Unit 2036 2037 2038 2039 2040 2041 2042 2043 2044 Material mined M tonnes 24.0 24.0 24.0 24.0 22.0 22.0 20.0 13.1 2.1 Ore processed M tonnes 3.7 3.4 3.7 3.7 3.4 3.3 2.5 3.4 1.6 Table 13-12: Combined Production Schedule, Ahafo Complex (2026–2035) Item Unit Total 2026 2027 2028 2029 2030 2031 2032 2033 2034 2035 Material mined M tonnes 623.5 58.3 56.6 54.6 56.6 57.2 43.3 27.2 26.2 25.0 24.0 Ore processed M tonnes 146.9 13.7 13.5 13.3 13.5 13.5 13.6 13.5 13.5 6.3 3.7 Material mined total includes 19.5Mt of initial stockpiles. Table 13-13: Combined Production Schedule, Ahafo Complex (2036–2044) Item Unit 2036 2037 2038 2039 2040 2041 2042 2043 2044 Material mined M tonnes 24.0 24.0 24.0 24.0 22.0 22.0 20.0 13.1 2.1 Ore processed M tonnes 3.7 3.4 3.7 3.7 3.4 3.3 2.5 3.4 1.6


Ahafo Complex Ghana Technical Report Summary Date: February 2026 Page 14-1 14.0 PROCESSING AND RECOVERY METHODS 14.1 Process Method Selection The process plant designs were based on a combination of metallurgical testwork, previous study designs and industry standard practices for handling combinations of fresh rock and saprolite. The designs are conventional to the gold industry and has no novel parameters. Debottlenecking and optimization activities were also completed once the Ahafo South mill was operational. Commercial production was declared for the Ahafo North mill in October, 2025. 14.2 Process Plant A summary process flow sheet for the Ahafo South plant is included in Figure 14-1. The flowsheet for the Ahafo North plant is included as Figure 14-2. Ahafo Complex Ghana Technical Report Summary Date: February 2026 Page 14-2 Figure 14-1: Process Flowsheet, Ahafo South Note: Figure prepared by Newmont, 2021. Ahafo Complex Ghana Technical Report Summary Date: February 2026 Page 14-3 Figure 14-2: Process Flowsheet, Ahafo North Note: Figure prepared by Lycopodium, 2018 Ahafo Complex Ghana Technical Report Summary Date: February 2026 Page 14-4 14.3 Plant Design 14.3.1 Ahafo South The process plant started operations in 2006 and was designed to treat 7.5 Mt/a using a blend of 27:73 oxide to primary ore. The plant was expanded in 2019 to treat an additional 3.0 Mt/a of primary ore. The planned throughput for the remaining LOM is projected to vary from 9.8– 10.2 Mt/a (1.200–1,300 t/h), depending on the ore blend from the pits and underground operations. The process route commences with one single-stage primary crushing fed by direct truck dump or front-end loader for crushing of primary ores onto a live crushed stockpile. This material is fed from the live crushed stockpile directly onto the Line 1 semi-autogenous grind (SAG) mill feed conveyor by apron feeder. Line 1 SAG milling is in closed circuit with pebble crushers for scats or pebble crushing. Crushed pebbles scats return to the SAG mill feed conveyor. This is followed by closed-circuit ball milling to a P80 size of 106 µm for Line 1. Line 2 was commissioned in September 2019. The process route commences with one single- stage primary crushing fed by direct truck dump or front-end loader for crushing of primary ores onto a live crushed stockpile. This material is fed from the live crushed stockpile directly onto the Line 2 SAG mill feed conveyor by apron feeder. SAG milling is in closed circuit with a pebble crusher for scats or pebble crushing. Crushed pebbles or scats return to the SAG mill feed conveyor. This is followed by a closed-circuit with cyclones to crush feed to a P80 size of 106 µm. The Line 1 and Line 2 cyclone overflow feed converge and through the trash screens to leach feed thickening. The thickener feed is pumped through 13 carbon-in-leach (CIL) tanks. Cyanide and oxygen are added to the thickener feed for leach. Gold is recovered from leach solution using activated carbon. An 18 t Anglo American Research Laboratory method (AARL) elution circuit is used to strip gold from loaded carbon. Rich solution from the elution circuit reports to the rich solution tank. Electrowinning of rich solution is conducted using stainless-steel cathodes, and the sludge collected from the stainless-steel cathodes is smelted in a furnace to produce doré. A counter-current decantation (CCD) circuit was commissioned in 2008 to recover cyanide from CIL tailings prior to discharge to the TSF. Recovered cyanide is effectively re-used in the CIL circuit and weakly acid-dissociable cyanide (CNWAD) levels in the plant tailings are effectively controlled to ensure discharge limit of 50 ppm CNWAD is not exceeded.


Ahafo Complex Ghana Technical Report Summary Date: February 2026 Page 14-5 14.3.2 Ahafo North ROM ore is delivered by rear-end dump haul trucks and dumped either on the ROM stockpile or directly into the primary crusher feed hopper/ROM bin. The ROM stockpile pad allows for limited feed blending to optimize plant performance. A grizzly is installed on top of the ROM bin to protect the jaw crusher from oversize material. The jaw crusher handles ROM ore with a maximum lump size of approximately 800 mm. A mobile rock breaker is available to break any oversize material that may be dumped onto the grizzly. ROM ore is drawn from the ROM bin at a controlled rate by a variable speed apron feeder and discharged onto a vibrating grizzly. The grizzly oversize reports to the jaw crusher. The crusher product and grizzly undersize discharges onto a reclaimed stockpile via conveyor belt. Crushed material from the stockpile is transported by conveyor at a controlled feeder speed to the SAG mill The grinding circuit consists of a 8 MW variable speed SAG mill operating in a closed circuit with a pebble crusher and a 13 MW variable speed ball mill operating in closed circuit with hydrocyclones. Crushed ore and recycled pebbles are fed to the SAG mill. The SAG mill discharge pebbles are screened out over the trommel screen. Oversize material from the pebble screen, consisting of pebbles and worn steel grinding media, discharges onto the pebble crusher feed conveyor. Screen oversize can also be diverted to the mill drive in sump, as required. The SAG mill pebble screen undersize gravitates to the mill discharge hopper, where it is combined with the ball mill discharge, diluted with process water, and pumped to the classifying hydrocyclone cluster. Classifying hydrocyclone underflow returns to the ball mill for further grinding. The combined cyclone overflow stream gravitates to a vibrating trash screen for debris and tramp metal removal. Trash screen underflow is thickened in a high-rate thickener to recover process water and increase pulp density in the CIL circuit. The feed slurry is de-aerated in the thickener feed box prior to entry into the thickener. Thickener underflow is pumped to the leach feed distribution box. Thickener underflow is capable of being diluted with process water to a selected density set point. Pre-leach thickener underflow is pumped to the CIL circuit. The circuit consists of six CIL tanks. Each tank is fitted with a dual impeller mechanical agitator, and a mechanically-swept, woven wire, intertank screen to retain the carbon. Fresh/regenerated carbon is advanced counter current to the slurry flow by pumping slurry and carbon using recessed impeller pumps installed in each CIL tank. The pump in CIL Tank 1 is used to transfer slurry to the loaded carbon recovery screen mounted above the acid wash column in the elution circuit. The carbon is washed and dewatered on the recovery screen prior to reporting to the acid wash column. The associated slurry and wash water return to CIL Tank 1. The loaded carbon is eluted using Anglo American Research Laboratories (AARL) process followed by electrowinning and smelting. Eluted carbon is regenerated with a 5 kg/hr horizontal kiln prior to discharge back into CIL tank 6 or tank 5. Ahafo Complex Ghana Technical Report Summary Date: February 2026 Page 14-6 The leached slurry discharges from the last CIL tank 6 over a carbon safety screen to ensure that no carbon and gold is lost to tailings. Recovered carbon is collected in the fine carbon bin for disposal, treatment, or return to the circuit dependent upon circumstances. The underflow from the screen is pumped to the CCD thickener feed de-aeration box for cyanide removal. Two high- rate CCD thickeners are used to recover a portion of the cyanide contained in solution for re-use in the process plant as well as reduce the CNWAD levels to <50 ppm before disposal to the TSF. Tailings are pumped by duty/standby single stage variable speed pumps to the TSF. 14.4 Equipment Sizing Design criteria are summarized in Table 14-1 for Ahafo South. The Ahafo South plant equipment is outlined in Table 14-3. Design criteria are summarized in Table 14-2 for Ahafo North, and the plant equipment for Ahafo North is outlined in Table 14-4. Table 14-1: Design Criteria, Ahafo South Process Plant Item Units Saprolite Primary Plant capacity Mt/a 0.2 9.8 Head grade (design) Au g/t 0.85 1.87 Design gold recovery % 95.9 92 Crushing plant availability % 92 92 Mill/CIL availability % 93 93 Bond abrasion index (Ai) 0.34–0.83 0.34–0.83 Bond ball mill work index (BWi) kWh/t 17.4–19.2 17.4–19.2 Grind size (P80) μm 106 106 Installed mill power (SAG + ball) kW 26,000 26,000 Number of CIL tanks 13 13 Total CIL volume m3 42,250 42,250 Calculated CIL residence time h 20.7 20.7 Cyanide consumption kg/t 0.24 0.25 Quicklime consumption kg/t 3.44 0.9 Elution circuit type AARL AARL Elution circuit size t 18 18.0 Frequency of elution strips/week 7 8 Ahafo Complex Ghana Technical Report Summary Date: February 2026 Page 14-7 Table 14-2: Design Criteria, Ahafo North Process Plant Item Units Saprolite Primary Plant capacity Mt/a 3.7 3.4 Head grade (design) Au g/t 2.1 2.7 Design gold recovery % 95.5 90 Crushing plant availability % 74 74 Mill/CIL availability % 91.3 91.3 Bond abrasion index (Ai) 0.06 0.3–0.47 Bond ball mill work index (BWi) kWh/t 10.23 15.35–20.38 Grind size (P80) μm 53 53 Installed mill power (SAG + ball) kW 20,000 20,000 Number of CIL tanks 6 6 Total CIL volume m3 15,225 15,225 Calculated CIL residence time h 24 27 Cyanide consumption kg/t 0.33 0.46 Quicklime consumption kg/t 3.1 0.9 Elution circuit type AARL AARL Elution circuit size t 10 10 Frequency of elution strips/week 6 6 Table 14-3: Ahafo South Plant Equipment Number/Qty Details of Specification 2 54 x 74 inch gyratory crusher with 500 kW installed motors power 1 MMD 154 series twin-shaft 4-tooth x 9 ring sizer with 2 x 150 kW installed motor power 2 10.36 x 5.0 m EGL SAG mill with 2 x 650 kW installed motor power 2 3.6 x 7.3 m double deck pebble dewatering screen, top deck 33 x 66 mm, bottom deck 10 x 36 mm panels 2 MP 800 pebble crusher, one duty, one standby, each with 600 kW installed motor power for line 1 2 HP 400 pebble crusher, one duty, one standby, each with 315 kW installed motor power for line 2 1 7.31 x 11.90 m EGL ball mill with 2 x 650 kW installed motor power 12 26 inch Krebs cyclones for line 1 12 20 inch Krebs cyclones for line 2 3 3.6 m x 6.1 m cyclone overflow trash screen, two duty, one standby, screen aperture 0.7 x 12 mm, 37 kW 4-pole motor, DF 504S exciters 1 42 m pre-leach thickener Ahafo Complex Ghana Technical Report Summary Date: February 2026 Page 14-8 Number/Qty Details of Specification 13 3,250 m3 leach and adsorption tanks 13 Lightning agitators, 783 gearbox, A310 shaft and impellers 1 1.8 x 4.8 m carbon recovery screen, screen aperture; 1.1 x 12 mm 2 3.6 x 6.1 m carbon safety screen aperture 1.1 x 12 mm, 30 kW 4-pole electric motor, DF 501S exciters 2 42 m CCD thickeners 1 1.2 m x 3.6 m carbon dewatering screen, screen aperture 0.7 x 12 mm 1 18 t acid wash column 1 18 t elution column 2 6,000 amp electrowinning cells 1 TA 300D Barring furnace 1 900 kg/hr diesel-fired carbon regeneration kiln Note: EGL = effective grinding length, CCD = counter-current decant. Table 14-4: Ahafo North Plant Equipment Number/Qty Details of Specification 1 Single toggle jaw crusher, C150, 250 kW motor 1 SAG mill Ø 8.50 x 4.85 m EGL, 60–80% critical speed, 20° heads with 7 MW installed power 1 Ball mill Ø 7.32 x 11.9 m EGL, 65–80% critical speed with 13 MW installed power 1 Pebble crusher short head coarse cone crusher HP3, installed motor power 220 kW 2 Vibrating, linear, flat deck trash screen 18 400CVX-10 cyclones 1 Pre-leach thickener 32 m diameter high rate 6 2,537 m3 leach and adsorption tanks 6 Afrommix agitato, AMX 11000, dual stage, mild steel wetted parts, rubber-lined impellers c/w gearbox drive, setup to sparge oxygen down the shaft 1 Carbon recovery screen 3.783 x 1.489 m, 0.7 mm aperture, 34.9% open area 1 Acid wash column, 10 t 1 Elution column, 10 t 1 Regeneration kiln 500 kg/hr, horizontal, diesel fired 2 4,500 amps electrowinning cell, 22 cathodes 1 Carbon safety screen vibrating, linear, horizontal 1 10 PSA oxygen plant Note: EGL = effective grinding length, CCD = counter-current decant, PSA = pressure swing adsorption


Ahafo Complex Ghana Technical Report Summary Date: February 2026 Page 14-9 14.5 Power and Consumables 14.5.1 Ahafo South Consumables used include reagents (cyanide, lime, acid, caustic), grinding media, and high- and low-pressure air. The main water sources for the process plant are from stored water in the mined- out Apensu open pit and the TSF. Potable water is sourced from boreholes. The Line 1 installations require approximately 26 MW of power to operate at full capacity while Line 2 draws about 13 MW of power. The site has an emergency backup generation plant consisting of seven 3.9 MW high-speed generators that together are capable of producing about 27.3 MW of supplemental power. 14.5.2 Ahafo North Consumables used include reagents (cyanide, lime, acid, caustic, grinding media, high- and low- pressure air and oxygen). The primary source of raw water is pit dewatering that will be pumped into a water storage dam/impacted water pond. This is supplemented by runoff from the local catchments. Duty/standby submersible pumps are used to transfer water from the impacted water pond into a raw water tank that is located in the process plant. The raw water tank has an overflow into the process water pond to maintain a consistent fill. The above-ground process water pond is double- lined with clay and high-density polyethylene (HDPE) to receive pre-leach thickener (partial) and CCD circuit overflow solution, as well as the make-up water from the raw water tank overflow. The process plant will receive its power supply from an 161 kV outdoor switching station to be located at the Ahafo North mining facility, and tapped from the existing 161 kV line between Kenyasi and Sunyani. The plant maximum demand is estimated to be 25 MW at a 0.95 power factor. 14.6 Personnel The Ahafo Complex employs a total of 390 persons, including process control staff. The process personnel required for the LOM plan for the Ahafo South process plant total 255 persons, with 114 required for operations and 141 persons for maintenance. The personnel total for the Ahafo North LOM process plan is 135. The personnel count includes both operations and maintenance staff. Ahafo Complex Ghana Technical Report Summary Date: February 2026 Page 15-1 15.0 INFRASTRUCTURE 15.1 Introduction 15.1.1 Ahafo South Key infrastructure associated with the Ahafo South operations includes: • Completed open pit mines at Subika, Apensu Main and Amoma; the Apensu open pit is being used for water storage; • Open pit mining activities are currently underway at Awonsu, and development of the Apensu South open pit is scheduled to begin in 2029; • Underground mining at Subika is currently underway whiles Apensu Underground project is scheduled to commence in 2030; • There are five waste rock storage facilities (WRSFs) at the site, of which one is currently active and four are inactive; • Five stockpiles; • Process plant; • TSF and the use of Awonsu Phase 4 pit for tailings deposition post mining in 2031; • Water storage facility; • Reverse osmosis water treatment facility; • Sediment control structures; • Residential camp; • Mine accommodations village; • Various support facilities including truck and vehicle shops, warehouse, administration, contractor and temporary offices, fuel storage, core processing facilities at the mine site, clinic and emergency response facilities, gatehouse, mess facilities, change rooms, personnel training facilities, information technology (IT) communications setups and towers, environmental monitoring facilities, water treatment plants, sewage treatment plants, reagents shed, and plant nurseries. During the remainder of the LOM, a new WRSF for storage of waste from the Apensu South pit will be required, as will a second water treatment plant. An infrastructure layout plan showing the surface infrastructure layout is provided in Figure 15-1. Ahafo Complex Ghana Technical Report Summary Date: February 2026 Page 15-2 Figure 15-1: Infrastructure Layout Plan, Ahafo South Note: Figure prepared by Newmont, 2025 Ahafo Complex Ghana Technical Report Summary Date: February 2026 Page 15-3 15.1.2 Ahafo North Key infrastructure to support the operations at Ahafo North includes: • Open pit mines at Yamfo South, Yamfo Northeast, Susuan, Subenso South, Subenso North, and Teekyere West; • Three WRSFs; • Stockpile; • Plant roads and ex-pit mine haul roads; • Process plant, reagent store, and laboratory; • Various support facilities including workshops, offices, change rooms and chop, warehousing, and stores, mine services area (mill maintenance shop, truck shop, truck wash, and tire shop) with fuel and lubricant storage facilities, emergency services building, and services distribution network; • Explosives magazine; • TSF; • 10 sediment control structures; • Water storage facility; • Reverse osmosis water treatment facility; • Two 1.1 MW diesel power stations; • Security gatehouse and perimeter fencing; • Permanent accommodation camp. An infrastructure layout plan showing the surface infrastructure layout is included as Figure 15-2.


Ahafo Complex Ghana Technical Report Summary Date: February 2026 Page 15-4 Figure 15-2: Infrastructure Layout Plan, Ahafo North Note: Figure prepared by Newmont, 2025. WR = waste rock facility; TSF = tailings storage facility; OP = open pit; SCS = sediment control structure; IWP = impacted water pond. Ahafo Complex Ghana Technical Report Summary Date: February 2026 Page 15-5 15.2 Roads and Logistics Road access to Ahafo South and Ahafo North is outlined in chapter 4.2. Mine supplies are brought in by truck. The existing Sunyani–Kumasi Road (Highway 6), which originally traversed the Teekyere West pit area, has been successfully realigned and the new 10  km diversion is now complete and open to the public. This realignment, developed around the Susuan and Teekyere West pits and along the southern boundary of the waste rock storage facility before reconnecting with the original alignment northwest of Afrisipakrom, was completed following permitting and construction in coordination with the Ghana Highway Authority. The route includes two major river crossings and allows for uninterrupted traffic flow around the mining areas. A number of tracks were constructed to access and maintain Ahafo North infrastructure such as power lines, pipelines, sediment control structures that are remote from the main site. 15.3 Stockpiles 15.3.1 Ahafo South A stockpiling strategy is practiced to defer lower-grade ores to the end of mine life. All stockpile inventories are calculated and reported monthly. Inventories are based on truck counts of material added to and removed from stockpiles, multiplied by truck tonnage factors. 15.3.2 Ahafo North The mine operating plan incorporates ore rehandling at the crusher feeder pad to improve plant throughput by blending material before primary crushing. It is assumed that approximately 60% ROM ore delivered to the mill will be rehandled to feed the primary crusher. A stockpiling strategy is also implemented to defer lower-grade ore for processing toward the end of the mine life. All stockpiled material is planned to be processed in the LOM plan. 15.4 Waste Rock Storage Facilities 15.4.1 Ahafo South WRSFs are sited on hillsides as bank fills or within shallow drainages as complete valley fills and were sited 60–100 m from pit crests. Lift heights are typically planned at 16–20 m and the overall slopes are designed at 3:1. The Apensu, Subika West and East and Amoma WRSFs are complete, and will have no additional waste tonnage added. The LOM plan assumes that only two WRSFs, at Apensu South and Awonsu, will be active for the remainder of the mine life: Ahafo Complex Ghana Technical Report Summary Date: February 2026 Page 15-6 • Apensu South : overall approximate capacity of 23 Mt, mine plan will send 10 Mt of waste to the facility; • Awonsu: facility will be expanded to the northwest; overall approximate capacity of 89 Mt; mine plan will send 117 Mt of waste to the facility, with a portion used in raising the TSF. 15.4.2 Ahafo North Three waste rock storage facilities were constructed at three separate locations that are in close proximity to the main mining areas (Figure 15-3). Figure 15-3: WRSF Locations, Ahafo North Note: Figure prepared by Newmont, 2026. Orange = outline of open pits, brown = WRSF locations labeled as WD, blue–green is TSF location. WRSFs were designed according to Ghana EPA regulations, which state that these facilities can only be 100 m above original ground topography. Facility heights will be in the range of 60–72 m in height (4–5 lifts). Ahafo Complex Ghana Technical Report Summary Date: February 2026 Page 15-7 The WRSFs are developed using 18 m lifts, a 30 m catch bench every lift and a face angle of about 36.5°. Designs were based on construction of the WRSFs in angle of repose lifts, with offsets between lifts to produce 3H:1V crest-to-crest slope angles. 15.5 Tailings Storage Facilities 15.5.1 Ahafo South The TSF is constructed in the Subri stream drainage. The northern upstream embankment serves as a downstream dam for a water storage facility. The TSF is operated as a zero-discharge facility; all water is returned to the process facility for reuse. The main embankment has been constructed in stages. The TSF is monitored monthly with both a network of piezometers to determine phreatic water levels in the embankments as well as via settlement pins. Drone survey and pool volume measurements are also conducted on monthly basis. These data are tabulated in a report that is reviewed by both Newmont and the Engineer of Record with Jones and Wagner, a third-party consultant. Reporting follows the TSF operations, maintenance and surveillance (OMS) management plan which stipulates minimum monitoring requirements and triggers that require a further response. TSF capacities meet the required capacities for the present LOM. A raise to Cell 1 will allow operations to 2031 followed by deposition into the mined Awonsu Phase 4 open pit will support the operations to the end of the LOM. The TSF expansions, Cell 1 that would be expanded to a maximum capacity of 220 Mt and the Awonsu Phase 4 in pit tailing deposition has an additional 89 Mt capacity. 15.5.2 Ahafo North The fully lined TSF will be developed in eight phases, with phases 1 and 2 already completed and currently supporting ongoing milling operations. The remaining will be constructed in a phased manner to provide a total capacity of 76.4 Mt, aligned with the mine plan and tailings production schedule. Construction of the remaining phases is planned to commence with phase 3 in 2026 and progress through to phase 8 by 2042. Tailings are deposited into the TSF sub-aerially from the TSF perimeter. The tailings delivery pipeline runs from the Plant Site to the southern perimeter within a geomembrane-lined pipeline corridor. The proposed tailings deposition method uses a sub-aerial technique, with the aim of minimizing the supernatant pond size and increasing the settled density of the tailings, thereby improving storage capacity. The location of the TSF in relation to other surface infrastructure was shown in Figure 15-3. The storm water capacity will be the greater of: 100 yr/24 hr event in addition to the maximum operating volume; or 100 yr/24 hr event, annual wet rainfall sequence pond volume. The operational basis seismic design was for an earthquake with a 2,475‐year recurrence interval, and peak horizontal displacement of 13g.


Ahafo Complex Ghana Technical Report Summary Date: February 2026 Page 15-8 15.6 Water Management Structures 15.6.1 Ahafo South Water management infrastructure at Ahafo South for mine operations include the following: • Surface water management infrastructure: diversion channels around the pits and collection systems downstream of the WRSFs and stockpiles; • Pit runoff management infrastructure: in-pit and ex-pit sumps with a system centrifugal pumps and high-density polyethylene (HDPE) pipelines dewatering to holding and transfer ponds; • Groundwater management infrastructure: hybrid system of ex-pit dewatering wells and installations of arrays of horizontal drain holes. A reverse osmosis water treatment plant with a 50 L/s (feed) capacity was commissioned in August 2017 and a second reverse osmosis water treatment plant with a 60 L/s (feed) capacity was commissioned in June 2023 to support dewatering of the Apensu pit. 15.6.2 Ahafo North All of the open pits will form hydraulic sinks for contact water (e.g., both groundwater and surface water flow into the pits). Topography in the immediate vicinity of the pits is graded to drain toward the pits. Diversion structures are used to direct non-contact water away from WRSFs, open pits, and stockpiles and route these flows to 10 sediment control structures, which are located downgradient of all major facilities. 15.7 Water Supply 15.7.1 Ahafo South Process water is sourced from a cross-valley embankment dam upstream from the TSF, which impounds water from a 28 km2 area of the Subri stream watershed. Potable water for the mining operations and camps is produced from bore fields. Water supplies are sufficient for current and planned development needs. The Ahafo mine operates with an excess water balance resulting from the accumulation of seasonal rainfall contacting the mining operation. The excess is stored in the mined-out Apensu pit, which has an area of 350,000 m2. 15.7.2 Ahafo North With a crest elevation of 293 m and a maximum water storage elevation of 290 m, the water storage facility is designed to store up to 1.3 Mm3 of water. The water collected in the facility will be pumped back to the plant to supply plant raw water requirements and process make-up water Ahafo Complex Ghana Technical Report Summary Date: February 2026 Page 15-9 requirements. Water will be removed via submersible pumps and delivered to an HDPE lined raw water storage pond at the plant site. A 5,000 m3 capacity above-ground process water pond with double HDPE lining and clay base liner receives pre-leach thickener (partial) and CCD circuit overflow solution and make-up water from the raw water pond overflow. The firewater system draws from the raw water pond. Potable water is supplied to the plant area and other site facilities from the potable water bores. This water is treated in a containerized potable water treatment package at the accommodation camp. 15.8 Camps and Accommodation Two types of accommodation are available at Ahafo South. Camp A, originally the construction camp at the plant site, hosts about 300 people, consisting of site visitors and long-term employees. Newmont constructed the Mensah Kumtah Village, near Kenyasi, for expatriate families and Ghanaian management staff. Workers who do not live in company housing receive housing allowances. At Ahafo North, a permanent accommodation camp is located adjacent to the process plant and includes 40 motel style rooms with en suite bathrooms, kitchen, dining area, wet mess, office, gym, laundry facilities, and a multi-purpose sport court. The remainder of the Ahafo North staff are accommodated in Sunyani and other local villages. 15.9 Power and Electrical 15.9.1 Ahafo South Newmont Africa in Ghana receives power purchased from the Volta River Authority’s (VRA) electricity generation thermal facilities near the Ghanaian coast and at the Akosombo Dam hydroelectric facility. Power is delivered to Ahafo South via the Ghana Grid Company Limited (Gridco) 161 kV transmission line into the Ahafo (Kenyasi) Substation where voltage is dropped from 161 kV down to 11 kV for use at the Ahafo complex. Gridco currently has three 161 kV lines that deliver power to the Kenyasi Substation at Ahafo; two from Kumasi, and one from Kumasi via Techiman/Sunyani. Each transmission line is capable of delivering power sufficient to satisfy Ahafo’s current peak startup power demand of about 35 MW, as the capacity of each of these lines is approximately 120 MW. The two direct lines from Kumasi do not have additional power demand other than Newmont’s load at the Kenyasi substation. The third line (from Kumasi via Sunyani) supplies Techiman, then Sunyani, on its route to service Kenyasi substation. Newmont has also installed emergency power generating capacity, consisting of 27 MW at Ahafo South to meet any power challenges. Ahafo Complex Ghana Technical Report Summary Date: February 2026 Page 15-10 15.9.2 Ahafo North The power supply is from the Ghana national grid via a 161 kV line tied into the Sunyani–Kenyasi 161 kV line originally built for Ahafo South. The 161 kV supply voltage is stepped down to 11 kV at a site substation built by Newmont, but thereafter owned and operated by Gridco. The substation is based around a single 33 MVA step down transformer. Site power distribution is at 11 kV, stepped down to 415 V at point of use. Approximately 2.2 MVA of high speed diesel-generating capacity is installed for emergency use, if required, during periods of grid load shedding or outages. Ahafo Complex Ghana Technical Report Summary Date: February 2026 Page 16-1 16.0 MARKET STUDIES AND CONTRACTS 16.1 Markets Newmont has established contracts and buyers for the doré products from the Ahafo Complex, and has an internal corporate marketing group that monitors markets for its key products. Together with public documents and analyst forecasts, these data support that there is a reasonable basis to assume that for the LOM plan, that the key products will be saleable at the assumed commodity pricing. There are no agency relationships relevant to the marketing strategies used. Product valuation is included in the economic analysis in Chapter 19, and is based on a combination of the metallurgical recovery, commodity pricing, and consideration of processing charges. The doré is not subject to product specification requirements. 16.2 Commodity Price Forecasts Newmont uses a combination of historical and current contract pricing, contract negotiations, knowledge of its key markets from a long operations production record, short-term versus long- term price forecasts prepared by Newmont’s internal corporate marketing group, public documents, and analyst forecasts when considering long-term commodity price forecasts. Higher metal prices are used for the mineral resource estimates to ensure the mineral reserves are a sub-set of, and not constrained by, the mineral resources, in accordance with industry- accepted practice. The long-term commodity price and exchange rate forecasts are provided in Table 16-1. Table 16-1: Commodity Price and Exchange Rate Forecasts Commodity Units Mineral Reserves Mineral Resources Gold $US/oz 2,000 2,300 Exchange rate US$:Gh$ 1:12.00 1:12.00 16.3 Contracts Newmont’s doré is sold on the spot market, by marketing experts retained in-house by Newmont. The terms contained within the sales contracts are typical and consistent with standard industry practice and are consistent with doré sold from other Newmont operations. The largest in-place contracts other than for product sales cover items such as bulk commodities, operational and technical services, mining and process equipment, and administrative support services. Contracts are negotiated and renewed as needed. Contract terms are typical of similar contracts in Ghana.


Ahafo Complex Ghana Technical Report Summary Date: February 2026 Page 17-1 17.0 ENVIRONMENTAL STUDIES, PERMITTING, AND PLANS, NEGOTIATIONS, OR AGREEMENTS WITH LOCAL INDIVIDUALS OR GROUPS 17.1 Introduction Newmont is committed to design, develop, and operate the Ahafo Complex in a manner that will preserve human health, the environment and stakeholder relationships. A variety of environmental management activities were developed and are being implemented during all operational phases. Newmont’s intent is to eliminate, offset, or reduce to acceptable levels any adverse environmental impacts through management programs, resource-specific mitigation measures, monitoring plans, and implementation schedules. 17.2 Ahafo South 17.2.1 Baseline and Supporting Studies Baseline and supporting environmental studies were completed to assess both pre-existing and ongoing site environmental conditions, as well as to support decision-making processes during operations start-up. Characterization studies were completed for climate, air quality, hydrology and surface water quality, hydrogeology, flora, fauna, soils, agriculture and land use, and the socioeconomic environment. Plans were developed and implemented to address aspects of operations such as waste and fugitive dust management, spill prevention and contingency planning, water management, and noise levels. 17.2.2 Environmental Considerations/Monitoring Programs Procedures for operational environmental and social monitoring of the Ahafo Complex area were established to ensure mining activities have minimal or acceptable levels of impact to surrounding areas. The primary environmental resource monitored at Ahafo is water – both surface water and groundwater. Other resource monitoring being conducted by Newmont includes fugitive dust, point source emission, meteorological parameters, noise and vibration, revegetation progress, surface water run-off quantity, and quality, mine pit conditions, waste rock disposal, TSF decant water quantity and quality, and environmental geochemistry of ore, waste rock, and tailings. Data from these monitoring programs are used to evaluate potential impacts of mining operations and to continually update plans for long-term monitoring and reclamation. Ahafo Complex Ghana Technical Report Summary Date: February 2026 Page 17-2 17.2.3 Closure and Reclamation Considerations In 2003, Newmont developed a conceptual closure and reclamation plan for the Ahafo South Mine Project Environmental Impact Statement (EIS) (SGS 2004) in compliance with requirements of the Environmental Protection Agency (EPA). The EIS was approved by the EPA in April 2005. A Draft Reclamation Plan to begin the process of formalizing the conceptual plan presented in the EIS was undertaken later in 2005. The Draft Reclamation Plan, subsequently approved for implementation, included descriptions of mining and ore processing operations, WRSFs, TSF, water-related structures, and the reclamation and monitoring plans for these facilities. Under EPA requirements, Newmont is required to provide updates to the reclamation plan as mine development proceeds. These updates are to include revisions or modifications to the closure and reclamation plan necessary to address actual site conditions. An updated Closure and Reclamation Plan was developed in 2019 that covers closure of the Subika Underground and ancillary infrastructure as well as the prior existing facilities. A Reclamation Security Agreement (RSA) between the EPA and Newmont was signed in April 2008 to outline the various objectives and targets as guidance for the plan. The EPA requires a Reclamation Bond to be posted as part of any mine permitting process. The bond is required to provide financial surety against non-compliance under the approved Closure and Reclamation Plan and is required within six months after the start of operations. As part of the reclamation and security agreement (environmental bond) with the Ghanaian Government, Newmont has provided a cumulative (project to date) cash deposit of US$14 M. The closure cost estimate for Ahafo South used in the economic analysis in Chapter 19 is US$0.2 B. 17.2.4 Permitting All major permits and approvals are in place to support operations. Where permits have specific terms, renewal applications are made of the relevant regulatory authority as required, prior to the end of the permit term. The environmental permitting approach for the operations is based on Ghana’s EPA Environmental Impact Assessment (EIA) process and meets Newmont policy requirements and social and environmental standards. Newmont monitors the regulatory regime in place at each of its operations and ensures that all permits are updated in line with any regulatory changes. 17.2.5 Social Considerations, Plans, Negotiations and Agreements Newmont developed a public consultation and disclosure plan (PCDP) for the Ahafo Complex using guidelines and policies developed by the International Finance Corporation (IFC). The IFC requires public consultation as an on-going process to be conducted during the construction and operational phases of any project. Ahafo Complex Ghana Technical Report Summary Date: February 2026 Page 17-3 Newmont has well-established relationships, issue management approaches, engagement forums, and a suite of integrated social impact and opportunity-aligned strategic investment partnerships. Newmont understands and accepts the importance of proactive community relations as an overriding principle in its day-to-day operations as well as future development planning. The company therefore structures its community relations activities to consider the concerns of the local people and endeavors to communicate and demonstrate its commitment in terms that can be best appreciated and understood to maintain the social license to operate. 17.2.6 Qualified Person’s Opinion on Adequacy of Current Plans to Address Issues Based on the information provided to the QP by Newmont (see Chapter 25), there are no material issues known to the QP. The Ahafo South operations are mature mining operations and Newmont currently has the social license to operate within its local communities. 17.3 Ahafo North 17.3.1 Baseline and Supporting Studies Ahafo North baseline and supporting environmental studies were completed to assess both pre- existing and ongoing site environmental conditions, as well as to support decision-making processes during construction and operations start-up. Characterization studies were completed for climate, air quality, hydrology and surface water quality, ground water quality, hydrogeology, flora, fauna, soils, agriculture and land use, and the socioeconomic environment. Environmental Management Plans were developed and implemented to address aspects of construction and operations such as waste and fugitive dust management, spill prevention and contingency planning, water management, and noise levels. A Social Impact Assessment was reviewed and updated with a field study in order to validate existing data for the Project. The study covered all five communities in the Project Area: Yamfo, Techire, Afrisipa, Adrooba and Susanso. The study also looked at the strategic position of Duayaw Nkwanta and Tanoso in relation to its community and political influence in the Ahafo North project area. The identification of sites of cultural relevance and significance to stakeholders was conducted with the assistance of local experts. 17.3.2 Environmental Considerations/Monitoring Programs Environmental monitoring procedures and monitoring schedule were established to ensure mining activities have minimal or acceptable levels of impact to surrounding areas. The monitoring activities included: Ahafo Complex Ghana Technical Report Summary Date: February 2026 Page 17-4 • Air quality monitoring for total suspended particulates; • Meteorological parameters; • Noise monitoring; • Ground water monitoring; • Revegetation progress ; • Blast air overpressure and ground vibration. Data from these monitoring programs are used to evaluate potential impacts of mining operations and to continually update plans for long-term monitoring and reclamation. 17.3.3 Closure and Reclamation Considerations A definitive closure and reclamation plan, which will address stockpiling of topsoils and concurrent reclamation, was developed for Ahafo North. The closure cost estimate for Ahafo North is approximately US$0.1B 17.3.4 Permitting The permitting process began in June 2017. The Ahafo North project team developed a comprehensive permit schedule for the EIA phase and related activities, such as the relocation of the highway. All major permits and approvals are in place to support construction and operations. Where permits have specific terms, renewal applications are made of the relevant regulatory authority as required, prior to the end of the permit expiry. Newmont monitors the regulatory regime in place at each of its operations and ensures that all permits are updated in line with any regulatory changes. The key permits and their status at the Report date are summarized in Table 17-1.


Ahafo Complex Ghana Technical Report Summary Date: February 2026 Page 17-5 Table 17-1: Key Permits, Ahafo North Permit Note Main EIS Permit Obtained the Main EIS Permit from EPA to construct the Ahafo North project. Mining Area Permit Obtained mine area permit from Minerals Commission. TSF EPA and Minerals commission issued approval for the construction and operations of the TSF. Sediment Control Structure and Impacted Water Pond Permits Obtained sediment control structure and impacted water pond construction and water abstraction permits from the Water Resources Commission. Dam safety permits were also obtained. Permanent Bulk Fuel Storage Permit Obtained from EPA Bulk Fuel Storage Permit. Mine Operating Permit MinCom issued mine operating permit. Authorizations (permits) for archaeological artifact removal and preservation Obtained from the Ghana Museum and Monuments Board. Abstraction of groundwater permits Obtained from the Water Resource Commission permits such as potable water abstraction permit, pit dewatering permit, and production well abstraction permits. Surface water diversion permit Obtained Susuan, Afransu and Aboadwoah diversion permits from Water Resources Commission. Highway diversion Obtained from the Ghana Highway Authority. Notifications Informing local district and regional government about Ahafo North operations and relevant changes. Planning permissions Permits from local district and regional planning authorities for resettlement construction. 17.3.5 Social Considerations, Plans, Negotiations and Agreements Newmont has created a stakeholder engagement plan that describes effective methods for building sustainable stakeholder relationships across the Ahafo North project, and, since 2009, there have been some 500 stakeholder engagements. A major concern of stakeholders is the management of compensation and resettlement as well as employment opportunities for local community members. This has been described as the key socio-economic issue, and being managed through the establishment of the Newmont Ahafo Development Foundation, which is assessing the strategic social investment into communities on a long-term basis. Compensation and resettlement negotiation will be undertaken during the final phase of the Project when permits have been approved for Project execution. Ahafo Complex Ghana Technical Report Summary Date: February 2026 Page 17-6 The Compensation, Resettlement and Relocation of impacted farms and property is a major concern for successful project development. Full compensation and resettlement will require the following to be completed: • Full built asset survey; • Crops survey; • Land ownership survey; • Socio-economic households survey (gathers data at household and individual level); • Data capture (the data from surveys will be captured into the Newmont Ghana Gold Management Information System, which will form the project database. This will enable the company to link all information gathered on both an individual and household level for compensation negotiation); • Negotiation committee (the Land Access team, in collaboration with the Community Relations team, plan to establish a subcommittee under the existing Community Consultative Committee (to handle resettlement negotiations); • Resettlement action plan. A preliminary resettlement action plan will be prepared to outline the framework for execution of the resettlement and a final resettlement action plan will be prepared after negotiations). Newmont also has existing agreements with local communities under the Ahafo Social Responsibility Forum Agreements for the Relationship Agreement, Foundation Agreement and Employment Agreement, which will remain in force for the planned Ahafo North operations. 17.3.6 Qualified Person’s Opinion on Adequacy of Current Plans to Address Issues Based on the information provided to the QP by Newmont (see Chapter 25), there are no material issues known to the QP. Newmont currently has the social license to operate within its local communities. Ahafo Complex Ghana Technical Report Summary Date: February 2026 Page 18-1 18.0 CAPITAL AND OPERATING COSTS 18.1 Introduction Capital and operating cost estimates are at a minimum at a pre-feasibility level of confidence, having an accuracy level of ±25% and a contingency range not exceeding 15%. 18.2 Capital Cost Estimates Capital costs are based on recent prices or operating data. Capital costs include funding for infrastructure, pit dewatering, development drilling, and permitting as well as miscellaneous expenditures required to maintain production. Mobile equipment re-build/replacement schedules and fixed asset replacement and refurbishment schedules are included. Sustaining capital costs reflect current price trends. The overall capital cost estimate for Ahafo South LOM is US$0.7 B and Ahafo North LOM is US$0.9 B, as summarized in Table 18-1. Table 18-1: Capital Cost Estimate Area Unit Ahafo South Ahafo North Ahafo Complex Mining, open pit US$ billion 0.2 0.3 0.5 Mining, underground US$ billion 0.2 0.3 0.5 Process US$ billion 0.3 0.3 0.6 Total US$ billion 0.7 0.9 1.6 Note: numbers have been rounded; totals may not sum due to rounding. Ahafo Complex Ghana Technical Report Summary Date: February 2026 Page 18-2 18.3 Operating Cost Estimates Operating costs are based on actual costs seen during operations and are projected through the LOM plan. Historical costs are used as the basis for operating cost forecasts for supplies and services unless there are new contract terms for these items. Labor and energy costs are based on budgeted rates applied to headcounts and energy consumption estimates. Operating costs for Ahafo South and Ahafo North LOM are estimated at US$4.0 B and US$3.3 B, respectively, as summarized in Table 18-2. Table 18-2: Operating Cost Estimate Cost Element Unit Ahafo South Ahafo North Ahafo Complex Open pit mining costs US$ billion 0.7 1.4 2.1 Underground mining costs US$ billion 1.2 — 1.2 Processing costs US$ billion 1.4 1.2 2.6 G&A costs US$ billion 0.7 0.7 1.4 Total Operating Costs US$ billion 4.0 3.3 7.3 Note: numbers have been rounded; totals may not sum due to rounding. The estimated LOM open pit mining cost is US$4.37/t and the underground mining cost is US$62.32/t for Ahafo South. The estimated LOM open pit mining cost for Ahafo North is US$3.27/t. Base processing costs are estimated at US$16.93 /t for Ahafo South and US$18.16/t for Ahafo North. In addition, total G&A costs are estimated at US$8.63/t for Ahafo South and US$11.41/t for Ahafo North (Table 18-3). Table 18-3: Operating Unit Cost Estimate Cost Element Unit Ahafo South Ahafo North Ahafo Complex Open pit mining costs US$/t mined 4.37 3.27 3.59 Underground mining costs US$/t mined 62.32 — 62.32 Processing costs US$/t processed 16.93 18.16 17.48 G&A costs US$/t processed 8.63 11.41 9.87 Note: numbers have been rounded; totals may not sum due to rounding.


Ahafo Complex Ghana Technical Report Summary Date: February 2026 Page 19-1 19.0 ECONOMIC ANALYSIS 19.1 Methodology Used The financial model that supports the mineral reserve declaration is a standalone model that calculates annual cash flows based on scheduled ore production, assumed processing recoveries, metal sale prices and Gh$/US$ exchange rate, projected operating and capital costs and estimated taxes. The financial analysis is based on an after-tax discount rate of 8%. All costs and prices are in unescalated “real” dollars. The currency used to document the cash flow is US$. All costs are based on the 2026 budget. Revenue is calculated from the recoverable metals and long-term metal price and exchange rate forecasts. 19.2 Financial Model Parameters The economic analysis is based on the metallurgical recovery predictions in Chapter 10.4, the mineral reserve estimates in Chapter 13, the mine plan discussed in Chapter 14, the commodity price forecasts in Chapter 16, closure cost estimates in Chapter 17.4, and the capital and operating costs outlined in Chapter 18. Royalties were summarized in Chapter 3.9. Taxes are based on Newmont’s existing agreement with the government of Ghana. The economic analysis is based on 100% equity financing and is reported on a 100% project ownership basis. The Government of Ghana has a 10% free-carried interest in the Project. Newmont has a 90% interest. The economic analysis assumes constant prices with no inflationary adjustments. The active Ahafo South mining operation ceases in 2034; however, closure costs are estimated to 2036. The active Ahafo North mining operation ceases in 2044; however, closure costs are estimated to 2078. The NPV8% for Ahafo South is $0.5 B, and the NPV8% for Ahafo North is $1.2 B, and that for the overall Ahafo Complex is US$1.7 B. As the cash flows are based on existing operations where all costs are considered sunk to January 1, 2026, considerations of payback and internal rate of return are not relevant. Free cash flow for the complex is $2.7 B. A summary of the financial results is provided in Table 19-1 for Ahafo South, in Table 19-2 for Ahafo North and in Table 19-3 for the Ahafo Complex as a whole. Ahafo Complex Ghana Technical Report Summary Date: February 2026 Page 19-2 Table 19-1: Cashflow Summary Table, Ahafo South Item Unit Value Metal prices Gold US$/oz 2,000 Milled ore Tonnage M tonnes 81 Gold grade g/t 1.56 Gold ounces Moz 4.1 Capital costs US$ billion 0.7 Costs applicable to sales US$ billion 4.8 Discount rate % 8 Exchange rate United States dollar:Ghanaian cedi 1:12.00 Free Cash Flow US$ billion 0.7 Net Present Value US$ billion 0.5 Table 19-2: Cashflow Summary Table, Ahafo North Item Unit Value Metal prices Gold US$/oz 2,000 Milled ore Tonnage M tonnes 66 Gold grade g/t 2.23 Gold ounces Moz 4.7 Capital costs US$ billion 0.9 Costs applicable to sales US$ billion 3.8 Discount rate % 8 Exchange rate United States dollar:Ghanaian cedi 1:12.00 Free Cash Flow US$ billion 2.0 Net Present Value US$ billion 1.2 Ahafo Complex Ghana Technical Report Summary Date: February 2026 Page 19-3 Table 19-3: Cashflow Summary Table, Ahafo Complex Item Unit Value Metal prices Gold US$/oz 2,000 Milled ore Tonnage M tonnes 147 Gold grade g/t 1.86 Gold ounces Moz 8.8 Capital costs US$ billion 1.6 Costs applicable to sales US$ billion 8.6 Discount rate % 8 Exchange rate United States dollar:Ghanaian cedi 1:12.00 Free Cash Flow US$ billion 2.7 Net Present Value US$ billion 1.7 Note: The economic analysis is based on 100% equity financing and is reported on a 100% project ownership basis. The Government of Ghana has a 10% free-carried interest in the Project. Newmont has a 90% interest. The economic analysis assumes constant prices with no inflationary adjustments. Table 19-1, Table 19-2, and Table 19-3 contain “forward-looking statements” within the meaning of Section 27A of the Securities Act of 1933, as amended, and Section 21E of the Securities Exchange Act of 1934, as amended, which are intended to be covered by the safe harbor created by such sections and other applicable laws. Please refer to the note regarding forward-looking information at the front of the Report. The cash flow is only intended to demonstrate the financial viability of the Project. Investors are cautioned that the above is based upon certain assumptions which may differ from Newmont’s long-term outlook or actual financial results, including, but not limited to commodity prices, escalation assumptions, and other technical inputs. For example, Table 19-1, Table 19-2, and Table 19-3 use the price assumptions stated in the tables, including a gold commodity price assumption of US$2,000/oz, which varies significantly from current gold prices and the assumptions that Newmont uses for its long-term guidance. Please be reminded that significant variation of metal prices, costs and other key assumptions may require modifications to mine plans, models, and prospects. Numbers have been rounded; totals may not sum due to rounding. An annualized cash flow statement is provided in Table 19-4 for Ahafo South, in Table 19-5 and Table 19-6 for Ahafo North, and in Table 19-7 and Table 19-8 for the Ahafo Complex as a whole. In these tables, EBITDA = earnings before interest, taxes, depreciation, and amortization. The active mining operation ceases in 2044; however, closure costs are estimated to 2078. Ahafo Complex Ghana Technical Report Summary Date: February 2026 Page 19-4 Table 19-4: Annualized Cashflow, Ahafo South (2026–2034) Item Units Total 2026 2027 2028 2029 2030 2031 2032 2033 2034 Material mined M tonnes 208.6 34.8 33.2 30.6 32.6 33.2 19.3 3.2 2.2 1.0 Ore processed M tonnes 81.3 10.1 9.8 9.6 9.8 9.8 9.9 9.8 9.8 2.6 Contained gold, processed Moz 4.1 0.5 0.5 0.5 0.5 0.7 0.7 0.4 0.3 0.1 Processed ore gold grade g/t 1.56 1.39 1.63 1.55 1.57 2.14 2.07 1.21 1.05 1.00 Recovered gold Moz 3.7 0.4 0.5 0.4 0.4 0.6 0.6 0.3 0.3 0.1 Recovery, gold % 90 92 91 92 90 91 90 88 88 90 Net revenue US$ billion 7.4 0.8 0.9 0.9 0.9 1.2 1.2 0.7 0.6 0.1 Costs applicable to sales US$ billion (4.8) (0.6) (0.6) (0.6) (0.6) (0.6) (0.5) (0.4) (0.4) (0.3) EBITDA US$ billion 2.6 0.2 0.3 0.2 0.3 0.6 0.7 0.3 0.1 (0.1) Operating cash flow (after estimated taxes and other adjustments) US$ billion 1.4 0.1 0.1 0.2 0.2 0.3 0.5 0.2 0.1 (0.2) Total capital US$ billion (0.7) (0.1) (0.1) (0.1) (0.1) (0.0) (0.1) (0.1) (0.0) (0.0) Free Cash Flow (FCF) US$ billion 0.7 (0.0) 0.0 0.1 0.1 0.3 0.4 0.1 0.1 (0.2) Note: The economic analysis is based on 100% equity financing and is reported on a 100% project ownership basis. The Government of Ghana has a 10% free- carried interest in the Project. Newmont has a 90% interest. The economic analysis assumes constant prices with no inflationary adjustments. Material mined total includes 18.5Mt of initial stockpiles. Reclamation expenses from 2035 to 2061 estimated at ($US0.1 B), included in operating and free cash flow LOM totals. Table 19-4 contains “forward-looking statements” within the meaning of Section 27A of the Securities Act of 1933, as amended, and Section 21E of the Securities Exchange Act of 1934, as amended, which are intended to be covered by the safe harbor created by such sections and other applicable laws. Please refer to the note regarding forward-looking information at the front of the Report. The cash flow is only intended to demonstrate the financial viability of the Project. Investors are cautioned that the above is based upon certain assumptions which may differ from Newmont’s long-term outlook or actual financial results, including, but not limited to commodity prices, escalation assumptions, and other technical inputs. For example, Table 19-4 uses the price assumptions stated in the table, including a gold commodity price assumption of US$2,000/oz, which varies significantly from current gold prices and the assumptions that Newmont uses for its long-term guidance. Please be reminded that significant variation of metal prices, costs and other key assumptions may require modifications to mine plans, models, and prospects. Numbers have been rounded; totals may not sum due to rounding. EBITDA = earnings before interest, taxes, depreciation, and amortization.


Ahafo Complex Ghana Technical Report Summary Date: February 2026 Page 19-5 Table 19-5: Annualized Cashflow, Ahafo North (2026–2036) Item Units Total 2026 2027 2028 2029 2030 2031 2032 2033 2034 2035 2036 Material mined M tonnes 414.9 23.5 23.4 24.0 24.0 24.0 24.0 24.0 24.0 24.0 24.0 24.0 Ore processed M tonnes 65.5 3.6 3.7 3.7 3.7 3.7 3.7 3.7 3.7 3.7 3.7 3.7 Contained gold, processed Moz 4.7 0.3 0.4 0.3 0.3 0.2 0.2 0.3 0.2 0.2 0.3 0.2 Processed ore gold grade g/t 2.23 2.63 3.03 2.70 2.25 1.99 1.66 2.10 1.68 1.87 2.32 1.64 Recovered gold Moz 4.2 0.3 0.3 0.3 0.3 0.2 0.2 0.2 0.2 0.2 0.2 0.2 Recovery, gold % 90 94 92 92 94 92 88 89 91 89 90 90 Net revenue US$ billion 8.5 0.6 0.7 0.6 0.5 0.4 0.3 0.4 0.4 0.4 0.5 0.4 Costs applicable to sales US$ billion (3.8) (0.2) (0.2) (0.2) (0.2) (0.2) (0.2) (0.2) (0.2) (0.2) (0.2) (0.2) EBITDA US$ billion 4.6 0.3 0.5 0.4 0.3 0.2 0.1 0.2 0.2 0.2 0.3 0.2 Operating cash flow (after estimated taxes and other adjustments) US$ billion 3.0 0.3 0.3 0.2 0.2 0.2 0.1 0.2 0.1 0.1 0.2 0.1 Total capital US$ billion (0.9) (0.3) (0.1) (0.1) (0.0) (0.0) (0.0) (0.1) (0.0) (0.0) (0.0) (0.0) Free Cash Flow US$ billion 2.0 (0.0) 0.2 0.2 0.2 0.1 0.1 0.1 0.1 0.1 0.2 0.0 Ahafo Complex Ghana Technical Report Summary Date: February 2026 Page 19-6 Table 19-6: Annualized Cashflow, Ahafo North (2037–2046) Item Units 2037 2038 2039 2040 2041 2042 2043 2044 Material mined M tonnes 24.0 24.0 24.0 22.0 22.0 20.0 13.1 2.1 Ore processed M tonnes 3.4 3.7 3.7 3.4 3.3 2.5 3.4 1.6 Contained gold, processed Moz 0.2 0.2 0.2 0.2 0.3 0.2 0.3 0.1 Processed ore gold grade g/t 2.15 1.89 2.10 2.30 2.83 2.70 2.73 1.86 Recovered gold Moz 0.2 0.2 0.2 0.2 0.3 0.2 0.3 0.1 Recovery, gold % 90 92 92 90 89 89 88 65 Net revenue US$ billion 0.4 0.4 0.5 0.4 0.5 0.4 0.5 0.1 Costs applicable to sales US$ billion (0.2) (0.2) (0.2) (0.2) (0.3) (0.2) (0.2) (0.1) EBITDA US$ billion 0.2 0.2 0.2 0.2 0.3 0.2 0.3 0.0 Operating cash flow (after estimated taxes and other adjustments) US$ billion 0.1 0.1 0.1 0.1 0.2 0.1 0.2 (0.0) Total capital US$ billion (0.0) (0.0) (0.1) (0.0) (0.0) (0.0) (0.0) — Free Cash Flow US$ billion 0.1 0.1 0.1 0.1 0.2 0.1 0.2 (0.0) Note: The economic analysis is based on 100% equity financing and is reported on a 100% project ownership basis. The Government of Ghana has a 10% free- carried interest in the Project. Newmont has a 90% interest. The economic analysis assumes constant prices with no inflationary adjustments. Material mined total includes 1.0Mt of initial stockpiles. Reclamation expenses from 2045 to 2078 estimated at ($US0.1 B), included in operating and free cash flow LOM totals. Table 19-5 and Table 19-6 contain “forward-looking statements” within the meaning of Section 27A of the Securities Act of 1933, as amended, and Section 21E of the Securities Exchange Act of 1934, as amended, which are intended to be covered by the safe harbor created by such sections and other applicable laws. Please refer to the note regarding forward-looking information at the front of the Report. The cash flow is only intended to demonstrate the financial viability of the Project. Investors are cautioned that the above is based upon certain assumptions which may differ from Newmont’s long-term outlook or actual financial results, including, but not limited to commodity prices, escalation assumptions, and other technical inputs. For example, Table 19-5 and Table 19-6 use the price assumptions stated in the tables, including a gold commodity price assumption of US$2,000/oz, which varies significantly from current gold prices and the assumptions that Newmont uses for its long-term guidance. Please be reminded that significant variation of metal prices, costs and other key assumptions may require modifications to mine plans, models, and prospects. Numbers have been rounded; totals may not sum due to rounding. EBITDA = earnings before interest, taxes, depreciation, and amortization. Ahafo Complex Ghana Technical Report Summary Date: February 2026 Page 19-7 Table 19-7: Annualized Cashflow, Ahafo Complex (2026–2036) Item Units Total 2026 2027 2028 2029 2030 2031 2032 2033 2034 2035 2036 Material mined M tonnes 623.5 58.3 56.6 54.6 56.6 57.2 43.3 27.2 26.2 25.0 24.0 24.0 Ore processed M tonnes 146.9 13.7 13.5 13.3 13.5 13.5 13.6 13.5 13.5 6.3 3.7 3.7 Contained gold, processed Moz 8.8 0.8 0.9 0.8 0.8 0.9 0.9 0.6 0.5 0.3 0.3 0.2 Processed ore gold grade g/t 1.86 1.72 2.01 1.87 1.76 2.10 1.96 1.46 1.23 1.52 2.32 1.64 Recovered gold Moz 7.9 0.7 0.8 0.7 0.7 0.8 0.8 0.6 0.5 0.3 0.2 0.2 Recovery, gold % 90 93 91 92 92 91 90 89 89 90 90 90 Net revenue US$ billion 15.9 1.4 1.6 1.5 1.4 1.7 1.5 1.1 1.0 0.5 0.5 0.4 Costs applicable to sales US$ billion (8.6) (0.8) (0.8) (0.9) (0.8) (0.8) (0.7) (0.6) (0.6) (0.5) (0.2) (0.2) EBITDA US$ billion 7.1 0.6 0.8 0.6 0.5 0.9 0.8 0.5 0.3 0.1 0.3 0.2 Operating cash flow (after estimated taxes and other adjustments) US$ billion 4.3 0.4 0.4 0.4 0.4 0.5 0.6 0.3 0.3 (0.0) 0.2 0.1 Total capital US$ billion (1.6) (0.5) (0.2) (0.2) (0.1) (0.1) (0.1) (0.1) (0.0) (0.0) (0.0) (0.0) Free Cash Flow (FCF) US$ billion 2.7 (0.1) 0.2 0.2 0.2 0.4 0.5 0.2 0.2 (0.0) 0.2 0.0 Ahafo Complex Ghana Technical Report Summary Date: February 2026 Page 19-8 Table 19-8: Annualized Cashflow, Ahafo Complex (2037–2044) Item Units 2037 2038 2039 2040 2041 2042 2043 2044 Material mined M tonnes 24.0 24.0 24.0 22.0 22.0 20.0 13.1 2.1 Ore processed M tonnes 3.4 3.7 3.7 3.4 3.3 2.5 3.4 1.6 Contained gold, processed Moz 0.2 0.2 0.2 0.2 0.3 0.2 0.3 0.1 Processed ore gold grade g/t 2.15 1.89 2.10 2.30 2.83 2.70 2.73 1.86 Recovered gold Moz 0.2 0.2 0.2 0.2 0.3 0.2 0.3 0.1 Recovery, gold % 90 92 92 90 89 89 88 65 Net revenue US$ billion 0.4 0.4 0.5 0.4 0.5 0.4 0.5 0.1 Costs applicable to sales US$ billion (0.2) (0.2) (0.2) (0.2) (0.3) (0.2) (0.2) (0.1) EBITDA US$ billion 0.2 0.2 0.2 0.2 0.3 0.2 0.3 0.0 Operating cash flow (after estimated taxes and other adjustments) US$ billion 0.1 0.1 0.1 0.1 0.2 0.1 0.2 (0.0) Total capital US$ billion (0.0) (0.0) (0.1) (0.0) (0.0) (0.0) (0.0) — Free Cash Flow US$ billion 0.1 0.1 0.1 0.1 0.2 0.1 0.2 (0.0) Note: The economic analysis is based on 100% equity financing and is reported on a 100% project ownership basis. The Government of Ghana has a 10% free- carried interest in the Project. Newmont has a 90% interest. The economic analysis assumes constant prices with no inflationary adjustments. Material mined total includes 19.5Mt of initial stockpiles. Operating cashflow and free cash flow totals (LOM) include reclamation costs to 2078. Table 19-7 and Table 19-8 contain “forward-looking statements” within the meaning of Section 27A of the Securities Act of 1933, as amended, and Section 21E of the Securities Exchange Act of 1934, as amended, which are intended to be covered by the safe harbor created by such sections and other applicable laws. Please refer to the note regarding forward-looking information at the front of the Report. The cash flow is only intended to demonstrate the financial viability of the Project. Investors are cautioned that the above is based upon certain assumptions which may differ from Newmont’s long-term outlook or actual financial results, including, but not limited to commodity prices, escalation assumptions, and other technical inputs. For example, Table 19-7 and Table 19-8 use the price assumptions stated in the tables, including a gold commodity price assumption of US$2,000/oz, which varies significantly from current gold prices and the assumptions that Newmont uses for its long-term guidance. Please be reminded that significant variation of metal prices, costs and other key assumptions may require modifications to mine plans, models, and prospects. Numbers have been rounded; totals may not sum due to rounding. EBITDA = earnings before interest, taxes, depreciation, and amortization.


Ahafo Complex Ghana Technical Report Summary Date: February 2026 Page 19-9 19.3 Sensitivity Analysis The sensitivity of the Project to changes in metal prices, exchange rate, sustaining capital costs and operating cost assumptions was tested using a range of 25% above and below the base case values. Figure 19-1 is a sensitivity graph for Ahafo South, Figure 19-2 shows the sensitivity for Ahafo North and Figure 19-3 shows the sensitivity graph for the Ahafo Complex. Figure 19-1: NPV Sensitivity, Ahafo South Note: Figure prepared by Newmont, 2026. FCF = free cash flow; op cost = operating cost; cap cost = capital cost; NPV = net present value. (1.0) (0.5) - 0.5 1.0 1.5 2.0 25% 25% Ahafo South Cashflow and NPV sensitivity Ahafo Complex Ghana Technical Report Summary Date: February 2026 Page 19-10 Figure 19-2: NPV Sensitivity, Ahafo North Note: Figure prepared by Newmont, 2026. FCF = free cash flow; op cost = operating cost; cap cost = capital cost; NPV = net present value. - 0.5 1.0 1.5 2.0 2.5 3.0 3.5 25% 25% Ahafo North Cashflow and NPV sensitivity Op Cost FCF Cap Cost FCF Price FCF Op Cost NPV Cap Cost NPV Price NPV Ahafo Complex Ghana Technical Report Summary Date: February 2026 Page 19-11 Figure 19-3: NPV Sensitivity, Ahafo Complex Note: Figure prepared by Newmont, 2026. FCF = free cash flow; op cost = operating cost; cap cost = capital cost; NPV = net present value. Each of Ahafo South, Ahafo North and the overall Ahafo Complex is most sensitive to metal price changes, less sensitive to changes in operating costs, and least sensitive to changes in capital costs. The sensitivity to gold grade mirrors the sensitivity to the gold price and is not shown. Ahafo Complex Ghana Technical Report Summary Date: February 2026 Page 20-1 20.0 ADJACENT PROPERTIES This Chapter is not relevant to this Report.


Ahafo Complex Ghana Technical Report Summary Date: February 2026 Page 21-1 21.0 OTHER RELEVANT DATA AND INFORMATION This Chapter is not relevant to this Report. Ahafo Complex Ghana Technical Report Summary Date: February 2026 Page 22-1 22.0 INTERPRETATION AND CONCLUSIONS 22.1 Introduction The QP notes the following interpretations and conclusions, based on the review of data available for this Report. 22.2 Property Setting The Ahafo Complex is located in an area that has more than 19 years of mining activity. As a result, local and regional infrastructure, and the supply of goods available to support mining operations is well-established. Personnel with experience in mining-related activities are available in the district. There are excellent transportation routes that access the Ahafo area. There are no significant topographic or physiographic issues that would affect the Ahafo Complex operations. The Ahafo Complex operations area consists primarily of subsistence farms with small-scale commercial farming intermingled with areas of forest regrowth and remnants of secondary forest. The Project shares a boundary with the Bosumkese Forest Reserve, and the Amoma Shelterbelt Forest Reserve bisects the Ahafo mining lease. Mining operations are conducted year-round. 22.3 Ownership The Project is held through Newmont Ghana Gold Ltd., an indirectly-wholly owned Newmont subsidiary. The Government of Ghana has a 10% free-carried interest in the Ahafo Complex. 22.4 Mineral Tenure, Surface Rights, Water Rights, Royalties and Agreements Newmont currently holds four mining licenses, and seven prospecting licenses that in total cover an area of 924.63 km2. The mining leases are current until 2031 and can be renewed by negotiation. The total area held under mining licenses is approximately 549 km2. The total area covered by prospecting licenses is about 403 km2. Newmont holds sufficient surface rights to execute the LOM plan. Newmont holds permits to allow abstraction of groundwater, surface water, and water from the Tano River. The Government of Ghana has a 10% free-carried, fixed, non-equity, interest in the Ahafo Complex. Newmont pays the Government of Ghana a ninth of the dividend declared to Newmont shareholders. Since December 2015, Newmont has been obligated to pay 0.6% of the operational revenue if the gold price averages US$1,300/oz or higher, as an advance dividend against the one-ninth share. Ahafo Complex Ghana Technical Report Summary Date: February 2026 Page 22-2 A Revised Investment Agreement (the Agreement) between Newmont and the Government of Ghana defined and fixed, in specific terms, the effective corporate tax and royalty burden the Project would carry during operations. The Agreement established a fixed fiscal and legal regime, including sliding-scale royalty and tax rates for the duration of the Agreement’s stability period. Under the Agreement stability period, which expired at the end of 2025, the tax rate remained at 32.5%. After the cessation of the stability period, the tax rate increased to 35%. During the stability period, Newmont paid gross royalties on gold doré production in accordance with a sliding scale of 3–5%, tied to the gold price. After the Agreement ended, the royalty rate was fixed at 5%. With the expiry of the stability agreement, the operation is also subject to the Growth and Sustainability Levy (GSL) of 3% based on gross revenue. A net smelter return (NSR) royalty of 2.0% is payable on all ounces produced from the Rank (formerly Ntotroso) concession. The royalty is paid to Franco-Nevada Corporation (Franco- Nevada), which acquired the royalty for US$58 M in November 2009. The majority of the Subika deposit, the northern portion of the Awonsu deposit, and the southern tip of the Amoma deposit fall within the Rank mining lease boundary. Royalties in forest reserves are currently not applicable for the Ahafo Complex. 22.5 Geology and Mineralization The Ahafo Complex deposits are interpreted to be examples of orogenic gold deposits; The geological understanding of the settings, lithologies, and structural and alteration controls on mineralization in the different zones is sufficient to support estimation of mineral resources and mineral reserves. The geological knowledge of the area is also considered sufficiently acceptable to reliably inform mine planning. The mineralization style and setting are well understood and can support declaration of mineral resources and mineral reserves. Newmont continues to actively explore in the immediate and near-mine areas. 22.6 History The Ahafo Complex has over 19 years of active mining history, and exploration activities date back to 1989 when gold was first discovered. 22.7 Exploration, Drilling, and Sampling The exploration programs completed to date are appropriate for the style of the mineralization within the Ahafo Complex area. Drill holes are oriented with an inclination to accommodate the steeply-dipping nature of the Ahafo deposits, resulting in an intersection generally representing 75–85% of true width. Drilling is orientated generally perpendicular to the strike of the orebodies. Local variations may be present to accommodate infrastructure constraints. Ahafo Complex Ghana Technical Report Summary Date: February 2026 Page 22-3 Sampling methods, sample preparation, analysis, and security conducted prior to Newmont’s interest in the operations were in accordance with exploration practices and industry standards at the time the information was collected. Current Newmont sampling methods are acceptable for mineral resource and mineral reserve estimation. Sample preparation, analysis and security for the Newmont programs are currently performed in accordance with exploration best practices and industry standards. The quantity and quality of the lithological, geotechnical, collar and down-hole survey data collected during the exploration and delineation drilling programs are sufficient to support mineral resource and mineral reserve estimation. The collected sample data adequately reflect deposit dimensions, true widths of mineralization, and the style of the deposits. Sampling is representative of the gold and copper grades in the deposit, reflecting areas of higher and lower grades. Density measurements are considered to provide acceptable density values for use in mineral resource and mineral reserve estimation. The sample preparation, analysis, quality control, and security procedures used by the Ahafo Complex have changed over time to meet evolving industry practices. Practices at the time the information was collected were industry-standard, and frequently were industry-leading practices. The sample preparation, analysis, quality control, and security procedures are sufficient to provide reliable data to support estimation of mineral resources and mineral reserves. The QA/QC programs adequately address issues of precision, accuracy, and contamination. Modern drilling programs typically included blanks, duplicates, and standard samples. QA/QC submission rates meet industry-accepted standards. 22.8 Data Verification Newmont had data collection procedures in place that included several verification steps designed to ensure database integrity. Newmont staff also conducted regular logging, sampling, laboratory, and database reviews. In addition to these internal checks, Newmont contracted independent consultants to perform laboratory, database, and mine study reviews. The process of active database quality control and internal and external audits generally resulted in quality data. The data verification programs concluded that the data collected from the Ahafo Complex area adequately support the geological interpretations and constitute a database of sufficient quality to support the use of the data in mineral resource and mineral reserve estimation. Data that were verified on upload to the database are acceptable for use in mineral resource and mineral reserve estimation. The QP receives and reviews monthly reconciliation reports from the mine site. Through the review of these reconciliation factors the QP is able to ascertain the quality and accuracy of the data and its suitability for use in the assumptions underlying the mineral resource and mineral reserve estimates.


Ahafo Complex Ghana Technical Report Summary Date: February 2026 Page 22-4 22.9 Metallurgical Testwork Industry-standard studies were performed as part of process development and initial mill design. Subsequent production experience and focused investigations guided mill alterations and process changes. Testwork programs, both internal and external, continue to be performed to support current operations and potential improvements. From time to time, this may lead to requirements to adjust cut-off grades, modify the process flowsheet, or change reagent additions and plant parameters to meet concentrate quality, production, and economic targets. Samples selected for testing were representative of the various types and styles of mineralization. Samples were selected from a range of depths within the deposit. Sufficient samples were taken so that tests were performed on sufficient sample mass. Recovery factors estimated are based on appropriate metallurgical testwork, and are appropriate to the mineralization types and the selected process routes. The forecast LOM gold recovery varies by deposit, ranging from 81–96%. These forecasts do not include the application of recovery degradation to long-term stockpiles. The mill throughput and associated recovery factors are considered appropriate to support mineral resource and mineral reserve estimation, and mine planning. The Ahafo Complex produces clean ores generally containing low levels of problematic elements. 22.10 Mineral Resource Estimates Newmont has a set of protocols, internal controls, and guidelines in place to support the mineral resource estimation process, which the estimators must follow. Estimation was performed by Newmont personnel. All mineralogical information, exploration boreholes and background information were provided to the estimators by the geological staff at the mines or by exploration staff. Modelling and resource estimates were performed in Vulcan software. Mineral resources are reported using the mineral resource definitions set out in SK1300, and are reported exclusive of those mineral resources converted to mineral reserves. The reference point for the estimate is in situ. Mineral resources are reported on a 100% basis. The Government of Ghana has a 10% free-carried interest in the Project. Newmont has a 90% interest. Factors that may affect the mineral resource estimate include: changes to long-term metal price assumptions; changes in local interpretations of mineralization geometry and continuity of mineralized zones; changes to geological and grade shape and geological and grade continuity assumptions; changes to input parameters used in the pit shells and stope outlines constraining the mineral resources; changes to the cut-off grades used to constrain the estimates; variations in geotechnical, mining, and processing recovery assumptions; and changes to environmental, permitting and social license assumptions. Ahafo Complex Ghana Technical Report Summary Date: February 2026 Page 22-5 22.11 Mineral Reserve Estimates Mineral reserves were converted from measured and indicated mineral resources. Inferred mineral resources were set to waste. Estimation was performed by Newmont personnel. All current mineral reserves will be exploited using open pit mining methods, underground mining methods, or are in stockpiles. Mineral reserves amenable to open pit mining methods were estimated assuming open pit methods with conventional methods for drilling, blasting, loading with hydraulic shovels and haulage by large trucks. Mineral reserves amenable to underground mining methods were estimated assuming conventional stoping methods. Mineral resources were converted to mineral reserves using a detailed mine plan, an engineering analysis, and consideration of appropriate modifying factors. Modifying factors include the consideration of dilution and ore losses, open pit and underground mining methods, metallurgical recoveries, permitting, and infrastructure requirements. Mineral reserves are reported using the mineral resource definitions set out in SK1300. The reference point for the estimate is the point of delivery to the process facilities. Mineral reserves are reported on a 100% basis. The Government of Ghana has a 10% free-carried interest in the Project. Newmont has a 90% interest. Factors that may affect the mineral reserve estimates include: changes to the gold price assumptions; changes in the metallurgical recovery factors; changes to the operating cut-off assumptions for mill feed or stockpile feed; changes to the input assumptions used to derive the open pit and stope outlines and the mine plan that is based on those open pit and stope designs; changes to operating, and capital assumptions used, including changes to input cost assumptions such as consumables, labor costs, royalty and taxation rates; variations in geotechnical, hydrogeological, dilution and mining assumptions; including changes to pit phase or stope designs as a result of changes to geotechnical, hydrogeological, and engineering data used; changes to the assumed permitting and regulatory environment under which the mine plan was developed; ability to maintain mining permits and/or surface rights; ability to permit the expanded TSF and obtain the operations certificate for current and future underground operations; ability to maintain social and environmental license to operate. 22.12 Mining Methods Mining operations can be conducted year-round. Open pit mining is conducted using conventional techniques and an Owner-operated conventional truck and shovel fleet. The open pit mine plans are appropriately developed to maximize mining efficiencies, based on the current knowledge of geotechnical, hydrological, mining and processing information on the Project. Underground mining is currently conducted using conventional stoping methods, and conventional mechanized equipment. Underground mining is conducted by a contractor. The underground mine plans are based on the current knowledge of geotechnical, hydrological, mining and processing information in the Subika underground area. Ahafo Complex Ghana Technical Report Summary Date: February 2026 Page 22-6 The Surface LOM plan for Ahafo South currently envisages mining at an average rate of approximately 29 Mt/a for nine years and peaking at 32.5 Mt/a in 2026 with a maximum rate of advance by pit stage of eight benches per annum. The open pit mine life will extend to 2032 with Awonsu phase 4 mining ending in 2031 whiles Apensu South commences in 2029 and ends in 2032. Milling will cease in 2034 after treatment of stockpiled ore and Subika underground material. Mining operations at Ahafo North commenced in 2024, with initial mining activities targeting the Subenso South and Susuan deposits through to the end of 2025. The mine plan schedules continued extraction from the Subenso South, Teekyere West and Susuan deposits during 2026 and 2027. Subsequent phases of mining will progress into the Yamfo Northeast deposit, followed by development of Yamfo South and Subenso North. All saprolite material is planned to be processed at the maximum throughput rate, while the throughput rate for primary material is dependent on the percentage of saprolite included in the blend. The maximum throughput rate is 462.5 t/hr. A stockpiling strategy is used. Sufficient capacity was designated at a location near the crusher to accommodate approximately 4 Mt of saprolites and 2.8 Mt of primary rock. As part of day-to-day operations, Newmont will continue to perform reviews of the mine plan and consider alternatives to, and variations within, the plan. Alternative scenarios and reviews may be based on ongoing or future mining considerations, evaluation of different potential input factors and assumptions, and corporate directives. 22.13 Recovery Methods The process plant designs were based on a combination of metallurgical testwork, previous study designs, previous operating experience. The designs are conventional to the gold industry and have no novel parameters. The plants will produce variations in recovery due to the day-to-day changes in ore type or combinations of ore type being processed. These variations are expected to trend to the forecast recovery value for monthly or longer reporting periods. 22.14 Infrastructure The key infrastructure to support the mining activities envisaged in the LOM is in place. A stockpiling strategy is practiced to defer lower-grade ores to the end of mine life. The LOM plan assumes that only two WRSFs, at Subika East and Awonsu, will be active for the remainder of the Ahafo South mine life. Ahafo North has three WRSFs. TSF capacities at Ahafo South meet the required capacities for the present LOM. A raise to Cell 1 will allow operations to 2031 followed by deposition into the mined Awonsu Phase 4 open pit will support the operations to the end of the LOM. The TSF expansions, Cell 1 that would be expanded to a maximum capacity of 220 Mt and the Awonsu Phase 4 pit has an additional 89 Mt capacity. Ahafo Complex Ghana Technical Report Summary Date: February 2026 Page 22-7 The fully lined TSF will be developed in eight phases, with phases 1 and 2 already completed and currently supporting ongoing milling operations. The remaining will be constructed in a phased manner to provide a total capacity of 76.4 Mt, aligned with the mine plan and tailings production schedule. Construction of the remaining phases is planned to commence with phase 3 in 2026 and progress through to phase 8 by 2042.The existing infrastructure, staff availability, existing power, water, and communications facilities, and the methods whereby goods are transported to the mine are all in place and well-established, and can support the estimation of mineral resources and mineral reserves. Personnel commute from surrounding settlements or live in purpose-built accommodation villages. Water management infrastructure for mine operations includes pit runoff, surface water, and groundwater management infrastructure. Reverse osmosis water treatment plants are operational. Power is sourced from the Volta River Authority’s electricity generation thermal facilities. Newmont has installed emergency generating capacity. 22.15 Market Studies Newmont has established contracts and buyers for its doré products, and has an internal marketing group that monitors markets for its key products. Together with public documents and analyst forecasts, there is a reasonable basis to assume that for the LOM plan, the doré will be saleable at the assumed commodity pricing. Newmont’s doré is sold on the spot market, by marketing experts retained in-house by Newmont. The terms contained within the sales contracts are typical and consistent with standard industry practice, and are similar to contracts for the supply of doré elsewhere in the world. Newmont uses a combination of historical and current contract pricing, contract negotiations, knowledge of its key markets from a long operations production record, short-term versus long- term price forecasts prepared by Newmont’s internal marketing group, public documents, and analyst forecasts when considering long-term commodity price forecasts. Higher metal prices are used for the mineral resource estimates to ensure the mineral reserves are a sub-set of, and not constrained by, the mineral resources, in accordance with industry-accepted practice. The largest in-place contracts other than for product sales cover items such as bulk commodities, operational and technical services, mining and process equipment, and administrative support services. Contracts are negotiated and renewed as needed. Contract terms are typical of similar contracts in Ghana. 22.16 Environmental, Permitting and Social Considerations Baseline and supporting environmental studies were completed to assess both pre-existing and ongoing site environmental conditions, as well as to support decision-making processes during operations start-up. Characterization studies were completed for climate, air quality, hydrology


Ahafo Complex Ghana Technical Report Summary Date: February 2026 Page 22-8 and surface water quality, hydrogeology, flora, fauna, soils, agriculture and land use, and the socioeconomic environment. Plans were developed and implemented to address aspects of operations such as waste and fugitive dust management, spill prevention and contingency planning, water management, and noise levels. The key monitoring areas are surface water and ground water. Other resource monitoring being conducted by Newmont includes fugitive dust, point source emission, meteorological parameters, noise and vibration, revegetation progress, surface water run-off quantity, and quality, mine pit conditions, waste rock disposal, TSF decant water quantity and quality, and environmental geochemistry of ore, waste rock, and tailings. As part of the reclamation and security agreement (environmental bond) with the Ghanaian Government for Ahafo South, Newmont has provided a cumulative (project to date) cash deposit of US$14 M. The closure cost estimate for Ahafo South is US$0.2 B. The closure cost estimate for Ahafo North is approximately US$0.1B. All major permits and approvals are either in place or Newmont expects to obtain them in the normal course of business. Where permits have specific terms, renewal applications are made of the relevant regulatory authority as required, prior to the end of the permit term. Newmont has well-established relationships, engagement forums, and a suite of integrated social impact and opportunity-aligned strategic investment partnerships. Newmont understands and accepts the importance of proactive community relations as an overriding principle in its day-to- day operations as well as future development planning. The company therefore structures its community relations activities to consider the concerns of the local people and endeavors to communicate and demonstrate its commitment in terms that can be best appreciated and understood to maintain the social license to operate. 22.17 Capital Cost Estimates Capital costs were based on recent prices or operating data and are at a minimum at a pre- feasibility level of confidence, having an accuracy level of ±25% and a contingency range not exceeding 15%. Capital costs included funding for infrastructure, pit dewatering, development drilling, and permitting as well as miscellaneous expenditures required to maintain production. Mobile equipment re-build/replacement schedules and fixed asset replacement and refurbishment schedules were included. Sustaining capital costs reflected current price trends. The capital cost estimate for Ahafo South LOM is US$0.7 B and Ahafo North LOM is US$0.9 B. The overall capital cost estimate for the Ahafo Complex is US$1.6 B. Ahafo Complex Ghana Technical Report Summary Date: February 2026 Page 22-9 22.18 Operating Cost Estimates Operating costs were based on actual costs seen during operations and are projected through the LOM plan, and are at a minimum at a pre-feasibility level of confidence, having an accuracy level of ±25% and a contingency range not exceeding 15%. Historical costs were used as the basis for operating cost forecasts for supplies and services unless there are new contract terms for these items. Labor and energy costs were based on budgeted rates applied to headcounts and energy consumption estimates. Operating costs for Ahafo South and Ahafo North LOM are estimated at US$4.0 B and US$3.3 B, respectively. The overall Ahafo Complex operating cost is an estimated US$7.3 B. The estimated LOM open pit mining cost is US$4.37/t and the underground mining cost is US$62.32/t for Ahafo South. The estimated LOM open pit mining cost for Ahafo North is US$3.27/t. Base processing costs are estimated at US$16.93 /t for Ahafo South and US$18.16/t for Ahafo North. In addition, total G&A costs are estimated at US$8.63/t for Ahafo South and US$11.41/t for Ahafo North. 22.19 Economic Analysis The economic analysis is based on 100% equity financing and is reported on a 100% project ownership basis. The Government of Ghana has a 10% free-carried interest in the Project. Newmont has a 90% interest. The economic analysis assumes constant prices with no inflationary adjustments. The NPV8% for Ahafo South is $0.5 B, and the NPV8% for Ahafo North is $1.2 B, and that for the overall Ahafo Complex is US$1.7 B. As the cash flows are based on existing operations where all costs are considered sunk to January 1, 2026, considerations of payback and internal rate of return are not relevant. Free cash flow is $2.7 B for the complex. Each of Ahafo South, Ahafo North and the overall Ahafo Complex is most sensitive to metal price changes, less sensitive to changes in operating costs, and least sensitive to changes in capital costs. 22.20 Risks and Opportunities Factors that may affect the mineral resource and mineral reserve estimates were identified in Chapter 11.12 and Chapter 12.7 respectively. 22.20.1 Risks The risks associated with the Ahafo Complex are generally those expected with open pit and underground mining operations and include the accuracy of the resource model, unexpected geological features that cause geotechnical issues, and/or operational impacts. Other risks noted include: Ahafo Complex Ghana Technical Report Summary Date: February 2026 Page 22-10 • The mineral reserve estimates are sensitive to metal prices. Lower metal prices than forecast in the LOM plan may require revisions to the mine plan, with impacts to the mineral reserve estimates and the economic analysis that supports the mineral reserve estimates; • Labor cost increases or productivity decreases could also impact the stated mineral reserves and mineral resources; • Geotechnical and hydrological assumptions used in mine planning are based on historical performance, and to date historical performance has been a reasonable predictor of current conditions. Any changes to the geotechnical and hydrological assumptions could affect mine planning, affect capital cost estimates if any major rehabilitation is required due to a geotechnical or hydrological event, affect operating costs due to mitigation measures that may need to be imposed, and impact the economic analysis that supports the mineral reserve estimates; • Expectations as to the performance of the Subika underground mining method. If the expectations are not met, this could have an effect on the mineral reserve estimates, the operating cost estimates, and the economic analysis that supports the mineral reserve estimates; • Galamsey (artisanal mining) activity can impact mine safety and operations; • Changes in climate could result in drought and associated potential water shortages that could impact operating costs and the ability to operate; • Political risk from changes to the fiscal or royalty regime. Such changes could have impacts to the mineral reserve estimates and the economic analysis that supports the mineral reserve estimates; • Political risk from challenges to mining licenses and/or Newmont’s right to operate. These could affect the assumptions in the economic analysis that supports the mineral reserve estimates, and the ability to operate. 22.20.2 Opportunities Opportunities include: • Conversion of some or all of the measured and indicated mineral resources currently reported exclusive of mineral reserves to mineral reserves, with appropriate supporting studies; • Upgrade of some or all of the inferred mineral resources to higher-confidence categories, such that such better-confidence material could be used in mineral reserve estimation; • Higher metal prices than forecast could present upside sales opportunities and potentially an increase in predicted Project economics; • Potential for new underground operations proximal to the current mineral resource and mineral reserve estimates, with the support of additional studies. Ahafo Complex Ghana Technical Report Summary Date: February 2026 Page 22-11 22.21 Conclusions Under the assumptions presented in this Report, the Ahafo Complex has a positive cash flow, and mineral reserve estimates can be supported.


Ahafo Complex Ghana Technical Report Summary Date: February 2026 Page 23-1 23.0 RECOMMENDATIONS As the Ahafo Complex is in operation, the QP has no material recommendations to make. Ahafo Complex Ghana Technical Report Summary Date: February 2026 Page 24-1 24.0 REFERENCES 24.1 Bibliography Allen, L.E., 2018: Subika OP Resource Model Peer Review: draft internal Newmont memorandum, 30 March, 2018, 2 p. Amec Foster Wheeler, 2016: Ahafo South Operations, Ghana Reserve/Resource Audit Report; 15 September 2016, report prepared by Amec Foster Wheeler for Newmont, Project No. 189766, 252 p. Anderson, T., 2018: Ahafo North Stage 2B Feasibility Report: internal Newmont report, 2 January, 2018, 563 p. Baah-Danso, E., 2011: The Structural Evolution of the Subika Deposit, Ahafo, Sefwi Belt, Ghana: MSc thesis, University of Western Australia. Bawden W.F., 2018: Preliminary Subika Extraction Ratio Guidance: memorandum prepared for Newmont by Bawden Engineering Ltd, 29 October, 2018, 14 p. Bawden W.F., 2018: Subika Underground Project 2018 Geotechnical Review: report prepared for Newmont by Bawden Engineering Ltd, 27 December, 2018, 44 p. Boye, A., Anderson, T., Jessen, M.H., Weedon, P., Nii-Armah, R., and Kappes, R., 2017: Ahafo North Competent Person Report: internal Newmont report, 31 December 2017, 48 p. Canadian Institute of Mining, Metallurgy and Petroleum (CIM), 2019: Estimation of Mineral Resources and Mineral Reserves, Best Practice Guidelines: Canadian Institute of Mining, Metallurgy and Petroleum, November, 2019. Canadian Institute of Mining, Metallurgy and Petroleum (CIM), 2014: CIM Definition Standards for Mineral Resources and Mineral Reserves: Canadian Institute of Mining, Metallurgy and Petroleum, May, 2014. Canadian Securities Administrators (CSA), 2011: National Instrument 43-101, Standards of Disclosure for Mineral Projects, Canadian Securities Administrators. Golder Associates (Accra), 2014a: Newmont Ahafo North Project, Ghana, Open Pit Slope Stage 2a Design – Susuan, Techire, and Subenso South Pits: report prepared by Golder for Newmont, July 2014 (Golder Project # 11613856). Golder Associates (Accra), 2014b. Newmont Ahafo North Project, Ghana, Geotechnical Design of Yamfo NE and Subenso North Pits: report prepared by Golder for Newmont, July 2014 (Golder Project # 13614907). Goldfarb, R.J., Baker, T., Dube, B., Groves, D.I., Hart, C.J R. and Gosselin, P., 2005: Distribution, Characters and Genesis of Gold Deposits in Metamorphic Terranes: Economic Geology 100th Anniversary Volume, Society of Economic Geologists, Littleton, Colorado, USA, pp. 407–450. Groves, D.I., Goldfarb, R.J., Gebre-Mariam, M., Hagemann, S.G., and Robert, F. 1998: Orogenic gold deposits: A Proposed Classification in the Context of their Crustal Distribution and Ahafo Complex Ghana Technical Report Summary Date: February 2026 Page 24-2 Relationship to Other Gold Deposit Types: Ore Geology Review, Special Issue, Vol. 13, pp. 7–27. Groves, D.I., Goldfarb, R.J., Robert, F., and Hart, C.J.R., 2003: Gold Deposits in Metamorphic Belts: Overview of Current Understanding, Outstanding Problems, Future Research, and Exploration Significance: Economic Geology, Vol. 98, pp. 1–29. Inglis, R., 2015: Ahafo North Database Audit 2015: internal Newmont report, 29 May 2015, 41 p. Jewbali, A., 2018: Review of the 2018 Subika UG model (Only Inclusion of SA1 material): internal Newmont memorandum, February 2018, 5 p. Kappes, R., 2018: Ahafo South Recovery Upscale Factor Testwork and Analysis: internal Newmont report, January 2018, 13 p. Kappes, R., 2018: Ahafo South Strategy Finer Grind Processing Options Update: internal Newmont report, January 2018, 37 p. Kintzel, R., 2016: HOV – Cut-off Grade Strategy: internal Newmont report, 6 January 2016, 2 p. Martos, M., 2017: GED Database Audit, Ghana Drillholes Database: internal Newmont report, 23 March, 2017, 59 p. McFarlane, H., 2017: The Geodynamic and Tectonic Evolution of the Palaeoproterozoic Sefwi Greenstone Belt, West African Craton (Ghana): PhD thesis, Monash University, Australia and Université Toulouse 3 Paul Sabatier, France, 326 p. Moritz, R., 2000: What Have We Learnt About Orogenic Lode Gold Deposits Over The Past 20 Years? : article posted to University of Geneva, Switzerland, website, 7 p., http://www.unige.ch/sciences/terre/mineral/publications/onlinepub/moritz_gold_brgm_20 00.doc. Newmont, 2015a. Final Ahafo North Stage 2B Metallurgical Report: internal Newmont report prepared by Metallurgical Services for the Ahafo North Project Team, August 2015. Newmont, 2015b: Ahafo North Mine Engineering Stage 2AB Bridge Report: internal Newmont report, 28 August, 2015. Newmont, 2016: NI 43-101 Technical Report for Ahafo Operations, Ghana: internal Newmont report, 6 July 2017, 197 p. Newmont, 2017: Subika Phase 3 and Phase 4 Pit Wall Optimization Geotechnical Study: internal Newmont report, 2 October, 2017, 27 p. Newmont, 2018a: Competent Person Report, Ahafo (Geology): draft internal Newmont report: 26 October, 2018, 16 p. Newmont, 2018b: Competent Person Report, Ahafo (Metallurgy): draft internal Newmont report: 24 December, 2018, 20 p. Newmont, 2018c: Competent Person Report, Ahafo (Open Pit Mine Engineering) 14 November, 2018, 17 p. Newmont, 2018d: Competent Person Report, Ahafo (Apensu): draft internal Newmont report: 24 October, 2018, 18 p. Ahafo Complex Ghana Technical Report Summary Date: February 2026 Page 24-3 Newmont, 2018e: Competent Person Report, Ahafo (Resource Modelling): draft internal Newmont report: 24 December, 2018, 12 p. Newmont, 2019: Competent Person Report, Ahafo (Underground): draft internal Newmont report, 20 January, 2019, 54 p. NewFields Mining and Energy Services, 2014a: Groundwater Modeling and Dewatering Study, Model Update to Well Installation and Aquifer Testing at Yamfo Northeast and Subenso North Deposits, Ahafo North Project, Ghana, West Africa: report prepared by NewFields for Newmont Ghana Gold, Ltd., April 2014. NewFields Mining and Energy Services, 2014b: Subenso North and Yamfo Northeast Hydrogeologic Characterization and Dewatering Evaluation, Well Installation and Hydraulic Testing Report, Ahafo North Project, Ghana, West Africa: report prepared by NewFields for Newmont Ghana Gold Ltd., January 2014. NewFields Mining and Energy Services, 2015a: Preliminary Water Balance Model Results, Ahafo North: report prepared by NewFields for Newmont Ghana Gold, Ltd., 4 May, 2015 NewFields Mining and Energy Services, 2015b: Tailings Storage Facility and Water Storage Dam Impoundment Engineering Design Report, Ahafo North Gold Project, Stage 2B: report prepared by NewFields for Newmont Ghana Gold, Ltd. NewFields Mining and Energy Services, 2015c: Plant Site Soil and Foundation Recommendations, Ahafo North Gold Project, Stage 2B, Brong Ahafo Region, Ghana: report prepared by NewFields for Newmont Ghana Gold, Ltd. NewFields Mining and Energy Services, 2016a: Surface Water Management Infrastructure Design Report, Ahafo North Project, Stage 2B: report prepared by NewFields for Newmont Ghana Gold, Ltd. NewFields Mining and Energy Services, 2016b: Life-of-Mine Water Management Plan, Ahafo North Project, Brong Ahafo Region, Ghana: report prepared by NewFields for Newmont Ghana Gold, Ltd. Optiro, 2014: Newmont Ghana Gold Limited Subika July 2014 Mineral Resource Independent Audit: report prepared by Optiro Pty Ltd for Newmont, 2 October, 2014, 59 p. Seibel, G., 2016: Mineral Resource/Mineral Reserve Audit Input: report prepared by Amec Foster Wheeler for Newmont, 7 November, 2016, 47 p. Seibel, G., 2015: Resource Model Review, Ahafo North: report prepared by AMEC for Newmont, 27 August, 2015, 321 p. Seibel, G., 2012: Ahafo North Resource Audit Ghana: report prepared by AMEC for Newmont, Project No. 170934, 30 November, 2012, 120 p.


Ahafo Complex Ghana Technical Report Summary Date: February 2026 Page 24-4 24.2 Abbreviations and Symbols Abbreviation/Symbol Term AARL Anglo American Research Laboratory AAS atomic absorption spectrometry Ai abrasion index AMS African Mining Services AUGNG Ahafo Unified Ghanaian National Grid B billion BLY Boart Longyear BRGM Bureau Recherché Geologiques et Minieres Bwi Bond work index CCD counter-current decantation CIL carbon-in-leach CIM Canadian Institute of Mining, Metallurgy and Petroleum CNwad weakly acid-dissociable cyanide DTM digital terrain model EIA Environmental Impact Assessment EIS Environmental Impact Statement EMP Environmental Management Plan EPA Environmental Protection Agency G&A general and administrative GED Global Exploration Database Gencor Gencor Ltd GPS global positioning system Herco Hermitian correction ICP-MS inductively coupled plasma–mass spectrometry IFC International Finance Corporation IP induced polarization IRA inter-ramp angle La Source La Source Compagnie Miniere SAS LHOSR long-hole open stope retreat LOM life-of-mine LOMP life-of-mine plan LVB Land Valuation Board M million MFZ “Magic Fracture Zone” MSPU Mobile Sample Preparation Unit MWc Megawatt cooling NewFields NewFields Consultants Inc. Ahafo Complex Ghana Technical Report Summary Date: February 2026 Page 24-5 Abbreviation/Symbol Term Newmont Newmont Corporation NGGL Newmont Ghana Gold Ltd. NGRL Newmont Golden Ridge Ltd. NN nearest neighbor Normandy Normandy Mining Limited NPV net present value NSR net smelter return OK ordinary kriging PCDP public consultation and disclosure plan PoO Plan of Operations QA/QC Quality assurance and quality control QP Qualified Person RAB rotary air blast Rank Rank Mining Company Limited RAR return air raise RC reverse circulation RL Relative level RQD rock quality description SAG semi-autogenous grind SG Specific gravity SLOS Sublevel open stoping SME Society for Mining, Metallurgy and Exploration TDEM total domain electromagnetics TEM transient electromagnetic TSF tailing storage facility US United States VL Visual Logger VLF very low frequency VRA Volta River Authority Ahafo Complex Ghana Technical Report Summary Date: February 2026 Page 24-6 24.3 Glossary of Terms Term Definition adit A passageway or opening driven horizontally into the side of a hill generally for the purpose of exploring or otherwise opening a mineral deposit. An adit is open to the atmosphere at one end, a tunnel at both ends. amphibolite facies one of the major divisions of the mineral-facies classification of metamorphic rocks, the rocks of which formed under conditions of moderate to high temperatures (500° C, or about 950° F, maximum) and pressures. Amphibole, diopside, epidote, plagioclase, almandine and grossular garnet, and wollastonite are minerals typically found in rocks of the amphibolite facies aquifer A geologic formation capable of transmitting significant quantities of groundwater under normal hydraulic gradients. azimuth The direction of one object from another, usually expressed as an angle in degrees relative to true north. Azimuths are usually measured in the clockwise direction, thus an azimuth of 90 degrees indicates that the second object is due east of the first. ball mill A piece of milling equipment used to grind ore into small particles. It is a cylindrical shaped steel container filled with steel balls into which crushed ore is fed. The ball mill is rotated causing the balls themselves to cascade, which in turn grinds the ore. Bond work index (BWi) A measure of the energy required to break an ore to a nominal product size, determined in laboratory testing, and used to calculate the required power in a grinding circuit design. carbon-in-leach (CIL) A method of recovering gold and silver from fine ground ore by simultaneous dissolution and adsorption of the precious metals onto fine carbon in an agitated tank of ore solids/solution slurry. The carbon flows counter currently to the head of the leaching circuit. comminution/crushing/grinding Crushing and/or grinding of ore by impact and abrasion. Usually, the word "crushing" is used for dry methods and "grinding" for wet methods. Also, "crushing" usually denotes reducing the size of coarse rock while "grinding" usually refers to the reduction of the fine sizes. concentrate The concentrate is the valuable product from mineral processing, as opposed to the tailing, which contains the waste minerals. The concentrate represents a smaller volume than the original ore counter-current decantation (CCD) A process where a slurry is thickened and washed in multiple stages, where clean water is added to the last thickener, and overflows from each thickener are progressively transferred to the previous thickener, countercurrent to the flow of thickened slurry. crosscut A horizontal opening driven across the course of a vein or structure, or in general across the strike of the rock formation; a connection from a shaft to an ore structure. crown pillar An ore pillar at the top of an open stope left for wall support and protection from wall sloughing above cut-off grade A grade level below which the material is not “ore” and considered to be uneconomical to mine and process. The minimum grade of ore used to establish reserves. data verification The process of confirming that data has been generated with proper procedures, has been accurately transcribed from the original source and is suitable to be used for mineral resource and mineral reserve estimation Ahafo Complex Ghana Technical Report Summary Date: February 2026 Page 24-7 Term Definition decline A sloping underground opening for machine access from level to level or from the surface. Also called a ramp. density The mass per unit volume of a substance, commonly expressed in grams/ cubic centimeter. development Often refers to the construction of a new mine or; Is the underground work carried out for the purpose of reaching and opening up a mineral deposit. It includes shaft sinking, cross-cutting, drifting and raising. dilution Waste of low-grade rock which is unavoidably removed along with the ore in the mining process. easement Areas of land owned by the property owner, but in which other parties, such as utility companies, may have limited rights granted for a specific purpose. electrowinning. The removal of precious metals from solution by the passage of current through an electrowinning cell. A direct current supply is connected to the anode and cathode. As current passes through the cell, metal is deposited on the cathode. When sufficient metal has been deposited on the cathode, it is removed from the cell and the sludge rinsed off the plate and dried for further treatment. elution Recovery of the gold from the activated carbon into solution before zinc precipitation or electro-winning. encumbrance An interest or partial right in real property which diminished the value of ownership, but does not prevent the transfer of ownership. Mortgages, taxes, and judgements are encumbrances known as liens. Restrictions, easements, and reservations are also encumbrances, although not liens. feasibility study A feasibility study is a comprehensive technical and economic study of the selected development option for a mineral project, which includes detailed assessments of all applicable modifying factors, as defined by this section, together with any other relevant operational factors, and detailed financial analysis that are necessary to demonstrate, at the time of reporting, that extraction is economically viable. The results of the study may serve as the basis for a final decision by a proponent or financial institution to proceed with, or finance, the development of the project. A feasibility study is more comprehensive, and with a higher degree of accuracy, than a pre-feasibility study. It must contain mining, infrastructure, and process designs completed with sufficient rigor to serve as the basis for an investment decision or to support project financing. flowsheet The sequence of operations, step by step, by which ore is treated in a milling, concentration, or smelting process. footwall The wall or rock on the underside of a vein or ore structure. gravity separation Exploitation of differences in the densities of particles to achieve separation. Machines utilizing gravity separation include jigs and shaking tables. greenschist facies one of the major divisions of the mineral facies classification of metamorphic rocks, the rocks of which formed under the lowest temperature and pressure conditions usually produced by regional metamorphism. Temperatures between 300 and 450 °C (570 and 840 °F) and pressures of 1 to 4 kilobars are typical. The more common minerals found in such rocks include quartz, orthoclase, muscovite, chlorite, serpentine, talc, and epidote hanging wall The wall or rock on the upper or top side of a vein or ore deposit. indicated mineral resource An indicated mineral resource is that part of a mineral resource for which quantity and grade or quality are estimated on the basis of adequate


Ahafo Complex Ghana Technical Report Summary Date: February 2026 Page 24-8 Term Definition geological evidence and sampling. The term adequate geological evidence means evidence that is sufficient to establish geological and grade or quality continuity with reasonable certainty. The level of geological certainty associated with an indicated mineral resource is sufficient to allow a qualified person to apply modifying factors in sufficient detail to support mine planning and evaluation of the economic viability of the deposit. inferred mineral resource An inferred mineral resource is that part of a mineral resource for which quantity and grade or quality are estimated on the basis of limited geological evidence and sampling. The term limited geological evidence means evidence that is only sufficient to establish that geological and grade or quality continuity is more likely than not. The level of geological uncertainty associated with an inferred mineral resource is too high to apply relevant technical and economic factors likely to influence the prospects of economic extraction in a manner useful for evaluation of economic viability. A qualified person must have a reasonable expectation that the majority of inferred mineral resources could be upgraded to indicated or measured mineral resources with continued exploration; and should be able to defend the basis of this expectation before his or her peers. initial assessment An initial assessment is a preliminary technical and economic study of the economic potential of all or parts of mineralization to support the disclosure of mineral resources. The initial assessment must be prepared by a qualified person and must include appropriate assessments of reasonably assumed technical and economic factors, together with any other relevant operational factors, that are necessary to demonstrate at the time of reporting that there are reasonable prospects for economic extraction. An initial assessment is required for disclosure of mineral resources but cannot be used as the basis for disclosure of mineral reserves IP Geophysical method, induced polarization; used to directly detect scattered primary sulfide mineralization. Most metal sulfides produce IP effects, e.g., chalcopyrite, bornite, chalcocite, pyrite, pyrrhotite life of mine (LOM) Number of years that the operation is planning to mine and treat ore, and is taken from the current mine plan based on the current evaluation of ore reserves. lithogeochemistry The chemistry of rocks within the lithosphere, such as rock, lake, stream, and soil sediments measured mineral resource A measured mineral resource is that part of a mineral resource for which quantity and grade or quality are estimated on the basis of conclusive geological evidence and sampling. The term conclusive geological evidence means evidence that is sufficient to test and confirm geological and grade or quality continuity. The level of geological certainty associated with a measured mineral resource is sufficient to allow a qualified person to apply modifying factors, as defined in this section, in sufficient detail to support detailed mine planning and final evaluation of the economic viability of the deposit. mill Includes any ore mill, sampling works, concentration, and any crushing, grinding, or screening plant used at, and in connection with, an excavation or mine. mineral reserve A mineral reserve is an estimate of tonnage and grade or quality of indicated and measured mineral resources that, in the opinion of the qualified person, can be the basis of an economically viable project. More specifically, it is the economically mineable part of a measured or indicated mineral resource, Ahafo Complex Ghana Technical Report Summary Date: February 2026 Page 24-9 Term Definition which includes diluting materials and allowances for losses that may occur when the material is mined or extracted. The determination that part of a measured or indicated mineral resource is economically mineable must be based on a preliminary feasibility (pre- feasibility) or feasibility study, as defined by this section, conducted by a qualified person applying the modifying factors to indicated or measured mineral resources. Such study must demonstrate that, at the time of reporting, extraction of the mineral reserve is economically viable under reasonable investment and market assumptions. The study must establish a life of mine plan that is technically achievable and economically viable, which will be the basis of determining the mineral reserve. The term economically viable means that the qualified person has determined, using a discounted cash flow analysis, or has otherwise analytically determined, that extraction of the mineral reserve is economically viable under reasonable investment and market assumptions. The term investment and market assumptions includes all assumptions made about the prices, exchange rates, interest and discount rates, sales volumes, and costs that are necessary to determine the economic viability of the mineral reserves. The qualified person must use a price for each commodity that provides a reasonable basis for establishing that the project is economically viable. mineral resource A mineral resource is a concentration or occurrence of material of economic interest in or on the Earth’s crust in such form, grade or quality, and quantity that there are reasonable prospects for economic extraction. The term material of economic interest includes mineralization, including dumps and tailings, mineral brines, and other resources extracted on or within the earth’s crust. It does not include oil and gas resources, gases (e.g., helium and carbon dioxide), geothermal fields, and water. When determining the existence of a mineral resource, a qualified person, as defined by this section, must be able to estimate or interpret the location, quantity, grade or quality continuity, and other geological characteristics of the mineral resource from specific geological evidence and knowledge, including sampling; and conclude that there are reasonable prospects for economic extraction of the mineral resource based on an initial assessment, as defined in this section, that he or she conducts by qualitatively applying relevant technical and economic factors likely to influence the prospect of economic extraction. mine take area Area for which land holders have been fully compensated for moving from their land. net present value (NPV) The present value of the difference between the future cash flows associated with a project and the investment required for acquiring the project. Aggregate of future net cash flows discounted back to a common base date, usually the present. NPV is an indicator of how much value an investment or project adds to a company. net smelter return royalty (NSR) A defined percentage of the gross revenue from a resource extraction operation, less a proportionate share of transportation, insurance, and processing costs. open pit A mine that is entirely on the surface. Also referred to as open-cut or open- cast mine. open stope In competent rock, it is possible to remove all of a moderate sized ore body, resulting in an opening of considerable size. Such large, irregularly-shaped openings are called stopes. The mining of large inclined ore bodies often Ahafo Complex Ghana Technical Report Summary Date: February 2026 Page 24-10 Term Definition requires leaving horizontal pillars across the stope at intervals in order to prevent collapse of the walls. ounce (oz) (troy) Used in imperial statistics. A kilogram is equal to 32.1507 ounces. A troy ounce is equal to 31.1035 grams. overburden Material of any nature, consolidated or unconsolidated, that overlies a deposit of ore that is to be mined. plant A group of buildings, and especially to their contained equipment, in which a process or function is carried out; on a mine it will include warehouses, hoisting equipment, compressors, repair shops, offices, mill or concentrator. preliminary feasibility study, pre- feasibility study A preliminary feasibility study (prefeasibility study) is a comprehensive study of a range of options for the technical and economic viability of a mineral project that has advanced to a stage where a qualified person has determined (in the case of underground mining) a preferred mining method, or (in the case of surface mining) a pit configuration, and in all cases has determined an effective method of mineral processing and an effective plan to sell the product. A pre-feasibility study includes a financial analysis based on reasonable assumptions, based on appropriate testing, about the modifying factors and the evaluation of any other relevant factors that are sufficient for a qualified person to determine if all or part of the indicated and measured mineral resources may be converted to mineral reserves at the time of reporting. The financial analysis must have the level of detail necessary to demonstrate, at the time of reporting, that extraction is economically viable probable mineral reserve A probable mineral reserve is the economically mineable part of an indicated and, in some cases, a measured mineral resource. For a probable mineral reserve, the qualified person’s confidence in the results obtained from the application of the modifying factors and in the estimates of tonnage and grade or quality is lower than what is sufficient for a classification as a proven mineral reserve, but is still sufficient to demonstrate that, at the time of reporting, extraction of the mineral reserve is economically viable under reasonable investment and market assumptions. The lower level of confidence is due to higher geologic uncertainty when the qualified person converts an indicated mineral resource to a probable reserve or higher risk in the results of the application of modifying factors at the time when the qualified person converts a measured mineral resource to a probable mineral reserve. A qualified person must classify a measured mineral resource as a probable mineral reserve when his or her confidence in the results obtained from the application of the modifying factors to the measured mineral resource is lower than what is sufficient for a proven mineral reserve. proven mineral reserve A proven mineral reserve is the economically mineable part of a measured mineral resource. For a proven mineral reserve, the qualified person has a high degree of confidence in the results obtained from the application of the modifying factors and in the estimates of tonnage and grade or quality. A proven mineral reserve can only result from conversion of a measured mineral resource. qualified person A qualified person is an individual who is a mineral industry professional with at least five years of relevant experience in the type of mineralization and type of deposit under consideration and in the specific type of activity that person is undertaking on behalf of the registrant; and an eligible member or licensee in good standing of a recognized professional organization at the time the technical report is prepared. For an organization to be a recognized professional organization, it must: Ahafo Complex Ghana Technical Report Summary Date: February 2026 Page 24-11 Term Definition (A) Be either: (1) An organization recognized within the mining industry as a reputable professional association, or (2) A board authorized by U.S. federal, state, or foreign statute to regulate professionals in the mining, geoscience, or related field; (B) Admit eligible members primarily on the basis of their academic qualifications and experience; (C) Establish and require compliance with professional standards of competence and ethics; (D) Require or encourage continuing professional development; (E) Have and apply disciplinary powers, including the power to suspend or expel a member regardless of where the member practices or resides; and; (F) Provide a public list of members in good standing. raise A vertical or inclined underground working that has been excavated from the bottom upward reclamation The restoration of a site after mining or exploration activity is completed. refining A high temperature process in which impure metal is reacted with flux to reduce the impurities. The metal is collected in a molten layer and the impurities in a slag layer. Refining results in the production of a marketable material. resistivity Observation of electric fields caused by current introduced into the ground as a means of studying earth resistivity in geophysical exploration. Resistivity is the property of a material that resists the flow of electrical current rock quality designation (RQD) A measure of the competency of a rock, determined by the number of fractures in a given length of drill core. For example, a friable ore will have many fractures and a low RQD. royalty An amount of money paid at regular intervals by the lessee or operator of an exploration or mining property to the owner of the ground. Generally based on a specific amount per tonne or a percentage of the total production or profits. Also, the fee paid for the right to use a patented process. run-in-mine (RIM) Generally refers to the rehandle of material on surface close to the underground portal, where material is brought to surface and dumped by the underground trucks into stockpiles or into a metal removal plant before being loaded onto surface trucks and hauled for direct feed into the processing plant or hauled to a fun-of-mine stockpile. Run-in-mine refers to this being a mining rehandle before the run-of-mine, and is usually considered specific to one mine. run-of-mine (ROM) Rehandle where the raw mine ore material is fed into the processing plant’s system, usually the crusher. This is where material that is not direct feed from the mine is stockpiled for later feeding. Run-of-mine relates to the rehandle being for any mine material, regardless of source, before entry into the processing plant’s system. semi-autogenous grinding (SAG) A method of grinding rock into fine powder whereby the grinding media consists of larger chunks of rocks and steel balls. shaft A vertical or inclined excavation for the purpose of opening and servicing a mine. It is usually equipped with a hoist at the top, which lowers and raises a conveyance for handling men and material shrinkage stoping In this method, mining is carried out from the bottom of an inclined or vertical ore body upwards, as in open stoping. However, most of the broken ore is


Ahafo Complex Ghana Technical Report Summary Date: February 2026 Page 24-12 Term Definition allowed to remain in the stope in order both to support the stope walls and to provide a working platform for the overhead mining operations. Ore is withdrawn from chutes in the bottom of the stope in order to maintain the correct amount of open space for working. When mining is completed in a particular stope, the remaining ore is withdrawn, and the walls are allowed to collapse. specific gravity The weight of a substance compared with the weight of an equal volume of pure water at 4°C. Squid TEM Geophysical method. High temperature superconducting quantum interference device (SQUID) magnetometers have been developed in a collaborative project between BHP and CSIRO specifically for application in airborne time domain electromagnetic (TEM) surveying to improve the performance of the system in detection of conductors with longer decay time constants, particularly in the presence of a conductive overburden stope An excavation in a mine, other than development workings, made for the purpose of extracting ore. tailings Material rejected from a mill after the recoverable valuable minerals have been extracted. triaxial compressive strength A test for the compressive strength in all directions of a rock or soil sample uniaxial compressive strength A measure of the strength of a rock, which can be determined through laboratory testing, and used both for predicting ground stability underground, and the relative difficulty of crushing. wacke A sandstone that consists of a mixed variety of angular and unsorted (or poorly sorted) mineral and rock fragments within an abundant matrix of clay and fine silt. Ahafo Complex Ghana Technical Report Summary Date: February 2026 Page 25-1 25.0 RELIANCE ON INFORMATION PROVIDED BY THE REGISTRANT 25.1 Introduction The QP fully relied on the registrant for the information used in the areas noted in the following sub-sections. The QP considers it reasonable to rely on the registrant for the information identified in those sub-sections, for the following reasons: • The registrant has been owner and operator of the mining operations for over 19 years; • The registrant has employed industry professionals with expertise in the areas listed in the following sub-sections; • The registrant has a formal system of oversight and governance over these activities, including a layered responsibility for review and approval; • The registrant has considerable experience in each of these areas. 25.2 Macroeconomic Trends • Information relating to inflation, interest rates, discount rates, exchange rates, and taxes was obtained from the registrant. This information is used in the economic analysis in Chapter 19. It supports the assessment of reasonable prospects for economic extraction of the mineral resource estimates in Chapter 11, and inputs to the determination of economic viability of the mineral reserve estimates in Chapter 12. 25.3 Markets • Information relating to market studies/markets for product, market entry strategies, marketing and sales contracts, product valuation, product specifications, refining and treatment charges, transportation costs, agency relationships, material contracts (e.g., mining, concentrating, smelting, refining, transportation, handling, hedging arrangements, and forward sales contracts), and contract status (in place, renewals), was obtained from the registrant. This information is used in the economic analysis in Chapter 19. It supports the assessment of reasonable prospects for economic extraction of the mineral resource estimates in Chapter 11, and inputs to the determination of economic viability of the mineral reserve estimates in Chapter 12. 25.4 Legal Matters • Information relating to the corporate ownership interest, the mineral tenure (concessions, payments to retain property rights, obligations to meet expenditure/reporting of work conducted), surface rights, water rights (water take allowances), royalties, encumbrances, easements and rights-of-way, violations and fines, permitting requirements, and the ability to maintain and renew permits was obtained from the registrant. Ahafo Complex Ghana Technical Report Summary Date: February 2026 Page 25-2 This information is used in support of the property description and ownership information in Chapter 3, the permitting and mine closure descriptions in Chapter 17, and the economic analysis in Chapter 19. It supports the reasonable prospects of economic extraction for the mineral resource estimates in Chapter 11, and the assumptions used in demonstrating economic viability of the mineral reserve estimates in Chapter 12. 25.5 Environmental Matters • Information relating to baseline and supporting studies for environmental permitting, environmental permitting and monitoring requirements, ability to maintain and renew permits, emissions controls, closure planning, closure and reclamation bonding and bonding requirements, sustainability accommodations, and monitoring for and compliance with requirements relating to protected areas and protected species was obtained from the registrant. This information is used when discussing property ownership information in Chapter 3, the permitting and closure discussions in Chapter 17, and the economic analysis in Chapter 19. It supports the reasonable prospects of economic extraction for the mineral resource estimates in Chapter 11, and the assumptions used in demonstrating economic viability of the mineral reserve estimates in Chapter 12. 25.6 Stakeholder Accommodations • Information relating to social and stakeholder baseline and supporting studies, hiring, and training policies for workforce from local communities, partnerships with stakeholders (including national, regional, and state mining associations; trade organizations; fishing organizations; state and local chambers of commerce; economic development organizations; non-government organizations; and, state and federal governments), and the community relations plan was obtained from the registrant. This information is used in the social and community discussions in Chapter 17, and the economic analysis in Chapter 19. It supports the reasonable prospects of economic extraction for the mineral resource estimates in Chapter 11, and the assumptions used in demonstrating economic viability of the mineral reserve estimates in Chapter 12. 25.7 Governmental Factors • Information relating to taxation and royalty considerations at the Project level, monitoring requirements and monitoring frequency, bonding requirements, violations, and fines and was obtained from the registrant. This information is used in the discussion on royalties and property encumbrances in Chapter 3, the monitoring, permitting and closure discussions in Chapter 17, and the economic analysis in Chapter 19. It supports the reasonable prospects of economic extraction for the mineral resource estimates in Chapter 11, and the assumptions used in demonstrating economic viability of the mineral reserve estimates in Chapter 12.