UNITED
STATES
SECURITIES
AND EXCHANGE COMMISSION
Washington,
D.C. 20549
FORM
8-K
CURRENT
REPORT
Pursuant
to Section 13 or 15(d) of the Securities Exchange Act of 1934
Date
of Report (Date of earliest event reported): March 10, 2021
NEONODE
INC.
(Exact
name of issuer of securities held pursuant to the plan)
Commission
File Number 1-35526
| Delaware |
|
94-1517641 |
(State
or other jurisdiction
of
incorporation) |
|
(I.R.S.
Employer
Identification
No.) |
Storgatan
23C, 114 55 Stockholm, Sweden
(Address
of Principal Executive Office, including Zip Code)
+46
(0) 8 667 17 17
Registrant’s
telephone number, including area code:
Not
Applicable
(Former
name or former address, if changed since last report)
Check
the appropriate box below if the Form 8-K filing is intended to simultaneously satisfy the filing obligation of the registrant
under any of the following provisions (see General Instruction A.2. below):
| ☐ | Written
communications pursuant to Rule 425 under the Securities Act (17 CFR 230.425) |
| ☐ | Soliciting
material pursuant to Rule 14a-12 under the Exchange Act (17 CFR 240.14a-12) |
| ☐ | Pre-commencement
communications pursuant to Rule 14d-2(b) under the Exchange Act (17 CFR 240.14d-2(b)) |
| ☐ | Pre-commencement
communications pursuant to Rule 13e-4(c) under the Exchange Act (17 CFR 240.13e-4(c)) |
Securities
registered pursuant to Section 12(b) of the Act:
| Title
of each class |
|
Trading
Symbol(s) |
|
Name
of each exchange on which registered |
| Common Stock, par
value $0.001 per share |
|
NEON |
|
The Nasdaq Stock
Market LLC |
Indicate
by check mark whether the registrant is an emerging growth company as defined in Rule 405 of the Securities Act of 1933 (§230.405
of this chapter) or Rule 12b-2 of the Securities Exchange Act of 1934 (§240.12b-2 of this chapter).
Emerging
growth company ☐
If
an emerging growth company, indicate by check mark if the registrant has elected not to use the extended transition period for
complying with any new or revised financial accounting standards provided pursuant to Section 13(a) of the Exchange Act. ☐
Item 2.02.
Results of Operations and Financial Condition.
On
March 10, 2021, Neonode Inc. (the “Company”) reported its earnings for the financial year ended December 31, 2020
(the “Earnings Release”) and posted on the Neonode website the Fourth Quarter and full year 2020 Presentation (the
“Presentation”). A copy of the Earnings Release and the Presentation are attached hereto as Exhibits 99.1 and 99.2,
respectively, and are incorporated herein by reference.
The
information furnished pursuant to this Item 2.02, including Exhibit 99.1, shall not be deemed “filed” for
purposes of Section 18 of the Securities Exchange Act of 1934, as amended (the “Exchange Act”), or otherwise
subject to the liabilities under that Section, or incorporated by reference in any filing under the Securities Act of 1933, as
amended, or the Exchange Act, except as shall be expressly set forth by specific reference in such a filing.
Item
7.01 Regulation FD Disclosure
As
previously announced, the Company will conduct a conference call today, Wednesday, March 10, 2021 at 10:00 a.m. ET. The presentation
slides to be used during the call, attached hereto as Exhibit 99.2, will be available on the “Investor Relations”
section of the Company’s website at www.neonode.com immediately prior to the call. The information contained in, or
that can be accessed through the Company’s website is not a part of this filing.
The
information furnished pursuant to this Item 7.01, including Exhibit 99.2, shall not be deemed “filed” for purposes
of Section 18 of the Exchange Act, or otherwise subject to the liabilities under that Section, or incorporated by reference
in any filing under the Securities Act or the Exchange Act, except as shall be expressly set forth by specific reference in such
a filing.
Item 9.01.
Financial Statements and Exhibits.
SIGNATURES
Pursuant
to the requirements of the Securities Exchange Act of 1934, the Registrant has duly caused this report to be signed on its behalf
by the undersigned thereunto duly authorized.
| Date: March 10, 2021 |
NEONODE INC. |
| |
|
|
| |
By: |
/s/
Maria Ek |
| |
Name: |
Maria Ek |
| |
Title: |
Chief Financial
Officer |
2
Exhibit 99.1

PRESS
RELEASE
For
Release, 9:10AM EST March 10, 2021
Neonode
Reports Year Ended December 31, 2020 Financial Results
STOCKHOLM,
SWEDEN – March 10, 2021 – Neonode Inc. (NASDAQ: NEON), today reported financial results for the fiscal
year ended December 31, 2020.
FINANCIAL
SUMMARY FOR THE FISCAL YEAR ENDED DECEMBER 31, 2020:
| ● | Revenue
of $6.0 million, a decrease of 10.0% compared to prior year. |
| ● | Operating
expenses of $11.1 million, a decrease of 5.1% over the prior year. |
| ● | Net
loss of $5.6 million, or $0.56 per share compared to $5.3 million, or $0.60 per share
for prior year. |
| ● | Cash
used by operations of $5.8 million compared to $3.5 million for prior year. |
| ● | Cash
and accounts receivable of $12.2 million as of December 31, 2020 compared to $3.7 million
for the prior year end. |
THE
CEO’S COMMENTS
“My
first year as CEO has been characterized by periods of frustration and at the same time great satisfaction. We had to navigate
some definite headwinds in 2020, including not only the general global economic downturn caused by the COVID-19 pandemic but also
the effects of the world going on lockdown, which brought on new challenges for our business development work and slowed decision
making processes at most of our customers. However, the pandemic also created an unexpected opportunity for us to leverage existing
products and knowhow in contactless touch applications. This is a new market for which we feel we are uniquely positioned to provide
the perfect technology solution with our Touch Sensor Modules. Building on this we have identified and engaged with several new
customers and partners in Asia, Europe, North America, and other parts of the world that will help us increase our product sales
significantly in the coming years. During the year we have also recruited several new, strong members to our Sales and Engineering
teams, who are driving our efforts to capitalize on the growing opportunities in current and new markets. Coming out of 2020,
we feel we are well positioned with a very good team, a strong technology and IP portfolio, a well-recognized brand, and an impressive
and growing customer list, which we will capitalize on in 2021 and the coming years,” said Dr. Urban Forssell, CEO of Neonode.
“Although
our license revenue from existing legacy customers decreased in 2020 compared to the prior year, we are encouraged by positive
customer interest in our technology and solutions offerings in the Military & Avionics, Industrial, and Automotive market
segments. We are engaged with several customers in these markets and have identified several application areas where we believe
our technology is very competitive and adds value, which we will use to grow our solutions and licensing businesses in the coming
years. Our presence in the new market for contactless touch continues to grow. Here our focus is on the Interactive Kiosk and
Elevator market segments and we are addressing these markets both directly with our Sales team and indirectly via different types
of partners, mainly value-added resellers and distributors. Growth in contactless touch for kiosks and elevator is currently led
by our customers and partners in Asia with a growing demand in Europe and North America. Customers and partners in China and Singapore
have installed aftermarket solutions in elevators and public space kiosks in airports, hospitals and hospitality businesses and
are now installing new contactless-touch-enabled devices in hospitals, train stations and other locations. In Japan and South
Korea our partners are increasing the number of devices incorporating our sensor modules in elevators and kiosks in both retrofit
and new OEM applications. Europe and North America are not far behind. We strongly believe the increasing demand related to these
customer activities will define 2021 as the transition year in our drive to profitability,” concluded Dr. Forssell.
INANCIAL
OVERVIEW FOR THE FISCAL YEAR ENDED DECEMBER 31, 2020
Since
January 1, 2020, we have allocated revenues to three different business areas. Revenues allocated to HMI Solutions consist of
license fees and related non-recurring engineering revenues while revenues allocated to HMI Products are derived from the sale
of sensor modules and related non-recurring engineering revenues. We expect that future revenues within our Remote Sensing Solutions
business area will be derived from license fees and non-recurring engineering revenues.
Net
revenue for fiscal 2020 was $6.0 million, a 10.0% decrease, compared to 2019. For 2020, HMI Solutions revenues were $5.0 million,
a decrease of 17.6% compared to 2019. This is primarily due to lower license fees from our automotive and consumer electronics
customers. These decreases were partially offset by an increase in NRE fees for prototype work related to military avionics projects.
Our HMI Products revenues were $1.0 million, an increase of 66.8% compared to 2019. This is due to larger volumes of our sensor
modules being shipped to our distributors and customers designing and selling medical devices, airport baggage trolleys and contactless
touch solutions for elevators and self-service kiosks, which incorporate our sensor modules. We continue to earn revenues from
the sale of our AirBar products, however the number of AirBar units sold continues to decrease over time.
Our
combined total gross margin was 82.0% in 2020 compared to 89.7% in 2019. The decrease in total gross margin in 2020 as compared
to 2019 is primarily due to the change in the mix of the components of overall revenue with an increase in sales of sensor modules
and NRE revenues which have a lower overall gross margin compared to the 100% gross margin license fee business. Our operating
expense decreased slightly in 2020 compared to 2019 and our overall operating expenses remain within budget.
Net
loss for fiscal 2020 was $5.6 million, or $0.56 per share, compared to a net loss of $5.3 million, or $0.60 per share, in fiscal
2019.
In
fiscal 2020, our cash used by operations was $5.8 million compared to $3.5 million in fiscal 2019.
Cash
and accounts receivable totaled $12.2 million and working capital was $10.4 million as of December 31, 2020 compared to $3.7 million
and $2.4 million as of December 31, 2019, respectively.
For
more information, please contact:
Investor
Relations
David
Brunton
Email:
[email protected]
Chief
Financial Officer
Maria
Ek
E-mail:
[email protected]
About
Neonode
Neonode Inc. (NASDAQ:NEON) is a publicly traded company, headquartered in Stockholm, Sweden and established in 2001.
The company provides advanced optical sensing solutions for contactless touch, touch, gesture control, and in-cabin monitoring.
Building on experience acquired during years of advanced R&D and technology licensing, Neonode’s technology is
currently deployed in more than 75 million products and the company holds more than 120 patents worldwide. Neonode’s customer
base includes some of the world’s best-known Fortune 500 companies in the consumer electronics, office equipment, medical,
avionics, and automotive industries.
Neonode
operates in three business areas: HMI Solutions, HMI Products and Remote Sensing Solutions. In HMI Solutions, Neonode offers customized
touch and gesture control solutions for different markets and segments, including the military & avionics and industrial segments.
In HMI Products, the company provides standardized sensor modules for contactless touch, touch and gesture sensing applications
relevant to many industries, including the elevator and interactive kiosk segments. In Remote Sensing Solutions, Neonode offers
software solutions for driver and in-cabin monitoring in vehicles.
NEONODE
and the NEONODE logo are trademarks of Neonode Inc. registered in the United States and other countries.
For
further information please visit www.neonode.com
Safe
Harbor Statement
This
press release contains forward-looking statements within the meaning of the Private Securities Litigation Reform Act of 1995.
These include, but are not limited to, statements relating to our expectations, future performance and future events. These statements
are based on current assumptions, expectations and information available to Neonode management and involve a number of known and
unknown risks, uncertainties and other factors that may cause Neonode's actual results, levels of activity, performance or achievements
to be materially different from any expressed or implied by these forward-looking statements. These risks, uncertainties, and
factors are discussed under "Risk Factors" and elsewhere in Neonode's public filings with the SEC from time to time,
including Neonode's annual report on Form 10-K, quarterly reports on Form 10-Q, and current reports on Form 8-K. You are advised
to carefully consider these various risks, uncertainties and other factors. Although Neonode management believes that the forward-looking
statements contained in this press release are reasonable, it can give no assurance that its expectations will be fulfilled. Forward-looking
statements are made as of today's date, and Neonode undertakes no duty to update or revise them.
NEONODE
INC.
CONSOLIDATED
BALANCE SHEETS
(In
thousands, except share and per share amounts)
| | |
As of
December 31,
2020 | | |
As of
December 31,
2019 | |
| ASSETS | |
| | |
| |
| Current assets: | |
| | |
| |
| Cash | |
$ | 10,473 | | |
$ | 2,357 | |
| Accounts receivable and unbilled revenues, net | |
| 1,743 | | |
| 1,324 | |
| Projects in process | |
| - | | |
| 8 | |
| Inventory | |
| 1,273 | | |
| 1,030 | |
| Prepaid expenses and other current assets | |
| 1,161 | | |
| 715 | |
| Total current assets | |
| 14,650 | | |
| 5,434 | |
| | |
| | | |
| | |
| Investment in joint venture | |
| - | | |
| 3 | |
| Property and equipment, net | |
| 1,003 | | |
| 1,583 | |
| Operating lease right-of-use assets | |
| 919 | | |
| 416 | |
| Total assets | |
$ | 16,572 | | |
$ | 7,436 | |
| | |
| | | |
| | |
| LIABILITIES AND STOCKHOLDERS’ EQUITY | |
| | | |
| | |
| Current liabilities: | |
| | | |
| | |
| Accounts payable | |
$ | 1,084 | | |
$ | 555 | |
| Accrued payroll and employee benefits | |
| 1,170 | | |
| 960 | |
| Accrued expenses | |
| 545 | | |
| 541 | |
| Deferred revenues | |
| 138 | | |
| 67 | |
| Current portion of finance lease obligations | |
| 769 | | |
| 568 | |
| Current portion of operating lease obligations | |
| 504 | | |
| 332 | |
| Total current liabilities | |
| 4,210 | | |
| 3,023 | |
| | |
| | | |
| | |
| Finance lease obligations, net of current portion | |
| 95 | | |
| 508 | |
| Operating lease obligations, net of current portion | |
| 377 | | |
| 58 | |
| Total liabilities | |
| 4,682 | | |
| 3,589 | |
| | |
| | | |
| | |
| Commitments and contingencies | |
| | | |
| | |
| | |
| | | |
| | |
| Stockholders’ equity: | |
| | | |
| | |
| Common stock, 25,000,000 shares authorized, with par value of $0.001; 11,504,665 and 9,171,154 shares issued and outstanding at December 31, 2020 and 2019, respectively | |
| 12 | | |
| 9 | |
| Additional paid-in capital | |
| 211,663 | | |
| 197,543 | |
| Accumulated other comprehensive loss | |
| (404 | ) | |
| (639 | ) |
| Accumulated deficit | |
| (196,158 | ) | |
| (190,520 | ) |
| Total Neonode Inc. stockholders’ equity | |
| 15,113 | | |
| 6,393 | |
| Noncontrolling interests | |
| (3,223 | ) | |
| (2,546 | ) |
| Total stockholders’ equity | |
| 11,890 | | |
| 3,847 | |
| Total liabilities and stockholders’ equity | |
$ | 16,572 | | |
$ | 7,436 | |
NEONODE
INC.
CONSOLIDATED
STATEMENTS OF OPERATIONS
(In
thousands, except per share amounts)
| | |
Years Ended | |
| | |
December 31,
2020 | | |
December 31,
2019 | |
| Revenues: | |
| | |
| |
| HMI Solutions | |
$ | 4,985 | | |
$ | 6,047 | |
| HMI Products | |
| 999 | | |
| 599 | |
| Total revenues | |
| 5,984 | | |
| 6,646 | |
| | |
| | | |
| | |
| Cost of revenues: | |
| | | |
| | |
| HMI Solutions | |
| 254 | | |
| 5 | |
| HMI Products | |
| 824 | | |
| 678 | |
| Total cost of revenues | |
| 1,078 | | |
| 683 | |
| | |
| | | |
| | |
| Total gross margin | |
| 4,906 | | |
| 5,963 | |
| | |
| | | |
| | |
| Operating expenses: | |
| | | |
| | |
| Research and development | |
| 4,139 | | |
| 5,239 | |
| Sales and marketing | |
| 2,534 | | |
| 2,158 | |
| General and administrative | |
| 4,424 | | |
| 4,296 | |
| | |
| | | |
| | |
| Total operating expenses | |
| 11,097 | | |
| 11,693 | |
| Operating loss | |
| (6,191 | ) | |
| (5,730 | ) |
| | |
| | | |
| | |
| Other expense: | |
| | | |
| | |
| Interest expense | |
| (27 | ) | |
| (34 | ) |
| Other expense | |
| (5 | ) | |
| - | |
| Total other expense | |
| (32 | ) | |
| (34 | ) |
| | |
| | | |
| | |
| Loss before provision for income taxes | |
| (6,223 | ) | |
| (5,764 | ) |
| | |
| | | |
| | |
| Provision for income taxes | |
| 59 | | |
| 38 | |
| Net loss including noncontrolling interests | |
| (6,282 | ) | |
| (5,802 | ) |
| Less: net loss attributable to noncontrolling interests | |
| 677 | | |
| 504 | |
| Net loss attributable to Neonode Inc. | |
| (5,605 | ) | |
| (5,298 | ) |
| Preferred dividends | |
| (33 | ) | |
| - | |
| Net loss attributable to common shareholders of Neonode Inc. | |
$ | (5,638 | ) | |
$ | (5,298 | ) |
| | |
| | | |
| | |
| Loss per common share: | |
| | | |
| | |
| Basic and diluted loss per share | |
$ | (0.56 | ) | |
$ | (0.60 | ) |
| Basic and diluted – weighted average number of common shares outstanding | |
| 9,989 | | |
| 8,844 | |
NEONODE
INC.
CONSOLIDATED
STATEMENTS OF COMPREHENSIVE LOSS
(In
thousands)
| | |
Years Ended | |
| | |
December 31,
2020 | | |
December 31,
2019 | |
| | |
| | |
| |
| Net loss including noncontrolling interests | |
$ | (6,282 | ) | |
$ | (5,802 | ) |
| Other comprehensive income (loss): | |
| | | |
| | |
| Foreign currency translation adjustments | |
| 235 | | |
| (183 | ) |
| Comprehensive loss | |
| (6,047 | ) | |
| (5,985 | ) |
| Less: Comprehensive loss attributable to noncontrolling interests | |
| 677 | | |
| 504 | |
| Comprehensive loss attributable to Neonode Inc. | |
$ | (5,370 | ) | |
$ | (5,481 | ) |
NEONODE
INC.
CONSOLIDATED
STATEMENTS OF STOCKHOLDERS’ EQUITY
(In
thousands, except for Preferred Stock Shares Issued)
| | |
Preferred
Stock
Shares
Issued | | |
Preferred
Stock
Amount | | |
Common
Stock Shares
Issued | | |
Common
Stock
Amount | | |
Additional
Paid-in
Capital | | |
Accumulated
Other
Comprehensive
Income (Loss) | | |
Accumulated
Deficit | | |
Total
Neonode Inc.
Stockholders’
Equity | | |
Noncontrolling
Interests | | |
Total
Stockholders’
Equity | |
| Balances,
January 1, 2019 | |
| 82 | | |
$ | - | | |
| 8,800 | | |
$ | 9 | | |
$ | 197,507 | | |
$ | (456 | ) | |
$ | (185,222 | ) | |
$ | 11,838 | | |
$ | (2,042 | ) | |
$ | 9,796 | |
| | |
| | | |
| | | |
| | | |
| | | |
| | | |
| | | |
| | | |
| | | |
| | | |
| | |
| Common
stock issued upon exercise of common stock warrants | |
| - | | |
| - | | |
| 360 | | |
| - | | |
| 36 | | |
| - | | |
| - | | |
| 36 | | |
| - | | |
| 36 | |
| | |
| | | |
| | | |
| | | |
| | | |
| | | |
| | | |
| | | |
| | | |
| | | |
| | |
| Conversion
of Series B Preferred Stock to common stock | |
| (82 | ) | |
| - | | |
| 11 | | |
| - | | |
| - | | |
| - | | |
| - | | |
| - | | |
| - | | |
| - | |
| | |
| | | |
| | | |
| | | |
| | | |
| | | |
| | | |
| | | |
| | | |
| | | |
| | |
| Foreign
currency translation adjustment | |
| - | | |
| - | | |
| - | | |
| - | | |
| - | | |
| (183 | ) | |
| - | | |
| (183 | ) | |
| - | | |
| (183 | ) |
| | |
| | | |
| | | |
| | | |
| | | |
| | | |
| | | |
| | | |
| | | |
| | | |
| | |
| Net
loss | |
| - | | |
| - | | |
| - | | |
| - | | |
| - | | |
| - | | |
| (5,298 | ) | |
| (5,298 | ) | |
| (504 | ) | |
| (5,802 | ) |
| | |
| | | |
| | | |
| | | |
| | | |
| | | |
| | | |
| | | |
| | | |
| | | |
| | |
| Balances,
December 31, 2019 | |
| - | | |
| - | | |
| 9,171 | | |
| 9 | | |
| 197,543 | | |
| (639 | ) | |
| (190,520 | ) | |
| 6,393 | | |
| (2,546 | ) | |
| 3,847 | |
| | |
| | | |
| | | |
| | | |
| | | |
| | | |
| | | |
| | | |
| | | |
| | | |
| | |
| Issuance
of shares for cash, net of offering costs | |
| 3,932 | | |
| 3,932 | | |
| 1,612 | | |
| 1 | | |
| 9,597 | | |
| - | | |
| - | | |
| 13,530 | | |
| - | | |
| 13,530 | |
| | |
| | | |
| | | |
| | | |
| | | |
| | | |
| | | |
| | | |
| | | |
| | | |
| | |
| Series
C-2 Preferred Stock issued for repayment of short-term borrowings and accrued interest | |
| 517 | | |
| 517 | | |
| - | | |
| - | | |
| (1 | ) | |
| - | | |
| - | | |
| 516 | | |
| - | | |
| 516 | |
| | |
| | | |
| | | |
| | | |
| | | |
| | | |
| | | |
| | | |
| | | |
| | | |
| | |
| Conversion
of Series C-1 and C-2. Preferred Stock to common stock | |
| (4,449 | ) | |
| (4,449 | ) | |
| 684 | | |
| 1 | | |
| 4,448 | | |
| - | | |
| - | | |
| - | | |
| - | | |
| - | |
| | |
| | | |
| | | |
| | | |
| | | |
| | | |
| | | |
| | | |
| | | |
| | | |
| | |
| Preferred
dividends | |
| - | | |
| - | | |
| - | | |
| - | | |
| - | | |
| - | | |
| (33 | ) | |
| (33 | ) | |
| - | | |
| (33 | ) |
| | |
| | | |
| | | |
| | | |
| | | |
| | | |
| | | |
| | | |
| | | |
| | | |
| | |
| Stock-based
compensation | |
| - | | |
| - | | |
| 37 | | |
| 1 | | |
| 76 | | |
| - | | |
| - | | |
| 77 | | |
| - | | |
| 77 | |
| | |
| | | |
| | | |
| | | |
| | | |
| | | |
| | | |
| | | |
| | | |
| | | |
| | |
| Foreign
currency translation adjustment | |
| - | | |
| - | | |
| - | | |
| - | | |
| - | | |
| 235 | | |
| - | | |
| 235 | | |
| - | | |
| 235 | |
| | |
| | | |
| | | |
| | | |
| | | |
| | | |
| | | |
| | | |
| | | |
| | | |
| | |
| Net
loss | |
| - | | |
| - | | |
| - | | |
| - | | |
| - | | |
| - | | |
| (5,605 | ) | |
| (5,605 | ) | |
| (677 | ) | |
| (6,282 | ) |
| Balances,
December 31, 2020 | |
| - | | |
$ | - | | |
| 11,504 | | |
$ | 12 | | |
$ | 211,663 | | |
$ | (404 | ) | |
$ | (196,158 | ) | |
$ | 15,113 | | |
$ | (3,223 | ) | |
$ | 11,890 | |
NEONODE
INC.
CONSOLIDATED
STATEMENTS OF CASH FLOWS
(In
thousands)
| | |
Years Ended | |
| | |
December 31,
2020 | | |
December 31,
2019 | |
| | |
| | |
| |
| Cash flows from operating activities: | |
| | |
| |
| Net loss (including noncontrolling interests) | |
$ | (6,282 | ) | |
$ | (5,802 | ) |
| Adjustments to reconcile net loss to net cash used in operating activities: | |
| | | |
| | |
| Stock-based compensation expense | |
| 77 | | |
| - | |
| Bad debt expense | |
| - | | |
| 105 | |
| Write-off of prepaids | |
| - | | |
| 414 | |
| Depreciation and amortization | |
| 767 | | |
| 855 | |
| Amortization of operating lease right-of-use assets | |
| 405 | | |
| 404 | |
| Loss on disposal of property and equipment | |
| 5 | | |
| - | |
| Changes in operating assets and liabilities: | |
| | | |
| | |
| Accounts receivable and unbilled revenue, net | |
| (394 | ) | |
| 397 | |
| Projects in process | |
| 8 | | |
| (8 | ) |
| Inventory | |
| (91 | ) | |
| 124 | |
| Prepaid expenses and other current assets | |
| (375 | ) | |
| (19 | ) |
| Accounts payable and accrued expenses | |
| 444 | | |
| 454 | |
| Deferred revenues | |
| 64 | | |
| (429 | ) |
| Operating lease obligations | |
| (380 | ) | |
| (12 | ) |
| | |
| | | |
| | |
| Net cash used in operating activities | |
| (5,752 | ) | |
| (3,517 | ) |
| | |
| | | |
| | |
| Cash flows from investing activities: | |
| | | |
| | |
| Purchase of property and equipment | |
| (60 | ) | |
| (89 | ) |
| Sale of investment in joint venture | |
| 2 | | |
| - | |
| | |
| | | |
| | |
| Net cash used in investing activities | |
| (58 | ) | |
| (89 | ) |
| | |
| | | |
| | |
| Cash flow from financing activities: | |
| | | |
| | |
| Proceeds from issuance of common stock and warrants, net of offering costs | |
| - | | |
| 36 | |
| Proceeds from issuance of preferred and common stock, net of offering costs | |
| 13,530 | | |
| - | |
| Preferred dividends | |
| (33 | ) | |
| - | |
| Proceeds from short-term borrowings | |
| 966 | | |
| - | |
| Proceeds from short-term tax credits | |
| 542 | | |
| - | |
| Payments on short-term borrowings | |
| (516 | ) | |
| - | |
| Payments on short-term tax credits | |
| (557 | ) | |
| - | |
| Principal payments on finance lease obligations | |
| (321 | ) | |
| (535 | ) |
| Net cash provided by (used in) financing activities | |
| 13,611 | | |
| (499 | ) |
| | |
| | | |
| | |
| Effect of exchange rate changes on cash | |
| 315 | | |
| (93 | ) |
| | |
| | | |
| | |
| Net change in cash | |
| 8,116 | | |
| (4,198 | ) |
| | |
| | | |
| | |
| Cash at beginning of year | |
| 2,357 | | |
| 6,555 | |
| | |
| | | |
| | |
| Cash at end of year | |
$ | 10,473 | | |
$ | 2,357 | |
| | |
| | | |
| | |
| Supplemental disclosure of cash flow information: | |
| | | |
| | |
| Cash paid for interest | |
$ | 27 | | |
$ | 34 | |
| Cash paid for income taxes | |
$ | 59 | | |
$ | 38 | |
| | |
| | | |
| | |
| Supplemental disclosure of non-cash investing and financing activities: | |
| | | |
| | |
| Short-term borrowings and accrued interest settled for Series C-2 Preferred Stock | |
$ | 516 | | |
$ | - | |
| Right-of-use asset obtained in exchange for lease obligations | |
$ | 864 | | |
$ | - | |
7
Exhibit
99.2

Neonode Inc. Fourth Quarter 2020 Presentation Dr. Urban Forssell, CEO Ms. Maria Ek, CFO Mr . Johan Swartz, Vice President HMI Products Mr . Jonas Wærn, Vice President HMI Solutions Mr . David Brunton, Head of Investor Relations March 10 , 2021
2 Disclaimer Copyright Neonode © 2001 - 2021 NASDAQ: NEON www.neonode.com This presentation contains oral and written statements of Neonode Inc. (“Neonode” or the “Company”) and its management and may contain, forward - looking statements within the meaning of the Private Securities Litigation Reform Act of 1995. Forward - looking statements include information about current expectations, potential financial performance or future events. These may also include statements about market and sales growth, financial results, use of free cash flow, product development and introduction, regulatory matters and sales efforts. They are based on assumptions, expectations and information available to the Company and its management and involve a number of known and unknown risks, uncertainties and other factors that may cause the Company’s actual results, levels of activity, performance or achievements to be materially different from any expressed or implied by these forward - looking statements. These uncertainties and risks include, but are not limited to, those outlined in filings of the Company with the U.S. Securities and Exchange Commission (the “SEC”) under the Securities Exchange Act of 1934, as amended, including sections entitled “Risk Factors” and “Management’s Discussion and Analysis of Financial Condition and Results of Operations.” You are advised to carefully consider these various risks, uncertainties and other factors. Forward - looking statements are made as of today’s date. The Company and its management undertake no duty to update or revise forward - looking statements. This presentation has been prepared by the Company based on its own information, as well as information from public sources. Certain of the information contained herein may be derived from information provided by industry sources. The Company believes such information is accurate and that the sources from which it has been obtained are reliable. However, the Company has not independently verified such information and cannot guarantee the accuracy of such information.
3 Strategy and Business Update Copyright Neonode © 2001 - 2021 NASDAQ: NEON www.neonode.com

4 Introduction Copyright Neonode © 2001 - 2021 NASDAQ: NEON www.neonode.com • 2020 was a very interesting year… • In Neonode we decided on a new direction for the company and developed radically new business strategies that we started executing on x 100% focus on B2B x Business organized into three separate business areas x Leveraging existing technolog and IP and applying it to new target segments • To support and drive the changeover we have recruited several strong team members both at our HQs in Stockholm, Sweden, and internationally • In parallel to implementing these changes we have continued to • Support existing customers • Innovate and improve on our different technology platforms
5 • Then came the COVID - 19 pandemic… Copyright Neonode © 2001 - 2021 NASDAQ: NEON www.neonode.com
6 • Coming out of 2020, we are well positioned to capitalize on current and future opportunities x Excellent team x Strong technology and IP portfolio x Well - recognized brand x Extensive, global ecosystem x Impressive and growing list of customers Copyright Neonode © 2001 - 2021 NASDAQ: NEON www.neonode.com • Now, during 2021, we continue to execute on our strategies and build our business pipeline

7 Business Area – HMI Products Copyright Neonode © 2001 - 2021 NASDAQ: NEON www.neonode.com Focuses on sales of Neonode’s innovative, plug - and - play sensor modules, using our reflective IR - based zForce technology that enable contactless touch, touch, and gesture sensing applications.

8 Neonode Contactless Touch Copyright Neonode © 2001 - 2021 NASDAQ: NEON www.neonode.com Touch, Contactless touch and gesture control for optimal user experiences The new normal for public interaction • High degree of design freedom – holographic touch or in - air touch with multiple configurations • Germ - free – preventing the spread of germs in public environments • Fast and simple integration – Neonode’s touch sensor module available off - the - shelf Neonode’s Technology at a Glance: x IR - based touch and gesture sensing technology x No need for overlays that compromises image quality x Works with any input x High scanning frequency x Enable the use of any material as a touch surface x Enable replacement of mechanical switches and controls x Allows for contactless operation, i.e. in - air touch and gesture control
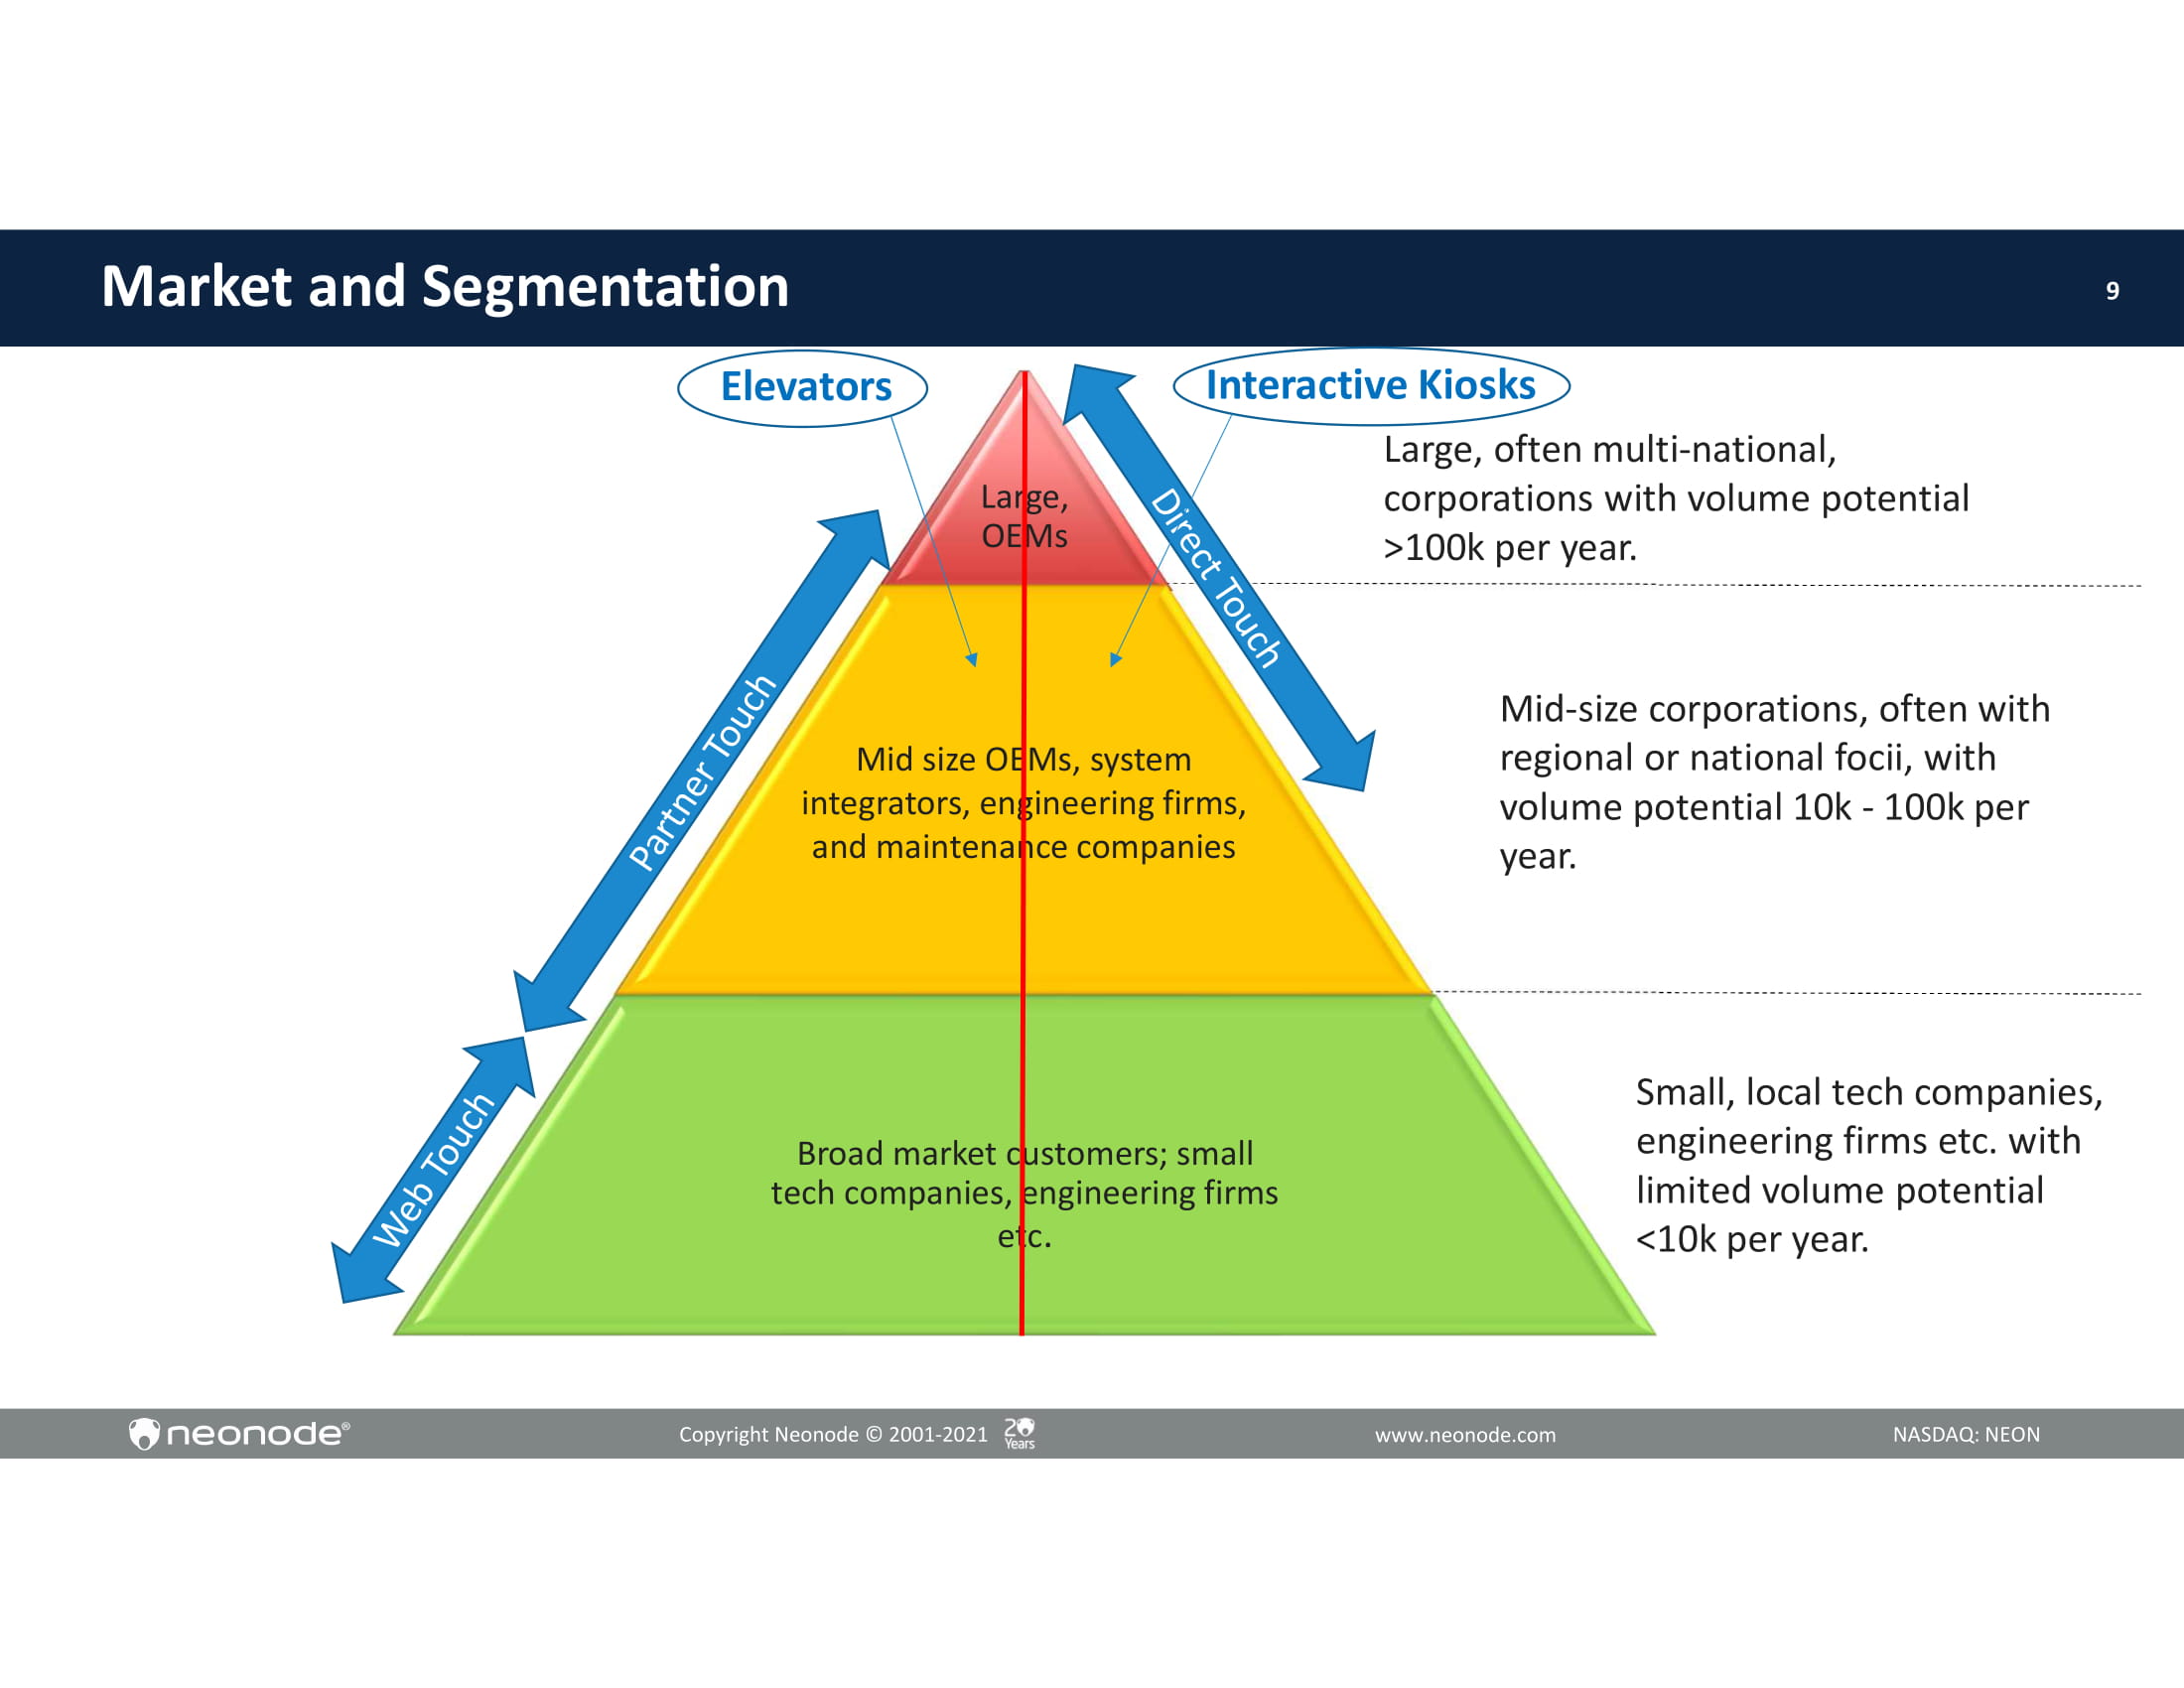
9 L a r g e, OE M s Broad market customers; small tech companies, engineering firms etc . Mid size OEMs, system integrators, engineering firms, and maintenance companies Mid - size corporations, often with regional or national focii, with volume potential 10k - 100k per year. Small, local tech companies, engineering firms etc. with limited volume potential <10k per year. Market and Segmentation Elevators Interactive Kiosks Large, often multi - national, corporations with volume potential >100k per year. Copyright Neonode © 2001 - 2021 NASDAQ: NEON www.neonode.com
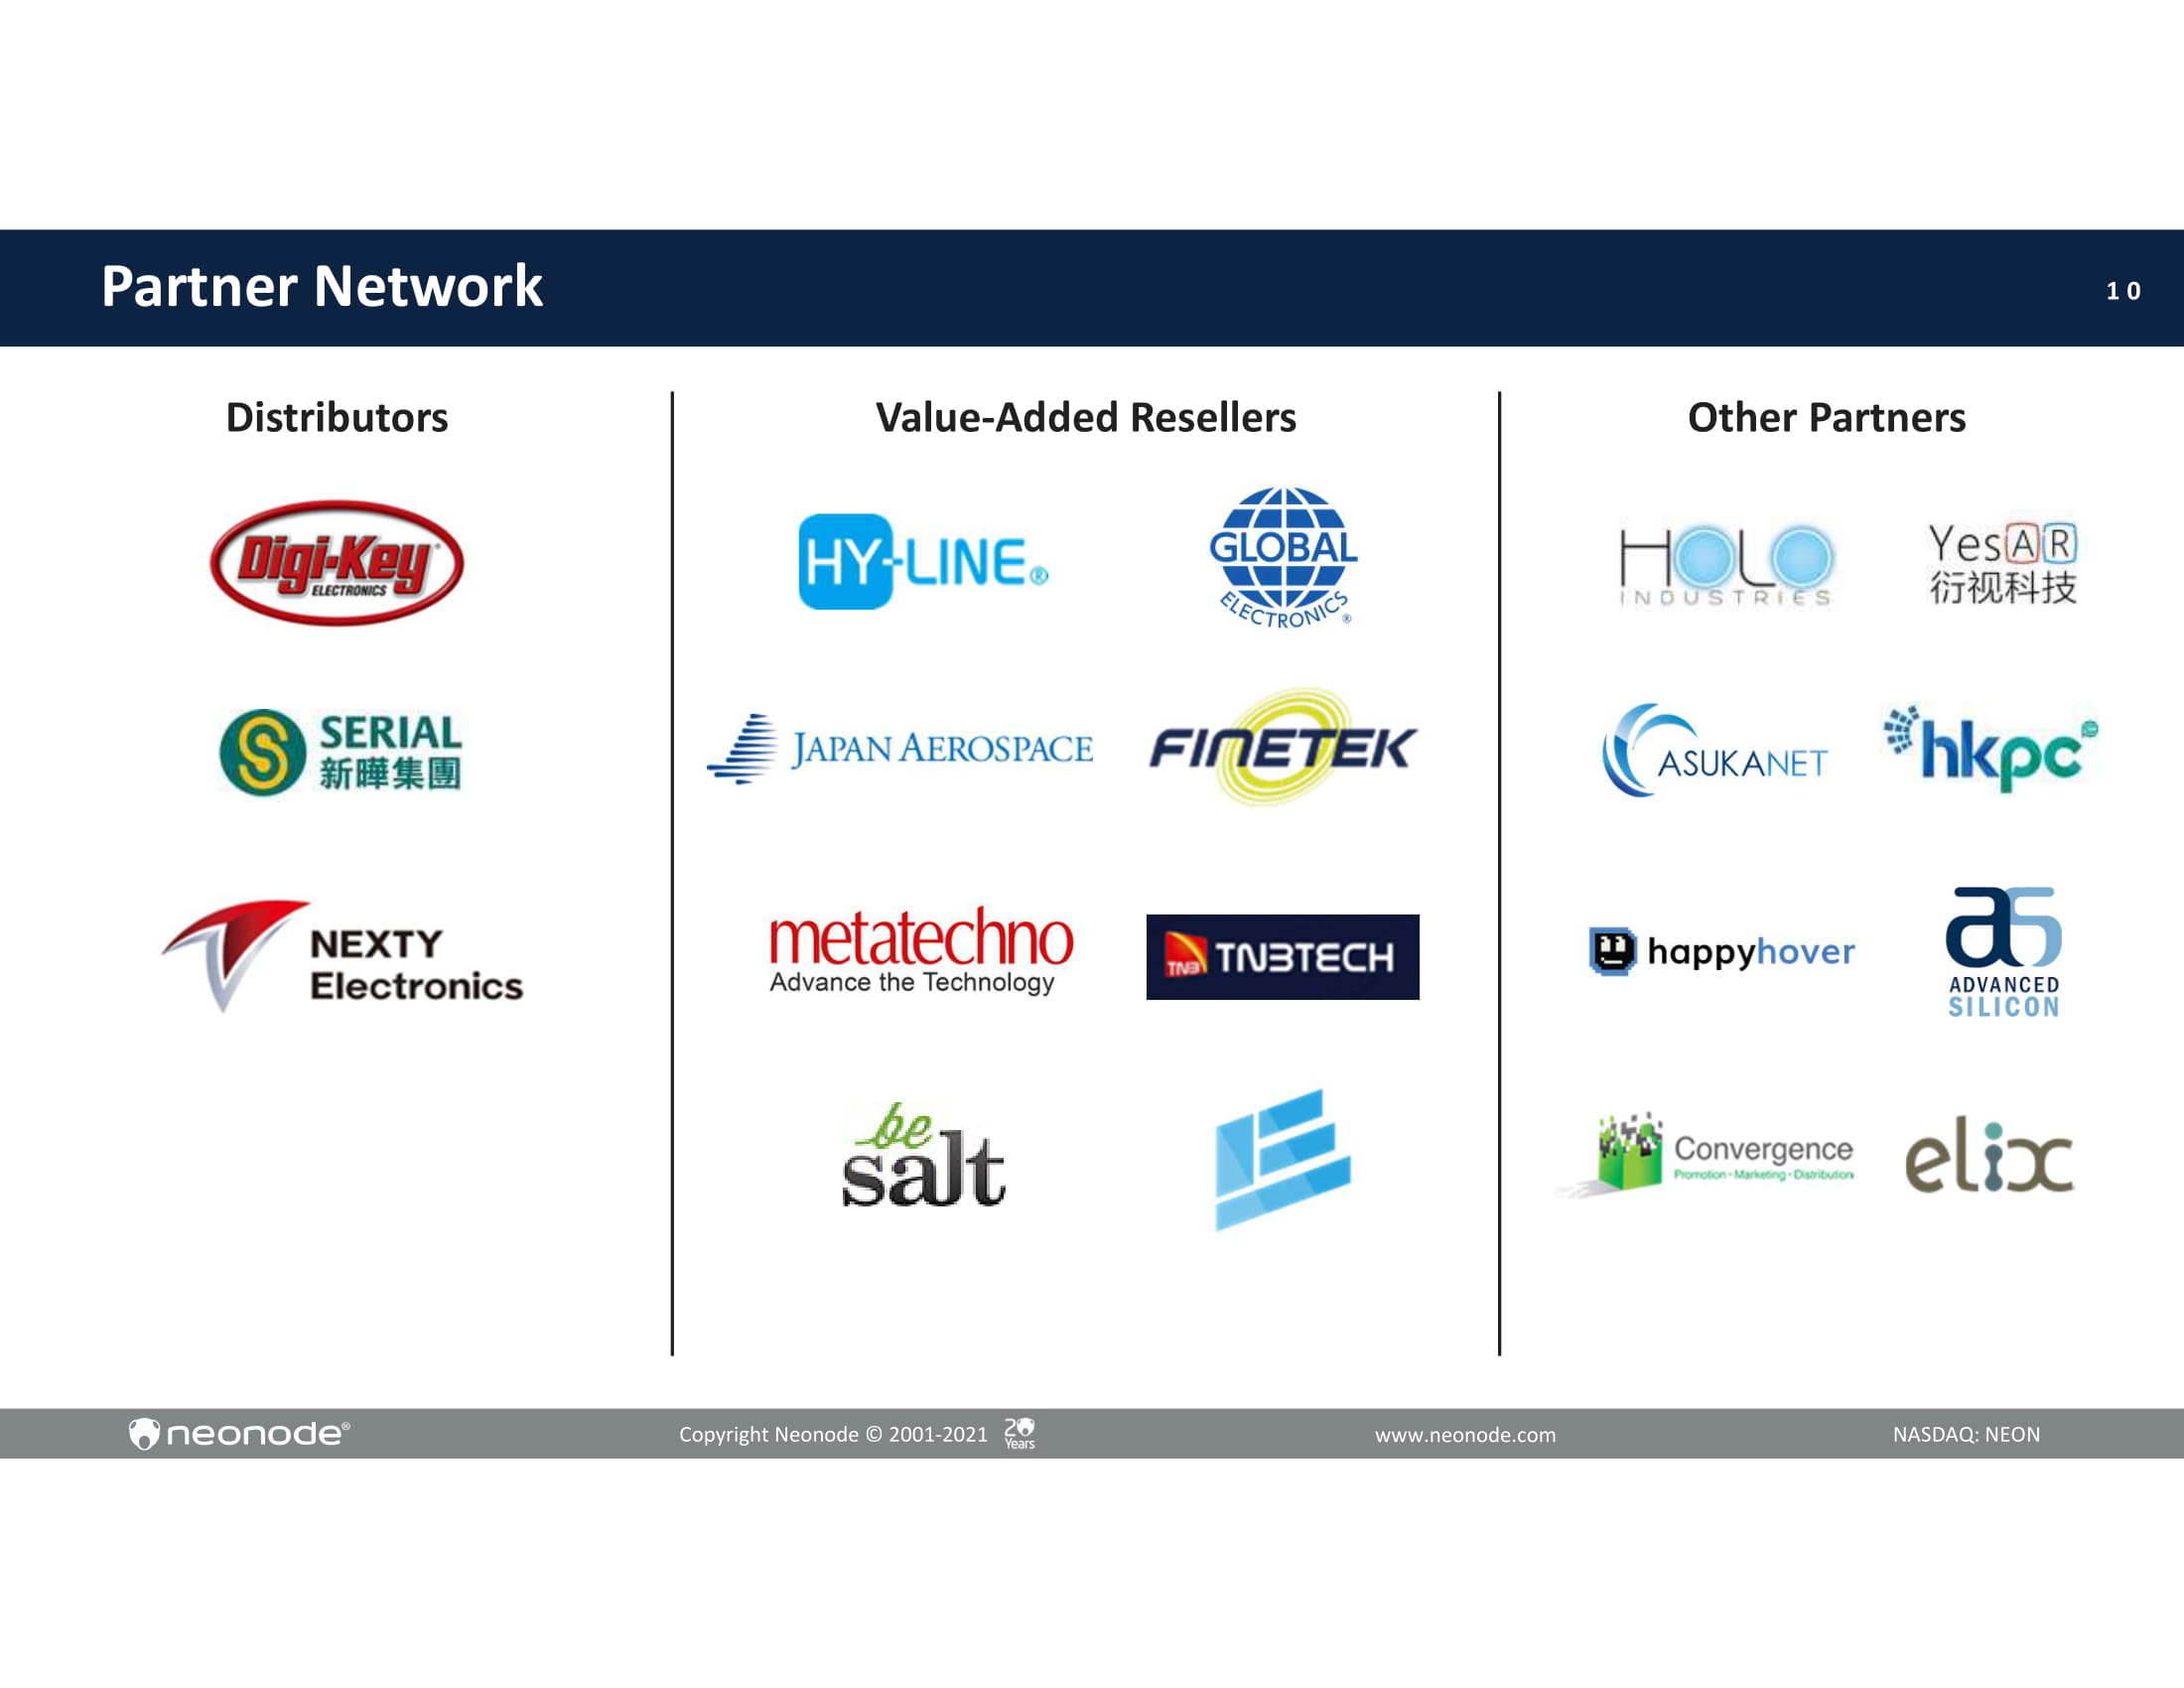
1 0 Partner Network D i s t r ib ut o r s Value - Added Resellers Other Partners Copyright Neonode © 2001 - 2021 NASDAQ: NEON www.neonode.com
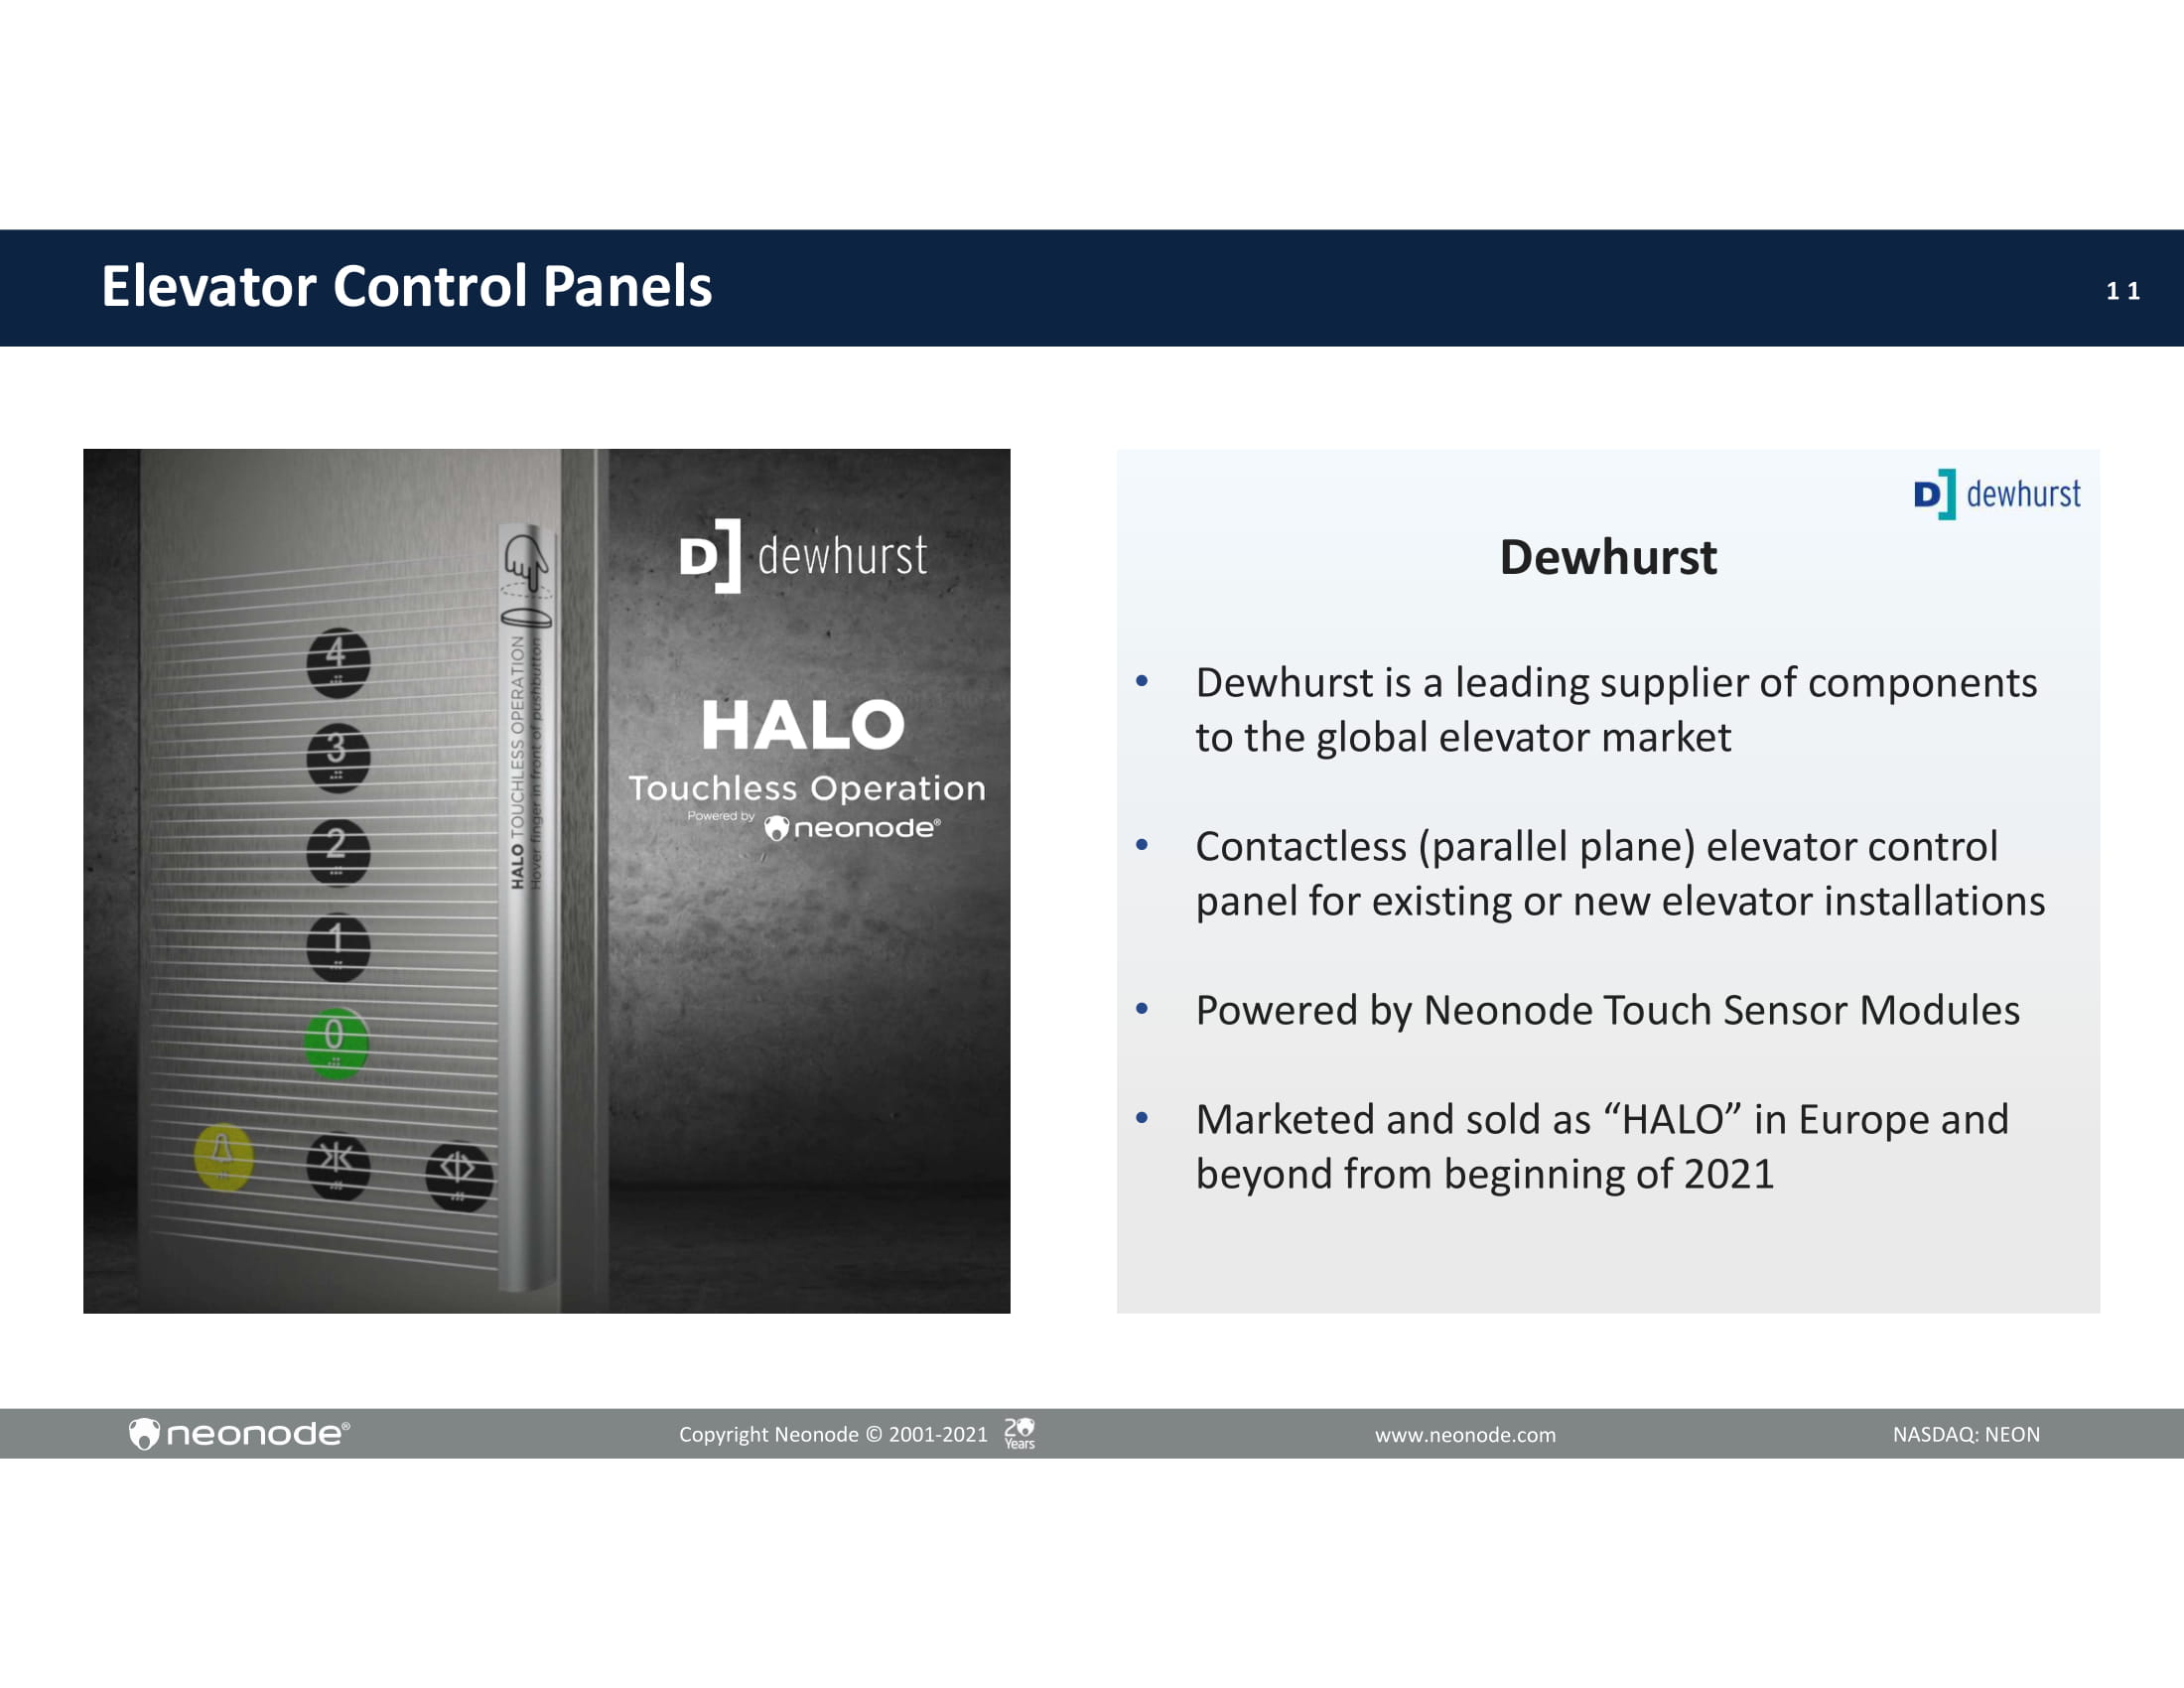
1 1 Elevator Control Panels Dewhurst • Dewhurst is a leading supplier of components to the global elevator market • Contactless (parallel plane) elevator control panel for existing or new elevator installations • Powered by Neonode Touch Sensor Modules • Marketed and sold as “HALO” in Europe and beyond from beginning of 2021 Copyright Neonode © 2001 - 2021 NASDAQ: NEON www.neonode.com

1 2 QSR PoS Kiosks Merim Groupe • Contactless (parallel plane) self - ordering system for quick service restaurants • Adaptable solution ideal for retrofitting on existing kiosks • Powered by Neonode Touch Sensor Modules • Marketed and sold as “AIR - CLICK” in Europe from beginning of 2021 Copyright Neonode © 2001 - 2021 NASDAQ: NEON www.neonode.com
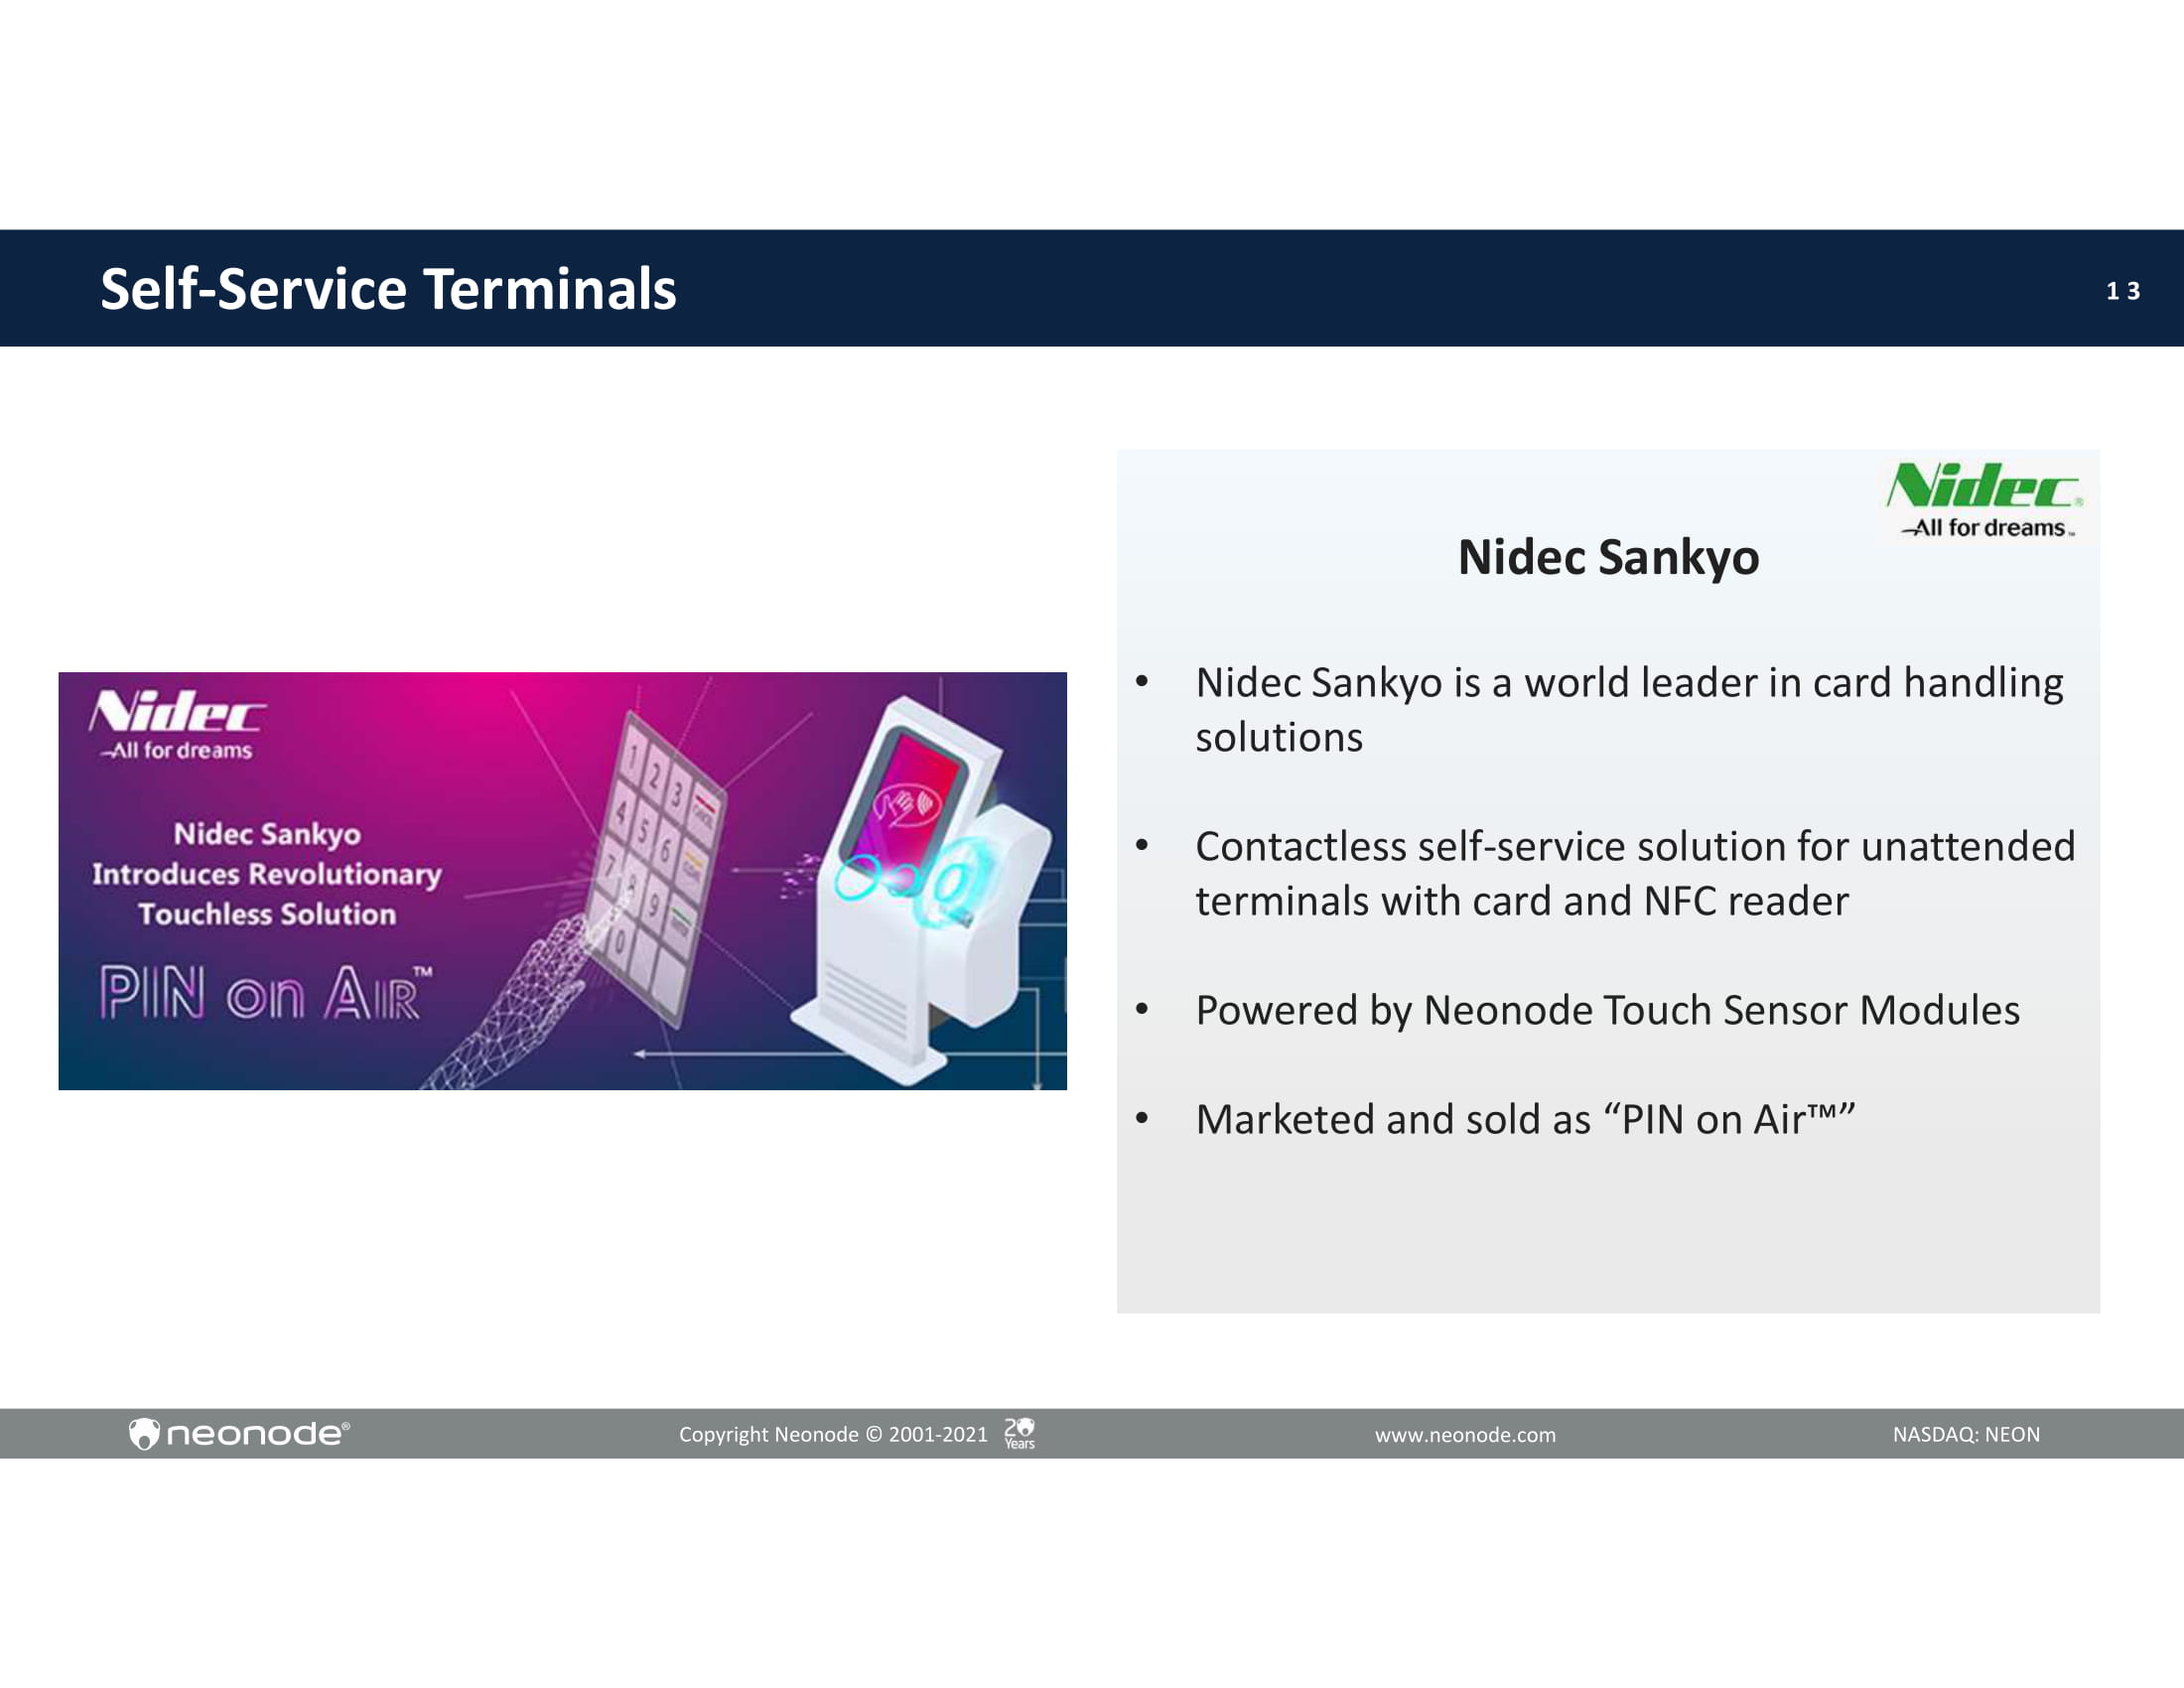
1 3 Nidec Sankyo • Nidec Sankyo is a world leader in card handling solutions • Contactless self - service solution for unattended terminals with card and NFC reader • Powered by Neonode Touch Sensor Modules • Marketed and sold as “PIN on Air Ρ ” Self - Service Terminals Copyright Neonode © 2001 - 2021 NASDAQ: NEON www.neonode.com
1 4 Business Area – HMI Solutions Copyright Neonode © 2001 - 2021 NASDAQ: NEON www.neonode.com Focuses on customized optical touch and gesture control solutions for demanding customers in the Military & Avionics and Industrial segments using our patented IR - based zForce technology.
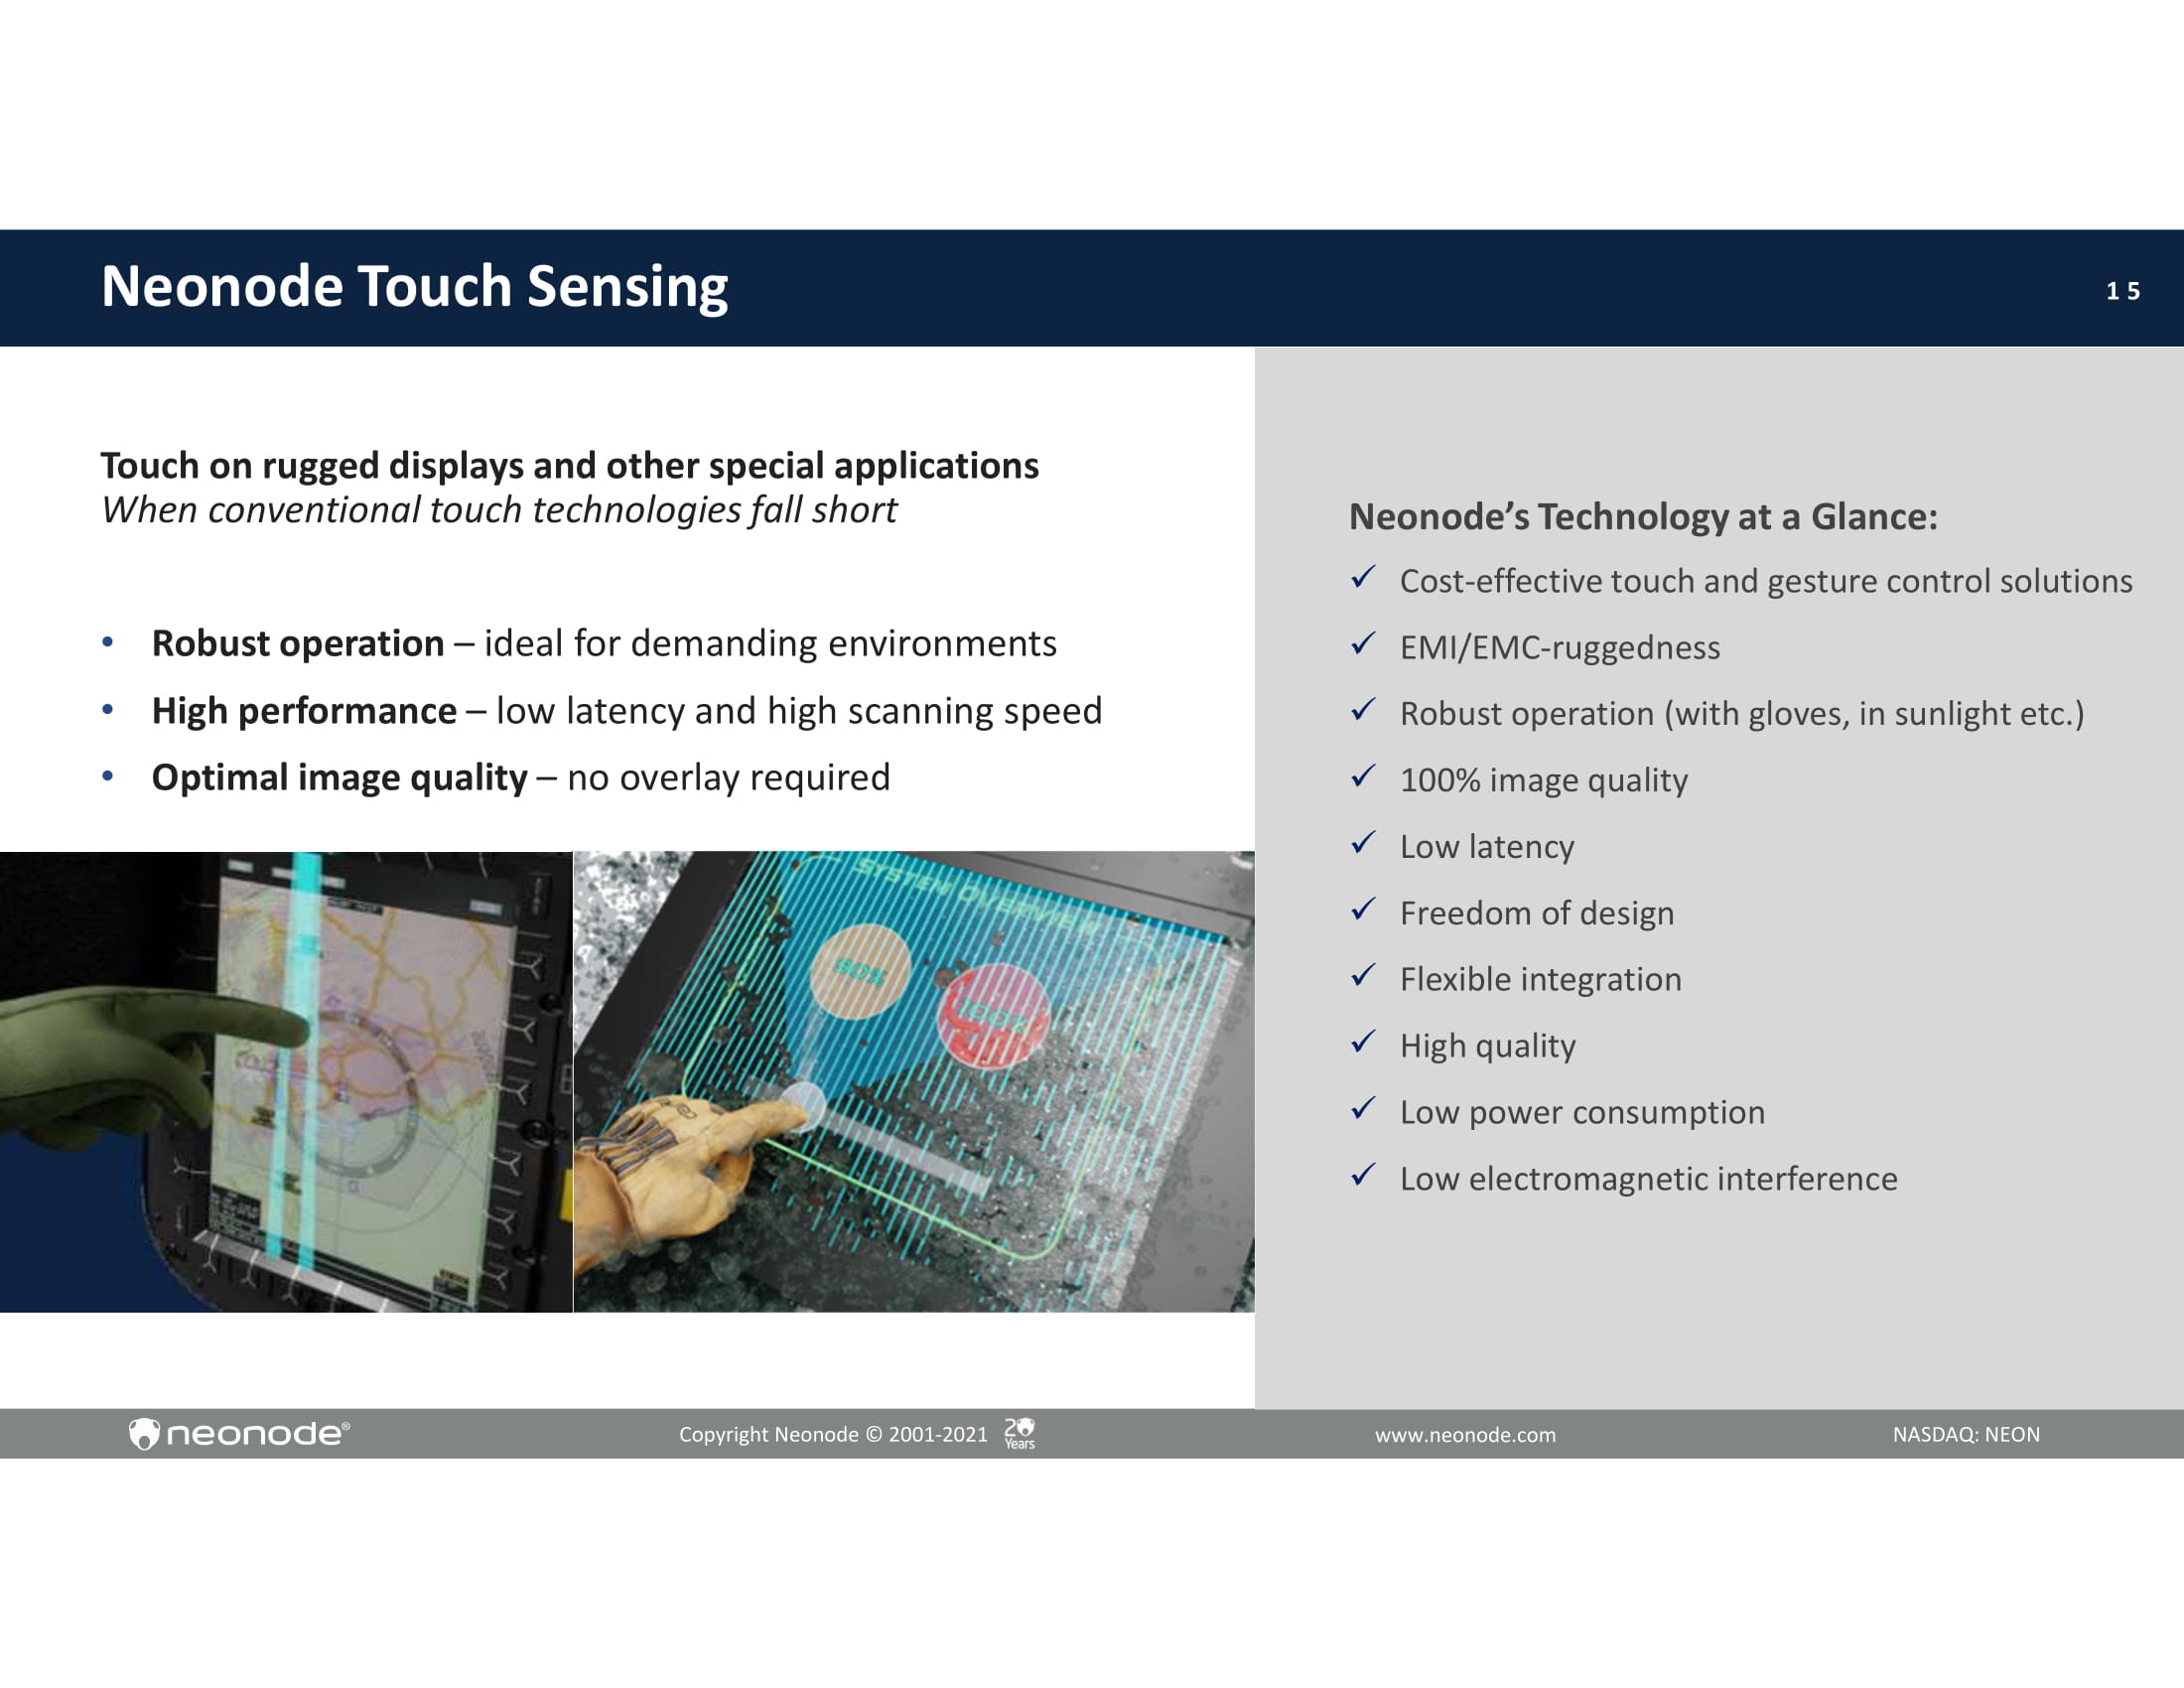
1 5 Neonode Touch Sensing Copyright Neonode © 2001 - 2021 NASDAQ: NEON www.neonode.com Touch on rugged displays and other special applications When conventional touch technologies fall short • Robust operation – ideal for demanding environments • High performance – low latency and high scanning speed • Optimal image quality – no overlay required Neonode’s Technology at a Glance: x Cost - effective touch and gesture control solutions x EMI/EMC - ruggedness x Robust operation (with gloves, in sunlight etc.) x 100% image quality x Low latency x Freedom of design x Flexible integration x High quality x Low power consumption x Low electromagnetic interference
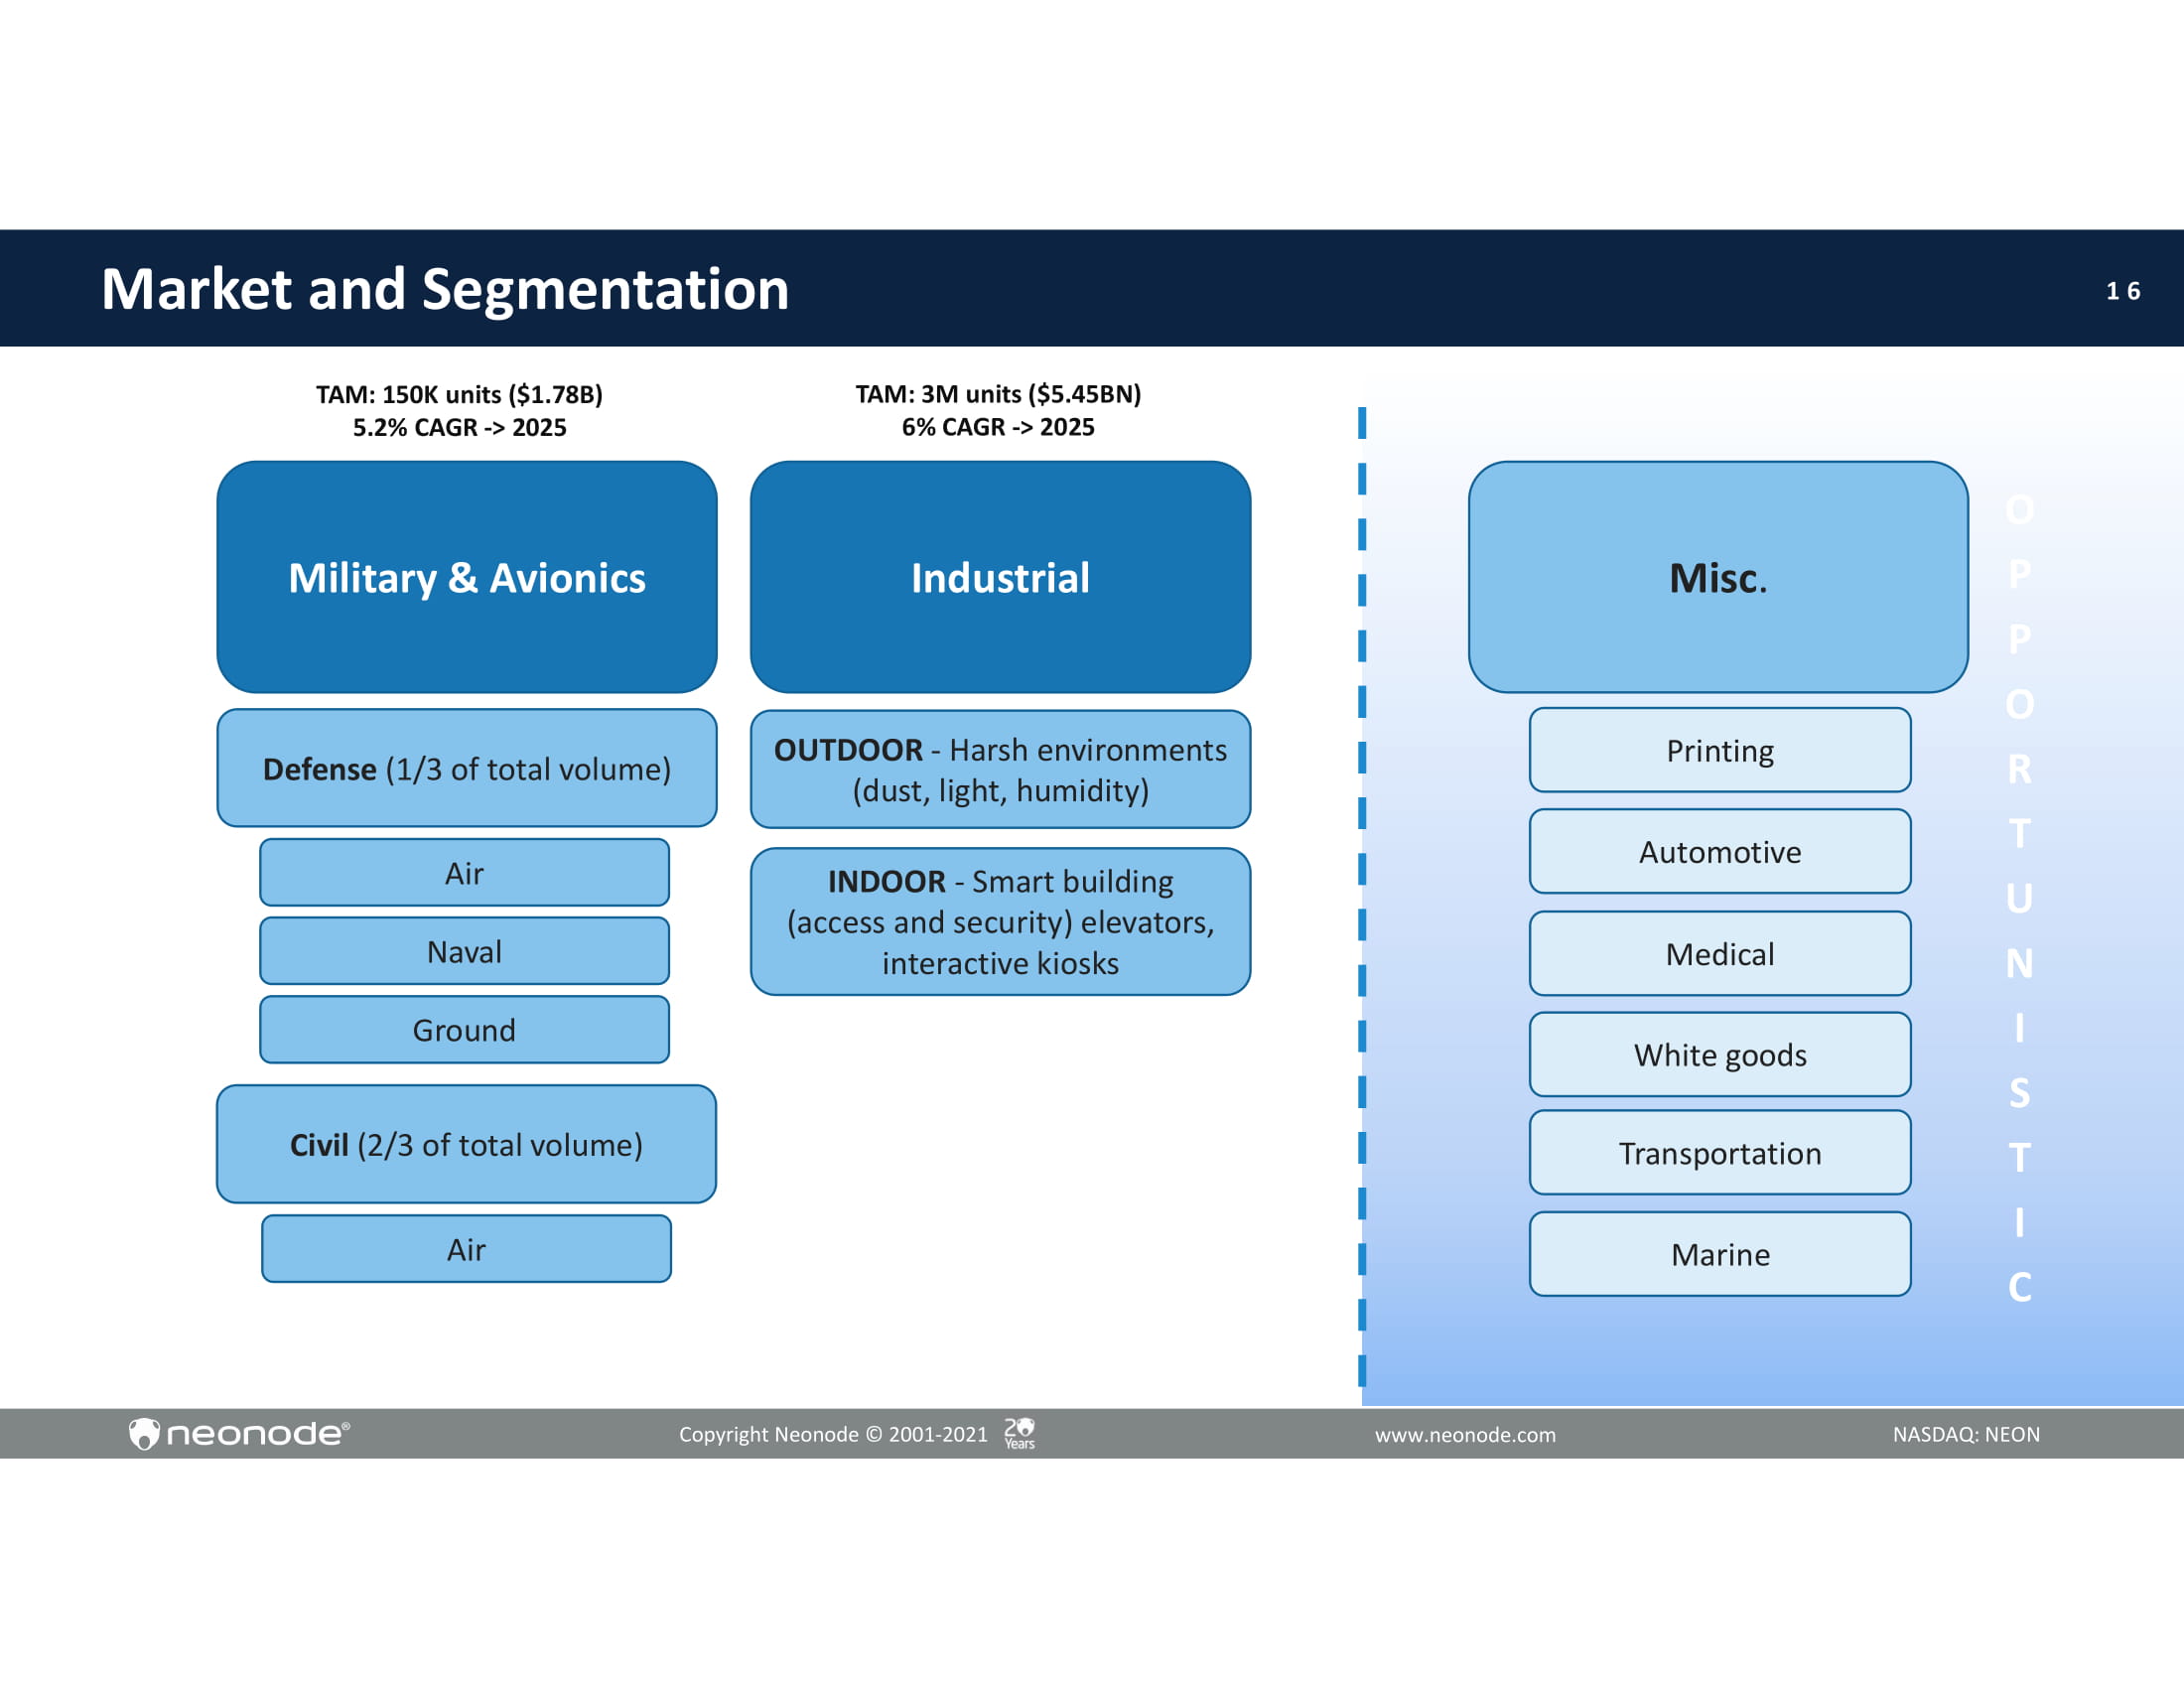
1 6 Printing Automotive Market and Segmentation Military & Avionics Industrial M i s c . Defense (1/3 of total volume) Civil (2/3 of total volume) M e d i c al Transportation White goods M ari n e OUTDOOR - Harsh environments (dust, light, humidity) INDOOR - Smart building (access and security) elevators, interactive kiosks T A M : 3 M un i ts ( $ 5 . 4 5 B N) 6% CAGR - > 2025 A i r N a v al G r o un d A i r Copyright Neonode © 2001 - 2021 NASDAQ: NEON www.neonode.com O P P O R T U N I S T I C TAM: 150K units ($1.78B) 5.2% CAGR - > 2025
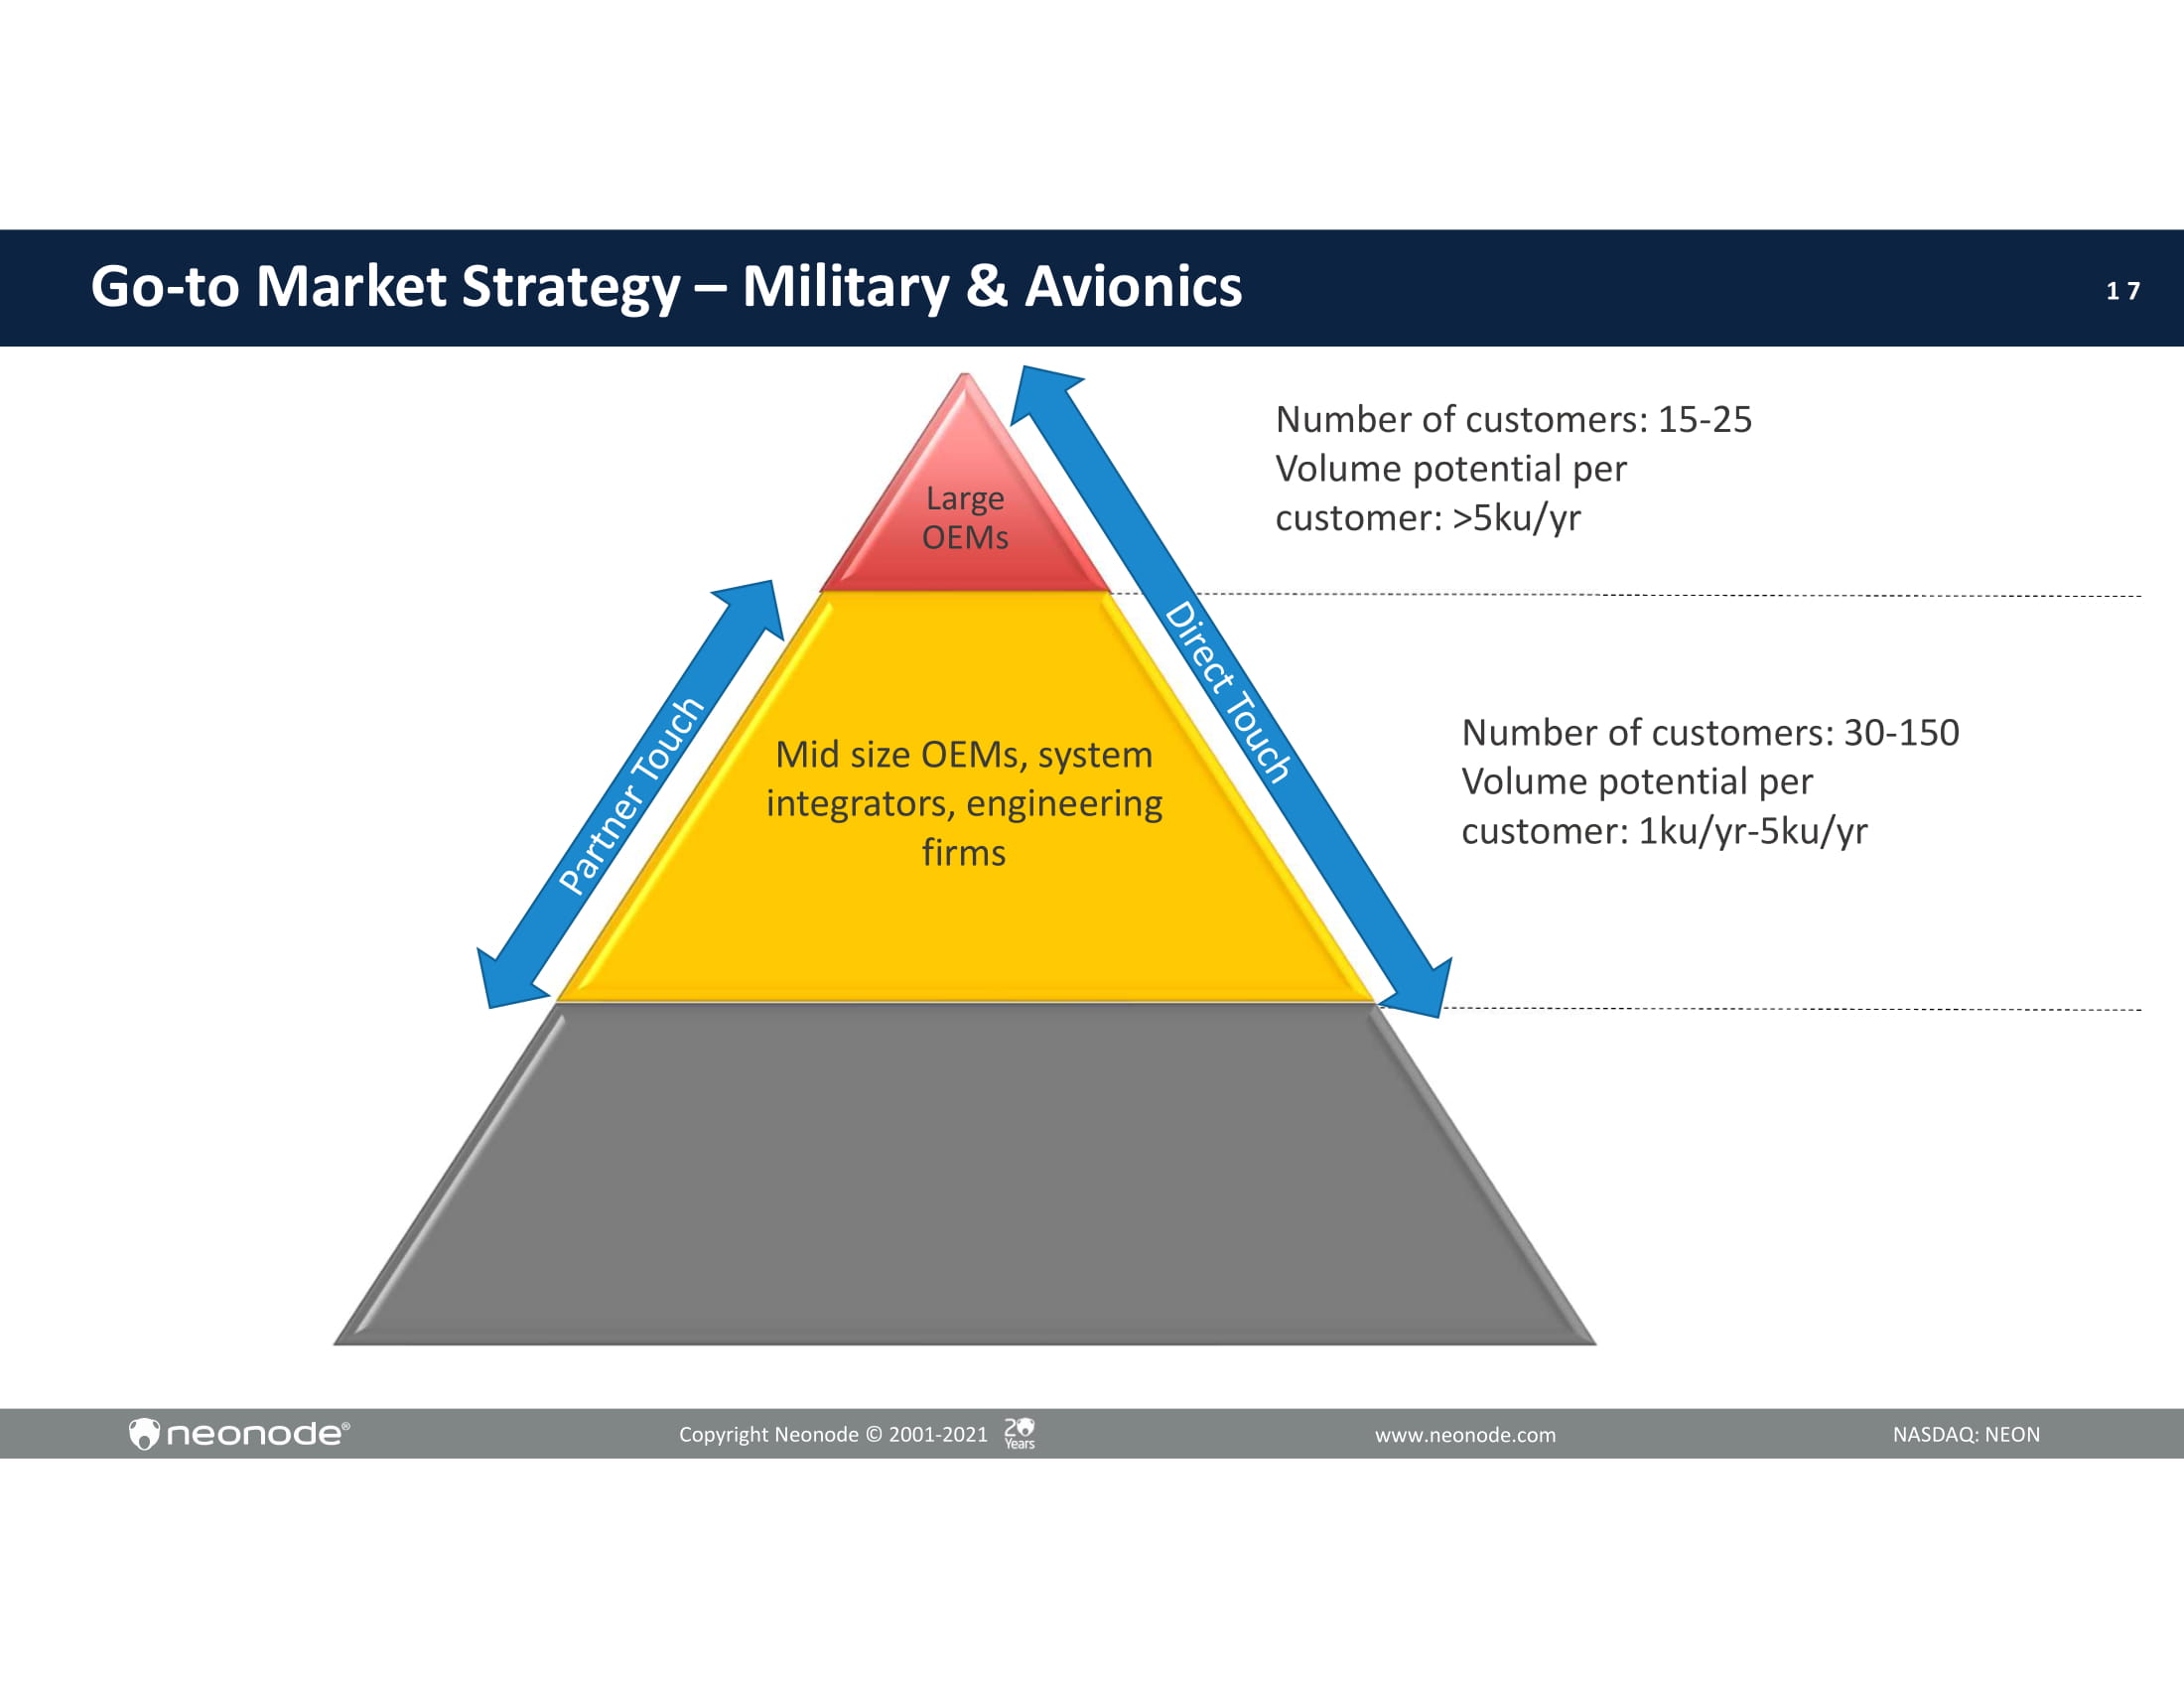
1 7 Go - to Market Strategy – Military & Avionics Large OE M s Mid size OEMs, system integrators, engineering firms Number of customers: 15 - 25 Volume potential per customer: >5ku/yr Copyright Neonode © 2001 - 2021 NASDAQ: NEON www.neonode.com Number of customers: 30 - 150 Volume potential per customer: 1ku/yr - 5ku/yr
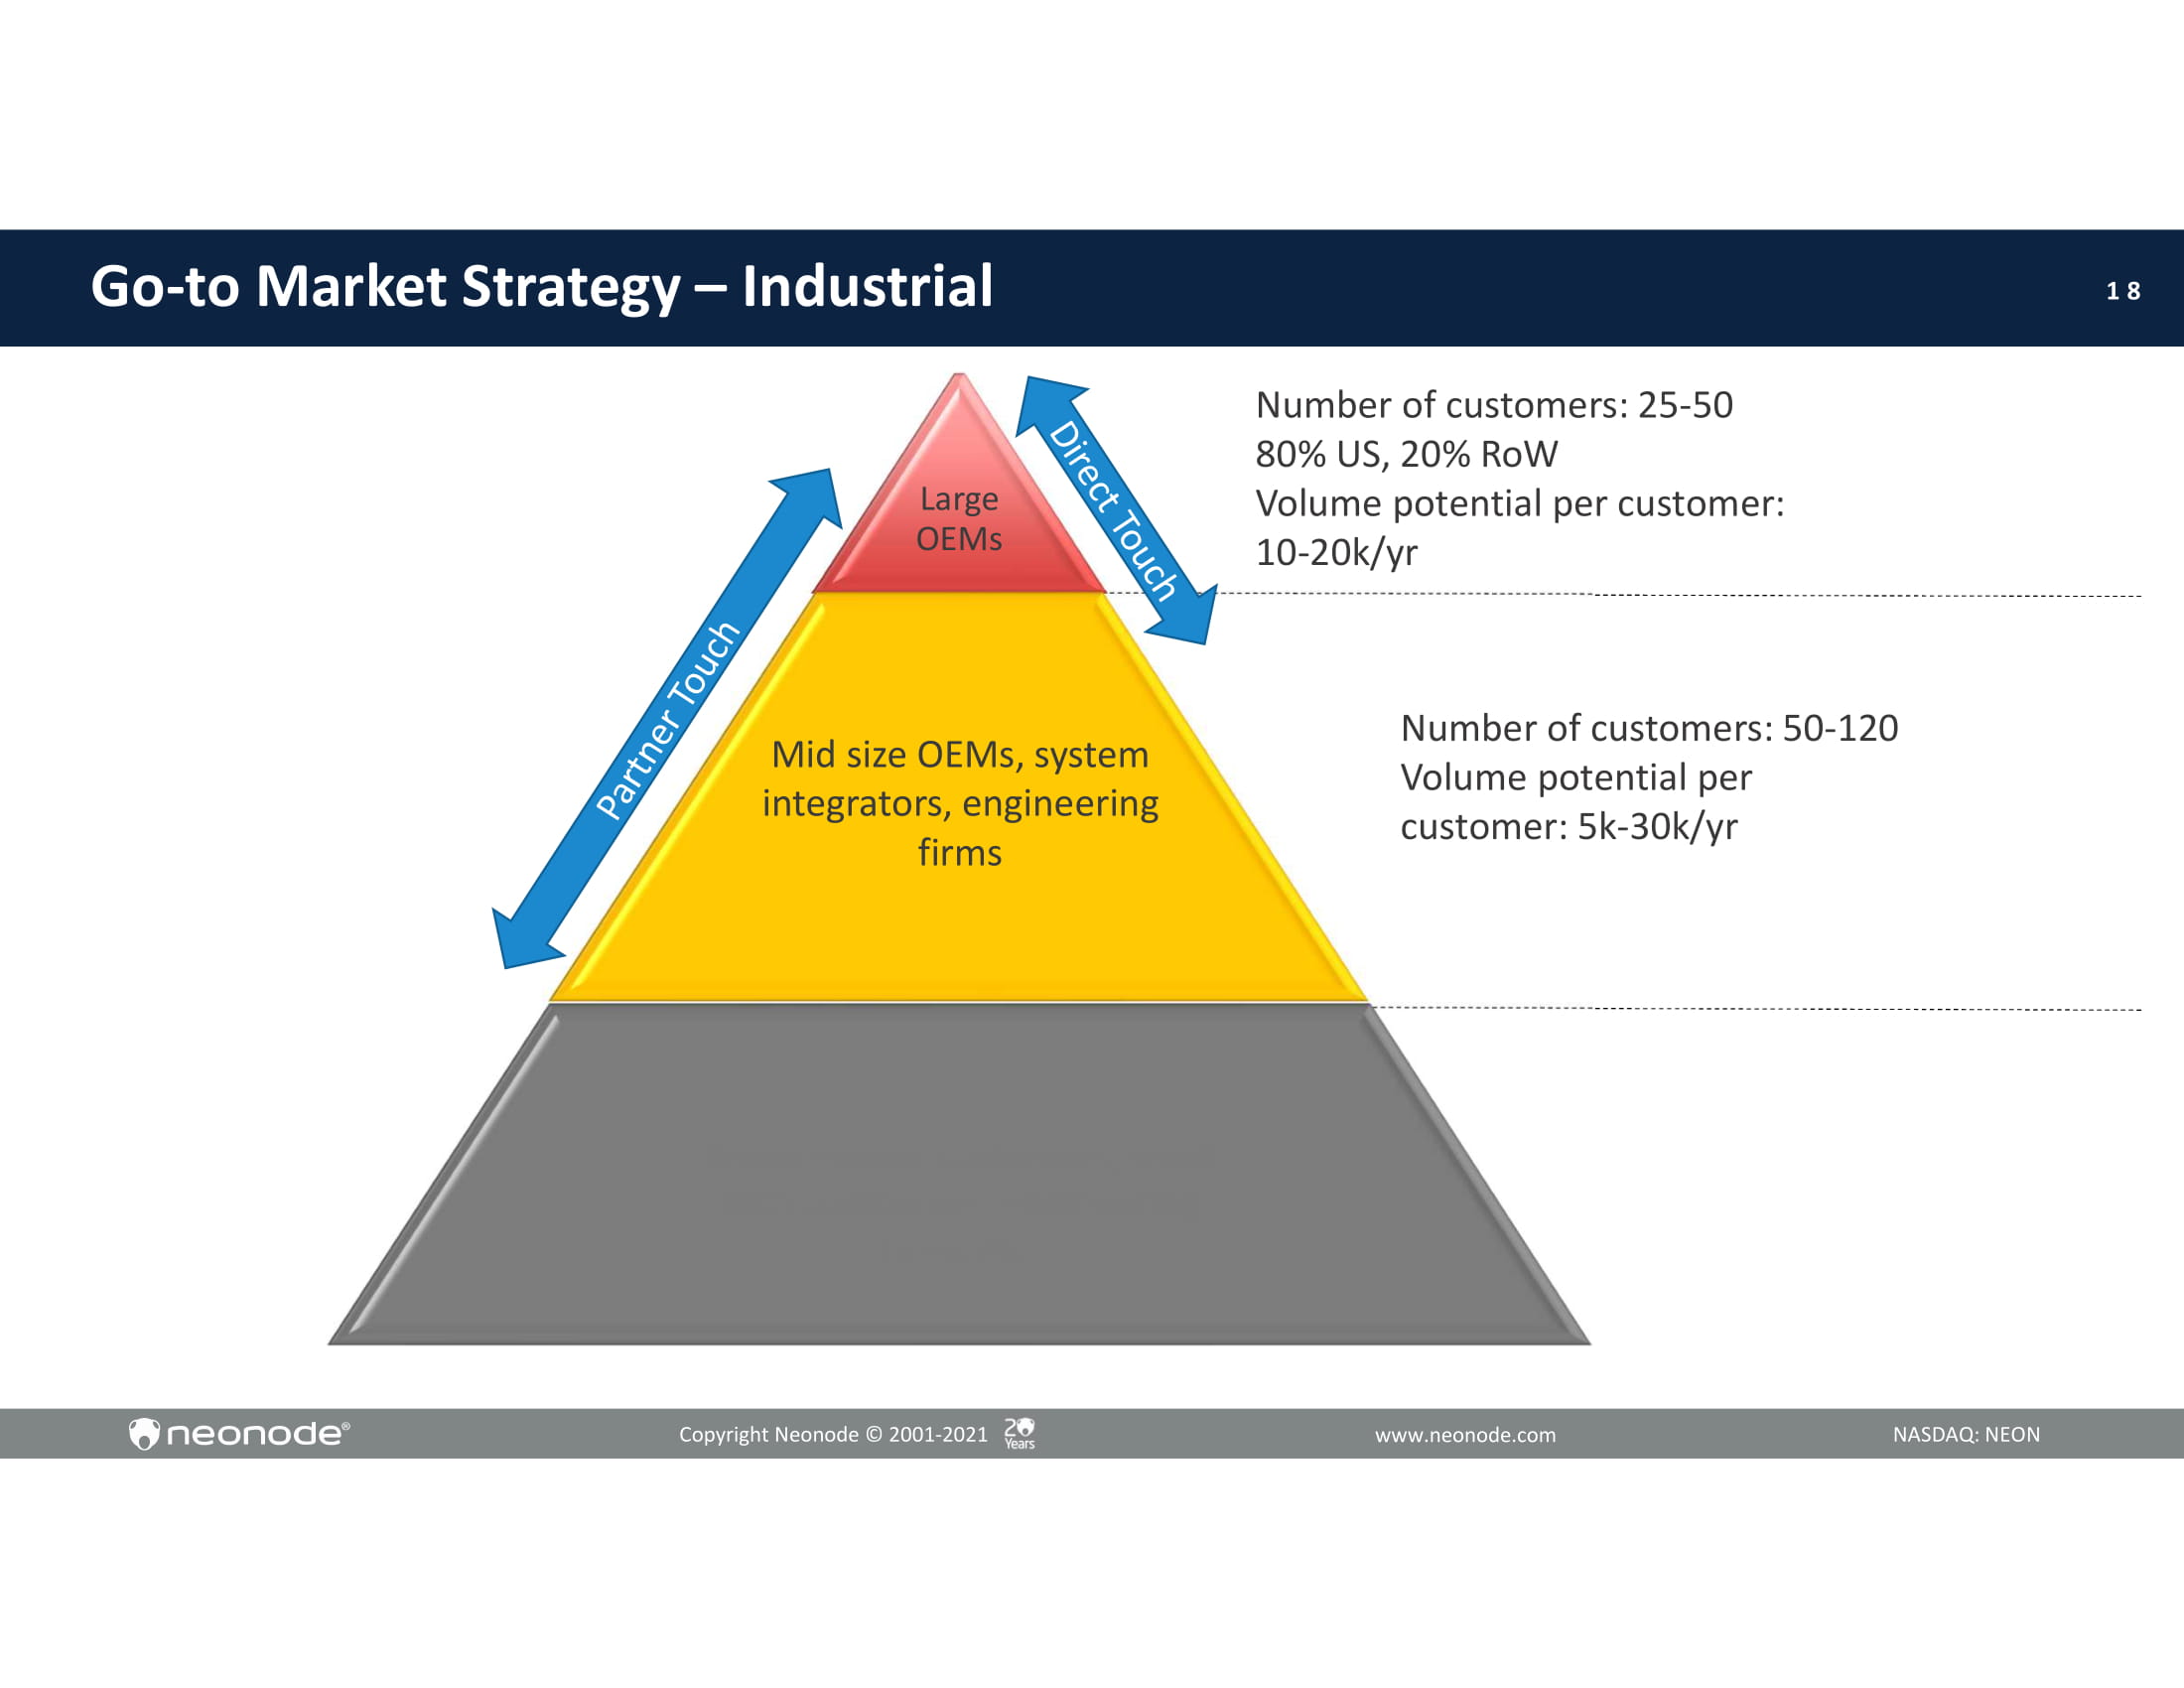
1 8 Go - to Market Strategy – Industrial Large OE M s Mid size OEMs, system integrators, engineering firms Number of customers: 25 - 50 80% US, 20% RoW Volume potential per customer: 10 - 20k/yr Copyright Neonode © 2001 - 2021 NASDAQ: NEON www.neonode.com Number of customers: 50 - 120 Volume potential per customer: 5k - 30k/yr
1 9 Business Area – Remote Sensing Solutions Copyright Neonode © 2001 - 2021 NASDAQ: NEON www.neonode.com Focuses on driver and in - cabin monitoring in vehicles . Addressing the need for robust, cost - effective driver and in - cabin monitoring systems that enable OEMs to be compliant with the new EU general safety regulations (GSR) and meet the Euro NCAP guidelines, applicable for all new vehicles from 2024 .

2 0 Neonode Driver and In - Cabin Monitoring Robust, cost - effective driver and in - cabin monitoring • Increases safety – can monitor driver status, can support adaptive seatbelt pretensioners and airbags • Increases comfort – can be used for automatic adjustments of seating position, climate control, interior lightning, audio systems etc. Neonode’s Technology at a Glance: x Scalable AI - based software platform for driver and cabin monitoring x Monitors the driver and/or the whole interior of the vehicle using camera images and other sensor inputs x Hardware - agnostic solution x High performance even with low - resolution cameras x Very efficient machine learning and decision algorithms with low computational footprint x Compatible with EU GSR and Euro NCAP guidelines Copyright Neonode © 2001 - 2021 NASDAQ: NEON www.neonode.com
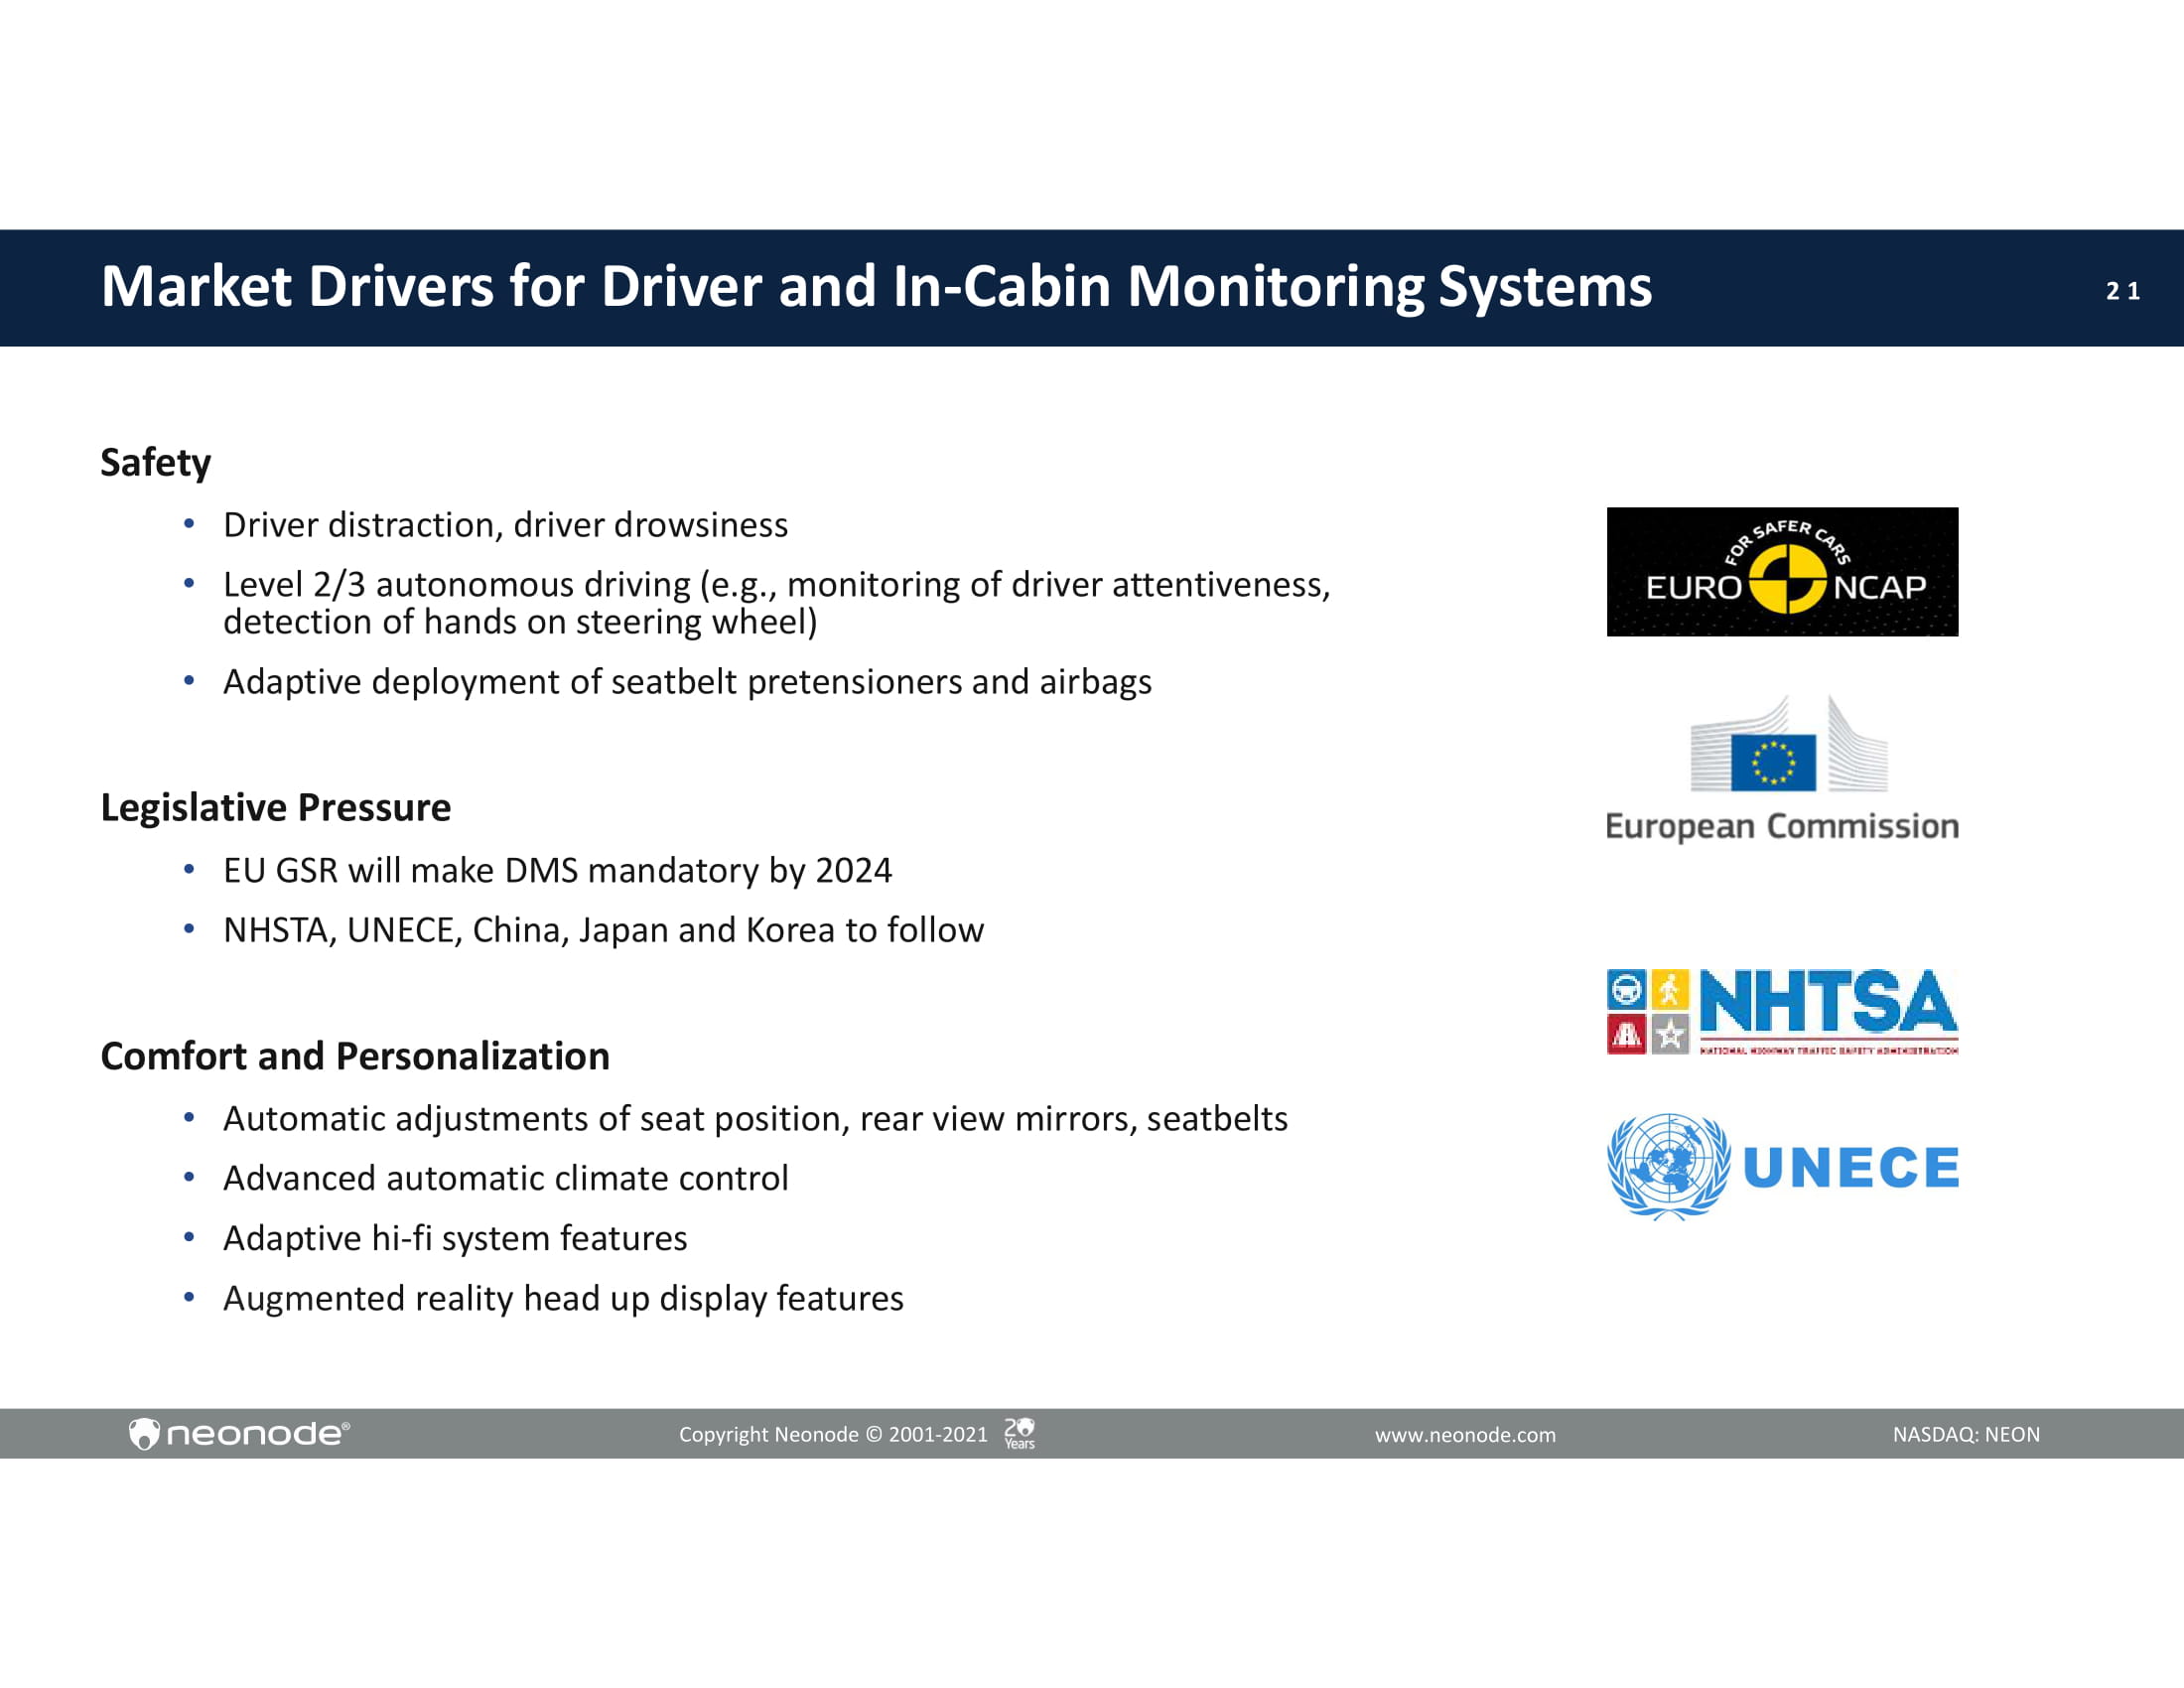
2 1 Market Drivers for Driver and In - Cabin Monitoring Systems Safety • Driver distraction, driver drowsiness • Level 2/3 autonomous driving (e.g., monitoring of driver attentiveness, detection of hands on steering wheel) • Adaptive deployment of seatbelt pretensioners and airbags Legislative Pressure • EU GSR will make DMS mandatory by 2024 • NHSTA, UNECE, China, Japan and Korea to follow Comfort and Personalization • Automatic adjustments of seat position, rear view mirrors, seatbelts • Advanced automatic climate control • Adaptive hi - fi system features • Augm ented reality head up display features Copyright Neonode © 2001 - 2021 NASDAQ: NEON www.neonode.com
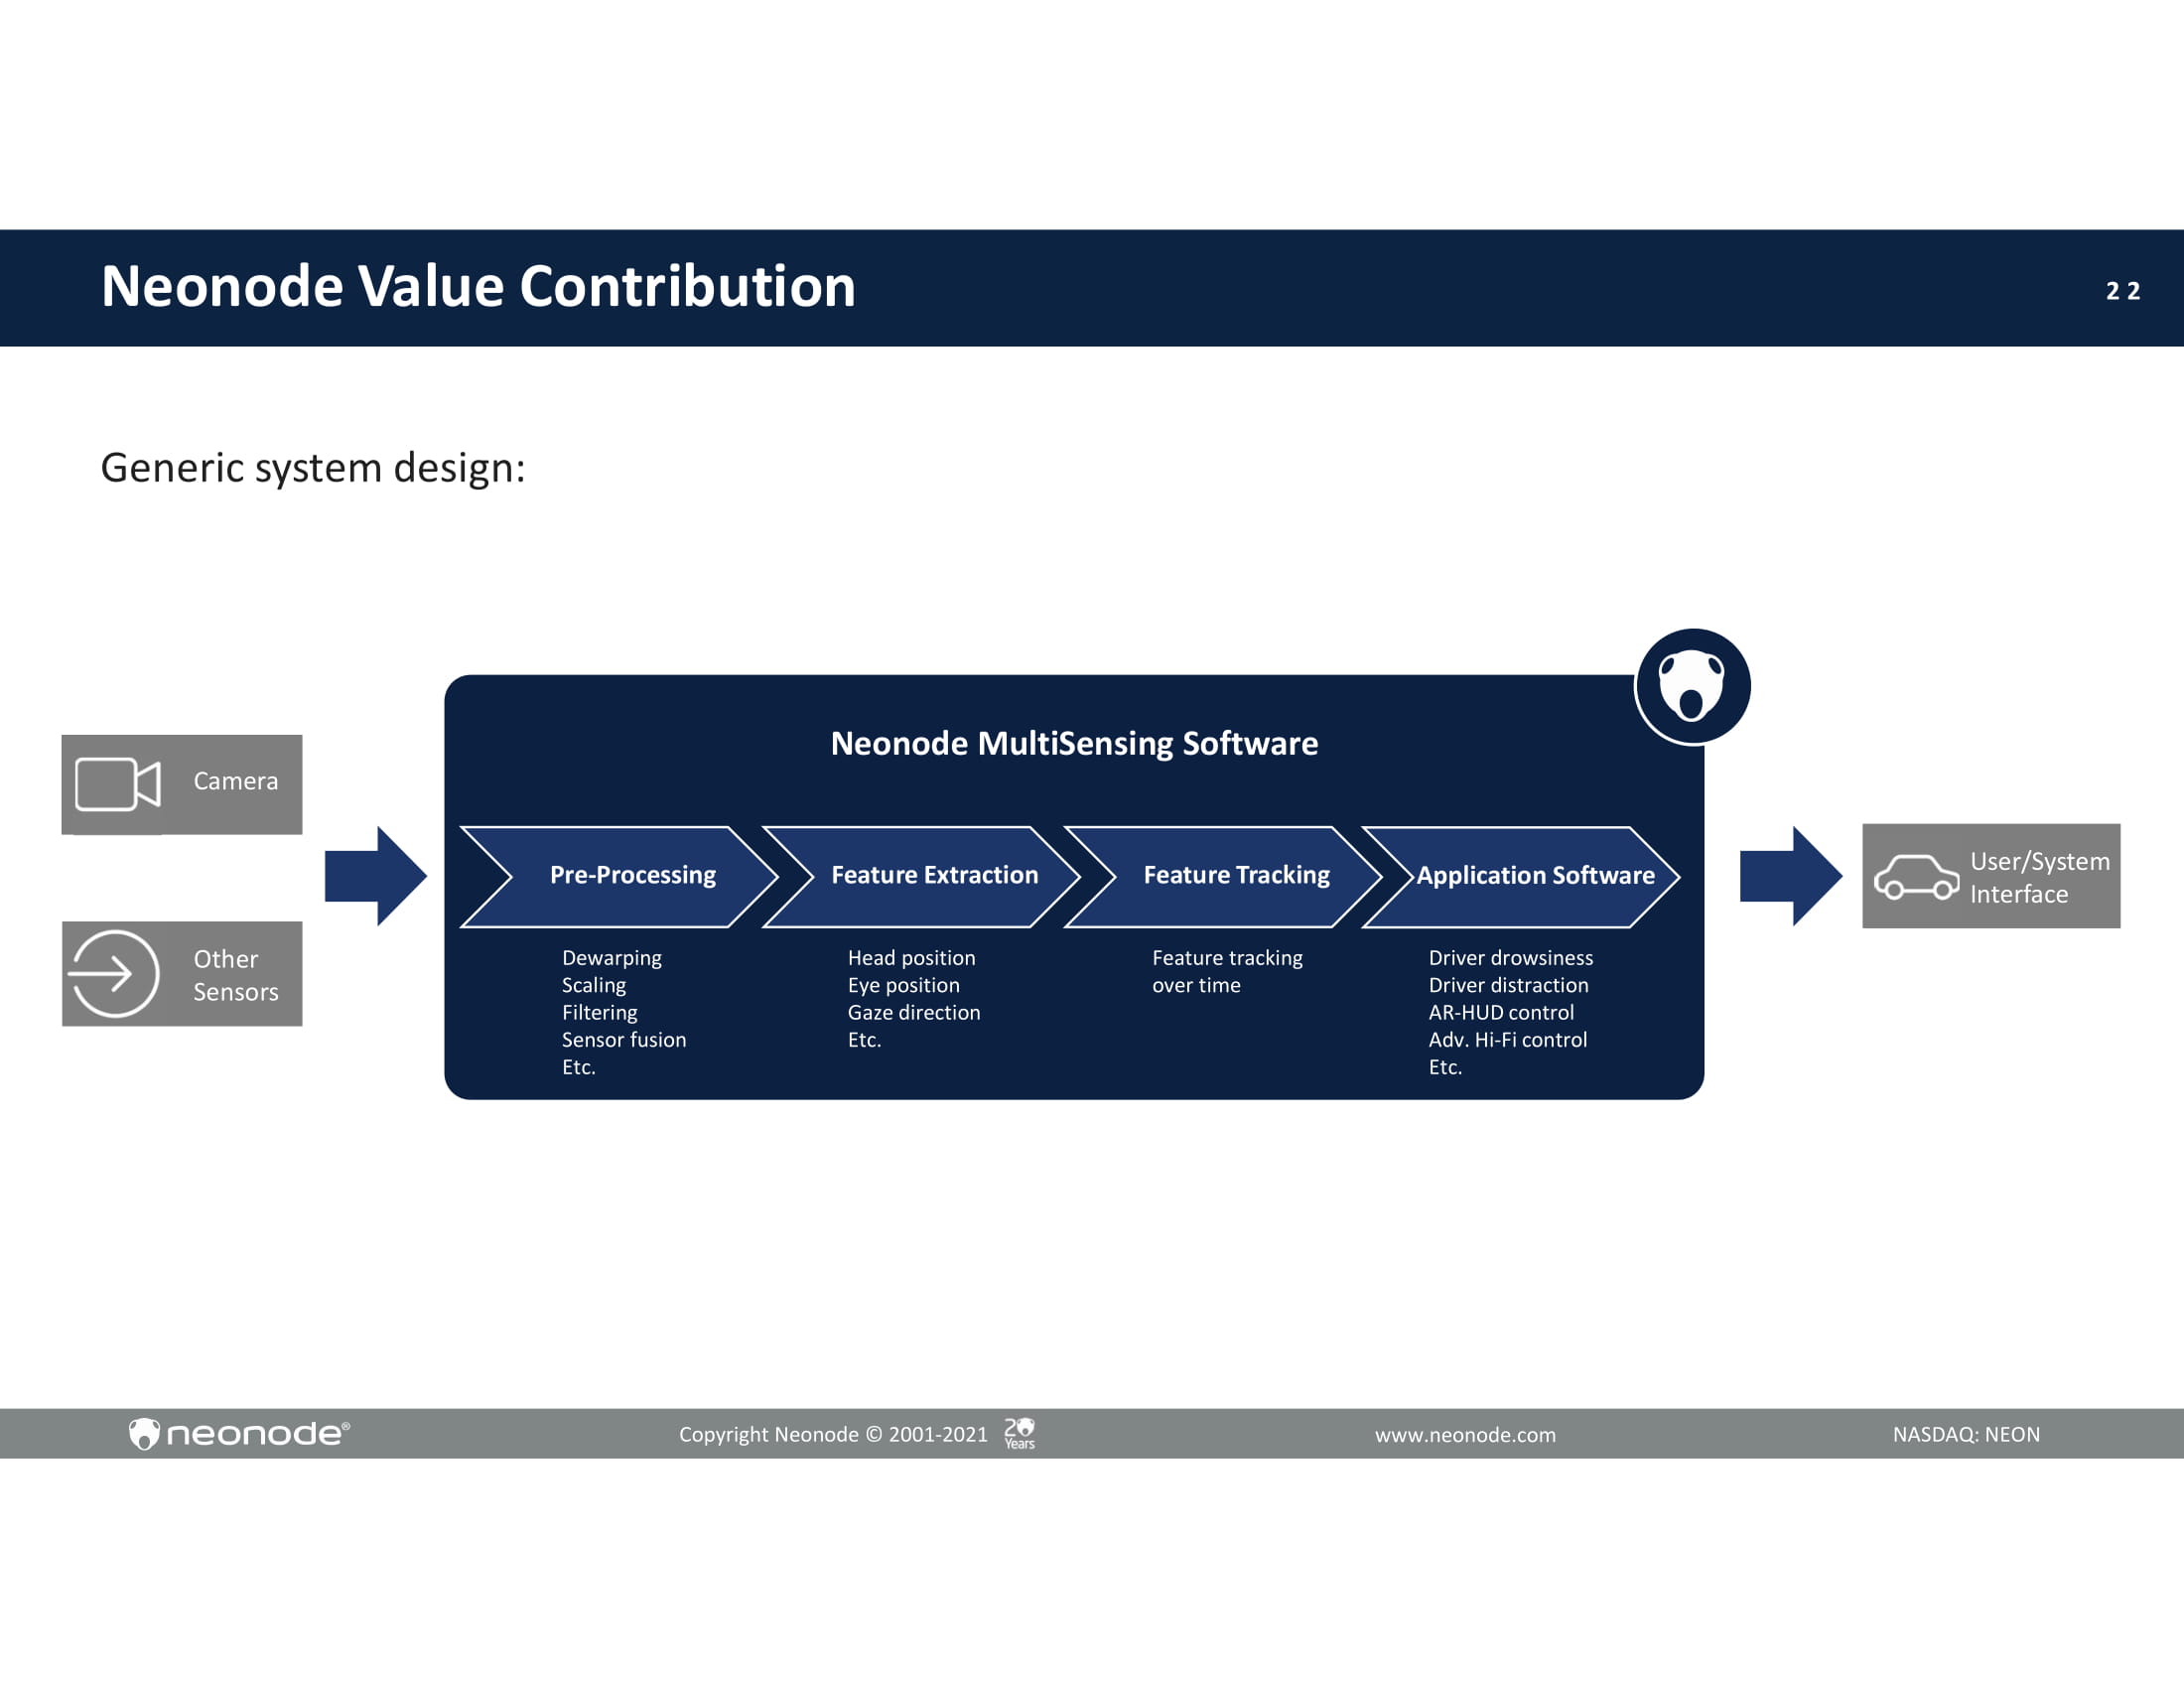
2 2 Generic system design: Other S e n s o r s C am e r a Neonode MultiSensing Software Head position Eye position G a z e dir e cti o n Etc. Dewarping Scaling Filtering Sensor fusion Etc. Driver drowsiness Driver distraction AR - HUD control Adv. Hi - Fi control Etc. Fe a tu re t r a cking over time Pre - Processing F e a t u r e E xt r a ct i o n F e a t u r e T r a ck i n g A p p li c a t i o n S oft w a r e U s er /S y s t em Interface Neonode Value Contribution Copyright Neonode © 2001 - 2021 NASDAQ: NEON www.neonode.com

2 3 Go - To - Market Strategy Complementary GTM Strategy: • Opportunistically engage with customers in Automotive CV and other market segments to create fast customer proof of concepts / technology references 1. Automotive LV 2. Automotive CV 3. Other, Miscellaneous Push/Pull Strategy Target Markets M a i n G T M Strategy 1. Europe 2. North America Target Regions 3. Japan 4. K o r e a 5. China 1. Europe Copyright Neonode © 2001 - 2021 NASDAQ: NEON www.neonode.com
2 4 Financial Update 2020 Copyright Neonode © 2001 - 2021 NASDAQ: NEON www.neonode.com
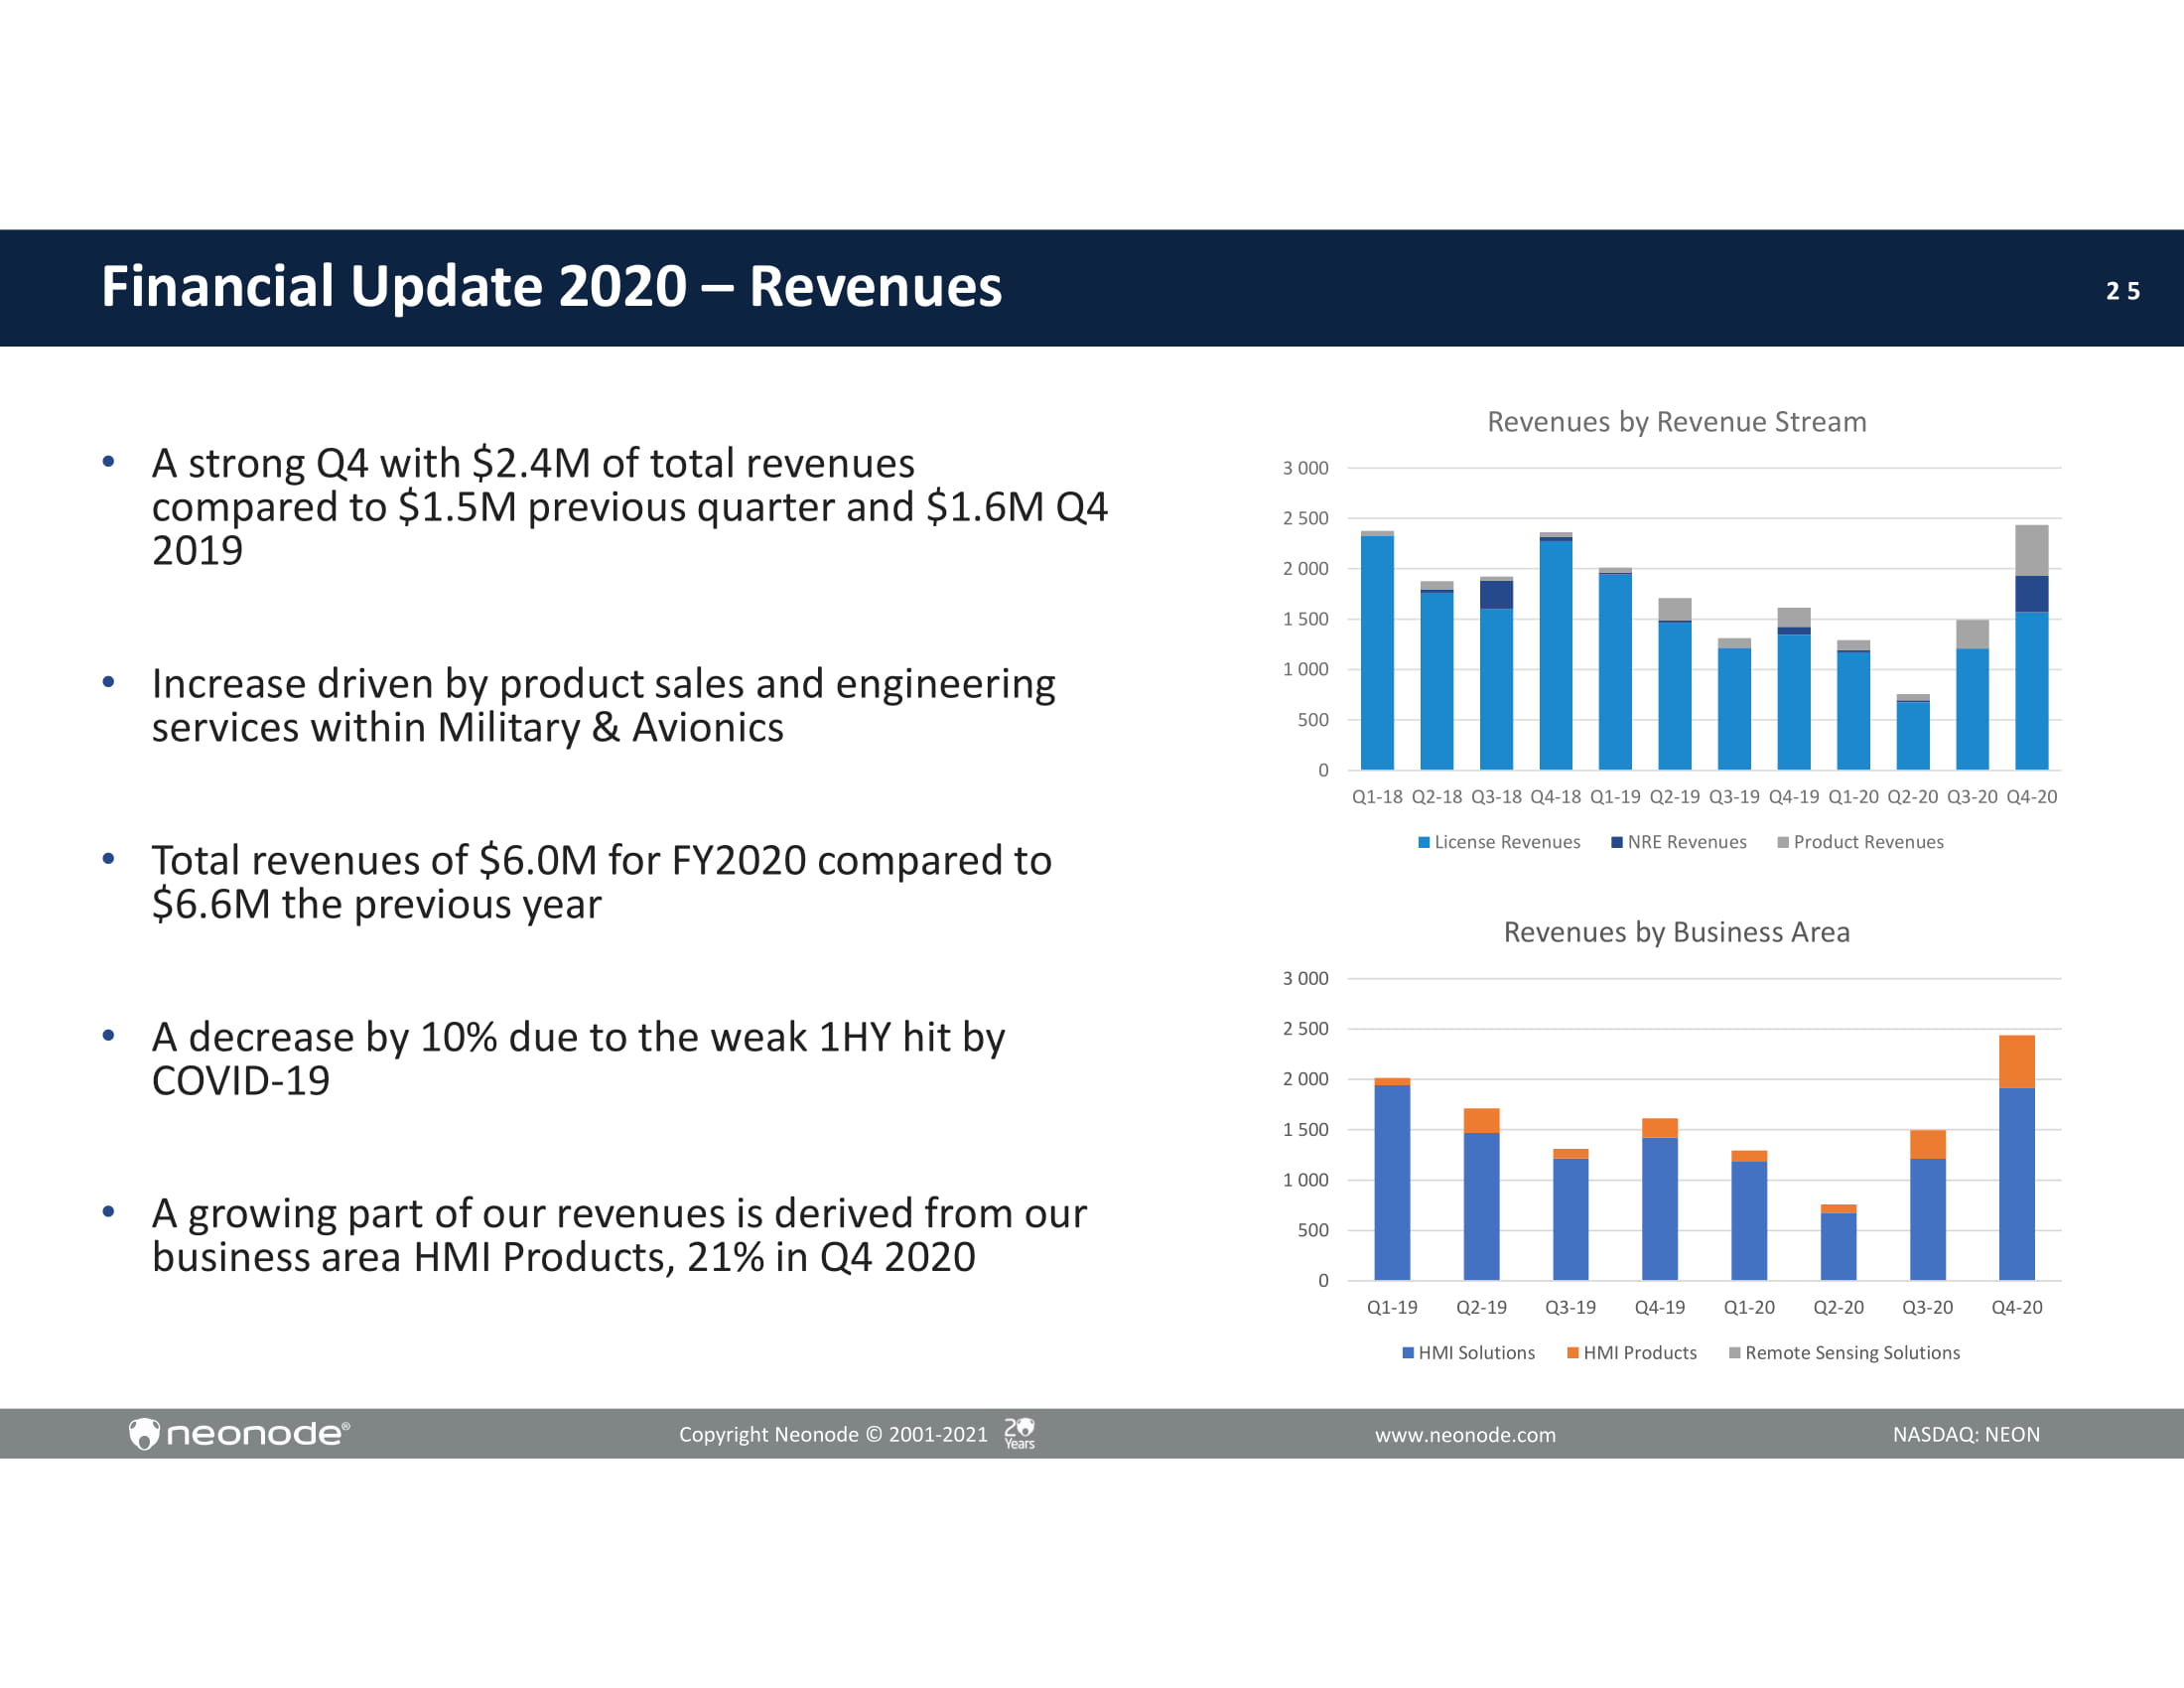
2 5 Financial Update 2020 – Revenues • A strong Q4 with $2.4M of total revenues compared to $1.5M previous quarter and $1.6M Q4 2019 • Increase driven by product sales and engineering services within Military & Avionics • Total revenues of $6.0M for FY2020 compared to $6.6M the previous year • A decrease by 10% due to the weak 1HY hit by COVID - 19 • A growing part of our revenues is derived from our business area HMI Products, 21% in Q4 2020 0 5 0 0 1 0 0 0 1 5 0 0 2 0 0 0 2 5 0 0 3 0 0 0 Revenues by Revenue Stream Q1 - 18 Q2 - 18 Q3 - 18 Q4 - 18 Q1 - 19 Q2 - 19 Q3 - 19 Q4 - 19 Q1 - 20 Q2 - 20 Q3 - 20 Q4 - 20 License Revenues NRE Revenues Product Revenues 0 5 0 0 1 0 0 0 1 5 0 0 2 0 0 0 2 5 0 0 3 0 0 0 Q 1 - 1 9 Q 2 - 1 9 Q 3 - 1 9 Q4 - 19 Q1 - 20 Q2 - 20 Q3 - 20 Q4 - 20 Revenues by Business Area H M I S o l uti o n s HMI Products Remote Sensing Solutions Copyright Neonode © 2001 - 2021 NASDAQ: NEON www.neonode.com
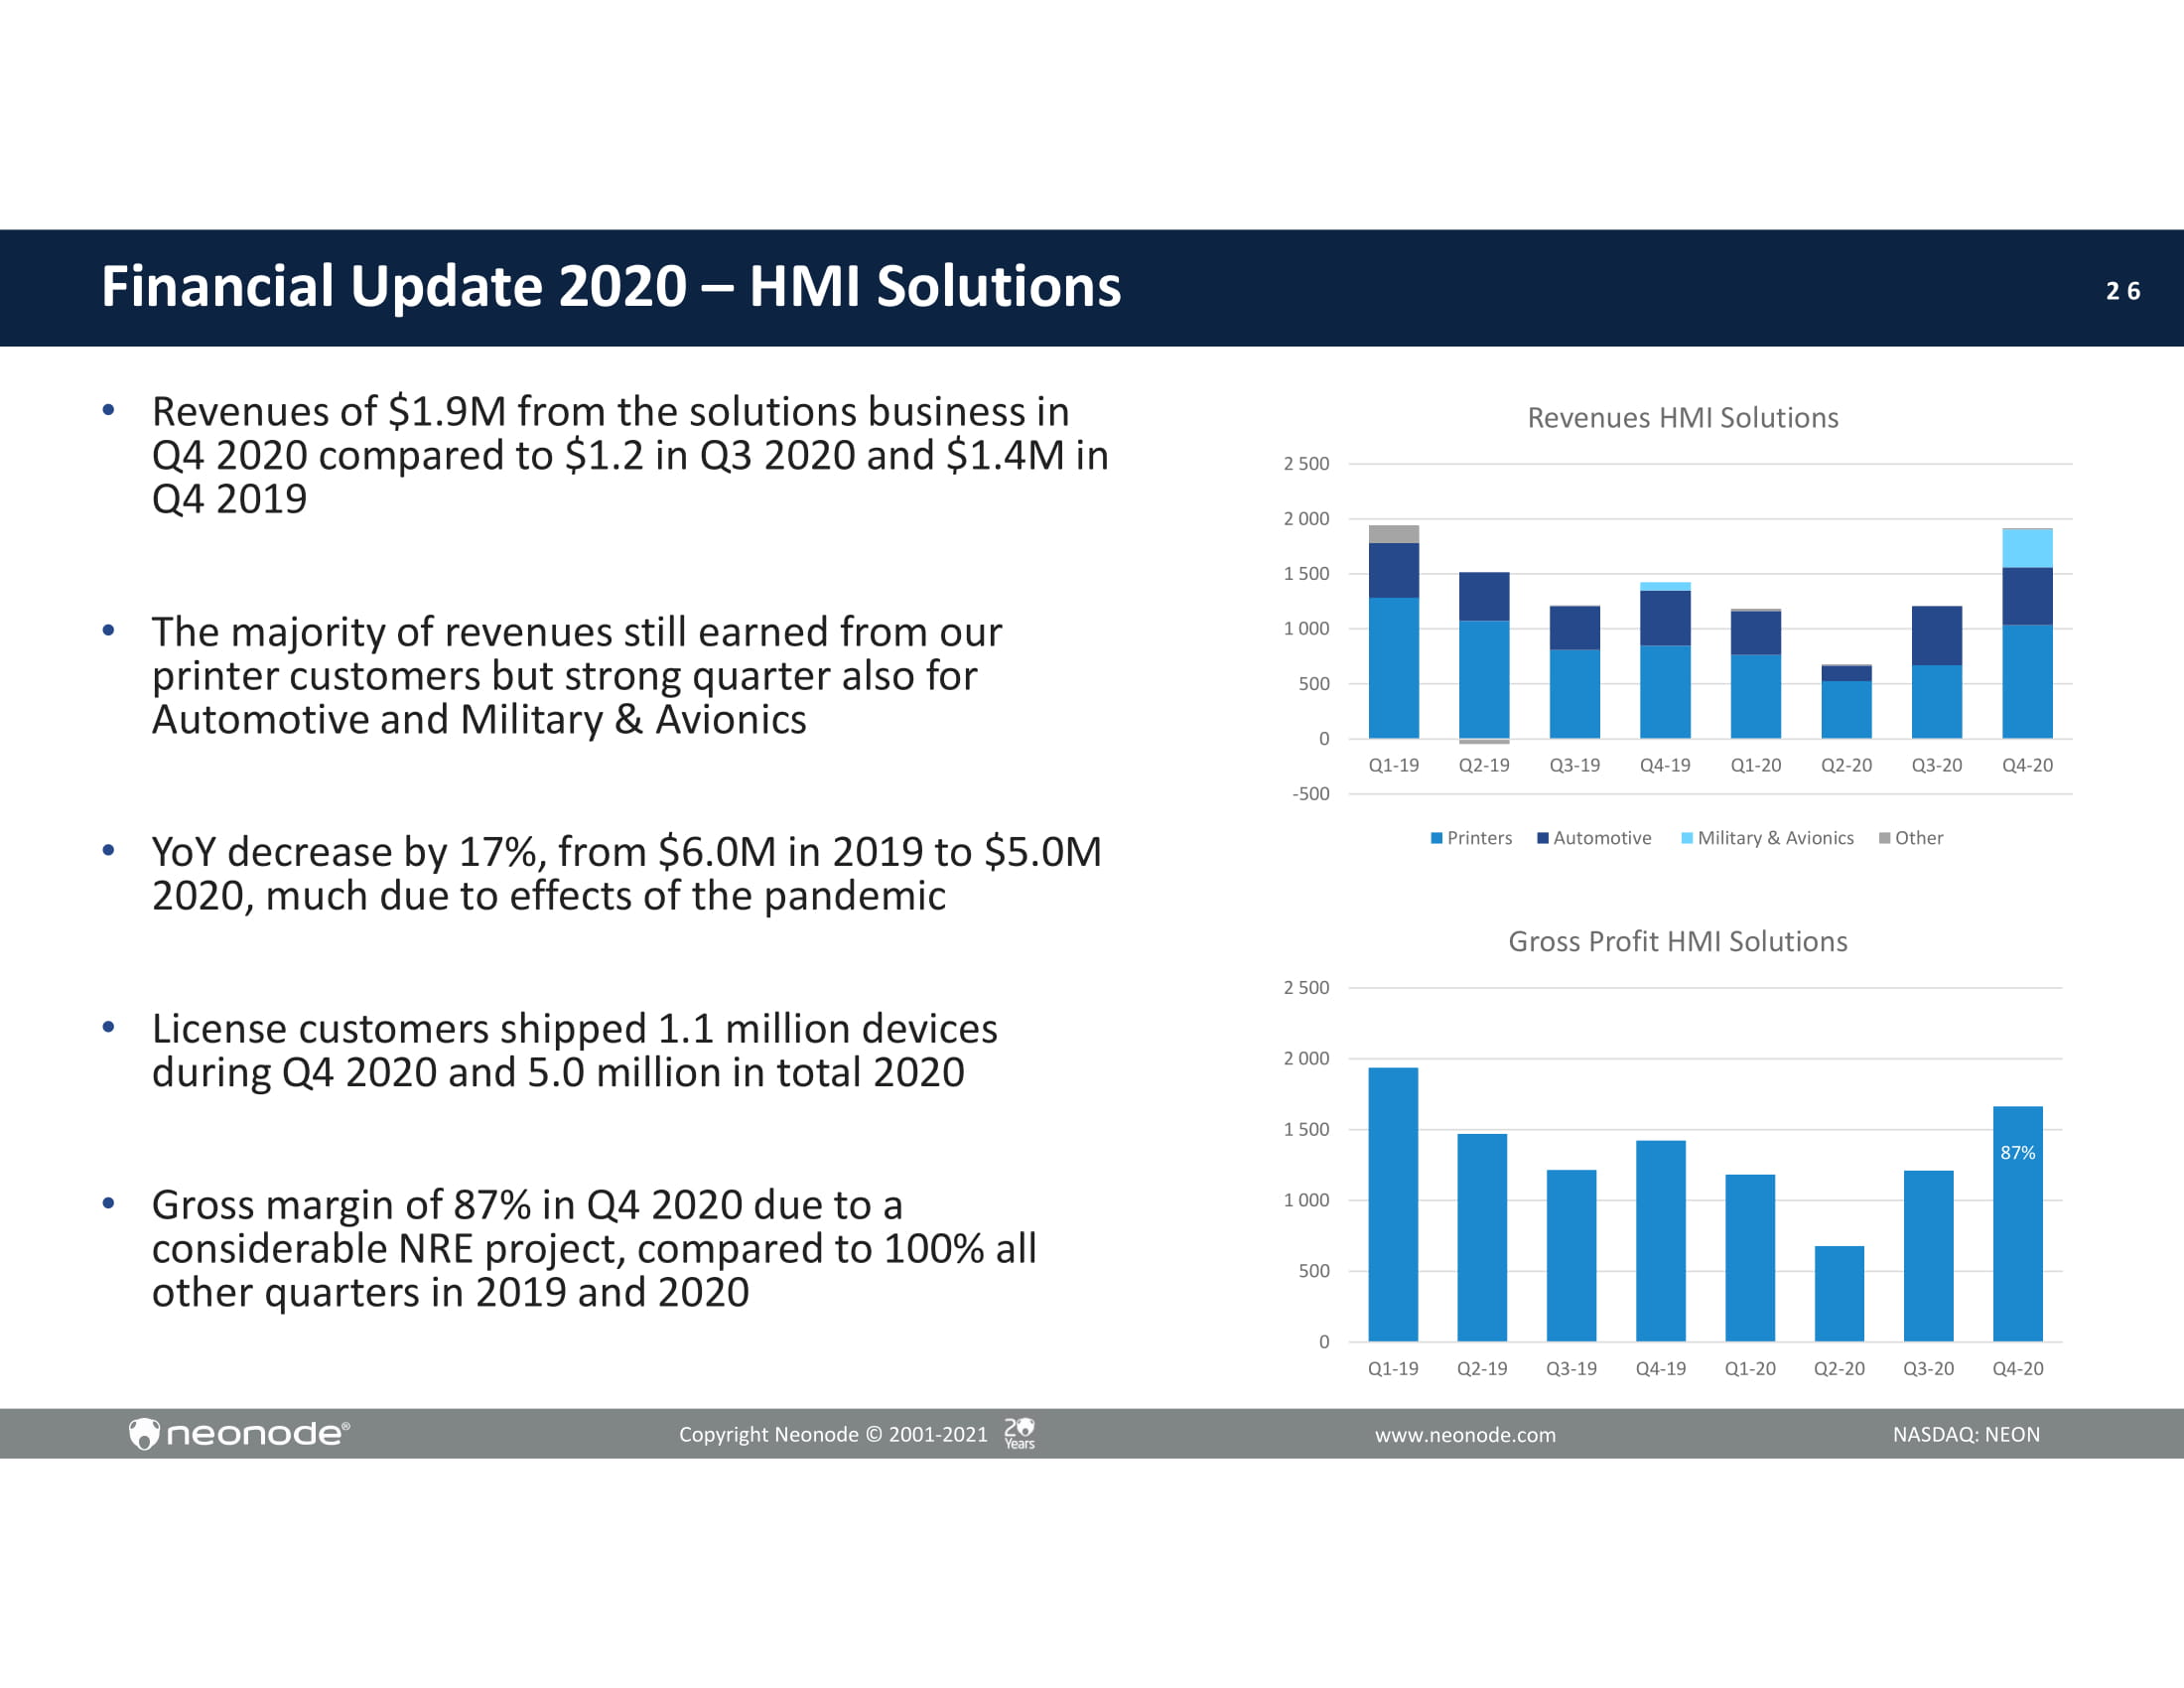
2 6 Financial Update 2020 – HMI Solutions • Revenues of $1.9M from the solutions business in Q4 2020 compared to $1.2 in Q3 2020 and $1.4M in Q4 2019 • The majority of revenues still earned from our printer customers but strong quarter also for Automotive and Military & Avionics • YoY decrease by 17%, from $6.0M in 2019 to $5.0M 2020, much due to effects of the pandemic • License customers shipped 1.1 million devices during Q4 2020 and 5.0 million in total 2020 • Gross margin of 87% in Q4 2020 due to a considerable NRE project, compared to 100% all other quarters in 2019 and 2020 - 5 00 0 5 0 0 1 0 0 0 1 5 0 0 2 0 0 0 2 5 0 0 Q 1 - 1 9 Q 2 - 1 9 Q 3 - 1 9 Q 4 - 1 9 Q 1 - 2 0 Q 2 - 2 0 Q 3 - 2 0 Q 4 - 2 0 Revenues HMI Solutions Printers A u to m o t iv e Military & Avionics O t h er 87 % Copyright Neonode © 2001 - 2021 NASDAQ: NEON www.neonode.com 0 5 0 0 1 0 0 0 1 5 0 0 2 0 0 0 2 5 0 0 Q 1 - 1 9 Q 2 - 1 9 Q 3 - 1 9 Q 4 - 1 9 Q 1 - 2 0 Q 2 - 2 0 Q 3 - 2 0 Q 4 - 2 0 Gross Profit HMI Solutions

2 7 Financial Update 2020 – HMI Products • Revenues of $0.5M in Q4 2020 compared to $0.3M in Q3 2020 and $0.2M in Q4 2019 • The major part sold through our distributors in the U.S. and China • YoY increase of 67 % , from $ 0 . 6 M in 2019 to $ 1 . 0 M 2020 , munch driven by the demand for contactless touch solutions • We shipped approximately 28,000 sensor modules, AirBars and evaluation kits during 2020 • 2020 sell - off of AirBars reduced gross margin to 18%. Gross margin, excluding AirBar sale, was 30 - 35%. 0 1 0 0 2 0 0 3 0 0 5 0 0 4 0 0 6 0 0 Q 1 - 1 9 Q 2 - 1 9 Q 3 - 1 9 Q 4 - 1 9 Q 1 - 2 0 Q 4 - 2 0 Revenues HMI Products D i st r i b ut o rs a n d o th e rs M e d i c a l Q 2 - 2 0 Q 3 - 2 0 Automotive - 2 00 - 2 50 - 3 00 Copyright Neonode © 2001 - 2021 NASDAQ: NEON www.neonode.com - 1 50 - 1 00 1 5 0 1 0 0 50 0 2 0 0 - 50 Q1 - 19 Q2 - 19 Q3 - 19 Q4 - 19 Q 1 - 2 0 Q 2 - 2 0 Q 3 - 2 0 Q 4 - 2 0 Gross Profit HMI Products
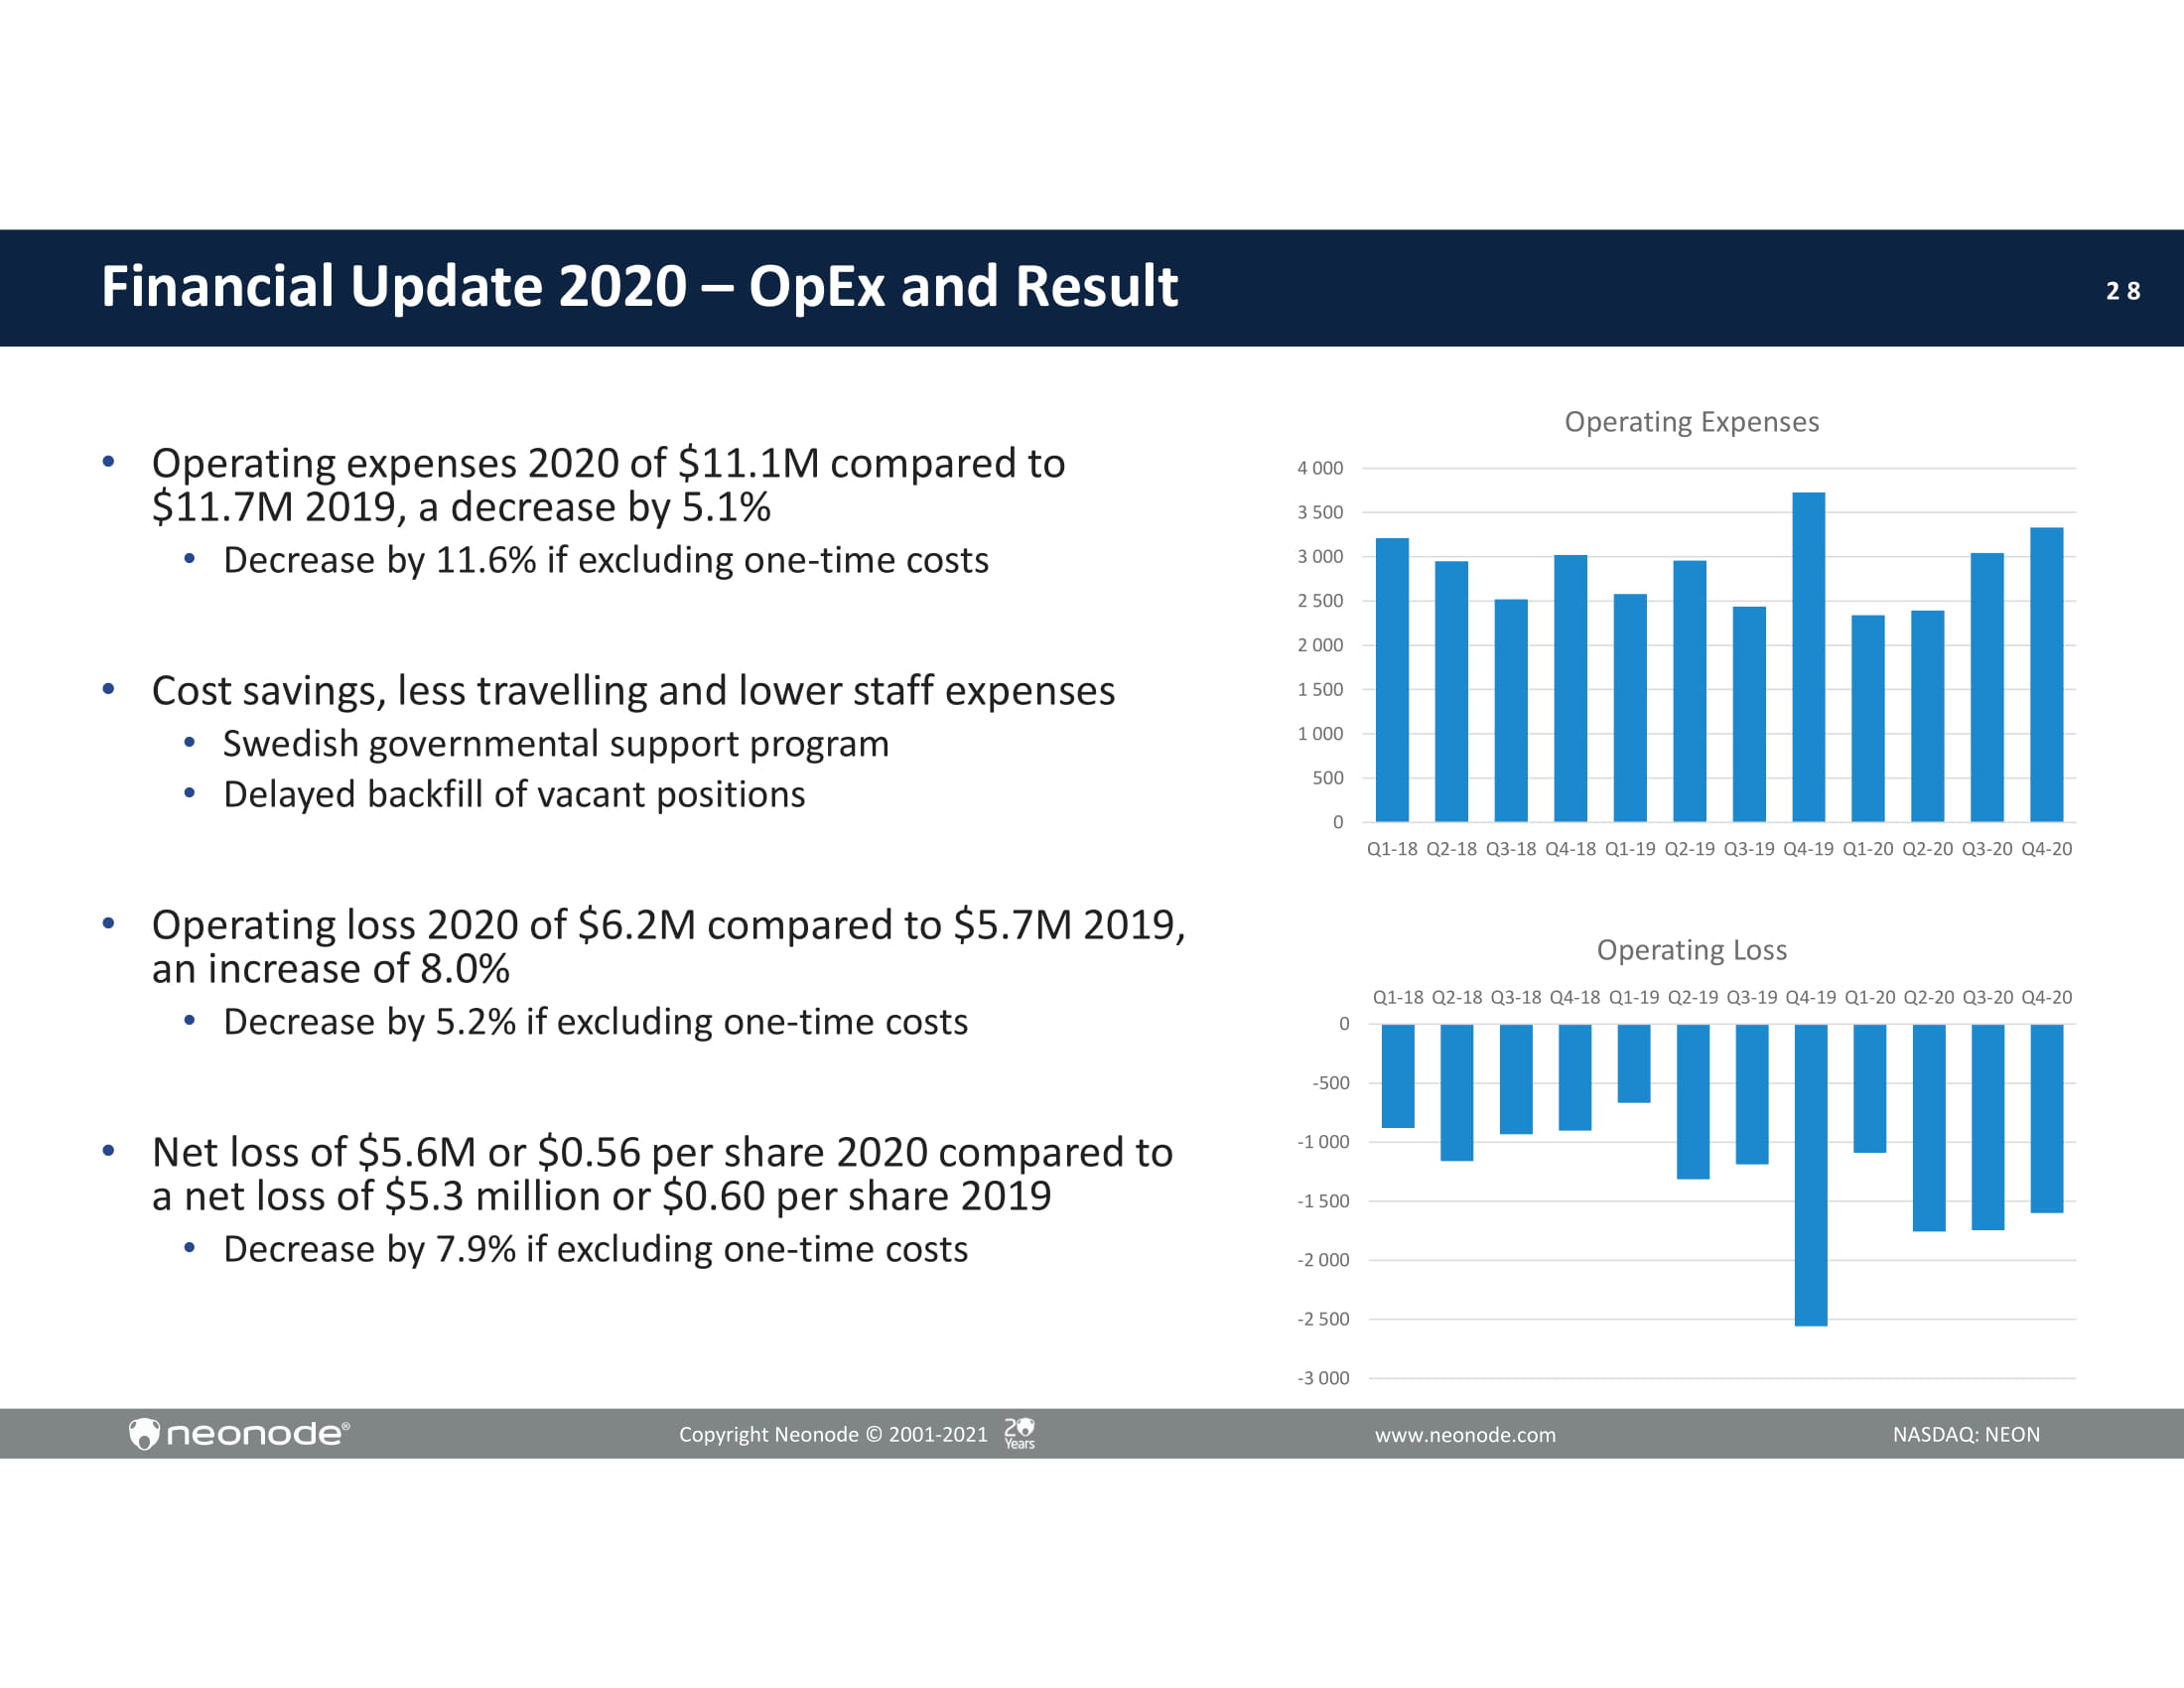
2 8 Financial Update 2020 – OpEx and Result • Operating expenses 2020 of $11.1M compared to $11.7M 2019, a decrease by 5.1% • Decrease by 11.6% if excluding one - time costs • Cost savings, less travelling and lower staff expenses • Swedish governmental support program • Delayed backfill of vacant positions • Operating loss 2020 of $6.2M compared to $5.7M 2019, an increase of 8.0% • Decrease by 5.2% if excluding one - time costs • Net loss of $5.6M or $0.56 per share 2020 compared to a net loss of $5.3 million or $0.60 per share 2019 • Decrease by 7.9% if excluding one - time costs 0 Q1 - 18 Q2 - 18 Q3 - 18 Q4 - 18 Q1 - 19 Q2 - 19 Q3 - 19 Q4 - 19 Q1 - 20 Q2 - 20 Q3 - 20 Q4 - 20 5 0 0 1 0 0 0 1 5 0 0 2 5 0 0 2 0 0 0 3 0 0 0 3 5 0 0 4 0 0 0 Operating Expenses - 2 5 0 0 - 3 0 0 0 Copyright Neonode © 2001 - 2021 NASDAQ: NEON www.neonode.com - 2 0 0 0 - 1 5 0 0 - 1 0 0 0 - 5 00 0 Operating Loss Q1 - 18 Q2 - 18 Q3 - 18 Q4 - 18 Q1 - 19 Q2 - 19 Q3 - 19 Q4 - 19 Q1 - 20 Q2 - 20 Q3 - 20 Q4 - 20

2 9 Financial Update 2020 – Cash • Net cash used in operating activities during 2020 increased by $2.2M compared to 2019, primarily due to increase in net loss • Cash and accounts receivables of $12.2M per end of December • Strong cash position enabling us to continue to execute on our business strategy - 2 5 0 0 - 2 0 0 0 - 1 5 0 0 - 1 0 0 0 - 5 00 0 Net cash used in operating activities Q1 - 18 Q2 - 18 Q3 - 18 Q4 - 18 Q1 - 19 Q2 - 19 Q3 - 19 Q4 - 19 Q1 - 20 Q2 - 20 Q3 - 20 Q4 - 20 0 Copyright Neonode © 2001 - 2021 NASDAQ: NEON www.neonode.com 2 0 0 0 4 0 0 0 6 0 0 0 8 0 0 0 1 0 00 0 1 2 00 0 1 4 00 0 Q 1 - 1 9 Q 2 - 1 9 Q 3 - 1 9 Q 4 - 1 9 Q 1 - 2 0 Q 2 - 2 0 Q 3 - 2 0 Q 4 - 2 0 Cash balance per end of quarter
3 0 Summarizing Remarks Copyright Neonode © 2001 - 2021 NASDAQ: NEON www.neonode.com • Our patented zForce technology is an enabling technology ideally positioned to solve for a lifestyle shift to contactless touch solutions brought on by COVID - 19 • High demand for contactless touch solutions – An enormous market opportunity to integrate Neonode technology into new and retrofitted equipment, for instance in » Interactive kiosks » Elevators • We also see significant interest for our zForce and MultiSensing technologies from customers in Military & Avionics, (Rugged) Industrial, and Automotive • We are well positioned to accelerate growth and capitalize on current and future opportunities
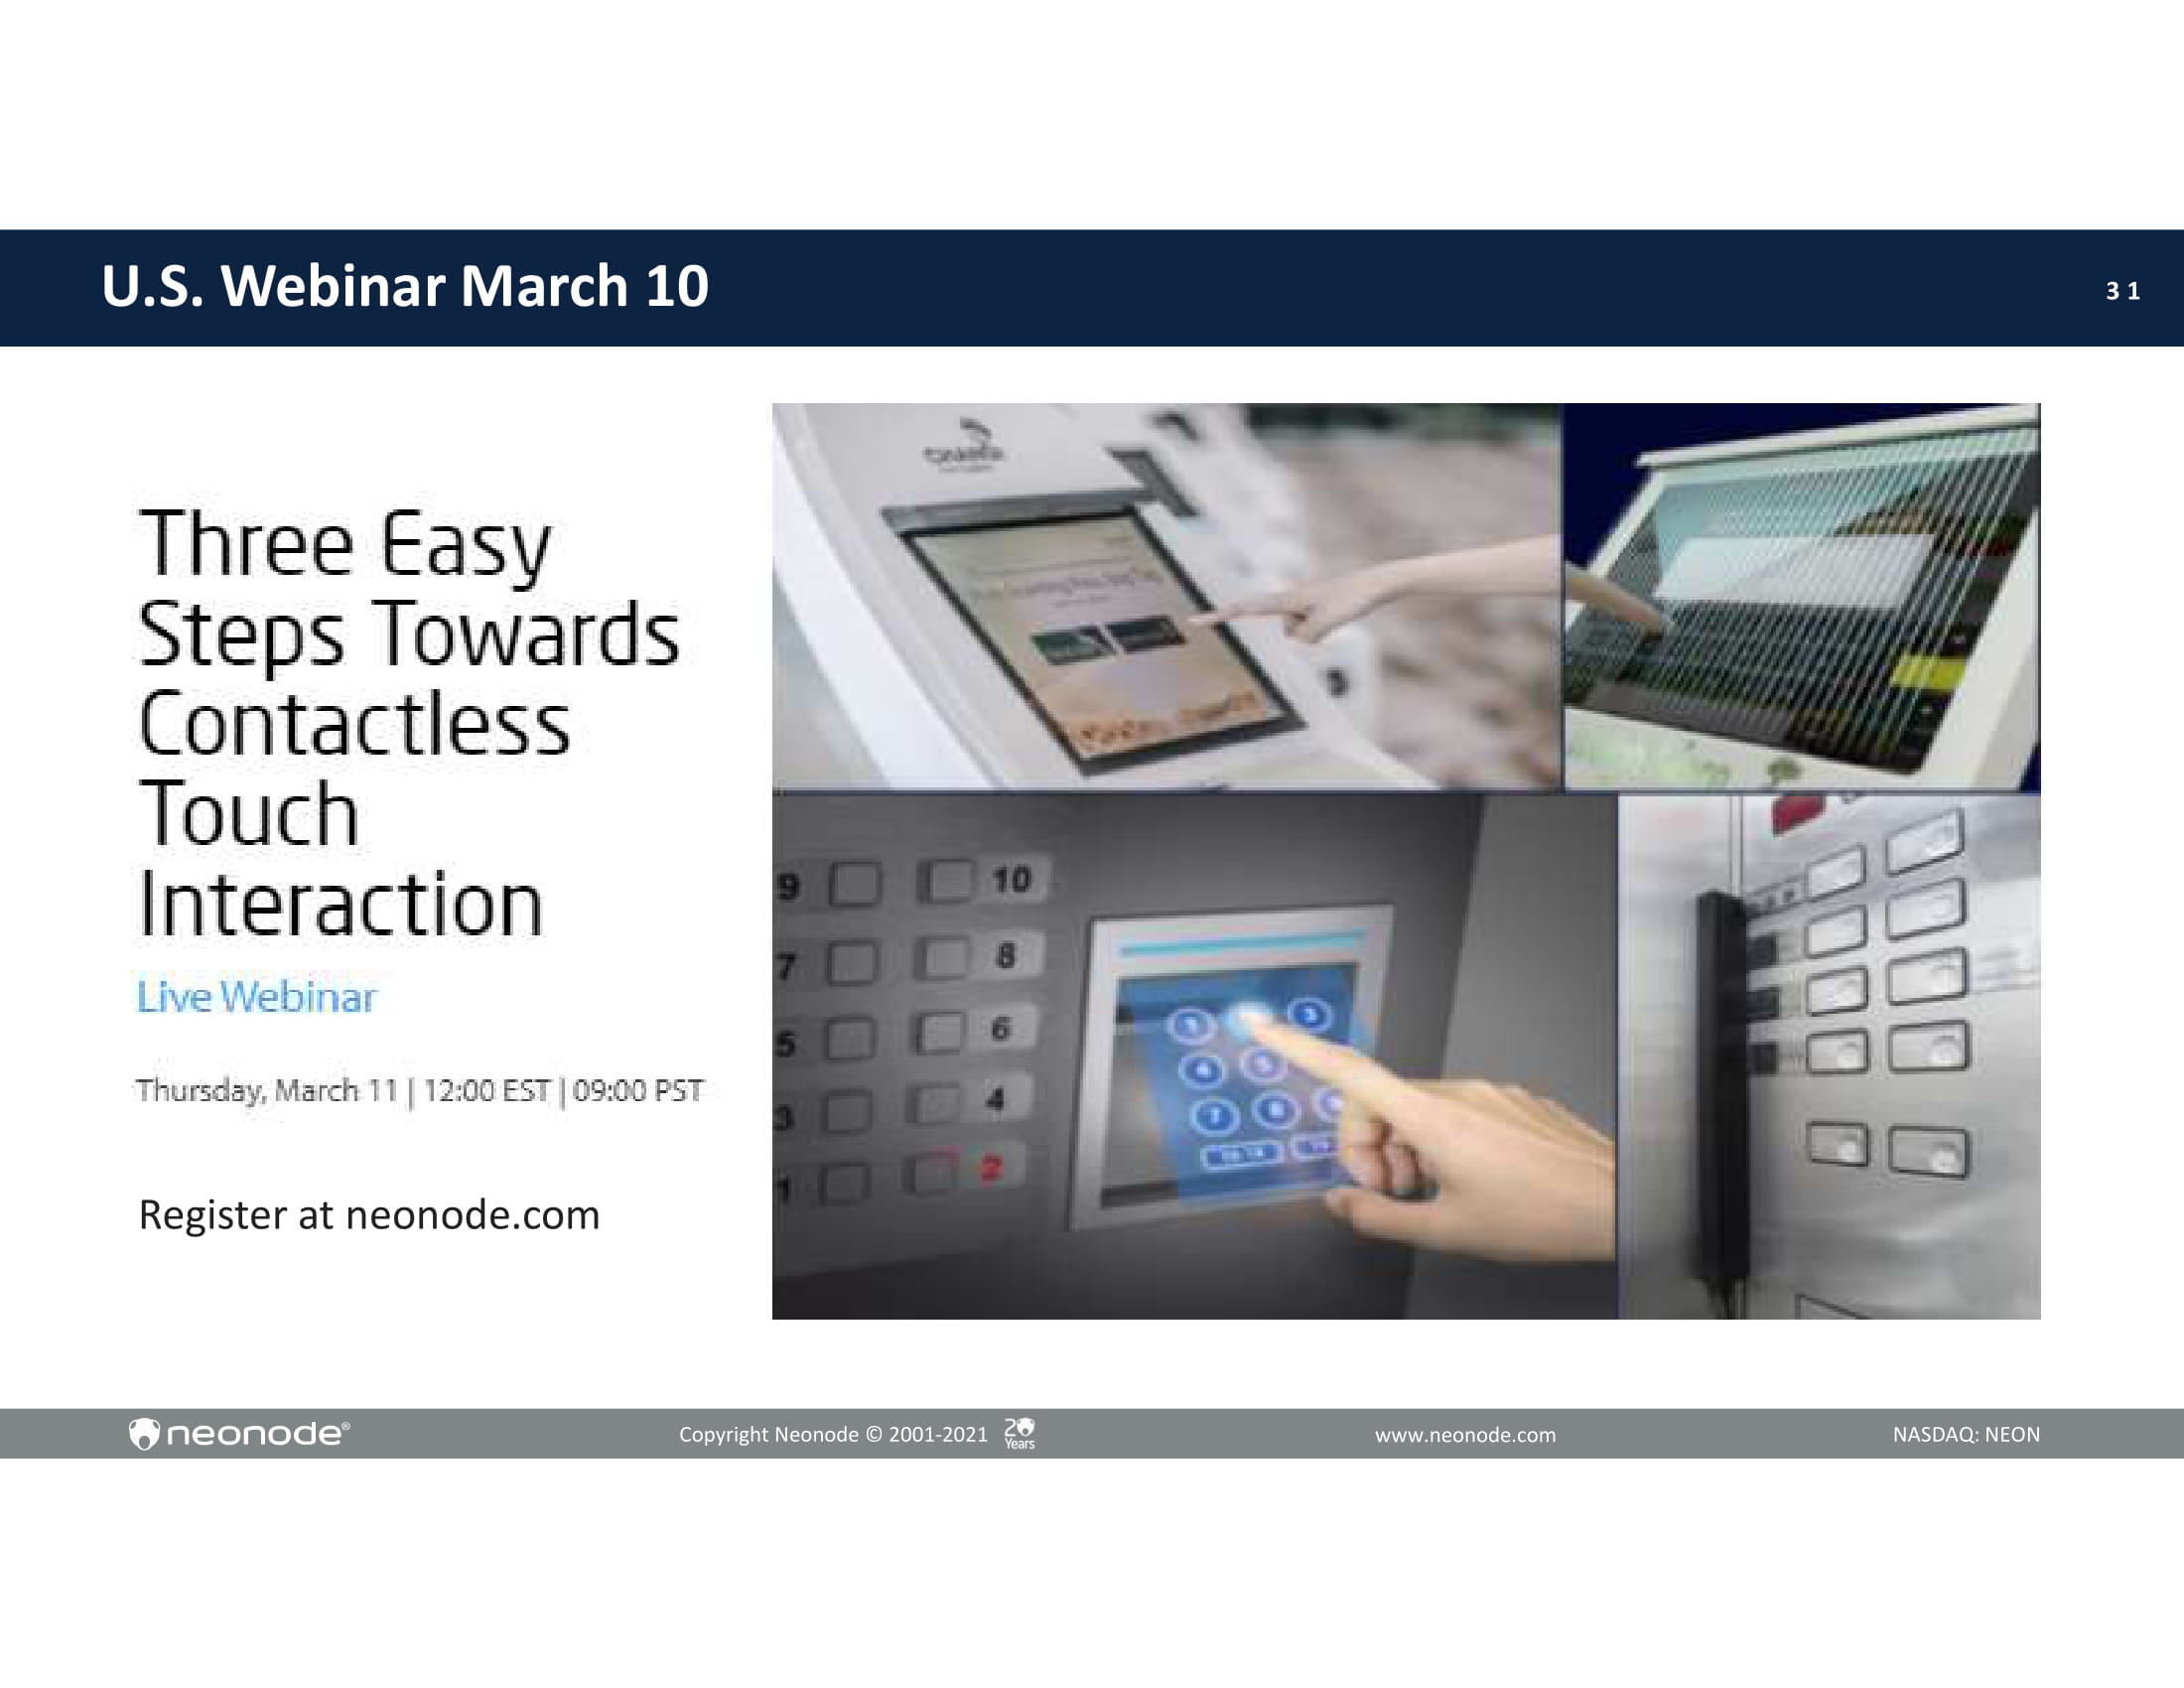
3 1 U.S. Webinar March 10 Register at neonode.com Copyright Neonode © 2001 - 2021 NASDAQ: NEON www.neonode.com
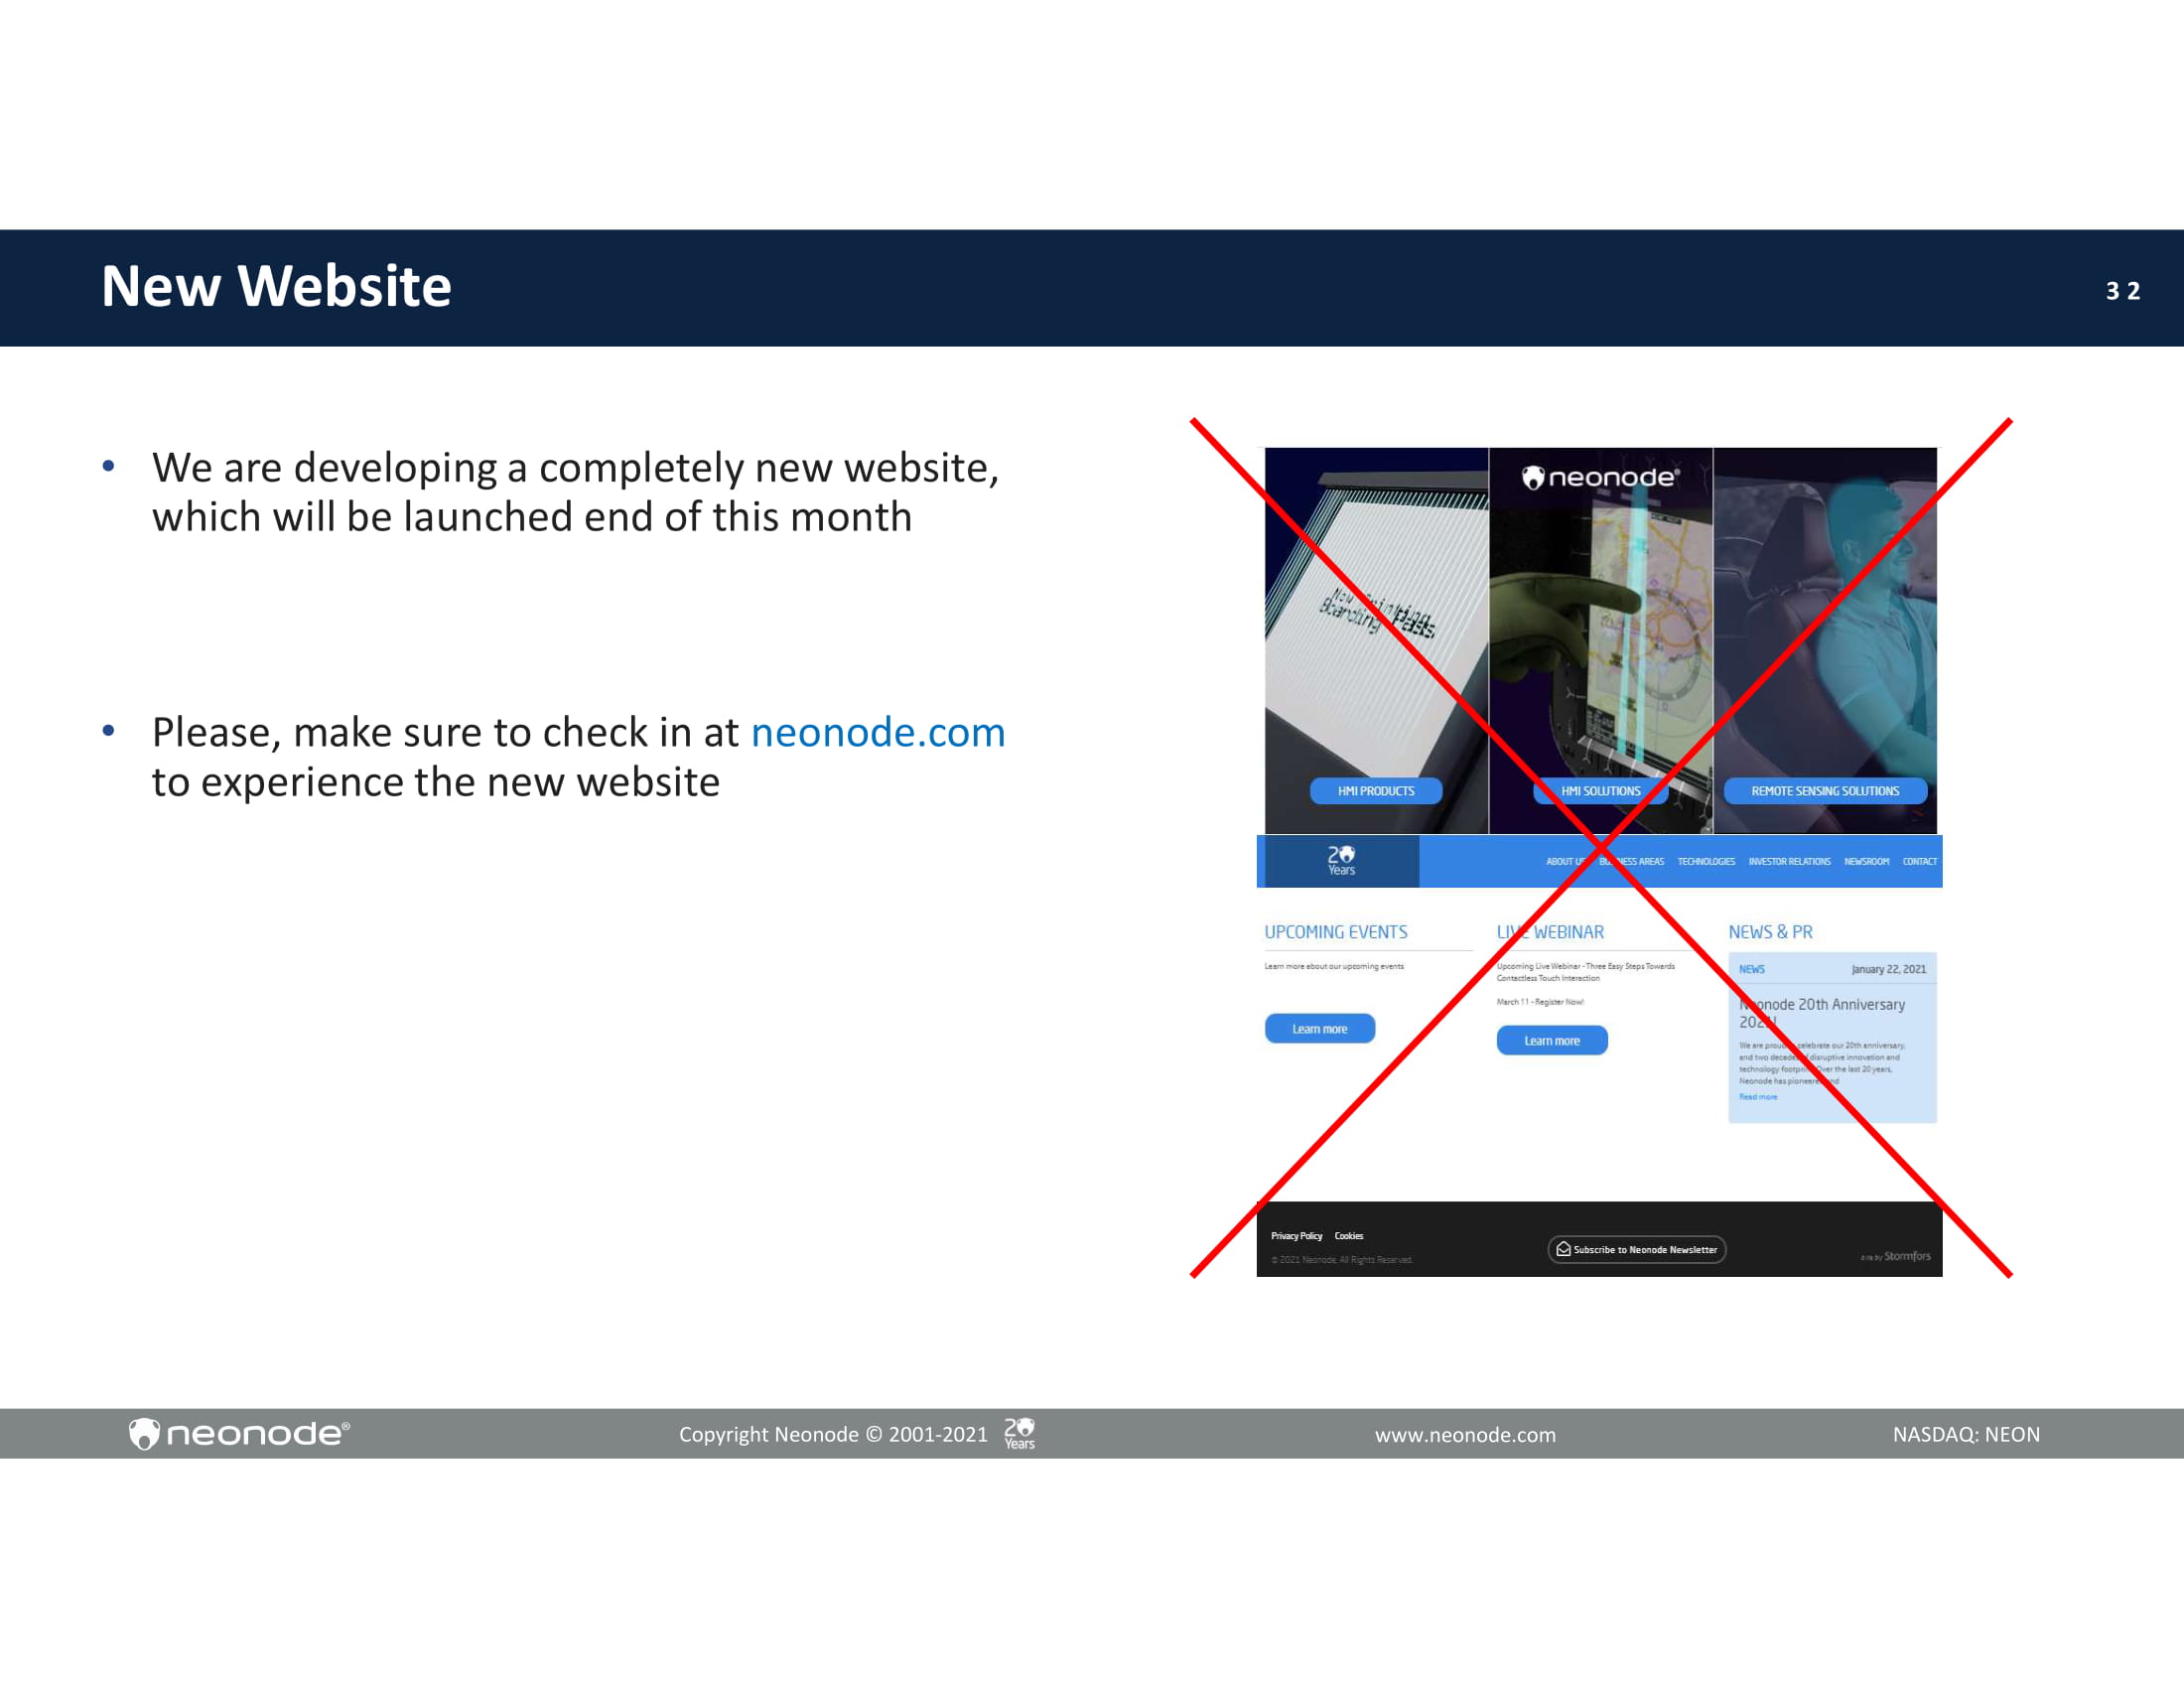
3 2 New Website • We are developing a completely new website, which will be launched end of this month • Please, make sure to check in at neonode.com to experience the new website Copyright Neonode © 2001 - 2021 NASDAQ: NEON www.neonode.com
3 3 Neonode 20 Years • This year we celebrate our 20 - year anniversary Copyright Neonode © 2001 - 2021 NASDAQ: NEON www.neonode.com • Make sure to follow us on social media and to visit our website neonode.com regularly for updates
3 4 Q & A Copyright Neonode © 2001 - 2021 NASDAQ: NEON www.neonode.com

Thank You i n f o @ n eo n o d e .c om neonode.com