0000087050
false
00000
0000087050
2023-05-11
2023-05-11
iso4217:USD
xbrli:shares
iso4217:USD
xbrli:shares
UNITED STATES
SECURITIES AND EXCHANGE COMMISSION
Washington, D.C. 20549
FORM 8-K
CURRENT REPORT
Pursuant to Section 13 or 15(d) of the Securities
Exchange Act of 1934
Date of Report (Date of earliest event reported):
May 11, 2023
NEONODE INC.
(Exact name of issuer of securities held pursuant
to the plan)
Commission File Number 1-35526
| Delaware |
|
94-1517641 |
(State or other jurisdiction
of incorporation) |
|
(I.R.S. Employer
Identification No.) |
Karlavägen 100, 115 26 Stockholm, Sweden
(Address of Principal Executive Office, including
Zip Code)
+46 (0) 86671717
Registrant’s telephone number, including
area code:
Not Applicable
(Former name or former address, if changed since
last report)
Check the appropriate box below if the Form 8-K
filing is intended to simultaneously satisfy the filing obligation of the registrant under any of the following provisions (see General
Instruction A.2. below):
| ☐ |
Written communications pursuant to Rule 425 under the Securities Act (17 CFR 230.425) |
| ☐ |
Soliciting material pursuant to Rule 14a-12 under the Exchange Act (17 CFR 240.14a-12) |
| ☐ |
Pre-commencement communications pursuant to Rule 14d-2(b) under the Exchange Act (17 CFR 240.14d-2(b)) |
| ☐ |
Pre-commencement communications pursuant to Rule 13e-4(c) under the Exchange Act (17 CFR 240.13e-4(c)) |
Securities registered pursuant to Section 12(b) of the Act:
| Title of each class |
|
Trading Symbol(s) |
|
Name of each exchange on which registered |
| Common Stock, par value $0.001 per share |
|
NEON |
|
The Nasdaq Stock Market LLC |
Indicate by check mark whether the registrant
is an emerging growth company as defined in Rule 405 of the Securities Act of 1933 (§230.405 of this chapter) or Rule 12b-2 of the
Securities Exchange Act of 1934 (§240.12b-2 of this chapter).
Emerging growth company ☐
If an emerging growth company, indicate by check
mark if the registrant has elected not to use the extended transition period for complying with any new or revised financial accounting
standards provided pursuant to Section 13(a) of the Exchange Act. ☐
Item 2.02. Results of Operations and Financial
Condition.
On May 11, 2023, Neonode Inc. (the “Company”)
reported its earnings for the three months ended March 31, 2023 (the “Earnings Release”) and posted on the Neonode website
the First Quarter 2023 Presentation (the “Presentation”). A copy of the Earnings Release and the Presentation are attached
hereto as Exhibits 99.1 and 99.2, respectively, and are incorporated herein by reference.
The information furnished pursuant to this Item
2.02, including Exhibits 99.1 and 99.2, shall not be deemed “filed” for purposes of Section 18 of the Securities Exchange
Act of 1934, as amended (the “Exchange Act”), or otherwise subject to the liabilities under that Section, or incorporated
by reference in any filing under the Securities Act of 1933, as amended (the “Securities Act”), or the Exchange Act, except
as shall be expressly set forth by specific reference in such a filing.
Item 7.01 Regulation FD Disclosure
As previously announced, the Company will conduct
a conference call today, Thursday, May 11, 2023 at 10:00 a.m. ET. The presentation slides to be used during the call, attached hereto
as Exhibit 99.2, will be available on the “Investor Relations” section of the Company’s website at www.neonode.com immediately
prior to the call. The information contained in, or that can be accessed through the Company’s website is not a part of this filing.
The information furnished pursuant to this Item
7.01, including Exhibit 99.2, shall not be deemed “filed” for purposes of Section 18 of the Exchange Act, or otherwise subject
to the liabilities under that Section, or incorporated by reference in any filing under the Securities Act or the Exchange Act, except
as shall be expressly set forth by specific reference in such a filing.
Item 9.01. Financial Statements and Exhibits.
(d) Exhibits
SIGNATURES
Pursuant to the requirements
of the Securities Exchange Act of 1934, the Registrant has duly caused this report to be signed on its behalf by the undersigned thereunto
duly authorized.
| Date: May 11, 2023 |
NEONODE INC. |
| |
|
|
| |
By: |
/s/ Fredrik Nihlén |
| |
Name: |
Fredrik Nihlén |
| |
Title: |
Chief Financial Officer |
2
Exhibit 99.1

Press Release
For Release, 09:10AM ET May 11, 2023
Neonode Reports Quarter Ended March 31, 2023 Financial Results
STOCKHOLM, SWEDEN, May 11, 2023 — Neonode Inc. (NASDAQ:
NEON) today reported financial results for the three months ended March 31, 2023.
FINANCIAL SUMMARY FOR THE QUARTER ENDED MARCH 31, 2023:
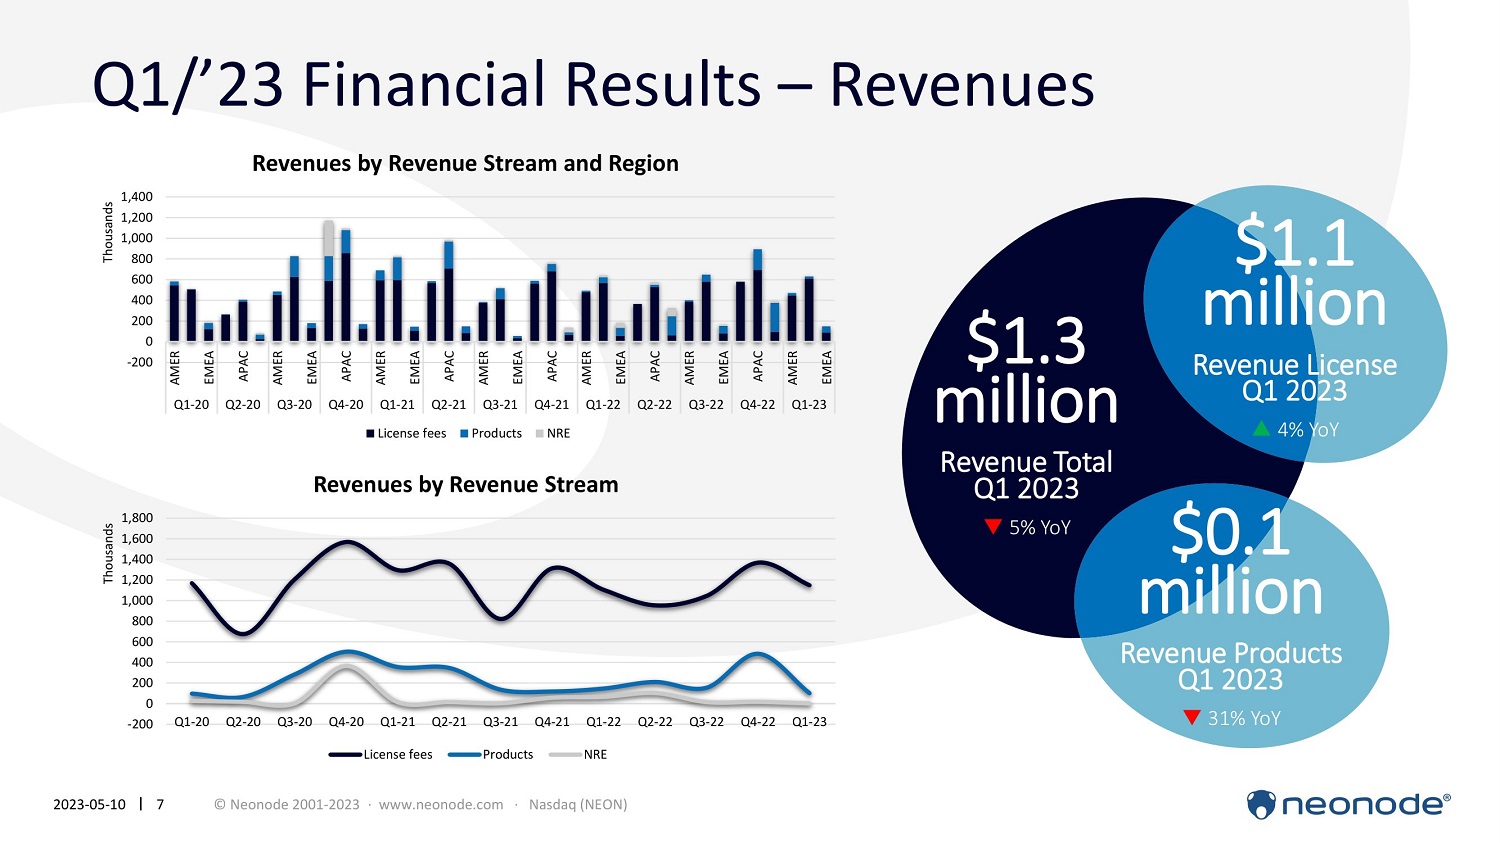
| ● | Revenue of $1.3 million, a decrease of 4.9% compared to the same period in the prior year. |
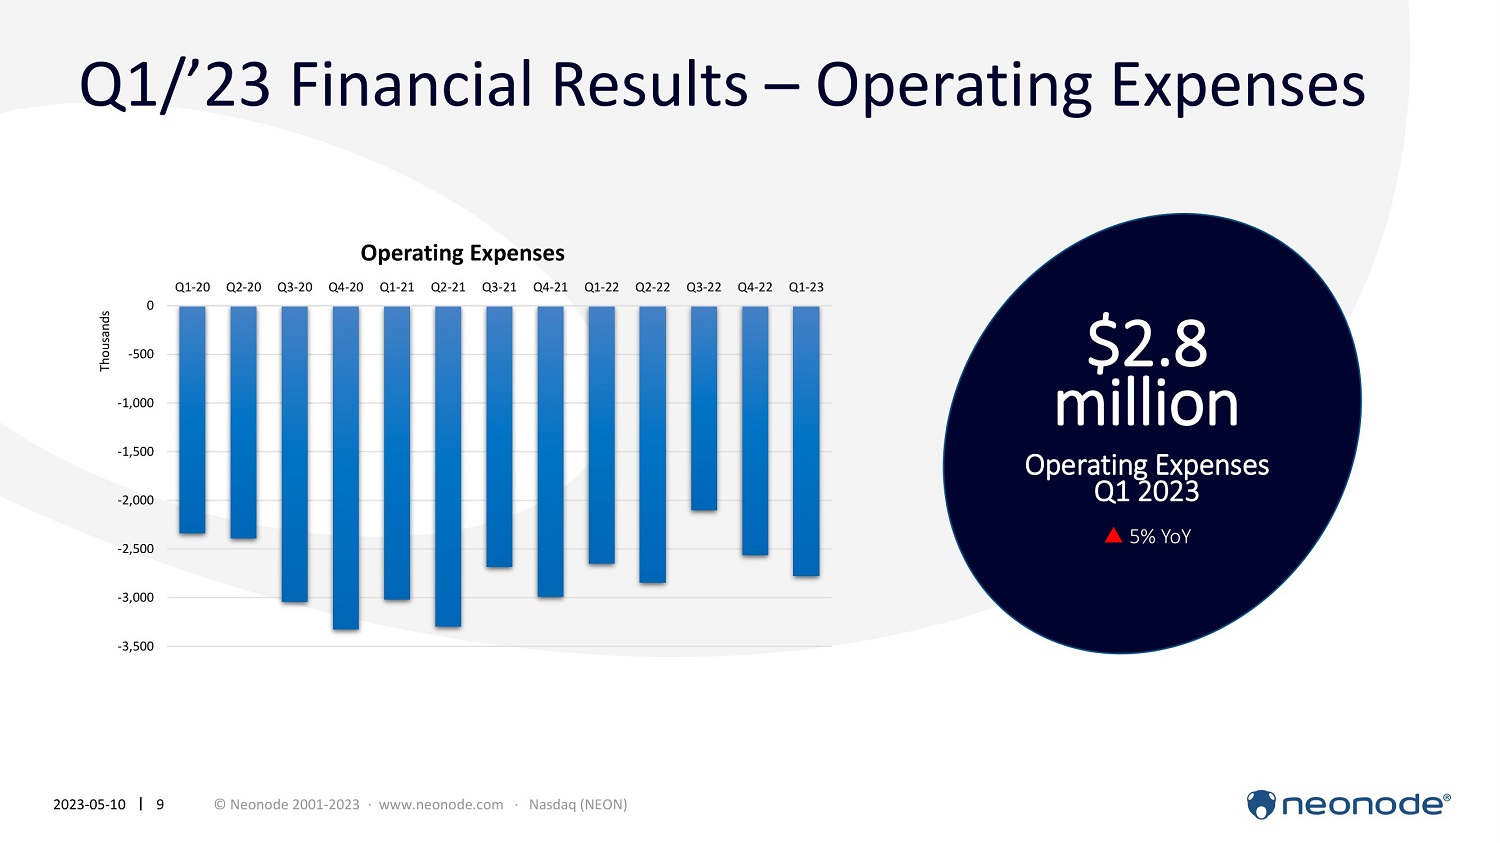
| ● | Operating expenses of $2.8 million, an increase of 4.9% compared to the same period in the prior year. |
| ● | Net loss of $1.4 million, or $0.09 per share, compared to $1.4 million, or $0.10 per share, for the same period in the prior year. |
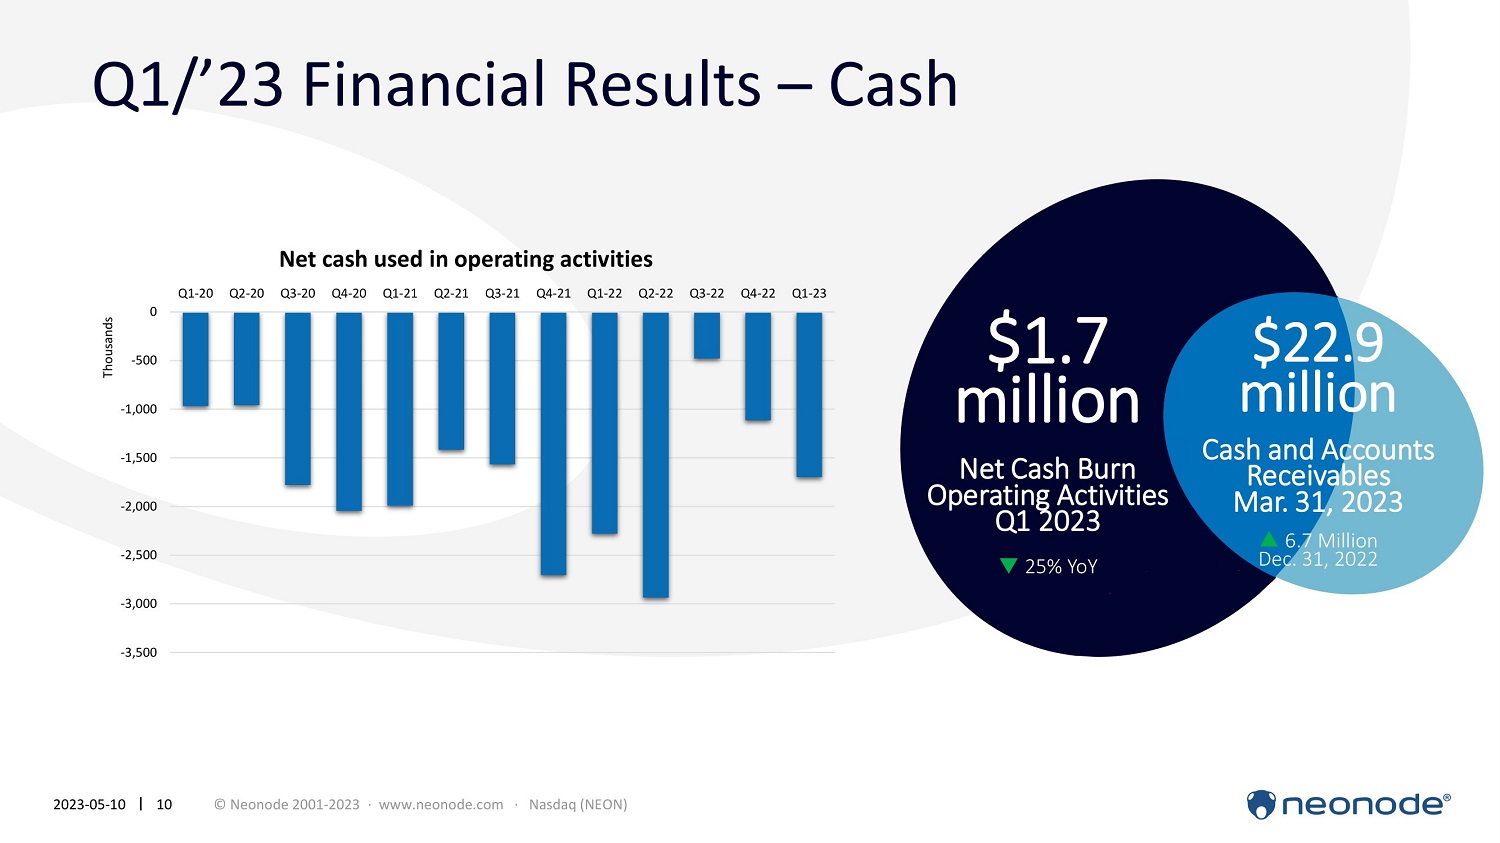
| ● | Cash used by operations of $1.7 million compared to $2.3 million for the same period in the prior year. |
| ● | Cash and accounts receivable of $22.9 million as of March 31, 2023 compared to $16.3 million as of December 31, 2022. |
THE CEO’S COMMENTS
“Our licensing revenues during Q1 were stable indicating that
the global supply chain challenges related to semiconductor supply shortages that have hampered our printer and automotive customers’
production and sales for the last two years are beginning to improve and that demand for our customers’ products is still strong”,
said Dr. Urban Forssell, Neonode’s CEO.
“Our product sales in Q1 were below expectations with many markets
starting the year very slowly. On a positive note, we are seeing strong interest for our solutions in China where businesses and markets
have begun to rebound following the lifting of COVID-related shutdowns. We are working together with different partners to try to capitalize
on this and plan to increase our marketing efforts in China going forward, which we hope will start to bear fruit later this year and
the next,” continued Dr. Forssell.
“While continuously monitoring our performance and adjusting
our strategies and tactics, we continue to execute on our overall business strategy to establish beachheads in key segments from which
we later can expand to further grow our business. As part of this strategy, we are using our strong cash position to intensify our marketing
work – both online and through participation in tradeshows and other types of events – and are recruiting experienced core
competence to strengthen our sales and engineering teams, which is key for accelerating growth,” concluded Dr. Forssell.
FINANCIAL OVERVIEW FOR THE QUARTER ENDED MARCH 31, 2023
Net revenues for the quarter ended March 31,
2023 were $1.3 million, a 4.9% decrease compared to the same period in 2022. For the 2023 period, license revenues were $1.1 million,
an increase of 4.0% compared to the 2022 period. The increase is primarily the result of an increase in volume as the global supply chain
challenges related to semiconductor supply shortages that hampered our printer and automotive customers’ production and sales for
the last two years are beginning to improve.
Revenues from product sales were $0.1 million, a 30.6% decrease compared
to the same period in 2022. The first quarter is typically slow due to the high number of holidays, but the decrease is also due to high
inventory levels at some key customers after purchases during the fourth quarter 2022.
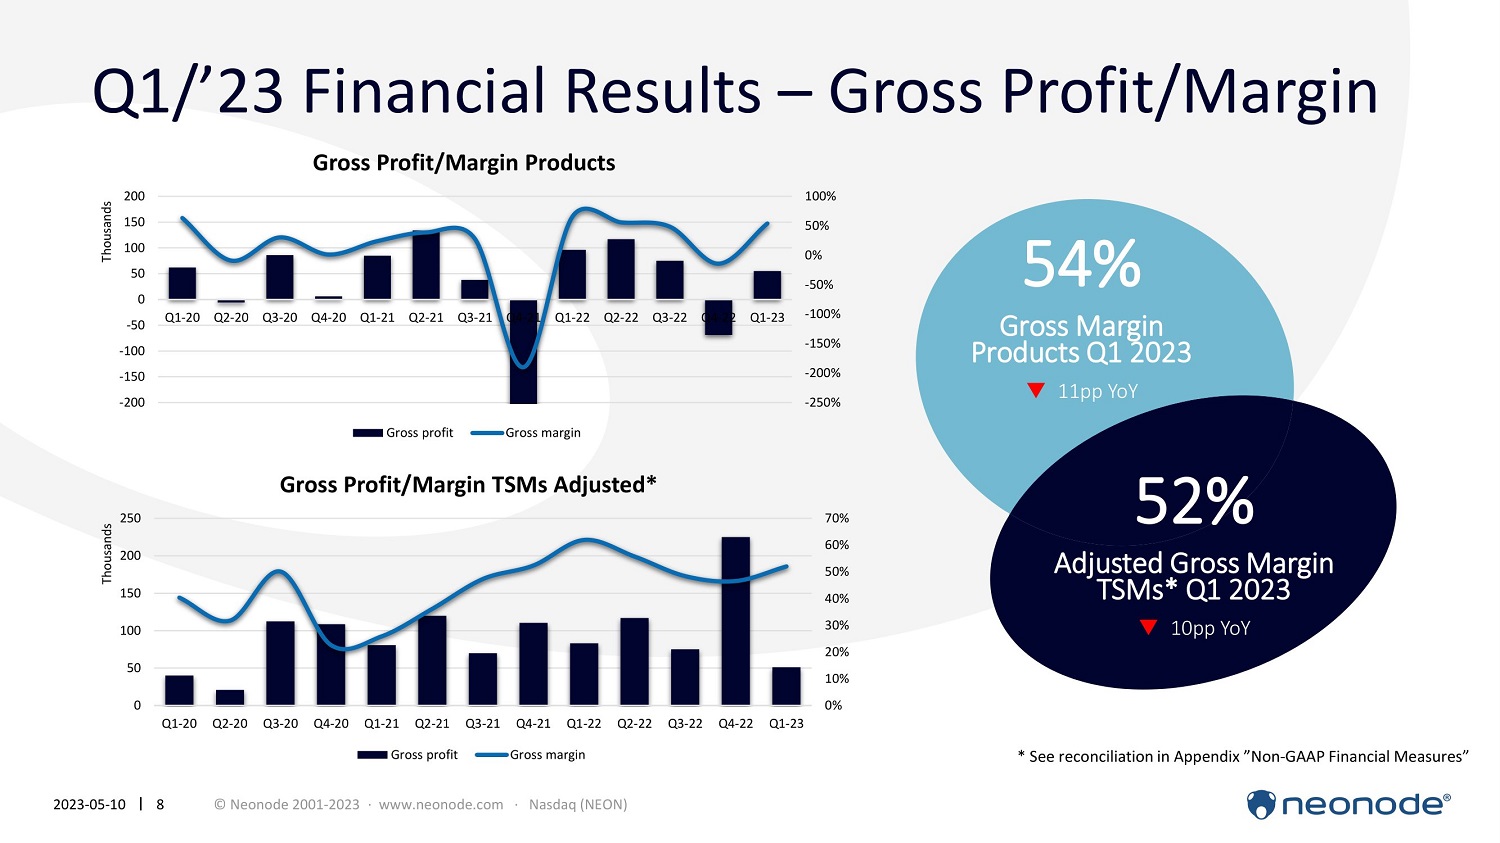
Gross margin related to products was 53.9% for the first quarter of
2023 compared to 65.3% in the same period in 2022. The gross margin for products varies with the product mix.
Our operating expenses increased by 4.9% for the first quarter of 2023
compared to the same period in 2022, primarily due to higher professional fees.
Net loss attributable to Neonode for the three months ended March 31,
2023 was $1.4 million, or $0.09 per share, compared to a net loss of $1.4 million, or $0.10 per share, for the same period in 2022. Cash
used by operations was $1.7 million in the first quarter of 2023 compared to $2.3 million for the same period in 2022. The decrease is
primarily the result of less component purchases offset by increased accounts receivable and unbilled revenues due to the timing of customer
payments.
Cash and accounts receivable totaled $22.9 million and working capital
was $25.6 million as of March 31, 2023 compared to $16.3 million and $19.1 million as of December 31, 2022, respectively.
For more information, please contact:
Chief Financial Officer
Fredrik Nihlén
E-mail: [email protected]
Phone: +46 703 97 21 09
Chief Executive Officer
Urban Forssell
E-mail: [email protected]
Phone: +46 734 10 03 59
About Neonode
Neonode Inc. (NASDAQ:NEON)
is a publicly traded company, headquartered in Stockholm, Sweden and established in 2001. The company provides advanced optical sensing
solutions for contactless touch, touch, gesture control, and in-cabin monitoring. Building on experience acquired during years of advanced
R&D and technology licensing, Neonode’s technology is currently deployed in more than 80 million products and the company holds
more than 100 patents worldwide. Neonode’s customer base includes some of the world’s best-known Fortune 500 companies in
the consumer electronics, office equipment, automotive, elevator, and self-service kiosk markets.
NEONODE and the NEONODE logo are trademarks of Neonode Inc. registered
in the United States and other countries.
For further information please visit www.neonode.com
Follow us at:
Cision
LinkedIn
Twitter
Safe Harbor Statement
This press release contains forward-looking
statements within the meaning of the Private Securities Litigation Reform Act of 1995. These include, but are not limited to, statements
relating to our expectations for growth and the growing demand for our products, future performance or future events. These statements
are based on current assumptions, expectations and information available to Neonode management and involve a number of known and unknown
risks, uncertainties and other factors that may cause Neonode’s actual results, levels of activity, performance or achievements
to be materially different from any expressed or implied by these forward-looking statements.
These risks, uncertainties, and factors include risks related to
our reliance on the ability of our customers to design, manufacture and sell their products with our touch technology, the length of a
customer’s product development cycle, our dependence and our customers’ dependence on suppliers, the COVID-19 pandemic, the
global economy generally and other risks discussed under “Risk Factors” and elsewhere in Neonode’s public filings with
the SEC from time to time, including Neonode’s annual reports on Form 10-K, quarterly reports on Form 10-Q, and current reports
on Form 8-K. You are advised to carefully consider these various risks, uncertainties and other factors. Although Neonode management believes
that the forward-looking statements contained in this press release are reasonable, it can give no assurance that its expectations will
be fulfilled. Forward-looking statements are made as of today’s date, and Neonode undertakes no duty to update or revise them.
NEONODE INC.
CONSOLIDATED BALANCE SHEETS
(In thousands, except share and per share amounts)
| | |
March 31, | | |
December 31, | |
| | |
2023 | | |
2022 | |
| | |
(Unaudited) | | |
(Audited) | |
| ASSETS | |
| | |
| |
| Current assets: | |
| | |
| |
| Cash | |
$ | 20,981 | | |
$ | 14,816 | |
| Accounts receivable and unbilled revenues, net | |
| 1,941 | | |
| 1,448 | |
| Inventory | |
| 3,851 | | |
| 3,827 | |
| Prepaid expenses and other current assets | |
| 648 | | |
| 707 | |
| Total current assets | |
| 27,421 | | |
| 20,798 | |
| | |
| | | |
| | |
| Property and equipment, net | |
| 284 | | |
| 282 | |
| Operating lease right-of-use assets, net | |
| 103 | | |
| 118 | |
| Total assets | |
$ | 27,808 | | |
$ | 21,198 | |
| | |
| | | |
| | |
| LIABILITIES AND STOCKHOLDERS’ EQUITY | |
| | | |
| | |
| Current liabilities: | |
| | | |
| | |
| Accounts payable | |
$ | 314 | | |
$ | 334 | |
| Accrued payroll and employee benefits | |
| 870 | | |
| 951 | |
| Accrued expenses | |
| 464 | | |
| 200 | |
| Contract liabilities | |
| 31 | | |
| 36 | |
| Current portion of finance lease obligations | |
| 73 | | |
| 95 | |
| Current portion of operating lease obligations | |
| 85 | | |
| 83 | |
| Total current liabilities | |
| 1,837 | | |
| 1,699 | |
| | |
| | | |
| | |
| Finance lease obligations, net of current portion | |
| 41 | | |
| 46 | |
| Operating lease obligations, net of current portion | |
| 18 | | |
| 35 | |
| Total liabilities | |
| 1,896 | | |
| 1,780 | |
| | |
| | | |
| | |
| Commitments and contingencies | |
| | | |
| | |
| | |
| | | |
| | |
| Stockholders’ equity: | |
| | | |
| | |
| Common stock, 25,000,000 shares authorized, with par value of $0.001; 15,359,481 and 14,455,765 shares issued and outstanding at March 31, 2023 and December 31, 2022, respectively | |
| 15 | | |
| 14 | |
| Additional paid-in capital | |
| 235,118 | | |
| 227,235 | |
| Accumulated other comprehensive loss | |
| (305 | ) | |
| (340 | ) |
| Accumulated deficit | |
| (208,916 | ) | |
| (207,491 | ) |
| Total stockholders’ equity | |
| 25,912 | | |
| 19,418 | |
| Total liabilities and stockholders’ equity | |
$ | 27,808 | | |
$ | 21,198 | |
NEONODE INC.
CONSOLIDATED STATEMENTS OF OPERATIONS
(In thousands, except per share amounts)
| | |
Three months ended
March 31, | |
| | |
2023 | | |
2022 | |
| Revenues: | |
| | |
| |
| License fees | |
$ | 1,148 | | |
$ | 1,104 | |
| Products | |
| 102 | | |
| 147 | |
| Non-recurring engineering | |
| 3 | | |
| 67 | |
| Total revenues | |
| 1,253 | | |
| 1,318 | |
| | |
| | | |
| | |
| Cost of revenues: | |
| | | |
| | |
| Products | |
| 47 | | |
| 51 | |
| Non-recurring engineering | |
| - | | |
| 9 | |
| Total cost of revenues | |
| 47 | | |
| 60 | |
| | |
| | | |
| | |
| Total gross margin | |
| 1,206 | | |
| 1,258 | |
| | |
| | | |
| | |
| Operating expenses: | |
| | | |
| | |
| Research and development | |
| 802 | | |
| 1,023 | |
| Sales and marketing | |
| 592 | | |
| 616 | |
| General and administrative | |
| 1,384 | | |
| 1,010 | |
| Total operating expenses | |
| 2,778 | | |
| 2,649 | |
| Operating loss | |
| (1,572 | ) | |
| (1,391 | ) |
| | |
| | | |
| | |
| Other income (expense): | |
| | | |
| | |
| Interest income (expense), net | |
| 158 | | |
| (2 | ) |
| Total other income (expense) | |
| 158 | | |
| (2 | ) |
| | |
| | | |
| | |
| Loss before provision for income taxes | |
| (1,414 | ) | |
| (1,393 | ) |
| | |
| | | |
| | |
| Provision for income taxes | |
| 11 | | |
| 44 | |
| Net loss including noncontrolling interests | |
| (1,425 | ) | |
| (1,437 | ) |
| Less: Net loss attributable to noncontrolling interests | |
| - | | |
| 57 | |
| Net loss attributable to Neonode Inc. | |
$ | (1,425 | ) | |
$ | (1,380 | ) |
| | |
| | | |
| | |
| Loss per common share: | |
| | | |
| | |
| Basic and diluted loss per share | |
$ | (0.09 | ) | |
$ | (0.10 | ) |
| Basic and diluted – weighted average number of common shares outstanding | |
| 15,209 | | |
| 13,576 | |
NEONODE INC.
CONSOLIDATED STATEMENTS OF COMPREHENSIVE LOSS
(In thousands)
| | |
Three months ended
March 31, | |
| | |
2023 | | |
2022 | |
| Net loss | |
$ | (1,425 | ) | |
$ | (1,437 | ) |
| | |
| | | |
| | |
| Other comprehensive income (loss): | |
| | | |
| | |
| Foreign currency translation adjustments | |
| 35 | | |
| 33 | |
| Other comprehensive loss | |
| (1,390 | ) | |
| (1,404 | ) |
| Less: Comprehensive loss attributable to noncontrolling interests | |
| - | | |
| 57 | |
| Other comprehensive loss attributable to Neonode Inc. | |
$ | (1,390 | ) | |
$ | (1,347 | ) |
NEONODE INC.
CONSOLIDATED STATEMENTS OF STOCKHOLDERS’
EQUITY
(In thousands)
| | |
Common
Stock Shares
Issued | | |
Common
Stock
Amount | | |
Additional
Paid-in
Capital | | |
Accumulated
Other
Comprehensive
Income
(Loss) | | |
Accumulated
Deficit | | |
Total
Neonode Inc.
Stockholders’
Equity | | |
Noncontrolling
Interests | | |
Total
Stockholders’
Equity | |
| Balances, December 31, 2022 | |
| 14,456 | | |
$ | 14 | | |
$ | 227,235 | | |
$ | (340 | ) | |
$ | (207,491 | ) | |
$ | 19,418 | | |
$ | - | | |
$ | 19,418 | |
| Stock-based compensation | |
| - | | |
| - | | |
| 18 | | |
| - | | |
| - | | |
| 18 | | |
| - | | |
| 18 | |
| Issuance of shares for cash, net of offering costs | |
| 903 | | |
| 1 | | |
| 7,865 | | |
| - | | |
| - | | |
| 7,866 | | |
| - | | |
| 7,866 | |
| Foreign currency translation adjustment | |
| - | | |
| - | | |
| - | | |
| 35 | | |
| - | | |
| 35 | | |
| - | | |
| 35 | |
| Net loss | |
| - | | |
| - | | |
| - | | |
| - | | |
| (1,425 | ) | |
| (1,425 | ) | |
| - | | |
| (1,425 | ) |
| Balances, March 31, 2023 | |
| 15,359 | | |
$ | 15 | | |
$ | 235,118 | | |
$ | (305 | ) | |
$ | (208,916 | ) | |
$ | 25,912 | | |
$ | - | | |
$ | 25,912 | |
| | |
Common
Stock Shares
Issued | | |
Common
Stock
Amount | | |
Additional
Paid-in
Capital | | |
Accumulated
Other
Comprehensive
Income
(Loss) | | |
Accumulated
Deficit | | |
Total
Neonode Inc.
Stockholders’
Equity | | |
Noncontrolling
Interests | | |
Total
Stockholders’
Equity | |
| Balances, December 31, 2021 | |
| 13,576 | | |
$ | 14 | | |
$ | 226,880 | | |
$ | (408 | ) | |
$ | (202,608 | ) | |
$ | 23,878 | | |
$ | (4,041 | ) | |
$ | 19,837 | |
| Stock-based compensation | |
| - | | |
| - | | |
| 39 | | |
| - | | |
| - | | |
| 39 | | |
| - | | |
| 39 | |
| Foreign currency translation adjustment | |
| - | | |
| - | | |
| - | | |
| 33 | | |
| - | | |
| 33 | | |
| - | | |
| 33 | |
| Net loss | |
| - | | |
| - | | |
| - | | |
| - | | |
| (1,380 | ) | |
| (1,380 | ) | |
| (57 | ) | |
| (1,437 | ) |
| Balances, March 31, 2022 | |
| 13,576 | | |
$ | 14 | | |
$ | 226,919 | | |
$ | (375 | ) | |
$ | (203,988 | ) | |
$ | 22,570 | | |
$ | (4,098 | ) | |
$ | 18,472 | |
NEONODE INC.
CONSOLIDATED STATEMENTS OF CASH FLOWS
(In thousands)
| | |
Three months ended
March 31, | |
| | |
2023 | | |
2022 | |
| Cash flows from operating activities: | |
| | |
| |
| Net loss (including noncontrolling interests) | |
$ | (1,425 | ) | |
$ | (1,437 | ) |
| Adjustments to reconcile net loss to net cash used in operating activities: | |
| | | |
| | |
| Stock-based compensation expense | |
| 18 | | |
| 39 | |
| Depreciation and amortization | |
| 17 | | |
| 45 | |
| Amortization of operating lease right-of-use assets | |
| 16 | | |
| 114 | |
| Changes in operating assets and liabilities: | |
| | | |
| | |
| Accounts receivable and unbilled revenue, net | |
| (491 | ) | |
| 146 | |
| Inventory | |
| (11 | ) | |
| (1,121 | ) |
| Prepaid expenses and other current assets | |
| 66 | | |
| 98 | |
| Accounts payable, accrued payroll and employee benefits, and accrued expenses | |
| 133 | | |
| 22 | |
| Contract liabilities | |
| (5 | ) | |
| (1 | ) |
| Operating lease obligations | |
| (16 | ) | |
| (184 | ) |
| Net cash used in operating activities | |
| (1,698 | ) | |
| (2,279 | ) |
| | |
| | | |
| | |
| Cash flows from investing activities: | |
| | | |
| | |
| Purchase of property and equipment | |
| - | | |
| (5 | ) |
| Net cash used in investing activities | |
| - | | |
| (5 | ) |
| | |
| | | |
| | |
| Cash flows from financing activities: | |
| | | |
| | |
| Proceeds from issuance of common stock, net of offering costs | |
| 7,866 | | |
| - | |
| Principal payments on finance lease obligations | |
| (28 | ) | |
| (61 | ) |
| Net cash provided by (used in) financing activities | |
| 7,838 | | |
| (61 | ) |
| | |
| | | |
| | |
| Effect of exchange rate changes on cash | |
| 25 | | |
| 88 | |
| | |
| | | |
| | |
| Net change in cash | |
| 6,165 | | |
| (2,257 | ) |
| Cash at beginning of period | |
| 14,816 | | |
| 17,383 | |
| Cash at end of period | |
$ | 20,981 | | |
$ | 15,126 | |
| | |
| | | |
| | |
| Supplemental disclosure of cash flow information: | |
| | | |
| | |
| Cash paid for income taxes | |
$ | 11 | | |
$ | 44 | |
| Cash paid for interest | |
$ | 2 | | |
$ | 2 | |
7
Exhibit
99.2
Q1 2023 Earnings Call May 11, 2023 2023 - 05 - 10 1 © Neonode 2001 - 2023 · www.neonode.com · Nasdaq (NEON)

T od a y ’ s Presenters 2023 - 05 - 10 2 © Neonode 2001 - 2023 · www.neonode.com · Nasdaq (NEON) • Urban Forssell, CEO • Fredrik Nihlén, CFO
Legal Disclaimer 2023 - 05 - 10 3 © Neonode 2001 - 2023 · www.neonode.com · Nasdaq (NEON) This presentation contains, and related oral and written statements of Neonode Inc. (the “Company”) and its management may contain, forward - looking statements within the meaning of the Private Securities Litigation Reform Act of 1995. Forward - looking statements include information about current expectations, strategy, plans, potential financial performance or future events. They also may include statements about market opportunity and sales growth, financial results, use of cash, product development and introduction, regulatory matters and sales efforts. Forward - looking statements are based on assumptions, expectations and information available to the Company and its management and involve a number of known and unknown risks, uncertainties and other factors that may cause the Company’s actual results, levels of activity, performance or achievements to be materially different from any expressed or implied by these forward - looking statements. These uncertainties and risks include, but are not limited to, our ability to secure financing when needed on acceptable terms, risks related to new product development, our ability to protect our intellectual property, our ability to compete, general economic conditions including as a result of the ongoing COVID - 19 pandemic or geopolitical conflicts such as the war in Ukraine, as well as other risks outlined in filings of the Company with the U.S. Securities and Exchange Commission (the “SEC”) under the Securities Exchange Act of 1934, as amended, including the sections entitled “Risk Factors” and “Management’s Discussion and Analysis of Financial Condition and Results of Operations.” Prospective investors are advised to carefully consider these various risks, uncertainties and other factors. Any forward - looking statements included in this presentation are made as of today’s date. The Company and its management undertake no duty to update or revise forward - looking statements. This presentation has been prepared by the Company based on its own information, as well as information from public sources. Certain of the information contained herein may be derived from information provided by industry sources. The Company believes such information is accurate and that the sources from which it has been obtained are reliable. However, the Company has not independently verified such information and cannot guarantee the accuracy of such information.

Agenda 2023 - 05 - 10 4 © Neonode 2001 - 2023 · www.neonode.com · Nasdaq (NEON) 1. Summary of Key Points 2. Q1 2023 Financial Results 3. Brief Business Update 4. Q&A Neonode Inc. Q1 2023 | May 11, 2023
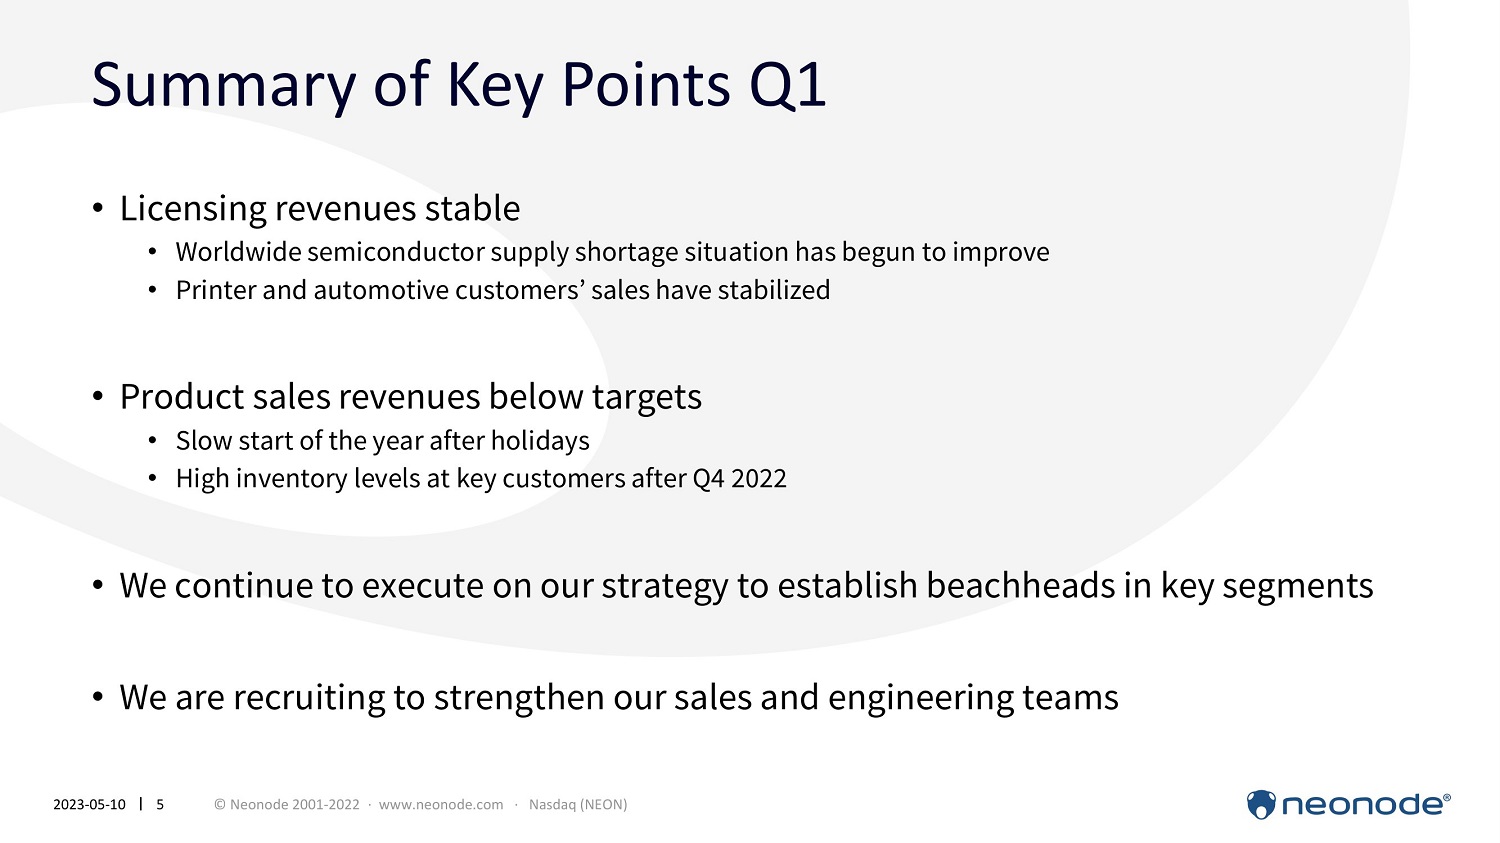
Summary of Key Points Q1 2023 - 05 - 10 5 © Neonode 2001 - 2023 · www.neonode.com · Nasdaq (NEON) • Licensing revenues stable • Worldwide semiconductor supply shortage situation has begun to improve • Printer and automotive customers’ sales have stabilized • Product sales revenues below targets • Slow start of the year after holidays • High inventory levels at key customers after Q4 2022 • We continue to execute on our strategy to establish beachheads in key segments • We are recruiting to strengthen our sales and engineering teams
Agenda 2023 - 05 - 10 6 © Neonode 2001 - 2023 · www.neonode.com · Nasdaq (NEON) 1. Summary of Key Points 2. Q1 2023 Financial Results 3. Brief Business Update 4. Q&A Neonode Inc. Q1 2023 | May 11, 2023
1,400 1,200 1,000 800 600 400 200 0 - 200 AMER EMEA APAC AMER EMEA APAC AMER EMEA APAC AMER EMEA APAC AMER EMEA APAC AMER EMEA APAC AMER EMEA Q1 - 20 Q2 - 20 Q3 - 20 Q4 - 20 Q1 - 22 Q2 - 22 Q3 - 22 Q4 - 22 Q1 - 23 Thousands Q1/’23 Financial Results – Revenues Revenues by Revenue Stream and Region Q1 - 21 Q2 - 21 Q3 - 21 Q4 - 21 License fees Products NRE 1,800 1,600 1,400 1,200 1,000 800 600 400 200 0 - 200 Q2 - 22 Q3 - 22 Q4 - 22 Q1 - 23 Thousands Revenues by Revenue Stream Q1 - 20 Q2 - 20 Q3 - 20 Q4 - 20 Q1 - 21 Q2 - 21 Q3 - 21 Q4 - 21 Q1 - 22 License fees Products NRE $1.3 million Revenue Total Q1 2023 ź 5% YoY 2023 - 05 - 10 7 © Neonode 2001 - 2023 · www.neonode.com · Nasdaq (NEON) $0.1 million Revenue Products Q1 2023 ź 31% YoY $1.1 million Revenue License Q1 2023 Ÿ 4% YoY
Q1/’23 Financial Results – Gross Profit/Margin 52% Adjusted Gross Margin TSMs* Q1 2023 ź 10pp YoY 54% Gross Margin Products Q1 2023 ź 11pp YoY * See reconciliation in Appendix ”Non - GAAP Financial Measures” - 250% - 200% - 150% - 100% - 50% 0% 50% 100 50 0 - 50 - 100 - 150 - 200 200 100% 150 Q1 - 20 Q2 - 20 Q3 - 20 Q4 - 20 Q1 - 21 Q2 - 21 Q3 - 21 Q4 - 21 Q1 - 22 Q2 - 22 Q3 - 22 Q4 - 22 Q1 - 23 Thousands Gross Profit/Margin Products Gross profit Gross margin 0% 10% 20% 50% 40% 30% 60% 70% 0 50 100 150 200 250 Q1 - 20 Q2 - 20 Q3 - 22 Q4 - 22 Q1 - 23 Thousands Gross Profit/Margin TSMs Adjusted* Q3 - 20 Q4 - 20 Q1 - 21 Q2 - 21 Q3 - 21 Q4 - 21 Q1 - 22 Q2 - 22 Gross profit Gross margin 2023 - 05 - 10 8 © Neonode 2001 - 2023 · www.neonode.com · Nasdaq (NEON)
Q1/’23 Financial Results – Operating Expenses $2.8 million Operating Expenses Q1 2023 Ÿ 5% YoY - 3,000 - 3,500 2023 - 05 - 10 9 © Neonode 2001 - 2023 · www.neonode.com · Nasdaq (NEON) - 2,500 - 2,000 - 1,500 - 1,000 - 500 0 Thousands Operating Expenses Q1 - 20 Q2 - 20 Q3 - 20 Q4 - 20 Q1 - 21 Q2 - 21 Q3 - 21 Q4 - 21 Q1 - 22 Q2 - 22 Q3 - 22 Q4 - 22 Q1 - 23
Q1/’23 Financial Results – Cash $22.9 million Cash and Accounts Receivables Mar. 31, 2023 Ÿ 6.7 Million Dec. 31, 2022 $1.7 million Net Cash Burn Operating Activities Q1 2023 ź 25% YoY - 3,000 - 3,500 2023 - 05 - 10 10 © Neonode 2001 - 2023 · www.neonode.com · Nasdaq (NEON) - 2,500 - 2,000 - 1,500 - 1,000 - 500 0 Thousands Net cash used in operating activities Q1 - 20 Q2 - 20 Q3 - 20 Q4 - 20 Q1 - 21 Q2 - 21 Q3 - 21 Q4 - 21 Q1 - 22 Q2 - 22 Q3 - 22 Q4 - 22 Q1 - 23

Agenda 2023 - 05 - 10 11 © Neonode 2001 - 2023 · www.neonode.com · Nasdaq (NEON) 1. Summary of Key Points 2. Q1 2023 Financial Results 3. Brief Business Update 4. Q&A Neonode Inc. Q1 2023 | May 11, 2023

We transform the way humans and machines interact 2023 - 05 - 10 12 © Neonode 2001 - 2023 · www.neonode.com · Nasdaq (NEON)
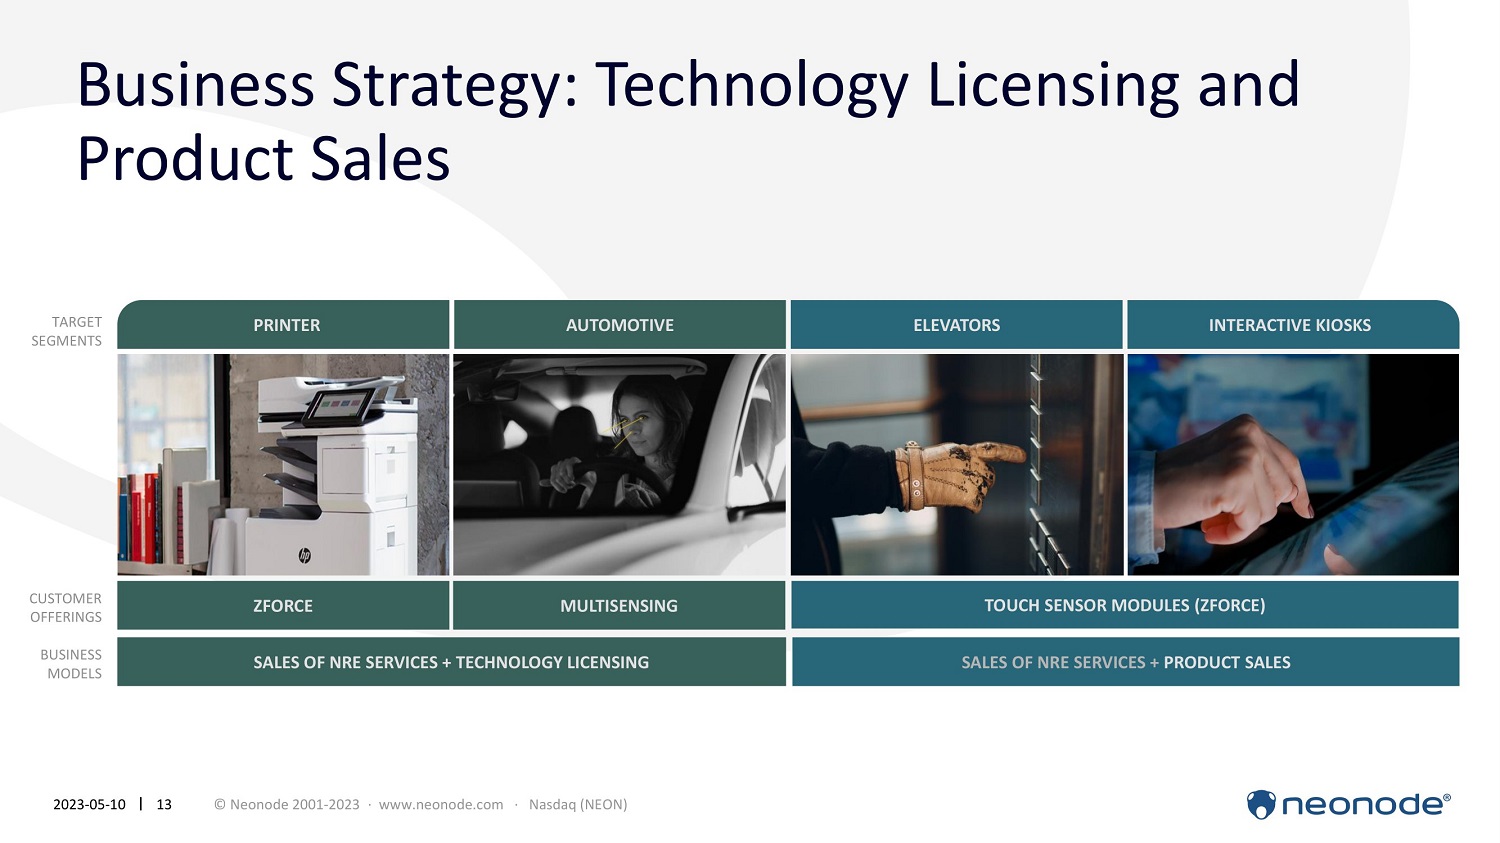
Business Strategy: Technology Licensing and Product Sales INTERACTIVE KIOSKS ELEVATORS PRINTER AUTOMOTIVE TARGET SEGMENTS CUSTOMER OFFERINGS BUSINESS MODELS ZFORCE MULTISENSING TOUCH SENSOR MODULES (ZFORCE) SALES OF NRE SERVICES + TECHNOLOGY LICENSING SALES OF NRE SERVICES + PRODUCT SALES 2023 - 05 - 10 13 © Neonode 2001 - 2023 · www.neonode.com · Nasdaq (NEON)
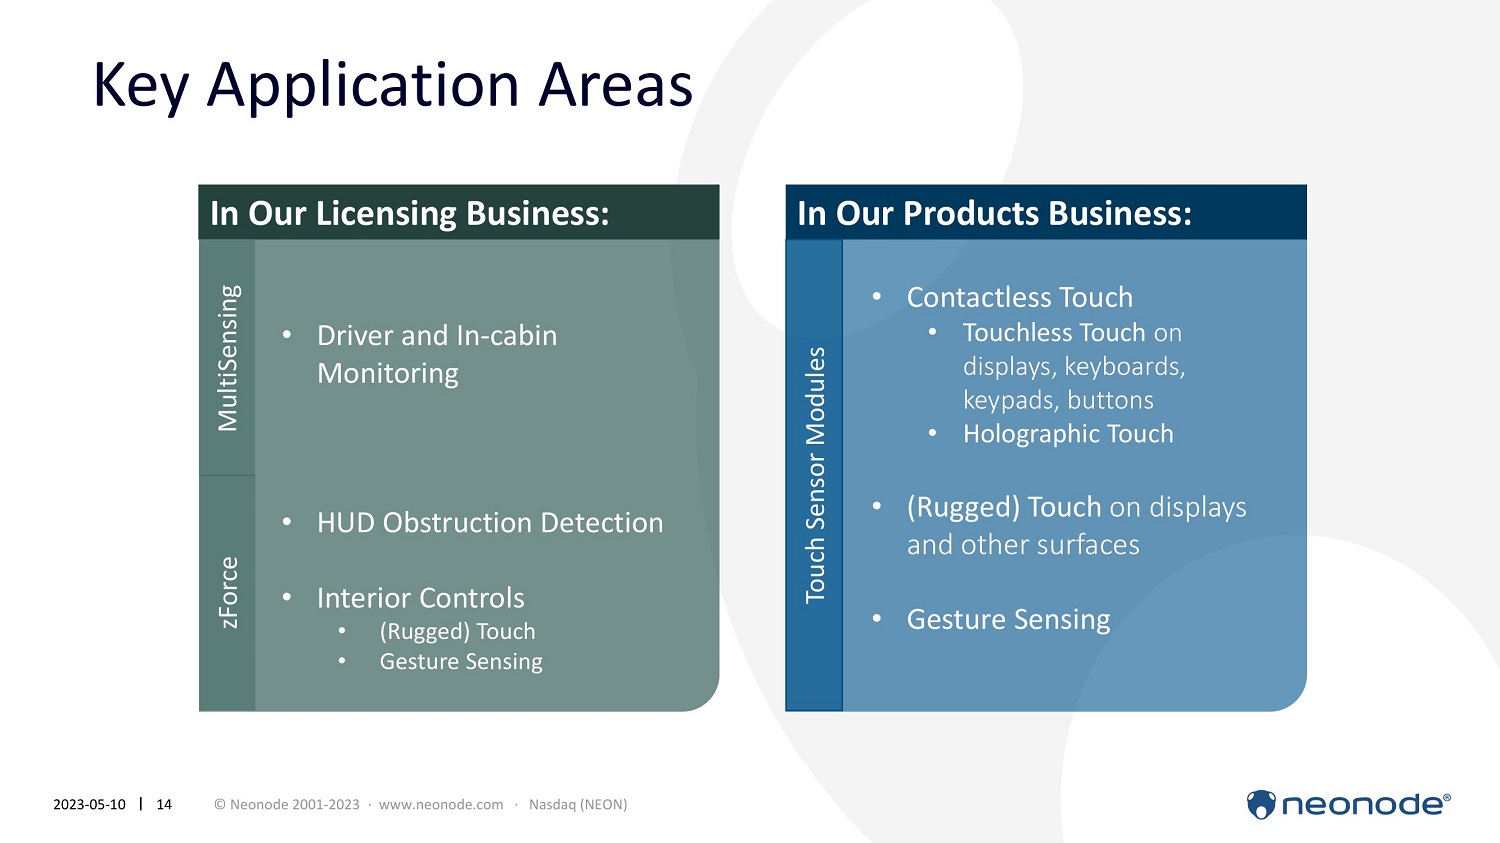
Key Application Areas In Our Licensing Business: • Driver and In - cabin Monitoring • HUD Obstruction Detection • Interior Controls • (Rugged) Touch • Gesture Sensing In Our Products Business: • Contactless Touch • Touchless Touch on displays, keyboards, keypads, buttons • Holographic Touch • (Rugged) Touch on displays and other surfaces • Gesture Sensing zForce MultiSensing Touch Sensor Modules 2023 - 05 - 10 14 © Neonode 2001 - 2023 · www.neonode.com · Nasdaq (NEON)
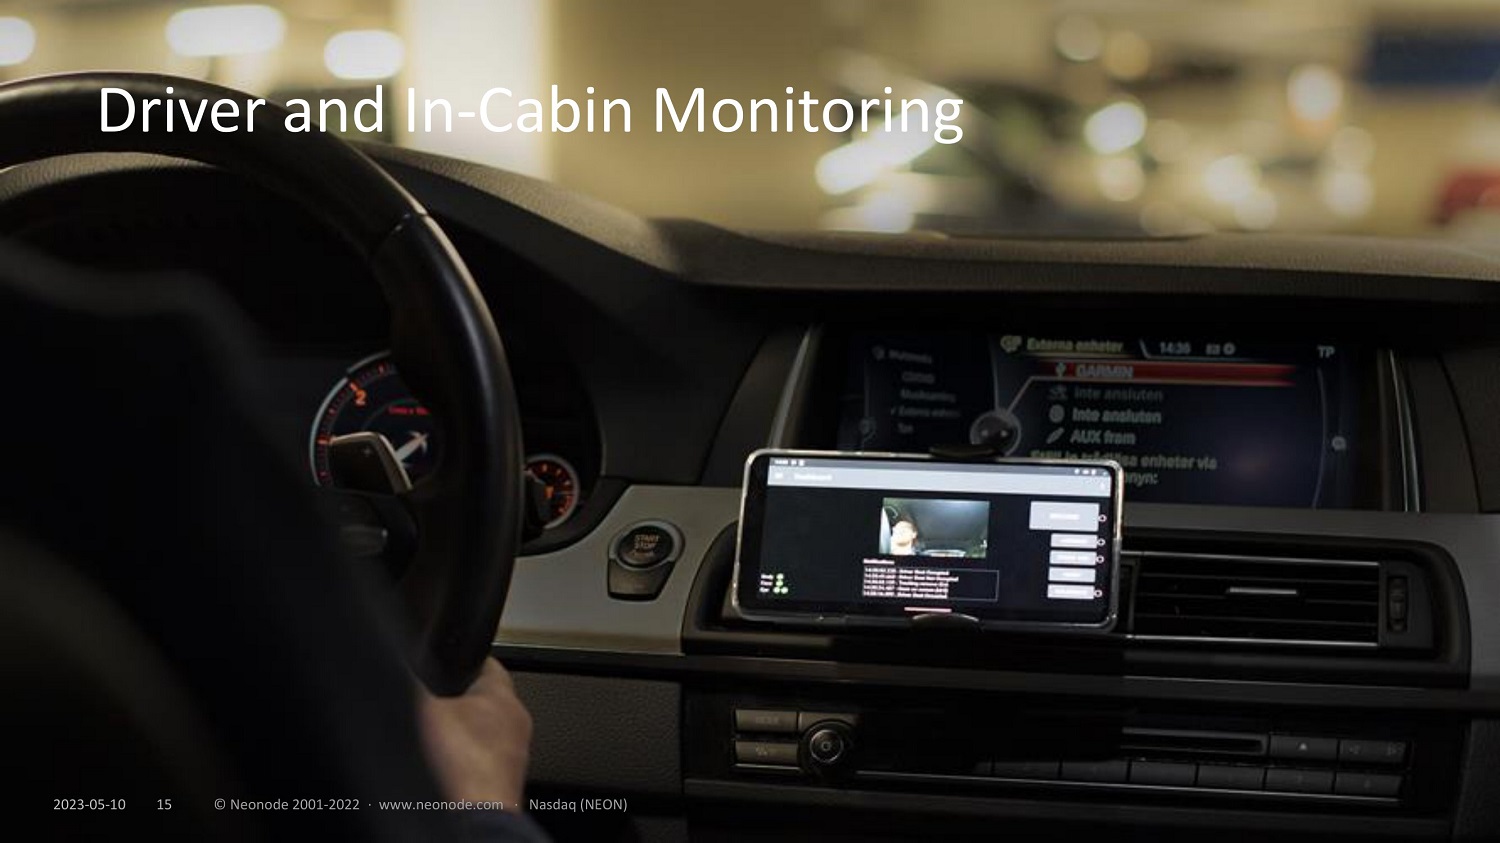
Driver and In - Cabin Monitoring 2023 - 05 - 10 15 © Neonode 2001 - 2023 · www.neonode.com · Nasdaq (NEON)
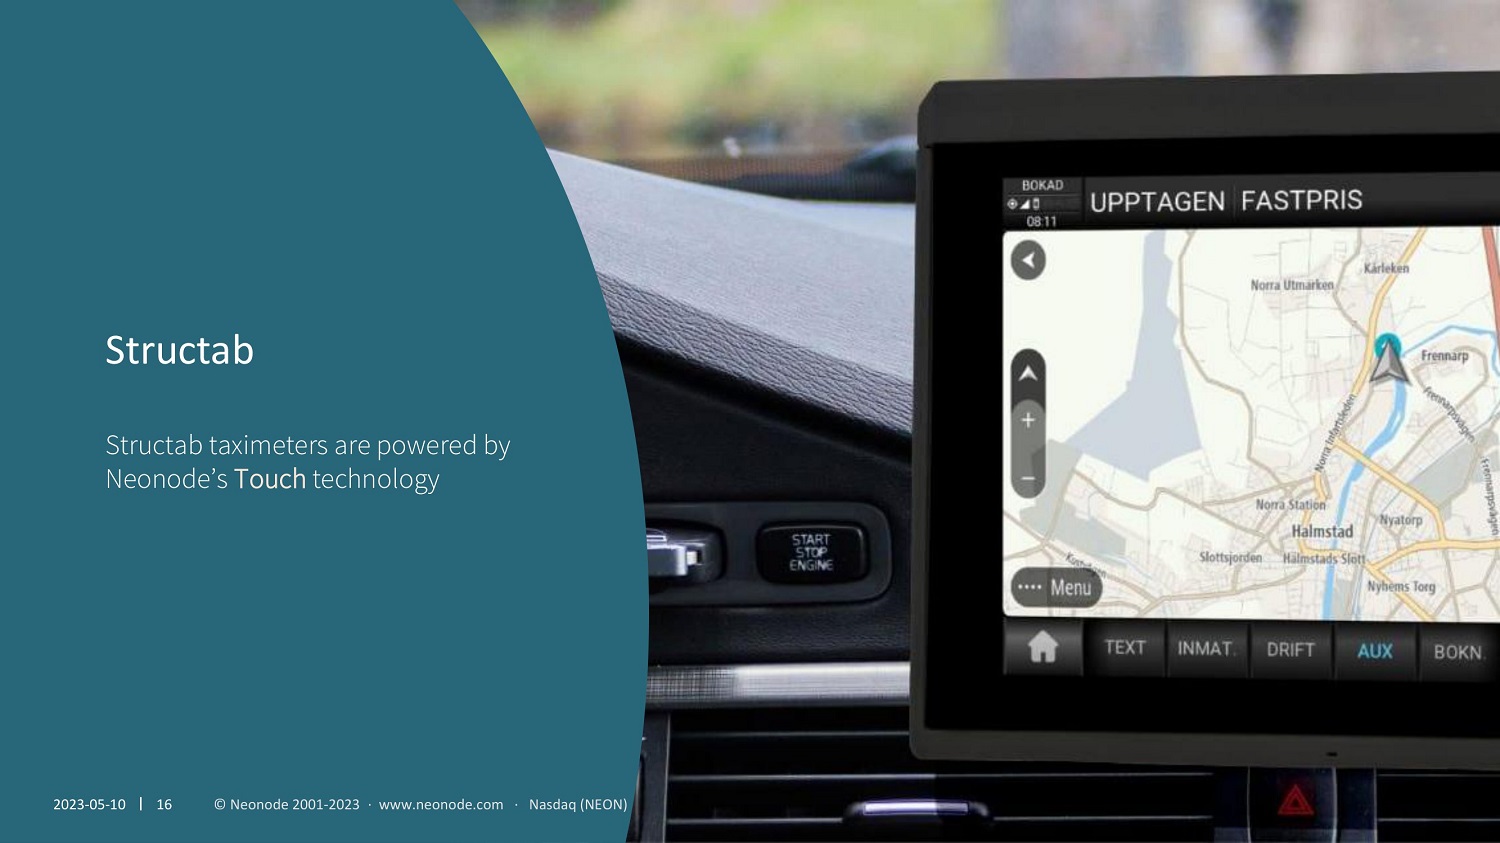
Structab 2023 - 05 - 10 16 © Neonode 2001 - 2023 · www.neonode.com · Nasdaq (NEON) Structab taximeters are powered by Neonode’s Touch technology

Claridge’s 2023 - 05 - 10 17 © Neonode 2001 - 2023 · www.neonode.com · Nasdaq (NEON) Claridge’s luxurious 5 - star hotel upgrades heritage elevator with Contactless Touch technology

Imagine… 2023 - 05 - 10 © Neonode 2001 - 2022 · www.neonode.com · Nasdaq (NEON) 18 www.youtube.com/@NeonodeInc
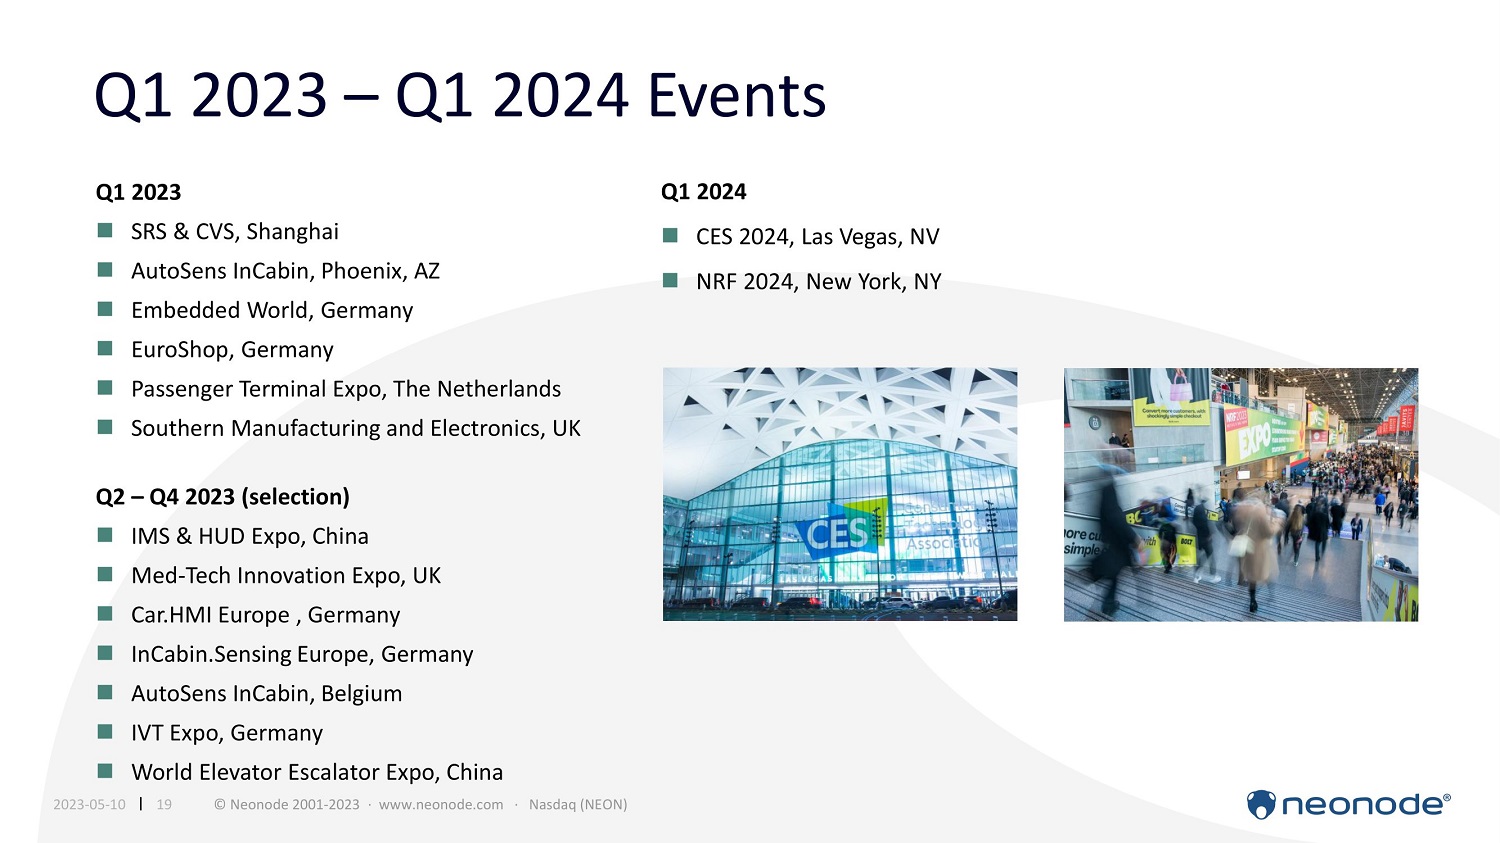
Q1 2023 – Q1 2024 Events CES 2024, Las Vegas, NV NRF 2024, New York, NY Q1 2023 Q1 2024 2023 - 05 - 10 19 © Neonode 2001 - 2023 · www.neonode.com · Nasdaq (NEON) SRS & CVS, Shanghai AutoSens InCabin, Phoenix, AZ Embedded World, Germany EuroShop, Germany Passenger Terminal Expo, The Netherlands Southern Manufacturing and Electronics, UK Q2 – Q4 2023 (selection) IMS & HUD Expo, China Med - Tech Innovation Expo, UK Car.HMI Europe , Germany InCabin.Sensing Europe, Germany AutoSens InCabin, Belgium IVT Expo, Germany World Elevator Escalator Expo, China

Agenda 2023 - 05 - 10 20 © Neonode 2001 - 2023 · www.neonode.com · Nasdaq (NEON) 1. Summary of Key Points 2. Q1 2023 Financial Results 3. Brief Business Update 4. Q&A Neonode Inc. Q1 2023 | May 11, 2023

[email protected] neonode.com Subscribe to Neonode newsletter Thank you. 2023 - 05 - 10 21 © Neonode 2001 - 2021 · www.neonode.com · Nasdaq (NEON) 2023 - 05 - 10 21 © Neonode 2001 - 2023 · www.neonode.com · Nasdaq (NEON)

Appendix 2023 - 05 - 10 22 © Neonode 2001 - 2023 · www.neonode.com · Nasdaq (NEON)
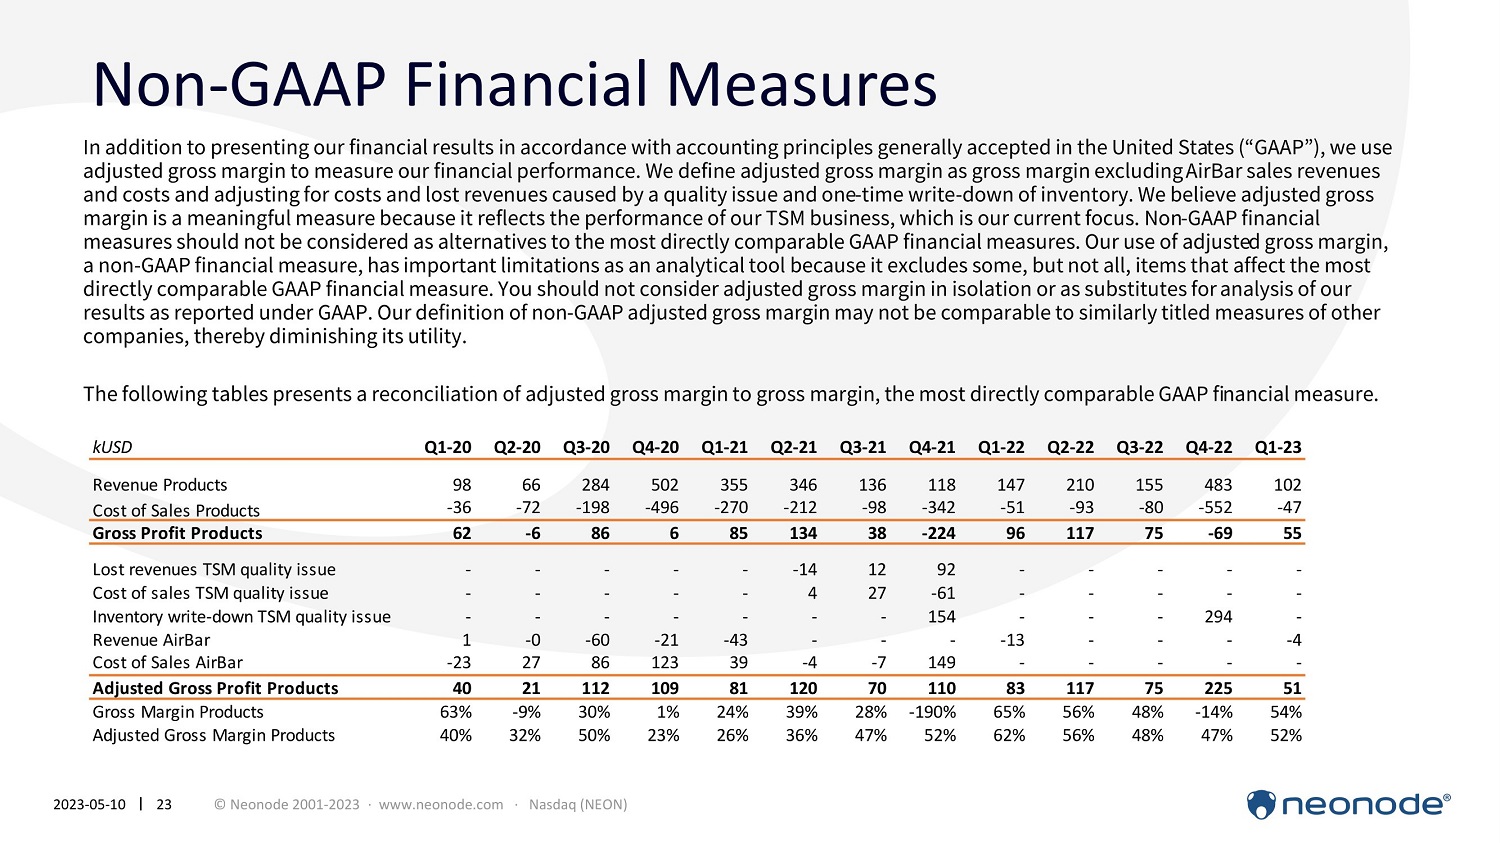
Non - GAAP Financial Measures In addition to presenting our financial results in accordance with accounting principles generally accepted in the United States (“GAAP”), we use adjusted gross margin to measure our financial performance. We define adjusted gross margin as gross margin excluding AirBar sales revenues and costs and adjusting for costs and lost revenues caused by a quality issue and one - time write - down of inventory. We believe adjusted gross margin is a meaningful measure because it reflects the performance of our TSM business, which is our current focus. Non - GAAP financial measures should not be considered as alternatives to the most directly comparable GAAP financial measures. Our use of adjusted gross margin, a non - GAAP financial measure, has important limitations as an analytical tool because it excludes some, but not all, items that affect the most directly comparable GAAP financial measure. You should not consider adjusted gross margin in isolation or as substitutes for analysis of our results as reported under GAAP. Our definition of non - GAAP adjusted gross margin may not be comparable to similarly titled measures of other companies, thereby diminishing its utility. 2023 - 05 - 10 23 © Neonode 2001 - 2023 · www.neonode.com · Nasdaq (NEON) The following tables presents a reconciliation of adjusted gross margin to gross margin, the most directly comparable GAAP financial measure. kUSD Q1 - 20 Q2 - 20 Q3 - 20 Q4 - 20 Q1 - 21 Q2 - 21 Q3 - 21 Q4 - 21 Q1 - 22 Q2 - 22 Q3 - 22 Q4 - 22 Q1 - 23 Revenue Products 98 66 284 502 355 346 136 118 147 210 155 483 102 Cost of Sales Products - 36 - 72 - 198 - 496 - 270 - 212 - 98 - 342 - 51 - 93 - 80 - 552 - 47 Gross Profit Products 62 - 6 86 6 85 134 38 - 224 96 117 75 - 69 55 Lost revenues TSM quality issue - - - - - - 14 12 92 - - - - - Cost of sales TSM quality issue - - - - - 4 27 - 61 - - - - - Inventory write - down TSM quality issue - - - - - - - 154 - - - 294 - Revenue AirBar 1 - 0 - 60 - 21 - 43 - - - - 13 - - - - 4 Cost of Sales AirBar - 23 27 86 123 39 - 4 - 7 149 - - - - - Adjusted Gross Profit Products 40 21 112 109 81 120 70 110 83 117 75 225 51 Gross Margin Products 63% - 9% 30% 1% 24% 39% 28% - 190% 65% 56% 48% - 14% 54% Adjusted Gross Margin Products 40% 32% 50% 23% 26% 36% 47% 52% 62% 56% 48% 47% 52%