UNITED STATES
SECURITIES AND EXCHANGE COMMISSION
Washington, D.C. 20549
FORM 8-K
CURRENT REPORT
Pursuant to Section 13 or 15(d)
of the Securities Exchange Act of 1934
Date of Report (Date of earliest event
reported): August 14, 2020
NEONODE INC.
(Exact name of issuer of securities held
pursuant to the plan)
Commission File Number 1-35526
| Delaware |
|
94-1517641 |
|
(State or other jurisdiction
of incorporation) |
|
(I.R.S. Employer
Identification No.) |
Storgatan 23C, 114 55 Stockholm, Sweden
(Address of Principal Executive Office,
including Zip Code)
+46 (0) 8 667 17 17
Registrant’s telephone number,
including area code:
Not Applicable
(Former name or former address, if changed
since last report)
Check the appropriate box below if the
Form 8-K filing is intended to simultaneously satisfy the filing obligation of the registrant under any of the following provisions
(see General Instruction A.2. below):
| ☐ | Written
communications pursuant to Rule 425 under the Securities Act (17 CFR 230.425) |
| ☐ | Soliciting
material pursuant to Rule 14a-12 under the Exchange Act (17 CFR 240.14a-12) |
| ☐ | Pre-commencement
communications pursuant to Rule 14d-2(b) under the Exchange Act (17 CFR 240.14d-2(b)) |
| ☐ | Pre-commencement
communications pursuant to Rule 13e-4(c) under the Exchange Act (17 CFR 240.13e-4(c)) |
Securities registered pursuant to Section 12(b) of the Act:
| Title of each class |
|
Trading Symbol(s) |
|
Name of each exchange on which registered |
| Common Stock, par value $0.001 per share |
|
NEON |
|
The Nasdaq Stock Market LLC |
Indicate by check mark whether the registrant
is an emerging growth company as defined in Rule 405 of the Securities Act of 1933 (§230.405 of this chapter) or Rule 12b-2
of the Securities Exchange Act of 1934 (§240.12b-2 of this chapter).
Emerging growth company ☐
If an emerging growth company, indicate
by check mark if the registrant has elected not to use the extended transition period for complying with any new or revised financial
accounting standards provided pursuant to Section 13(a) of the Exchange Act. ☐
TABLE OF CONTENTS
Exhibit Index

| Item 2.02. |
Results of Operations and Financial Condition |
On August 14, 2020, Neonode Inc. (the “Company”)
reported its earnings for the three and six months ended June 30, 2020 (the “Earnings Release”) and posted on the
Neonode website the Second Quarter 2020 Presentation (the “Quarterly Presentation”). A copy of the Earnings Release
and the Quarterly Presentation are attached hereto as Exhibits 99.1 and 99.2, respectively, and are incorporated herein by
reference.
The information furnished pursuant to this
Item 2.02, including Exhibits 99.1 and 99.2, shall not be deemed “filed” for purposes of Section 18
of the Securities Exchange Act of 1934, as amended (the “Exchange Act”), or otherwise subject to the liabilities under
that Section, or incorporated by reference in any filing under the Securities Act of 1933, as amended (the “Securities Act”),
or the Exchange Act, except as shall be expressly set forth by specific reference in such a filing.
| Item 7.01 | Regulation FD Disclosure |
As previously announced, the Company will
conduct a conference call today, Friday, August 14, 2020 at 10:00 a.m. ET. The presentation slides to be used during the
call, attached hereto as Exhibit 99.2, will be available on the “Investor Relations” section of the Company’s
website at www.neonode.com immediately prior to the call. The information contained in, or that can be accessed through
the Company’s website is not a part of this filing.
The information furnished pursuant to this
Item 7.01, including Exhibit 99.2, shall not be deemed “filed” for purposes of Section 18 of the Exchange
Act, or otherwise subject to the liabilities under that Section, or incorporated by reference in any filing under the Securities
Act or the Exchange Act, except as shall be expressly set forth by specific reference in such a filing.
| Item 9.01. |
Financial Statements and Exhibits. |
SIGNATURES
Pursuant to the requirements
of the Securities Exchange Act of 1934, the Registrant has duly caused this report to be signed on its behalf by the undersigned
thereunto duly authorized.
| Date: August 14, 2020 |
NEONODE INC. |
| |
|
|
| |
By: |
/s/ Maria Ek |
| |
Name: |
Maria Ek |
| |
Title: |
Chief Financial Officer |
3
Exhibit 99.1

PRESS
RELEASE
For
Release, 09:10AM EST August 14, 2020
Neonode
Reports Second Quarter Ended June 30, 2020 Financial Results
STOCKHOLM,
SWEDEN, August 14, 2020 — Neonode Inc. (NASDAQ: NEON), today reported financial results for the three and six months
ended June 30, 2020.
FINANCIAL SUMMARY SECOND QUARTER 2020
| · | Net sales totaled $0.8 million compared to $1.7 million
for the same period last year. |
| · | Net loss totaled $1.6 million compared to a net loss
of $1.3 million for the same period last year. |
| · | Loss per share totaled $0.18 compared to a loss per
share of $0.14 for the same period last year. |
| · | Net cash used in operating activities totaled $1.0 million
and $1.0 million for the three months ended June 30, 2020 and 2019, respectively. |
BUSINESS HIGHLIGHTS DURING THE QUARTER
| · | Strengthened commercial leadership through recruitment
of Mr. Jonas Waern and Mr. Johan Swartz who joined in April and May, respectively. |
| · | Advanced discussions regarding several new development
projects around zForce® touch solutions with existing and new customers,
for example in the avionics and industrial control systems segments. |
| · | Growing interest in the company’s contactless
touch solutions and increased sales of touch sensor modules and evaluation kits. |
| · | Expansion of partner network and increased focus on
marketing activities to further drive sales of touch sensor modules. |
| · | Continued development and marketing of MultiSensing®
platform for driver and cabin monitoring in automotive applications. Interest from
several OEM and Tier 1 customers; shortlisted for sourcing process for 2024+ platform
design win with a premium OEM. |
BUSINESS HIGHLIGHTS SINCE THE END OF THE QUARTER
| · | Continued trend of growing interest in the company’s
contactless touch solutions and increased sales of touch sensor modules and evaluation
kits. |
PRIVATE PLACEMENT TRANSACTION AND DEBT CONVERSION COMPLETED
| · | On August 7, 2020, the company completed a $13.9 million
private placement transaction consisting of Common and Convertible Preferred Stock receiving
cash proceeds totaling $13.1 million, net of offering expenses. Management and members
of the Board participated in the transaction investing a total of $3.1million in cash.
|
| · | In addition, as part of the financing transaction, the
company converted a $1.0 million short-term working capital loan provided by members
of the Board into shares of Convertible Preferred Stock. |
THE
CEO’S COMMENTS
“The
second quarter was impacted by softer sales in the global printer and automotive market due to COVID-19, as anticipated in earlier
announcements. We expect these markets to rebound. COVID-19 has also rapidly projected our technology into new areas of growth.
Our contactless touch sensor technology is an elegant and cost-effective solution that can protect consumers from having to physically
touch surfaces on devices in public spaces. We see COVID-19 as a paradigm shift in global consumer behavior, where people
do not want to touch buttons, keypads, and screens on public space devices,” commented Dr. Urban Forssell, CEO of Neonode.
“I am pleased that we completed a significant financing transaction
that included the participation of several investment funds along with company insiders. We anticipate the worldwide demand for
contactless touch will continue to build over the coming quarters and years from new customer applications in self-service kiosks,
vending machines, elevators, and other applications. The proceeds from the financing not
only strengthens the company’s cash position, but also provides the liquidity to accelerate growth by added critical assets
needed to meet growing customer demand,” concluded Dr. Forssell.
FINANCIAL
OVERVIEW FOR THE THREE AND SIX PERIOD ENDED JUNE 30, 2020
The
decrease of 55.7% and 44.9% in total net revenues for the three and six months ended June 30, 2020 as compared to the same periods
in 2019 is due primarily to a 54.1% and 45.9% decrease in license revenues in the same periods in 2020, respectively. The decrease
in revenues was partly the result of lower estimates for unbilled license fees. In accordance with our revenue recognition policy,
we record unbilled license fees using prior royalty revenue data. In 2020, due to the uncertainty in the global economy, we recorded
lower estimated license fees than in the same period in 2019.
Our combined total gross margin was 83.8% and 91.9% for the
three and six months ended June 30, 2020 and 95.8% and 95.4% for the three and six months ended June 2019, respectively. The
decrease in total gross margin in 2020 as compared to 2019 was primarily due to high costs relating to write off of inventory in 2020. Our operating expense decreased 19.0% and 14.5% in the three and six months ended June 30, 2020 compared
to same periods in 2019. The decreases are primarily related to lower staff expenses and scrapped inventory included in the
comparable periods in 2019.
Net
loss attributable to the three and six months ended June 30, 2020 was $1.6 million and $2.6 million, or a loss of $0.18 and $0.29
per share, respectively, compared to a net loss of $1.3 million and $1.8 million, or a loss of $0.14 and $0.21 per share, in the
comparable periods in 2019, respectively.
Cash used by operations was $1.0 million and $1.9 million for three
and six months ended June 30, 2020, respectively, compared to $1.0 million and $1.5 million in the same periods in 2019, respectively.
The
company had a total of $1.5 million of short-term debt outstanding at June 30, 2020. The debt is comprised of a $1.0 million
working capital debt facility provide by two members of the board of directors plus a $0.5 million tax credit from the
Swedish government as part of their COVID-19 related corporate support program.
Cash
and accounts receivable totaled $2.5 million on June 30, 2020 compared to $3.7 million at December 31, 2019.
CONFERENCE
CALL INFORMATION
Neonode
will host a conference call Friday August 14, 2020 at 10AM Eastern Daylight Time (EDT)/4PM Central European Time (CET) featuring
remarks by, and Q&A with, Urban Forssell, CEO, Maria Ek, CFO and David Brunton, Head of Investor Relations.
The
dial-in number for the conference call is toll-free: (877) 539-0733 (U.S. domestic) or +1 (678) 607-2005 (international). To access
the call all participants must use the following Conference ID: #4797078. Please make sure to call at least five minutes before
the scheduled start time.
To register for the call, and listen online, please click:
https://event.on24.com/wcc/r/2528673/45B47C275D341DDD7BF33343B1599C5D
For
interested individuals unable to join the live event, a digital recording for replay will be available for 30 days after the call’s
completion – 8/14/2020 (13:00PM EDT) to 9/14/2020 (23:59PM EDT). To access the recording, please use one of these Dial-In
Numbers (800) 859-2056 or (404) 537-3406, and the Conference ID #4797078.
Neonode will post a link to the presentation
from the conference call in the Investor Relations section of the Neonode website www.neonode.com after the call.
For
more information, please contact:
Investor
Relations
David
Brunton
E-mail:
[email protected]
Chief
Financial Officer
Maria
Ek
E-mail:
[email protected]
ABOUT
NEONODE
Neonode Inc. (NASDAQ:NEON) is a publicly traded company, headquartered in Stockholm, Sweden and established in 2001. The company
provides advanced optical sensing solutions for touch, gesture control, and remote sensing. Building on experience acquired during
years of advanced optical R&D and technology licensing, Neonode’s technology is currently deployed in more than
75 million products and the company holds more than 120 patents worldwide. Neonode’s customer base includes some of the
world’s best-known Fortune 500 companies in the consumer electronics, office equipment, medical, avionics, and automotive
industries.
Neonode
operates in three business areas: HMI Solutions, HMI Products and Remote Sensing Solutions. In HMI Solutions, Neonode offers customized
optical touch and gesture control solutions for many different markets and segments. In HMI Products, the company provides innovative,
plug-and-play sensor modules that enable touch on any surface, in-air touch, and gesture control for a wide range of applications.
In Remote Sensing Solutions, Neonode offers robust and cost-effective driver and cabin monitoring solutions for vehicles based
on the company’s flexible, scalable and hardware-agnostic software platform.
NEONODE
and the NEONODE logo are trademarks of Neonode, Inc. registered in the United States and other countries.
For
further information please visit www.neonode.com
Follow
us at:
LinkedIn
Cision
Subscribe to our news here
Safe
Harbor Statement
This press release contains forward-looking statements within the meaning of the Private Securities Litigation Reform Act of
1995. These include, but are not limited to, statements relating to expectations, future performance or future events, the impact
of COVID-19, the increase in our customer base, their projects and sales, our ability to generate growth and become profitable,
and the listing of our shares on Nasdaq Stockholm. These statements are based on current assumptions, expectations and information
available to Neonode management and involve a number of known and unknown risks, uncertainties and other factors that may cause
Neonode’s actual results, levels of activity, performance or achievements to be materially different from any expressed or implied
by these forward-looking statements.
These
risks, uncertainties, and factors are discussed under “Risk Factors” and elsewhere in Neonode’s public filings with
the SEC from time to time, including Neonode’s annual report on Form 10-K, quarterly reports on Form 10-Q, and current reports
on Form 8-K. You are advised to carefully consider these various risks, uncertainties and other factors. Although Neonode management
believes that the forward-looking statements contained in this press release are reasonable, it can give no assurance that its
expectations will be fulfilled. Forward-looking statements are made as of today’s date, and Neonode undertakes no duty to update
or revise them.
NEONODE
INC.
CONDENSED
CONSOLIDATED BALANCE SHEETS
(In
thousands, except share and per share amounts)
| | |
June 30, | | |
December 31, | |
| | |
2020 | | |
2019 | |
| ASSETS | |
(Unaudited) | | |
(Audited) | |
| Current assets: | |
| | |
| |
| Cash | |
$ | 1,773 | | |
$ | 2,357 | |
| Accounts receivable and unbilled revenue, net | |
| 738 | | |
| 1,324 | |
| Projects in process | |
| - | | |
| 8 | |
| Inventory | |
| 1,077 | | |
| 1,030 | |
| Prepaid expenses and other current assets | |
| 562 | | |
| 715 | |
| Total current assets | |
| 4,150 | | |
| 5,434 | |
| | |
| | | |
| | |
| Investment in joint venture | |
| 3 | | |
| 3 | |
| Property and equipment, net | |
| 1,208 | | |
| 1,583 | |
| Operating lease right-of-use assets | |
| 227 | | |
| 416 | |
| Total assets | |
$ | 5,588 | | |
$ | 7,436 | |
| | |
| | | |
| | |
| LIABILITIES AND STOCKHOLDERS’ EQUITY | |
| | | |
| | |
| Current liabilities: | |
| | | |
| | |
| Accounts payable | |
$ | 476 | | |
$ | 555 | |
| Accrued payroll and employee benefits | |
| 1,104 | | |
| 960 | |
| Accrued expenses | |
| 320 | | |
| 541 | |
| Deferred revenues | |
| 101 | | |
| 67 | |
| Short-term borrowing | |
| 967 | | |
| - | |
| Short-term tax credits | |
| 563 | | |
| - | |
| Current portion of finance lease obligations | |
| 517 | | |
| 568 | |
| Current portion of operating lease obligations | |
| 181 | | |
| 332 | |
| Total current liabilities | |
| 4,229 | | |
| 3,023 | |
| | |
| | | |
| | |
| Finance lease obligations, net of current portion | |
| 393 | | |
| 508 | |
| Operating lease obligations, net of current portion | |
| 20 | | |
| 58 | |
| Total liabilities | |
| 4,642 | | |
| 3,589 | |
| | |
| | | |
| | |
| Commitments and contingencies | |
| | | |
| | |
| | |
| | | |
| | |
| Stockholders’ equity: | |
| | | |
| | |
| Common stock, 15,000,000 shares authorized, with par value of $0.001; 9,171,154 shares issued and outstanding at June 30, 2020 and December 31, 2019 | |
| 9 | | |
| 9 | |
| Additional paid-in capital | |
| 197,543 | | |
| 197,543 | |
| Accumulated other comprehensive loss | |
| (662 | ) | |
| (639 | ) |
| Accumulated deficit | |
| (193,142 | ) | |
| (190,520 | ) |
| Total Neonode Inc. stockholders’ equity | |
| 3,748 | | |
| 6,393 | |
| Noncontrolling interests | |
| (2,802 | ) | |
| (2,546 | ) |
| Total stockholders’ equity | |
| 946 | | |
| 3,847 | |
| Total liabilities and stockholders’ equity | |
$ | 5,588 | | |
$ | 7,436 | |
NEONODE
INC.
CONDENSED
CONSOLIDATED STATEMENTS OF OPERATIONS
(In
thousands, except per share amounts)
(Unaudited)
| | |
Three months ended
June 30, | | |
Six months ended
June 30, | |
| | |
2020 | | |
2019 | | |
2020 | | |
2019 | |
| Revenues: | |
| | |
| | |
| | |
| |
| HMI Solutions | |
$ | 678 | | |
$ | 1,469 | | |
$ | 1,860 | | |
$ | 3,411 | |
| HMI Products | |
| 80 | | |
| 241 | | |
| 192 | | |
| 311 | |
| Total revenues | |
| 758 | | |
| 1,710 | | |
| 2,052 | | |
| 3,722 | |
| Cost of revenues: | |
| | | |
| | | |
| | | |
| | |
| HMI Solutions | |
| - | | |
| - | | |
| 1 | | |
| 5 | |
| HMI Products | |
| 123 | | |
| 71 | | |
| 166 | | |
| 167 | |
| Total cost of revenues | |
| 123 | | |
| 71 | | |
| 167 | | |
| 172 | |
| | |
| | | |
| | | |
| | | |
| | |
| Total gross margin | |
| 635 | | |
| 1,639 | | |
| 1,885 | | |
| 3,550 | |
| | |
| | | |
| | | |
| | | |
| | |
| Operating expenses: | |
| | | |
| | | |
| | | |
| | |
| Research and development | |
| 1,043 | | |
| 1,452 | | |
| 2,038 | | |
| 2,711 | |
| Sales and marketing | |
| 648 | | |
| 491 | | |
| 1,193 | | |
| 940 | |
| General and administrative | |
| 700 | | |
| 1,010 | | |
| 1,499 | | |
| 1,881 | |
| | |
| | | |
| | | |
| | | |
| | |
| Total operating expenses | |
| 2,391 | | |
| 2,953 | | |
| 4,730 | | |
| 5,532 | |
| Operating loss | |
| (1,756 | ) | |
| (1,314 | ) | |
| (2,845 | ) | |
| (1,982 | ) |
| | |
| | | |
| | | |
| | | |
| | |
| Other expense: | |
| | | |
| | | |
| | | |
| | |
| Interest expense | |
| 7 | | |
| 9 | | |
| 14 | | |
| 19 | |
| Total other expense | |
| 7 | | |
| 9 | | |
| 14 | | |
| 19 | |
| | |
| | | |
| | | |
| | | |
| | |
| Loss before provision for income taxes | |
| (1,763 | ) | |
| (1,323 | ) | |
| (2,859 | ) | |
| (2,001 | ) |
| | |
| | | |
| | | |
| | | |
| | |
| Provision for income taxes | |
| 3 | | |
| 7 | | |
| 19 | | |
| 13 | |
| Net loss including noncontrolling interests | |
| (1,766 | ) | |
| (1,330 | ) | |
| (2,878 | ) | |
| (2,014 | ) |
| Less: Net loss attributable to noncontrolling interests | |
| 154 | | |
| 66 | | |
| 256 | | |
| 177 | |
| Net loss attributable to Neonode Inc. | |
$ | (1,612 | ) | |
$ | (1,264 | ) | |
$ | (2,622 | ) | |
$ | (1,837 | ) |
| | |
| | | |
| | | |
| | | |
| | |
| Loss per common share: | |
| | | |
| | | |
| | | |
| | |
| Basic and diluted loss per share | |
$ | (0.18 | ) | |
$ | (0.14 | ) | |
$ | (0.29 | ) | |
$ | (0.21 | ) |
| Basic and diluted – weighted average number of common shares outstanding | |
| 9,171 | | |
| 8,801 | | |
| 9,171 | | |
| 8,800 | |
NEONODE
INC.
CONDENSED
CONSOLIDATED STATEMENTS OF COMPREHENSIVE LOSS
(In
thousands)
(Unaudited)
| | |
Three months ended
June 30, | | |
Six months ended
June 30, | |
| | |
2020 | | |
2019 | | |
2020 | | |
2019 | |
| | |
| | |
| | |
| | |
| |
| Net loss | |
$ | (1,766 | ) | |
$ | (1,330 | ) | |
$ | (2,878 | ) | |
$ | (2,014 | ) |
| Other comprehensive income (loss): | |
| | | |
| | | |
| | | |
| | |
| Foreign currency translation adjustments | |
| 64 | | |
| 26 | | |
| (23 | ) | |
| (155 | ) |
| Comprehensive loss | |
| (1,702 | ) | |
| (1,304 | ) | |
| (2,901 | ) | |
| (2,169 | ) |
| Less: Comprehensive loss attributable to noncontrolling interests | |
| 154 | | |
| 66 | | |
| 256 | | |
| 177 | |
| Comprehensive loss attributable to Neonode Inc. | |
$ | (1,548 | ) | |
$ | (1,238 | ) | |
$ | (2,645 | ) | |
$ | (1,992 | ) |
NEONODE
INC.
CONDENSED
CONSOLIDATED STATEMENTS OF STOCKHOLDERS’ EQUITY
(In
thousands, except for Series B Preferred Stock Shares Issued)
(Unaudited)
For
the Quarter to Date periods ended June 30, 2019 through June 30, 2020
| | |
Series
B Preferred Stock Shares Issued | | |
Series
B Preferred Stock Amount | | |
Common
Stock Shares Issued | | |
Common
Stock Amount | | |
Additional
Paid-in Capital | | |
Accumulated
Other Comprehensive Income
(Loss) | | |
Accumulated
Deficit | | |
Total
Neonode Inc. Stockholders’ Equity | | |
Noncontrolling
Interests | | |
Total
Stockholders’ Equity | |
| | |
| | |
| | |
| | |
| | |
| | |
| | |
| | |
| | |
| | |
| |
| Balances,
March 31, 2019 | |
| 82 | | |
$ | - | | |
| 8,800 | | |
$ | 9 | | |
$ | 197,507 | | |
$ | (637 | ) | |
$ | (185,795 | ) | |
$ | 11,084 | | |
$ | (2,153 | ) | |
$ | 8,931 | |
| | |
| | | |
| | | |
| | | |
| | | |
| | | |
| | | |
| | | |
| | | |
| | | |
| | |
| Conversion
of series B Preferred Stock to Common Stock | |
| (2 | ) | |
| - | | |
| 1 | | |
| - | | |
| - | | |
| - | | |
| - | | |
| - | | |
| - | | |
| - | |
| | |
| | | |
| | | |
| | | |
| | | |
| | | |
| | | |
| | | |
| | | |
| | | |
| | |
| Foreign
currency translation adjustment | |
| - | | |
| - | | |
| - | | |
| - | | |
| - | | |
| 26 | | |
| - | | |
| 26 | | |
| - | | |
| 26 | |
| | |
| | | |
| | | |
| | | |
| | | |
| | | |
| | | |
| | | |
| | | |
| | | |
| | |
| Net
loss | |
| - | | |
| - | | |
| - | | |
| - | | |
| - | | |
| - | | |
| (1,264 | ) | |
| (1,264 | ) | |
| (66 | ) | |
| (1,330 | ) |
| | |
| | | |
| | | |
| | | |
| | | |
| | | |
| | | |
| | | |
| | | |
| | | |
| | |
| Balances,
June 30, 2019 | |
| 80 | | |
$ | - | | |
| 8,801 | | |
$ | 9 | | |
$ | 197,507 | | |
$ | (611 | ) | |
$ | (187,059 | ) | |
$ | 9,846 | | |
$ | (2,219 | ) | |
$ | 7,627 | |
| | |
| | | |
| | | |
| | | |
| | | |
| | | |
| | | |
| | | |
| | | |
| | | |
| | |
| Conversion
of series B Preferred Stock to Common Stock | |
| (80 | ) | |
| - | | |
| 10 | | |
| - | | |
| - | | |
| - | | |
| - | | |
| - | | |
| - | | |
| - | |
| | |
| | | |
| | | |
| | | |
| | | |
| | | |
| | | |
| | | |
| | | |
| | | |
| | |
| Foreign
currency translation adjustment | |
| - | | |
| - | | |
| - | | |
| - | | |
| - | | |
| (145 | ) | |
| - | | |
| (145 | ) | |
| - | | |
| (145 | ) |
| | |
| | | |
| | | |
| | | |
| | | |
| | | |
| | | |
| | | |
| | | |
| | | |
| | |
| Net
loss | |
| - | | |
| - | | |
| - | | |
| - | | |
| - | | |
| - | | |
| (1,086 | ) | |
| (1,086 | ) | |
| (113 | ) | |
| (1,199 | ) |
| | |
| | | |
| | | |
| | | |
| | | |
| | | |
| | | |
| | | |
| | | |
| | | |
| | |
| Balances,
September 30, 2019 | |
| - | | |
$ | - | | |
| 8,811 | | |
$ | 9 | | |
$ | 197,507 | | |
$ | (756 | ) | |
$ | (188,145 | ) | |
$ | 8,615 | | |
$ | (2,332 | ) | |
$ | 6,283 | |
| | |
| | | |
| | | |
| | | |
| | | |
| | | |
| | | |
| | | |
| | | |
| | | |
| | |
| Common
stock issued upon exercise of common stock warrants | |
| - | | |
| - | | |
| 360 | | |
| - | | |
| 36 | | |
| - | | |
| - | | |
| 36 | | |
| - | | |
| 36 | |
| | |
| | | |
| | | |
| | | |
| | | |
| | | |
| | | |
| | | |
| | | |
| | | |
| | |
| Foreign
currency translation adjustment | |
| - | | |
| - | | |
| - | | |
| - | | |
| - | | |
| 117 | | |
| - | | |
| 117 | | |
| - | | |
| 117 | |
| | |
| | | |
| | | |
| | | |
| | | |
| | | |
| | | |
| | | |
| | | |
| | | |
| | |
| Net
loss | |
| - | | |
| - | | |
| - | | |
| - | | |
| - | | |
| - | | |
| (2,375 | ) | |
| (2,375 | ) | |
| (214 | ) | |
| (2,589 | ) |
| | |
| | | |
| | | |
| | | |
| | | |
| | | |
| | | |
| | | |
| | | |
| | | |
| | |
| Balances,
December 31, 2019 | |
| - | | |
$ | - | | |
| 9,171 | | |
$ | 9 | | |
$ | 197,543 | | |
$ | (639 | ) | |
$ | (190,520 | ) | |
$ | 6,393 | | |
$ | (2,546 | ) | |
$ | 3,847 | |
| | |
| | | |
| | | |
| | | |
| | | |
| | | |
| | | |
| | | |
| | | |
| | | |
| | |
| Foreign
currency translation adjustment | |
| - | | |
| - | | |
| - | | |
| - | | |
| - | | |
| (87 | ) | |
| - | | |
| (87 | ) | |
| - | | |
| (87 | ) |
| | |
| | | |
| | | |
| | | |
| | | |
| | | |
| | | |
| | | |
| | | |
| | | |
| | |
| Net
loss | |
| - | | |
| - | | |
| - | | |
| - | | |
| - | | |
| - | | |
| (1,010 | ) | |
| (1,010 | ) | |
| (102 | ) | |
| (1,112 | ) |
| | |
| | | |
| | | |
| | | |
| | | |
| | | |
| | | |
| | | |
| | | |
| | | |
| | |
| Balances,
March 31, 2020 | |
| - | | |
$ | - | | |
| 9,171 | | |
$ | 9 | | |
$ | 197,543 | | |
$ | (726 | ) | |
$ | (191,530 | ) | |
$ | 5,296 | | |
$ | (2,648 | ) | |
$ | 2,648 | |
| | |
| | | |
| | | |
| | | |
| | | |
| | | |
| | | |
| | | |
| | | |
| | | |
| | |
| Foreign
currency translation adjustment | |
| - | | |
| - | | |
| - | | |
| - | | |
| - | | |
| 64 | | |
| - | | |
| 64 | | |
| - | | |
| 64 | |
| | |
| | | |
| | | |
| | | |
| | | |
| | | |
| | | |
| | | |
| | | |
| | | |
| | |
| Net
loss | |
| - | | |
| - | | |
| - | | |
| - | | |
| - | | |
| - | | |
| (1,612 | ) | |
| (1,612 | ) | |
| (154 | ) | |
| (1,766 | ) |
| | |
| | | |
| | | |
| | | |
| | | |
| | | |
| | | |
| | | |
| | | |
| | | |
| | |
| Balances,
June 30, 2020 | |
| - | | |
$ | - | | |
| 9,171 | | |
$ | 9 | | |
$ | 197,543 | | |
$ | (662 | ) | |
$ | (193,142 | ) | |
$ | 3,748 | | |
$ | (2,802 | ) | |
$ | 946 | |
NEONODE
INC.
CONDENSED
CONSOLIDATED STATEMENTS OF CASH FLOWS
(In
thousands)
(Unaudited)
| | |
Six months ended
June 30, | |
| | |
2020 | | |
2019 | |
| Cash flows from operating activities: | |
| | |
| |
| Net loss (including noncontrolling interests) | |
$ | (2,878 | ) | |
$ | (2,014 | ) |
| Adjustments to reconcile net loss to net cash used in operating activities: | |
| | | |
| | |
| Bad debt expense | |
| - | | |
| 19 | |
| Depreciation and amortization | |
| 373 | | |
| 439 | |
| Amortization of operating lease right-of-use assets | |
| 183 | | |
| 189 | |
| Changes in operating assets and liabilities: | |
| | | |
| | |
| Accounts receivable and unbilled revenue, net | |
| 588 | | |
| 24 | |
| Projects in process | |
| 7 | | |
| (8 | ) |
| Inventory | |
| (42 | ) | |
| (5 | ) |
| Prepaid expenses and other current assets | |
| 155 | | |
| 118 | |
| Accounts payable and accrued expenses | |
| (169 | ) | |
| 1 | |
| Deferred revenues | |
| 33 | | |
| (14 | ) |
| Operating lease obligations | |
| (178 | ) | |
| (224 | ) |
| Net cash used in operating activities | |
| (1,928 | ) | |
| (1,475 | ) |
| | |
| | | |
| | |
| Cash flows from investing activities: | |
| | | |
| | |
| Purchase of property and equipment | |
| (7 | ) | |
| (77 | ) |
| Net cash used in investing activities | |
| (7 | ) | |
| (77 | ) |
| | |
| | | |
| | |
| Cash flows from financing activities: | |
| | | |
| | |
| Proceeds from short-term borrowings | |
| 966 | | |
| - | |
| Proceeds from short-term tax credits | |
| 542 | | |
| - | |
| Principal payments on finance lease obligations | |
| (164 | ) | |
| (272 | ) |
| Net cash provided by (used in) financing activities | |
| 1,344 | | |
| (272 | ) |
| | |
| | | |
| | |
| Effect of exchange rate changes on cash | |
| 7 | | |
| (93 | ) |
| | |
| | | |
| | |
| Net decrease in cash | |
| (584 | ) | |
| (1.917 | ) |
| Cash at beginning of period | |
| 2,357 | | |
| 6,555 | |
| Cash at end of period | |
$ | 1,773 | | |
$ | 4,638 | |
| | |
| | | |
| | |
| Supplemental disclosure of cash flow information: | |
| | | |
| | |
| Cash paid for income taxes | |
$ | 19 | | |
$ | 13 | |
| Cash paid for interest | |
$ | 13 | | |
$ | 19 | |
8
Exhibit 99.2
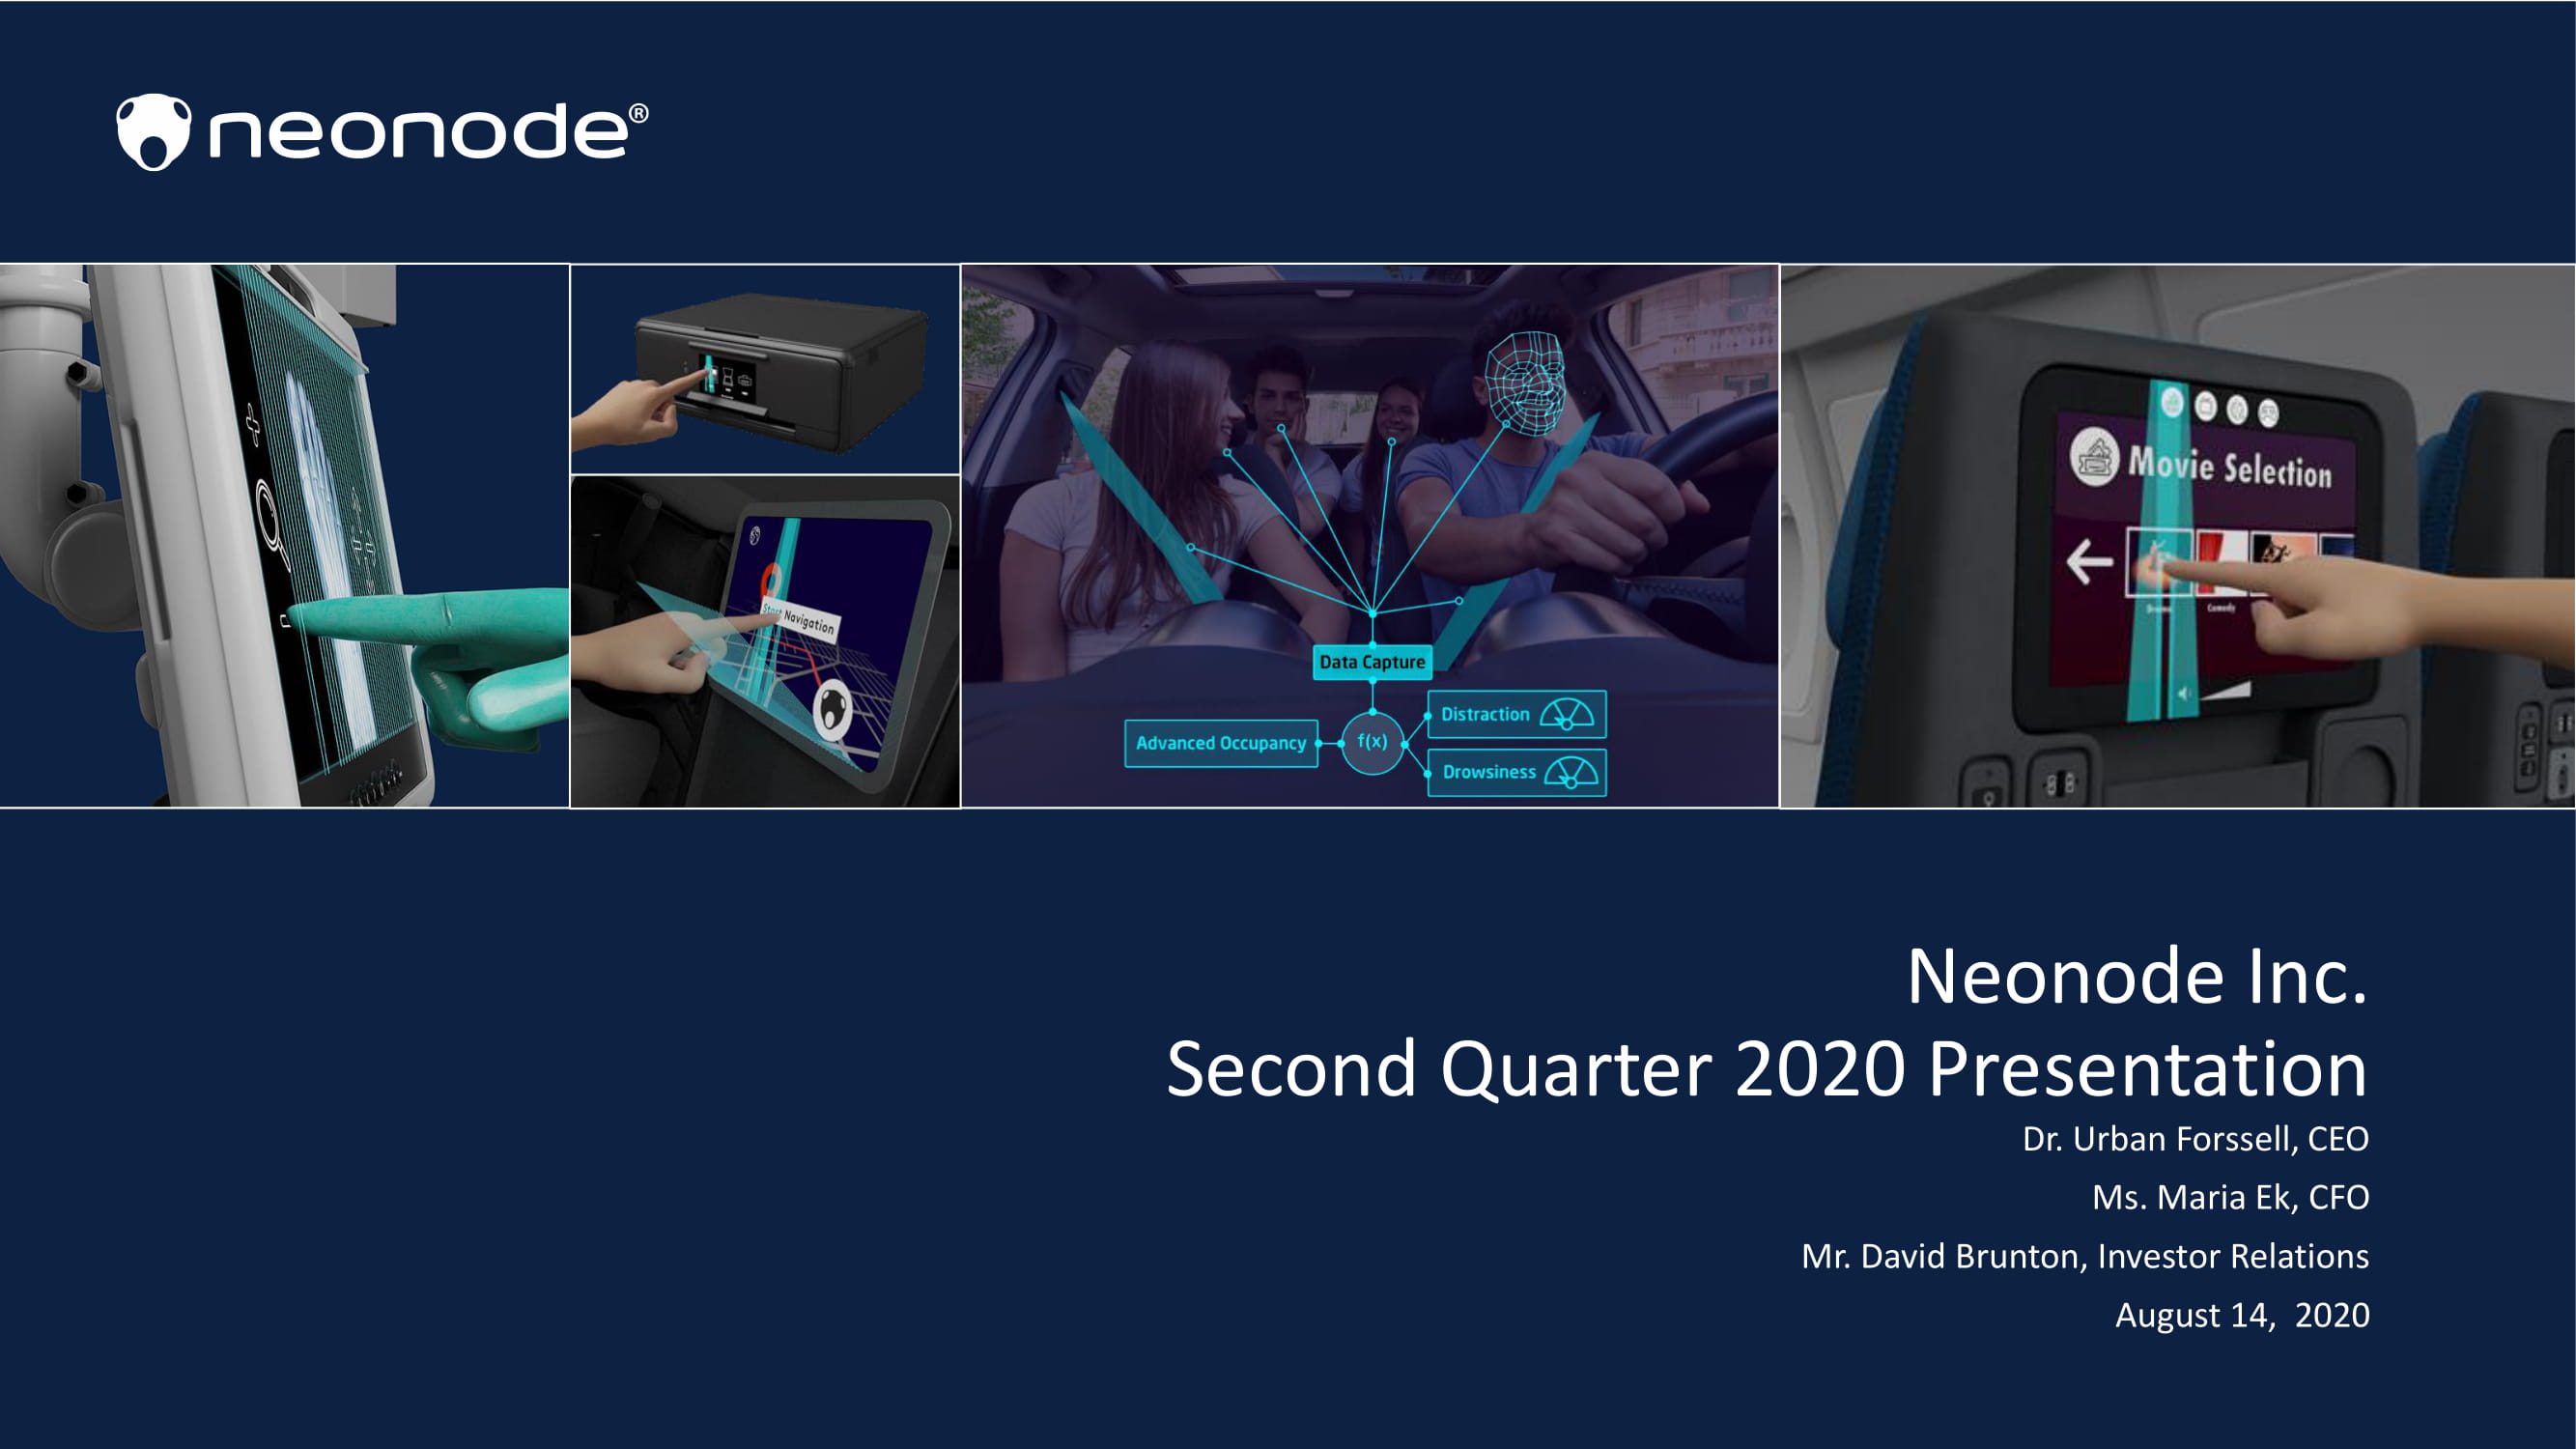
Neonode Inc. Second Quarter 2020 Presentation Ms. Maria Ek, CFO Mr. David Brunton, Investor Relations August 14, 2020 Dr. Urban Forssell, CEO

2 Disclaimer This presentation contains, and related oral and written statements of Neonode Inc. (“Neonode” or the “Company”) and its management may contain, forward-looking statements within the meaning of the Private Securities Litigation Reform Act of 1995 . Forward - looking statements include information about current expectations, potential financial performance or future events. The se also may include statements about market and sales growth, financial results, use of free cash flow, product development and introduction, regulatory matters and sales efforts. They are based on assumptions, expectations and information available to the Company and its management and involve a number of known and unknown risks, uncertainties and other factors that may cause th e Company’s actual results, levels of activity, performance or achievements to be materially different from any expressed or im pli ed by these forward-looking statements. These uncertainties and risks include, but are not limited to, those outlined in filings of th e Company with the U.S. Securities and Exchange Commission (the “SEC”) under the Securities Exchange Act of 1934, as amended, including sections entitled “Risk Factors” and “Management’s Discussion and Analysis of Financial Condition and Results of Operations.” You are advised to carefully consider these various risks, uncertainties and other factors. Forward-looking stat eme nts are made as of today’s date. The Company and its management undertake no duty to update or revise forward - looking statements. This presentation has been prepared by the Company based on its own information, as well as information from public sources. Certain of the information contained herein may be derived from information provided by industry sources. The Company believe s such information is accurate and that the sources from which it has been obtained are reliable. However, the Company has not independently verified such information and cannot guarantee the accuracy of such information.
3 Business and Strategy Update

4 Listed on Neonode Legacy 2001 2004 2010 2012 2014 2015 2016 2 017 2018 2019 2020 The World’s First Gesture Based Mobile Phone Volvo XC90 S hips with Neonode HMI Launch of B2C Touchscreen Sensor AirBar 75 Million Systems Sold First B2B OEM Customer for Technology Licensing, Sony 25 Million Systems Sold Launch of B2B Touch Sensors Worldwide Sales and Distribution Founded

5 Contactless Touch – The New Normal Post COVID - 19 TRANSITIONING TO NEONODE 3.0

6 Neonode Today • Proven contactless touch technology deployed in more than 75 million products • Extensive technical expertise and knowhow • Technology protected by more than 120 patents and patents pending worldwide • Scalable product and technology platforms that are easy to integrate and allows for short time - to - market • Well - established worldwide ecosystem of distributors , value added partners and sales reps Neonode is well - positioned to provide contactless touch solutions in a post - COVID world

7 Neonode’s Optical zForce ® Technology Neonode’s patented , IR - based zForce ® technology supports: • Contactless Touch Applications • Together with displays • On other surfaces • In air with holographic displays • Gesture Sensing Applications • Gesture control • Proximity detection

8 Neonode zForce ® Unique Selling Points • Safer – no requirements to physically touch the display or touch surface • Robust operation – ideal for demanding environments and use cases • Flexible – supports a wide range of applications • High performance – low latency and high scanning speed • Optimal image quality – no overlay required • Easy to integrate – sold as standard touch sensor modules or engineering solutions

9 Application Examples Interaction without physical contact. Add touch functionality to holographic displays. Contactless, In - Air Touch • Allows for advanced multi - finger touch interactions. • Works with gloved hands (independent of thickness). • Support touch interaction with stylus pens and other objects. Interactive Holographic Displays • Safer contactless interaction . • Less wear and tear by avoiding direct contact with the display. • Ideal for elevators and self - service ordering terminals in restaurants etc. Mechanical Controls Replacement • Replace physical buttons and switches. • Develop new, creative features. Selective Touch Area(s) • Can be integrated in an early design phase or as a retrofit. • No need for overlays that compromises image quality. • Cost - competitive solution for manufacturers of devices with large screens. Replace mechanical controls and touch - enable any surface of a control panel. Touch enable certain area(s) on a screen.

10 Neonode Business Legacy Neonode Business • Legacy licensing business does $5 - 7 million revenue a year • Applications include printers, eReaders , and vehicle infotainment systems through B2B licensing agreements • Customers include Hewlett Packard, Canon, and Epson among others Neonode Growth and Expansion Opportunities • Contactless touch in high demand worldwide – capitalizing on post - COVID environment • Flexibility and application of the technology provide endless verticals to operate • New equipment and retrofit opportunities New Applications Market Snapshot Retail Self Checkout Kiosks Potential top 5 kiosk manufacturer customer with pilot program underway with major retailers in US, AUS, CO, and SGP Airport Self Check In Kiosks Growing use of self check in kiosks – 86% of airports are investing in more self check in kiosks ATMs Increasing user base – over 3 million ATMs in the world, over 10 billion transactions a year Elevators Large and growing market – 19M elevators worldwide, 1.3M new elevators installed annually

11 Pipeline Opportunities – Self Checkout Kiosks • Potential Customer – Top 5 kiosk manufacturer in the world • Application – Touchless display intended for self - checkout kiosks • Background – Customer reached out post COVID and quickly initiated a 6 - 8 week pilot trial • Current Status – Pilot program underway with 6 major retailers in US, AUS, CO, and SGP • Potential Initial Order – 50,000 to 200,000 units • Potential Sales Price – $30 - 50 per unit ; gross margin: 30 - 40% • Distribution – Direct to OEM Market Segment Highlights • There are over 325,000 self checkout kiosks worldwide, expected to grow to more than 675,000 by 2024 1 • $14.8 billion global kiosk market in 2018 expected to grow to $32.5 billion in 2027 2 • Self checkout kiosks alone are growing at a 10.9% CAGR in the Americas to a $7.1 billion market by 2024 3 Sources: 1) RBR Research 2) Allied Market Research 3) P&S Intelligence

12 Pipeline Opportunities – Touchless ATMs Self Checkout Kiosk Success Enables ATM Penetration • Neonode’s self checkout kiosk partner in its pilot program is also a leading ATM manufacturer • A succesfull self checkout kiosk pilot is an entry point into the ATM installed base • Main drivers: • Demand for contactless touch post COVID • Cost savings by replacing physical keypad by touch solution • More standardized HW design and fewer components ; fewer SKUs • More robust and durable solution; lower maintenance costs Market Segment Highlights • There are over 3 million ATMs in the world 1 and over 470,000 ATMs only in the US 2 • Average ATM gets used 300 times/month with over 10 billion transactions performed on ATMs each year 2 • The ATM market is valued at over $20 billion today and expected to reach $30 billion by 2027 3 Sources: 1) The World Bank 2) National Cash Systems 3) Allied Market Research
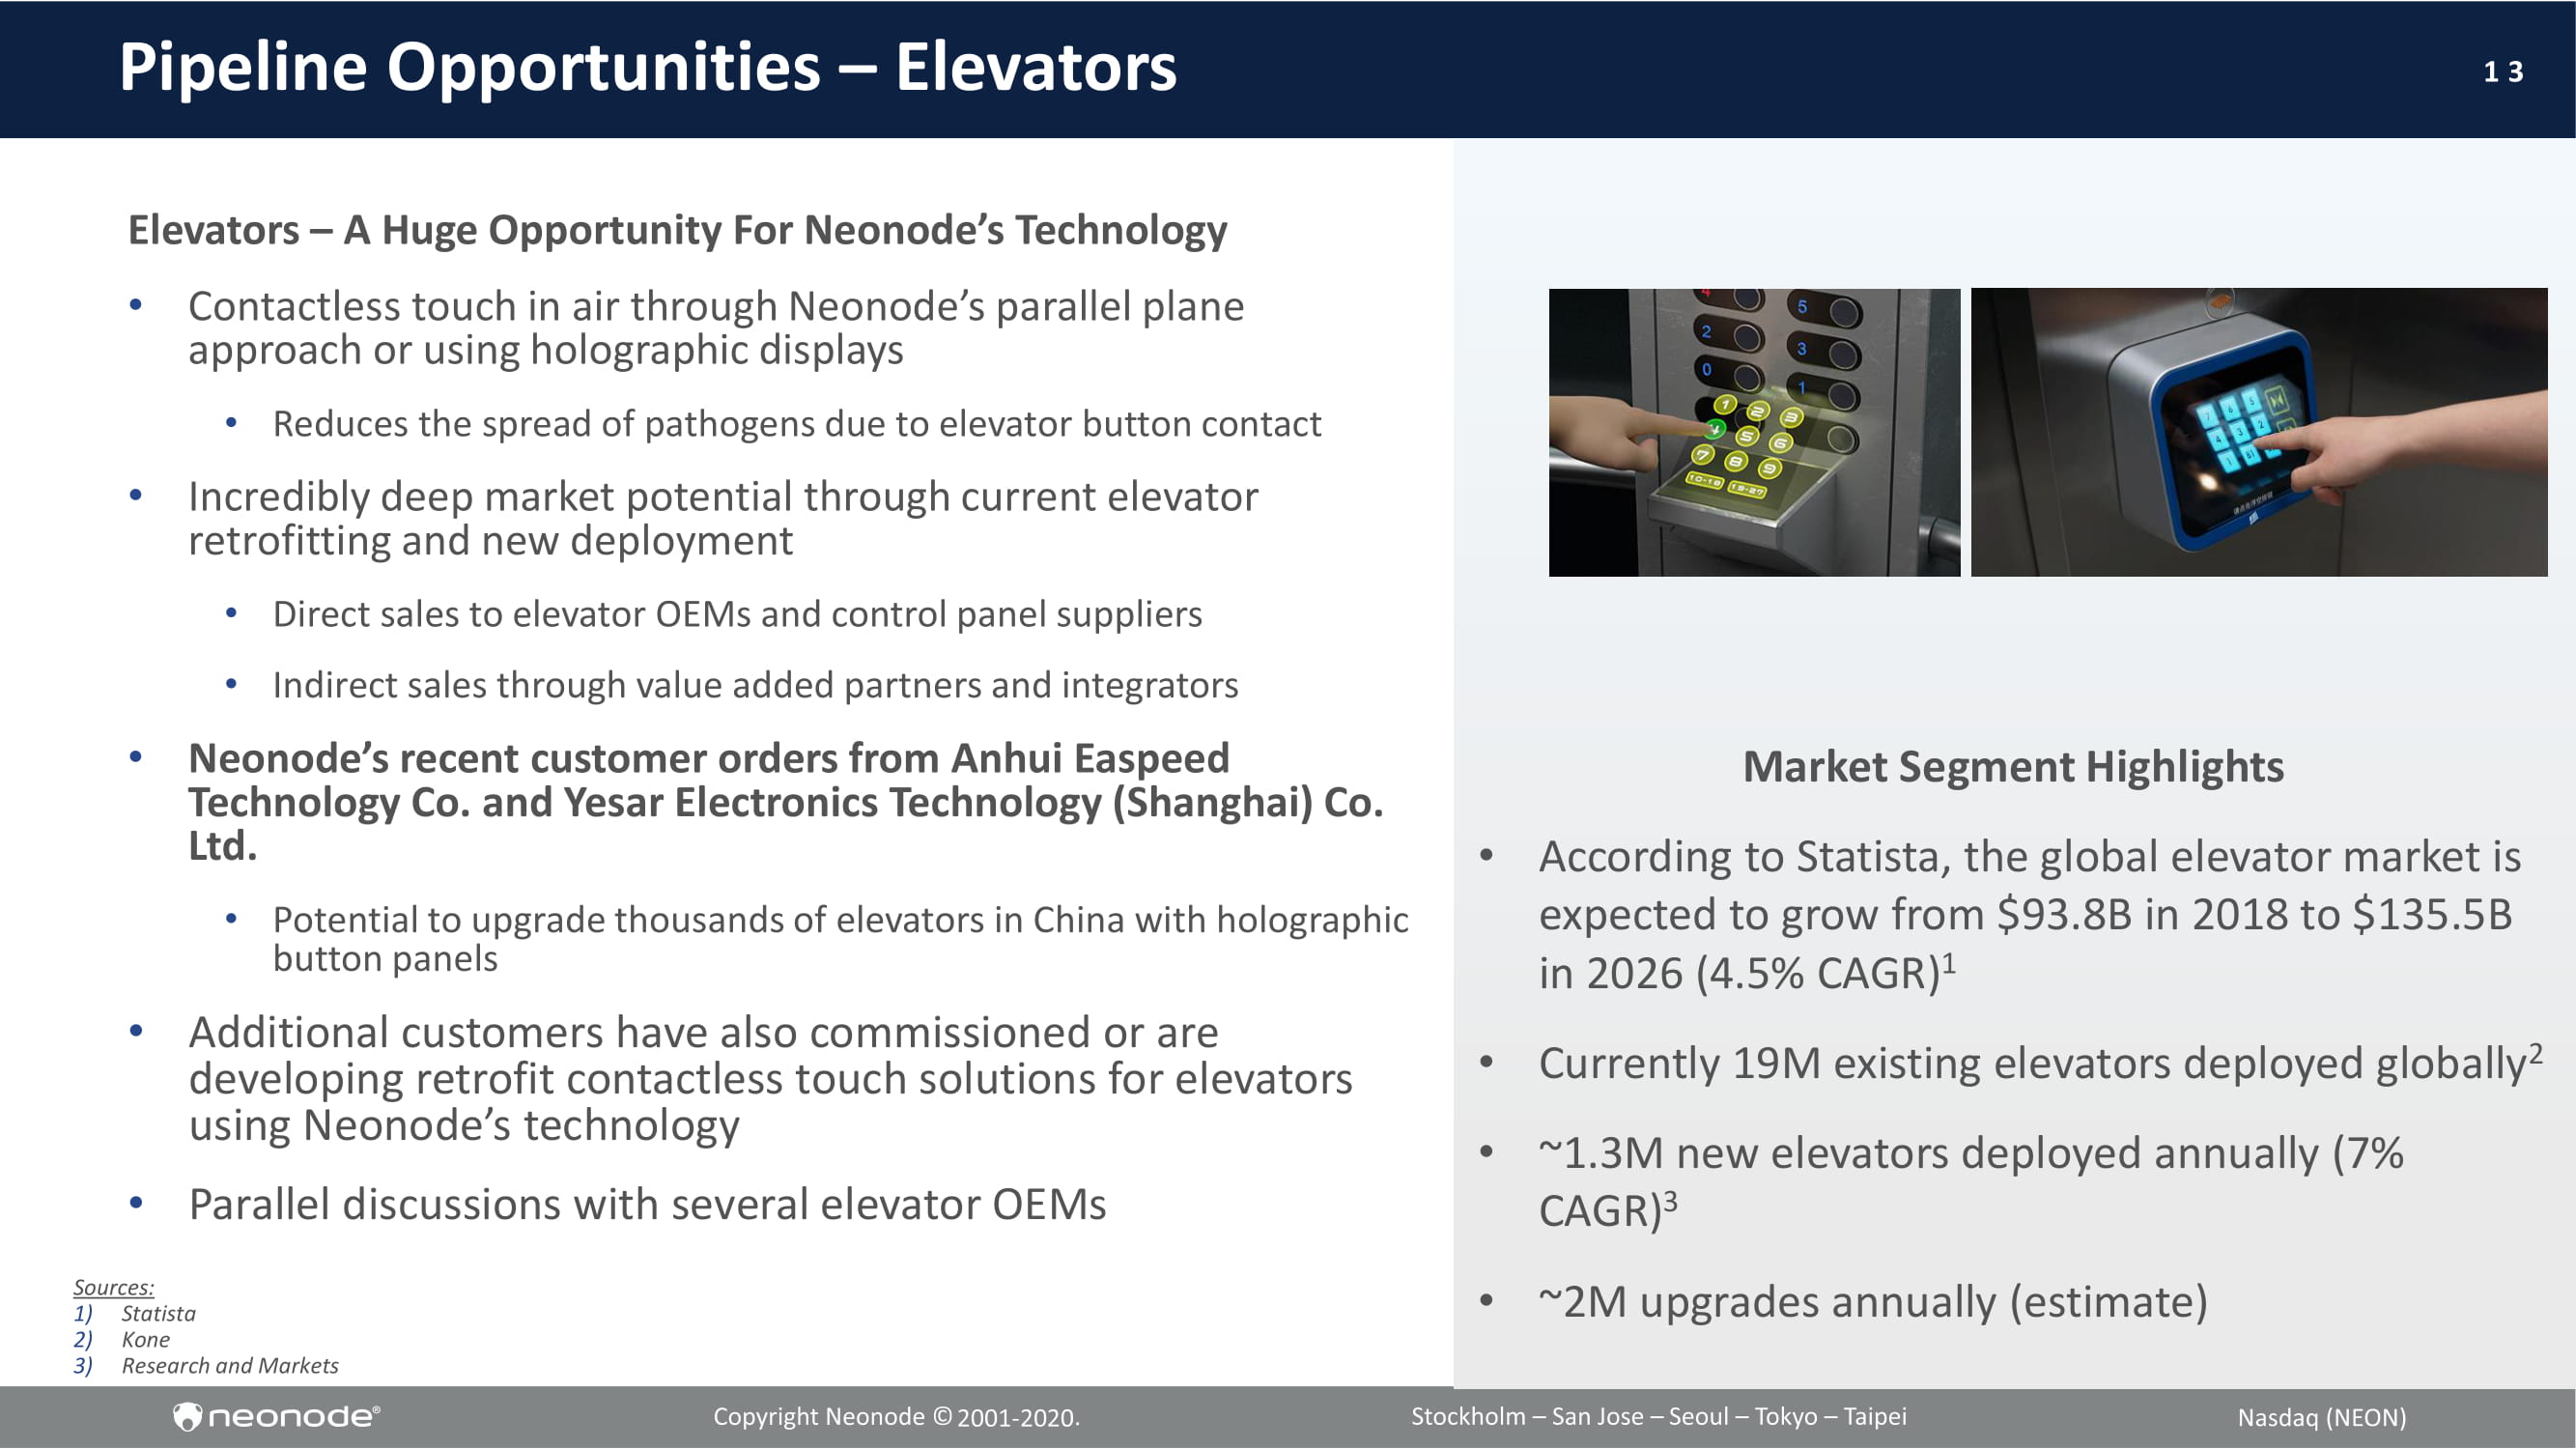
13 Pipeline Opportunities – Elevators Elevators – A Huge Opportunity For Neonode’s Technology • Contactless touch in air through Neonode’s parallel plane approach or using holographic displays • Reduces the spread of pathogens due to elevator button contact • Incredibly deep market potential through current elevator retrofitting and new deployment • Direct sales to elevator OEMs and control panel suppliers • Indirect sales through value added partners and integrators • Neonode’s recent customer orders from Anhui Easpeed Technology Co. and Yesar Electronics Technology (Shanghai) Co. Ltd. • Potential to upgrade thousands of elevators in China with holographic button panels • Additional customers have also commissioned or are developing retrofit contactless touch solutions for elevators using Neonode’s technology • Parallel discussions with several elevator OEMs Market Segment Highlights • According to Statista, the global elevator market is expected to grow from $93.8B in 2018 to $135.5B in 2026 (4.5% CAGR) 1 • Currently 19M existing elevators deployed globally 2 • ~1.3M new elevators deployed annually (7% CAGR) 3 • ~2M upgrades annually (estimate) Sources: 1) Statista 2) Kone 3) Research and Markets

14 Pipeline Opportunities – Airport Kiosks Asian Airport – A Model For Future Expansion • Passenger safety in a post - COVID world is a top priority for airports and airlines worldwide • Asian Airport, consistently the top ranked airport in the world, chose Neonode contactless touch solutions for their self - check in kiosks, vending machines and other self - service kiosks; further applications being discussed • Huge retrofit opportunity , in addition new equipment opportunity • Typical sales price of Neonode’s touch sensor modules to retrofit customers is $50 - 80 per unit with a gross margin of 40% - 50% Market Segment Highlights • There are more than 17,000 commercial airports in the world 1 • Some 14,000 self - service check in kiosks are installed in airports worldwide with 86% of airports investing in more self - check in kiosks 2 • In 2019, over 925 million passengers traveled through airports in the US alone 3 Sources: 1) Airports Council International 1) Acuant Corporation 2) Bureau of Transportation

15 Pipeline Opportunities – zForce ® Technology Licensing • Typical customers are OEMs developing, producing and selling products featuring touch - enabled displays. Examples include: • Military/Avionics Displays • Industrial Control Systems • Office Equipment and Household Appliances • Have entered 42 zForce ® technology license agreements with global OEMs, ODMs, and Tier 1 suppliers as of December 31, 2019 • Customer product development and release cycles typically take 12 to 36 months Technology Key Benefits • Ideal for both indoor and outdoor applications • Works in harsh conditions and with any input, including gloved fingers • Works well with any protective cover/front glass • No electromagnetic interference issues • Low power consumption • Limited footprint and flexible industrial design • Neonode’s solutions can co - exist with other touch systems to achieve redundancy Prototype sales NRE revenues Licensing revenues Typical Timeline Revenue Opportunities Sales (3 - 12 months) Development (12 - 36 months) Production (5 - 10 years)

16 Pipeline Opportunities – MultiSensing ® Software Licensing • Neonode’s software platform MultiSensing ® a ddresses the need for robust, cost - effective driver and cabin monitoring systems • Compliant with the new EU general safety regulations (GSR) and meets the Euro NCAP guidelines, applicable for all new vehicles from 2024 • Engaged in discussions with several OEMs and Tier 1s; shortlisted for shortlisted for sourcing process for 2024+ platform design win with a premium OEM • Customer product development and release cycles typically take 24 to 36 months Technology Key Benefits • Scalable – fits many different applications and supports different features and performance levels • Hardware - agnostic - software can be integrated and run on different processor units and use different types of input signals • Low computational footprint - supports low - cost system designs Prototype sales NRE revenues Licensing revenues Typical Timeline Revenue Opportunities Sales (3 - 12 months) Development (24 - 36 months) Production (5 - 10 years)

17 Private Placement Closed August 7 • On August 7, 2020, the company completed a private placement transaction consisting of common and preferred stock receiving cash proceeds totaling $13.1 million, net of offering expenses. • The company also converted $1.0 million short - term working capital loans into shares of preferred stock. The preferred stock will be converted into common stock upon shareholder approval. • Management and members of the Board participated in the transaction investing a total of $3.1million in cash plus converting the $1.0 million outstanding short - term loans. • The proceeds from this financing transaction will be used to strengthen the company’s cash position to accelerate growth to meet the rapidly increasing demands for contactless touch solutions from customers worldwide.

18 Patent Agreement with Aequitas Technologies • Neonode has an embedded call option associated with its patent agreement with Aequitas Technologies LLC. • In May 2019, Neonode assigned two patent families related to old smartphone technology to Aequitas in exchange for 50% of the net proceeds if Aequitas succeeds in monetizing the patents. • In June 2020, Neonode Smartphone LLC, a subsidiary of Aequitas, filed patent infringement lawsuits against Apple Inc., and Samsung Electronics Co. Ltd. and Samsung Electronics America Inc., respectively, in the Western District of Texas, USA. • Neonode will not bear any of the expenses associated with the lawsuits.

19 Financial Update Second Quarter 2020

20 Q2 2020 Summary • Revenues of $0.7M compared to $1.7M in Q2 2019 • Low estimations of license revenues due to COVID - 19 effects, $0.7 compared to $1.2 previous quarter • Operating expenses of $2.4M compared to $3.0M in Q2 2019 • Subsidized staff taxes and less travelling • Operating loss $1.8M compared to $1.3M loss in Q2 2019 • Revenues down by 55.7% compared to same quarter 2019 • Partly offset by lower operating expenses, down by 19.0% compared to same quarter 2019 0 500 1,000 1,500 2,000 2,500 Q1-18 Q2-18 Q3-18 Q4-18 Q1-19 Q2-19 Q3-19 Q4-19 Q1-20 Q2-20 Revenues License Revenues NRE Revenues Product Revenues -3,000 -2,500 -2,000 -1,500 -1,000 -500 0 Q1-18 Q2-18 Q3-18 Q4-18 Q1-19 Q2-19 Q3-19 Q4-19 Q1-20 Q2-20 Operating Loss

21 Q2 2020 Revenues • Estimated license fees in business area HMI Solutions low in Q2 2020 due to COVID - 19 • A rebound is expected but dependent on the development of the pandemic • License customers shipped 0.7 million products during Q2 2020, accumulated >76 million since 2011 • Product sales still on low volumes but increased interest and increased in - flow of new customer orders • COVID - 19 related lock - downs in Q2 decreased number of shipped products -500 0 500 1,000 1,500 2,000 2,500 Q1-19 Q2-19 Q3-19 Q4-19 Q1-20 Q2-20 Revenues HMI Solutions Printers Automotive Avionics Other 0 50 100 150 200 250 300 Q1-19 Q2-19 Q3-19 Q4-19 Q1-20 Q2-20 Revenues HMI Products Distributors and others Medical Automotive

22 Q2 Operating Expenses and Result • Operating expenses decreased by 19% compared to Q2 2019 • New employees to strengthen management • Swedish government support program • Reduced payroll taxes • Subsidized reduced working hours • In total lower staff expenses , professional fees and travelling than plan • Operating loss increased by 34% Q2 2020 compared to 2019 • Net loss $1.8 million or $0.18 per share 0 500 1,000 1,500 2,000 2,500 3,000 3,500 4,000 Q1-18 Q2-18 Q3-18 Q4-18 Q1-19 Q2-19 Q3-19 Q4-19 Q1-20 Q2-20 Operating Expenses -7,000 -6,000 -5,000 -4,000 -3,000 -2,000 -1,000 0 dec/18 jan/19 feb/19 mar/19 apr/19 maj/19 jun/19 jul/19 aug/19 sep/19 okt/19 nov/19 dec/19 jan/20 feb/20 mar/20 apr/20 maj/20 jun/20 Operating Loss, rolling 12 months
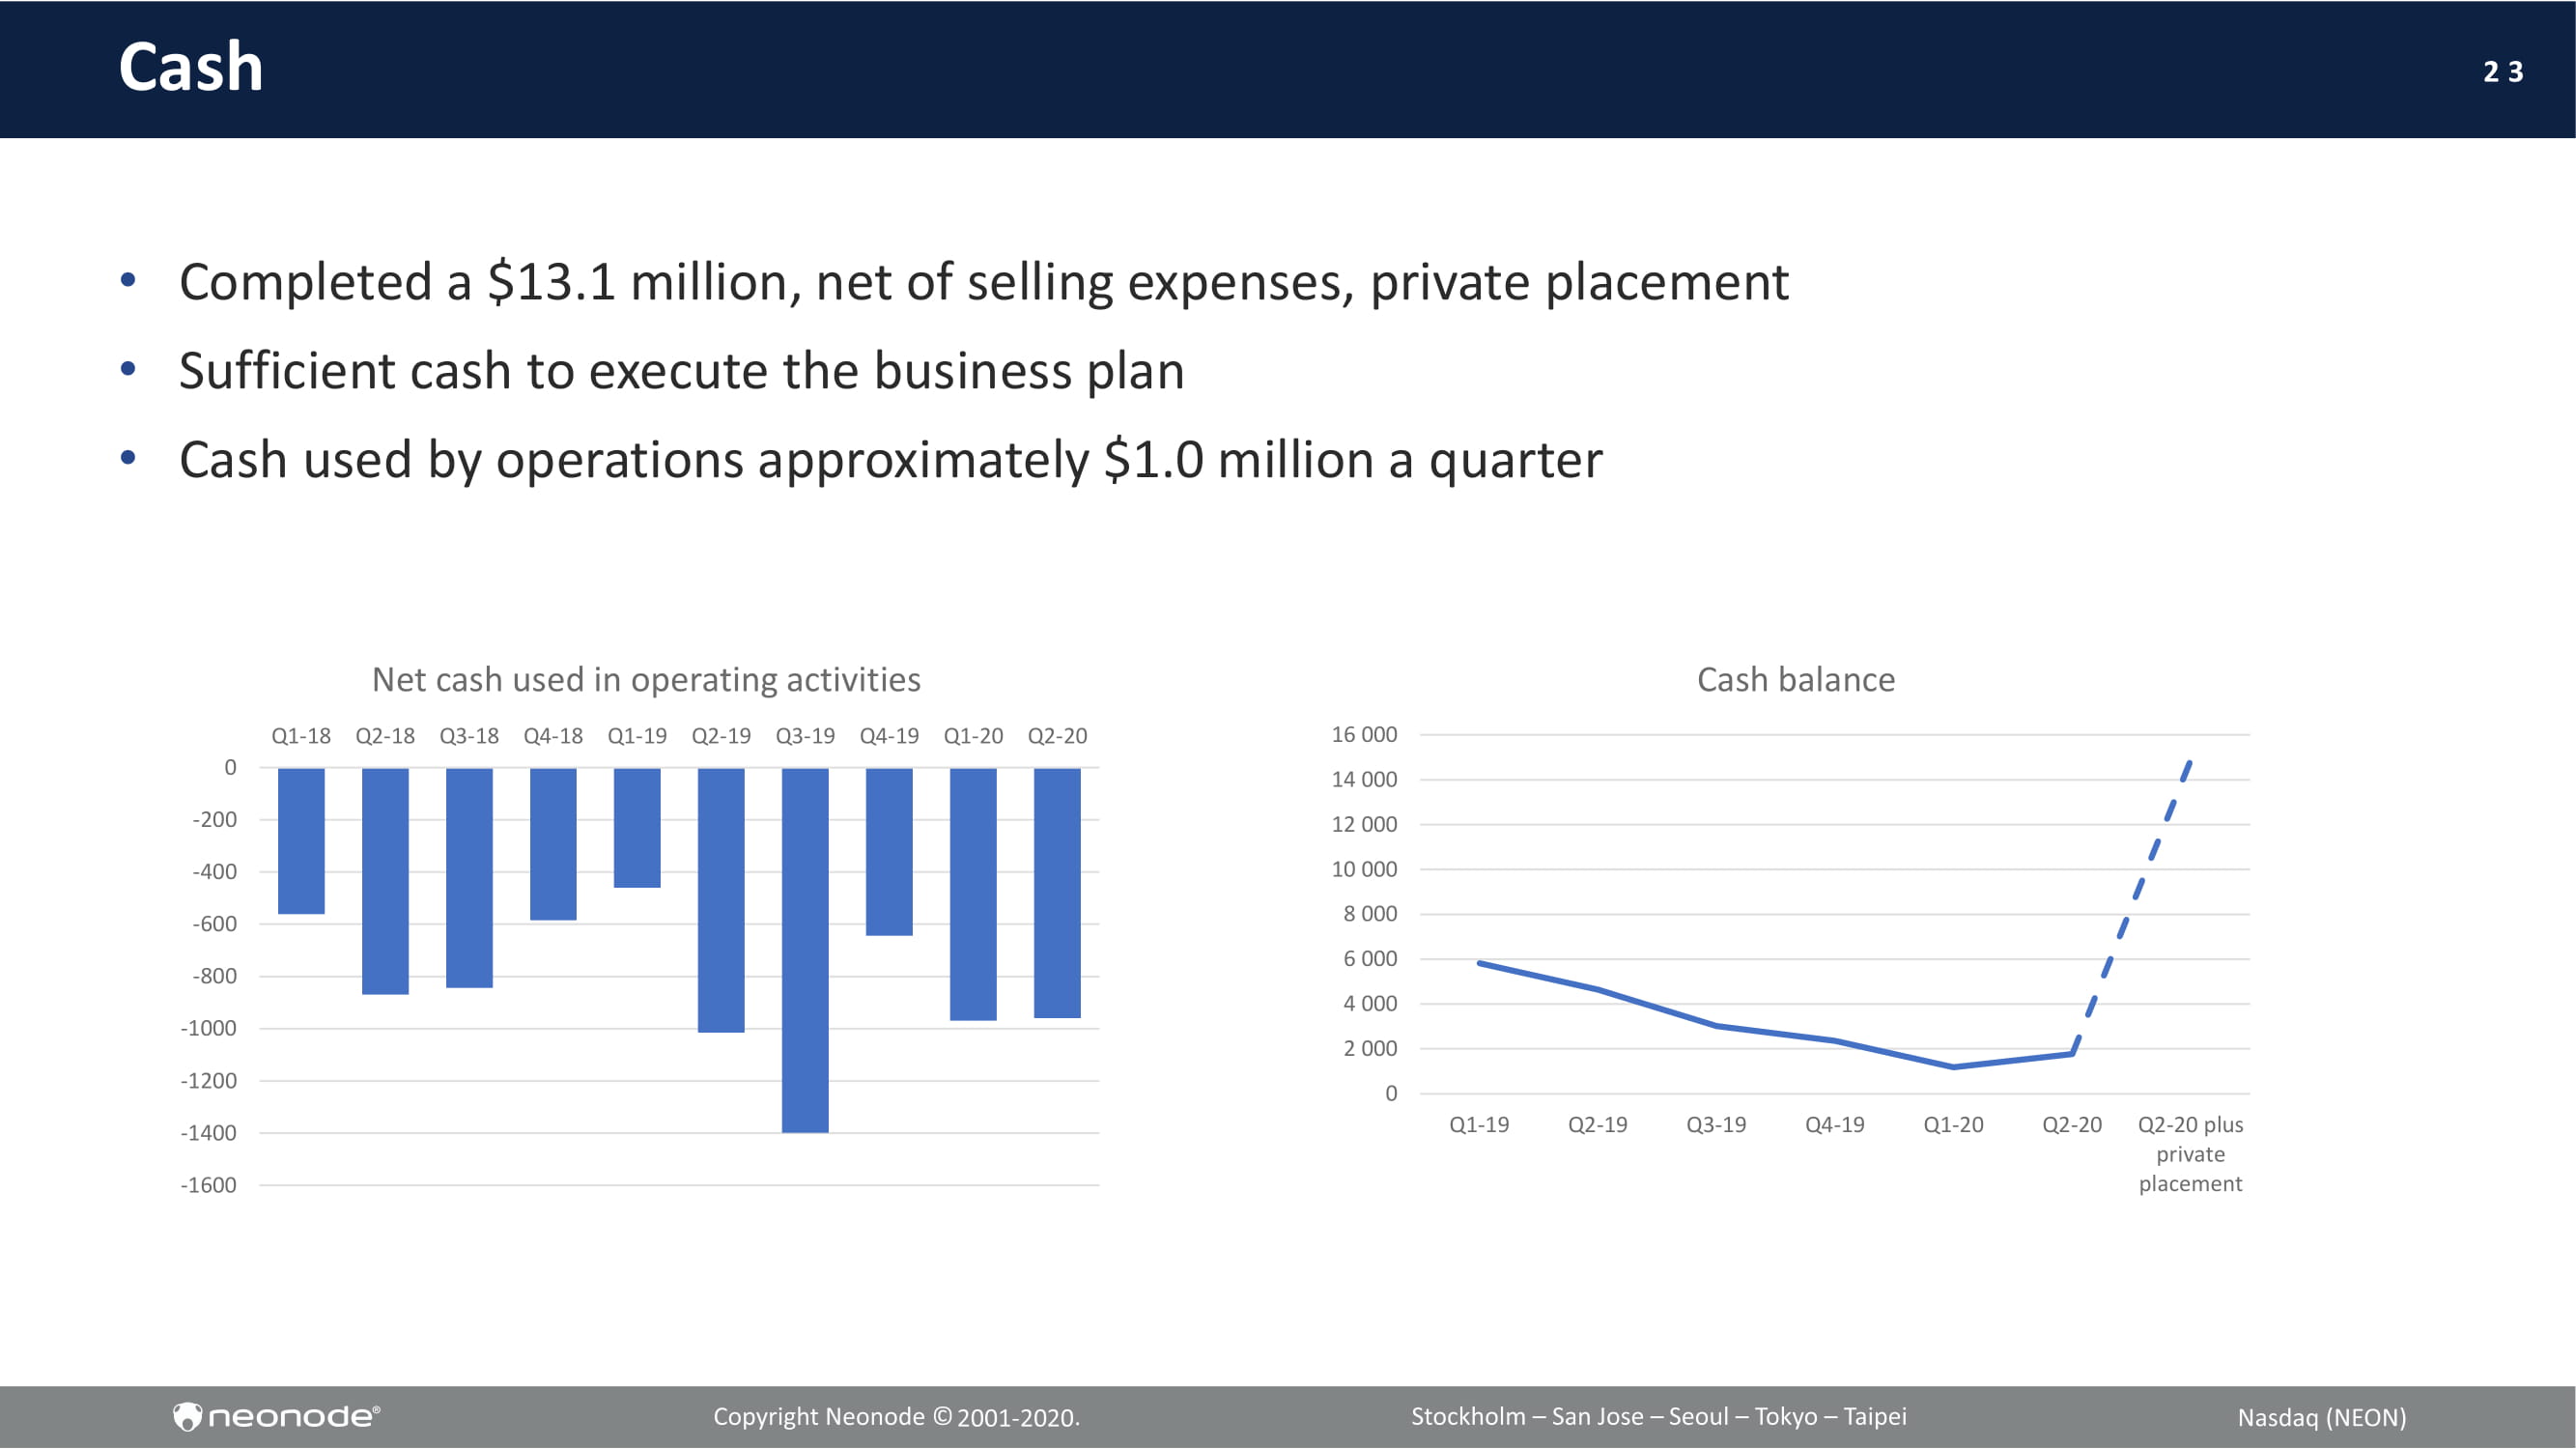
23 Cash • Completed a $13.1 million, net of selling expenses, private placement • Sufficient cash to execute the business plan • Cash used by operations approximately $1.0 million a quarter -1600 -1400 -1200 -1000 -800 -600 -400 -200 0 Q1-18 Q2-18 Q3-18 Q4-18 Q1-19 Q2-19 Q3-19 Q4-19 Q1-20 Q2-20 Net cash used in operating activities 0 2,000 4,000 6,000 8,000 10,000 12,000 14,000 16,000 Q1-19 Q2-19 Q3-19 Q4-19 Q1-20 Q2-20 Q2-20 plus private placement Cash balance

24 Highlights • Through the private placement closed on August 7 we have adequate cash resources needed to accelerate growth and capitalize on current and future opportunities • Our zForce ® technology – patent protected – is an enabling technology ideally positioned to solve for a lifestyle shift to contactless touch solutions brought on by COVID - 19 • Demand for contactless touch solutions is exploding – enormous market opportunity to integrate Neonode technology into new and retrofitted equipment , for instance in » Interactive kiosks ( ticketing , vending , self checkout in retail , ATMs etc.) – pilot with leading OEM underway » Elevators – several customers and tech partners have developed solutions and secured agreements for retrofitting , engaged in discussions with several OEMs • We also see strong demand for our zForce ® and MultiSensing ® technology and software licensing offers from customers in the avionics and industrial control system industries and the automotive industry, respectively • The focus the coming 6 - 12 months will be on execution

Thank You [email protected] neonode.com Thank You [email protected] neonode.com