0000087050
false
0000087050
2021-11-10
2021-11-10
iso4217:USD
xbrli:shares
iso4217:USD
xbrli:shares
UNITED STATES
SECURITIES AND EXCHANGE COMMISSION
Washington, D.C. 20549
FORM 8-K
CURRENT REPORT
Pursuant to Section 13 or 15(d) of the
Securities Exchange Act of 1934
Date of Report (Date of earliest event reported):
November 10, 2021
NEONODE INC.
(Exact name of issuer of securities held pursuant
to the plan)
Commission File Number 1-35526
| Delaware |
|
94-1517641 |
|
(State or other jurisdiction
of incorporation) |
|
(I.R.S. Employer
Identification No.) |
Karlavägen 100, 115 26 Stockholm, Sweden
(Address of Principal Executive Office, including
Zip Code)
+46 (0) 8 667 17 17
Registrant’s telephone number, including
area code:
Not Applicable
(Former name or former address, if changed since
last report)
Check the appropriate box below if the Form 8-K
filing is intended to simultaneously satisfy the filing obligation of the registrant under any of the following provisions (see General
Instruction A.2. below):
| ☐ |
Written communications pursuant to Rule 425 under the Securities Act (17 CFR 230.425) |
| ☐ |
Soliciting material pursuant to Rule 14a-12 under the Exchange Act (17 CFR 240.14a-12) |
| ☐ |
Pre-commencement communications pursuant to Rule 14d-2(b) under the Exchange Act (17 CFR 240.14d-2(b)) |
| ☐ |
Pre-commencement communications pursuant to Rule 13e-4(c) under the Exchange Act (17 CFR 240.13e-4(c)) |
Securities registered pursuant to Section 12(b) of the Act:
| Title of each class |
|
Trading Symbol(s) |
|
Name of each exchange on which registered |
| Common Stock, par value $0.001 per share |
|
NEON |
|
The Nasdaq Stock Market LLC |
Indicate by check mark whether the registrant
is an emerging growth company as defined in Rule 405 of the Securities Act of 1933 (§230.405 of this chapter) or Rule 12b-2 of the
Securities Exchange Act of 1934 (§240.12b-2 of this chapter).
Emerging growth company ☐
If an emerging growth company, indicate by check
mark if the registrant has elected not to use the extended transition period for complying with any new or revised financial accounting
standards provided pursuant to Section 13(a) of the Exchange Act. ☐
Item 2.02. Results of Operations and Financial
Condition.
On November 10, 2021, Neonode Inc. (the “Company”)
reported its earnings for the three and nine months ended September 30, 2021 (the “Earnings Release”) and posted on the Company’s
website the Third Quarter 2021 Presentation (the “Presentation”). A copy of the Earnings Release and the Presentation are
attached hereto as Exhibits 99.1 and 99.2, respectively, and are incorporated herein by reference.
The information furnished pursuant to this Item 2.02,
including Exhibits 99.1 and 99.2, shall not be deemed “filed” for purposes of Section 18 of the Securities Exchange
Act of 1934, as amended (the “Exchange Act”), or otherwise subject to the liabilities under that Section, or incorporated
by reference in any filing under the Securities Act of 1933, as amended (the “Securities Act”), or the Exchange Act, except
as shall be expressly set forth by specific reference in such a filing.
Item 7.01 Regulation FD Disclosure
As previously announced, the Company will conduct
a conference call today, Wednesday, November 10, 2021 at 10:00 a.m. ET. The presentation slides to be used during the call, attached
hereto as Exhibit 99.2, will be available on the “Investor Relations” section of the Company’s website at www.neonode.com
immediately prior to the call. The information contained in, or that can be accessed through the Company’s website is not a
part of this filing.
The information furnished pursuant to this Item 7.01,
including Exhibits 99.1 and 99.2, shall not be deemed “filed” for purposes of Section 18 of the Exchange Act, or otherwise
subject to the liabilities under that Section, or incorporated by reference in any filing under the Securities Act or the Exchange Act,
except as shall be expressly set forth by specific reference in such a filing.
Item 9.01. Financial Statements and Exhibits.
SIGNATURES
Pursuant to the requirements
of the Securities Exchange Act of 1934, the Registrant has duly caused this report to be signed on its behalf by the undersigned thereunto
duly authorized.
| Date: November 10, 2021 |
NEONODE INC. |
| |
|
|
| |
By: |
/s/ Fredrik Nihlén |
| |
Name: |
Fredrik Nihlén |
| |
Title: |
Chief Financial Officer |
2
Exhibit
99.1

PRESS
RELEASE
For
Release, 9:10AM EST November 10, 2021
Neonode
Reports Quarter Ended September 30, 2021 Financial Results
STOCKHOLM,
SWEDEN – November 10, 2021 – Neonode Inc. (NASDAQ: NEON), today reported financial results for the three and nine
months ending September 30, 2021.
FINANCIAL
SUMMARY FOR THE THREE MONTHS ENDED September 30, 2021:
| ● | Revenue
of $1.0 million, a decrease of 36% compared to the same period in the prior year. |
| | | |
| ● | Operating
expenses of $2.7 million, a decrease of 12% compared to the same period in the prior year. |
| | | |
| ● | Net loss of $1.7 million, or $0.15 per share, compared to $1.6 million,
or $0.16 per share, for the same period in the prior year. |
| ● | Cash
used by operations of $1.6 million compared to $1.8 million for the same period
in the prior year. |
| | | |
| ● | Cash
and accounts receivable of $6.3 million as of September 30, 2021, compared to $12.2 million
as of December 31, 2020. |
FINANCIAL SUMMARY FOR THE NINE
MONTHS ENDED September 30, 2021:
| ● | Revenue
of $4.3 million, an increase of 23% compared to the same period in the prior year. |
| ● | Operating
expenses of $9.0 million, an increase of 16% compared to the same period in the prior year. |
| ● | Net
loss of $4.9 million, or $0.43 per share, compared to $4.3 million, or $0.45 per share, for the same period in the prior year. |
| ● | Cash
used by operations of $5.0 million compared to $3.7 million for the same period in the prior year. |
THE
CEO’S COMMENTS
“During
the third quarter our revenue was negatively impacted by COVID-19 driven
lock-downs in our key Asian markets. The impact of these lock-downs was exacerbated by global supply chain constraints due to
semiconductor component shortages, which resulted in a reduction in license fees earned from our printer and automotive customers.
These developments resulted in a temporary slowdown in the progress we experienced in the first half of the year where we saw
increasing traction with elevator and kiosk customers using our Touch Sensor Modules (”TSMs”) and stable license
revenues. During this renewed lock-down phase, sales of our TSMs have been negatively impacted because our
partners who are providing retrofit solutions have been unable to freely access their customer locations to install their
contactless touch kits. Some elevator and kiosk projects have also been
delayed due to of supply-chain issues related to semiconductor component shortages,” commented Dr. Urban Forssell, CEO of
Neonode.
“We continue to build our sales pipeline
with an increasing number of development and pilot projects underway for elevators plus an array of public space kiosks, such as contactless
touch systems in airport and retail self-check-in/out kiosks, and our sales pipeline continues to improve. We are pleased to see that
these sales efforts are now being turned into commercial decisions to install our solutions with the next step to place purchase orders.
Asian customers are leading the way, but we see increasing interest in our contactless touch technology and our TSM solutions from European
and North American customers as well,” said Dr. Urban Forssell.
“To
ensure we maintain ample liquidity during this current period of market uncertainty related to the ongoing pandemic, in October
2021, we sold an aggregate of 1,808,000 shares of our common stock in a registered direct offering to certain Swedish and European
investors, which, combined with sales under our existing at-the-market facility provided approximately $14.5 million of cash, net of
placement agent fees and other offering expenses. The net proceeds will be
used for continued investments in sales and marketing to create greater awareness and support for the expected growth of our
TSM production volumes. We believe we are now well capitalized to navigate
the current headwinds and continue to grow the company and increase shareholder value,” concluded Dr. Forssell.
FINANCIAL
OVERVIEW FOR THE THREE AND NINE MONTHS ENDED SEPTEMBER 30, 2021
Net revenues decreased by 36% for the three months
ended September 30, 2021 as compared to the same period in 2020. The decrease is primarily due to overall global supply-chain constraints
and more specifically semiconductor component shortages within the printer and automotive markets combined with renewed pandemic-driven
lock-downs in our key markets. For the nine months ended September 30, 2021 as compared to the same period in 2020 we saw a 23% increase
in total net revenues. The increase was mainly due to higher license fees and higher TSM sales earned primarily in the first half of the
year before COVID-19 driven lock-downs were implemented in our key markets. Elevator and kiosks customers in Asia have been first adopters
for our contactless touch technology and as expected, most of our sales are related to retrofit solutions due to long product development
cycles.
Our total gross margin was 90% and 86% for the
three and nine months ended September 30, 2021, respectively, and 87% and 90% for the three and nine months ended September 30, 2020,
respectively. For the three and nine months ended September 30, 2021, gross margin related to product sales was 28% and 31%, respectively
compared to 30% and 31% for the same periods in 2020, respectively. Our operating expenses decreased 14% in the three months ended September
30, 2021 compared to the same period in 2020, primarily due to one-time legal costs in 2020. Operating expenses increased 15% in the nine
months ended September 30, 2021, compared to the same period in 2020, primarily due to adding headcount in all departments in 2021 to
position the company for future growth.
Net loss attributable to Neonode was $1.7 million
and $4.9 million for the three and nine months ended September 30, 2021, respectively, and $1.6 million and $4.3 million for the same
periods in 2020 respectively. Cash used by operations was $1.6 million and $5.0 million for three and nine months ended September 30,
2021, respectively, compared to $1.8 million and $3.7 million in the same periods of 2020, respectively. This was primarily the result
of a higher net loss and increased inventory to secure our future product deliveries.
Cash and accounts receivable totaled $6.3 million
and working capital was $6.2 million as of September 30, 2021, compared to $12.2 million and $10.4 million as of December 31, 2020, respectively.
During the three and nine months ended September 30, 2021, we sold an aggregate of 93,553 shares of common stock under our at-the-market
facility (“ATM facility”), resulting in net proceeds of approximately $593,000 after payment of commissions of $18,000.
In October 2021, we sold an aggregate of 1,808,000
shares of our common stock at a price of $7.75 per share to certain Swedish and other European investors in a registered direct offering.
We received net proceeds of approximately $13.1 million from the offering after deducting placement agent fees and other offering expenses.
We also sold an aggregate of 142,169 shares under our ATM facility with aggregate net proceeds to us of $1.4 million.
For
more information, please contact:
Investor
Relations
David
Brunton
E-mail:
[email protected]
Chief
Financial Officer
Fredrik
Nihlén
E-mail:
[email protected]
About
Neonode
Neonode Inc. (NASDAQ:NEON) is a publicly traded company, headquartered in Stockholm, Sweden and established in 2001. The company provides
advanced optical sensing solutions for contactless touch, touch, gesture control, and in-cabin monitoring. Building on experience acquired
during years of advanced R&D and technology licensing, Neonode’s technology is currently deployed in more than 80 million
products and the company holds more than 100 patents worldwide. Neonode’s customer base includes some of the world’s best-known
Fortune 500 companies in the consumer electronics, office equipment, automotive, elevator, and self-service kiosk markets.
NEONODE
and the NEONODE logo are trademarks of Neonode Inc. registered in the United States and other countries.
For
further information please visit www.neonode.com
Follow
us at:
LinkedIn
Cision
Subscribe to our news here
Safe
Harbor Statement
This press release contains forward-looking statements within the meaning of the Private Securities Litigation
Reform Act of 1995. These include, but are not limited to, statements relating to expectations, future performance or future events.
These statements are based on current assumptions, expectations and information available to Neonode management and involve a number
of known and unknown risks, uncertainties and other factors that may cause Neonode's actual results, levels of activity, performance
or achievements to be materially different from any expressed or implied by these forward-looking statements.
These
risks, uncertainties, and factors are discussed under "Risk Factors" and elsewhere in Neonode's public filings with the SEC
from time to time, including Neonode's annual report on Form 10-K, quarterly reports on Form 10-Q, and current reports on Form 8-K. You
are advised to carefully consider these various risks, uncertainties and other factors. Although Neonode management believes that the
forward-looking statements contained in this press release are reasonable, it can give no assurance that its expectations will be fulfilled.
Forward-looking statements are made as of today's date, and Neonode undertakes no duty to update or revise them.
NEONODE INC.
CONDENSED CONSOLIDATED BALANCE SHEETS
(In thousands, except share and per share amounts)
| | |
September 30, | | |
December 31, | |
| | |
2021 | | |
2020 | |
| | |
(Unaudited) | | |
(Audited) | |
| ASSETS | |
| | |
| |
| Current assets: | |
| | |
| |
| Cash | |
$ | 5,496 | | |
$ | 10,473 | |
| Accounts receivable and unbilled revenue, net | |
| 763 | | |
| 1,743 | |
| Inventory | |
| 2,402 | | |
| 1,273 | |
| Prepaid expenses and other current assets | |
| 586 | | |
| 1,161 | |
| Total current assets | |
| 9,247 | | |
| 14,650 | |
| | |
| | | |
| | |
| Property and equipment, net | |
| 492 | | |
| 1,003 | |
| Operating lease right-of-use assets | |
| 488 | | |
| 919 | |
| Total assets | |
$ | 10,227 | | |
$ | 16,572 | |
| | |
| | | |
| | |
| LIABILITIES AND STOCKHOLDERS’ EQUITY | |
| | | |
| | |
| Current liabilities: | |
| | | |
| | |
| Accounts payable | |
$ | 635 | | |
$ | 1,084 | |
| Accrued payroll and employee benefits | |
| 1,009 | | |
| 1,170 | |
| Accrued expenses | |
| 637 | | |
| 545 | |
| Deferred revenues | |
| 134 | | |
| 138 | |
| Current portion of finance lease obligations | |
| 369 | | |
| 769 | |
| Current portion of operating lease obligations | |
| 314 | | |
| 504 | |
| Total current liabilities | |
| 3,098 | | |
| 4,210 | |
| | |
| | | |
| | |
| Finance lease obligations, net of current portion | |
| 28 | | |
| 95 | |
| Operating lease obligations, net of current portion | |
| 36 | | |
| 377 | |
| Total liabilities | |
| 3,162 | | |
| 4,682 | |
| | |
| | | |
| | |
| Commitments and contingencies | |
| | | |
| | |
| | |
| | | |
| | |
| Stockholders’ equity: | |
| | | |
| | |
| Common stock, 25,000,000 shares authorized, with par value of $0.001; 11,611,048 and 11,504,665 shares issued and outstanding at September 30, 2021 and December 31, 2020, respectively | |
| 12 | | |
| 12 | |
| Additional paid-in capital | |
| 212,347 | | |
| 211,663 | |
| Accumulated other comprehensive loss | |
| (551 | ) | |
| (404 | ) |
| Accumulated deficit | |
| (201,104 | ) | |
| (196,158 | ) |
| Total Neonode Inc. stockholders’ equity | |
| 10,704 | | |
| 15,113 | |
| Noncontrolling interests | |
| (3,639 | ) | |
| (3,223 | ) |
| Total stockholders’ equity | |
| 7,065 | | |
| 11,890 | |
| Total liabilities and stockholders’ equity | |
$ | 10,227 | | |
$ | 16,572 | |
NEONODE INC.
CONDENSED CONSOLIDATED STATEMENTS OF OPERATIONS
(In thousands, except per share amounts)
(Unaudited)
| | |
Three months ended
September 30, | | |
Nine months ended
September 30, | |
| | |
2021 | | |
2020 | | |
2021 | | |
2020 | |
| Revenues: | |
| | |
| | |
| | |
| |
| License fees | |
$ | 821 | | |
$ | 1,207 | | |
$ | 3,474 | | |
$ | 3,050 | |
| Products | |
| 136 | | |
| 284 | | |
| 837 | | |
| 450 | |
| Non-recurring engineering | |
| 5 | | |
| 4 | | |
| 36 | | |
| 47 | |
| Total revenues | |
| 962 | | |
| 1,495 | | |
| 4,347 | | |
| 3,547 | |
| | |
| | | |
| | | |
| | | |
| | |
| Cost of revenues: | |
| | | |
| | | |
| | | |
| | |
| Products | |
| 98 | | |
| 198 | | |
| 580 | | |
| 306 | |
| Non-recurring engineering | |
| 1 | | |
| 3 | | |
| 17 | | |
| 62 | |
| Total cost of revenues | |
| 99 | | |
| 201 | | |
| 597 | | |
| 368 | |
| | |
| | | |
| | | |
| | | |
| | |
| Total gross margin | |
| 863 | | |
| 1,294 | | |
| 3,750 | | |
| 3,179 | |
| | |
| | | |
| | | |
| | | |
| | |
| Operating expenses: | |
| | | |
| | | |
| | | |
| | |
| Research and development | |
| 1,015 | | |
| 901 | | |
| 3,536 | | |
| 2,939 | |
| Sales and marketing | |
| 640 | | |
| 604 | | |
| 2,197 | | |
| 1,797 | |
| General and administrative | |
| 1,030 | | |
| 1,535 | | |
| 3,264 | | |
| 3,034 | |
| | |
| | | |
| | | |
| | | |
| | |
| Total operating expenses | |
| 2,685 | | |
| 3,040 | | |
| 8,997 | | |
| 7,770 | |
| Operating loss | |
| (1,822 | ) | |
| (1,746 | ) | |
| (5,247 | ) | |
| (4,591 | ) |
| | |
| | | |
| | | |
| | | |
| | |
| Other expense: | |
| | | |
| | | |
| | | |
| | |
| Interest expense | |
| 3 | | |
| 11 | | |
| 11 | | |
| 25 | |
| Total other expense | |
| 3 | | |
| 11 | | |
| 11 | | |
| 25 | |
| | |
| | | |
| | | |
| | | |
| | |
| Loss before provision (benefit) for income taxes | |
| (1,825 | ) | |
| (1,757 | ) | |
| (5,258 | ) | |
| (4,616 | ) |
| | |
| | | |
| | | |
| | | |
| | |
| Provision (benefit) for income taxes | |
| 31 | | |
| (9 | ) | |
| 104 | | |
| 10 | |
| Net loss including noncontrolling interests | |
| (1,856 | ) | |
| (1,748 | ) | |
| (5,362 | ) | |
| (4,626 | ) |
| Less: Net loss attributable to noncontrolling interests | |
| 135 | | |
| 110 | | |
| 416 | | |
| 366 | |
| Net loss attributable to Neonode Inc. | |
$ | (1,721 | ) | |
$ | (1,638 | ) | |
$ | (4,946 | ) | |
$ | (4,260 | ) |
| Preferred dividends | |
| - | | |
| (33 | ) | |
| - | | |
| (33 | ) |
| Net loss attributable to common shareholders of Neonode Inc. | |
$ | (1,721 | ) | |
$ | (1,671 | ) | |
$ | (4,946 | ) | |
$ | (4,293 | ) |
| | |
| | | |
| | | |
| | | |
| | |
| Loss per common share: | |
| | | |
| | | |
| | | |
| | |
| Basic and diluted loss per share | |
$ | (0.15 | ) | |
$ | (0.16 | ) | |
$ | (0.43 | ) | |
$ | (0.45 | ) |
| Basic and diluted – weighted average number of common shares outstanding | |
| 11,542 | | |
| 10,128 | | |
| 11,517 | | |
| 9,492 | |
NEONODE INC.
CONDENSED CONSOLIDATED STATEMENTS OF COMPREHENSIVE
LOSS
(In thousands)
(Unaudited)
| | |
Three months ended
September 30, | | |
Nine months ended
September 30, | |
| | |
2021 | | |
2020 | | |
2021 | | |
2020 | |
| Net loss | |
$ | (1,856 | ) | |
$ | (1,748 | ) | |
$ | (5,362 | ) | |
$ | (4,626 | ) |
| | |
| | | |
| | | |
| | | |
| | |
| Other comprehensive income (loss): | |
| | | |
| | | |
| | | |
| | |
| Foreign currency translation adjustments | |
| (37 | ) | |
| (228 | ) | |
| (147 | ) | |
| (251 | ) |
| Comprehensive loss | |
| (1,893 | ) | |
| (1,976 | ) | |
| (5,509 | ) | |
| (4,877 | ) |
| Less: Comprehensive loss attributable to noncontrolling interests | |
| 135 | | |
| 110 | | |
| 416 | | |
| 366 | |
| Comprehensive loss attributable to Neonode Inc. | |
$ | (1,758 | ) | |
$ | (1,866 | ) | |
$ | (5,093 | ) | |
$ | (4,511 | ) |
NEONODE INC.
CONDENSED CONSOLIDATED STATEMENTS OF STOCKHOLDERS’
EQUITY
(In thousands, except for Preferred Stock Shares
Issued)
(Unaudited)
For the Quarter to Date periods ended September
30, 2020 through September 30, 2021
| | |
Preferred Stock Shares Issued | | |
Preferred Stock Amount | | |
Common Stock Shares Issued | | |
Common Stock Amount | | |
Additional
Paid-in
Capital | | |
Accumulated
Other
Comprehensive
Income (Loss) | | |
Accumulated
Deficit | | |
Total
Neonode Inc.
Stockholders’
Equity | | |
Noncontrolling
Interests | | |
Total
Stockholders’
Equity | |
| Balances, December 31, 2019 | |
| - | | |
$ | - | | |
| 9,171 | | |
$ | 9 | | |
$ | 197,543 | | |
$ | (639 | ) | |
$ | (190,520 | ) | |
$ | 6,393 | | |
$ | (2,546 | ) | |
$ | 3,847 | |
| | |
| | | |
| | | |
| | | |
| | | |
| | | |
| | | |
| | | |
| | | |
| | | |
| | |
| Foreign currency translation adjustment | |
| - | | |
| - | | |
| - | | |
| - | | |
| - | | |
| (87 | ) | |
| - | | |
| (87 | ) | |
| - | | |
| (87 | ) |
| | |
| | | |
| | | |
| | | |
| | | |
| | | |
| | | |
| | | |
| | | |
| | | |
| | |
| Net loss | |
| - | | |
| - | | |
| - | | |
| - | | |
| - | | |
| - | | |
| (1,010 | ) | |
| (1,010 | ) | |
| (102 | ) | |
| (1,112 | ) |
| | |
| | | |
| | | |
| | | |
| | | |
| | | |
| | | |
| | | |
| | | |
| | | |
| | |
| Balances, March 31, 2020 | |
| - | | |
$ | - | | |
| 9,171 | | |
$ | 9 | | |
$ | 197,543 | | |
$ | (726 | ) | |
$ | (191,530 | ) | |
$ | 5,296 | | |
$ | (2,648 | ) | |
$ | 2,648 | |
| | |
| | | |
| | | |
| | | |
| | | |
| | | |
| | | |
| | | |
| | | |
| | | |
| | |
| Foreign currency translation adjustment | |
| - | | |
| - | | |
| - | | |
| - | | |
| - | | |
| 64 | | |
| - | | |
| 64 | | |
| - | | |
| 64 | |
| | |
| | | |
| | | |
| | | |
| | | |
| | | |
| | | |
| | | |
| | | |
| | | |
| | |
| Net loss | |
| - | | |
| - | | |
| - | | |
| - | | |
| - | | |
| - | | |
| (1,612 | ) | |
| (1,612 | ) | |
| (154 | ) | |
| (1,766 | ) |
| | |
| | | |
| | | |
| | | |
| | | |
| | | |
| | | |
| | | |
| | | |
| | | |
| | |
| Balances, June 30, 2020 | |
| - | | |
$ | - | | |
| 9,171 | | |
$ | 9 | | |
$ | 197,543 | | |
$ | (662 | ) | |
$ | (193,142 | ) | |
$ | 3,748 | | |
$ | (2,802 | ) | |
$ | 946 | |
| | |
| | | |
| | | |
| | | |
| | | |
| | | |
| | | |
| | | |
| | | |
| | | |
| | |
| Issuance of shares for cash, net of offering costs | |
| 3,932 | | |
| 3,932 | | |
| 1,612 | | |
| 1 | | |
| 9,597 | | |
| - | | |
| - | | |
| 13,530 | | |
| - | | |
| 13,530 | |
| | |
| | | |
| | | |
| | | |
| | | |
| | | |
| | | |
| | | |
| | | |
| | | |
| | |
| Series C-2 Preferred Stock issued for repayment of short-term borrowings and accrued interest | |
| 517 | | |
| 517 | | |
| - | | |
| - | | |
| (1 | ) | |
| - | | |
| - | | |
| 516 | | |
| - | | |
| 516 | |
| | |
| | | |
| | | |
| | | |
| | | |
| | | |
| | | |
| | | |
| | | |
| | | |
| | |
| Conversion of Series C-1 and C-2 Preferred Stock to common stock | |
| (4,449 | ) | |
| (4,449 | ) | |
| 684 | | |
| 1 | | |
| 4,448 | | |
| - | | |
| - | | |
| - | | |
| - | | |
| - | |
| | |
| | | |
| | | |
| | | |
| | | |
| | | |
| | | |
| | | |
| | | |
| | | |
| | |
| Preferred dividends | |
| - | | |
| - | | |
| - | | |
| - | | |
| - | | |
| - | | |
| (33 | ) | |
| (33 | ) | |
| - | | |
| (33 | ) |
| | |
| | | |
| | | |
| | | |
| | | |
| | | |
| | | |
| | | |
| | | |
| | | |
| | |
| Foreign currency translation adjustment | |
| - | | |
| - | | |
| - | | |
| - | | |
| - | | |
| (228 | ) | |
| - | | |
| (228 | ) | |
| - | | |
| (228 | ) |
| | |
| | | |
| | | |
| | | |
| | | |
| | | |
| | | |
| | | |
| | | |
| | | |
| | |
| Net loss | |
| - | | |
| - | | |
| - | | |
| - | | |
| - | | |
| - | | |
| (1,638 | ) | |
| (1,638 | ) | |
| (110 | ) | |
| (1,748 | ) |
| | |
| | | |
| | | |
| | | |
| | | |
| | | |
| | | |
| | | |
| | | |
| | | |
| | |
| Balances, September 30, 2020 | |
| - | | |
$ | - | | |
| 11,467 | | |
$ | 11 | | |
$ | 211,587 | | |
$ | (890 | ) | |
$ | (194,813 | ) | |
$ | 15,895 | | |
$ | (2,912 | ) | |
$ | 12,983 | |
| | |
| | | |
| | | |
| | | |
| | | |
| | | |
| | | |
| | | |
| | | |
| | | |
| | |
| Stock-based compensation | |
| - | | |
| - | | |
| 37 | | |
| 1 | | |
| 76 | | |
| - | | |
| - | | |
| 77 | | |
| - | | |
| 77 | |
| | |
| | | |
| | | |
| | | |
| | | |
| | | |
| | | |
| | | |
| | | |
| | | |
| | |
| Foreign currency translation adjustment | |
| - | | |
| - | | |
| - | | |
| - | | |
| - | | |
| 486 | | |
| - | | |
| 486 | | |
| - | | |
| 486 | |
| | |
| | | |
| | | |
| | | |
| | | |
| | | |
| | | |
| | | |
| | | |
| | | |
| | |
| Net loss | |
| - | | |
| - | | |
| - | | |
| - | | |
| - | | |
| - | | |
| (1,345 | ) | |
| (1,345 | ) | |
| (311 | ) | |
| (1,656 | ) |
| | |
| | | |
| | | |
| | | |
| | | |
| | | |
| | | |
| | | |
| | | |
| | | |
| | |
| Balances, December 31, 2020 | |
| - | | |
$ | - | | |
| 11,504 | | |
$ | 12 | | |
$ | 211,663 | | |
$ | (404 | ) | |
$ | (196,158 | ) | |
$ | 15,113 | | |
$ | (3,223 | ) | |
$ | 11,890 | |
| | |
| | | |
| | | |
| | | |
| | | |
| | | |
| | | |
| | | |
| | | |
| | | |
| | |
| Stock-based compensation | |
| - | | |
| - | | |
| - | | |
| - | | |
| 23 | | |
| - | | |
| - | | |
| 23 | | |
| - | | |
| 23 | |
| | |
| | | |
| | | |
| | | |
| | | |
| | | |
| | | |
| | | |
| | | |
| | | |
| | |
| Foreign currency translation adjustment | |
| - | | |
| - | | |
| - | | |
| - | | |
| - | | |
| (166 | ) | |
| - | | |
| (166 | ) | |
| - | | |
| (166 | ) |
| | |
| | | |
| | | |
| | | |
| | | |
| | | |
| | | |
| | | |
| | | |
| | | |
| | |
| Net loss | |
| - | | |
| - | | |
| - | | |
| - | | |
| - | | |
| - | | |
| (1,568 | ) | |
| (1,568 | ) | |
| (102 | ) | |
| (1,670 | ) |
| | |
| | | |
| | | |
| | | |
| | | |
| | | |
| | | |
| | | |
| | | |
| | | |
| | |
| Balances, March 31, 2021 | |
| - | | |
$ | - | | |
| 11,504 | | |
$ | 12 | | |
$ | 211,686 | | |
$ | (570 | ) | |
$ | (197,726 | ) | |
$ | 13,402 | | |
$ | (3,325 | ) | |
$ | 10,077 | |
| | |
| | | |
| | | |
| | | |
| | | |
| | | |
| | | |
| | | |
| | | |
| | | |
| | |
| Stock-based compensation | |
| - | | |
| - | | |
| - | | |
| - | | |
| 22 | | |
| - | | |
| - | | |
| 22 | | |
| - | | |
| 22 | |
| | |
| | | |
| | | |
| | | |
| | | |
| | | |
| | | |
| | | |
| | | |
| | | |
| | |
| Foreign currency translation adjustment | |
| - | | |
| - | | |
| - | | |
| - | | |
| - | | |
| 56 | | |
| - | | |
| 56 | | |
| - | | |
| 56 | |
| | |
| | | |
| | | |
| | | |
| | | |
| | | |
| | | |
| | | |
| | | |
| | | |
| | |
| Net loss | |
| - | | |
| - | | |
| - | | |
| - | | |
| - | | |
| - | | |
| (1,657 | ) | |
| (1,657 | ) | |
| (179 | ) | |
| (1,836 | ) |
| | |
| | | |
| | | |
| | | |
| | | |
| | | |
| | | |
| | | |
| | | |
| | | |
| | |
| Balances, June 30, 2021 | |
| - | | |
$ | - | | |
| 11,504 | | |
$ | 12 | | |
$ | 211,708 | | |
$ | (514 | ) | |
$ | (199,383 | ) | |
$ | 11,823 | | |
$ | (3,504 | ) | |
$ | 8,319 | |
| | |
| | | |
| | | |
| | | |
| | | |
| | | |
| | | |
| | | |
| | | |
| | | |
| | |
| Issuance of common stock under the ATM | |
| - | | |
| - | | |
| 94 | | |
| - | | |
| 593 | | |
| - | | |
| - | | |
| 593 | | |
| - | | |
| 593 | |
| | |
| | | |
| | | |
| | | |
| | | |
| | | |
| | | |
| | | |
| | | |
| | | |
| | |
| Stock-based compensation | |
| - | | |
| - | | |
| 13 | | |
| - | | |
| 46 | | |
| - | | |
| - | | |
| 46 | | |
| - | | |
| 46 | |
| | |
| | | |
| | | |
| | | |
| | | |
| | | |
| | | |
| | | |
| | | |
| | | |
| | |
| Foreign currency translation adjustment | |
| - | | |
| - | | |
| - | | |
| - | | |
| - | | |
| (37 | ) | |
| - | | |
| (37 | ) | |
| - | | |
| (37 | ) |
| | |
| | | |
| | | |
| | | |
| | | |
| | | |
| | | |
| | | |
| | | |
| | | |
| | |
| Net loss | |
| - | | |
| - | | |
| - | | |
| - | | |
| - | | |
| - | | |
| (1,721 | ) | |
| (1,721 | ) | |
| (135 | ) | |
| (1,856 | ) |
| | |
| | | |
| | | |
| | | |
| | | |
| | | |
| | | |
| | | |
| | | |
| | | |
| | |
| Balances, September 30, 2021 | |
| - | | |
$ | - | | |
| 11,611 | | |
$ | 12 | | |
$ | 212,347 | | |
$ | (551 | ) | |
$ | (201,104 | ) | |
$ | 10,704 | | |
$ | (3,639 | ) | |
$ | 7,065 | |
NEONODE INC.
CONDENSED CONSOLIDATED STATEMENTS OF CASH FLOWS
(In thousands)
(Unaudited)
| | |
Nine months ended
September 30, | |
| | |
2021 | | |
2020 | |
| Cash flows from operating activities: | |
| | |
| |
| Net loss (including noncontrolling interests) | |
$ | (5,362 | ) | |
$ | (4,626 | ) |
| Adjustments to reconcile net loss to net cash used in operating activities: | |
| | | |
| | |
| Stock-based compensation expense | |
| 91 | | |
| - | |
| Depreciation and amortization | |
| 530 | | |
| 567 | |
| Amortization of operating lease right-of-use assets | |
| 386 | | |
| 289 | |
| Changes in operating assets and liabilities: | |
| | | |
| | |
| Accounts receivable and unbilled revenue, net | |
| 970 | | |
| 284 | |
| Projects in process | |
| - | | |
| (3 | ) |
| Inventory | |
| (1,249 | ) | |
| (55 | ) |
| Prepaid expenses and other current assets | |
| 524 | | |
| (248 | ) |
| Accounts payable and accrued expenses | |
| (371 | ) | |
| 310 | |
| Deferred revenues | |
| (1 | ) | |
| 73 | |
| Operating lease obligations | |
| (492 | ) | |
| (298 | ) |
| Net cash used in operating activities | |
| (4,974 | ) | |
| (3,707 | ) |
| | |
| | | |
| | |
| Cash flows from investing activities: | |
| | | |
| | |
| Purchase of property and equipment | |
| (67 | ) | |
| (17 | ) |
| Net cash used in investing activities | |
| (67 | ) | |
| (17 | ) |
| | |
| | | |
| | |
| Cash flows from financing activities: | |
| | | |
| | |
| Proceeds from issuance of preferred and common stock, net of offering costs | |
| 593 | | |
| 13,530 | |
| Proceeds from short term borrowings | |
| - | | |
| 966 | |
| Proceeds from short term tax credits | |
| - | | |
| 542 | |
| Payments on short term borrowings | |
| - | | |
| (516 | ) |
| Payments on short term tax credits | |
| - | | |
| (557 | ) |
| Principal payments on finance lease obligations | |
| (426 | ) | |
| (185 | ) |
| Payment of preferred dividend | |
| - | | |
| (2 | ) |
| Net cash provided by (used in) financing activities | |
| 167 | | |
| 13,778 | |
| | |
| | | |
| | |
| Effect of exchange rate changes on cash | |
| (103 | ) | |
| (199 | ) |
| | |
| | | |
| | |
| Net increase (decrease) in cash | |
| (4,977 | ) | |
| 9,855 | |
| Cash at beginning of period | |
| 10,473 | | |
| 2,357 | |
| Cash at end of period | |
$ | 5,496 | | |
$ | 12,212 | |
| | |
| | | |
| | |
| Supplemental disclosure of cash flow information: | |
| | | |
| | |
| Cash paid for income taxes | |
$ | 104 | | |
$ | 10 | |
| Cash paid for interest | |
$ | 11 | | |
$ | 25 | |
| Supplemental disclosure of non-cash investing and financing activities: | |
| | | |
| | |
| Short-term borrowings and accrued interest settled for Series C-2 Preferred Stock | |
$ | - | | |
$ | 516 | |
| Accrual of dividends | |
$ | - | | |
$ | 31 | |
| Right-of-use asset obtained in exchange for lease obligation | |
$ | - | | |
$ | 25 | |
8
Exhibit
99.2
3Q 2021 Earnings Call November 10, 2021
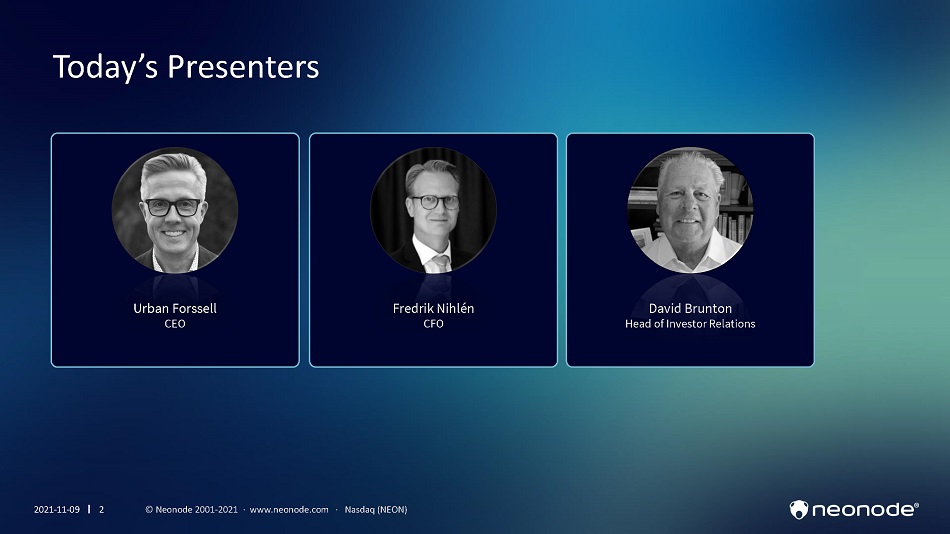
Today’s Presenters Ur ban Forssell CEO Fr edr ik Ni h lén CFO Dav id B ru nt o n Head of Investor Relations 2021 - 11 - 09 2 © Neonode 2001 - 2021 · www.neonode.com · Nasdaq (NEON)
Legal Disclaimer 2021 - 11 - 09 3 © Neonode 2001 - 2021 · www.neonode.com · Nasdaq (NEON) This presentation contains, and related oral and written statements of Neonode Inc. (the “Company”) and its management may contain, forward - looking statements within the meaning of the Private Securities Litigation Reform Act of 1995. Forward - looking statements include information about current expectations, strategy, plans, potential financial performance or future events. They also may include statements about market opportunity and sales growth, financial results, use of free cash flow, product development and introduction, regulatory matters and sales efforts. Forward - looking statements are based on assumptions, expectations and information available to the Company and its management and involve a number of known and unknown risks, uncertainties and other factors that may cause the Company’s actual results, levels of activity, performance or achievements to be materially different from any expressed or implied by these forward - looking statements. These uncertainties and risks include, but are not limited to, our ability to secure financing when needed on acceptable terms, risks related to new product development, our ability to protect our intellectual property, our ability to compete, as well as other risks outlined in filings of the Company with the U.S. Securities and Exchange Commission (the “SEC”) under the Securities Exchange Act of 1934, as amended, including the sections entitled “Risk Factors” and “Management’s Discussion and Analysis of Financial Condition and Results of Operations.” Prospective investors are advised to carefully consider these various risks, uncertainties and other factors. Any forward - looking statements included in this presentation are made as of today’s date. The Company and its management undertake no duty to update or revise forward - looking statements. This presentation has been prepared by the Company based on its own information, as well as information from public sources. Certain of the information contained herein may be derived from information provided by industry sources. The Company believes such information is accurate and that the sources from which it has been obtained are reliable. However, the Company has not independently verified such information and cannot guarantee the accuracy of such information.
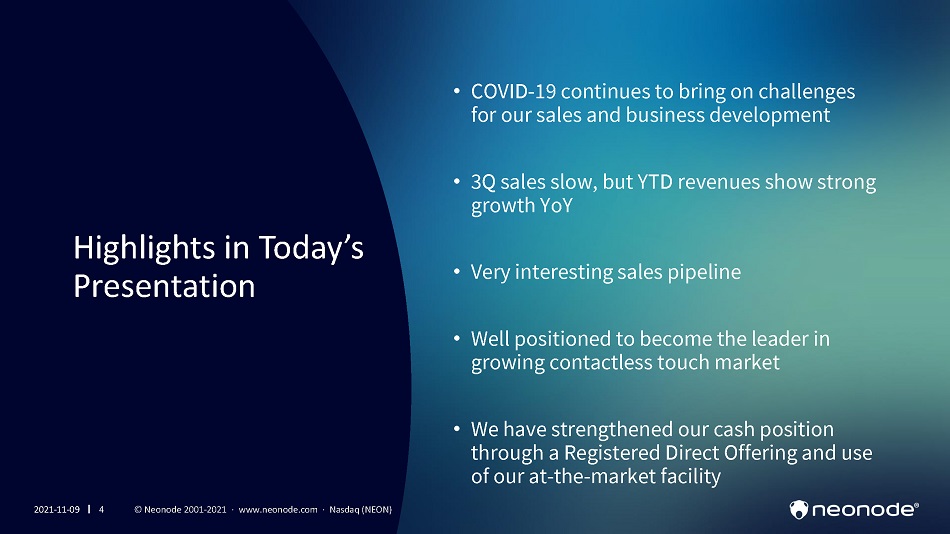
Highlights in Today’s Presentation 2021 - 11 - 09 4 © Neonode 2001 - 2021 · www.neonode.com · Nasdaq (NEON) • COVID - 19 continues to bring on challenges for our sales and business development • 3Q sales slow, but YTD revenues show strong growth YoY • Very interesting sales pipeline • Well positioned to become the leader in growing contactless touch market • We have strength ened our cash p osition through a Registered Direct Offering and use of our at - the - market facility
4 3Q Financials Update 5 Q&A Concluding Remarks 2 Registered Direct Offering 3 Business and Strategy Update 1 2021 - 11 - 09 5 © Neonode 2001 - 2021 · www.neonode.com · Nasdaq (NEON)
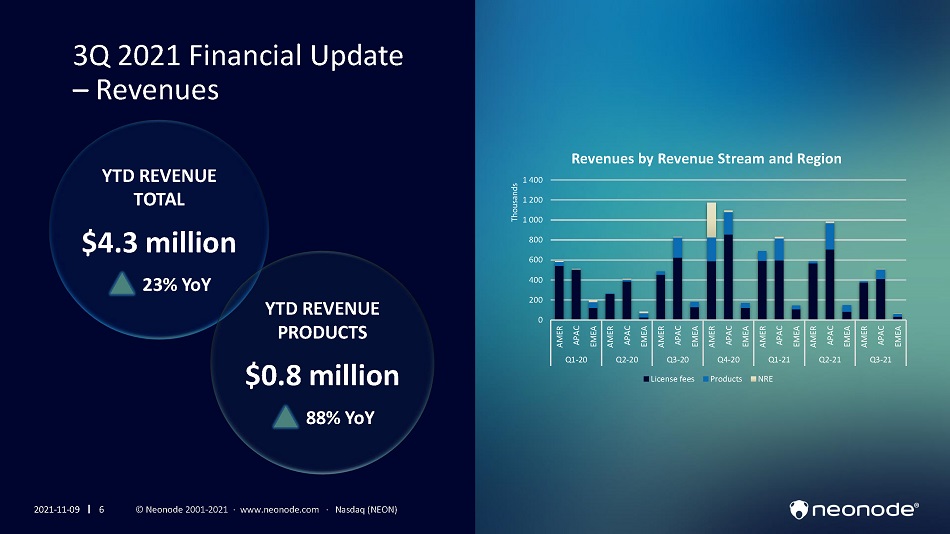
3Q 2021 Financial Update – Revenues YTD REVENUE TOTAL $4.3 million 23% YoY YTD REVENUE PRODUCTS $0.8 million 88% YoY 0 200 400 600 800 1 000 1 200 1 400 A M E R A P A C EM E A A M E R A P A C EM E A A M E R A P A C EM E A A M E R APAC EM E A A M E R A P A C EM E A A M E R A P A C E M E A A M E R APAC EM E A Q 1 - 20 Q 2 - 20 Q 3 - 20 Q 4 - 20 Q 1 - 21 Q 2 - 21 Q 3 - 21 T h o us a nd s Revenues by Revenue Stream and Region L i c e n s e fe e s Pr o d u cts N RE 2021 - 11 - 09 6 © Neonode 2001 - 2021 · www.neonode.com · Nasdaq (NEON)
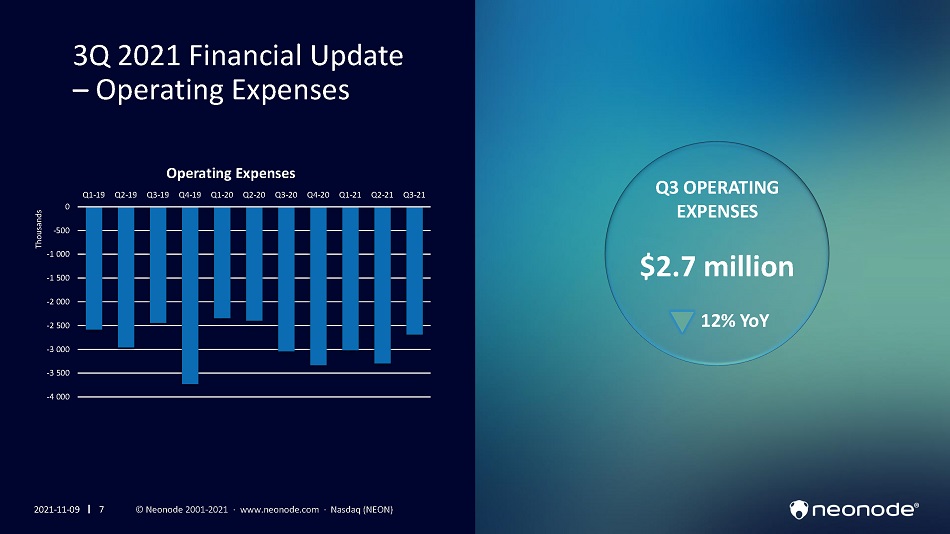
Q3 OPERATING EXPENSES $2.7 million 12% YoY 3Q 2021 Financial Update – Operating Expenses - 3 0 0 0 - 3 5 0 0 - 4 0 0 0 2021 - 11 - 09 7 © Neonode 2001 - 2021 · www.neonode.com · Nasdaq (NEON) - 2 5 0 0 - 2 0 0 0 - 1 5 00 - 1 0 0 0 - 500 0 T h o us a nd s Operating Expenses Q1 - 19 Q2 - 19 Q3 - 19 Q4 - 19 Q1 - 20 Q2 - 20 Q3 - 20 Q4 - 20 Q1 - 21 Q2 - 21 Q3 - 21
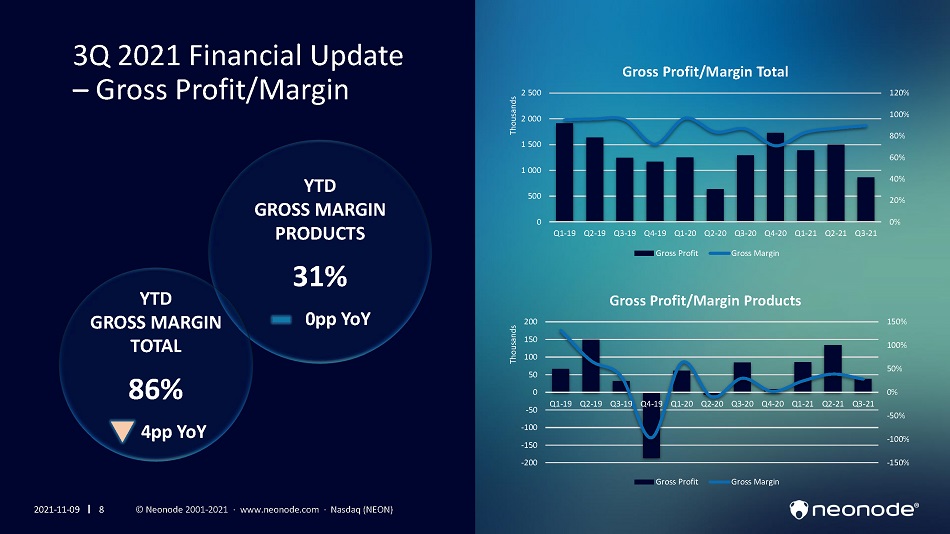
YTD GROSS MARGIN PRODUCTS 31% 0pp YoY YTD GROSS MARGIN TOTAL 86% 4pp YoY 3Q 2021 Financial Update – Gross Profit/Margin 0% 20% 40% 60% 80% 100% 120% 0 500 1 000 1 500 2 000 2 500 Q 1 - 19 Q 1 - 21 Q 2 - 21 Q 3 - 21 T h o us a nd s Gross Profit/Margin Total Q2 - 19 Q3 - 19 Q4 - 19 Q1 - 20 Q2 - 20 Q3 - 20 Q4 - 20 Gross Profit Gross Margin - 15 0 % - 10 0 % - 50% 0% 50% 100% 150% - 200 - 150 - 100 - 50 0 50 100 150 200 Q 1 - 1 9 Q 2 - 1 9 Q 3 - 1 9 Q 4 - 1 9 Q 1 - 2 0 Q 2 - 2 0 Q 3 - 2 0 Q 4 - 2 0 Q 1 - 2 1 Q 2 - 2 1 Q 3 - 2 1 T h o us a nd s Gross Profit/Margin Products G r o s s P r o fit Gross Margin 2021 - 11 - 09 8 © Neonode 2001 - 2021 · www.neonode.com · Nasdaq (NEON)
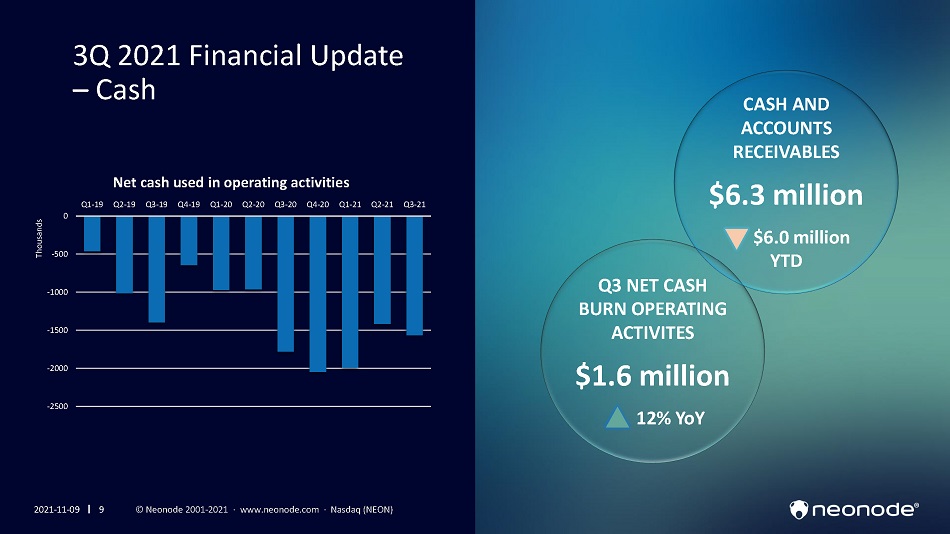
3Q 2021 Financial Update – Cash Q3 NET CASH BURN OPERATING ACTIVITES $1.6 million 12% YoY CASH AND ACCOUNTS R E C E I V ABL E S $6.3 million $6.0 million YTD - 25 0 0 2021 - 11 - 09 9 © Neonode 2001 - 2021 · www.neonode.com · Nasdaq (NEON) - 20 0 0 - 15 0 0 - 10 0 0 - 500 0 Thousands Net cash used in operating activities Q 1 - 19 Q 2 - 19 Q 3 - 19 Q 4 - 19 Q 1 - 20 Q 2 - 20 Q 3 - 20 Q 4 - 20 Q 1 - 21 Q 2 - 21 Q 3 - 21
2 4 1 3Q Financials Update 5 Q&A Concluding Remarks 3 Business and Strategy Update 2021 - 11 - 09 10 © Neonode 2001 - 2021 · www.neonode.com · Nasdaq (NEON) Registered Direct Offering
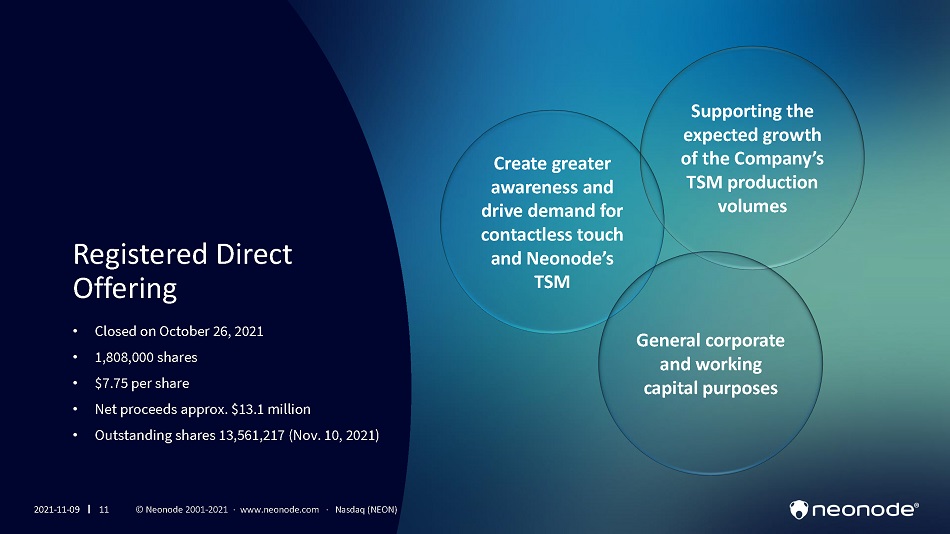
Registered Direct Offering • Closed on October 26, 2021 • 1,808,000 shares • $7.75 per share • Net proceeds approx. $13.1 million • Outstanding shares 13,561,217 (Nov. 10, 2021) Create greater awareness and drive demand for contactless touch and Neonode’s TSM Supporting the expected growth of the Company’s TSM production volumes General corporate and working capital purposes 2021 - 11 - 09 11 © Neonode 2001 - 2021 · www.neonode.com · Nasdaq (NEON)
4 1 3Q Financials Update 5 Q&A Concluding Remarks 2 Registered Direct Offering 3 Business and Strategy Update 2021 - 11 - 09 12 © Neonode 2001 - 2021 · www.neonode.com · Nasdaq (NEON)

Vision: To transform the way humans interact with machines 2021 - 11 - 09 13 © Neonode 2001 - 2021 · www.neonode.com · Nasdaq (NEON)
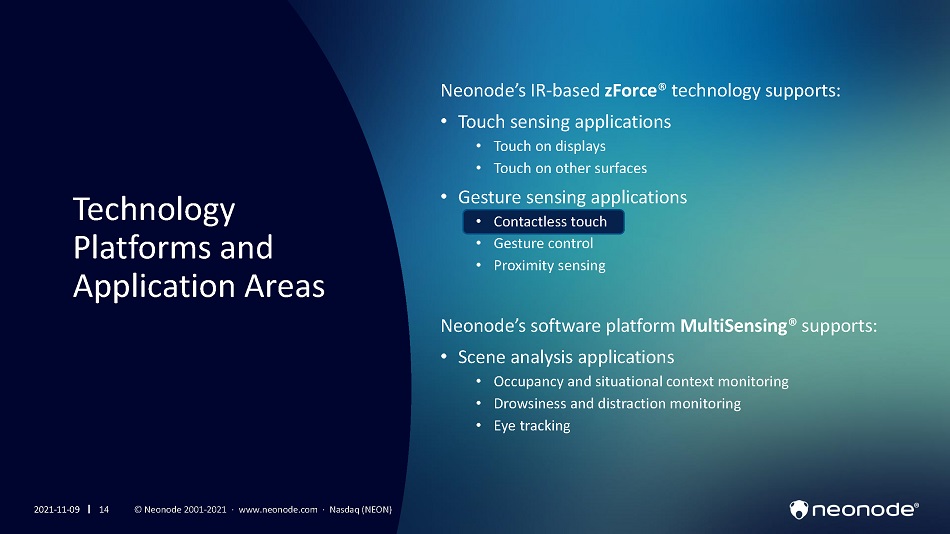
Technology Platforms and Application Areas 2021 - 11 - 09 14 © Neonode 2001 - 2021 · www.neonode.com · Nasdaq (NEON) Neonode’s IR - based zForce ® technology supports: • Touch sensing applications • Touch on displays • Touch on other surfaces • Gesture sensing applications • Contactless touch • Gesture control • Proximity sensing Neonode’s software platform MultiSensing ® supports: • Scene analysis applications • Occupancy and situational context monitoring • Drowsiness and distraction monitoring • Eye tracking

2021 - 11 - 09 15 What is Contactless Touch? Contactless, but “touch - like”, interaction w L it o h d r is e pl m ays, k i e p yp s a u ds m , butt d on o s a l n o d r sit holographic images. With our Touch Sensor Modules natural, easy - to - use contactless touch features can be created in a simple and cost - effective way. © Neonode 2001 - 2021 · www.neonode.com · · N N as addsadaqaqq (N (N E OEOONN ) )
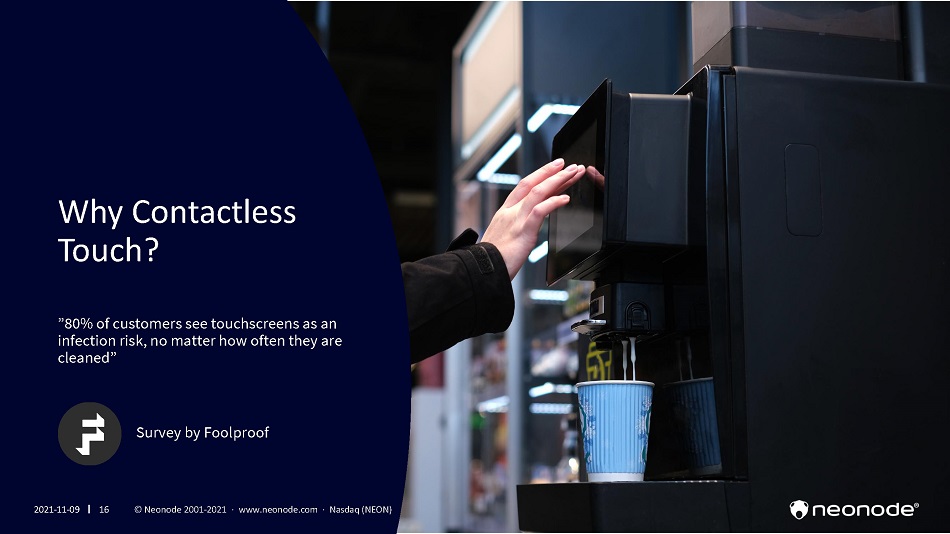
Why Contactless Touch? Lorem ”80% of customers see touchscreens as an infection risk, no matter how often they are cleaned” Survey by Foolproof ipsum dolor sit eonode 2001 - 2021eonode 2001 - 2021 · www.neonode.com · Nasdaq (NEON)· www.neonode.com · Nasdaq (NEON) 2021 - 11 - 09 16 © N eonode 2001 - 2021 · www.neonode.com · Nasdaq (NEON)
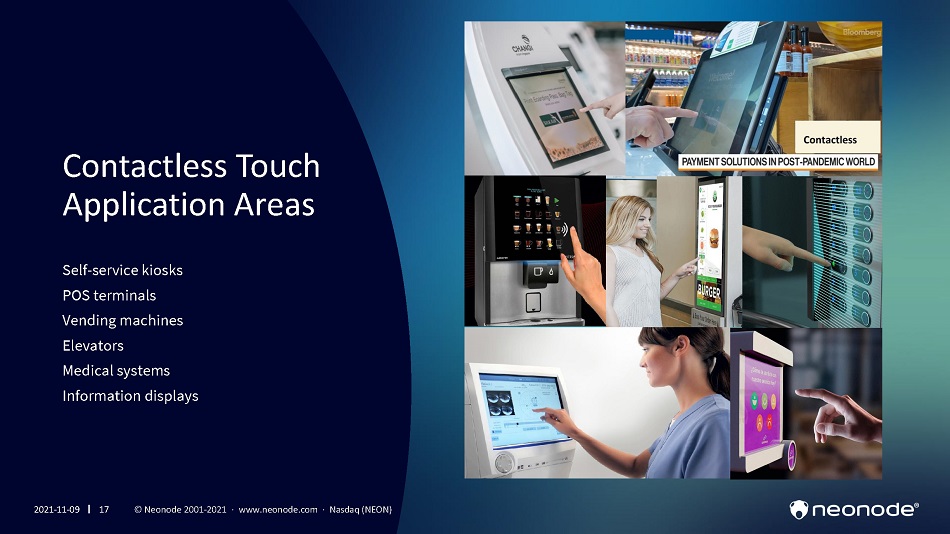
Contactless Touch Application Areas Sel f - service kiosks POS terminals V end in g machines Elevators Medical systems Information displays 2021 - 11 - 09 17 © Neonode 2001 - 2021 · www.neonode.com · Nasdaq (NEON)
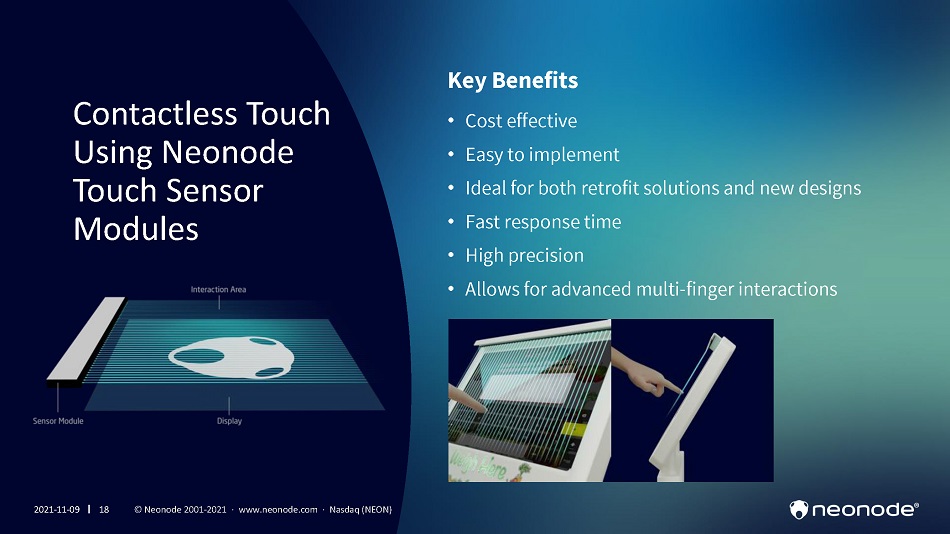
Contactless Touch Using Neonode Touch Sensor Modules Key Benefits • Cost effective • Easy to implement • Ideal for both retrofit solutions and new designs • Fast response time • High precision • Allows for advanced multi - finger interactions 2021 - 11 - 09 18 © Neonode 2001 - 2021 · www.neonode.com · Nasdaq (NEON)
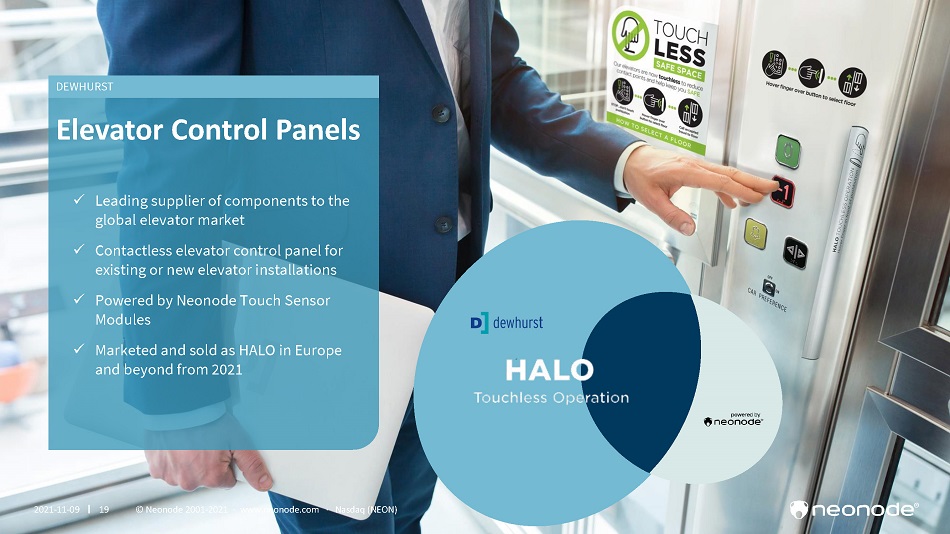
x Leading supplier of components to the global elevator market x Contactless elevator control panel for existing or new elevator installations x Powered by Neonode Touch Sensor Modules x Marketed and sold as HALO in Europe and beyond from 2021 DEWHURST 2021 - 11 - 09 19 © Neonode 2001 - 2021 · www.neonode.com · Nasdaq (NEON) Elevator Control Panels
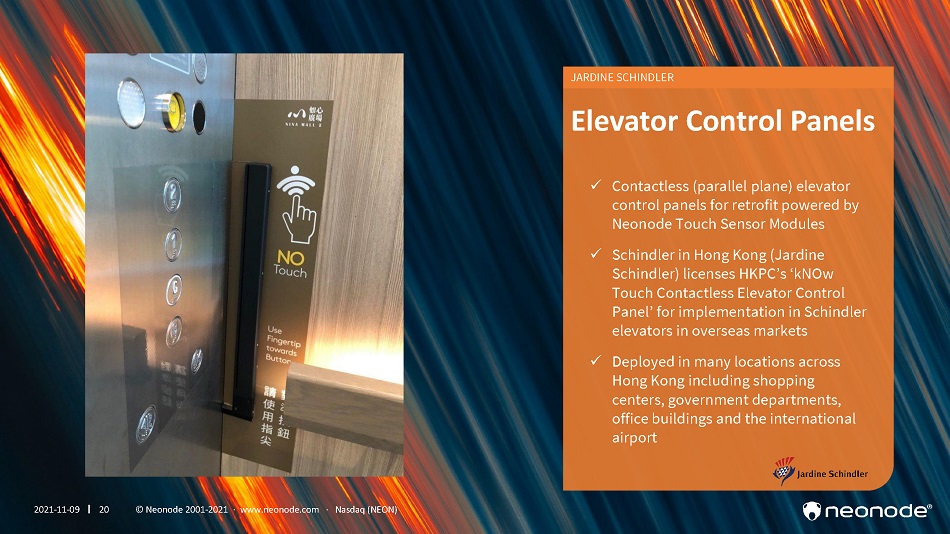
x Contactless (parallel plane) elevator control panels for retrofit powered by Neonode Touch Sensor Modules x Schindler in Hong Kong (Jardine Schindler) licenses HKPC’s ‘kNOw Touch Contactless Elevator Control Panel’ for implementation in Schindler elevators in overseas markets x Deployed in many locations across Hong Kong including shopping centers, government departments, office buildings and the international airport J A R D I N E S CH I N D L ER 2021 - 11 - 09 20 © Neonode 2001 - 2021 · www.neonode.com · Nasdaq (NEON) Elevator Control Panels
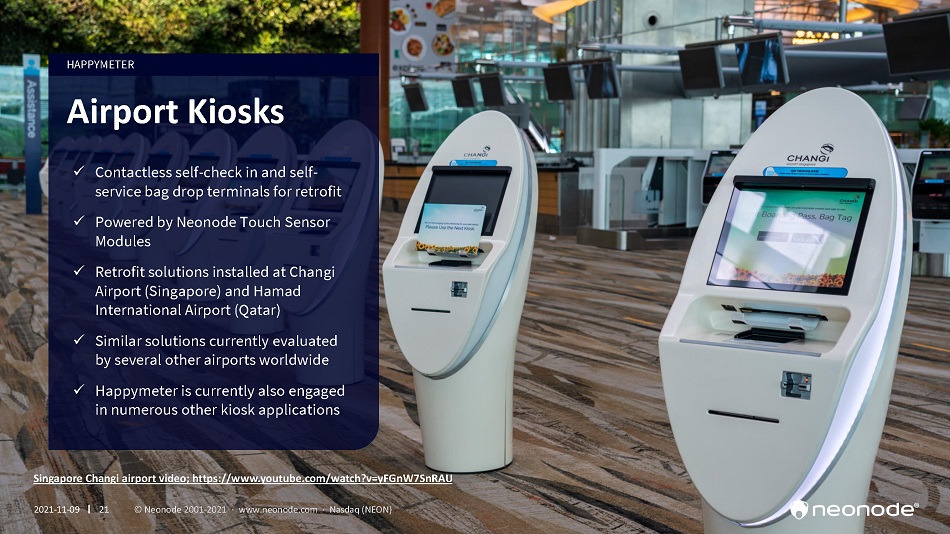
HAPPYMETER 2021 - 11 - 09 21 © Neonode 2001 - 2021 · www.neonode.com · Nasdaq (NEON) Airport Kiosks x Contactless self - check in and self - service bag drop terminals for retrofit x Powered by Neonode Touch Sensor Modules x Retrofit solutions installed at Changi Airport (Singapore) and Hamad International Airport (Qatar) x Similar solutions currently evaluated by several other airports worldwide x Happymeter is currently also engaged in numerous other kiosk applications Singapore Changi airport video; https://www.youtube.com/watch?v=yFGnW7SnRAU
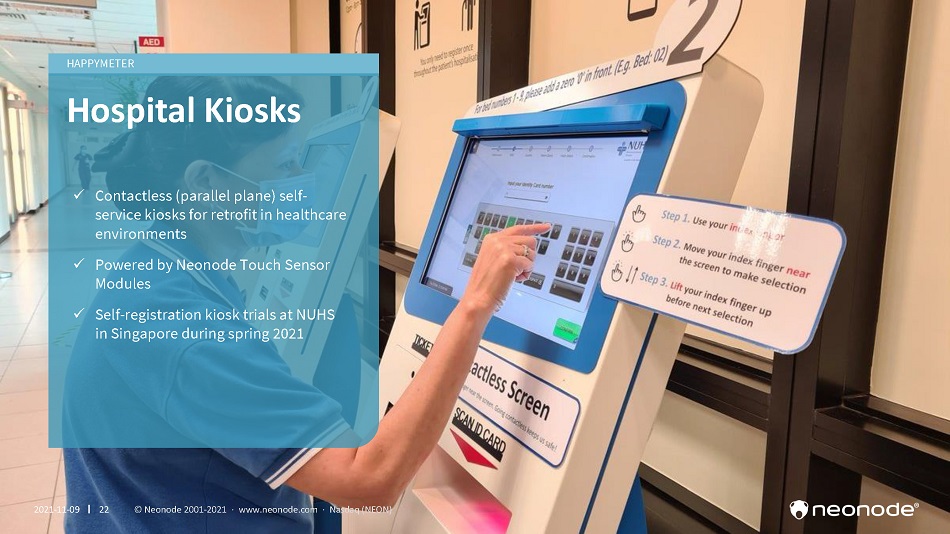
HAPPYMETER 2021 - 11 - 09 22 © Neonode 2001 - 2021 · www.neonode.com · Nasdaq (NEON) Hospital Kiosks x Contactless (parallel plane) self - service kiosks for retrofit in healthcare environments x Powered by Neonode Touch Sensor Modules x Self - registration kiosk trials at NUHS in Singapore during spring 2021
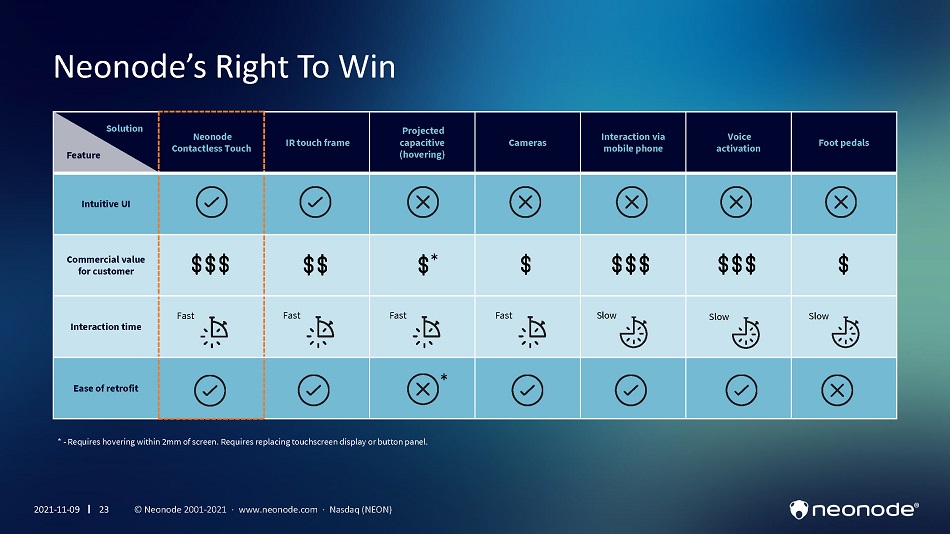
Wh y Ne ono e? ( h o v eri n g ) * - Requires hovering within 2mm of screen. Requires replacing touchscreen display or button panel. Solution Feature Neonode Contactless Touch IR touch frame Projected capacitive Cameras I n teraction v ia m o b ile p h o n e Voice activation Foot pedals Intuitive UI d C om m ercial v alue for customer * Interaction time Fast Fast Fast Fast Slow Slow Slow Ease of retrofit * Neonode’s Right To Win 2021 - 11 - 09 23 © Neonode 2001 - 2021 · www.neonode.com · Nasdaq (NEON)
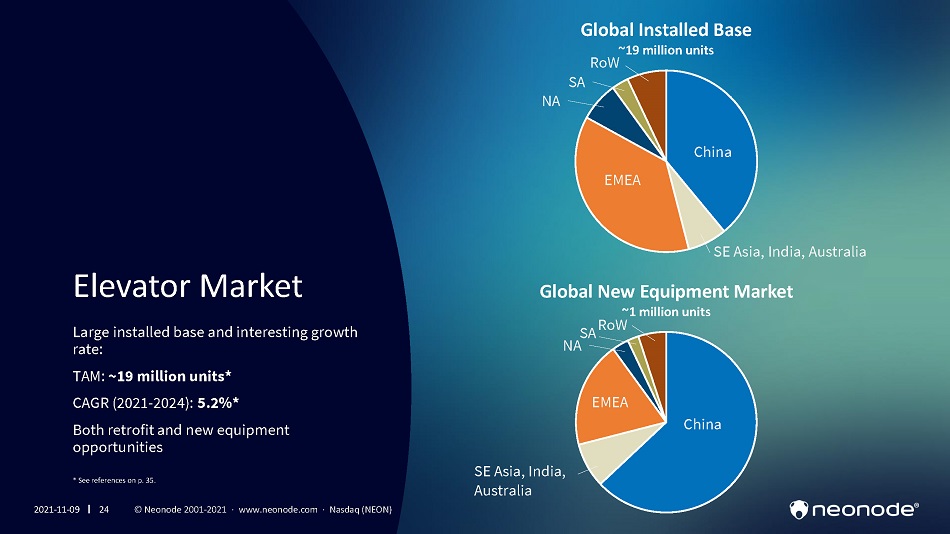
Elevator Market Large installed base and interesting growth rate: TAM: ~19 million units* CAGR (2021 - 2024): 5.2%* Both retrofit and new equipment opportunities Global Installed Base ~19 million units Global New Equipment Market ~1 million units SE Asia, India, Australia RoW SA NA China EMEA China EMEA SE Asia, India, Australia NA SA RoW * See references on p. 35. 2021 - 11 - 09 24 © Neonode 2001 - 2021 · www.neonode.com · Nasdaq (NEON)
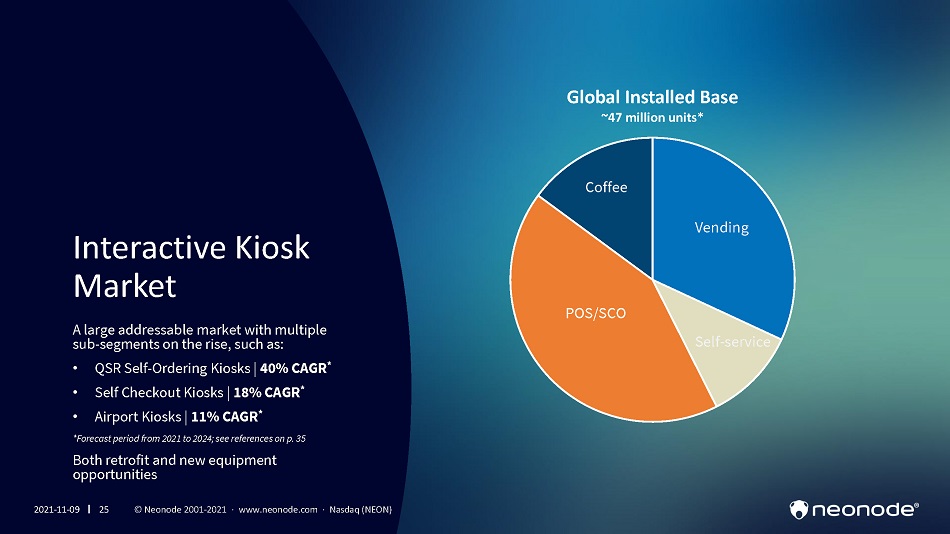
Interactive Kiosk Market A la r ge a d d r e s s able mark e t with multi p le sub - segments on the rise, such as: • QSR S elf - O r d e r ing K io s ks | 40% C A GR * • Sel f C heckout K io s ks | 18% C A GR * • Air p ort K iosks | 11% CAG R * * F o r eca s t p e r i o d f r o m 2021 to 2024; s ee r ef e r e nces o n p . 35 Both retrofit and new equipment opportunities Global Installed Base ~47 million units* 2021 - 11 - 09 25 © Neonode 2001 - 2021 · www.neonode.com · Nasdaq (NEON) Ven d i n g Se lf - servi c e PO S/ SCO Cof fee
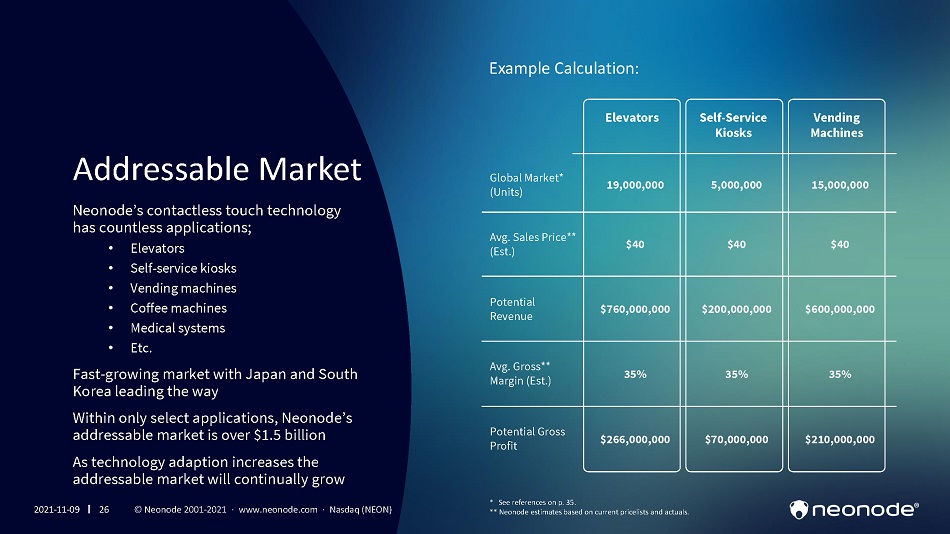
Glo b a l M a r k et* (Units) Elevators Self - Ser v ice Kiosks Vending Ma c hines 19,000,000 5,000,000 15,000,000 A vg. Sa les Pr i ce** (Est.) $40 $40 $40 Potential Revenue $760,000,000 $200,000,000 $600,000,000 A vg. G r oss** M a rgin (Est.) 35% 35% 35% Potent i a l Gross Profit $266,000,000 $70,000,000 $210,000,000 Addressable Market Neonode’s contactless touch technology has countless applications; • Elevators • S el f - ser vice kiosks • Vending machines • Co f fee machines • Medical systems • Etc. Fast - growing market with Japan and South Korea leading the way Within only select applications, Neonode’s addressable market is over $1.5 billion As technology adaption increases the addressable market will continually grow 2021 - 11 - 09 26 © Neonode 2001 - 2021 · www.neonode.com · Nasdaq (NEON) Example Calculation: * See references on p. 35. ** Neonode estimates based on current pricelists and actuals.
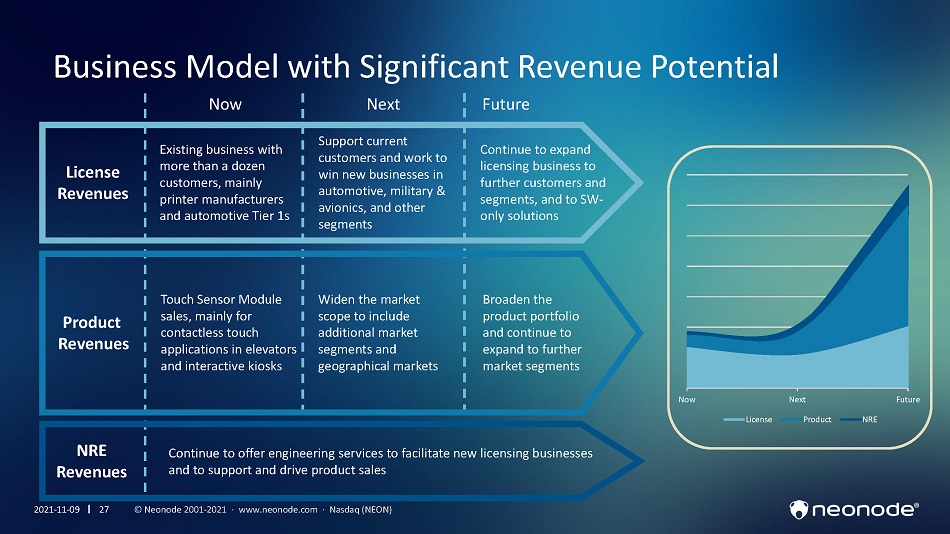
Continue to offer engineering services to facilitate new licensing businesses and to support and drive product sales License R e v en ue s Product R e v en u e s NRE Revenues N o w N e x t Futu r e Existing business with more than a dozen customers, mainly printer manufacturers and automotive Tier 1s Support current customers and work to win new businesses in automotive, military & avionics, and other segments Continue to expand licensing business to further customers and segments, and to SW - only solutions Touch Sensor Module sales, mainly for contactless touch applications in elevators and interactive kiosks Broaden the product portfolio and continue to expand to further market segments Widen the market scope to include additional market segments and g eog r a ph i c al m ar k e ts Business Model with Significant Revenue Potential N ow N e x t F u t u r e License Product N RE 2021 - 11 - 09 27 © Neonode 2001 - 2021 · www.neonode.com · Nasdaq (NEON)
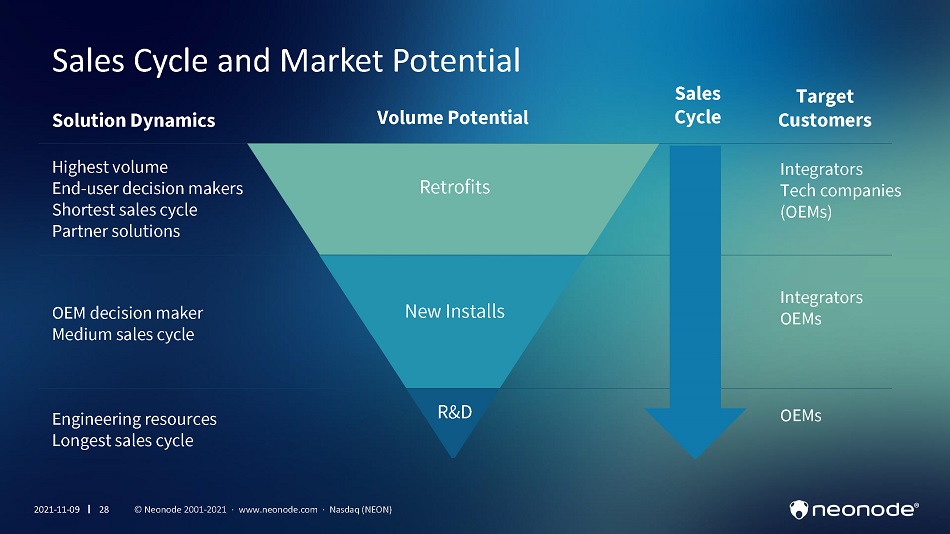
Sales Cycle and Market Potential Retrofits New Ins t alls R&D Highest volume End - user decision makers Shortest sales cycle Partner solutions Sales Cycle OEM d e cision m aker Medium sales cycle Engine e ring resourc e s Longest sales cycle 2021 - 11 - 09 28 © Neonode 2001 - 2021 · www.neonode.com · Nasdaq (NEON) So lution Dynamics Target Custome rs Integrators T e ch co m p anies (OEMs) I ntegr a tors OEMs OEMs Volume Potential
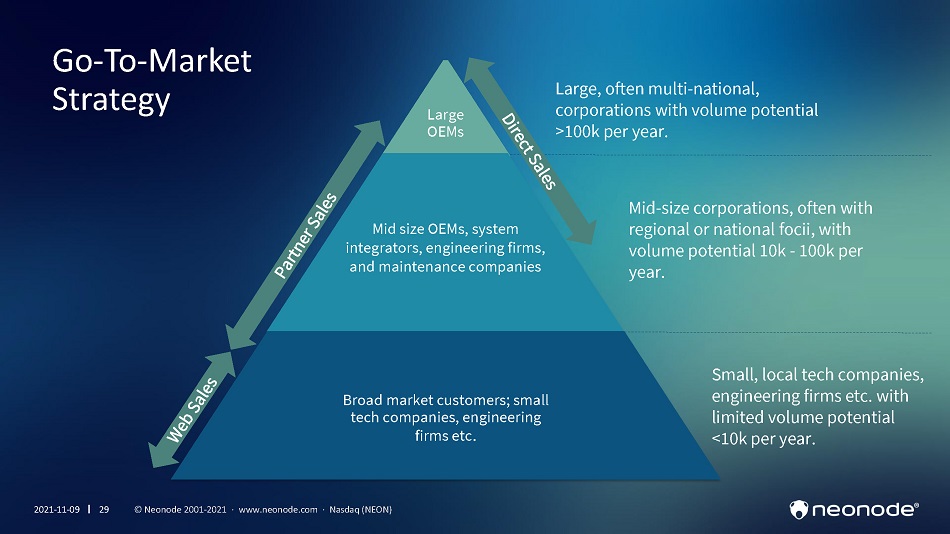
Large O E Ms Broad market customers; small tech companies, engineering firms etc . Mi d si z e O E Ms , sys tem integrators, engineering firms, and maintenance companies Large, often multi - national, corporations with volume potential >100k per year. Mid - size corporations, often with regional or national focii, with volume potential 10k - 100k per year. Small, local tech companies, engineering firms etc. with limited volume potential <10k per year. Go - T o - Mar k e t Strategy 2021 - 11 - 09 29 © Neonode 2001 - 2021 · www.neonode.com · Nasdaq (NEON)
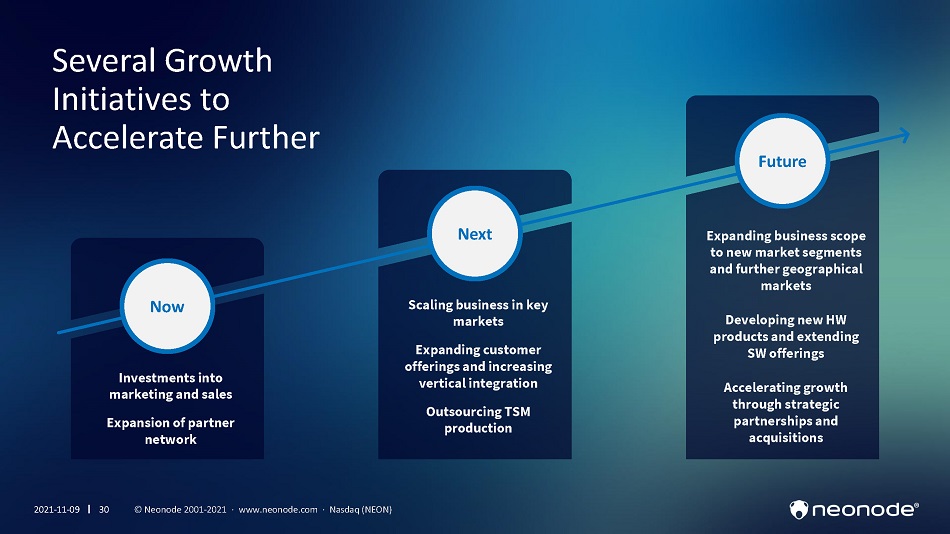
F u tu r e Investments into market ing and sa l e s Expansion of pa r tn e r network Scaling business in key markets Expanding customer off e r ing s and incr e as ing vertical integration O u ts o u r c ing TSM production Exp a nd ing busin e ss s c op e to new market segments and further geographical markets Developing new HW p r od uct s and e xt e nd ing SW offerings Acc e l e r a ting g r owt h through strategic par tne r ships and acquisitions N e xt N o w 2021 - 11 - 09 30 © Neonode 2001 - 2021 · www.neonode.com · Nasdaq (NEON) Several Growth Initiatives to Accelerate Further
4 1 3Q Financials Update 5 Q&A Co n clu d ing Remarks 2 Registered Direct Offering 3 Business and Strategy Update 2021 - 11 - 09 31 © Neonode 2001 - 2021 · www.neonode.com · Nasdaq (NEON)
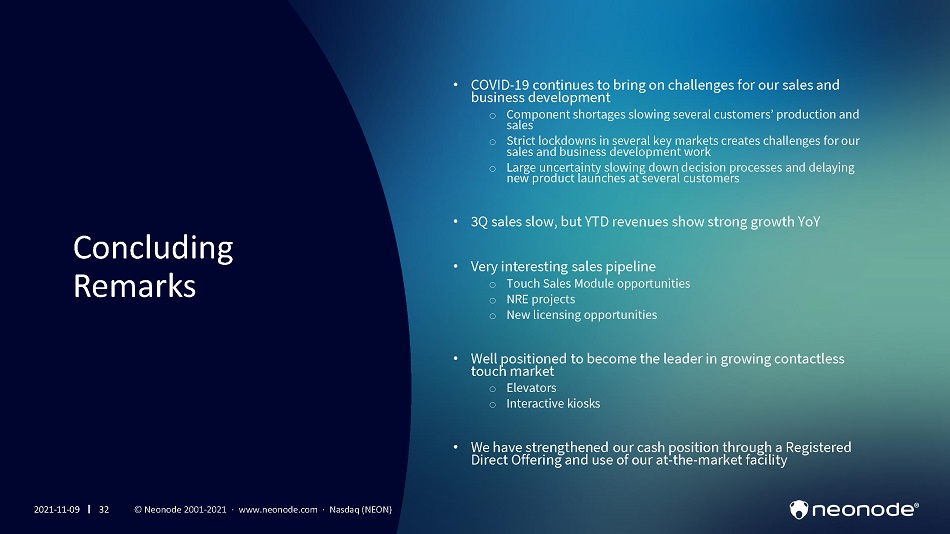
Concl u di n g Remarks 2021 - 11 - 09 32 © Neonode 2001 - 2021 · www.neonode.com · Nasdaq (NEON) • COVID - 19 continues to bring on challenges for our sales and business development o Component shortages slowing several customers’ production and sales o Strict lockdowns in several key markets creates challenges for our sales and business development work o Large uncertainty slowing down decision processes and delaying new product launches at several customers • 3Q sales slow, but YTD revenues show strong growth YoY • Very interesting sales pipeline o Touch Sales Module opportunities o NRE projects o New licensing opportunities • Well positioned to become the leader in growing contactless touch m a r ket o E l e v a t o r s o Interactive kiosks • We have strengthened our cash position through a Registered Direct Offering and use of our at - the - market facility
4 5 1 3Q Financials Update Q&A Concluding Remarks 2 Registered Direct Offering 3 Business and Strategy Update 2021 - 11 - 09 33 © Neonode 2001 - 2021 · www.neonode.com · Nasdaq (NEON)

Ap p endix 2021 - 11 - 09 34 © Neonode 2001 - 2021 · www.neonode.com · Nasdaq (NEON)
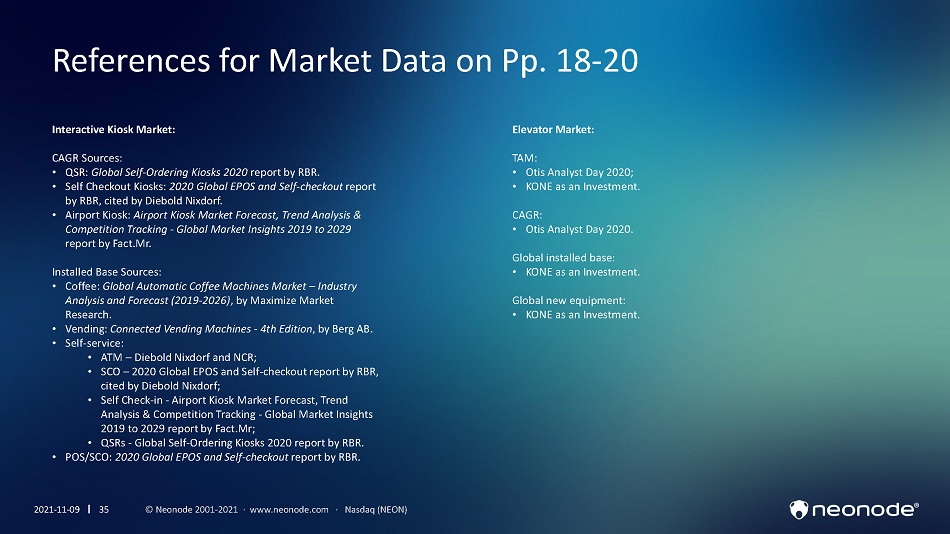
References for Market Data on Pp. 18 - 20 2021 - 11 - 09 35 © Neonode 2001 - 2021 · www.neonode.com · Nasdaq (NEON) El e v a t or M a r k e t: TAM: • Otis Analyst Day 2020; • KONE as an Investment. CAGR: • Otis Analyst Day 2020. Global installed base: • KONE as an Investment. Global new equipment: • KONE as an Investment. Interactive Kiosk Market: CAGR Sources: • QSR: Global Self - Ordering Kiosks 2020 report by RBR. • Self Checkout Kiosks: 2020 Global EPOS and Self - checkout report by RBR, cited by Diebold Nixdorf. • Airport Kiosk: Airport Kiosk Market Forecast, Trend Analysis & Competition Tracking - Global Market Insights 2019 to 2029 report by Fact.Mr. Installed Base Sources: • Coffee: Global Automatic Coffee Machines Market – Industry Analysis and Forecast (2019 - 2026) , by Maximize Market Research. • Vending: Connected Vending Machines - 4th Edition , by Berg AB. • Self - service: • ATM – Diebold Nixdorf and NCR; • SCO – 2020 Global EPOS and Self - checkout report by RBR, cited by Diebold Nixdorf; • Self Check - in - Airport Kiosk Market Forecast, Trend Analysis & Competition Tracking - Global Market Insights 2019 to 2029 report by Fact.Mr; • QSRs - Global Self - Ordering Kiosks 2020 report by RBR. • POS/SCO: 2020 Global EPOS and Self - checkout report by RBR.

[email protected] neonode.com Subsc r ibe to N e onode n e w s let te r Thank you! 2021 - 11 - 09 36 © Neonode 2001 - 2021 · www.neonode.com · Nasdaq (NEON)