ANNALY CAPITAL MANAGEMENT, INC. REPORTS 3rd QUARTER 2020 RESULTS
NEW YORK—October 28, 2020—Annaly Capital Management, Inc. (NYSE: NLY) ("Annaly" or the "Company") today announced its financial results for the quarter ended September 30, 2020.
Financial Highlights | ||
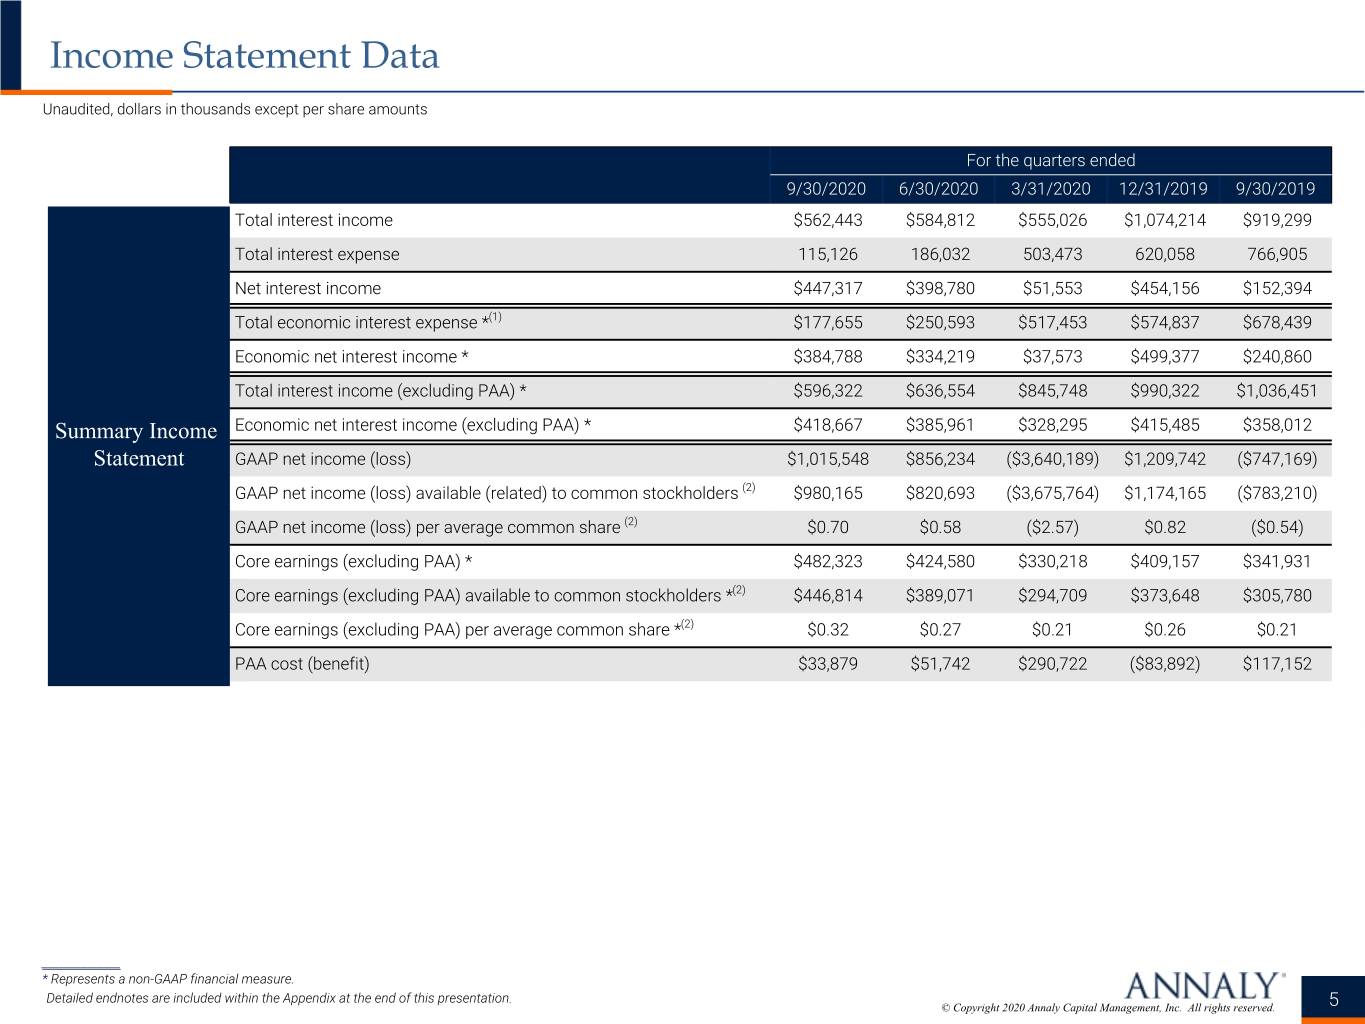
•GAAP net income of $0.70 per average common share for the quarter, up from $0.58 in the prior quarter
•Core earnings (excluding PAA) of $0.32 per average common share for the quarter, up 18.5% from the prior quarter
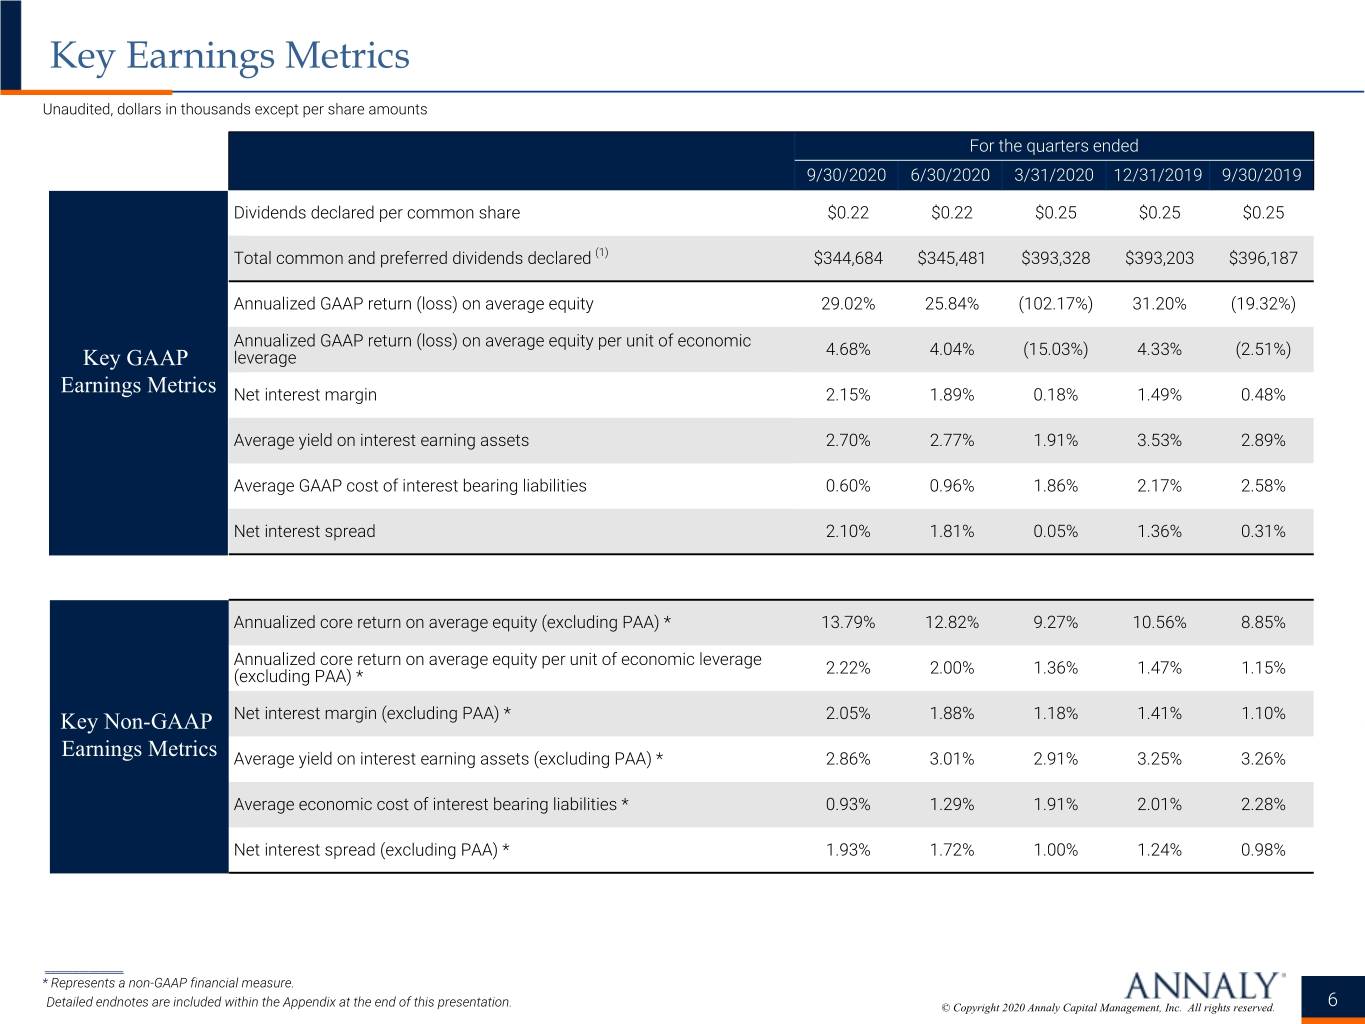
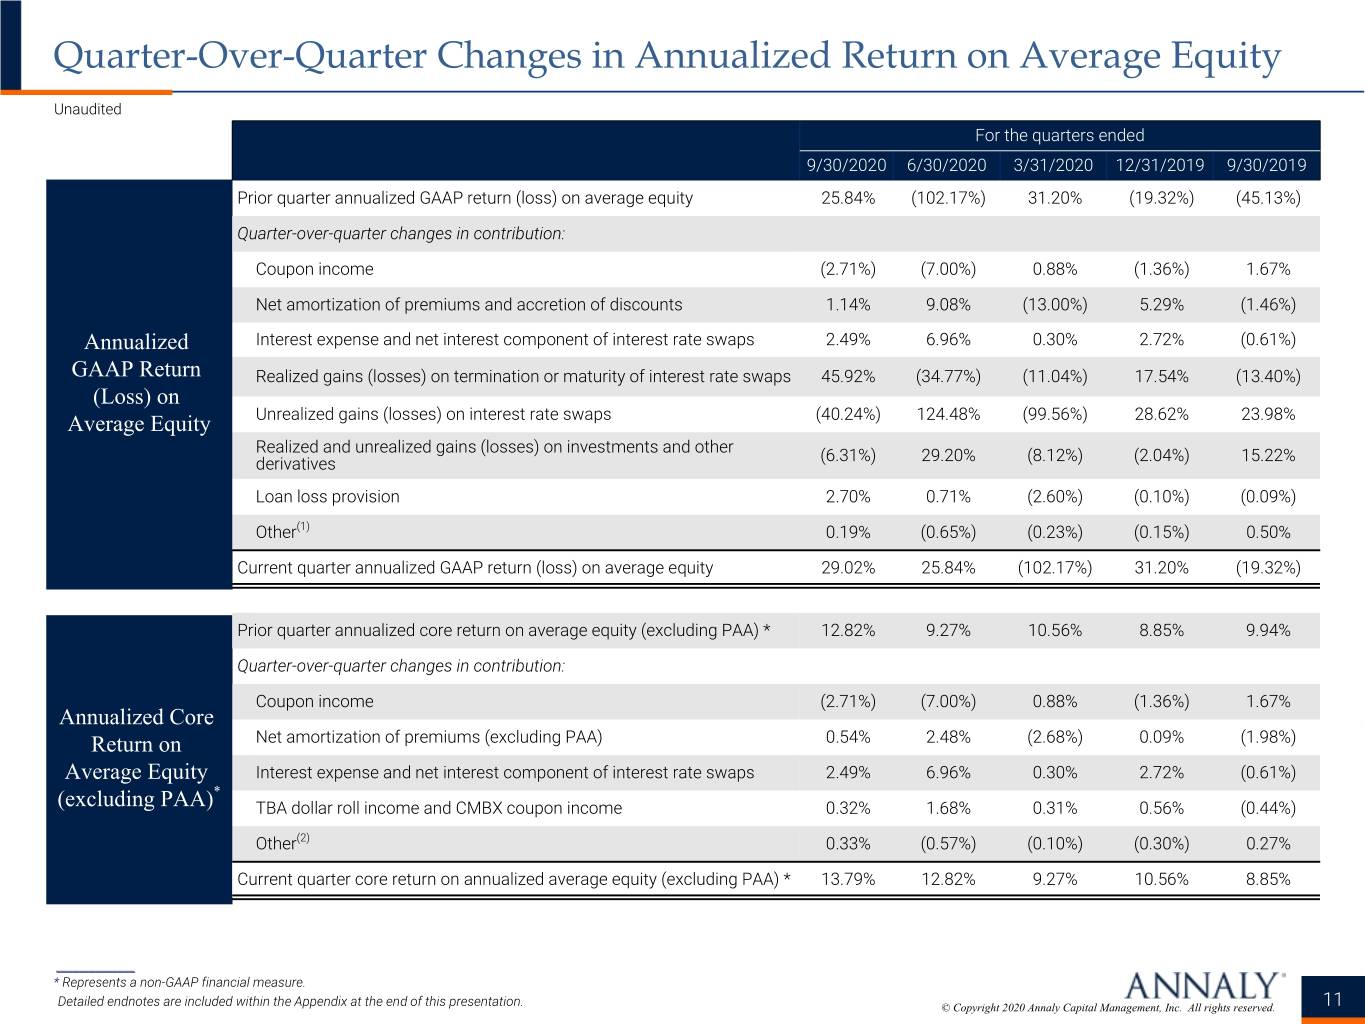
•GAAP return on average equity of 29.0% and core return on average equity (excluding PAA) of 13.8% for the quarter
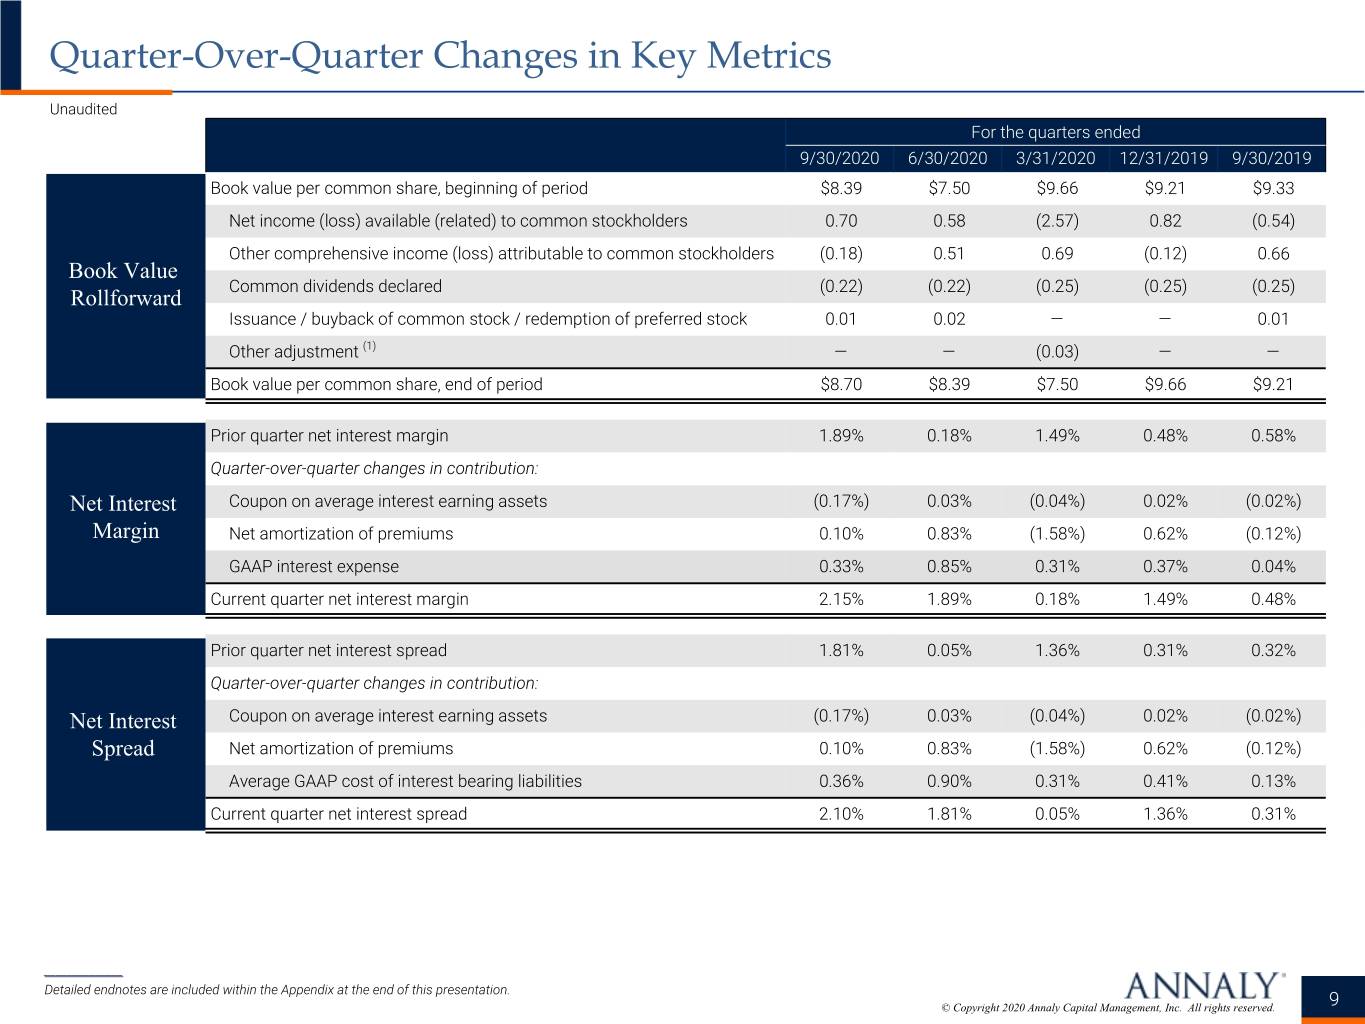
•Book value per common share of $8.70, up 3.7% from the prior quarter
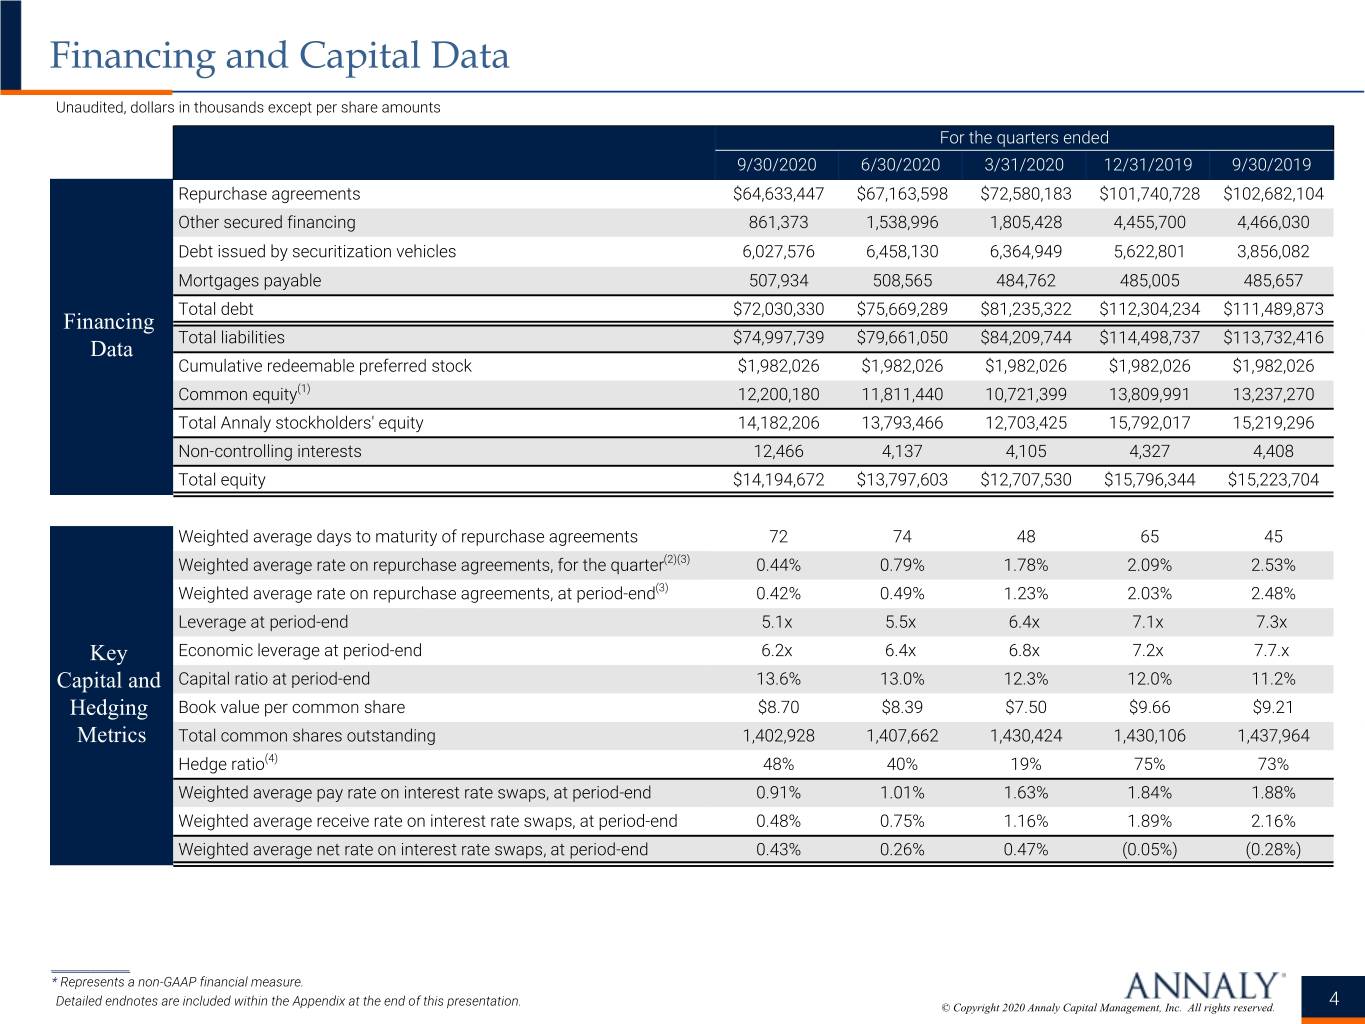
•Economic leverage of 6.2x, down from 6.4x in the prior quarter
•Declared quarterly common stock cash dividend of $0.22 per share
•Economic return of 6.3% for the third quarter
Business Highlights | ||
Investment and Strategy
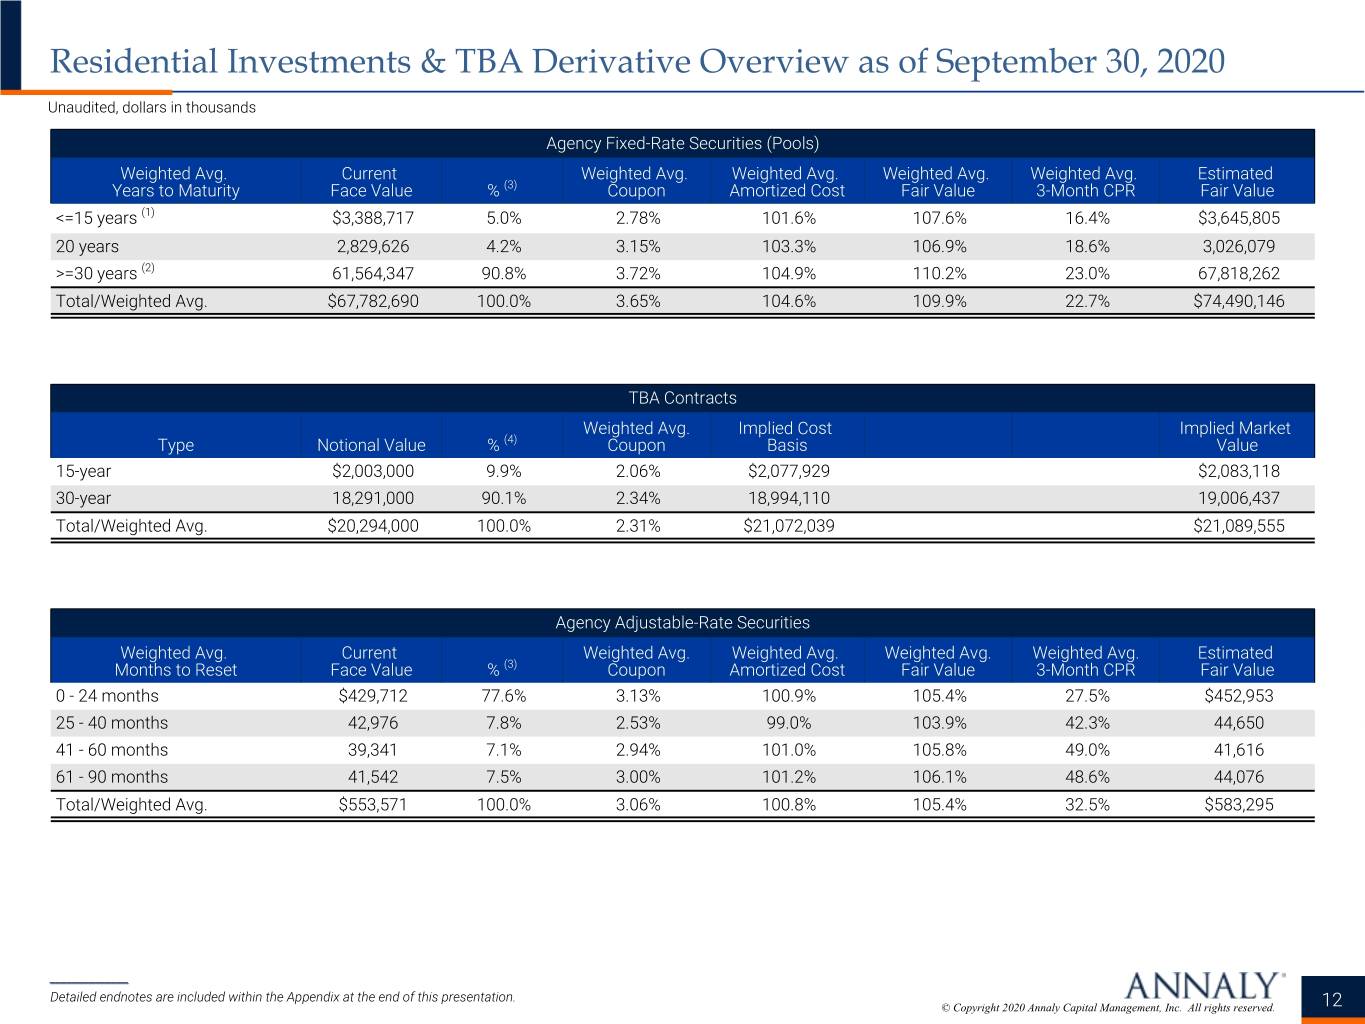
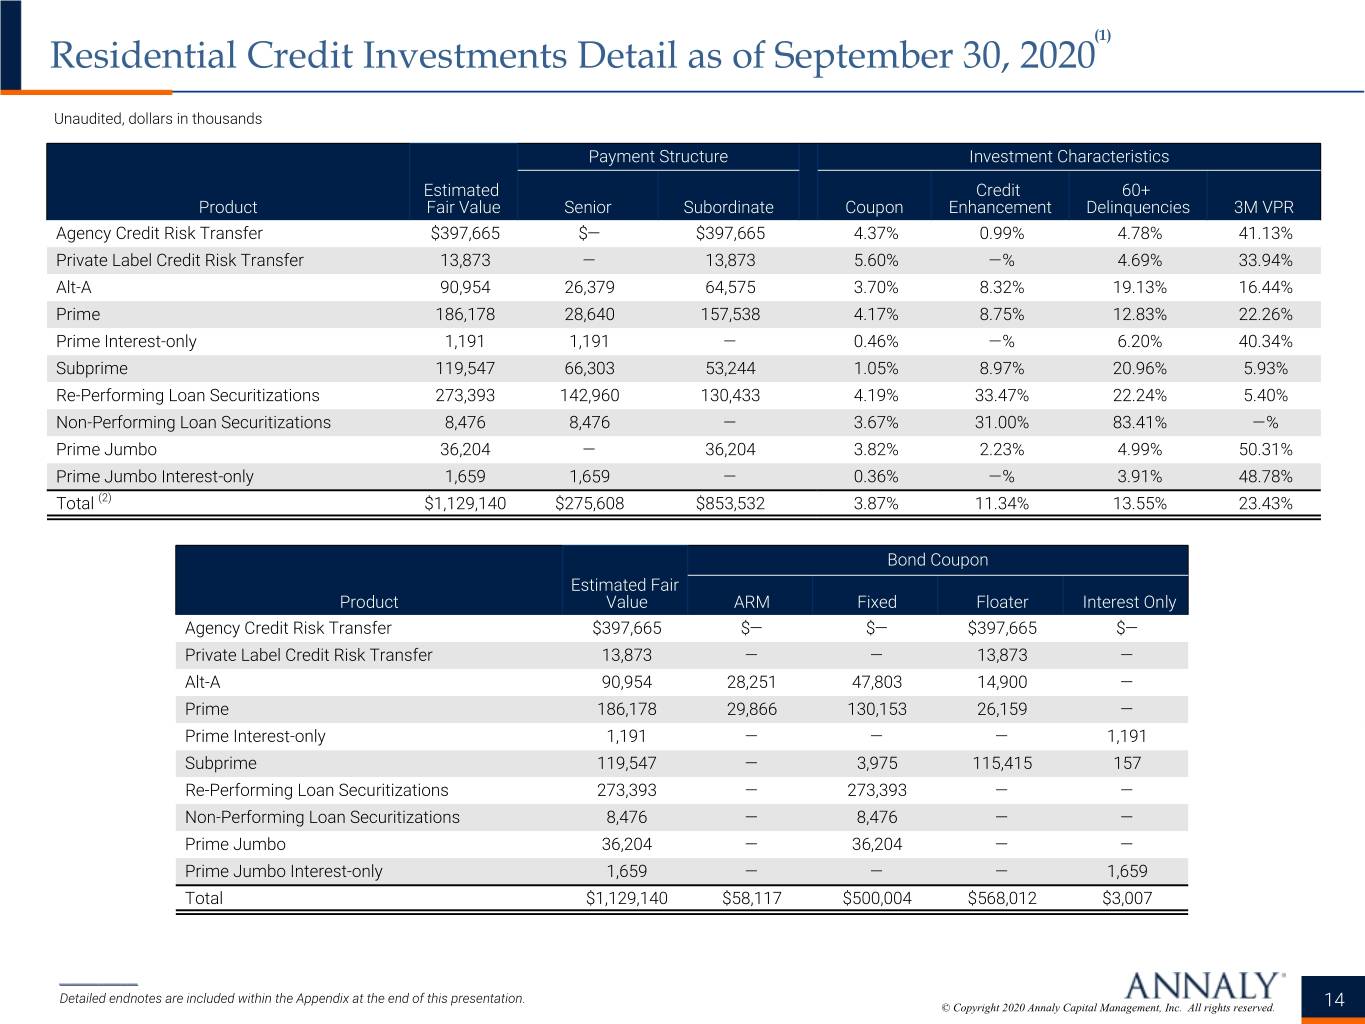
•Capital allocation to Agency increased to 80% of dedicated equity capital, which was largely driven by residential credit securitizations; highly liquid Agency portfolio relatively unchanged at $96.3 billion and 94% of Annaly's total assets(1)
•Credit businesses remain conservatively positioned and are performing well on improving economic indicators; will look to be opportunistic amidst steady improvement in deal flow and sector activity
•Total loan loss reserves (CECL and specific) declined by $22 million largely driven by a stronger economic forecast compared to the prior quarter
Financing and Capital
•$8.8 billion of unencumbered assets, including cash and unencumbered Agency MBS of $6.9 billion
•Average GAAP cost of interest bearing liabilities and average economic cost of interest bearing liabilities declined 36 basis points to 0.60% and 0.93%, respectively
•Annaly Residential Credit Group completed two residential whole loan securitizations totaling $1.0 billion in the third quarter, bringing aggregate issuances to over $5.0 billion since the beginning of 2018(2)
•Repurchased $209 million of common stock year-to-date(3)
Corporate Responsibility & Governance
•Demonstrated improved cost efficiency metrics relative to the second quarter following the completion of the Internalization
•Published inaugural Corporate Responsibility Report subsequent to quarter end, highlighting Annaly's leadership across ESG practices and outlining future goals and commitments for Annaly's five key ESG areas
•Named first Head of Inclusion and established an Inclusion Support Committee of executives, which represents the latest in a series of steps to enhance Annaly’s diversity initiatives and generate stronger returns for our shareholders
"We are quite optimistic about the operating environment for our business - particularly for Agency MBS - due to low interest rate volatility, strong carry and the lowest financing costs we’ve seen in the last decade," stated David Finkelstein, Chief Executive Officer and Chief Investment Officer. "We took advantage of the rebound in risk sentiment to further enhance our cost of capital and liquidity profile - completing two securitizations totaling $1 billion. Amidst this backdrop, Annaly delivered a strong 6.3% quarterly economic return to shareholders driven by an increase in book value through proactive management of our portfolio and generated core earnings $0.10 higher than the dividend. These solid results were derived with lower leverage, and with nearly $7 billion of highly liquid unencumbered assets, we are poised to take advantage of opportunities we see across our market-leading platform."
"Additionally, I am proud that we published our inaugural Corporate Responsibility Report earlier this month on the 23rd anniversary of Annaly's IPO. The report showcases Annaly's accomplishments across key areas of ESG related to corporate governance, responsible investments, human capital and inclusion initiatives. We believe continued progress in these endeavors is critical in order to support long-term performance."
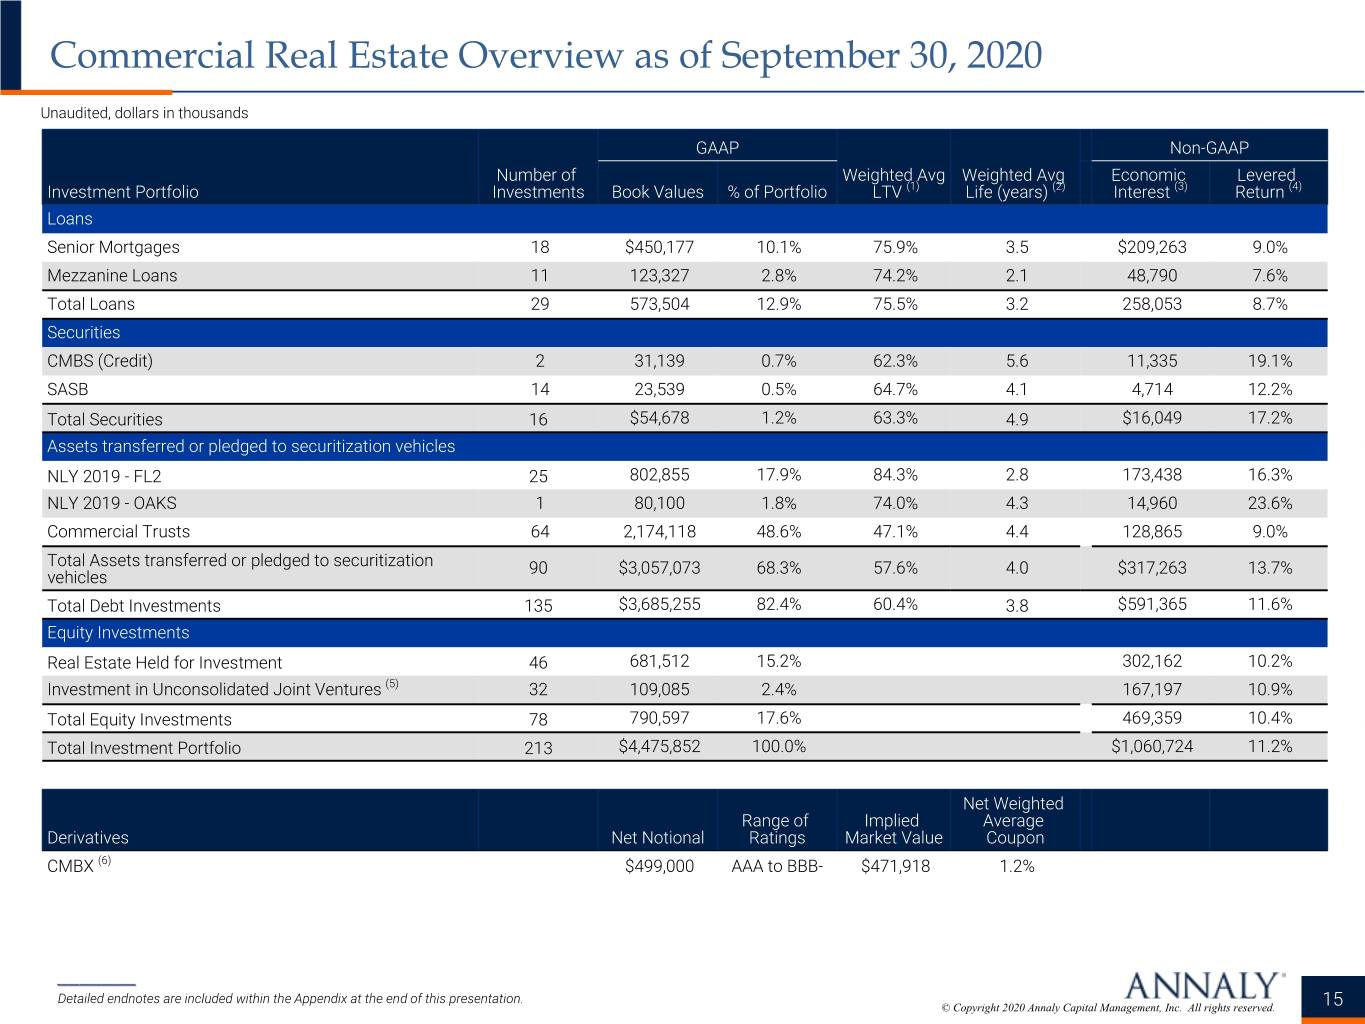
(1) Assets represent Annaly’s investments that are on balance sheet, net of securitized debt of consolidated VIEs, as well as investments that are off-balance sheet in which the Company has economic exposure. Assets include TBA purchase contracts (market value) of $21.1 billion and CMBX derivatives (market value) of $471.9 million and are shown net of securitized debt of consolidated VIEs of $6.0 billion.
(2) Includes three residential whole loan securitizations totaling $1.1 billion in 2018, five residential whole loan securitizations totaling $2.1 billion in 2019 and four residential whole loan securitizations totaling $1.8 billion in 2020.
(3) Share repurchases are under Annaly’s current authorized share repurchase program that expires in December 2020. Amounts exclude fees and commissions and include $34 million of repurchases that settled subsequent to quarter end.
Financial Performance | ||
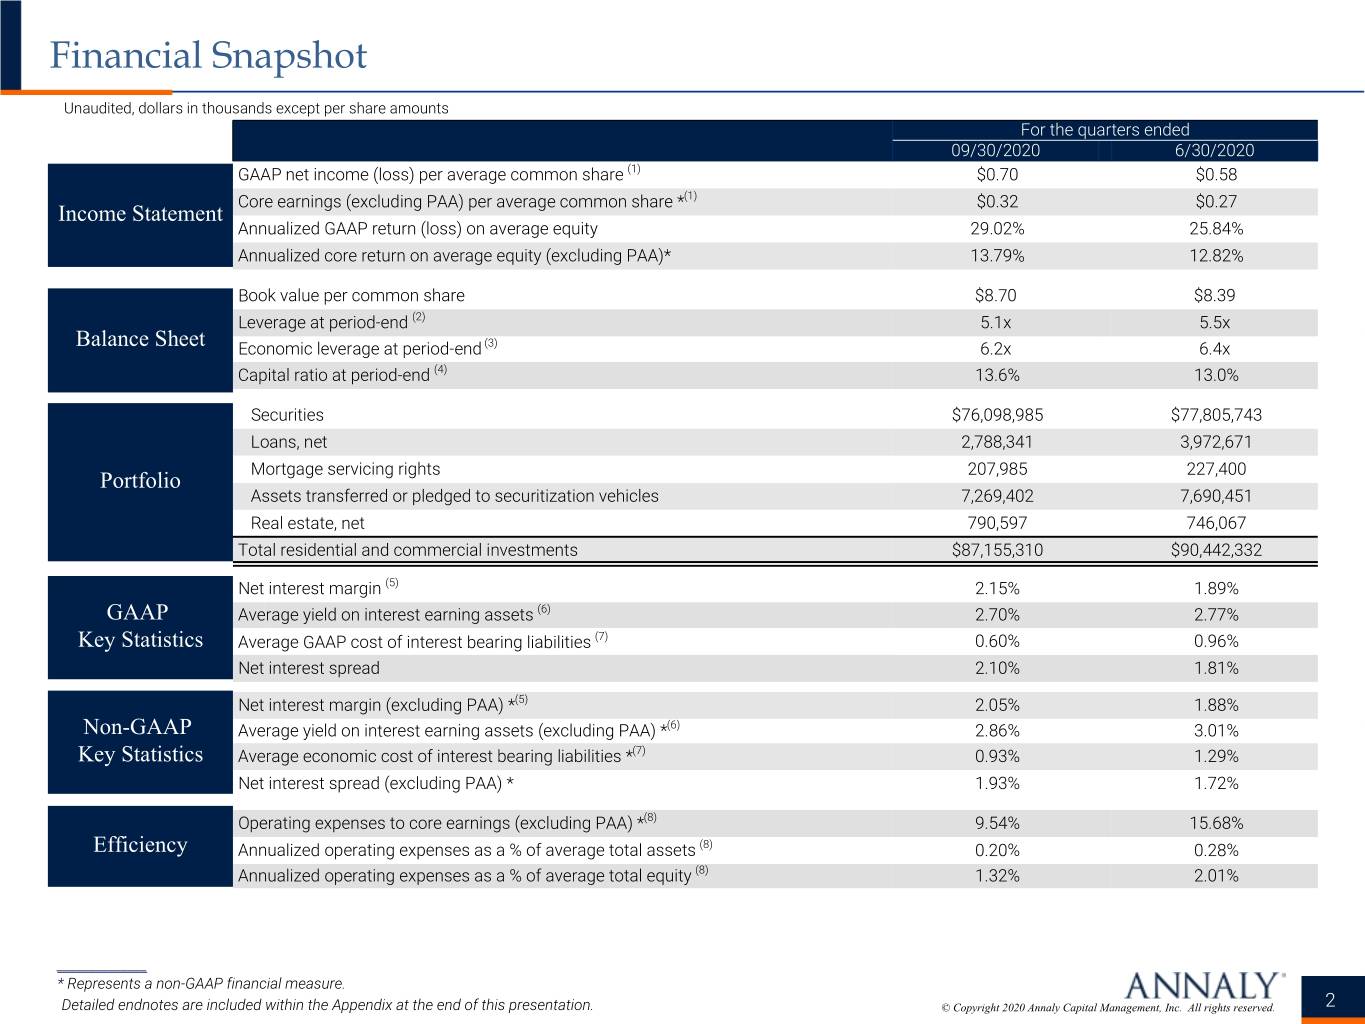
The following table summarizes certain key performance indicators as of and for the quarters ended September 30, 2020, June 30, 2020 and September 30, 2019:
| September 30, 2020 | June 30, 2020 | September 30, 2019 | |||||||||||||||
| Book value per common share | $ | 8.70 | $ | 8.39 | $ | 9.21 | |||||||||||
Economic leverage at period-end (1) | 6.2:1 | 6.4:1 | 7.7:1 | ||||||||||||||
GAAP net income (loss) per average common share (2) | $ | 0.70 | $ | 0.58 | $ | (0.54) | |||||||||||
| Annualized GAAP return (loss) on average equity | 29.02 | % | 25.84 | % | (19.32 | %) | |||||||||||
Net interest margin (3) | 2.15 | % | 1.89 | % | 0.48 | % | |||||||||||
Average yield on interest earning assets (4) | 2.70 | % | 2.77 | % | 2.89 | % | |||||||||||
Average GAAP cost of interest bearing liabilities (5) | 0.60 | % | 0.96 | % | 2.58 | % | |||||||||||
| Net interest spread | 2.10 | % | 1.81 | % | 0.31 | % | |||||||||||
| Non-GAAP metrics * | |||||||||||||||||
Core earnings (excluding PAA) per average common share (2) | $ | 0.32 | $ | 0.27 | $ | 0.21 | |||||||||||
| Annualized core return on average equity (excluding PAA) | 13.79 | % | 12.82 | % | 8.85 | % | |||||||||||
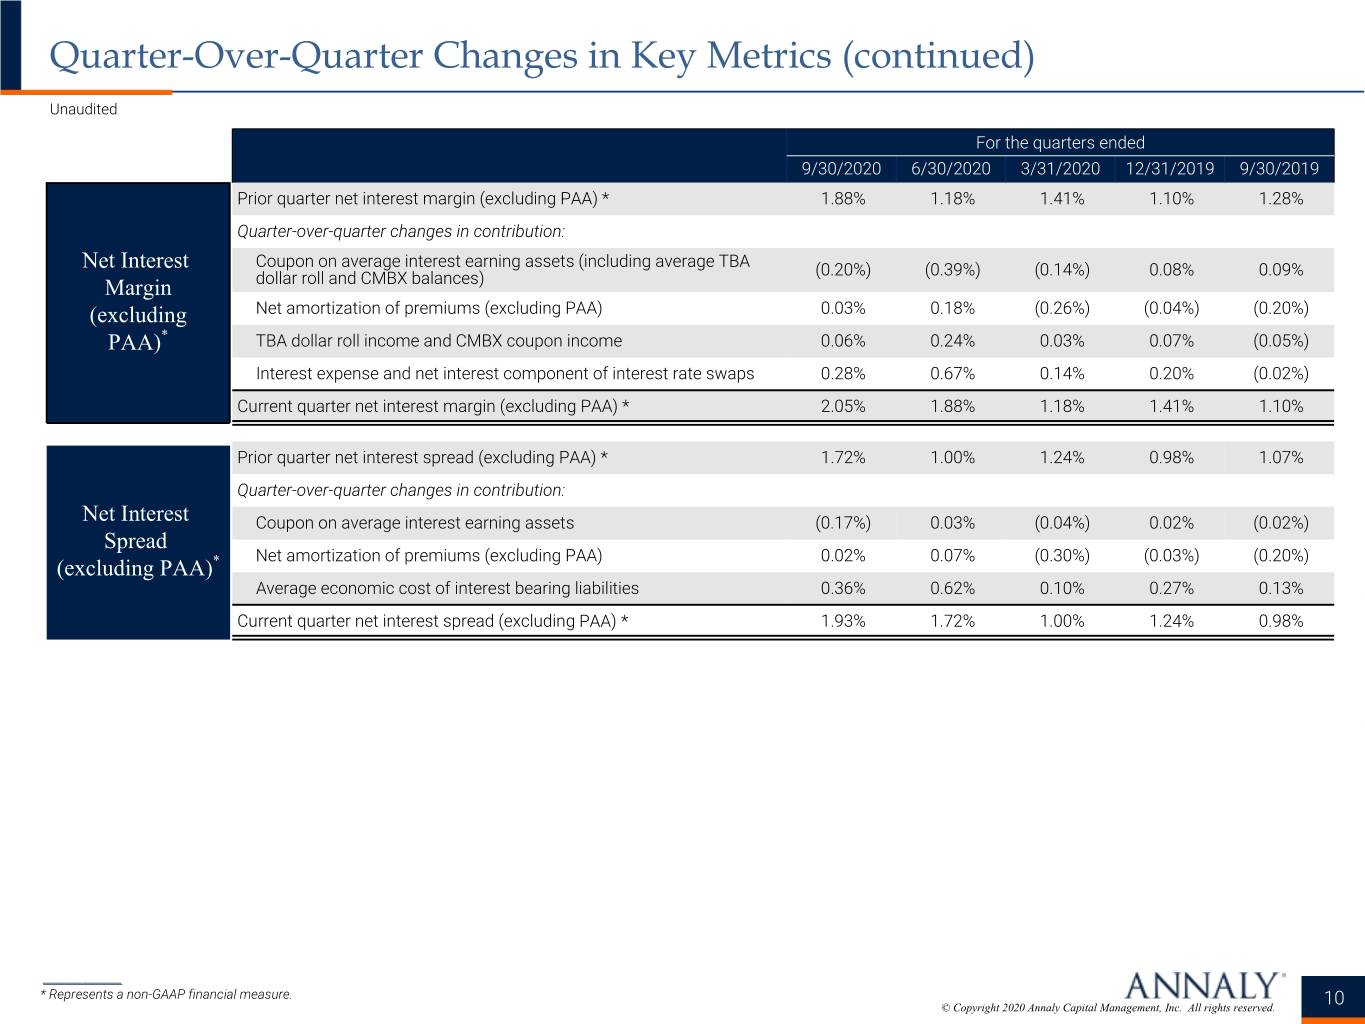
Net interest margin (excluding PAA) (3) | 2.05 | % | 1.88 | % | 1.10 | % | |||||||||||
Average yield on interest earning assets (excluding PAA) (4) | 2.86 | % | 3.01 | % | 3.26 | % | |||||||||||
Average economic cost of interest bearing liabilities (5) | 0.93 | % | 1.29 | % | 2.28 | % | |||||||||||
| Net interest spread (excluding PAA) | 1.93 | % | 1.72 | % | 0.98 | % | |||||||||||
* Represents a non-GAAP financial measure. Please refer to the "Non-GAAP Financial Measures" section for additional information. (1) Computed as the sum of recourse debt, cost basis of to-be-announced ("TBA") and CMBX derivatives outstanding, and net forward purchases (sales) of investments divided by total equity. Recourse debt consists of repurchase agreements and other secured financing (excluding certain non-recourse credit facilities). Securitized debt, certain credit facilities (included within other secured financing) and mortgages payable are non-recourse to the Company and are excluded from this measure. (2) Net of dividends on preferred stock. The quarter ended September 30, 2019 excludes cumulative and undeclared dividends of $0.3 million on the Company's Series I Preferred Stock as of June 30, 2019. (3) Net interest margin represents interest income less interest expense divided by average Interest Earning Assets. Net interest margin (excluding PAA) represents the sum of interest income (excluding PAA) plus TBA dollar roll income and CMBX coupon income less interest expense and the net interest component of interest rate swaps divided by the sum of average Interest Earning Assets plus average outstanding TBA contract and CMBX balances. PAA represents the cumulative impact on prior periods, but not the current period, of quarter-over-quarter changes in estimated long-term prepayment speeds related to the Company’s Agency mortgage-backed securities. (4) Average yield on interest earning assets represents annualized interest income divided by average interest earning assets. Average interest earning assets reflects the average amortized cost of our investments during the period. Average yield on interest earning assets (excluding PAA) is calculated using annualized interest income (excluding PAA). (5) Average GAAP cost of interest bearing liabilities represents annualized interest expense divided by average interest bearing liabilities. Average interest bearing liabilities reflects the average balances during the period. Average economic cost of interest bearing liabilities represents annualized economic interest expense divided by average interest bearing liabilities. Economic interest expense is comprised of GAAP interest expense and the net interest component of interest rate swaps. | |||||||||||||||||
2
Other Information | ||
This news release and our public documents to which we refer contain or incorporate by reference certain forward-looking statements which are based on various assumptions (some of which are beyond our control) and may be identified by reference to a future period or periods or by the use of forward-looking terminology, such as "may," "will," "believe," "expect," "anticipate," "continue," or similar terms or variations on those terms or the negative of those terms. Actual results could differ materially from those set forth in forward-looking statements due to a variety of factors, including, but not limited to, risks and uncertainties related to the COVID-19 pandemic, including as related to adverse economic conditions on real estate-related assets and financing conditions; changes in interest rates; changes in the yield curve; changes in prepayment rates; the availability of mortgage-backed securities and other securities for purchase; the availability of financing and, if available, the terms of any financing; changes in the market value of our assets; changes in business conditions and the general economy; our ability to grow our commercial real estate business; our ability to grow our residential credit business; our ability to grow our middle market lending business; credit risks related to our investments in credit risk transfer securities, residential mortgage-backed securities and related residential mortgage credit assets, commercial real estate assets and corporate debt; risks related to investments in mortgage servicing rights; our ability to consummate any contemplated investment opportunities; changes in government regulations or policy affecting our business; our ability to maintain our qualification as a REIT for U.S. federal income tax purposes; and our ability to maintain our exemption from registration under the Investment Company Act of 1940. For a discussion of the risks and uncertainties which could cause actual results to differ from those contained in the forward-looking statements, see "Risk Factors" in our most recent Annual Report on Form 10-K and any subsequent Quarterly Reports on Form 10-Q. We do not undertake, and specifically disclaim any obligation, to publicly release the result of any revisions which may be made to any forward-looking statements to reflect the occurrence of anticipated or unanticipated events or circumstances after the date of such statements, except as required by law.
Annaly is a leading diversified capital manager that invests in and finances residential and commercial assets. Annaly’s principal business objective is to generate net income for distribution to its stockholders and to optimize its returns through prudent management of its diversified investment strategies. Annaly is internally managed and has elected to be taxed as a real estate investment trust, or REIT, for federal income tax purposes. Additional information on the company can be found at www.annaly.com.
Annaly routinely posts important information for investors on the Company’s website, www.annaly.com. Annaly intends to use this webpage as a means of disclosing material, non-public information, for complying with the Company’s disclosure obligations under Regulation FD and to post and update investor presentations and similar materials on a regular basis. Annaly encourages investors, analysts, the media and others interested in Annaly to monitor the Company’s website, in addition to following Annaly’s press releases, SEC filings, public conference calls, presentations, webcasts and other information it posts from time to time on its website. To sign-up for email-notifications, please visit the "Investors" section of our website, www.annaly.com, then click on "Investor Resources" and select "Email Alerts" to complete the email notification form. The information contained on, or that may be accessed through, the Company’s webpage is not incorporated by reference into, and is not a part of, this document.
The Company prepares a supplemental investor presentation and a financial summary for the benefit of its shareholders. Both the Third Quarter 2020 Investor Presentation and the Third Quarter 2020 Financial Summary can be found at the Company’s website (www.annaly.com) in the Investors section under Investor Presentations.
Conference Call | ||
The Company will hold the third quarter 2020 earnings conference call on October 29, 2020 at 10:00 a.m. Eastern Time. Participants are encouraged to pre-register for the conference call to receive a unique PIN to gain immediate access to the call and bypass the live operator. Pre-registration may be completed by accessing the Pre-Registration link found on the homepage or "Investors" section of the Company's website at www.annaly.com, or by using the following link: https://dpregister.com/sreg/10148947/daee3e6ede.
Pre-registration may be completed at any time, including up to and after the call start time.
For participants who would like to join the call but have not pre-registered, access is available by dialing 844-735-3317 within the U.S., or 412-317-5703 internationally, and requesting the "Annaly Earnings Call."
There will also be an audio webcast of the call on www.annaly.com. A replay of the call will be available for one week following the conference call. The replay number is 877-344-7529 for domestic calls and 412-317-0088 for international calls and the conference passcode is 10148947. If you would like to be added to the e-mail distribution list, please visit www.annaly.com, click on Investors, then select Email Alerts and complete the email notification form.
3
Financial Statements | ||
ANNALY CAPITAL MANAGEMENT, INC. AND SUBSIDIARIES
CONSOLIDATED STATEMENTS OF FINANCIAL CONDITION
(dollars in thousands, except per share data)
| September 30, 2020 | June 30, 2020 | December 31, 2019 (1) | December 31, 2019 | September 30, 2019 | |||||||||||||||||||||||||
| (unaudited) | (unaudited) | (unaudited) | (unaudited) | ||||||||||||||||||||||||||
| Assets | |||||||||||||||||||||||||||||
| Cash and cash equivalents | $ | 1,239,982 | $ | 1,393,910 | $ | 2,823,521 | $ | 1,850,729 | $ | 1,793,921 | |||||||||||||||||||
| Securities | 76,098,985 | 77,805,743 | 79,357,596 | 114,833,580 | 116,094,061 | ||||||||||||||||||||||||
| Loans, net | 2,788,341 | 3,972,671 | 4,068,189 | 4,462,350 | 3,946,614 | ||||||||||||||||||||||||
| Mortgage servicing rights | 207,985 | 227,400 | 280,558 | 378,078 | 386,051 | ||||||||||||||||||||||||
| Assets transferred or pledged to securitization vehicles | 7,269,402 | 7,690,451 | 7,671,662 | 7,002,460 | 4,688,144 | ||||||||||||||||||||||||
| Real estate, net | 790,597 | 746,067 | 751,738 | 725,638 | 725,508 | ||||||||||||||||||||||||
| Derivative assets | 103,245 | 165,642 | 238,776 | 113,556 | 168,755 | ||||||||||||||||||||||||
| Receivable for unsettled trades | 54,200 | 747,082 | 1,006,853 | 4,792 | 193,229 | ||||||||||||||||||||||||
| Principal and interest receivable | 281,009 | 300,089 | 335,170 | 449,906 | 483,744 | ||||||||||||||||||||||||
| Goodwill and intangible assets, net | 136,900 | 137,680 | 98,293 | 92,772 | 94,904 | ||||||||||||||||||||||||
| Other assets | 221,765 | 271,918 | 284,918 | 381,220 | 381,189 | ||||||||||||||||||||||||
| Total assets | $ | 89,192,411 | $ | 93,458,653 | $ | 96,917,274 | $ | 130,295,081 | $ | 128,956,120 | |||||||||||||||||||
| Liabilities and stockholders’ equity | |||||||||||||||||||||||||||||
| Liabilities | |||||||||||||||||||||||||||||
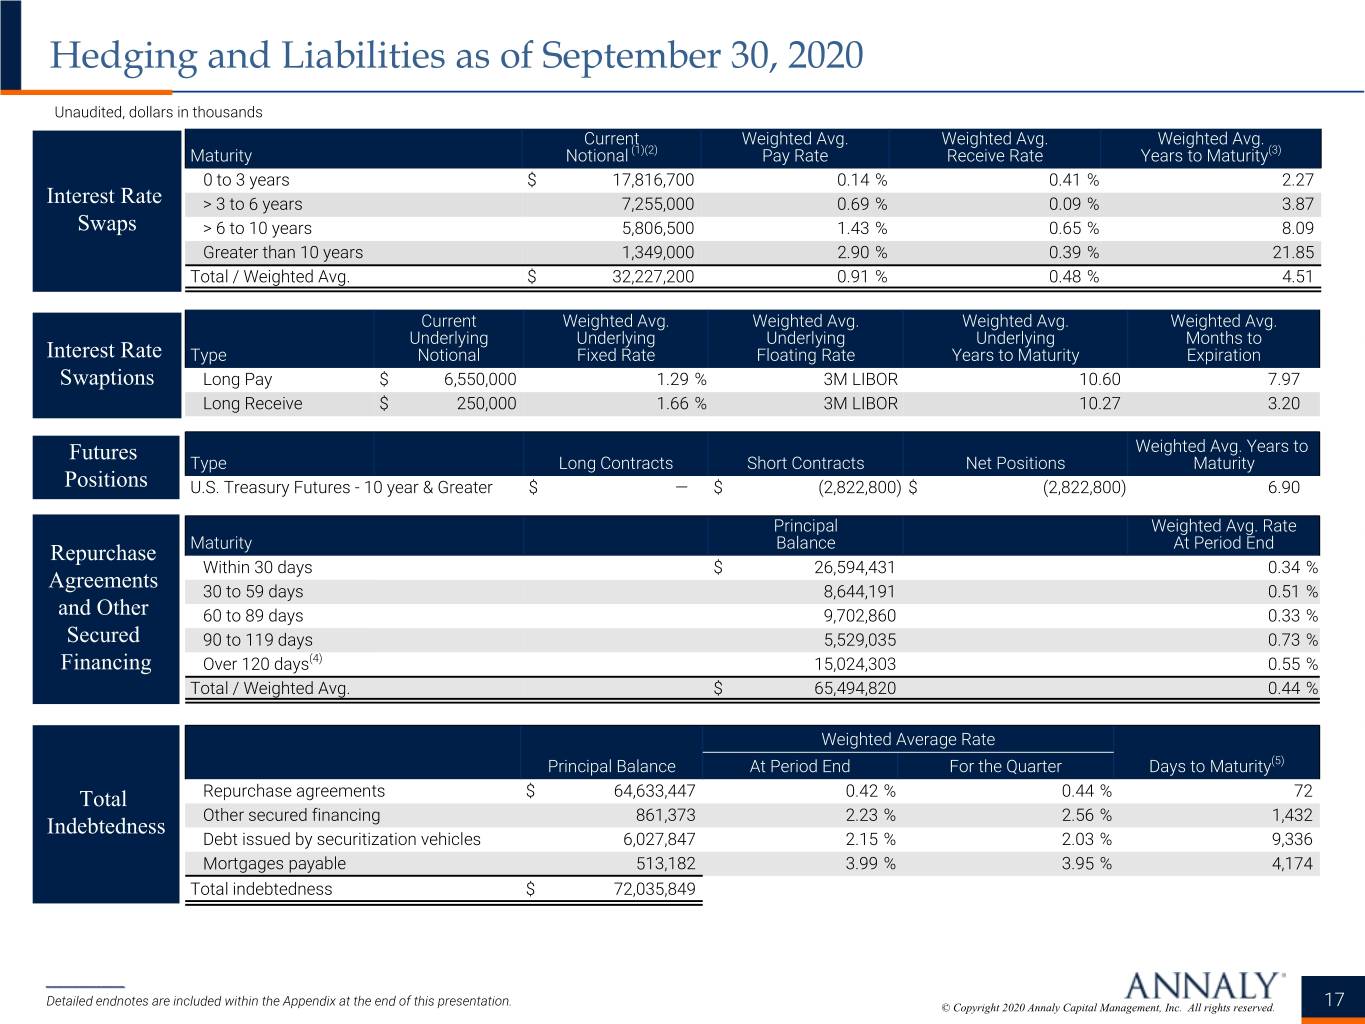
| Repurchase agreements | $ | 64,633,447 | $ | 67,163,598 | $ | 72,580,183 | $ | 101,740,728 | $ | 102,682,104 | |||||||||||||||||||
| Other secured financing | 861,373 | 1,538,996 | 1,805,428 | 4,455,700 | 4,466,030 | ||||||||||||||||||||||||
| Debt issued by securitization vehicles | 6,027,576 | 6,458,130 | 6,364,949 | 5,622,801 | 3,856,082 | ||||||||||||||||||||||||
| Mortgages payable | 507,934 | 508,565 | 484,762 | 485,005 | 485,657 | ||||||||||||||||||||||||
| Derivative liabilities | 1,182,681 | 1,257,038 | 1,331,188 | 803,866 | 972,415 | ||||||||||||||||||||||||
| Payable for unsettled trades | 1,176,001 | 2,122,735 | 923,552 | 463,387 | 245,626 | ||||||||||||||||||||||||
| Interest payable | 155,338 | 180,943 | 261,304 | 476,335 | 565,797 | ||||||||||||||||||||||||
| Dividends payable | 308,644 | 309,686 | 357,606 | 357,527 | 359,491 | ||||||||||||||||||||||||
| Other liabilities | 144,745 | 121,359 | 100,772 | 93,388 | 99,214 | ||||||||||||||||||||||||
| Total liabilities | 74,997,739 | 79,661,050 | 84,209,744 | 114,498,737 | 113,732,416 | ||||||||||||||||||||||||
| Stockholders’ equity | |||||||||||||||||||||||||||||
Preferred stock, par value $0.01 per share (2) | 1,982,026 | 1,982,026 | 1,982,026 | 1,982,026 | 1,982,026 | ||||||||||||||||||||||||
Common stock, par value $0.01 per share (3) | 14,029 | 14,077 | 14,304 | 14,301 | 14,380 | ||||||||||||||||||||||||
| Additional paid-in capital | 19,798,032 | 19,827,216 | 19,968,372 | 19,966,923 | 20,034,970 | ||||||||||||||||||||||||
| Accumulated other comprehensive income (loss) | 3,589,056 | 3,842,074 | 3,121,371 | 2,138,191 | 2,313,815 | ||||||||||||||||||||||||
| Accumulated deficit | (11,200,937) | (11,871,927) | (12,382,648) | (8,309,424) | (9,125,895) | ||||||||||||||||||||||||
| Total stockholders’ equity | 14,182,206 | 13,793,466 | 12,703,425 | 15,792,017 | 15,219,296 | ||||||||||||||||||||||||
| Noncontrolling interests | 12,466 | 4,137 | 4,105 | 4,327 | 4,408 | ||||||||||||||||||||||||
| Total equity | 14,194,672 | 13,797,603 | 12,707,530 | 15,796,344 | 15,223,704 | ||||||||||||||||||||||||
| Total liabilities and equity | $ | 89,192,411 | $ | 93,458,653 | $ | 96,917,274 | $ | 130,295,081 | $ | 128,956,120 | |||||||||||||||||||
(1) Derived from the audited consolidated financial statements at December 31, 2019.
(2) 7.50% Series D Cumulative Redeemable Preferred Stock - Includes 18,400,000 shares authorized, issued and outstanding.
6.95% Series F Fixed-to-Floating Rate Cumulative Redeemable Preferred Stock - Includes 28,800,000 shares authorized, issued and outstanding.
6.50% Series G Fixed-to-Floating Rate Cumulative Redeemable Preferred Stock - Includes 19,550,000 shares authorized and 17,000,000 shares issued and outstanding.
6.75% Series I Preferred Stock - Includes 18,400,000 shares authorized and 17,700,000 issued and outstanding.
(3) Includes 2,914,850,000 shares authorized at September 30, 2020, June 30, 2020, March 31, 2020 and December 31, 2019 and September 30, 2019. Includes 1,402,928,317 shares issued and outstanding at September 30, 2020; 1,407,662,483 shares issued and outstanding at June 30, 2020; 1,430,424,398 shares issued and outstanding at March 31, 2020; 1,430,106,199 shares issued and outstanding at December 31, 2019; and 1,437,964,466 shares issued and outstanding at September 30, 2019.
4
| ANNALY CAPITAL MANAGEMENT, INC. AND SUBSIDIARIES CONSOLIDATED STATEMENTS OF COMPREHENSIVE INCOME (LOSS) (dollars in thousands, except per share data) (Unaudited) | |||||||||||||||||||||||||||||
| For the quarters ended | |||||||||||||||||||||||||||||
| September 30, 2020 | June 30, 2020 | March 31, 2020 | December 31, 2019 | September 30, 2019 | |||||||||||||||||||||||||
| Net interest income | |||||||||||||||||||||||||||||
| Interest income | $ | 562,443 | $ | 584,812 | $ | 555,026 | $ | 1,074,214 | $ | 919,299 | |||||||||||||||||||
| Interest expense | 115,126 | 186,032 | 503,473 | 620,058 | 766,905 | ||||||||||||||||||||||||
| Net interest income | 447,317 | 398,780 | 51,553 | 454,156 | 152,394 | ||||||||||||||||||||||||
| Realized and unrealized gains (losses) | |||||||||||||||||||||||||||||
| Net interest component of interest rate swaps | (62,529) | (64,561) | (13,980) | 45,221 | 88,466 | ||||||||||||||||||||||||
| Realized gains (losses) on termination or maturity of interest rate swaps | (427) | (1,521,732) | (397,561) | (4,615) | (682,602) | ||||||||||||||||||||||||
| Unrealized gains (losses) on interest rate swaps | 170,327 | 1,494,628 | (2,827,723) | 782,608 | (326,309) | ||||||||||||||||||||||||
| Subtotal | 107,371 | (91,665) | (3,239,264) | 823,214 | (920,445) | ||||||||||||||||||||||||
| Net gains (losses) on disposal of investments and other | 198,888 | 246,679 | 206,583 | 17,783 | 66,522 | ||||||||||||||||||||||||
| Net gains (losses) on other derivatives | 169,316 | 170,916 | 206,426 | (42,312) | (16,888) | ||||||||||||||||||||||||
| Net unrealized gains (losses) on instruments measured at fair value through earnings | 121,255 | 254,772 | (730,160) | (5,636) | (1,091) | ||||||||||||||||||||||||
| Loan loss provision | 21,993 | (68,751) | (99,326) | (7,362) | (3,504) | ||||||||||||||||||||||||
| Subtotal | 511,452 | 603,616 | (416,477) | (37,527) | 45,039 | ||||||||||||||||||||||||
| Total realized and unrealized gains (losses) | 618,823 | 511,951 | (3,655,741) | 785,687 | (875,406) | ||||||||||||||||||||||||
| Other income (loss) | 7,959 | 15,224 | 14,926 | 42,656 | 35,074 | ||||||||||||||||||||||||
| General and administrative expenses | |||||||||||||||||||||||||||||
| Compensation and management fee | 29,196 | 37,036 | 40,825 | 40,403 | 41,161 | ||||||||||||||||||||||||
| Other general and administrative expenses | 19,636 | 30,630 | 36,804 | 32,948 | 24,977 | ||||||||||||||||||||||||
| Total general and administrative expenses | 48,832 | 67,666 | 77,629 | 73,351 | 66,138 | ||||||||||||||||||||||||
| Income (loss) before income taxes | 1,025,267 | 858,289 | (3,666,891) | 1,209,148 | (754,076) | ||||||||||||||||||||||||
| Income taxes | 9,719 | 2,055 | (26,702) | (594) | (6,907) | ||||||||||||||||||||||||
| Net income (loss) | 1,015,548 | 856,234 | (3,640,189) | 1,209,742 | (747,169) | ||||||||||||||||||||||||
| Net income (loss) attributable to noncontrolling interests | (126) | 32 | 66 | 68 | (110) | ||||||||||||||||||||||||
| Net income (loss) attributable to Annaly | 1,015,674 | 856,202 | (3,640,255) | 1,209,674 | (747,059) | ||||||||||||||||||||||||
Dividends on preferred stock (1) | 35,509 | 35,509 | 35,509 | 35,509 | 36,151 | ||||||||||||||||||||||||
| Net income (loss) available (related) to common stockholders | $ | 980,165 | $ | 820,693 | $ | (3,675,764) | $ | 1,174,165 | $ | (783,210) | |||||||||||||||||||
| Net income (loss) per share available (related) to common stockholders | |||||||||||||||||||||||||||||
| Basic | $ | 0.70 | $ | 0.58 | $ | (2.57) | $ | 0.82 | $ | (0.54) | |||||||||||||||||||
| Diluted | $ | 0.70 | $ | 0.58 | $ | (2.57) | $ | 0.82 | $ | (0.54) | |||||||||||||||||||
| Weighted average number of common shares outstanding | |||||||||||||||||||||||||||||
| Basic | 1,404,202,695 | 1,423,909,112 | 1,430,994,319 | 1,431,079,108 | 1,453,359,211 | ||||||||||||||||||||||||
| Diluted | 1,404,368,300 | 1,423,909,112 | 1,430,994,319 | 1,431,079,108 | 1,453,359,211 | ||||||||||||||||||||||||
| Other comprehensive income (loss) | |||||||||||||||||||||||||||||
| Net income (loss) | $ | 1,015,548 | $ | 856,234 | $ | (3,640,189) | $ | 1,209,742 | $ | (747,169) | |||||||||||||||||||
| Unrealized gains (losses) on available-for-sale securities | (140,671) | 986,146 | 1,374,796 | (153,192) | 1,034,873 | ||||||||||||||||||||||||
| Reclassification adjustment for net (gains) losses included in net income (loss) | (112,347) | (265,443) | (391,616) | (22,432) | (86,061) | ||||||||||||||||||||||||
| Other comprehensive income (loss) | (253,018) | 720,703 | 983,180 | (175,624) | 948,812 | ||||||||||||||||||||||||
| Comprehensive income (loss) | 762,530 | 1,576,937 | (2,657,009) | 1,034,118 | 201,643 | ||||||||||||||||||||||||
| Comprehensive income (loss) attributable to noncontrolling interests | (126) | 32 | 66 | 68 | (110) | ||||||||||||||||||||||||
| Comprehensive income (loss) attributable to Annaly | 762,656 | 1,576,905 | (2,657,075) | 1,034,050 | 201,753 | ||||||||||||||||||||||||
Dividends on preferred stock (1) | 35,509 | 35,509 | 35,509 | 35,509 | 36,151 | ||||||||||||||||||||||||
| Comprehensive income (loss) attributable to common stockholders | $ | 727,147 | $ | 1,541,396 | $ | (2,692,584) | $ | 998,541 | $ | 165,602 | |||||||||||||||||||
(1)The quarter ended September 30, 2019 excludes cumulative and undeclared dividends of $0.3 million on the Company's Series I Preferred Stock as of June 30, 2019.
5
| ANNALY CAPITAL MANAGEMENT, INC. AND SUBSIDIARIES CONSOLIDATED STATEMENTS OF COMPREHENSIVE INCOME (LOSS) (dollars in thousands, except per share data) | |||||||||||
| For the nine months ended | |||||||||||
| September 30, 2020 | September 30, 2019 | ||||||||||
| Net interest income | |||||||||||
| Interest income | $ | 1,702,281 | $ | 2,713,083 | |||||||
| Interest expense | 804,631 | 2,164,817 | |||||||||
| Net interest income | 897,650 | 548,266 | |||||||||
| Realized and unrealized gains (losses) | |||||||||||
| Net interest component of interest rate swaps | (141,070) | 306,154 | |||||||||
| Realized gains (losses) on termination or maturity of interest rate swaps | (1,919,720) | (1,438,349) | |||||||||
| Unrealized gains (losses) on interest rate swaps | (1,162,768) | (1,992,884) | |||||||||
| Subtotal | (3,223,558) | (3,125,079) | |||||||||
| Net gains (losses) on disposal of investments | 652,150 | (65,727) | |||||||||
| Net gains (losses) on other derivatives | 546,658 | (638,458) | |||||||||
| Net unrealized gains (losses) on instruments measured at fair value through earnings | (354,133) | 41,657 | |||||||||
| Loan loss provision | (146,084) | (9,207) | |||||||||
| Subtotal | 698,591 | (671,735) | |||||||||
| Total realized and unrealized gains (losses) | (2,524,967) | (3,796,814) | |||||||||
| Other income (loss) | 38,109 | 93,757 | |||||||||
| General and administrative expenses | |||||||||||
| Compensation and management fee | 107,057 | 130,225 | |||||||||
| Other general and administrative expenses | 87,070 | 98,058 | |||||||||
| Total general and administrative expenses | 194,127 | 228,283 | |||||||||
| Income (loss) before income taxes | (1,783,335) | (3,383,074) | |||||||||
| Income taxes | (14,928) | (10,241) | |||||||||
| Net income (loss) | (1,768,407) | (3,372,833) | |||||||||
| Net income (loss) attributable to noncontrolling interests | (28) | (294) | |||||||||
| Net income (loss) attributable to Annaly | (1,768,379) | (3,372,539) | |||||||||
| Dividends on preferred stock | 106,527 | 101,067 | |||||||||
| Net income (loss) available (related) to common stockholders | $ | (1,874,906) | $ | (3,473,606) | |||||||
| Net income (loss) per share available (related) to common stockholders | |||||||||||
| Basic | $ | (1.32) | $ | (2.42) | |||||||
| Diluted | $ | (1.32) | $ | (2.42) | |||||||
| Weighted average number of common shares outstanding | |||||||||||
| Basic | 1,419,645,475 | 1,436,204,582 | |||||||||
| Diluted | 1,419,645,475 | 1,436,204,582 | |||||||||
| Other comprehensive income (loss) | |||||||||||
| Net income (loss) | $ | (1,768,407) | $ | (3,372,833) | |||||||
| Unrealized gains (losses) on available-for-sale securities | 2,220,271 | 4,289,054 | |||||||||
| Reclassification adjustment for net (gains) losses included in net income (loss) | (769,406) | 4,626 | |||||||||
| Other comprehensive income (loss) | 1,450,865 | 4,293,680 | |||||||||
| Comprehensive income (loss) | (317,542) | 920,847 | |||||||||
| Comprehensive income (loss) attributable to noncontrolling interests | (28) | (294) | |||||||||
| Comprehensive income (loss) attributable to Annaly | (317,514) | 921,141 | |||||||||
| Dividends on preferred stock | 106,527 | 101,067 | |||||||||
| Comprehensive income (loss) attributable to common stockholders | $ | (424,041) | $ | 820,074 | |||||||
6
Key Financial Data | ||
The following table presents key metrics of the Company’s portfolio, liabilities and hedging positions, and performance as of and for the quarters ended September 30, 2020, June 30, 2020, and September 30, 2019:
| September 30, 2020 | June 30, 2020 | September 30, 2019 | |||||||||||||||
| Portfolio related metrics | |||||||||||||||||
| Fixed-rate Residential Securities as a percentage of total Residential Securities | 98 | % | 98 | % | 97 | % | |||||||||||
| Adjustable-rate and floating-rate Residential Securities as a percentage of total Residential Securities | 2 | % | 2 | % | 3 | % | |||||||||||
| Weighted average experienced CPR for the period | 22.9 | % | 19.5 | % | 14.6 | % | |||||||||||
| Weighted average projected long-term CPR at period-end | 17.1 | % | 18.0 | % | 16.3 | % | |||||||||||
| Liabilities and hedging metrics | |||||||||||||||||
| Weighted average days to maturity on repurchase agreements outstanding at period-end | 72 | 74 | 45 | ||||||||||||||
Hedge ratio (1) | 48 | % | 40 | % | 73 | % | |||||||||||
Weighted average pay rate on interest rate swaps at period-end (2) | 0.91 | % | 1.01 | % | 1.88 | % | |||||||||||
Weighted average receive rate on interest rate swaps at period-end (2) | 0.48 | % | 0.75 | % | 2.16 | % | |||||||||||
Weighted average net rate on interest rate swaps at period-end (2) | 0.43 | % | 0.26 | % | (0.28 | %) | |||||||||||
Leverage at period-end (3) | 5.1:1 | 5.5:1 | 7.3:1 | ||||||||||||||
Economic leverage at period-end (4) | 6.2:1 | 6.4:1 | 7.7:1 | ||||||||||||||
| Capital ratio at period-end | 13.6 | % | 13.0 | % | 11.2 | % | |||||||||||
| Performance related metrics | |||||||||||||||||
| Book value per common share | $ | 8.70 | $ | 8.39 | $ | 9.21 | |||||||||||
GAAP net income (loss) per average common share (5) | $ | 0.70 | $ | 0.58 | $ | (0.54) | |||||||||||
| Annualized GAAP return (loss) on average equity | 29.02 | % | 25.84 | % | (19.32 | %) | |||||||||||
Net interest margin (6) | 2.15 | % | 1.89 | % | 0.48 | % | |||||||||||
Average yield on interest earning assets (7) | 2.70 | % | 2.77 | % | 2.89 | % | |||||||||||
Average GAAP cost of interest bearing liabilities (8) | 0.60 | % | 0.96 | % | 2.58 | % | |||||||||||
| Net interest spread | 2.10 | % | 1.81 | % | 0.31 | % | |||||||||||
| Dividend declared per common share | $ | 0.22 | $ | 0.22 | $ | 0.25 | |||||||||||
Annualized dividend yield (9) | 12.36 | % | 13.41 | % | 11.36 | % | |||||||||||
| Non-GAAP metrics * | |||||||||||||||||
Core earnings (excluding PAA) per average common share (5) | $ | 0.32 | $ | 0.27 | $ | 0.21 | |||||||||||
| Annualized core return on average equity (excluding PAA) | 13.79 | % | 12.82 | % | 8.85 | % | |||||||||||
Net interest margin (excluding PAA) (6) | 2.05 | % | 1.88 | % | 1.10 | % | |||||||||||
Average yield on interest earning assets (excluding PAA) (7) | 2.86 | % | 3.01 | % | 3.26 | % | |||||||||||
Average economic cost of interest bearing liabilities (8) | 0.93 | % | 1.29 | % | 2.28 | % | |||||||||||
| Net interest spread (excluding PAA) | 1.93 | % | 1.72 | % | 0.98 | % | |||||||||||
* Represents a non-GAAP financial measure. Please refer to the "Non-GAAP Financial Measures" section for additional information.
(1) Measures total notional balances of interest rate swaps, interest rate swaptions (excluding receiver swaptions) and futures relative to repurchase agreements, other secured financing and cost basis of TBA derivatives outstanding; excludes MSRs and the effects of term financing, both of which serve to reduce interest rate risk. Additionally, the hedge ratio does not take into consideration differences in duration between assets and liabilities.
(2) Excludes forward starting swaps.
(3) Debt consists of repurchase agreements, other secured financing, securitized debt and mortgages payable. Certain credit facilities (included within other secured financing), securitized debt and mortgages payable are non-recourse to the Company.
(4) Computed as the sum of recourse debt, cost basis of TBA and CMBX derivatives outstanding, and net forward purchases (sales) of investments divided by total equity.
(5) Net of dividends on preferred stock. The quarter ended September 30, 2019 excludes cumulative and undeclared dividends of $0.3 million on the Company's Series I Preferred Stock as of June 30, 2019.
(6) Net interest margin represents interest income less interest expense divided by average interest earning assets. Net interest margin (excluding PAA) represents the sum of interest income (excluding PAA) plus TBA dollar roll income and CMBX coupon income less interest expense and the net interest component of interest rate swaps divided by the sum of average interest earning assets plus average TBA contract and CMBX balances.
(7) Average yield on interest earning assets represents annualized interest income divided by average interest earning assets. Average interest earning assets reflects the average amortized cost of our investments during the period. Average yield on interest earning assets (excluding PAA) is calculated using annualized interest income (excluding PAA).
(8) Average GAAP cost of interest bearing liabilities represents annualized interest expense divided by average interest bearing liabilities. Average interest bearing liabilities reflects the average balances during the period. Average economic cost of interest bearing liabilities represents annualized economic interest expense divided by average interest bearing liabilities. Economic interest expense is comprised of GAAP interest expense and the net interest component of interest rate swaps.
(9) Based on the closing price of the Company’s common stock of $7.12, $6.56 and $8.80 at September 30, 2020, June 30, 2020 and September 30, 2019, respectively.
7
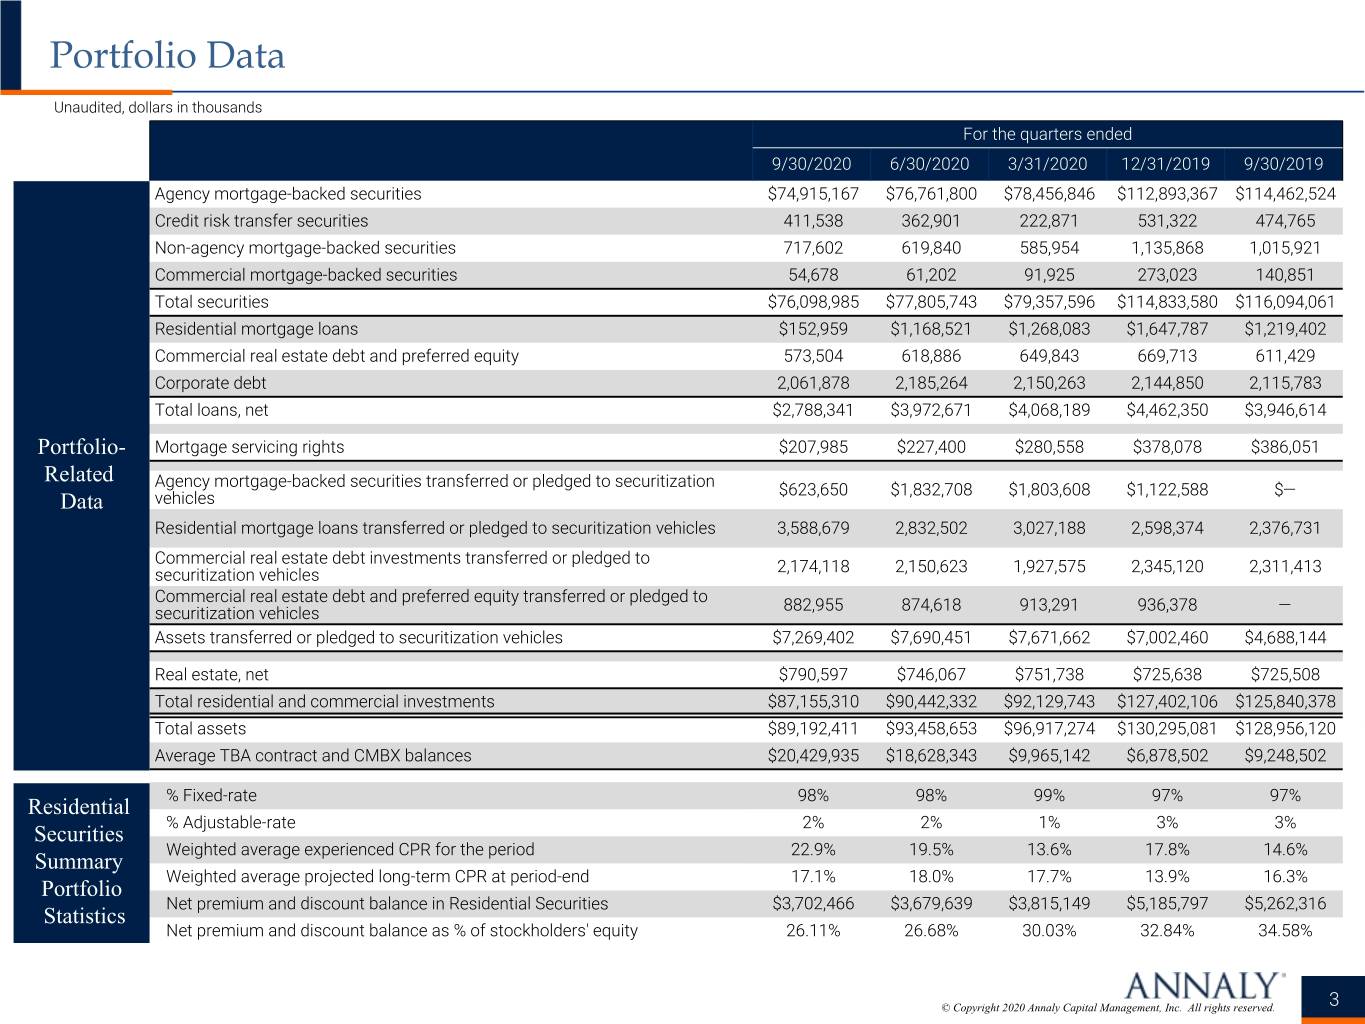
The following table contains additional information on our residential and commercial investments as of the dates presented:
| For the quarters ended | |||||||||||||||||
| September 30, 2020 | June 30, 2020 | September 30, 2019 | |||||||||||||||
| Agency mortgage-backed securities | $ | 74,915,167 | $ | 76,761,800 | $ | 114,462,524 | |||||||||||
| Credit risk transfer securities | 411,538 | 362,901 | 474,765 | ||||||||||||||
| Non-agency mortgage-backed securities | 717,602 | 619,840 | 1,015,921 | ||||||||||||||
| Commercial mortgage-backed securities | 54,678 | 61,202 | 140,851 | ||||||||||||||
| Total securities | $ | 76,098,985 | $ | 77,805,743 | $ | 116,094,061 | |||||||||||
| Residential mortgage loans | $ | 152,959 | $ | 1,168,521 | $ | 1,219,402 | |||||||||||
| Commercial real estate debt and preferred equity | 573,504 | 618,886 | 611,429 | ||||||||||||||
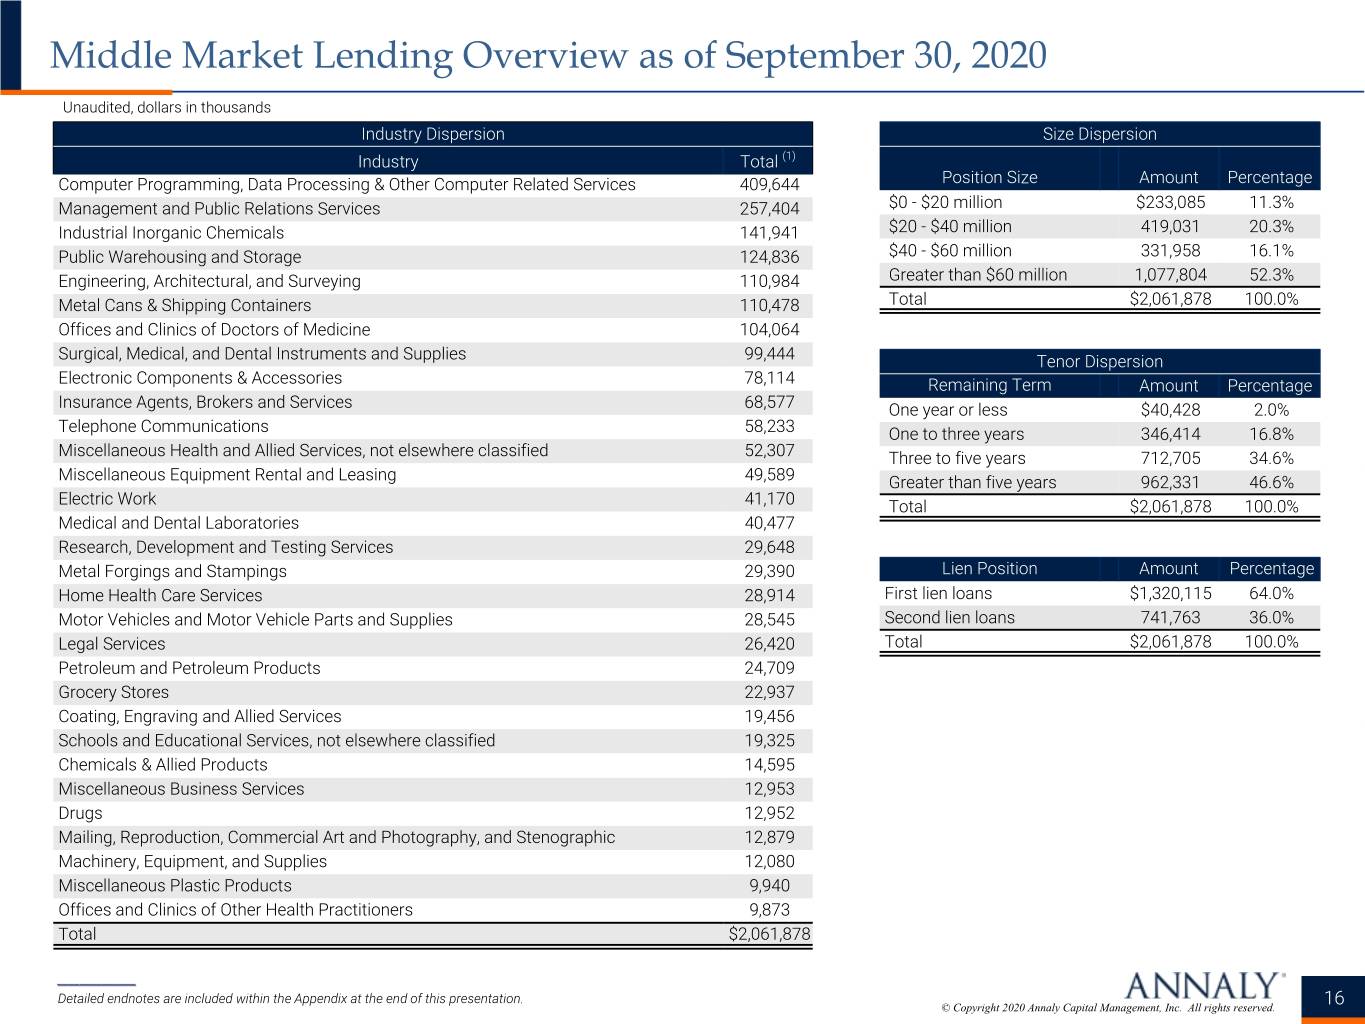
| Corporate debt | 2,061,878 | 2,185,264 | 2,115,783 | ||||||||||||||
| Loans held for sale | — | — | — | ||||||||||||||
| Total loans, net | $ | 2,788,341 | $ | 3,972,671 | $ | 3,946,614 | |||||||||||
| Mortgage servicing rights | $ | 207,985 | $ | 227,400 | $ | 386,051 | |||||||||||
| Agency mortgage-backed securities transferred or pledged to securitization vehicles | $ | 623,650 | $ | 1,832,708 | $ | — | |||||||||||
| Residential mortgage loans transferred or pledged to securitization vehicles | 3,588,679 | 2,832,502 | 2,376,731 | ||||||||||||||
| Commercial real estate debt investments transferred or pledged to securitization vehicles | 2,174,118 | 2,150,623 | 2,311,413 | ||||||||||||||
| Commercial real estate debt and preferred equity transferred or pledged to securitization vehicles | 882,955 | 874,618 | — | ||||||||||||||
| Assets transferred or pledged to securitization vehicles | $ | 7,269,402 | $ | 7,690,451 | $ | 4,688,144 | |||||||||||
| Real estate, net | $ | 790,597 | $ | 746,067 | $ | 725,508 | |||||||||||
| Total residential and commercial investments | $ | 87,155,310 | $ | 90,442,332 | $ | 125,840,378 | |||||||||||
8
Non-GAAP Financial Measures | ||
To supplement its consolidated financial statements, which are prepared and presented in accordance with U.S. generally accepted accounting principles ("GAAP"), the Company provides the following non-GAAP measures:
•core earnings (excluding PAA);
•core earnings (excluding PAA) attributable to common stockholders;
•core earnings (excluding PAA) per average common share;
•annualized core return on average equity (excluding PAA);
•interest income (excluding PAA);
•economic interest expense;
•economic net interest income (excluding PAA);
•average yield on interest earning assets (excluding PAA);
•average economic cost of interest bearing liabilities;
•net interest margin (excluding PAA); and
•net interest spread (excluding PAA).
These measures should not be considered a substitute for, or superior to, financial measures computed in accordance with GAAP. While intended to offer a fuller understanding of the Company’s results and operations, non-GAAP financial measures also have limitations. For example, the Company may calculate its non-GAAP metrics, such as core earnings (excluding PAA), or the PAA, differently than its peers making comparative analysis difficult. Additionally, in the case of non-GAAP measures that exclude the PAA, the amount of amortization expense excluding the PAA is not necessarily representative of the amount of future periodic amortization nor is it indicative of the term over which the Company will amortize the remaining unamortized premium. Changes to actual and estimated prepayments will impact the timing and amount of premium amortization and, as such, both GAAP and non-GAAP results.
These non-GAAP measures provide additional detail to enhance investor understanding of the Company’s period-over-period operating performance and business trends, as well as for assessing the Company’s performance versus that of industry peers. Additional information pertaining to the Company’s use of these non-GAAP financial measures, including discussion of how each such measure may be useful to investors, and reconciliations to their most directly comparable GAAP results are provided below.
Core earnings (excluding PAA), core earnings (excluding PAA) attributable to common stockholders, core earnings (excluding PAA) per average common share and annualized core return on average equity (excluding PAA)
The Company's principal business objective is to generate net income for distribution to its stockholders and to preserve capital through prudent selection of investments and continuous management of its portfolio. The Company generates net income by earning a net interest spread on its investment portfolio, which is a function of interest income from its investment portfolio less financing, hedging and operating costs. Core earnings (excluding PAA), which is defined as the sum of (a) economic net interest income, (b) TBA dollar roll income and CMBX coupon income, (c) realized amortization of MSRs, (d) other income (loss) (excluding depreciation expense related to commercial real estate and amortization of intangibles, non-core income allocated to equity method investments and other non-core components of other income (loss)), (e) general and administrative expenses (excluding transaction expenses and non-recurring items), and (f) income taxes (excluding the income tax effect of non-core income (loss) items) and excludes (g) the premium amortization adjustment ("PAA") representing the cumulative impact on prior periods, but not the current period, of quarter-over-quarter changes in estimated long-term prepayment speeds related to the Company’s Agency mortgage-backed securities is used by the Company's management and, the Company believes, used by analysts and investors to measure its progress in achieving its principal business objective.
The Company seeks to fulfill this objective through a variety of factors including portfolio construction, the degree of market risk exposure and related hedge profile, and the use and forms of leverage, all while operating within the parameters of the Company's capital allocation policy and risk governance framework.
The Company believes these non-GAAP measures provide management and investors with additional details regarding the Company’s underlying operating results and investment portfolio trends by (i) making adjustments to account for the disparate reporting of changes in fair value where certain instruments are reflected in GAAP net income (loss) while others are reflected in other comprehensive income (loss) and (ii) by excluding certain unrealized, non-cash or episodic components of GAAP net income (loss) in order to provide additional transparency into the operating performance of the Company’s portfolio. Annualized core return on average equity (excluding PAA), which is calculated by dividing core earnings (excluding PAA) over average stockholders’ equity, provides investors with additional detail on the core earnings (excluding PAA) generated by the Company’s invested equity capital.
9
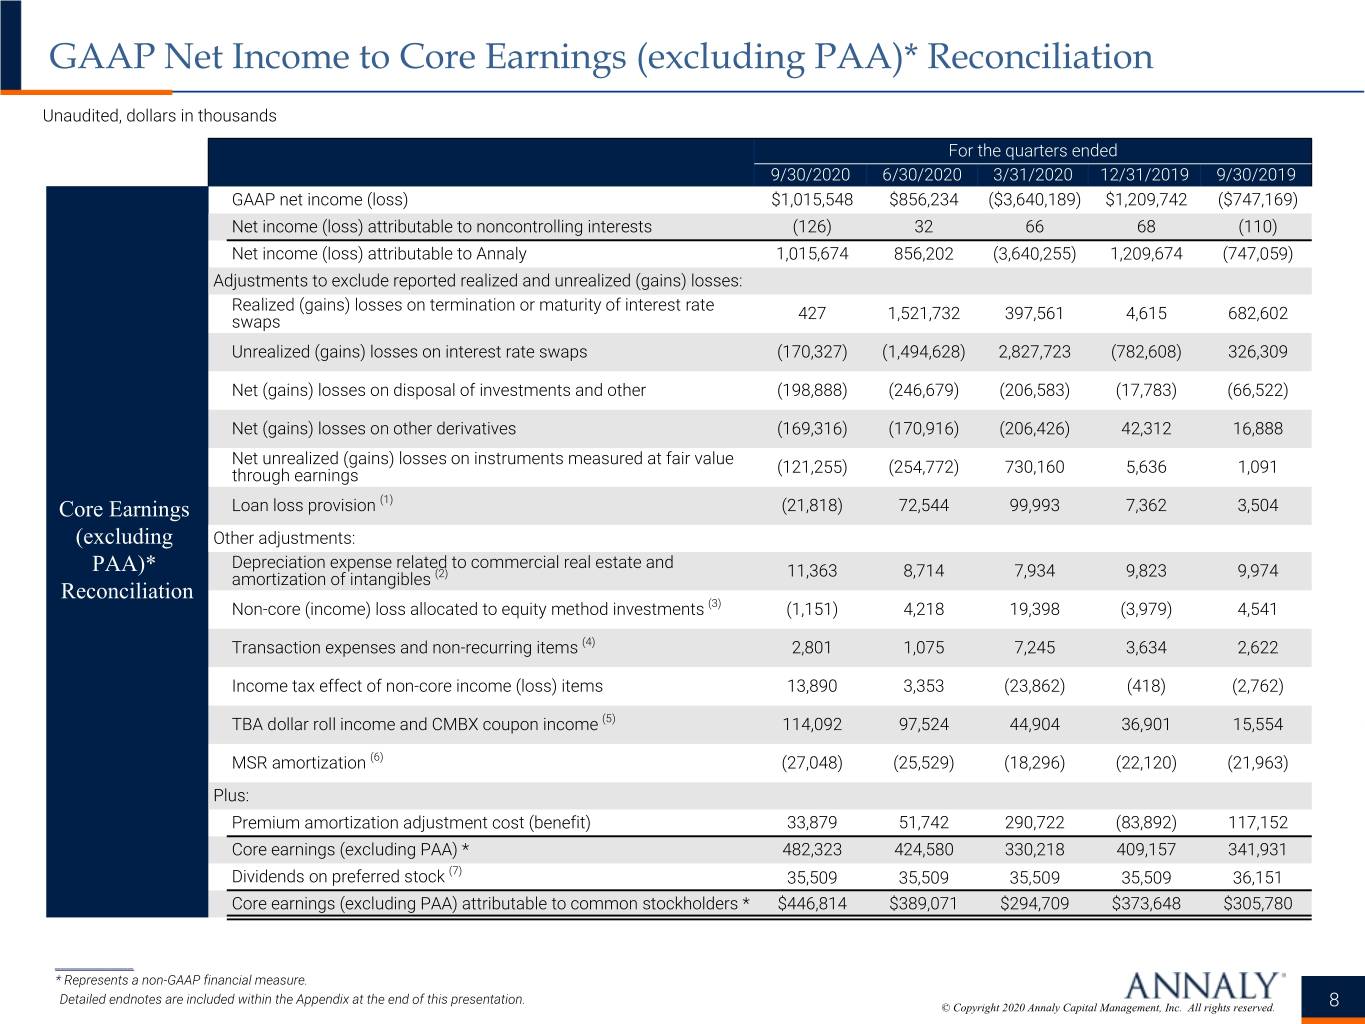
The following table presents a reconciliation of GAAP financial results to non-GAAP core earnings (excluding PAA) for the periods presented:
| For the quarters ended | |||||||||||||||||
| September 30, 2020 | June 30, 2020 | September 30, 2019 | |||||||||||||||
| (dollars in thousands, except per share data) | |||||||||||||||||
| GAAP net income (loss) | $ | 1,015,548 | $ | 856,234 | $ | (747,169) | |||||||||||
| Net income (loss) attributable to noncontrolling interests | (126) | 32 | (110) | ||||||||||||||
| Net income (loss) attributable to Annaly | 1,015,674 | 856,202 | (747,059) | ||||||||||||||
| Adjustments to exclude reported realized and unrealized (gains) losses | |||||||||||||||||
| Realized (gains) losses on termination or maturity of interest rate swaps | 427 | 1,521,732 | 682,602 | ||||||||||||||
| Unrealized (gains) losses on interest rate swaps | (170,327) | (1,494,628) | 326,309 | ||||||||||||||
| Net (gains) losses on disposal of investments and other | (198,888) | (246,679) | (66,522) | ||||||||||||||
| Net (gains) losses on other derivatives | (169,316) | (170,916) | 16,888 | ||||||||||||||
| Net unrealized (gains) losses on instruments measured at fair value through earnings | (121,255) | (254,772) | 1,091 | ||||||||||||||
Loan loss provision (1) | (21,818) | 72,544 | 3,504 | ||||||||||||||
| Other adjustments | |||||||||||||||||
| Depreciation expense related to commercial real estate and amortization of intangibles | 11,363 | 8,714 | 9,974 | ||||||||||||||
Non-core (income) loss allocated to equity method investments (2) | (1,151) | 4,218 | 4,541 | ||||||||||||||
Transaction expenses and non-recurring items (3) | 2,801 | 1,075 | 2,622 | ||||||||||||||
| Income tax effect of non-core income (loss) items | 13,890 | 3,353 | (2,762) | ||||||||||||||
TBA dollar roll income and CMBX coupon income (4) | 114,092 | 97,524 | 15,554 | ||||||||||||||
MSR amortization (5) | (27,048) | (25,529) | (21,963) | ||||||||||||||
| Plus: | |||||||||||||||||
| Premium amortization adjustment cost (benefit) | 33,879 | 51,742 | 117,152 | ||||||||||||||
| Core earnings (excluding PAA) * | 482,323 | 424,580 | 341,931 | ||||||||||||||
| Dividends on preferred stock | 35,509 | 35,509 | 36,151 | ||||||||||||||
| Core earnings (excluding PAA) attributable to common stockholders * | $ | 446,814 | $ | 389,071 | $ | 305,780 | |||||||||||
| GAAP net income (loss) per average common share | $ | 0.70 | $ | 0.58 | $ | (0.54) | |||||||||||
| Core earnings (excluding PAA) per average common share * | $ | 0.32 | $ | 0.27 | $ | 0.21 | |||||||||||
| Annualized GAAP return (loss) on average equity | 29.02 | % | 25.84 | % | (19.32 | %) | |||||||||||
| Annualized core return on average equity (excluding PAA) * | 13.79 | % | 12.82 | % | 8.85 | % | |||||||||||
* Represents a non-GAAP financial measure.
(1) Includes $0.2 million and $3.8 million of loss provision on the Company’s unfunded loan commitments for the quarters ended September 30, 2020 and June 30, 2020, respectively, which is reported in Other income (loss) in the Company’s Consolidated Statements of Comprehensive Income (Loss).
(2) The Company excludes non-core (income) loss allocated to equity method investments, which represents the unrealized (gains) losses allocated to equity interests in a portfolio of MSR, which is a component of Other income (loss).
(3) The quarters ended September 30, 2020 and September 30, 2019 includes costs incurred in connection with securitizations of residential whole loans. The quarters ended June 30, 2020 include costs incurred in connection with the Internalization and costs incurred in connection with the CEO search process.
(4) TBA dollar roll income and CMBX coupon income each represent a component of Net gains (losses) on other derivatives. CMBX coupon income totaled $1.5 million, $1.6 million and $1.5 million for the quarters ended September 30, 2020, June 30, 2020 and September 30, 2019, respectively.
(5) MSR amortization represents the portion of changes in fair value that is attributable to the realization of estimated cash flows on the Company’s MSR portfolio and is reported as a component of Net unrealized gains (losses) on instruments measured at fair value.
10
From time to time, the Company enters into TBA forward contracts as an alternate means of investing in and financing Agency mortgage-backed securities. A TBA contract is an agreement to purchase or sell, for future delivery, an Agency mortgage-backed security with a specified issuer, term and coupon. A TBA dollar roll represents a transaction where TBA contracts with the same terms but different settlement dates are simultaneously bought and sold. The TBA contract settling in the later month typically prices at a discount to the earlier month contract with the difference in price commonly referred to as the "drop". The drop is a reflection of the expected net interest income from an investment in similar Agency mortgage-backed securities, net of an implied financing cost, that would be foregone as a result of settling the contract in the later month rather than in the earlier month. The drop between the current settlement month price and the forward settlement month price occurs because in the TBA dollar roll market, the party providing the financing is the party that would retain all principal and interest payments accrued during the financing period. Accordingly, TBA dollar roll income generally represents the economic equivalent of the net interest income earned on the underlying Agency mortgage-backed security less an implied financing cost.
TBA dollar roll transactions are accounted for under GAAP as a series of derivatives transactions. The fair value of TBA derivatives is based on methods similar to those used to value Agency mortgage-backed securities. The Company records TBA derivatives at fair value on its Consolidated Statements of Financial Condition and recognizes periodic changes in fair value in Net gains (losses) on other derivatives in the Consolidated Statements of Comprehensive Income (Loss), which includes both unrealized and realized gains and losses on derivatives (excluding interest rate swaps).
TBA dollar roll income is calculated as the difference in price between two TBA contracts with the same terms but different settlement dates multiplied by the notional amount of the TBA contract. Although accounted for as derivatives, TBA dollar rolls capture the economic equivalent of net interest income, or carry, on the underlying Agency mortgage-backed security (interest income less an implied cost of financing). TBA dollar roll income is reported as a component of Net gains (losses) on other derivatives in the Consolidated Statements of Comprehensive Income (Loss).
The CMBX index is a synthetic tradable index referencing a basket of 25 commercial mortgage-backed securities ("CMBS") of a particular rating and vintage. The CMBX index allows investors to take a long exposure (referred to as selling protection) or short exposure (referred to as buying protection) on the respective basket of CMBS securities and is structured as a "pay-as-you-go" contract whereby the protection buyer pays to the protection seller a standardized running coupon on the contracted notional amount. The Company reports income (expense) on CMBX positions in Net gains (losses) on other derivatives in the Consolidated Statements of Comprehensive Income (Loss). The coupon payments received or paid on CMBX positions are equivalent to interest income (expense) and therefore included in core earnings (excluding PAA).
Premium Amortization Expense
In accordance with GAAP, the Company amortizes or accretes premiums or discounts into interest income for its Agency mortgage-backed securities, excluding interest-only securities, multifamily and reverse mortgages, taking into account estimates of future principal prepayments in the calculation of the effective yield. The Company recalculates the effective yield as differences between anticipated and actual prepayments occur. Using third-party model and market information to project future cash flows and expected remaining lives of securities, the effective interest rate determined for each security is applied as if it had been in place from the date of the security’s acquisition. The amortized cost of the security is then adjusted to the amount that would have existed had the new effective yield been applied since the acquisition date. The adjustment to amortized cost is offset with a charge or credit to interest income. Changes in interest rates and other market factors will impact prepayment speed projections and the amount of premium amortization recognized in any given period.
The Company’s GAAP metrics include the unadjusted impact of amortization and accretion associated with this method. Certain of the Company’s non-GAAP metrics exclude the effect of the PAA, which quantifies the component of premium amortization representing the cumulative impact on prior periods, but not the current period, of quarter-over-quarter changes in estimated long-term CPR.
The following table illustrates the impact of the PAA on premium amortization expense for the Company’s Residential Securities portfolio and residential securities transferred or pledged to securitization vehicles, for the quarters ended September 30, 2020, June 30, 2020, and September 30, 2019:
| For the quarters ended | |||||||||||||||||
| September 30, 2020 | June 30, 2020 | September 30, 2019 | |||||||||||||||
| (dollars in thousands) | |||||||||||||||||
| Premium amortization expense (accretion) | $ | 248,718 | $ | 270,688 | $ | 376,306 | |||||||||||
| Less: PAA cost (benefit) | 33,879 | 51,742 | 117,152 | ||||||||||||||
| Premium amortization expense (excluding PAA) | $ | 214,839 | $ | 218,946 | $ | 259,154 | |||||||||||
11
Interest income (excluding PAA), economic interest expense and economic net interest income (excluding PAA)
Interest income (excluding PAA) represents interest income excluding the effect of the PAA, and serves as the basis for deriving average yield on interest earning assets (excluding PAA), net interest spread (excluding PAA) and net interest margin (excluding PAA), which are discussed below. The Company believes this measure provides management and investors with additional detail to enhance their understanding of the Company’s operating results and trends by excluding the component of premium amortization expense representing the cumulative impact on prior periods, but not the current period, of quarter-over-quarter changes in estimated long-term prepayment speeds related to the Company’s Agency mortgage-backed securities (other than interest-only securities, multifamily and reverse mortgages), which can obscure underlying trends in the performance of the portfolio.
Economic interest expense includes GAAP interest expense and the net interest component of interest rate swaps. The Company uses interest rate swaps to manage its exposure to changing interest rates on its repurchase agreements by economically hedging cash flows associated with these borrowings. Accordingly, adding the net interest component of interest rate swaps to interest expense, as computed in accordance with GAAP, reflects the total contractual interest expense and thus, provides investors with additional information about the cost of the Company's financing strategy. The Company may use market agreed coupon (“MAC”) interest rate swaps in which the Company may receive or make a payment at the time of entering into such interest rate swap to compensate for the off-market nature of such interest rate swap. In accordance with GAAP, upfront payments associated with MAC interest rate swaps are not reflected in the net interest component of interest rate swaps in the Company's Consolidated Statements of Comprehensive Income (Loss). The Company did not enter into any MAC interest rate swaps during the quarter ended September 30, 2020.
Similarly, economic net interest income (excluding PAA), as computed below, provides investors with additional information to enhance their understanding of the net economics of our primary business operations.
| For the quarters ended | |||||||||||||||||
| September 30, 2020 | June 30, 2020 | September 30, 2019 | |||||||||||||||
| Interest income (excluding PAA) reconciliation | (dollars in thousands) | ||||||||||||||||
| GAAP interest income | $ | 562,443 | $ | 584,812 | $ | 919,299 | |||||||||||
| Premium amortization adjustment | 33,879 | 51,742 | 117,152 | ||||||||||||||
| Interest income (excluding PAA) * | $ | 596,322 | $ | 636,554 | $ | 1,036,451 | |||||||||||
| Economic interest expense reconciliation | |||||||||||||||||
| GAAP interest expense | $ | 115,126 | $ | 186,032 | $ | 766,905 | |||||||||||
| Add: | |||||||||||||||||
| Net interest component of interest rate swaps | 62,529 | 64,561 | (88,466) | ||||||||||||||
| Economic interest expense * | $ | 177,655 | $ | 250,593 | $ | 678,439 | |||||||||||
| Economic net interest income (excluding PAA) reconciliation | |||||||||||||||||
| Interest income (excluding PAA) * | $ | 596,322 | $ | 636,554 | $ | 1,036,451 | |||||||||||
| Less: | |||||||||||||||||
| Economic interest expense * | 177,655 | 250,593 | 678,439 | ||||||||||||||
| Economic net interest income (excluding PAA) * | $ | 418,667 | $ | 385,961 | $ | 358,012 | |||||||||||
* Represents a non-GAAP financial measure. | |||||||||||||||||
Average yield on interest earning assets (excluding PAA), net interest spread (excluding PAA), net interest margin (excluding PAA) and average economic cost of interest bearing liabilities
Net interest spread (excluding PAA), which is the difference between the average yield on interest earning assets (excluding PAA) and the average economic cost of interest bearing liabilities, which represents annualized economic interest expense divided by average interest bearing liabilities, and net interest margin (excluding PAA), which is calculated as the sum of interest income (excluding PAA) plus TBA dollar roll income and CMBX coupon income less interest expense and the net interest component of interest rate swaps divided by the sum of average interest earning assets plus average TBA contract and CMBX balances, provide management with additional measures of the Company’s profitability that management relies upon in monitoring the performance of the business.
12
Disclosure of these measures, which are presented below, provides investors with additional detail regarding how management evaluates the Company’s performance.
| For the quarters ended | |||||||||||||||||
| September 30, 2020 | June 30, 2020 | September 30, 2019 | |||||||||||||||
| Economic metrics (excluding PAA) | (dollars in thousands) | ||||||||||||||||
| Average interest earning assets | $ | 83,286,119 | $ | 84,471,839 | $ | 127,207,668 | |||||||||||
| Interest income (excluding PAA) * | $ | 596,322 | $ | 636,554 | $ | 1,036,451 | |||||||||||
| Average yield on interest earning assets (excluding PAA) * | 2.86 | % | 3.01 | % | 3.26 | % | |||||||||||
| Average interest bearing liabilities | $ | 74,901,128 | $ | 76,712,894 | $ | 116,391,094 | |||||||||||
| Economic interest expense * | $ | 177,655 | $ | 250,593 | $ | 678,439 | |||||||||||
| Average economic cost of interest bearing liabilities * | 0.93 | % | 1.29 | % | 2.28 | % | |||||||||||
| Economic net interest income (excluding PAA) * | $ | 418,667 | $ | 385,961 | $ | 358,012 | |||||||||||
| Net interest spread (excluding PAA) * | 1.93 | % | 1.72 | % | 0.98 | % | |||||||||||
| Interest income (excluding PAA) * | $ | 596,322 | $ | 636,554 | $ | 1,036,451 | |||||||||||
| TBA dollar roll income and CMBX coupon income | 114,092 | 97,524 | 15,554 | ||||||||||||||
| Interest expense | (115,126) | (186,032) | (766,905) | ||||||||||||||
| Net interest component of interest rate swaps | (62,529) | (64,561) | 88,466 | ||||||||||||||
| Subtotal | $ | 532,759 | $ | 483,485 | $ | 373,566 | |||||||||||
| Average interest earnings assets | $ | 83,286,119 | $ | 84,471,839 | $ | 127,207,668 | |||||||||||
| Average TBA contract and CMBX balances | 20,429,935 | 18,628,343 | 9,248,502 | ||||||||||||||
| Subtotal | $ | 103,716,054 | $ | 103,100,182 | $ | 136,456,170 | |||||||||||
| Net interest margin (excluding PAA) * | 2.05 | % | 1.88 | % | 1.10 | % | |||||||||||
* Represents a non-GAAP financial measure. | |||||||||||||||||
13