Exhibit 99.1

Q2 I 2026 Shareholder Letter The Learning Experience
| Q2 2026 EARNINGS RELEASE |
0 2 |
In this release
| 01 | A Note to Our Shareholders | 03 | ||||||||
| 02 | Second Quarter Financial Highlights | 06 | ||||||||
| 03 | Second Quarter 2026 Key Results | 07 | ||||||||
| 04 | Third Quarter and Full Year 2026 Outlook | 08 | ||||||||
| 05 | Financial Discussion | 09 | ||||||||
| 06 | Condensed Consolidated Financial Statements | 12 | ||||||||
| 07 | Non-GAAP Reconciliations | 15 | ||||||||
| 08 | Key Operating Metrics | 17 | ||||||||
| 09 | Key Performance Metrics and Non-GAAP Financial Measures | 18 | ||||||||
| 10 | Forward-Looking Statements | 20 | ||||||||
| NERDY INC.• NYSE: NRDY | Q2 2026 | |
| Q2 2026 EARNINGS RELEASE |
0 3 |
Dear Shareholders,
Q2 demonstrated continued improvement in Nerdy’s operating performance and made clearer what the company is becoming: a focused Consumer learning company built around one connected system for learning, tutoring, and progress.
Total revenue was $43.3 million, with Consumer generating $36.5 million, or 84% of total revenue. Gross margin expanded 320 basis points to 64.7%. Net loss improved to $6.9 million from $12.0 million. Our non-GAAP adjusted EBITDA loss narrowed 68% to $0.9 million from $2.7 million, ahead of the midpoint of our guidance range.
Alongside that progress, we have made two decisions that have narrowed the Company’s focus to its highest-return opportunity. We decided to wind down Varsity Tutors for Schools (“VT4S”) and exit First Tutors, a small, legacy tutoring property in the United Kingdom. This decision concentrates our people, capital, and product development on the part of Nerdy where we have the strongest brand, the deepest operating experience, and the greatest opportunity to build a differentiated learning experience for consumers. We believe the market opportunity is significantly larger and the potential returns on our investments are substantially higher and we’ve been encouraged by the progress in our consumer product and business.
Concentrating Nerdy on Consumer
Consumer revenue was $36.5 million in Q2. Average Revenue per Member per Month (“ARPM”) was $366, up 5% year over year. Learning Memberships were 29.1 thousand at June 30, down 5% year over year, with the rate of decline moderating for the fourth consecutive quarter.
Returning the member base to durable growth remains an important objective this back-to-school season. The rate of decline has continued to narrow while ARPM, gross margin, and operating efficiency have improved. We expect the stronger product experience described below to support retention and acquisition as we move through the back-to-school season and into 2027.
We are reducing our full-year revenue outlook to $168 million to $175 million from $180 million to $190 million. The reduction reflects the removal of expected Varsity Tutors for Schools and First Tutors revenue. Q3 is seasonally our lowest revenue quarter, with the back-to-school cohort beginning to convert into revenue late in Q3 and continuing into Q4. That seasonality, together with the institutional wind-down, is reflected in our Q3 non-GAAP adjusted EBITDA guidance of negative $9 million to negative $6 million, excluding exit costs. Our revised full-year non-GAAP adjusted EBITDA outlook is negative $4 million to approximately breakeven, excluding exit costs.
| NERDY INC.• NYSE: NRDY | Q2 2026 | |
| Q2 2026 EARNINGS RELEASE |
0 4 |
A Smaller Team Building More
Total headcount at the end of Q2 was down 34% year over year. Our engineering organization was 30% smaller than it was a year ago and delivered substantially more product output. We incurred $2.0 million of Al-related expenses during the quarter, which is up sharply from the prior year, which we’re actively moderating and getting more intelligent around. We used variable Al expense to accelerate that work without adding the permanent headcount that a traditional production model would have required. This is one of the most tangible ways Al is changing Nerdy. It allows a smaller organization to build faster, operate with fewer fixed costs, and direct more resources toward the customer experience.
The result is not one isolated product release. Since the beginning of 2026, we have launched or rebuilt almost every piece of the digital learning experience surrounding our live tutoring product and our complimentary non-tutoring products. This will be a significant step up in breadth and quality of our offerings for our customers.
From Tutoring Sessions to a Continuous Learning Plan
Our library now includes more than 15,000 lessons covering each skill within 220 discrete subjects. The lessons are available in 2 formats. The first is a dynamic textbook-style format for self-study purposes. The second is a presentation-style format for tutors to use in live tutoring sessions so that we have prepared, structured lessons for almost every subject. We believe this can up-level the experience across millions of tutoring sessions each year.
We extended adaptive diagnostics, quizzes, full-length practice tests, flashcards and the lessons I mentioned to those 200+ subjects and we’re weaving them together into what we’re calling a Study Plan. A study plan is a software-based way to track and plan activities over time in pursuit of a goal and can serve as the common system to help drive daily active usage and provide value before, during, and after tutoring sessions in pursuit of that long-term goal.
The importance of this work is not the volume of content alone. Every lesson, diagnostic question, quiz, worksheet, and activity is organized against a shared academic taxonomy. That structure allows a diagnostic to identify a skill gap, the Study Plan to recommend the appropriate next activity, and a tutor to use the same information when deciding what the Learner should do next.
The Study Plan brings together four elements that our product previously handled discretely: the Learner’s goal, the time available to reach it, the skills already mastered, and the combination of lessons, practice, diagnostics, and live tutoring most likely to produce progress. The same plan is visible to the student, the tutor, and within the Live Learning Platform during a tutoring session. It is now a core part of the Learning Membership experience and in August will be extended to 100% of tutoring relationships.
| NERDY INC.• NYSE: NRDY | Q2 2026 | |
| Q2 2026 EARNINGS RELEASE |
0 5 |
Historically, the tutoring session was often perceived as the product and the customer interactions could become quiet in between tutoring sessions. We are building a platform in which the Study Plan highlights all the different ways to learn a subject in between and during live tutoring sessions and where it can serve as the daily active drumbeat to engagement.
Our historical experience from 10+ million hours of live tutoring and many more practice activities is driving personalization and our approach to how we’re sequencing learning. That combination of Al and human expertise is what we mean by Al for HI®.
Turning Product Progress into Growth
The same product infrastructure can support a more efficient acquisition and activation model. Historically, the vast majority of our customers converted via a telesales-assisted consultative sales process. Under the new model, learners can register online, better see and experience the platform, purchase a learning membership via a self-service checkout funnel. We believe this modern approach creates a substantially lower-cost, more scalable customer acquisition model while improving the customer experience.
In Closing
We are entering this back to school season as a more focused, lean company with higher quality products and a more efficient operating model which we believe positions us well for the year ahead.
Thank you for your continued support.
Chuck Cohn
Founder, Chairman & CEO
| NERDY INC.• NYSE: NRDY | Q2 2026 | |
| Q2 2026 EARNINGS RELEASE |
0 6 |
Second Quarter Financial Highlights
Revenue In Line with Expectations - Revenue of $43.3 million was in line with our guidance range of $42 million to $44 million, and represented a decrease of 4% year-over-year from $45.3 million during the same period in 2025. Consistent with expectations, revenue decreased when compared to the prior year period due to lower Consumer and Institutional revenue. The decrease in Consumer revenue was primarily driven by a lower Active Member count, partially offset by higher ARPM. As we began to lap the price increases enacted in February 2025, the rate of ARPM growth moderated year-over-year.
Consumer Revenue - Consumer revenue recognized in the second quarter was $36.5 million and represented 84% of total Company revenue. As of June 30, 2026, ARPM was $366, a 5% increase year-over-year. As of June 30, 2026, there were 29.1 thousand Active Members, a 5% decrease year-over-year. This rate of decline has narrowed sequentially for four consecutive quarters, and we expect to return to positive growth by the end of 2026.
Gross Margin - Gross margin was 64.7% for the three months ended June 30, 2026, compared to a gross margin of 61.5% during the comparable period in 2025. The increase in gross margin was primarily driven by lower amortization of capitalized internal-use software as a result of a charge for the abandonment of capitalized internal-use software that occurred in Q4 2025, coupled with lower Expert costs when compared to the prior year period.
Adjusted EBITDA Loss Improves Compared to Last Year; also In Line with Expectations - Net loss was $6.9 million in the second quarter versus a net loss of $12.0 million during the same period in 2025. Excluding non-cash stock compensation expenses and restructuring costs, which were treated as an adjustment for non-GAAP measures, non-GAAP adjusted net loss was $2.1 million for the second quarter of 2026 compared to a non-GAAP adjusted net loss of $4.5 million in the second quarter of 2025. We reported a non-GAAP adjusted EBITDA loss of $0.9 million for the second quarter of 2026, in line with our guidance of negative $2 million to breakeven. This compares to a non-GAAP adjusted EBITDA loss of $2.7 million in the same period one year ago. Non-GAAP adjusted EBITDA performance relative to guidance was driven by lower marketing spend, reduced variable staffing costs, and strong G&A cost control. These impacts were partially offset by higher Al costs. Non-GAAP adjusted EBITDA performance relative to the prior year period was driven by reduced variable staffing costs, efficiency improvements, and strong cost control. These impacts were also partially offset by higher Al costs.
Liquidity and Capital Resources - As of June 30, 2026, the Company’s principal sources of liquidity were cash and cash equivalents of $38.4 million. With our cash on hand and the funding available under our term loan, we believe we have ample liquidity to fund operations and growth initiatives, as we execute toward free cash flow positive.
See pages 15 and 16 for reconciliations of non-GAAP measures to the most directly comparable GAAP financial measure.
| NERDY INC.• NYSE: NRDY | Q2 2026 | |
| Q2 2026 EARNINGS RELEASE |
0 7 |
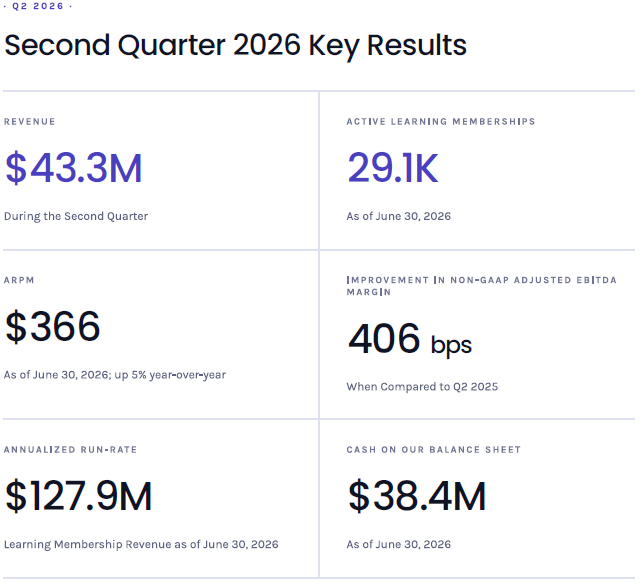
·Q22026· Second Quarter 2026 Key Results REVENUE $43.3M During the Second Quarter ACTIVE LEARNING MEMBERSHIPS 29.1K As of June 30, 2026 ARPM IMPROVEMENT IN NON-GAAP ADJUSTED EBITDA MARGIN $366 406 bps As of June 30, 2026; up 5% year-over-year When Compared to Q2 2025 ANNUALIZED RUN-RATE $127.9M Learning Membership Revenue as of June 30, 2026 CASH ON OUR BALANCE SHEET $38.4M As of June 30, 2026
| NERDY INC.• NYSE: NRDY | Q2 2026 | |
| Q2 2026 EARNINGS RELEASE |
0 8 |
Third Quarter and Full Year 2026 Outlook
As discussed, we have made two decisions, both aimed at sharpening our focus on the core business.
First. we exited First Tutors. a small tutoring business in the United Kingdom. It is immaterial to our results. and the decision is about focus rather than economics. Second, we are shutting down Varsity Tutors for Schools to concentrate on Consumer – our core business, where the opportunity is significantly larger and where our resources and management bandwidth earn better returns. Together, these decisions simplify the Company and put our capital behind our highest-return assets. We expect that focus to show up in execution.
We expect to incur approximately $2 million to $4 million of exit-related costs, primarily in Q3.
With the Varsity Tutors for Schools exit, we are lowering our annual fixed cost run-rate by approximately $11 million.
The decision does have a near-term impact on our outlook, most notably on cash, and the guidance we are establishing today reflects that. Excluding the exit, our full year outlook is largely unchanged from our previously announced revenue, non-GAAP adjusted EBITDA and cash guidance.
Revenue Guidance
| • | For the third quarter of 2026, we expect revenue in the range of $32 million to $35 million. |
| • | For the full year of 2026, we expect revenue in the range of $168 million to $175 million, compared to our prior range of $180 to $190 million. |
Adjusted EBITDA Guidance
| • | For the third quarter of 2026, we expect non-GAAP adjusted EBITDA in the range of negative $9 million to negative $6 million, excluding exit costs. |
| • | For the full year of 2026, we expect non-GAAP adjusted EBITDA in the range of negative $4 million to approximately breakeven, excluding exit costs. |
As a reminder, the third quarter is seasonally our lowest revenue quarter, with our back-to-school cohort converting to revenue late in the third quarter and into the fourth.
We now expect to end the year with approximately $30 to $32 million of cash, inclusive of the $20 million drawn on our term loan, compared to our prior expectation of $40 to $45 million. The change is primarily due to the timing of VT4S collections and the expected costs of the wind-down. VT4S contracts were generally paid in advance and recognized as revenue over the following twelve months. Exiting ahead of its peak booking period reduces the cash collections and year-end cash balance assumptions embedded in our prior outlook. To be clear, the year-end cash balance change is not a reflection on changed economics of the Consumer business. rather the working capital cycle of the business we are exiting. Based on our current operating plan, we expect existing liquidity to fund the company through free-cash-flow breakeven.
| NERDY INC.• NYSE: NRDY | Q2 2026 | |
| Q2 2026 EARNINGS RELEASE |
0 9 |
Financial Discussion
Revenue
Revenue for the three months ended June 30, 2026, was $43.3 million, a decrease of 4% from $45.3 million during the same period in 2025. Revenue for the six months ended June 30, 2026 was $92.0 million, a decrease of 1% from $92.9 million during the same period in 2025.
Revenue for the three months ended June 30, 2026 decreased when compared to the prior year period due to lower Consumer and Institutional revenue. The decrease in Consumer revenue was primarily driven by a lower Active Member count, partially offset by higher ARPM. As we began to lap the price increases enacted in February 2025, the rate of ARPM growth moderated year-over-year. Revenue for the six months ended June 30, 2026, decreased slightly when compared to the prior year period primarily due to lower Institutional revenue. Consumer revenue was relatively flat year-over-year as a lower Active Member count was offset by higher ARPM, which was primarily a result of price increases enacted in February 2025. While both current year periods were impacted by a lower Active Member count when compared to the corresponding prior year periods, the rate of decline has narrowed sequentially for four consecutive quarters, and we expect to return to positive Active Member growth by the end of 2026.
Gross Profit and Gross Margin
Gross profit of $28.0 million for the three months ended June 30, 2026 increased by $0.1 million or 1% compared to the same period in 2025. Gross profit of $60.3 million for the six months ended June 30, 2026, increased by $4.8 million or 9% compared to the same period in 2025. Gross margin was 64.7% and 61.5% for the three months ended June 30, 2026 and 2025, respectively. Gross margin was 65.5% and 59.7% for the six months ended June 30, 2026 and 2025, respectively.
Cost of revenue included amortization expense related to capitalized internal-use software of $0.6 million and $1.7 million for the three months ended June 30, 2026 and 2025, respectively, and $1.1 million and $3.4 million for the six months ended June 30, 2026 and 2025, respectively. Gross profit and gross margin improvements for the three and six months ended June 30, 2026, were primarily driven by lower amortization of capitalized internal-use software as a result of a charge for the abandonment of capitalized internal-use software that occurred in Q4 2025, coupled with lower Expert costs when compared to the corresponding prior year periods.
| NERDY INC.• NYSE: NRDY | Q2 2026 | |
| Q2 2026 EARNINGS RELEASE |
10 |
Sales and Marketing
Sales and marketing expenses for the three months ended June 30, 2026 on a GAAP basis were $11.5 million, a decrease of $2.0 million from $13.5 million in the same period in 2025. Excluding non-cash stock compensation and restructuring costs, sales and marketing expenses for the three months ended June 30, 2026 were $11.3 million, a decrease of $1.9 million compared to $13.2 million in the same period in 2025. Sales and marketing expenses for the six months ended June 30, 2026 on a GAAP basis were $25.7 million, a decrease of $3.6 million from $29.3 million in the same period in 2025. Excluding non-cash stock compensation and restructuring costs, sales and marketing expenses for the six months ended June 30, 2026 were $25.2 million, a decrease of $3.3 million compared to $28.5 million in the same period in 2025. These decreases were driven by Al-enabled productivity gains and reduced investment in our Institutional business.
General and Administrative
General and administrative expenses include compensation for certain employees, support services, product and development expenses intended to support innovation, and other operating expenses. Product and development costs were $9.7 million and $10.7 million during the three months ended June 30, 2026 and 2025, respectively. Product and development costs were $18.9 million and $21.4 million during the six months ended June 30, 2026 and 2025, respectively. Product and development costs include compensation for employees on our product and engineering teams who are responsible for developing new and improving existing offerings, maintaining our website, improving efficiencies across our organization, and third-party expenses.
GeneraI and administrative expenses for the three months ended June 30, 2026 on a GAAP basis were $22.9 million, a decrease of $3.7 million from $26.6 million in the same period in 2025. Excluding non-cash stock compensation expenses and restructuring costs, general and administrative expenses for the three months ended June 30, 2026, were $18.4 million, a decrease of $1.0 million compared to $19.4 million in the same period in 2025. General and administrative expenses for the six months ended June 30, 2026, on a GAAP basis were $46.8 million, a decrease of $8.2 million from $55.0 million in the same period in 2025. Excluding non-cash stock compensation expenses and restructuring costs, general and administrative expenses for the six months ended June 30, 2026 were $36.6 million, a decrease of $3.5 million compared to $40.1 million in the same period in 2025. We are applying Al systematically across the tech stack, helping drive continued cost reductions and improved unit economics.
| NERDY INC.• NYSE: NRDY | Q2 2026 | |
| Q2 2026 EARNINGS RELEASE |
11 |
Net Loss, Non-GAAP Adjusted Net Loss, and Non-GAAP Adjusted EBITDA (Loss)
Net loss on a GAAP basis was $6.9 million for the three months ended June 30, 2026, versus a net loss of $12.0 million in the same period in 2025. Excluding non-cash stock compensation expenses and restructuring costs, non-GAAP adjusted net loss was $2.1 million for the three months ended June 30, 2026, compared to a non-GAAP adjusted net loss of $4.5 million in the same period in 2025. Net loss on a GAAP basis was $13.0 million for the six months ended June 30, 2026 versus a net loss of $28.2 million in the same period in 2025. Excluding non-cash stock compensation expenses and restructuring costs, non-GAAP adjusted net loss was $2.3 million for the six months ended June 30, 2026, compared to a non-GAAP adjusted net loss of $12.4 million in the same period in 2025.
Non-GAAP adjusted EBITDA loss was $0.9 million for the three months ended June 30, 2026, beating our guidance of negative $2.0 million to breakeven, and compared to a non-GAAP adjusted EBITDA loss of $2.7 million in the same period in 2025. Non-GAAP adjusted EBITDA was $0.1 million for the six months ended June 30, 2026, compared to a non-GAAP adjusted EBITDA loss of $9.1 million in the same period in 2025.
Non-GAAP adjusted EBITDA performance relative to guidance was driven by lower marketing spend, reduced variable staffing costs, and strong G&A cost control. These impacts were partially offset by higher Al costs. Non-GAAP adjusted EBITDA performance relative to the prior year periods were driven by reduced variable staffing costs, efficiency improvements, and strong cost control. These impacts were also partially offset by higher Al costs.
See pages 15 and 16 for reconciliations of non-GAAP measures to the most directly comparable GAAP financial measure.
Liquidity and Capital Resources
As of June 30, 2026, the Company’s principal sources of liquidity were cash and cash equivalents of $38.4 million. With our cash on hand and the funding available under our term loan, we believe we have ample liquidity to fund operations and growth initiatives.
|
Conference Call Details
Nerdy’s management will host a conference call to discuss its financial results on Thursday, August 6, 2026 at 5:00 p.m. Eastern Time. Interested parties in the U.S. may Iisten to the call by dialing 1-833-461-5787. International callers can dial 1-585-542-9983. The Access Code is 511635729. A live webcast of the call will also be available on Nerdy’s investor relations website at https://www.nerdy.com/investors.
|
Contact
Investor Relations
| NERDY INC.• NYSE: NRDY | Q2 2026 | |
| Q2 2026 EARNINGS RELEASE |
12 |
CONDENSED CONSOLIDATED STATEMENTS
OF OPERATIONS (Unaudited)
(in thousands, except per share data)
| Three Months Ended June 30, |
Six Months Ended June 30, |
|||||||||||||||
| 2026 | 2025 | 2026 | 2025 | |||||||||||||
| Revenue |
$ | 43,231 | $ | 45,263 | $ | 91,966 | $ | 92,858 | ||||||||
| Cost of revenue |
15,247 | 17,421 | 31,708 | 37,405 | ||||||||||||
|
|
|
|
|
|
|
|
|
|||||||||
| Gross Profit |
27,984 | 27,842 | 60,258 | 55,453 | ||||||||||||
| Sales and marketing expenses |
11,571 | 13,558 | 25,728 | 29,343 | ||||||||||||
| General and administrative expenses |
22,889 | 26,572 | 46,804 | 54,983 | ||||||||||||
|
|
|
|
|
|
|
|
|
|||||||||
| Operating Loss |
(6,476 | ) | (12,288 | ) | (12,274 | ) | (28,873 | ) | ||||||||
| Interest expense |
672 | — | 1,332 | — | ||||||||||||
| Interest income |
(325 | ) | (365 | ) | (693 | ) | (827 | ) | ||||||||
| Other (income) expense, net |
(1 | ) | 4 | 15 | 4 | |||||||||||
|
|
|
|
|
|
|
|
|
|||||||||
| Loss before Income Taxes |
(6,822 | ) | (11,927 | ) | (12,928 | ) | (28,050 | ) | ||||||||
| Income tax expense |
34 | 74 | 56 | 102 | ||||||||||||
|
|
|
|
|
|
|
|
|
|||||||||
| Net Loss |
(6,856 | ) | (12,001 | ) | (12,984 | ) | (28,152 | ) | ||||||||
| Net loss attributable to noncontrolling interests |
(2,203 | ) | (4,104 | ) | (4,256 | ) | (9,759 | ) | ||||||||
|
|
|
|
|
|
|
|
|
|||||||||
| Net Loss Attributable to Class A Common Stockholders |
$ | (4,653 | ) | $ | (7,897 | ) | $ | (8,728 | ) | $ | (18,393 | ) | ||||
|
|
|
|
|
|
|
|
|
|||||||||
| Loss per share of Class A Common Stock: |
||||||||||||||||
| Basic and Diluted |
$ | (0.04 | ) | $ | (0.07 | ) | $ | (0.07 | ) | $ | (0.15 | ) | ||||
| Weighted-Average Shares of Class A Common Stock Outstanding: |
||||||||||||||||
| Basic and Diluted |
126,382 | 120,151 | 125,339 | 119,304 | ||||||||||||
REVENUE (Unaudited)
(in thousands)
| Three Months Ended June 30, |
Change | |||||||||||||||||||||||
| 2026 | % | 2025 | % | $ | % | |||||||||||||||||||
| Consumer |
$ | 36,452 | 84 | % | $ | 37,824 | 83 | % | $ | (1,372 | ) | (4 | )% | |||||||||||
| Institutional |
6,752 | 15 | % | 7,308 | 16 | % | (556 | ) | (8 | )% | ||||||||||||||
| Other |
27 | 1 | % | 131 | 1 | % | (104 | ) | (79 | )% | ||||||||||||||
|
|
|
|
|
|
|
|
|
|
|
|
|
|||||||||||||
| Revenue |
$ | 43,231 | 100 | % | $ | 45,263 | 100 | % | $ | (2,032 | ) | (4 | )% | |||||||||||
|
|
|
|
|
|
|
|
|
|
|
|
|
|||||||||||||
| Six Months Ended June 30, |
Change | |||||||||||||||||||||||
| 2026 | % | 2025 | % | $ | % | |||||||||||||||||||
| Consumer |
$ | 75,736 | 82 | % | $ | 75,837 | 81 | % | $ | (101 | ) | — | % | |||||||||||
| Institutional |
16,046 | 17 | % | 16,688 | 18 | % | (642 | ) | (4 | )% | ||||||||||||||
| Other |
184 | 1 | % | 333 | 1 | % | (149 | ) | (45 | )% | ||||||||||||||
|
|
|
|
|
|
|
|
|
|
|
|
|
|||||||||||||
| Revenue |
$ | 91,966 | 100 | % | $ | 92,858 | 100 | % | $ | (892 | ) | (1 | )% | |||||||||||
|
|
|
|
|
|
|
|
|
|
|
|
|
|||||||||||||
| NERDY INC.• NYSE: NRDY | Q2 2026 | |
| Q2 2026 EARNINGS RELEASE |
13 |
CONDENSED CONSOLIDATED
BALANCE SHEETS (Unaudited)
(in thousands)
| June 30, 2026 |
December 31, 2025 |
|||||||
| ASSETS |
| |||||||
| Current Assets |
||||||||
| Cash and cash equivalents |
$ | 38,424 | $ | 47,895 | ||||
| Accounts receivable, net |
4,319 | 5,639 | ||||||
| Other current assets |
3,613 | 4,640 | ||||||
|
|
|
|
|
|||||
| Total Current Assets |
46,356 | 58,174 | ||||||
| Fixed assets, net |
10,221 | 8,683 | ||||||
| Goodwill |
5,717 | 5,717 | ||||||
| Intangible assets, net |
688 | 1,893 | ||||||
| Other assets |
1,596 | 1,699 | ||||||
|
|
|
|
|
|||||
| Total Assets |
$ | 64,578 | $ | 76,166 | ||||
|
|
|
|
|
|||||
| LIABILITIES AND STOCKHOLDERS’ EQUITY |
| |||||||
| Current Liabilities |
||||||||
| Accounts payable |
$ | 4,425 | $ | 3,376 | ||||
| Deferred revenue |
6,235 | 14,481 | ||||||
| Other current liabilities |
6,518 | 7,768 | ||||||
|
|
|
|
|
|||||
| Total Current Liabilities |
17,178 | 25,625 | ||||||
| Long-term debt |
19,578 | 19,327 | ||||||
| Other liabilities |
1,882 | 2,281 | ||||||
|
|
|
|
|
|||||
| Total Liabilities |
38,638 | 47,233 | ||||||
| Stockholders’ Equity |
||||||||
| Class A common stock |
13 | 12 | ||||||
| Class B common stock |
6 | 6 | ||||||
| Additional paid-in capital |
623,771 | 616,741 | ||||||
| Accumulated deficit |
(606,514 | ) | (597,786 | ) | ||||
| Accumulated other comprehensive income |
— | 36 | ||||||
|
|
|
|
|
|||||
| Total Stockholders’ Equity Excluding Noncontrolling Interests |
17,276 | 19,009 | ||||||
| Noncontrolling interests |
8,664 | 9,924 | ||||||
|
|
|
|
|
|||||
| Total Stockholders’ Equity |
25,940 | 28,933 | ||||||
|
|
|
|
|
|||||
| Total Liabilities and Stockholders’ Equity |
$ | 64,578 | $ | 76,166 | ||||
|
|
|
|
|
|||||
| NERDY INC.• NYSE: NRDY | Q2 2026 | |
| Q2 2026 EARNINGS RELEASE |
14 |
CONDENSED CONSOLIDATED STATEMENTS
OF CASH FLOWS (Unaudited)
(in thousands)
| Six Months Ended June 30, |
||||||||
| 2026 | 2025 | |||||||
| Cash Flows From Operating Activities |
||||||||
| Net Loss |
$ | (12,984 | ) | $ | (28,152 | ) | ||
| Adjustments to reconcile net loss to net cash used in operating activities: |
||||||||
| Non-cash stock-based compensation expense |
9,831 | 15,126 | ||||||
| Depreciation & amortization |
1,417 | 3,671 | ||||||
| Amortization of intangibles |
257 | 310 | ||||||
| Amortization of deferred financing fees |
251 | — | ||||||
| Loss on abandonment of business |
673 | — | ||||||
| Other |
— | 69 | ||||||
| Other changes in operating assets and liabilities: |
||||||||
| Decrease in accounts receivable, net |
1,320 | 977 | ||||||
| Decrease in other current assets |
1,027 | 279 | ||||||
| Decrease in other assets |
103 | 703 | ||||||
| Increase in accounts payable |
1,055 | 1,253 | ||||||
| Decrease in deferred revenue |
(8,461 | ) | (5,276 | ) | ||||
| Decrease in other current liabilities |
(853 | ) | (1,672 | ) | ||||
| Decrease in other liabilities |
(161 | ) | (777 | ) | ||||
|
|
|
|
|
|||||
| Net Cash Used in Operating Activities |
(6,525 | ) | (13,489 | ) | ||||
| Cash Flows From Investing Activities |
||||||||
| Capital expenditures |
(2,714 | ) | (2,333 | ) | ||||
|
|
|
|
|
|||||
| Net Cash Used In Investing Activities |
(2,714 | ) | (2,333 | ) | ||||
| Cash Flows From Financing Activities |
||||||||
| Payments of deferred financing fees |
(250 | ) | — | |||||
|
|
|
|
|
|||||
| Net Cash Used In Financing Activities |
(250 | ) | — | |||||
| Effect of Exchange Rate Change on Cash, Cash Equivalents, and Restricted Cash |
18 | 3 | ||||||
|
|
|
|
|
|||||
| Net Decrease in Cash, Cash Equivalents, and Restricted Cash |
(9,471 | ) | (15,819 | ) | ||||
| Cash, Cash equivalents, and Restricted Cash, Beginning of Year |
47,895 | 52,673 | ||||||
|
|
|
|
|
|||||
| Cash, Cash Equivalents, and Restricted Cash, End of Period |
$ | 38,424 | $ | 36,854 | ||||
|
|
|
|
|
|||||
| Supplemental Cash Flow Information |
||||||||
| Non-cash stock-based compensation included in capitalized internal use software |
$ | 246 | $ | 537 | ||||
| Purchase of fixed assets included in accounts payable |
19 | 3 | ||||||
| Cash paid for interest |
1,087 | — | ||||||
| NERDY INC.• NYSE: NRDY | Q2 2026 | |
| Q2 2026 EARNINGS RELEASE |
15 |
RECONCILIATION OF GAAP TO
NON-GAAP SALES AND MARKETING EXPENSES (Unaudited)
(in thousands)
| Three Months Ended June 30, |
Six Months Ended June 30, |
|||||||||||||||
| 2026 | 2025 | 2026 | 2025 | |||||||||||||
| Sales and marketing expenses |
$ | 11,571 | $ | 13,558 | $ | 25,728 | $ | 29,343 | ||||||||
| Less: |
||||||||||||||||
| Non-cash stock-based compensation expense |
257 | 330 | 553 | 674 | ||||||||||||
| Restructuring costs |
— | — | — | 193 | ||||||||||||
|
|
|
|
|
|
|
|
|
|||||||||
| Non-GAAP sales and marketing expenses |
$ | 11,314 | $ | 13,228 | $ | 25,175 | $ | 28,476 | ||||||||
|
|
|
|
|
|
|
|
|
|||||||||
RECONCILIATION OF GAAP TO
NON-GAAP GENERAL AND ADMINISTRATIVE EXPENSES (Unaudited)
(in thousands)
| Three Months Ended June 30, |
Six Months Ended June 30, |
|||||||||||||||
| 2026 | 2025 | 2026 | 2025 | |||||||||||||
| General and administrative expenses |
$ | 22,889 | $ | 26,572 | $ | 46,804 | $ | 54,983 | ||||||||
| Less: |
||||||||||||||||
| Non-cash stock-based compensation expense |
3,596 | 7,208 | 9,278 | 14,452 | ||||||||||||
| Restructuring costs |
882 | — | 882 | 455 | ||||||||||||
|
|
|
|
|
|
|
|
|
|||||||||
| Non-GAAP general and administrative expenses |
$ | 18,411 | $ | 19,364 | $ | 36,644 | $ | 40,076 | ||||||||
|
|
|
|
|
|
|
|
|
|||||||||
RECONCILIATION OF GAAP NET LOSS TO
NON-GAAP ADJUSTED EBITDA (LOSS) (Unaudited)
(in thousands)
| Three Months Ended June 30, |
Six Months Ended June 30, |
|||||||||||||||
| 2026 | 2025 | 2026 | 2025 | |||||||||||||
| Net Loss |
$ | (6,856 | ) | $ | (12,001 | ) | $ | (12,984 | ) | $ | (28,152 | ) | ||||
| Add: |
||||||||||||||||
| Interest expense |
672 | — | 1,332 | — | ||||||||||||
| Interest income |
(325 | ) | (365 | ) | (693 | ) | (827 | ) | ||||||||
| Income taxes |
34 | 74 | 56 | 102 | ||||||||||||
| Depreciation and amortization |
859 | 1,996 | 1,674 | 3,981 | ||||||||||||
| Non-cash stock-based compensation expense |
3,853 | 7,538 | 9,831 | 15,126 | ||||||||||||
| Restructuring costs |
882 | — | 882 | 648 | ||||||||||||
|
|
|
|
|
|
|
|
|
|||||||||
| Adjusted EBITDA (Loss) |
$ | (881 | ) | $ | (2,758 | ) | $ | 98 | $ | (9,122 | ) | |||||
|
|
|
|
|
|
|
|
|
|||||||||
RECONCILIATION OF GAAP NET LOSS TO
NON-GAAP ADJUSTED NET LOSS (Unaudited)
(in thousands)
| Three Months Ended June 30, |
Six Months Ended June 30, |
|||||||||||||||
| 2026 | 2025 | 2026 | 2025 | |||||||||||||
| Net Loss |
$ | (6,856 | ) | $ | (12,001 | ) | $ | (12,984 | ) | $ | (28,152 | ) | ||||
| Add: |
||||||||||||||||
| Non-cash stock-based compensation expense |
3,853 | 7,538 | 9,831 | 15,126 | ||||||||||||
| Restructuring costs |
882 | — | 882 | 648 | ||||||||||||
|
|
|
|
|
|
|
|
|
|||||||||
| Adjusted Net Loss |
$ | (2,121 | ) | $ | (4,463 | ) | $ | (2,271 | ) | $ | (12,378 | ) | ||||
|
|
|
|
|
|
|
|
|
|||||||||
| NERDY INC.• NYSE: NRDY | Q2 2026 | |
| Q2 2026 EARNINGS RELEASE |
16 |
RECONCILIATION OF GAAP NET CASH USED IN OPERATING ACTIVITIES TO
NON-GAAP FREE CASH FLOW (Unaudited)
(in thousands)
| Three Months Ended June 30, |
Six Months Ended June 30, |
|||||||||||||||
| 2026 | 2025 | 2026 | 2025 | |||||||||||||
| Net Cash Used in Operating Activities |
$ | (4,745 | ) | $ | (7,045 | ) | $ | (6,525 | ) | $ | (13,489 | ) | ||||
| Less: |
||||||||||||||||
| Capital expenditures |
$ | (1,532 | ) | $ | (1,158 | ) | (2,714 | ) | (2,333 | ) | ||||||
|
|
|
|
|
|
|
|
|
|||||||||
| Free Cash Flow |
$ | (6,277 | ) | $ | (8,203 | ) | $ | (9,239 | ) | $ | (15,822 | ) | ||||
|
|
|
|
|
|
|
|
|
|||||||||
CAPITALIZATION RECONCILIATION (Unaudited)
(in thousands)
| June 30, 2026 |
||||
| Class A Common Stock |
127,042 | |||
| Combined Interests that can be converted into shares of Class A Common Stock |
63,730 | |||
|
|
|
|||
| Total outstanding share count |
190,772 | |||
|
|
|
|||
| NERDY INC.• NYSE: NRDY | Q2 2026 | |
| Q2 2026 EARNINGS RELEASE |
17 |
Key Operating Metrics
We monitor the following key operating metrics, among others, to evaluate the performance of our business.
Active Members is defined as the number of Learners with a paid active Learning Membership as of the date presented. Variations in the number of Active Members are due to changes in demand for our solutions, seasonality, testing schedules, and the launch of new Learning Membership options. As a result, Active Members is a key indicator of our ability to attract, engage and retain Learners. Active Members exclude our Institutional business. While our Active Member count as of June 30, 2026, was lower when compared to June 30, 2025, the rate of decline has narrowed sequentially for four consecutive quarters and we believe the recent rollout and continued advancement of our new Learner and Expert platform user experiences will result in positive growth by the end of 2026.
ARPM is defined as the average Consumer Learning Membership subscription revenue per member per month as of the date presented. Variations in ARPM are primarily due to changes in the mix of Learning Memberships sold and pricing changes. We believe ARPM is a key indicator of the value we provide to our customers. ARPM excludes our Institutional business. ARPM as of June 30, 2026, was higher when compared to June 30, 2025, primarily driven by price increases enacted in February 2025.
Active Experts is defined as the number of Experts who have instructed one or more sessions in a given period. Active Experts include our Institutional business. Our Active Expert count during the three and six months ended June 30, 2026, decreased when compared to the prior year period. This decrease was primarily due to lower Consumer Active Experts as a result of our Expert incentives, which has promoted utilization of the highest quality Experts by encouraging them to work with more Learners and develop deeper relationships that allow for increased revenue-generating opportunities. We believe our Active Expert count at June 30, 2026, is sufficient to meet our near-term growth objectives.
KEY OPERATING METRICS
| Active Members in thousands | June 30, 2026 |
March 31, 2026 |
December 31, 2025 |
September 30, 2025 |
June 30, 2025 |
March 31, 2025 |
||||||||||||||||||
| Active Members |
29.1 | 36.9 | 33.2 | 34.3 | 30.6 | 40.5 | ||||||||||||||||||
| YoY change |
(5 | )% | (9 | )% | (11 | )% | (14 | )% | (14 | )% | (12 | )% | ||||||||||||
| ARPM in ones | June 30, 2026 |
March 31, 2026 |
December 31, 2025 |
September 30, 2025 |
June 30, 2025 |
March 31, 2025 |
||||||||||||||||||
| ARPM |
$ | 366 | $ | 374 | $ | 364 | $ | 374 | $ | 348 | $ | 335 | ||||||||||||
| YoY change |
5 | % | 12 | % | 21 | % | 24 | % | 24 | % | 14 | % | ||||||||||||
| Three Months Ended June 30, |
Change | Six Months Ended June 30, |
Change | |||||||||||||||||||||
| Active Experts in thousands | 2026 | 2025 | % | 2026 | 2025 | % | ||||||||||||||||||
| Active Experts |
8.4 | 9.7 | (13 | )% | 9.8 | 12.1 | (19 | )% | ||||||||||||||||
| NERDY INC.• NYSE: NRDY | Q2 2026 | |
| Q2 2026 EARNINGS RELEASE |
18 |
Key Performance Metrics and Non-GAAP Financial Measures
This earnings release includes non-GAAP financial measures for non-GAAP sales and marketing expenses, non-GAAP general and administrative expenses, non-GAAP adjusted net earnings (loss), non-GAAP adjusted EBITDA (loss), and non-GAAP free cash flow.
Non-GAAP sales and marketing expenses exclude non-cash stock compensation expenses and restructuring costs. Non-GAAP general and administrative expenses exclude non-cash stock compensation expenses and restructuring costs.
Non-GAAP adjusted net earnings (loss) is defined as net income or net loss, as applicable, excluding non-cash stock-based compensation expenses and restructuring costs.
Non-GAAP adjusted EBITDA (loss) is defined as net income or net loss, as applicable, before interest expense, income, taxes, depreciation and amortization expense, non-cash stock-based compensation expenses, and restructuring costs.
Non-GAAP free cash flow is defined as net cash provided by (used in) operating activities less capital expenditures.
Sales and marketing expenses consist of salaries and benefits for our employees engaged in our consultative sales process. General and administrative expenses are recorded in the period in which they are incurred and include salaries, benefits, and non-cash stock-based compensation expense for certain employees as well as support services, product development, finance, legal, human resources, other administrative employees, information technology expenses, outside services, legal and accounting services, depreciation expense, and other costs required to support our operations.
Net loss per share is computed by dividing net loss by the weighted average number of shares outstanding during the period as calculated using the treasury stock and “if-converted” methods, as applicable.
Non-GAAP measures are in addition, and not a substitute for or superior to measures of financial performance prepared in accordance with GAAP and should not be considered as an alternative to sales, net income, operating income, cash flows from operations, or any other performance measures derived in accordance with GAAP. Other companies may calculate these non-GAAP financial measures differently, and therefore such financial measures may not be directly comparable to similarly titled measures of other companies. The Company believes that these non-GAAP measures of financial results provide useful supplemental information. The Company’s management uses these non-GAAP measures to evaluate the Company’s operating performance, trends, and to compare it against the performance of other companies. There are, however, a number of limitations related to the use of these non-GAAP measures and their nearest GAAP equivalents.
See the tables above regarding reconciliation of non-GAAP measures to the most directly comparable GAAP measures.
| NERDY INC.• NYSE: NRDY | Q2 2026 | |
| Q2 2026 EARNINGS RELEASE |
19 |
Annualized run-rate is defined as the number of Active Members at the end of the period multiplied by average revenue per Learning Membership per month multiplied by twelve months. This recurring revenue customer base provides us with increased forecasting visibility into future periods.
Bookings represent contracted amounts during the period for Varsity Tutors for Schools.
Management and our board of directors use these metrics as supplemental measures of our performance that are not required by or presented in accordance with GAAP because they assist us in comparing our operating performance on a consistent basis, as they remove the impact of items not directly resulting from our core operations. We also use these metrics for planning purposes, including the preparation of our internal annual operating budget and financial projections, to evaluate the performance and effectiveness of our strategic initiatives and to evaluate our capacity to expand our business and the capital expenditures required for that expansion.
Non-GAAP sales and marketing expenses, non-GAAP general and administrative expenses, non-GAAP adjusted EBITDA (loss), non-GAAP adjusted net income or loss, and non-GAAP free cash flow should not be considered in isolation, as an alternative to, or superior to net earnings (loss), revenue, cash flows or other performance measure derived in accordance with GAAP. We believe these metrics are frequently used by analysts, investors, and other interested parties to evaluate companies in our industry. Management believes that the presentation of non-GAAP metrics is an appropriate measure of operating performance because they eliminate the impact of expenses that do not relate directly to the performance of our underlying business. These non-GAAP metrics should not be construed as an implication that our future results will be unaffected by unusual or other items. We are not able to provide a reconciliation of non-GAAP adjusted EBITDA (loss) guidance for future periods to net loss, the comparable GAAP measure, because certain items that are excluded from non-GAAP adjusted EBITDA (loss) cannot be reasonably predicted or are not in our control. In particular, we are unable to forecast the timing or magnitude for gains or losses on stock-based compensation without unreasonable efforts, and these items could significantly impact, either individually or in the aggregate, net income or loss in the future. See the tables above regarding reconciliations of these non-GAAP measures to the most directly comparable GAAP measures for historical periods.
| NERDY INC.• NYSE: NRDY | Q2 2026 | |
| Q2 2026 EARNINGS RELEASE |
20 |
Forward-Looking Statements
All statements contained herein that do not relate to matters of historical fact should be considered forward-looking statements, including, without limitation, statements regarding our strategic priorities, including those related to revenue and active member growth; enhancing the Learning Membership experience; Al-enabled productivity and operating leverage; the sufficiency of our cash to fund future operations; and our anticipated quarterly and full year 2026 outlook; as well as statements that include the words “expect,” “plan,” “believe,” “project,” “will” and “may,” and similar statements of a future or forward-looking nature.
The forward-looking statements made herein relate only to events as of the date on which the statements are made. We undertake no obligation to update any forward-looking statements to reflect events or circumstances after the date of this press release or to reflect new information or the occurrence of unanticipated events, except as required by law. We may not actually achieve the plans, intentions, or expectations disclosed in our forward-looking statements, and you should not place undue reliance on our forward-looking statements.
There are a significant number of factors that could cause actual results to differ materially from statements made herein or in connection herewith, including but not limited to, our offerings continue to evolve, which makes it difficult to predict our future financial and operating results; our level of indebtedness, which could adversely affect our financial condition; our operating activities may be restricted as a result of covenants related to our term loan and failure to comply with these covenants could have a material adverse effect on us; our history of net losses and negative operating cash flows, which could require us to need other sources of liquidity; risks associated with our ability to acquire and retain customers, operate, and scale up our Consumer business; risks associated with the implementation of our plan to wind down Varsity Tutors for Schools, including the timing and amount of expected exit costs, our ability to realize anticipated benefits, and the impact on our business and results of operations; risks associated with our intellectual property, including claims that we infringe on a third-party’s intellectual property rights; risks associated with our classification of some individuals and entities we contract with as independent contractors; risks associated with the liquidity and trading of our securities; risks associated with payments that we may be required to make under the tax receivable agreement; litigation, regulatory and reputational risks arising from the fact that many of our Learners are minors; changes in applicable law or regulation; the possibility of cyber-related incidents and their related impacts on our business and results of operations; risks associated with the development and use of artificial intelligence and related regulatory uncertainty; the possibility that we may be adversely affected by other economic, business, and/or competitive factors; and risks associated with managing our growth.
Our actual results could differ materially from those stated or implied in forward-looking statements due to a number of factors, including but not limited to, risks detailed in our filings with the SEC, including our Annual Report on Form 10-K filed on February 26, 2026, and our Quarterly Report on Form 10-Q filed on August 6, 2026, as well as other filings that we may make from time to time with the SEC.
| NERDY INC.• NYSE: NRDY | Q2 2026 | |