Exhibit 99.1

Q3 | 2022 Earnings Release age Arts Geometry Magic Thursdays, 4:30-5:30PM (ET)
|
Making a great impact in my son’s education. |
||||||
| “Varsity Tutors is making great impact in my son’s education. Tutors are amazing, evaluating needs and working with the weak areas in all the subjects. With membership you have the option of trying all other free courses. Based on my son’s experience I definitely will recommend VT to any parent. It definitely will help your kid to excel and gain more confidence for the years to come.”
- Brianna, Learning Member |
||||||
|
[My son] enjoys it. Worth the price. |
||||||
| “His tutor is amazing with him, and very patient. She uses his IEP, makes it fun and always has something new to do. He also enjoys it. Worth the price. We are still new so I can’t wait to see how well he does in a few more months.”
- Liz, Learning Member |
||||||


|
Q3 Earnings Release 2022 | 2 |
|
A Note to Our Shareholders |
| Two quarters ago we unveiled our ambitious plan to evolve our products and revenue model to be oriented toward long-term recurring relationships with customers that default to being ‘always on.’ We did this in response to market changes, including evolving customer needs that created an opportunity to help develop longer and more all-encompassing relationships that spanned academic calendar years, subjects, and learning formats. We believed this was true for both our Consumer and Institutional school district customers and began to converge our product and revenue strategies in response to the changes we were witnessing. | ||
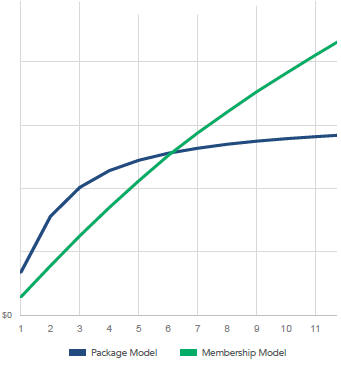
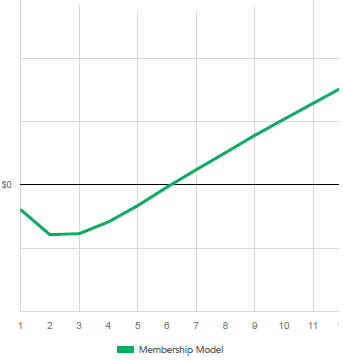
| We created new subscription and recurring revenue products including Learning Memberships for Consumers and On Demand and Teacher Assigned for school district customers that were built specifically to address the ongoing support we believed both types of customers desired. We shared that this new focus would require trading off revenue recognition in the short term because our Package model had more front-loaded revenue recognition than the Learning Membership model where subscription revenue was recognized linearly over time. We estimated that by month six for a given Learning Membership customer, the cumulative revenue would catch up and surpass that of a given Package customer, a phenomenon we call the ‘J Curve’. | ||
| Two quarters into this initiative, we are pleased to report that the new recurring/subscription business model has exceeded our expectations and validated our underlying assumptions (and more). | ||
|
We expect our new ‘always on’ business model will lead to the following:
|
||||||
| ● | Longer duration and higher lifetime value customer relationships | |||||
| ● | Enhanced gross margins | |||||
| ● | Better marketing efficiency (lifetime value relative to customer acquisition costs) | |||||
| ● | Better forecasting visibility | |||||
| ● | A more scalable and efficient operating model | |||||
| ● | Enabling new market expansion by allowing us to serve a larger market of Learners | |||||
| ● | More consistent earning potential for Experts
|
|||||
|
|
Q3 Earnings Release 2022 | 3 |
|
A Note to Our Shareholders (cont’d) |
| Based upon the strong consumer reaction and feedback we received as schools started across the country, combined with the positive customer economics we were experiencing with Learning Membership customers, we determined it was the winning model and made Learning Memberships the primary solution offered to consumers. In doing so, we made the decision to shift a larger percentage of the business than previously targeted to Learning Memberships, and discontinued academic and enrichment a la carte class sales by rolling them into our Learning Membership offering. | ||
| As anticipated and consistent with what we shared in August following the second quarter, summer travel and leisure was heightened with consumption seasonally declining over the summer months. We then saw continued strengthening of demand for supplemental learning heading into back-to-school, and have not observed any discernible macroeconomic pressure on the demand for our products. | ||
| We delivered revenue of $31.8 million for the third quarter, in line with our guidance range of $30-33 million. This result reflects stronger than anticipated performance given our decision to shift a higher than originally contemplated percentage of new customers to Learning Memberships. Shifting a higher proportion of new customers joining the platform into Learning Memberships decreased recognized revenue in the current quarter in order to be able to generate higher levels of revenue in subsequent quarters for those specific customers. | ||
| $50M+ |
| A N N U A L I Z E D R U N R A T E |
| L E A R N I N G M E M B E R S H I P |
| R E V E N U E A S O F 9 / 3 0 / 2 0 2 2 |
| 25%+ |
| L E A R N I N G M E M B E R S H I P |
| C U S T O M E R S |
| engaged in a non-tutoring product |
| (live class, On Demand video lessons, |
| StarCourse, self-study, adaptive |
| assessment) in their first three months |
| >$300 |
| A V E R A G E R E V E N U E P E R |
| L E A R N I N G M E M B E R S H I P P E R |
| M O N T H |
| 12 Months |
| M O S T P O P U L A R L E A R N I N G |
| M E M B E R S H I P T E R M |
| O F F E R I N G |
|
|
Q3 Earnings Release 2022 | 4 |
Consumer
During the third quarter, approximately 62% of new Learners in our Consumer business purchased a Learning Membership (vs. a Package). Revenue recognized in the third quarter from Learning Memberships grew to $5.8 million or 18% of total recognized revenue, up from just 2% of total recognized revenue in the second quarter; and Learning Membership revenue has already grown to an annualized run-rate of $50.2 million as of September 30, 2022 (annualized run-rate is defined as the number of Learning Members at the end of the period multiplied by average revenue per Learning Member per month multiplied by twelve months).
The Learning Membership model is helping transform our relationship with customers into one that is recurring in nature and spans subjects and learning formats. The model encourages ongoing consistent learning over longer periods of time, which is leading to significant improvements in customer engagement. In addition to 1-on-1 tutoring, each Learning Membership includes access to unlimited live and asynchronous learning formats and content available for the entire household. We are seeing these benefits deliver positive multi-format engagement trends with over 25% of our early cohorts adopting another learning format beyond 1-on-1 tutoring. That number grows to 40% in audiences that have a broad selection of classes and other learning resources.
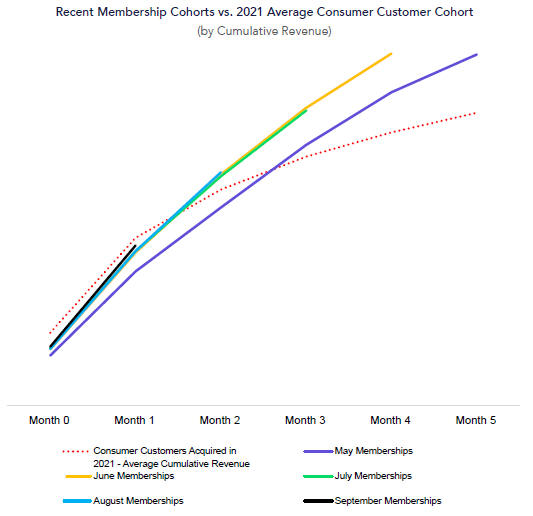
The higher retention and engagement is leading to superior customer monetization and lifetime value relative to our Package model. As visualized in the chart below, recent monthly cohorts’ cumulative Learning Membership revenue is on a path to equal or exceed historical average consumer revenue cohort curves after approximately three to four months, more than making up for the approximately 30% of customers and less than 10% of revenue that Consumer class customers historically represented. This helps demonstrate the superior economics of our Learning Membership model and the higher value of the Active Learners we are adding to the platform.
We now expect that by the end of the calendar year, our monthly subscription revenue recognized from Learning Memberships will exceed the revenue recognized from Package customers and that by the end of the first quarter our monthly consumer revenue will be driving year-over-year growth with more attractive unit-level economics having exited the J Curve business model transition period.

|
Q3 Earnings Release 2022 | 5 |
We have developed a powerful and unique proposition for Learners. We are continuing to invest in serving a wider array of learning needs by offering more learning resources and providing customers with more value. Customer surveys and engagement trends support our view that Learning Memberships provide significantly more value to customers than purchasing services a la carte. Based upon both our historical experience with customers engaging in learning across multiple formats, as well as our recent experience with Learning Membership customers, we have seen that multi-format engagement is highly correlated with better retention and extending customer lifetime value and monetization.
| more formats |
| more engagement |
| more retention |
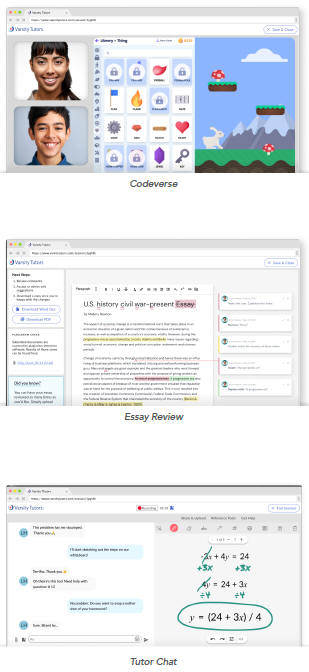
In the fourth quarter, we are continuing to enhance Learning Memberships by adding unlimited access to three new products, including Codeverse, Tutor Chat, and Essay Review.
Codeverse is our recently acquired coding platform for kids. Tutor Chat provides 24/7 support to every student with access to homework help and support from highly qualified tutors via live chat across core K-12 subjects. Lastly, Essay Review provides writing support for students whenever they need it by allowing students to upload written work to receive thoughtful feedback within 48 hours on essays, term papers, reports, admission essays, and more.
Tutor Chat and Essay Review were both originally developed for Varsity Tutors for Schools, and we are now leveraging them in a key consumer product, a good example of the convergence of product strategies and our platform-based approach to growth that allows us to build a product once and leverage it multiple times across other audiences. As we expand our product portfolio, make our platform more sticky, and enhance the value we provide to Learning Membership customers, we anticipate that we can further grow customer lifetime values.
|
|
Q3 Earnings Release 2022 | 6 |
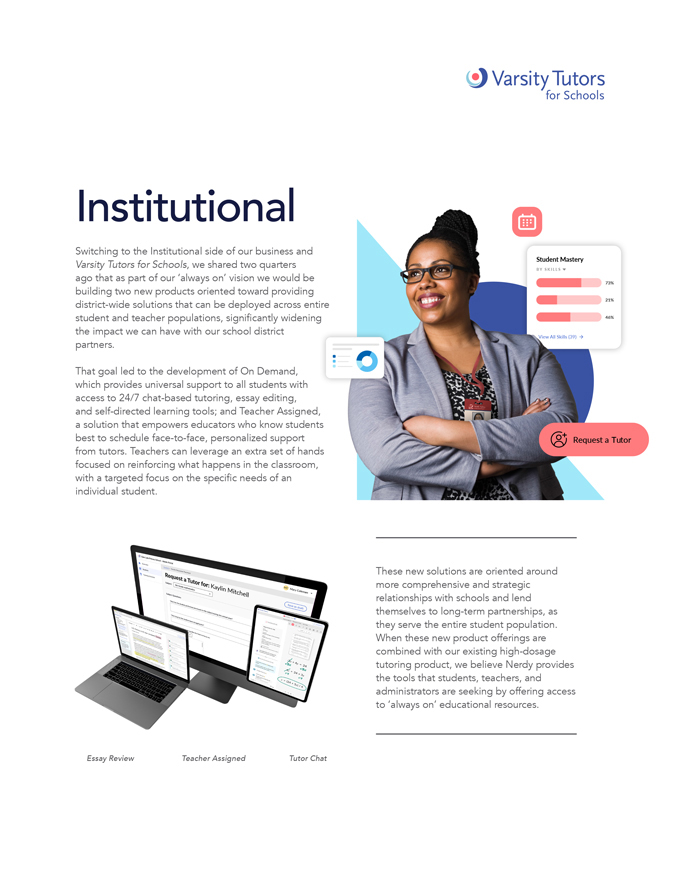
Institutional Switching to the Institutional side of our business and Varsity Tutors for Schools, we shared two quarters ago that as part of our ‘always on’ vision we would be building two new products oriented toward providing district-wide solutions that can be deployed across entire student and teacher populations, significantly widening the impact we can have with our school district partners. That goal led to the development of On Demand, which provides universal support to all students with access to 24/7 chat-based tutoring, essay editing, and self-directed learning tools; and Teacher Assigned, a solution that empowers educators who know students best to schedule face-to-face, personalized support from tutors. Teachers can leverage an extra set of hands focused on reinforcing what happens in the classroom, with a targeted focus on the specific needs of an individual student. These new solutions are oriented around more comprehensive and strategic relationships with schools and lend themselves to long-term partnerships, as they serve the entire student population. When these new product offerings are combined with our existing high-dosage tutoring product, we believe Nerdy provides the tools that students, teachers, and administrators are seeking by offering access to ‘always on’ educational resources.
|
|
Q3 Earnings Release 2022 | 7 |
|
|

focusing on larger school districts interested in holistic and longer-lasting partnerships Earlier this year, we also discussed that we adjusted the Institutional sales team’s focus toward larger school district opportunities where there is an interest in more holistic and longer-lasting partnerships. During the third quarter, Varsity Tutors for Schools signed 21 new contracts, yielding $5.6 million of bookings with an average contract value that more than doubled (versus all prior periods). 21 $5.6M New Contracts Q3 Total Contract Value The shift in focus to larger school district opportunities has also driven continued growth in our deal pipeline heading into the fourth quarter. We are seeing high levels of interest in our new products that address entire district-wide student populations and target higher contract values. These partnerships involve more complicated implementations and the involvement of more stakeholders, which is leading to longer contracting and implementation timelines.
| Marketplace Dynamics
Shifting gears to marketplace dynamics, our third quarter results reflect momentum across both our Consumer and Institutional businesses as we reorient our products toward higher value and more recurrent relationships. As we shared earlier, by orienting our business to consumers with recurring need states, we are targeting higher lifetime value customers. Midway through the quarter, we began slowing the number of new Experts added to the platform to both concentrate on deeper relationships with fewer Experts and to provide those Experts with a higher volume of revenue-generating opportunities.
Path to Profitability
As we have progressed through the J Curve on our Learning Memberships offering, and as we have tuned our product offering and go-to-market approach for Varsity Tutors for Schools, we have also started to drive operational efficiencies across our business. Specifically, we have reduced our marketing spend; leaned further into automation, self-service capabilities, and our machine learning matching algorithms; and continued to moderate the pace of corporate hiring and third-party vendor spend. We also expect to gain operating leverage from prior investments as we allow revenue to grow without a proportional increase in both variable and fixed costs.
As the Learning Memberships subscriber base increases and Institutional revenues grow, we expect that these new go-to-market strategies will continue to yield operating efficiencies. We remain confident in our ability to achieve adjusted EBITDA profitability by the end of 2023 as previously communicated.
In Closing
Today marks just over one year as a public company. During that time, the education landscape has changed dramatically. We continue to innovate at a rapid pace, bring new products and capabilities to market, and evolve our go-to-market strategies to position Nerdy as the preferred solution to meet both Consumer and Institutional Learners’ needs in any subject, anywhere, and at any time.
We appreciate your interest in our Company.
CHUCK COHN
Founder, Chairman & CEO |

|

Financial Highlights
| • | Revenue In Line with Guidance – In the third quarter, Nerdy delivered revenue of $31.8 million, in line with our guidance range of $30-33 million. Due to strong customer response during the back-to-school season, we accelerated the rollout of Learning Memberships in the third quarter, making Learning Memberships the primary option presented to consumers. Revenue for the nine months ended September 30, 2022 was $120.9 million, an increase of 23% from $98.6 million during the same period in 2021. Revenue growth was driven by continued strength in our Consumer business and the addition of our Institutional business. |
| • | Accelerated Learning Memberships Rollout – Learning Membership revenue grew to an annualized run rate of $50.2 million as of September 30, 2022. Revenue recognized in the third quarter from Learning Memberships grew to $5.8 million or 18% of total revenue, up from 2% of total company revenue recognized in the second quarter. |
| • | Institutional Momentum – In the third quarter, Varsity Tutors for Schools signed 21 new contracts, yielding $5.6 million of bookings. Average contract value more than doubled in the third quarter reflecting our new focus on larger school districts and our ‘always on’ bundled solutions. Institutional revenue of $2.4 million represented 7% of total revenue in the third quarter reflecting normal summer seasonality with schools out of session, and longer contracting and implementation timelines as we target larger school district opportunities. |
| • | Gross Profit – Gross profit of $21.9 million in the third quarter increased 6% year-over-year. The increase in gross profit was driven by growth across Consumer audiences and growth in our Institutional business. Gross margin of 69% for the three months ended September 30, 2022, was approximately 300 bps higher than gross margin of 66% during the comparable period in 2021. |
| • | Liquidity and Profitability – With no debt and $106.4 million of cash on our balance sheet, Nerdy has ample liquidity to fund the business and pursue growth initiatives. We remain confident in our ability to achieve adjusted EBITDA profitability by the end of 2023 and have increased visibility and confidence into how it will be reached. |
| • | Net Loss and Adjusted EBITDA Loss – Net loss was $(32.3) million in the third quarter versus a net loss of $(57.7) million in the third quarter of 2021. Excluding transaction-related costs, non-recurring one-time items, non-cash stock compensation expenses, and mark-to-market derivative adjustments, adjusted net loss was $(15.6) million for the third quarter of 2022 versus $(14.7) million in the third quarter of 2021. Nerdy reported a non-GAAP adjusted EBITDA loss of $(14.0) million in the third quarter of 2022, at the high end of our guidance range of $(14.0) to $(17.0) million. This compares to a non-GAAP adjusted EBITDA loss of $(11.7) million in the same period one year ago. For both non-GAAP adjusted net loss and non-GAAP adjusted EBITDA loss, revenue and gross profit improvements were offset by investments in technology and product capabilities, and the buildout of Varsity Tutors for Schools. In addition, we previously expanded and enhanced our finance, accounting, and legal functions in connection with being a public company. |
| • | See pages 18 to 19 for reconciliations of non-GAAP measures to the most directly comparable GAAP financial measure. |
|
|
Q3 Earnings Release 2022 | 10 |
Fourth Quarter and Full
Year 2022 Outlook
Consistent with our stated plan shared in our last Shareholder Letter, during the third quarter we continued building and began selling our new ‘always on’ learning solutions focused on long-term recurring customer relationships across both Consumer and Institutional go-to-market strategies.
As shared earlier in this letter, the traction and response we have received from consumers related to Learning Memberships has exceeded our expectations. We also began to see more evidence that validates our belief that the model would lead to longer duration and higher lifetime value customer relationships, enhanced gross margins, and a more scalable and efficient operating model. We determined Learning Memberships is the winning business model and superior to our Package model for most customers and shifted a higher proportion of customers to Learning Memberships throughout the quarter than originally targeted. This acceleration has continued in the fourth quarter, reflecting the strong traction we have seen from consumers during the back-to-school season.
Cumulative Revenue from
Package Model vs. Membership Model
Over Time (months)
The narrowing of our fourth quarter and full-year revenue guidance ranges reflects the significant momentum we are realizing in the rollout of Learning Memberships, as well as the longer-lead times we are experiencing in our Institutional business due to the previously discussed focus on opportunities with larger school districts.
We are targeting to exit the aggregate J Curve business model transition, whereby aggregate monthly Consumer revenue returns to year-over-year growth, by the end of the first quarter in 2023.
The combination of our unique platform, comprehensive product offerings, including Learning Memberships and Varsity Tutors for Schools, and our ability to deliver high-quality live learning at scale personalized to each Learner positions us for continued growth as the education landscape rapidly evolves.
Under our Learning Membership model, revenue is recognized on a linear basis over the term of the contract versus being front weighted (typically over the first three to six months) as is the case in our Package model. We are targeting an approximate six month J Curve transition in revenue recognition to achieve equal cumulative revenue recognition for a given customer between the Learning Membership and Package models (as shown in the below illustrative graphs).
Cumulative Revenue Change per Customer:
Memberships minus Packages
Over Time (months)
|
|
Q3 Earnings Release 2022 | 11 |

|
Fourth Quarter and
Full Year 2022 Outlook
Revenue Guidance
As is typical for our business, we expect sequential quarterly revenue growth, driven by increases in the number of Learning Membership subscribers and higher Institutional revenues.
• For the fourth quarter of 2022, we expect revenue in a range of $39-41 million.
• For the full year 2022, we expect revenue of $160-162 million, within the guidance range we provided when we first introduced Learning Memberships in May.
Adjusted EBITDA Guidance
Our adjusted EBITDA guidance for both the fourth quarter and full year reflects the natural flow through from lower revenue recognized in the quarter that is the result of accelerating the rollout of Learning Memberships as we capitalize on the long-term shift towards ‘always on’ learning solutions. The guidance also reflects the continued moderation of marketing spend and reduced levels of hiring beginning to demonstrate operating leverage.
• For the fourth quarter of 2022, we expect a non-GAAP adjusted EBITDA loss in the range of $6-8 million.
• For the full year 2022, we expect non-GAAP adjusted EBITDA loss in the range of $36-38 million, also consistent with the guidance ranges provided in May.
Nerdy has ample liquidity to fund the business and to pursue growth initiatives with no debt and $106.4 million of cash on our balance sheet. We remain confident in our ability to achieve adjusted EBITDA profitability by the end of 2023 as previously communicated.
|
|
|
Q3 Earnings Release 2022 | 12 |
|
Financial
Discussion |
Revenue
Revenue for the three months ended September 30, 2022 was $31.8 million, an increase of 1% from $31.3 million during the same period in 2021. Revenue for the nine months ended September 30, 2022 of $120.9 million increased 23% from $98.6 million during the same period in 2021. Revenue growth was driven by continued strength in our Consumer business and the addition of our Institutional business.
Gross Profit and Gross Margin
Gross profit of $21.9 million for the three months ended September 30, 2022 increased by $1.3 million or 6% compared to the same period in 2021. Gross margin of 69% for the three months ended September 30, 2022, was approximately 300 bps higher than gross margin of 66% during the comparable period in 2021. Gross profit for the nine months ended September 30, 2022 of $83.4 million increased by $18.1 million, or 28%, compared to the same period in 2021. Gross margin of 69% for the nine months ended September 30, 2022 was approximately 280 bps higher than gross margin of 66% during the comparable period in 2021. Gross profit increases for both periods were driven by growth across Consumer audiences and growth in our Institutional business.
Sales and Marketing
Sales and marketing expenses for the three months ended September 30, 2022 on a GAAP basis were $16.2 million, a decrease of $2.6 million from $18.8 million in the same period in 2021. Excluding non-cash stock compensation, sales and marketing expenses for the three months ended September 30, 2022 were $15.1 million, or 48% of revenue, compared to $16.1 million, or 52% of revenue in the same period in 2021, a 400 bps improvement year-over-year.
Sales and marketing expenses for the nine months ended September 30, 2022 on a GAAP basis were $57.2 million, an increase of $9.6 million from $47.5 million in the same period in 2021. Excluding non-cash stock compensation, sales and marketing expenses for the nine months ended September 30, 2022 were $54.0 million, or 45% of revenue, compared to $44.9 million, or 45% of revenue in the same period in 2021.
We continued to moderate the level of marketing spend in the third quarter, yielding efficiencies in our Consumer business. These efficiencies were partially offset by continued investments in our Institutional sales and go-to-market organization in support of Varsity Tutors for Schools, which we expect to grow into as revenue continues to grow and we slow the rate of hiring, thereby creating operating leverage.
Sales and marketing expenses as a percentage of revenue may fluctuate from quarter to quarter based on Learning Membership sales, the size and volume of institutional contracts, bookings, consumption patterns that drive revenue levels, seasonality, and the timing of our investments in marketing activities.
General and Administrative
General and administrative expenses for the three months ended September 30, 2022 on a GAAP basis were $33.4 million, a decrease of $26.5 million from $59.9 million in the same period in 2021. Excluding non-recurring one-time items and non-cash stock compensation expenses, general and administrative expenses for the three months ended September 30, 2022 were $22.3 million, or 70% of revenue, compared to $17.8 million, or 57% of revenue in the third quarter of 2021, reflecting our rollout of Learning Memberships and the impact of revenue being at the bottom of the J Curve during the third quarter.
General and administrative expenses for the nine months ended September 30, 2022 on a GAAP basis were $96.7 million, an increase of $9.0 million from $87.7 million in the same period in 2021. Excluding non-recurring one-time items and non-cash stock compensation expenses, general and administrative expenses for the nine months ended September 30, 2022 were $64.3 million, or 53% of revenue, compared to $42.2 million, or 43% of revenue in the first nine months of 2021.
|
|
Q3 Earnings Release 2022 | 13 |
Nerdy became a publicly traded company in the third quarter of 2021, resulting in higher transaction-related general and administrative expenses on a GAAP basis in the comparable periods last year. On a non-GAAP basis, investments in new product development, the build out of Varsity Tutors for Schools, and administrative expenses related to being a public company resulted in higher third quarter and year-to-date expenses versus the comparable periods last year.
Our investments in product development have allowed us to launch a suite of new products including Learning Memberships, and our Teacher Assigned and On Demand institutional offerings oriented toward recurring revenue subscriptions and contracts. When combined with investments in automation, self-service capabilities, and our machine learning matching algorithms that connect Learners with Experts, our evolution to a Learning Membership model over the last several months has allowed us to generate operating efficiencies. As Learning Memberships mix continues to increase as a percentage of total Active Learners, we believe we will be able to further simplify the sales process and operating model generating additional efficiencies. We also continued to moderate the pace of corporate hiring and third-party vendor spend in the third quarter and expect to gain operating leverage from prior investments as we allow revenue to grow without a proportional increase in both variable and fixed costs. We expect these efficiencies will begin to materialize in the first quarter of 2023, as the cumulative build of Learning Membership and Institutional revenue accelerates and we exit the J Curve.
Net Loss, Non-GAAP Adjusted Net Loss, and Non-GAAP Adjusted EBITDA Loss
Net loss on a GAAP basis was $(32.3) million for the three months ended September 30, 2022, an improvement of $25.4 million from a net loss of $(57.7) million in the same period in 2021. Excluding transaction-related costs, non-recurring one-time items, non-cash stock compensation expenses, and mark-to-market derivative adjustments, adjusted net loss was $(15.6) million for the third quarter of 2022 versus $(14.7) million in the third quarter of 2021.
For the nine months ended September 30, 2022, net loss on a GAAP basis was $(48.8) million, an improvement of $15.0 million from a net loss of $(63.8) million in the same period in 2021. Excluding transaction related costs, non-recurring one-time items, non-cash stock compensation expenses, and mark-to-market derivative adjustments, adjusted net loss for the nine months ended September 30, 2022 was $(35.0) million versus an adjusted net loss of $(25.7) million in the same period one year ago.
Non-GAAP adjusted EBITDA loss was $(14.0) million in the third quarter of 2022 compared to $(11.7) million in the third quarter of 2021. Non-GAAP adjusted EBITDA loss was $(30.2) million for the nine months ended September 30, 2022, compared to $(17.0) million in the same period one year ago.
For both non-GAAP adjusted net loss and non-GAAP adjusted EBITDA loss, revenue and gross profit improvements were offset by investments in technology and product capabilities, and the buildout of Varsity Tutors for Schools. In addition, we previously expanded and enhanced our finance, accounting, and legal functions in connection with being a public company.
See pages 18 to 19 for reconciliations of non-GAAP measures to the most directly comparable GAAP financial measure.
Liquidity and Capital Resources
As of September 30, 2022, the Company’s principal sources of liquidity were cash and cash equivalents of $106.4 million. Our strong balance sheet provides us with ample liquidity to operate against our plan and achieve expected adjusted EBITDA profitability by the end of 2023.
| Conference Call Details |
| Nerdy’s management will host a conference call to discuss its financial results on Monday, November 14, 2022 at 5:00 p.m. Eastern Time. Interested parties in the U.S. may listen to the call by dialing 1-844-200-6205. International callers can dial 1-929-526-1599. The Conference ID is 228320. |
| A live webcast of the call will also be available on Nerdy’s investor relations website at nerdy.com/ investors. A replay of the webcast will be available on Nerdy’s website for one year following the event and a telephonic replay of the call will be available until November 21, 2022 by dialing 1-866-813-9403 from the U.S. or 44-204-525-0658 from all other locations, and entering the access code 271293. |
| Contacts
|
|
|
Q3 Earnings Release 2022 | 14 |
CONDENSED CONSOLIDATED STATEMENTS
OF OPERATIONS (Unaudited)
(in thousands, except per share data)
| Three Months Ended September 30, |
Nine Months Ended September 30, |
|||||||||||||||
| 2022 | 2021 | 2022 | 2021 | |||||||||||||
| Revenue |
$ | 31,752 | $ | 31,298 | $ | 120,863 | $ | 98,649 | ||||||||
| Cost of revenue |
9,835 | 10,639 | 37,418 | 33,344 | ||||||||||||
|
|
|
|
|
|
|
|
|
|||||||||
| Gross Profit |
21,917 | 20,659 | 83,445 | 65,305 | ||||||||||||
| Sales and marketing expenses |
16,195 | 18,773 | 57,152 | 47,520 | ||||||||||||
| General and administrative expenses |
33,409 | 59,902 | 96,669 | 87,674 | ||||||||||||
|
|
|
|
|
|
|
|
|
|||||||||
| Operating Loss |
(27,687 | ) | (58,016 | ) | (70,376 | ) | (69,889 | ) | ||||||||
| Unrealized loss (gain) on derivatives, net |
4,521 | (11,342 | ) | (21,773 | ) | (11,342 | ) | |||||||||
| Interest (income) expense, net |
(7 | ) | 1,286 | (19 | ) | 3,777 | ||||||||||
| Other expense, net |
75 | 8,446 | 149 | 8,539 | ||||||||||||
| Loss (gain) on extinguishment of debt, net |
— | 1,278 | — | (7,117 | ) | |||||||||||
|
|
|
|
|
|
|
|
|
|||||||||
| Loss before Income Taxes |
(32,276 | ) | (57,684 | ) | (48,733 | ) | (63,746 | ) | ||||||||
| Income tax expense |
22 | 35 | 35 | 35 | ||||||||||||
|
|
|
|
|
|
|
|
|
|||||||||
| Net Loss |
(32,298 | ) | (57,719 | ) | (48,768 | ) | (63,781 | ) | ||||||||
| Net loss attributable to legacy Nerdy holders prior to the reverse recapitalization |
— | (17,484 | ) | — | (23,546 | ) | ||||||||||
| Net loss attributable to noncontrolling interests |
(13,782 | ) | (18,960 | ) | (22,102 | ) | (18,960 | ) | ||||||||
|
|
|
|
|
|
|
|
|
|||||||||
| Net Loss Attributable to Class A Common Stockholders |
$ | (18,516 | ) | $ | (21,275 | ) | $ | (26,666 | ) | $ | (21,275 | ) | ||||
|
|
|
|
|
|
|
|
|
|||||||||
| Loss per share of Class A Common Stock: |
||||||||||||||||
| Basic and Diluted |
$ | (0.21 | ) | $ | (0.27 | ) | $ | (0.32 | ) | $ | (0.27 | ) | ||||
| Weighted-Average Shares of Class A Common Stock Outstanding: |
||||||||||||||||
| Basic and Diluted |
87,714 | 79,233 | 84,601 | 79,233 | ||||||||||||
REVENUE (Unaudited)
(in thousands)
| Three Months Ended September 30, |
Nine Months Ended September 30, |
|||||||||||||||||||||||||||||||
| 2022 | % | 2021 | % | 2022 | % | 2021 | % | |||||||||||||||||||||||||
| Consumer |
$ | 29,087 | 92 | % | $ | 29,249 | 94 | % | $ | 103,640 | 86 | % | $ | 92,930 | 94 | % | ||||||||||||||||
| Institutional |
2,393 | 7 | % | 952 | 3 | % | 14,693 | 12 | % | 1,340 | 1 | % | ||||||||||||||||||||
| Other (a) |
272 | 1 | % | 1,097 | 3 | % | 2,530 | 2 | % | 4,379 | 5 | % | ||||||||||||||||||||
|
|
|
|
|
|
|
|
|
|
|
|
|
|
|
|
|
|||||||||||||||||
| Revenue |
$ | 31,752 | 100 | % | $ | 31,298 | 100 | % | $ | 120,863 | 100 | % | $ | 98,649 | 100 | % | ||||||||||||||||
|
|
|
|
|
|
|
|
|
|
|
|
|
|
|
|
|
|||||||||||||||||
| (a) | Other consists of the legacy Veritas Prep LLC business and EduNation Limited, a company incorporated in England and Wales (“First Tutors UK”) and other services. |
|
|
Q3 Earnings Release 2022 | 15 |
CONDENSED CONSOLIDATED BALANCE SHEETS (Unaudited)
(in thousands)
| September 30, 2022 |
December 31, 2021 |
|||||||
| ASSETS |
| |||||||
| Current Assets |
||||||||
| Cash and cash equivalents |
$ | 106,382 | $ | 143,964 | ||||
| Accounts receivable, net |
3,600 | 5,321 | ||||||
| Other current assets |
4,218 | 6,165 | ||||||
|
|
|
|
|
|||||
| Total Current Assets |
114,200 | 155,450 | ||||||
| Fixed assets, net |
12,546 | 10,718 | ||||||
| Goodwill |
5,717 | 5,717 | ||||||
| Intangible assets, net |
3,566 | 4,428 | ||||||
| Other assets |
3,590 | 832 | ||||||
|
|
|
|
|
|||||
| Total Assets |
$ | 139,619 | $ | 177,145 | ||||
|
|
|
|
|
|||||
| LIABILITIES AND STOCKHOLDERS’ EQUITY |
| |||||||
| Current Liabilities |
||||||||
| Accounts payable |
$ | 5,596 | $ | 3,590 | ||||
| Deferred revenue |
20,933 | 30,005 | ||||||
| Due to legacy Nerdy holders |
— | 841 | ||||||
| Other current liabilities |
9,926 | 7,473 | ||||||
|
|
|
|
|
|||||
| Total Current Liabilities |
36,455 | 41,909 | ||||||
| Other liabilities |
19,247 | 39,431 | ||||||
|
|
|
|
|
|||||
| Total Liabilities |
55,702 | 81,340 | ||||||
| Stockholders’ Equity |
||||||||
| Class A common stock |
9 | 8 | ||||||
| Class B common stock |
7 | 7 | ||||||
| Additional paid-in capital |
514,617 | 490,220 | ||||||
| Accumulated deficit |
(466,374 | ) | (439,708 | ) | ||||
| Accumulated other comprehensive (loss) income |
(91 | ) | 136 | |||||
|
|
|
|
|
|||||
| Total Stockholders’ Equity Excluding Noncontrolling Interests |
48,168 | 50,663 | ||||||
| Noncontrolling interests |
35,749 | 45,142 | ||||||
|
|
|
|
|
|||||
| Total Stockholders’ Equity |
83,917 | 95,805 | ||||||
|
|
|
|
|
|||||
| Total Liabilities and Stockholders’ Equity |
$ | 139,619 | $ | 177,145 | ||||
|
|
|
|
|
|||||
|
|
Q3 Earnings Release 2022 | 16 |
CONDENSED CONSOLIDATED STATEMENTS
OF CASH FLOWS (Unaudited)
(in thousands)
| Nine Months Ended September 30, |
||||||||
| 2022 | 2021 | |||||||
| Cash Flows From Operating Activities |
||||||||
| Net Loss |
$ | (48,768 | ) | $ | (63,781 | ) | ||
| Adjustments to reconcile net loss to net cash used in operating activities: |
||||||||
| Depreciation & amortization |
4,368 | 3,957 | ||||||
| Amortization of intangibles |
454 | 804 | ||||||
| Unrealized gain on derivatives, net |
(21,773 | ) | (11,342 | ) | ||||
| Gain on extinguishment of debt, net |
— | (7,117 | ) | |||||
| Stock-based compensation |
35,502 | 38,515 | ||||||
| Amortization of deferred debt charges |
— | 493 | ||||||
| Gain on asset dispositions |
— | (3 | ) | |||||
| Reverse recapitalization costs allocated to warrants and earnouts |
— | 1,604 | ||||||
| Other changes in operating assets and liabilities: |
||||||||
| Decrease (increase) in accounts receivable, net |
1,721 | (1,712 | ) | |||||
| Decrease (increase) in other current assets |
1,252 | (1,154 | ) | |||||
| Decrease in other assets |
882 | 18 | ||||||
| Increase in accounts payable |
2,006 | 525 | ||||||
| Increase in other current liabilities |
998 | 12,737 | ||||||
| Decrease in other liabilities |
(1,040 | ) | (607 | ) | ||||
| (Decrease) increase in deferred revenue |
(9,072 | ) | 7,114 | |||||
|
|
|
|
|
|||||
| Net Cash Used In Operating Activities |
(33,470 | ) | (19,949 | ) | ||||
|
|
|
|
|
|||||
| Cash Flows From Investing Activities |
||||||||
| Capital expenditures |
(4,339 | ) | (3,769 | ) | ||||
|
|
|
|
|
|||||
| Net Cash Used In Investing Activities |
(4,339 | ) | (3,769 | ) | ||||
|
|
|
|
|
|||||
| Cash Flows From Financing Activities |
||||||||
| Proceeds from reverse recapitalization, net |
— | 558,324 | ||||||
| Payments to legacy Nerdy holders |
(767 | ) | (299,317 | ) | ||||
| Payments of reverse recapitalization costs |
— | (16,712 | ) | |||||
| Proceeds from loan and security agreement |
— | 11,000 | ||||||
| Repayment of loan and security agreement |
— | (50,000 | ) | |||||
| Payments of debt extinguishment costs |
— | (1,607 | ) | |||||
| Other |
(96 | ) | — | |||||
|
|
|
|
|
|||||
| Net Cash (Used In) Provided By Financing Activities |
(863 | ) | 201,688 | |||||
|
|
|
|
|
|||||
| Effect of Exchange Rate Change on Cash, Cash Equivalents, and Restricted Cash |
7 | 2 | ||||||
|
|
|
|
|
|||||
| Net (Decrease) Increase in Cash, Cash Equivalents, and Restricted Cash |
(38,665 | ) | 177,972 | |||||
| Cash, Cash equivalents, and Restricted Cash, Beginning of Year |
145,879 | 30,682 | ||||||
|
|
|
|
|
|||||
| Cash, Cash Equivalents, and Restricted Cash, End of Period |
$ | 107,214 | $ | 208,654 | ||||
|
|
|
|
|
|||||
| Supplemental Cash Flow Information |
||||||||
| Stock-based compensation included in capitalized internal use software |
$ | 1,870 | $ | — | ||||
| Purchase of fixed assets included in accounts payable |
— | 174 | ||||||
|
|
Q3 Earnings Release 2022 | 17 |
RECONCILIATION OF GAAP TO NON-GAAP SALES AND
MARKETING EXPENSE (Unaudited)
(in thousands)
| Three Months Ended September 30, |
Nine Months Ended September 30, |
|||||||||||||||
| 2022 | 2021 | 2022 | 2021 | |||||||||||||
| Sales and marketing expenses |
$ | 16,195 | $ | 18,773 | $ | 57,152 | $ | 47,520 | ||||||||
| Less: |
||||||||||||||||
| Stock-based compensation |
1,085 | 2,648 | 3,130 | 2,648 | ||||||||||||
|
|
|
|
|
|
|
|
|
|||||||||
| Non-GAAP sales and marketing expenses |
$ | 15,110 | $ | 16,125 | $ | 54,022 | $ | 44,872 | ||||||||
|
|
|
|
|
|
|
|
|
|||||||||
RECONCILIATION OF GAAP TO NON-GAAP GENERAL
AND ADMINISTRATIVE EXPENSE (Unaudited)
(in thousands)
| Three Months Ended September 30, |
Nine Months Ended September 30, |
|||||||||||||||
| 2022 | 2021 | 2022 | 2021 | |||||||||||||
| General and administrative expenses |
$ | 33,409 | $ | 59,902 | $ | 96,669 | $ | 87,674 | ||||||||
| Less: |
||||||||||||||||
| Stock-based compensation |
11,073 | 34,863 | 32,372 | 35,867 | ||||||||||||
| Transaction related costs |
— | 7,216 | — | 9,602 | ||||||||||||
|
|
|
|
|
|
|
|
|
|||||||||
| Non-GAAP general and administrative expenses |
$ | 22,336 | $ | 17,823 | $ | 64,297 | $ | 42,205 | ||||||||
|
|
|
|
|
|
|
|
|
|||||||||
RECONCILIATION OF GAAP NET EARNINGS (LOSS) TO
ADJUSTED EBITDA LOSS (Unaudited)
(in thousands)
| Three Months Ended September 30, |
Nine Months Ended September 30, |
|||||||||||||||||||
| 2022 | 2021 | 2022 | 2021 | |||||||||||||||||
| Net Loss |
$ | (32,298 | ) | $ | (57,719 | ) | $ | (48,768 | ) | $ | (63,781 | ) | ||||||||
| Add: |
||||||||||||||||||||
| Interest (income) expense, net |
(7 | ) | 1,286 | (19 | ) | 3,777 | ||||||||||||||
| Income and franchise taxes |
22 | 75 | 35 | 200 | ||||||||||||||||
| Depreciation and amortization |
1,653 | 1,596 | 4,822 | 4,761 | ||||||||||||||||
| Stock-based compensation |
12,158 | 37,511 | 35,502 | 38,515 | ||||||||||||||||
| Unrealized loss (gain) on derivatives, net |
4,521 | (11,342 | ) | (21,773 | ) | (11,342 | ) | |||||||||||||
| Loss on repayment of promissory note |
— | 8,395 | — | 8,395 | ||||||||||||||||
| Loss (gain) on extinguishment of debt, net |
— | 1,278 | — | (7,117 | ) | |||||||||||||||
| Transaction related costs |
— | 7,216 | — | 9,602 | ||||||||||||||||
|
|
|
|
|
|
|
|
|
|||||||||||||
| Adjusted EBITDA Loss |
$ | (13,951 | ) | $ | (11,704 | ) | $ | (30,201 | ) | $ | (16,990 | ) | ||||||||
|
|
|
|
|
|
|
|
|
|||||||||||||
|
|
Q3 Earnings Release 2022 | 18 |
RECONCILIATION OF GAAP NET EARNINGS (LOSS) TO ADJUSTED NET LOSS
(Unaudited)
(in thousands)
| Three Months Ended September 30, |
Nine Months Ended September 30, |
|||||||||||||||
| 2022 | 2021 | 2022 | 2021 | |||||||||||||
| Net Loss |
$ | (32,298 | ) | $ | (57,719 | ) | $ | (48,768 | ) | $ | (63,781 | ) | ||||
| Add: |
||||||||||||||||
| Stock-based compensation |
12,158 | 37,511 | 35,502 | 38,515 | ||||||||||||
| Unrealized loss (gain) on derivatives, net |
4,521 | (11,342 | ) | (21,773 | ) | (11,342 | ) | |||||||||
| Loss on repayment of promissory note |
— | 8,395 | — | 8,395 | ||||||||||||
| Loss (gain) on extinguishment of debt, net |
— | 1,278 | — | (7,117 | ) | |||||||||||
| Transaction related costs |
— | 7,216 | — | 9,602 | ||||||||||||
|
|
|
|
|
|
|
|
|
|||||||||
| Adjusted Net Loss |
$ | (15,619 | ) | $ | (14,661 | ) | $ | (35,039 | ) | $ | (25,728 | ) | ||||
|
|
|
|
|
|
|
|
|
|||||||||
CAPITALIZATION RECONCILIATION (Unaudited)
(in thousands)
| September 30, 2022 |
||||
| Class A Common Shares |
88,600 | |||
| Combined Interests that can be converted into shares of Class A Common Stock |
65,790 | |||
|
|
|
|||
| Total outstanding share count, excluding Earnouts |
154,390 | |||
| Earnouts |
7,964 | |||
|
|
|
|||
| Total outstanding share count, end of period |
162,354 | |||
|
|
|
|||
|
|
Q3 Earnings Release 2022 | 19 |
We monitor the following key financial and operating metrics to evaluate the growth of our business, measure our performance, identify trends affecting our business, formulate business plans, and make strategic decisions. The below metrics exclude the legacy Veritas Prep LLC business and EduNation Limited, a company incorporated in England and Wales (“First Tutors UK”) (collectively, the “Legacy Businesses”), as well as our On Demand and Teacher Assigned solutions.
Consistent with our previously discussed expectations, Active Learner and Session growth rates decreased during the third quarter and reflect our decisions to shift our go-to-market strategy and products to focus on higher value and longer duration Learning Membership customers. Both metrics were primarily affected by the shift to Learning Memberships (and the related inclusion of Classes in our Learning Membership offering vs. selling academic and enrichment Classes on a stand-alone basis) as we evolve our focus toward higher lifetime value recurring relationships with Learners.
KEY FINANCIAL AND OPERATING METRICS
| Active Learners in ones; favorable/(unfavorable) |
Three Months Ended September 30, |
Change | Nine Months Ended September 30, |
Change | ||||||||||||||||||||
| 2022 | 2021 | % | 2022 | 2021 | % | |||||||||||||||||||
| Active Learners |
53,214 | 51,572 | 3 | % | 104,231 | 99,287 | 5 | % | ||||||||||||||||
| dollars in ones; favorable/(unfavorable) |
Three Months Ended September 30, |
Change | Nine Months Ended September 30, |
Change | ||||||||||||||||||||
| 2022 | 2021 | % | 2022 | 2021 | % | |||||||||||||||||||
| Revenue per Active Learner |
$ | 597 | $ | 607 | (2 | )% | $ | 1,160 | $ | 994 | 17 | % | ||||||||||||
| Sessions in thousands; favorable/(unfavorable) |
Three Months Ended September 30, |
Change | Nine Months Ended September 30, |
Change | ||||||||||||||||||||
| 2022 | 2021 | % | 2022 | 2021 | % | |||||||||||||||||||
| Sessions |
371 | 451 | (18 | )% | 1,378 | 1,396 | (1 | )% | ||||||||||||||||
| Sessions Taught per Active Expert in ones: favorable/(unfavorable) |
Three Months Ended September 30, |
Change | Nine Months Ended September 30, |
Change | ||||||||||||||||||||
| 2022 | 2021 | % | 2022 | 2021 | % | |||||||||||||||||||
| Sessions Taught per Active Expert |
27 | 31 | (13 | )% | 66 | 72 | (8 | )% | ||||||||||||||||
| in hours; favorable/(unfavorable) |
Three Months Ended September 30, |
Change | Nine Months Ended September 30, |
Change | ||||||||||||||||||||
| 2022 | 2021 | % | 2022 | 2021 | % | |||||||||||||||||||
| One-on-One Average Session Length |
1.30 | 1.34 | (3 | )% | 1.29 | 1.32 | (2 | )% | ||||||||||||||||
|
|
Q3 Earnings Release 2022 | 20 |
Key Performance Metrics and Non-GAAP Financial Measures
This earnings release includes non-GAAP financial measures for non-GAAP sales and marketing expenses, non-GAAP general and administrative expenses, non-GAAP adjusted EBITDA (loss), and non-GAAP adjusted net loss.
Non-GAAP sales and marketing expenses exclude non-cash stock compensation expenses. Non-GAAP general and administrative expenses exclude non-cash stock compensation expenses and transaction-related costs.
Non-GAAP adjusted EBITDA (loss) is defined as net income or net loss, as applicable, before net interest income (expense), taxes, depreciation and amortization expense, non-cash stock-based compensation expenses, gain or loss on mark-to-market derivative financial instruments, gain or loss on debt extinguishment, transaction-related costs, and non-recurring one-time items.
Non-GAAP adjusted net earnings or loss is defined as net income or net loss, as applicable, excluding non-cash stock-based compensation expenses, gain or loss on mark-to-market derivative financial instruments, gain or loss on debt extinguishment, transaction-related costs, and non-recurring one-time items.
Sales and marketing expenses consist of salaries and benefits for our employees engaged in our consultative sales process. General and administrative expenses are recorded in the period in which they are incurred and include salaries, benefits, and stock-based compensation expense for certain employees as well as support services, finance, legal, human resources, other administrative employees, information technology expenses, outside services, legal and accounting services, depreciation expense, and other costs required to support our operations.
Net loss per share is computed by dividing net loss by the weighted average number of ordinary shares outstanding during the period as calculated using the treasury stock method.
Non-GAAP measures are in addition, and not a substitute for or superior to measures of financial performance prepared in accordance with GAAP and should not be considered as an alternative to sales, net income, operating income, cash flows from operations, or any other performance measures derived in accordance with GAAP. Other companies may calculate these non-GAAP financial measures differently, and therefore such financial measures may not be directly comparable to similarly titled measures of other companies. The Company believes that these non-GAAP measures of financial results provide useful supplemental information. The Company’s management uses these non-GAAP measures to evaluate the Company’s operating performance, trends, and to compare it against the performance of other companies. There are, however, a number of limitations related to the use of these non-GAAP measures and their nearest GAAP equivalents. See the table above regarding reconciliation of non-GAAP measures to the most directly comparable GAAP measures.
Active Learners is defined as the Learners attending a paid 1-on-1 session, a paid class, or a paid group tutoring session in a given period, as well as the number of unique Learning Membership customers.
Amounts exclude Legacy Businesses as well as our On Demand and Teacher Assigned solutions. An increase or decrease in the number of Active Learners is a key indicator of our ability to attract and engage Learners.
Revenue per Active Learner is defined as GAAP revenue divided by the number of Active Learners in a given year or period.
Sessions are defined as the total number of paid 1-on-1 sessions, the number of paid group classes enrollees, the number of paid group tutoring session attendees, and the number of sessions enrolled in by Learning Membership customers in a given period. Amounts exclude Legacy Businesses as well as our On Demand and Teacher Assigned solutions.
|
|
Q3 Earnings Release 2022 | 21 |
Active Experts is defined as the unique number of Experts instructing a 1-on-1 session, a class, or a group tutoring session in a given period. Amounts exclude Legacy Businesses as well as our On Demand and Teacher Assigned solutions.
Sessions Taught per Active Expert is calculated as the number of 1-on-1 sessions, the number of group classes, and the number of group tutoring sessions per active Expert in a given period. Amounts exclude Legacy Businesses as well as our On Demand and Teacher Assigned solutions.
1-on-1 average session length is defined as a session (e.g., an instructional meeting) between a Learner and a single Expert in a 1-on-1 setting. Amounts exclude Legacy Businesses as well as our On Demand and Teacher Assigned solutions.
Bookings represent contracted amounts in the next 12 months for Varsity Tutors for Schools.
Management and our board of directors use these metrics as supplemental measures of our performance that are not required by or presented in accordance with GAAP because they assist us in comparing our operating performance on a consistent basis, as they remove the impact of items not directly resulting from our core operations. We also use these metrics for planning purposes, including the preparation of our internal annual operating budget and financial projections, to evaluate the performance and effectiveness of our strategic initiatives and to evaluate our capacity to expand our business and the capital expenditures required for that expansion.
Non-GAAP sales and marketing expenses, non-GAAP general and administrative expenses, non-GAAP adjusted EBITDA (loss), and non-GAAP adjusted net income or loss should not be considered in isolation, as an alternative to, or superior to net loss, revenue, cash flows or other performance measure derived in accordance with GAAP. We believe these metrics are frequently used by analysts, investors, and other interested parties to evaluate companies in our industry. Management believes that the presentation of non-GAAP metrics is an appropriate measure of operating performance because they eliminate the impact of expenses that do not relate directly to the performance of our underlying business. These non-GAAP metrics should not be construed as an implication that our future results will be unaffected by unusual or other items. We are not able to provide a reconciliation of non-GAAP adjusted EBITDA (loss) guidance for future periods to net loss, the comparable GAAP measure, because certain items that are excluded from non-GAAP adjusted EBITDA (loss) cannot be reasonably predicted or are not in our control. In particular, we are unable to forecast the timing or magnitude for gains or losses on mark-to-market derivative financial instruments, or share based compensation without unreasonable efforts, and these items could significantly impact, either individually or in the aggregate, net income or loss in the future. See the tables above regarding reconciliations of these non-GAAP measures to the most directly comparable GAAP measures for historical periods.
|
|
Q3 Earnings Release 2022 | 22 |
Forward-Looking Statements
The information included herein and in any oral statements made in connection herewith may include “forward-looking statements” within the meaning of Section 27A of the Securities Act of 1933, as amended, and Section 21E of the Securities Exchange Act of 1934, as amended. Forward-looking statements include, but are not limited to, statements regarding our or our management team’s expectations, hopes, beliefs, intentions, or strategies regarding the future, including statements related to our expectations of the benefits and future financial results of our Learning Membership model, statements regarding our financial outlook and future guidance, including statements regarding our expectations to achieve adjusted EBITDA profitability. Additionally, any statements that refer to projections, forecasts, or other characterizations of future events or circumstances, including any underlying assumptions, are forward-looking statements. The words “anticipates,” “approximately,” “believes,” “contemplates,” “continues,” “could,” “estimates,” “expects,” “intends,” “may,” “might,” “outlook,” “plans,” “possible,” “potential,” “predicts,” “projects,” “should,” “seeks,” “will,” “would,” and similar expressions may identify forward-looking statements, but the absence of these words does not mean that a statement is not forward-looking.
The forward-looking statements made herein relate only to events as of the date on which the statements are made. We undertake no obligation to update any forward-looking statements to reflect events or circumstances after the date of this press release or to reflect new information or the occurrence of unanticipated events, except as required by law. We may not actually achieve the plans, intentions, or expectations disclosed in our forward-looking statements, and you should not place undue reliance on our forward-looking statements.
There are a significant number of factors that could cause actual results to differ materially from statements made herein or in connection herewith, including but not limited to, our limited operating history, which makes it difficult to predict our future financial and operating results; our history of net losses; risks associated with our shift to the Learning Membership model; risks associated with our intellectual property, including claims that we infringe on a third party’s intellectual property rights; risks associated with our classification of some individual and entities we contract with as independent contractors; risks associated with the liquidity and trading of the Company’s securities; risks associated with payments that we may be required to make under the tax receivable agreement; risks associated with the terms of our warrants; litigation, regulatory and reputational risks arising from the fact that many of our learners are minors; our lack of an effective control environment that meets our accounting and reporting requirements; changes in applicable laws or regulations; the possibility of cyber-related incidents and their related impacts on our business and results of operations; the possibility that COVID-19 may adversely affect our results of operations, financial position and cash flows; the possibility that we may be adversely affected by other economic, business and/or competitive factors; and risks associated with managing our rapid growth. Our actual results could differ materially from those stated or implied in forward-looking statements due to a number of factors, including but not limited to, risks detailed in our filings with the SEC, including our Annual Report on Form 10-K filed on February 28, 2022 and our Quarterly Report on Form 10-Q filed on November 14, 2022, as well as other filings that we may make from time to time with the SEC.
|
|
Q3 Earnings Release 2022 | 23 |