|
Insight Q2 2020 Results, Page 1 |
|
August 6, 2020 |
Exhibit 99.1

|
|
|
FOR IMMEDIATE RELEASE |
Nasdaq: NSIT |
Insight Enterprises, Inc. Reports SECOND QUARTER
2020 Results
TEMPE, AZ – August 6, 2020 – Insight Enterprises, Inc. (Nasdaq: NSIT) (the “Company”) today reported financial results for the quarter ended June 30, 2020. Highlights include:
|
|
• |
Record cash flows from operating activities |
|
|
• |
Net sales increased 7% year over year to $1.97 billion |
|
|
• |
Gross profit increased 18% year over year to $324.4 million |
|
|
• |
Earnings from operations increased 3% to $74.2 million |
|
|
• |
Adjusted earnings from operations increased 15% to $91.8 million |
|
|
• |
Diluted earnings per share of $1.32 decreased 5% year to year |
|
|
• |
Adjusted diluted earnings per share of $1.75 increased 11% year over year |
In the second quarter of 2020, net sales increased 7%, year over year, primarily as a result of our acquisition of PCM, Inc. (“PCM”) on August 30, 2019. Excluding PCM, net sales in our core business would have been down due to the negative impact of the COVID-19 pandemic. Gross profit increased 18%, year over year, and gross margin increased 150 basis points compared to the second quarter of 2019. The increase in gross profit and gross margin reflects our continued emphasis on growing our higher margin cloud and services business. Diluted earnings per share was $1.32, down 5%, year to year, and adjusted diluted earnings per share was $1.75, up 11%, year over year.
“In a challenging demand environment our operating priorities for the quarter were clear. We tightened the health and safety standards in our warehouses and mobilized most of our teammates to work from home, which allowed us to continue to support our clients’ most pressing IT needs,” stated Ken Lamneck, President and Chief Executive Officer. “We also reduced our discretionary operating expenses sequentially and delivered strong cash flow results, all while driving double digit adjusted earnings growth year over year,” stated Lamneck.
KEY HIGHLIGHTS
|
|
• |
We continued to support clients with their changing needs in response to the COVID-19 global pandemic. Through our four solution areas, we have accelerated the use of digital marketing platforms to bring relevant solutions to our clients through webinars, ecommerce demonstrations and market intelligence and research. |
|
|
• |
We maintained our focus on successfully integrating the PCM business and are nearing completion with the onboarding of almost all PCM clients to our systems. We aligned our go-to-market structure in North America and EMEA and believe we are well positioned to compete as a single brand in the marketplace. We are currently ahead of our first-year expectations in annualized run-rate cost savings based on our previously disclosed total commitment of $70 million over two years. |
|
|
• |
Cash flow from operations for the first half of 2020 of $497.5 million increased more than 100% year over year when compared to the first half of 2019. |
- MORE -
|
Insight Enterprises, Inc. |
|
6820 South Harl Avenue |
|
Tempe, Arizona 85283 |
|
800.467.4448 |
|
FAX 480.760.8958 |
|
Insight Q2 2020 Results, Page 2 |
|
August 6, 2020 |
|
|
• |
We believe that we have a strong balance sheet and healthy liquidity position, including amounts available under our ABL facility with current capacity of up to $1.2 billion, of which $144.0 million in loans were outstanding at June 30, 2020. |
|
|
• |
Consolidated net sales for the second quarter of 2020 of $1.97 billion increased 7% year over year when compared to the second quarter of 2019. |
|
|
• |
Net sales in North America increased 10% year over year to $1.54 billion; |
|
|
• |
Net sales in EMEA increased 3% year over year to $392.0 million; and |
|
|
• |
Net sales in APAC decreased 27% year to year to $37.6 million. |
|
|
• |
Excluding the effects of fluctuating foreign currency exchange rates, consolidated net sales increased 8% year over year, with growth in net sales in North America and EMEA of 10% and 6%, respectively, year over year partially offset by a decline in APAC of 23%, year to year. |
|
|
• |
Consolidated gross profit increased to $324.4 million, an increase of 18% compared to the second quarter of 2019, with consolidated gross margin expanding 150 basis points to 16.5% of net sales. |
|
|
• |
Gross profit in North America increased 23% year over year to $244.9 million (15.9% gross margin); |
|
|
• |
Gross profit in EMEA increased 6% year over year to $68.2 million (17.4% gross margin); and |
|
|
• |
Gross profit in APAC decreased 5% year to year to $11.3 million (30.1% gross margin). |
|
|
• |
Excluding the effects of fluctuating foreign currency exchange rates, consolidated gross profit increased 19% year over year, with gross profit growth in North America and EMEA of 23% and 8%, respectively, year over year. Gross profit in APAC was flat year over year. |
|
|
• |
Consolidated earnings from operations increased 3% compared to the second quarter of 2019 to $74.2 million, or 3.8% of net sales. |
|
|
• |
Earnings from operations in North America increased 2% year over year to $52.1 million, or 3.4% of net sales; |
|
|
• |
Earnings from operations in EMEA increased 8% year over year to $17.9 million, or 4.6% of net sales; and |
|
|
• |
Earnings from operations in APAC decreased 8% year to year to $4.2 million, or 11.2% of net sales. |
|
|
• |
Excluding the effects of fluctuating foreign currency exchange rates, consolidated earnings from operations increased 4% year over year, with increased earnings from operations in North America and EMEA of 3% and 10%, respectively, year over year, partially offset by decreased earnings from operations in APAC of 4%, year to year. |
|
|
• |
Adjusted earnings from operations increased 15% compared to the second quarter of 2019 to $91.8 million, or 4.7% of net sales. |
|
|
• |
Adjusted earnings from operations in North America increased 15% year over year to $67.0 million, or 4.4% of net sales; |
|
|
• |
Adjusted earnings from operations in EMEA increased 22% year over year to $20.5 million, or 5.2% of net sales; and |
|
|
• |
Adjusted earnings from operations in APAC decreased 8% year to year to $4.3 million, or 11.5% of net sales. |
|
|
• |
Consolidated net earnings and diluted earnings per share for the second quarter of 2020 were $46.4 million and $1.32, respectively, at an effective tax rate of 26.2%. |
|
|
• |
Adjusted consolidated net earnings and Adjusted diluted earnings per share for the second quarter of 2020 were $61.8 million and $1.75, respectively. |
In discussing financial results for the three and six months ended June 30, 2020 and 2019 in this press release, the Company refers to certain financial measures that are adjusted from the financial results prepared in accordance with United States generally accepted accounting principles (“GAAP”). When referring to non-GAAP measures, the Company refers to such measures as “Adjusted.” See “Use of Non-GAAP Financial Measures” for additional information. A tabular reconciliation of financial measures prepared in accordance with GAAP to the non-GAAP financial measures is included at the end of this press release.
In some instances the Company refers to changes in net sales, gross profit and earnings from operations on a consolidated basis and in North America, EMEA and APAC excluding the effects of fluctuating foreign currency exchange rates. In computing these changes and percentages, the Company compares the current year
- MORE -
|
Insight Enterprises, Inc. |
|
6820 South Harl Avenue |
|
Tempe, Arizona 85283 |
|
800.467.4448 |
|
FAX 480.760.8958 |
|
Insight Q2 2020 Results, Page 3 |
|
August 6, 2020 |
amount as translated into U.S. dollars under the applicable accounting standards to the prior year amount in local currency translated into U.S. dollars utilizing the weighted average translation rate for the current period.
The tax effect of Adjusted amounts referenced herein were computed using the statutory tax rate for the taxing jurisdictions in the operating segment in which the related expenses were recorded, adjusted for the effects of valuation allowances on net operating losses in certain jurisdictions.
guidance AND ANTICIPATED COVID-19 IMPACT
When reporting its first quarter financial results, the Company withdrew its 2020 guidance for net sales and Adjusted diluted earnings per share due to the high level of economic uncertainty and disruption caused by COVID-19. We observed a pronounced impact of COVID-19 on our second quarter financial results compared to internal budgets and we anticipate demand for our products and services will continue to be down in the third quarter of 2020, as clients continue to evaluate the impact of COVID-19 on their businesses, their profitability and their liquidity. The ultimate extent of the impact of the COVID-19 pandemic on our business operations, financial performance and results of operations, including our ability to execute our business strategies and initiatives in the expected time frame, is currently unknown and will depend on future developments, which are highly uncertain, continuously evolving and cannot be predicted. This includes, but is not limited to, the duration and spread of the COVID-19 pandemic, its severity, the actions taken to contain the virus or treat its impact, such as restrictions on travel and transportation, and how quickly and to what extent normal economic and operating conditions can resume.
Conference Call and Webcast
The Company will host a conference call and live web cast today at 9:00 a.m. ET to discuss second quarter 2020 results of operations. A live web cast of the conference call (in listen-only mode) will be available on the Company’s web site at http://investor.insight.com/, and a replay of the web cast will be available on the Company’s web site for a limited time following the call. To listen to the live web cast by telephone, call 1-833-922-2056 if located in the U.S., 409-330-8713 for international callers, and enter the access code 1769399.
Use of NON-GAAP Financial Measures
The non-GAAP financial measures are referred to as “Adjusted”. Adjusted consolidated earnings from operations, Adjusted consolidated net earnings and Adjusted diluted earnings per share exclude (i) severance and restructuring expenses, (ii) certain acquisition and integration related expenses, (iii) amortization of intangible assets, and (iv) the tax effects of each of these items, as applicable. Adjusted consolidated net earnings and Adjusted diluted earnings per share also exclude amortization of debt discount and issuance costs associated with the issuance of the Company’s convertible senior notes due 2025. The Company excludes these items when internally evaluating earnings from operations, tax expense, net earnings and diluted earnings per share for the Company and earnings from operations for each of the Company’s operating segments. Adjusted free cash flow is the Company’s net cash provided by operating activities adjusted for (i) purchases of property and equipment and (ii) the net borrowings or repayments under the inventory financing facilities. Adjusted return on invested capital (“ROIC”) excludes (i) severance and restructuring expenses, (ii) certain acquisition and integration related expenses, (iii) impairment of construction in progress, and (iv) the tax effects of each of these items, as applicable.
These non-GAAP measures are used to evaluate financial performance against budgeted amounts, to calculate incentive compensation, to assist in forecasting future performance and to compare the Company’s results to those of the Company’s competitors. The Company believes that these non-GAAP financial measures are useful to investors because they allow for greater transparency, facilitate comparisons to prior periods and the Company’s competitors’ results and assist in forecasting performance for future periods. These non-GAAP financial measures are not prepared in accordance with GAAP and may be different from non-GAAP financial measures presented by other companies. Non-GAAP financial measures should not be considered as a substitute for, or superior to, measures of financial performance prepared in accordance with GAAP.
- MORE -
|
Insight Enterprises, Inc. |
|
6820 South Harl Avenue |
|
Tempe, Arizona 85283 |
|
800.467.4448 |
|
FAX 480.760.8958 |
|
Insight Q2 2020 Results, Page 4 |
|
August 6, 2020 |
Financial Summary Table
(dollars in thousands, except per share data)
(Unaudited)
|
|
|
Three Months Ended June 30, |
|
|
Six Months Ended June 30, |
|
|
|
|
2020 |
|
|
2019 |
|
|
change |
|
|
2020 |
|
|
2019 |
|
|
change |
|
|
Insight Enterprises, Inc. |
|
|
|
|
|
|
|
|
|
|
|
|
|
|
|
|
|
|
|
|
|
|
|
|
|
Net sales: |
|
|
|
|
|
|
|
|
|
|
|
|
|
|
|
|
|
|
|
|
|
|
|
|
|
Products |
|
$ |
1,672,933 |
|
|
$ |
1,594,335 |
|
|
5% |
|
|
$ |
3,521,249 |
|
|
$ |
3,061,007 |
|
|
15% |
|
|
Services |
|
$ |
295,802 |
|
|
$ |
241,686 |
|
|
22% |
|
|
$ |
591,537 |
|
|
$ |
460,480 |
|
|
28% |
|
|
Total net sales |
|
$ |
1,968,735 |
|
|
$ |
1,836,021 |
|
|
7% |
|
|
$ |
4,112,786 |
|
|
$ |
3,521,487 |
|
|
17% |
|
|
Gross profit |
|
$ |
324,389 |
|
|
$ |
275,449 |
|
|
18% |
|
|
$ |
649,725 |
|
|
$ |
523,921 |
|
|
24% |
|
|
Gross margin |
|
|
16.5 |
% |
|
|
15.0 |
% |
|
150 bps |
|
|
|
15.8 |
% |
|
|
14.9 |
% |
|
90 bps |
|
|
Selling and administrative expenses |
|
$ |
242,580 |
|
|
$ |
199,489 |
|
|
22% |
|
|
$ |
511,443 |
|
|
$ |
390,552 |
|
|
31% |
|
|
Severance and restructuring expenses |
|
$ |
7,010 |
|
|
$ |
680 |
|
|
> 100% |
|
|
$ |
9,154 |
|
|
$ |
1,050 |
|
|
> 100% |
|
|
Acquisition and integration related expenses |
|
$ |
611 |
|
|
$ |
3,163 |
|
|
(81%) |
|
|
$ |
2,077 |
|
|
$ |
3,163 |
|
|
(34%) |
|
|
Earnings from operations |
|
$ |
74,188 |
|
|
$ |
72,117 |
|
|
3% |
|
|
$ |
127,051 |
|
|
$ |
129,156 |
|
|
(2%) |
|
|
Net earnings |
|
$ |
46,385 |
|
|
$ |
49,998 |
|
|
(7%) |
|
|
$ |
80,346 |
|
|
$ |
89,325 |
|
|
(10%) |
|
|
Diluted earnings per share |
|
$ |
1.32 |
|
|
$ |
1.38 |
|
|
(5%) |
|
|
$ |
2.27 |
|
|
$ |
2.47 |
|
|
(8%) |
|
|
|
|
|
|
|
|
|
|
|
|
|
|
|
|
|
|
|
|
|
|
|
|
|
|
|
|
North America |
|
|
|
|
|
|
|
|
|
|
|
|
|
|
|
|
|
|
|
|
|
|
|
|
|
Net sales: |
|
|
|
|
|
|
|
|
|
|
|
|
|
|
|
|
|
|
|
|
|
|
|
|
|
Products |
|
$ |
1,310,172 |
|
|
$ |
1,225,666 |
|
|
7% |
|
|
$ |
2,743,821 |
|
|
$ |
2,296,082 |
|
|
20% |
|
|
Services |
|
$ |
228,975 |
|
|
$ |
179,841 |
|
|
27% |
|
|
$ |
469,707 |
|
|
$ |
351,866 |
|
|
33% |
|
|
Total net sales |
|
$ |
1,539,147 |
|
|
$ |
1,405,507 |
|
|
10% |
|
|
$ |
3,213,528 |
|
|
$ |
2,647,948 |
|
|
21% |
|
|
Gross profit |
|
$ |
244,896 |
|
|
$ |
199,059 |
|
|
23% |
|
|
$ |
501,824 |
|
|
$ |
381,666 |
|
|
31% |
|
|
Gross margin |
|
|
15.9 |
% |
|
|
14.2 |
% |
|
170 bps |
|
|
|
15.6 |
% |
|
|
14.4 |
% |
|
120 bps |
|
|
Selling and administrative expenses |
|
$ |
187,313 |
|
|
$ |
144,498 |
|
|
30% |
|
|
$ |
398,516 |
|
|
$ |
281,448 |
|
|
42% |
|
|
Severance and restructuring expenses |
|
$ |
4,904 |
|
|
$ |
480 |
|
|
> 100% |
|
|
$ |
7,026 |
|
|
$ |
811 |
|
|
> 100% |
|
|
Acquisition and integration related expenses |
|
$ |
611 |
|
|
$ |
3,163 |
|
|
(81%) |
|
|
$ |
1,873 |
|
|
$ |
3,163 |
|
|
(41%) |
|
|
Earnings from operations |
|
$ |
52,068 |
|
|
$ |
50,918 |
|
|
2% |
|
|
$ |
94,409 |
|
|
$ |
96,244 |
|
|
(2%) |
|
|
|
|
|
|
|
|
|
|
|
|
|
|
|
|
|
|
|
|
|
|
|
|
|
|
|
|
Sales Mix |
|
|
|
|
|
|
|
|
|
** |
|
|
|
|
|
|
|
|
|
|
** |
|
|
Hardware |
|
|
66 |
% |
|
|
67 |
% |
|
9% |
|
|
|
67 |
% |
|
|
64 |
% |
|
28% |
|
|
Software |
|
|
19 |
% |
|
|
20 |
% |
|
(1%) |
|
|
|
18 |
% |
|
|
23 |
% |
|
(3%) |
|
|
Services |
|
|
15 |
% |
|
|
13 |
% |
|
27% |
|
|
|
15 |
% |
|
|
13 |
% |
|
33% |
|
|
|
|
|
100 |
% |
|
|
100 |
% |
|
10% |
|
|
|
100 |
% |
|
|
100 |
% |
|
21% |
|
|
|
|
|
|
|
|
|
|
|
|
|
|
|
|
|
|
|
|
|
|
|
|
|
|
|
|
EMEA |
|
|
|
|
|
|
|
|
|
|
|
|
|
|
|
|
|
|
|
|
|
|
|
|
|
Net sales: |
|
|
|
|
|
|
|
|
|
|
|
|
|
|
|
|
|
|
|
|
|
|
|
|
|
Products |
|
$ |
340,036 |
|
|
$ |
333,037 |
|
|
2% |
|
|
$ |
716,087 |
|
|
$ |
687,710 |
|
|
4% |
|
|
Services |
|
$ |
51,981 |
|
|
$ |
46,137 |
|
|
13% |
|
|
$ |
94,816 |
|
|
$ |
81,639 |
|
|
16% |
|
|
Total net sales |
|
$ |
392,017 |
|
|
$ |
379,174 |
|
|
3% |
|
|
$ |
810,903 |
|
|
$ |
769,349 |
|
|
5% |
|
|
Gross profit |
|
$ |
68,180 |
|
|
$ |
64,450 |
|
|
6% |
|
|
$ |
126,954 |
|
|
$ |
121,433 |
|
|
5% |
|
|
Gross margin |
|
|
17.4 |
% |
|
|
17.0 |
% |
|
40 bps |
|
|
|
15.7 |
% |
|
|
15.8 |
% |
|
(10 bps) |
|
|
Selling and administrative expenses |
|
$ |
48,177 |
|
|
$ |
47,652 |
|
|
1% |
|
|
$ |
98,421 |
|
|
$ |
94,797 |
|
|
4% |
|
|
Severance and restructuring expenses |
|
$ |
2,093 |
|
|
$ |
200 |
|
|
> 100% |
|
|
$ |
2,099 |
|
|
$ |
115 |
|
|
> 100% |
|
|
Acquisition and integration related expenses |
|
$ |
— |
|
|
$ |
— |
|
|
|
— |
|
|
$ |
204 |
|
|
$ |
— |
|
|
* |
|
|
Earnings from operations |
|
$ |
17,910 |
|
|
$ |
16,598 |
|
|
8% |
|
|
$ |
26,230 |
|
|
$ |
26,521 |
|
|
(1%) |
|
|
|
|
|
|
|
|
|
|
|
|
|
|
|
|
|
|
|
|
|
|
|
|
|
|
|
|
Sales Mix |
|
|
|
|
|
|
|
|
|
** |
|
|
|
|
|
|
|
|
|
|
** |
|
|
Hardware |
|
|
39 |
% |
|
|
38 |
% |
|
7% |
|
|
|
40 |
% |
|
|
41 |
% |
|
4% |
|
|
Software |
|
|
48 |
% |
|
|
50 |
% |
|
(2%) |
|
|
|
48 |
% |
|
|
48 |
% |
|
4% |
|
|
Services |
|
|
13 |
% |
|
|
12 |
% |
|
13% |
|
|
|
12 |
% |
|
|
11 |
% |
|
16% |
|
|
|
|
|
100 |
% |
|
|
100 |
% |
|
3% |
|
|
|
100 |
% |
|
|
100 |
% |
|
5% |
|
|
|
|
|
|
|
|
|
|
|
|
|
|
|
|
|
|
|
|
|
|
|
|
|
|
|
|
* |
Percentage change not considered meaningful. |
|
** |
Change in sales mix represents growth/decline in category net sales on a U.S. dollar basis and does not exclude the effects of fluctuating foreign currency exchange rates. |
- MORE -
|
Insight Enterprises, Inc. |
|
6820 South Harl Avenue |
|
Tempe, Arizona 85283 |
|
800.467.4448 |
|
FAX 480.760.8958 |
|
Insight Q2 2020 Results, Page 5 |
|
August 6, 2020 |
Financial Summary Table (continued)
(dollars in thousands, except per share data)
(Unaudited)
|
|
|
Three Months Ended June 30, |
|
|
Six Months Ended June 30, |
|
|
|
|
2020 |
|
|
2019 |
|
|
change |
|
|
2020 |
|
|
2019 |
|
|
change |
|
|
APAC |
|
|
|
|
|
|
|
|
|
|
|
|
|
|
|
|
|
|
|
|
|
|
|
|
|
Net sales: |
|
|
|
|
|
|
|
|
|
|
|
|
|
|
|
|
|
|
|
|
|
|
|
|
|
Products |
|
$ |
22,725 |
|
|
$ |
35,632 |
|
|
(36%) |
|
|
$ |
61,341 |
|
|
$ |
77,215 |
|
|
(21%) |
|
|
Services |
|
$ |
14,846 |
|
|
$ |
15,708 |
|
|
(5%) |
|
|
$ |
27,014 |
|
|
$ |
26,975 |
|
|
|
— |
|
|
Total net sales |
|
$ |
37,571 |
|
|
$ |
51,340 |
|
|
(27%) |
|
|
$ |
88,355 |
|
|
$ |
104,190 |
|
|
(15%) |
|
|
Gross profit |
|
$ |
11,313 |
|
|
$ |
11,940 |
|
|
(5%) |
|
|
$ |
20,947 |
|
|
$ |
20,822 |
|
|
1% |
|
|
Gross margin |
|
|
30.1 |
% |
|
|
23.3 |
% |
|
680 bps |
|
|
|
23.7 |
% |
|
|
20.0 |
% |
|
370 bps |
|
|
Selling and administrative expenses |
|
$ |
7,090 |
|
|
$ |
7,339 |
|
|
(3%) |
|
|
$ |
14,506 |
|
|
$ |
14,307 |
|
|
1% |
|
|
Severance and restructuring expenses |
|
$ |
13 |
|
|
$ |
— |
|
|
* |
|
|
$ |
29 |
|
|
$ |
124 |
|
|
(77%) |
|
|
Earnings from operations |
|
$ |
4,210 |
|
|
$ |
4,601 |
|
|
(8%) |
|
|
$ |
6,412 |
|
|
$ |
6,391 |
|
|
|
— |
|
|
|
|
|
|
|
|
|
|
|
|
|
|
|
|
|
|
|
|
|
|
|
|
|
|
|
|
Sales Mix |
|
|
|
|
|
|
|
|
|
** |
|
|
|
|
|
|
|
|
|
|
** |
|
|
Hardware |
|
|
18 |
% |
|
|
19 |
% |
|
(32%) |
|
|
|
16 |
% |
|
|
16 |
% |
|
(12%) |
|
|
Software |
|
|
42 |
% |
|
|
50 |
% |
|
(38%) |
|
|
|
53 |
% |
|
|
58 |
% |
|
(23%) |
|
|
Services |
|
|
40 |
% |
|
|
31 |
% |
|
(5%) |
|
|
|
31 |
% |
|
|
26 |
% |
|
|
— |
|
|
|
|
|
100 |
% |
|
|
100 |
% |
|
(27%) |
|
|
|
100 |
% |
|
|
100 |
% |
|
(15%) |
|
|
* |
Percentage change not considered meaningful. |
|
** |
Change in sales mix represents growth/decline in category net sales on a U.S. dollar basis and does not exclude the effects of fluctuating foreign currency exchange rates. |
- MORE -
|
Insight Enterprises, Inc. |
|
6820 South Harl Avenue |
|
Tempe, Arizona 85283 |
|
800.467.4448 |
|
FAX 480.760.8958 |
|
Insight Q2 2020 Results, Page 6 |
|
August 6, 2020 |
Forward-Looking Information
Certain statements in this release and the related conference call and web cast are “forward-looking statements” within the meaning of the Private Securities Litigation Reform Act of 1995. Forward-looking statements, including those related to our future responses to and the potential impact of coronavirus strain COVID-19 (“COVID-19”) on our Company, the Company’s future financial performance and results of operations, the Company’s anticipated effective tax rate, capital expenditures, expected average share count, the Company’s expectations regarding cash flow, the Company’s expectations about future benefits relating to the PCM integration, including expected synergies, future trends in the IT market, including due to COVID-19, our business strategy and our strategic initiatives, and the completion of the sale of certain real estate, are inherently subject to risks and uncertainties, some of which cannot be predicted or quantified. Future events and actual results could differ materially from those set forth in, contemplated by, or underlying the forward-looking statements. There can be no assurances that the results discussed by the forward-looking statements will be achieved, and actual results may differ materially from those set forth in the forward-looking statements. Some of the important factors that could cause the Company’s actual results to differ materially from those projected in any forward-looking statements, include, but are not limited to, the following, which are discussed in “Risk Factors” in Part I, Item 1A of the Company’s Annual Report on Form 10-K for the year ended December 31, 2019, and in “Risk Factors” in Part II, Item 1A of the Company’s Quarterly Report on form 10-Q for the quarter ended June 30, 2020:
|
|
• |
the duration and severity of the COVID-19 pandemic and its effects on our business, results of operations and financial condition, as well as the widespread outbreak of any other illnesses or communicable diseases; |
|
|
• |
actions of our competitors, including manufacturers and publishers of products we sell; |
|
|
• |
our reliance on our partners for product availability, competitive products to sell and marketing funds and purchasing incentives, which can change significantly in the amounts made available and in the requirements year over year; |
|
|
• |
changes in the IT industry and/or rapid changes in technology; |
|
|
• |
risks associated with the integration and operation of acquired businesses, including PCM and the achievement of expected synergies and benefits; |
|
|
• |
possible significant fluctuations in our future operating results as well as seasonality and variability in customer demands; |
|
|
• |
the risks associated with our international operations; |
|
|
• |
general economic conditions, economic uncertainties and changes in geopolitical conditions; |
|
|
• |
increased debt and interest expense and decreased availability of funds under our financing facilities; |
|
|
• |
cyberattacks or breaches of data privacy and security regulations; |
|
|
• |
disruptions in our IT systems and voice and data networks; |
|
|
• |
failure to comply with the terms and conditions of our commercial and public sector contracts; |
|
|
• |
legal proceedings, including PCM related litigation, client audits and failure to comply with laws and regulations; |
|
|
• |
accounts receivable risks, including increased credit loss experience or extended payment terms with our clients; |
|
|
• |
our reliance on independent shipping companies; |
|
|
• |
our dependence on certain key personnel; |
|
|
• |
natural disasters or other adverse occurrences; |
|
|
• |
exposure to changes in, interpretations of, or enforcement trends related to tax rules and regulations; |
|
|
• |
intellectual property infringement claims and challenges to our registered trademarks and trade names; |
|
|
• |
our substantial indebtedness; |
|
|
• |
the conditional conversion feature of the convertible notes, which if triggered, may adversely affect the Company’s financial condition and operating results; |
|
|
• |
the accounting method for convertible debt securities that may be settled in cash, such as the convertible notes, could have a material effect on the Company’s reported financial results; |
|
|
• |
future sales of the Company’s common stock or equity-linked securities in the public market could lower the market price for our common stock; |
|
|
• |
the Company is subject to counterparty risk with respect to the convertible note hedge transactions; and |
|
|
• |
risks associated with the discontinuation of LIBOR as a benchmark rate. |
Additionally, there may be other risks that are otherwise described from time to time in the reports that the Company files with the Securities and Exchange Commission. Any forward-looking statements in this release, the related conference call and webcast speak only as of the date on which they are made and should be
- MORE -
|
Insight Enterprises, Inc. |
|
6820 South Harl Avenue |
|
Tempe, Arizona 85283 |
|
800.467.4448 |
|
FAX 480.760.8958 |
|
Insight Q2 2020 Results, Page 7 |
|
August 6, 2020 |
considered in light of various important factors, including the risks and uncertainties listed above, as well as others. The Company assumes no obligation to update, and, except as may be required by law, does not intend to update, any forward-looking statements. The Company does not endorse any projections regarding future performance that may be made by third parties.
- MORE -
|
Insight Enterprises, Inc. |
|
6820 South Harl Avenue |
|
Tempe, Arizona 85283 |
|
800.467.4448 |
|
FAX 480.760.8958 |
|
Insight Q2 2020 Results, Page 8 |
|
August 6, 2020 |
INSIGHT ENTERPRISES, INC. AND SUBSIDIARIES
Consolidated Statements of Operations
(In thousands, except per share data)
(Unaudited)
|
|
|
Three Months Ended
June 30, |
|
|
Six Months Ended
June 30, |
|
|
|
|
2020 |
|
|
2019 |
|
|
2020 |
|
|
2019 |
|
|
Net sales: |
|
|
|
|
|
|
|
|
|
|
|
|
|
|
|
|
|
Products |
|
$ |
1,672,933 |
|
|
$ |
1,594,335 |
|
|
$ |
3,521,249 |
|
|
$ |
3,061,007 |
|
|
Services |
|
|
295,802 |
|
|
|
241,686 |
|
|
|
591,537 |
|
|
|
460,480 |
|
|
Total net sales |
|
|
1,968,735 |
|
|
|
1,836,021 |
|
|
|
4,112,786 |
|
|
|
3,521,487 |
|
|
Costs of goods sold: |
|
|
|
|
|
|
|
|
|
|
|
|
|
|
|
|
|
Products |
|
|
1,517,947 |
|
|
|
1,458,916 |
|
|
|
3,188,185 |
|
|
|
2,796,224 |
|
|
Services |
|
|
126,399 |
|
|
|
101,656 |
|
|
|
274,876 |
|
|
|
201,342 |
|
|
Total costs of goods sold |
|
|
1,644,346 |
|
|
|
1,560,572 |
|
|
|
3,463,061 |
|
|
|
2,997,566 |
|
|
Gross profit |
|
|
324,389 |
|
|
|
275,449 |
|
|
|
649,725 |
|
|
|
523,921 |
|
|
Operating expenses: |
|
|
|
|
|
|
|
|
|
|
|
|
|
|
|
|
|
Selling and administrative expenses |
|
|
242,580 |
|
|
|
199,489 |
|
|
|
511,443 |
|
|
|
390,552 |
|
|
Severance and restructuring expenses, net |
|
|
7,010 |
|
|
|
680 |
|
|
|
9,154 |
|
|
|
1,050 |
|
|
Acquisition and integration related expenses |
|
|
611 |
|
|
|
3,163 |
|
|
|
2,077 |
|
|
|
3,163 |
|
|
Earnings from operations |
|
|
74,188 |
|
|
|
72,117 |
|
|
|
127,051 |
|
|
|
129,156 |
|
|
Non-operating (income) expense: |
|
|
|
|
|
|
|
|
|
|
|
|
|
|
|
|
|
Interest expense, net |
|
|
10,219 |
|
|
|
4,335 |
|
|
|
22,045 |
|
|
|
8,887 |
|
|
Other (income) expense, net |
|
|
1,098 |
|
|
|
346 |
|
|
|
(465 |
) |
|
|
1,396 |
|
|
Earnings before income taxes |
|
|
62,871 |
|
|
|
67,436 |
|
|
|
105,471 |
|
|
|
118,873 |
|
|
Income tax expense |
|
|
16,486 |
|
|
|
17,438 |
|
|
|
25,125 |
|
|
|
29,548 |
|
|
Net earnings |
|
$ |
46,385 |
|
|
$ |
49,998 |
|
|
$ |
80,346 |
|
|
$ |
89,325 |
|
|
|
|
|
|
|
|
|
|
|
|
|
|
|
|
|
|
|
|
Net earnings per share: |
|
|
|
|
|
|
|
|
|
|
|
|
|
|
|
|
|
Basic |
|
$ |
1.32 |
|
|
$ |
1.40 |
|
|
$ |
2.29 |
|
|
$ |
2.50 |
|
|
Diluted |
|
$ |
1.32 |
|
|
$ |
1.38 |
|
|
$ |
2.27 |
|
|
$ |
2.47 |
|
|
|
|
|
|
|
|
|
|
|
|
|
|
|
|
|
|
|
|
Shares used in per share calculations: |
|
|
|
|
|
|
|
|
|
|
|
|
|
|
|
|
|
Basic |
|
|
35,060 |
|
|
|
35,772 |
|
|
|
35,147 |
|
|
|
35,691 |
|
|
Diluted |
|
|
35,260 |
|
|
|
36,111 |
|
|
|
35,453 |
|
|
|
36,107 |
|
- MORE -
|
Insight Enterprises, Inc. |
|
6820 South Harl Avenue |
|
Tempe, Arizona 85283 |
|
800.467.4448 |
|
FAX 480.760.8958 |
|
Insight Q2 2020 Results, Page 9 |
|
August 6, 2020 |
INSIGHT ENTERPRISES, INC. AND SUBSIDIARIES
Consolidated Balance Sheets
(In thousands)
(Unaudited)
|
|
|
June 30,
2020 |
|
|
December 31,
2019 |
|
|
ASSETS |
|
|
|
|
|
|
|
|
|
Current assets: |
|
|
|
|
|
|
|
|
|
Cash and cash equivalents |
|
$ |
153,866 |
|
|
$ |
114,668 |
|
|
Accounts receivable, net |
|
|
2,677,564 |
|
|
|
2,511,383 |
|
|
Inventories |
|
|
212,980 |
|
|
|
190,833 |
|
|
Other current assets |
|
|
220,080 |
|
|
|
231,148 |
|
|
Total current assets |
|
|
3,264,490 |
|
|
|
3,048,032 |
|
|
|
|
|
|
|
|
|
|
|
|
Property and equipment, net |
|
|
127,490 |
|
|
|
130,907 |
|
|
Goodwill |
|
|
415,897 |
|
|
|
415,149 |
|
|
Intangible assets, net |
|
|
261,254 |
|
|
|
278,584 |
|
|
Other assets |
|
|
272,347 |
|
|
|
305,507 |
|
|
|
|
$ |
4,341,478 |
|
|
$ |
4,178,179 |
|
|
|
|
|
|
|
|
|
|
|
|
LIABILITIES AND STOCKHOLDERS’ EQUITY |
|
|
|
|
|
|
|
|
|
Current liabilities: |
|
|
|
|
|
|
|
|
|
Accounts payable – trade |
|
$ |
1,796,918 |
|
|
$ |
1,275,957 |
|
|
Accounts payable – inventory financing facilities |
|
|
261,133 |
|
|
|
253,676 |
|
|
Accrued expenses and other current liabilities |
|
|
371,401 |
|
|
|
352,204 |
|
|
Current portion of long-term debt |
|
|
1,509 |
|
|
|
1,691 |
|
|
Total current liabilities |
|
|
2,430,961 |
|
|
|
1,883,528 |
|
|
|
|
|
|
|
|
|
|
|
|
Long-term debt |
|
|
435,955 |
|
|
|
857,673 |
|
|
Deferred income taxes |
|
|
43,880 |
|
|
|
44,633 |
|
|
Other liabilities |
|
|
223,326 |
|
|
|
232,027 |
|
|
|
|
|
3,134,122 |
|
|
|
3,017,861 |
|
|
Stockholders’ equity: |
|
|
|
|
|
|
|
|
|
Preferred stock |
|
|
— |
|
|
|
— |
|
|
Common stock |
|
|
351 |
|
|
|
353 |
|
|
Additional paid-in capital |
|
|
354,431 |
|
|
|
357,032 |
|
|
Retained earnings |
|
|
900,950 |
|
|
|
841,097 |
|
|
Accumulated other comprehensive loss – foreign currency
translation adjustments |
|
|
(48,376 |
) |
|
|
(38,164 |
) |
|
Total stockholders’ equity |
|
|
1,207,356 |
|
|
|
1,160,318 |
|
|
|
|
$ |
4,341,478 |
|
|
$ |
4,178,179 |
|
- MORE -
|
Insight Enterprises, Inc. |
|
6820 South Harl Avenue |
|
Tempe, Arizona 85283 |
|
800.467.4448 |
|
FAX 480.760.8958 |
|
Insight Q2 2020 Results, Page 10 |
|
August 6, 2020 |
INSIGHT ENTERPRISES, INC. AND SUBSIDIARIES
Consolidated Statements of Cash Flows
(In thousands)
(Unaudited)
|
|
|
Six Months Ended
June 30, |
|
|
|
|
2020 |
|
|
2019 |
|
|
Cash flows from operating activities: |
|
|
|
|
|
|
|
|
|
Net earnings |
|
$ |
80,346 |
|
|
$ |
89,325 |
|
|
Adjustments to reconcile net earnings to net cash provided by
operating activities: |
|
|
|
|
|
|
|
|
|
Depreciation and amortization |
|
|
34,623 |
|
|
|
17,626 |
|
|
Provision for losses on accounts receivable |
|
|
6,570 |
|
|
|
2,346 |
|
|
Non-cash stock-based compensation |
|
|
7,241 |
|
|
|
7,797 |
|
|
Deferred income taxes |
|
|
(1,464 |
) |
|
|
1,180 |
|
|
Amortization of debt discount and issuance costs |
|
|
8,002 |
|
|
|
— |
|
|
Other adjustments |
|
|
2,829 |
|
|
|
2,350 |
|
|
Changes in assets and liabilities: |
|
|
|
|
|
|
|
|
|
Increase in accounts receivable |
|
|
(182,511 |
) |
|
|
(354,717 |
) |
|
Increase in inventories |
|
|
(26,647 |
) |
|
|
(33,359 |
) |
|
Decrease (increase) in other assets |
|
|
46,088 |
|
|
|
(93,714 |
) |
|
Increase in accounts payable |
|
|
529,742 |
|
|
|
448,682 |
|
|
(Decrease) increase in accrued expenses and other liabilities |
|
|
(7,290 |
) |
|
|
95,022 |
|
|
Net cash provided by operating activities |
|
|
497,529 |
|
|
|
182,538 |
|
|
Cash flows from investing activities: |
|
|
|
|
|
|
|
|
|
Proceeds from sale of assets held for sale |
|
|
14,218 |
|
|
|
— |
|
|
Purchases of property and equipment |
|
|
(14,494 |
) |
|
|
(10,584 |
) |
|
Acquisitions, net of cash and cash equivalents acquired |
|
|
(6,406 |
) |
|
|
(3,362 |
) |
|
Net cash used in investing activities |
|
|
(6,682 |
) |
|
|
(13,946 |
) |
|
Cash flows from financing activities: |
|
|
|
|
|
|
|
|
|
Borrowings on senior revolving credit facility |
|
|
— |
|
|
|
89,936 |
|
|
Repayments on senior revolving credit facility |
|
|
— |
|
|
|
(89,936 |
) |
|
Borrowings on ABL revolving credit facility |
|
|
1,381,179 |
|
|
|
— |
|
|
Repayments on ABL revolving credit facility |
|
|
(1,807,421 |
) |
|
|
— |
|
|
Borrowings on accounts receivable securitization financing facility |
|
|
— |
|
|
|
1,919,500 |
|
|
Repayments on accounts receivable securitization financing facility |
|
|
— |
|
|
|
(2,068,500 |
) |
|
Net borrowings (repayments) under inventory financing facilities |
|
|
7,457 |
|
|
|
(43,240 |
) |
|
Repurchases of treasury stock |
|
|
(25,000 |
) |
|
|
— |
|
|
Other payments |
|
|
(6,791 |
) |
|
|
(6,757 |
) |
|
Net cash used in financing activities |
|
|
(450,576 |
) |
|
|
(198,997 |
) |
|
Foreign currency exchange effect on cash, cash equivalents and
restricted cash balances |
|
|
(814 |
) |
|
|
(183 |
) |
|
Increase (decrease) in cash, cash equivalents and restricted cash |
|
|
39,457 |
|
|
|
(30,588 |
) |
|
Cash, cash equivalents and restricted cash at beginning of period |
|
|
116,297 |
|
|
|
144,293 |
|
|
Cash, cash equivalents and restricted cash at end of period |
|
$ |
155,754 |
|
|
$ |
113,705 |
|
- MORE -
|
Insight Enterprises, Inc. |
|
6820 South Harl Avenue |
|
Tempe, Arizona 85283 |
|
800.467.4448 |
|
FAX 480.760.8958 |
|
Insight Q2 2020 Results, Page 11 |
|
August 6, 2020 |
INSIGHT ENTERPRISES, INC. AND SUBSIDIARIES
Reconciliation of GAAP to non-GAAP Financial Measures
(In thousands, except per share data)
(unaudited)
|
|
|
Three Months Ended
June 30, |
|
|
Six Months Ended
June 30, |
|
|
|
|
2020 |
|
|
2019 |
|
|
2020 |
|
|
2019 |
|
|
Adjusted Consolidated Earnings from
Operations: |
|
|
|
|
|
|
|
|
|
|
|
|
|
|
|
|
|
GAAP consolidated EFO |
|
$ |
74,188 |
|
|
$ |
72,117 |
|
|
$ |
127,051 |
|
|
$ |
129,156 |
|
|
Severance and restructuring expenses |
|
|
7,010 |
|
|
|
680 |
|
|
|
9,154 |
|
|
|
1,050 |
|
|
Acquisition and integration related expenses |
|
|
611 |
|
|
|
3,163 |
|
|
|
2,077 |
|
|
|
3,163 |
|
|
Amortization of intangible assets |
|
|
10,014 |
|
|
|
3,821 |
|
|
|
20,122 |
|
|
|
7,644 |
|
|
Adjusted non-GAAP consolidated EFO |
|
$ |
91,823 |
|
|
$ |
79,781 |
|
|
$ |
158,404 |
|
|
$ |
141,013 |
|
|
|
|
|
|
|
|
|
|
|
|
|
|
|
|
|
|
|
|
Adjusted Consolidated Net Earnings: |
|
|
|
|
|
|
|
|
|
|
|
|
|
|
|
|
|
GAAP consolidated net earnings |
|
$ |
46,385 |
|
|
$ |
49,998 |
|
|
$ |
80,346 |
|
|
$ |
89,325 |
|
|
Severance and restructuring expenses |
|
|
7,010 |
|
|
|
680 |
|
|
|
9,154 |
|
|
|
1,050 |
|
|
Acquisition and integration related expenses |
|
|
611 |
|
|
|
3,163 |
|
|
|
2,077 |
|
|
|
3,163 |
|
|
Amortization of intangible assets |
|
|
10,014 |
|
|
|
3,821 |
|
|
|
20,122 |
|
|
|
7,644 |
|
|
Amortization of debt discount and issuance costs |
|
|
2,886 |
|
|
|
— |
|
|
|
5,717 |
|
|
|
— |
|
|
Income taxes on non-GAAP adjustments |
|
|
(5,067 |
) |
|
|
(1,098 |
) |
|
|
(9,227 |
) |
|
|
(2,146 |
) |
|
Adjusted non-GAAP consolidated net earnings |
|
$ |
61,839 |
|
|
$ |
56,564 |
|
|
$ |
108,189 |
|
|
$ |
99,036 |
|
|
|
|
|
|
|
|
|
|
|
|
|
|
|
|
|
|
|
|
Adjusted Diluted Earnings Per Share: |
|
|
|
|
|
|
|
|
|
|
|
|
|
|
|
|
|
GAAP diluted EPS |
|
$ |
1.32 |
|
|
$ |
1.38 |
|
|
$ |
2.27 |
|
|
$ |
2.47 |
|
|
Severance and restructuring expenses |
|
|
0.20 |
|
|
|
0.02 |
|
|
|
0.26 |
|
|
|
0.03 |
|
|
Acquisition and integration related expenses |
|
|
0.02 |
|
|
|
0.09 |
|
|
|
0.06 |
|
|
|
0.09 |
|
|
Amortization of intangible assets |
|
|
0.28 |
|
|
|
0.11 |
|
|
|
0.56 |
|
|
|
0.21 |
|
|
Amortization of debt discount and issuance costs |
|
|
0.08 |
|
|
|
— |
|
|
|
0.16 |
|
|
|
— |
|
|
Income taxes on non-GAAP adjustments |
|
|
(0.15 |
) |
|
|
(0.03 |
) |
|
|
(0.26 |
) |
|
|
(0.06 |
) |
|
Adjusted non-GAAP diluted EPS |
|
$ |
1.75 |
|
|
$ |
1.57 |
|
|
$ |
3.05 |
|
|
$ |
2.74 |
|
|
|
|
|
|
|
|
|
|
|
|
|
|
|
|
|
|
|
|
Adjusted North America Earnings from
Operations: |
|
|
|
|
|
|
|
|
|
|
|
|
|
|
|
|
|
GAAP EFO from North America segment |
|
$ |
52,068 |
|
|
$ |
50,918 |
|
|
$ |
94,409 |
|
|
$ |
96,244 |
|
|
Severance and restructuring expenses |
|
|
4,904 |
|
|
|
480 |
|
|
|
7,026 |
|
|
|
811 |
|
|
Acquisition and integration related expenses |
|
|
611 |
|
|
|
3,163 |
|
|
|
1,873 |
|
|
|
3,163 |
|
|
Amortization of intangible assets |
|
|
9,371 |
|
|
|
3,636 |
|
|
|
18,864 |
|
|
|
7,272 |
|
|
Adjusted non-GAAP EFO from North America
segment |
|
$ |
66,954 |
|
|
$ |
58,197 |
|
|
$ |
122,172 |
|
|
$ |
107,490 |
|
|
|
|
|
|
|
|
|
|
|
|
|
|
|
|
|
|
|
|
Adjusted EMEA Earnings from Operations: |
|
|
|
|
|
|
|
|
|
|
|
|
|
|
|
|
|
GAAP EFO from EMEA segment |
|
$ |
17,910 |
|
|
$ |
16,598 |
|
|
$ |
26,230 |
|
|
$ |
26,521 |
|
|
Severance and restructuring expenses |
|
|
2,093 |
|
|
|
200 |
|
|
|
2,099 |
|
|
|
115 |
|
|
Acquisition and integration related expenses |
|
|
- |
|
|
|
- |
|
|
|
204 |
|
|
|
- |
|
|
Amortization of intangible assets |
|
|
534 |
|
|
|
69 |
|
|
|
1,040 |
|
|
|
138 |
|
|
Adjusted non-GAAP EFO from EMEA segment |
|
$ |
20,537 |
|
|
$ |
16,867 |
|
|
$ |
29,573 |
|
|
$ |
26,774 |
|
- MORE -
|
Insight Enterprises, Inc. |
|
6820 South Harl Avenue |
|
Tempe, Arizona 85283 |
|
800.467.4448 |
|
FAX 480.760.8958 |
|
Insight Q2 2020 Results, Page 12 |
|
August 6, 2020 |
INSIGHT ENTERPRISES, INC. AND SUBSIDIARIES
Reconciliation of GAAP to NON-GAAP Financial Measures (Continued)
(In thousands, except per share data)
(unaudited)
|
|
|
Three Months Ended
June 30, |
|
|
Six Months Ended
June 30, |
|
|
|
|
2020 |
|
|
2019 |
|
|
2020 |
|
|
2019 |
|
|
Adjusted APAC Earnings from Operations: |
|
|
|
|
|
|
|
|
|
|
|
|
|
|
|
|
|
GAAP EFO from APAC segment |
|
$ |
4,210 |
|
|
$ |
4,601 |
|
|
$ |
6,412 |
|
|
$ |
6,391 |
|
|
Severance and restructuring expenses |
|
|
13 |
|
|
|
— |
|
|
|
29 |
|
|
|
124 |
|
|
Amortization of intangible assets |
|
|
109 |
|
|
|
116 |
|
|
|
218 |
|
|
|
234 |
|
|
Adjusted non-GAAP EFO from APAC segment |
|
$ |
4,332 |
|
|
$ |
4,717 |
|
|
$ |
6,659 |
|
|
$ |
6,749 |
|
|
|
|
Six Months Ended
June 30, |
|
|
|
|
2020 |
|
|
2019 |
|
|
Adjusted free cash flow: |
|
|
|
|
|
|
|
|
|
Net cash provided by operating activities |
|
$ |
497,529 |
|
|
$ |
182,538 |
|
|
Purchases of property and equipment |
|
|
(14,494 |
) |
|
|
(10,584 |
) |
|
Net repayments under inventory financing facilities |
|
|
7,457 |
|
|
|
(43,240 |
) |
|
Adjusted non-GAAP free cash flow |
|
$ |
490,492 |
|
|
$ |
128,714 |
|
|
|
|
Twelve Months Ended
June 30, |
|
|
|
|
2020 |
|
|
2019 |
|
|
Adjusted return on invested capital: |
|
|
|
|
|
|
|
|
|
GAAP consolidated EFO |
|
$ |
238,489 |
|
|
$ |
237,762 |
|
|
Severance and restructuring expenses |
|
|
13,529 |
|
|
|
2,448 |
|
|
Acquisition and integration related expenses |
|
|
10,256 |
|
|
|
3,351 |
|
|
Impairment of construction in progress |
|
|
1,501 |
|
|
|
— |
|
|
Adjusted non-GAAP consolidated EFO * |
|
|
263,775 |
|
|
|
243,561 |
|
|
Income tax expense** |
|
|
68,582 |
|
|
|
66,979 |
|
|
Adjusted non-GAAP consolidated EFO, net of tax |
|
$ |
195,193 |
|
|
$ |
176,582 |
|
|
Average stockholders’ equity*** |
|
$ |
1,140,093 |
|
|
$ |
988,509 |
|
|
Average debt*** |
|
|
586,456 |
|
|
|
157,833 |
|
|
Average cash*** |
|
|
(116,764 |
) |
|
|
(147,748 |
) |
|
Invested Capital |
|
$ |
1,609,785 |
|
|
$ |
998,594 |
|
|
|
|
|
|
|
|
|
|
|
|
Adjusted non-GAAP ROIC (from GAAP consolidated EFO) **** |
|
|
10.96 |
% |
|
|
17.26 |
% |
|
Adjusted non-GAAP ROIC (from non-GAAP consolidated
EFO) ***** |
|
|
12.13 |
% |
|
|
17.68 |
% |
|
* |
The adjusted non-GAAP consolidated EFO amount used for the Adjusted non-GAAP ROIC calculation does not exclude amortization of intangible assets. This calculation remains consistent with the metric utilized in management’s compensation plan. |
|
** |
Assumed tax rate of 26.0% and 27.5% for 2020 and 2019, respectively. |
|
*** |
Average of previous five quarters. |
|
**** |
Computed as GAAP consolidated EFO, net of tax of $62,007 and $65,384 for the twelve months ended June 30, 2020 and 2019, respectively, divided by invested capital. |
|
***** |
Computed as Adjusted non-GAAP consolidated EFO, net of tax, divided by invested capital. |
- ### -
|
Insight Enterprises, Inc. |
|
6820 South Harl Avenue |
|
Tempe, Arizona 85283 |
|
800.467.4448 |
|
FAX 480.760.8958 |

Insight Enterprises, Inc. Second Quarter 2020 Earnings Conference Call and Webcast Exhibit 99.2
Agenda Opening Comments CEO Commentary Q2 2020 Priorities Second Quarter 2020 Financial Results PCM Integration Update Impact of COVID-19 on Client Engagement Current Demand Environment CFO Commentary Recent Cost Reductions Liquidity and Debt Covenants Financial Results by Region Taxes and Cash Flow Closing Comments
Disclosures Safe harbor statement This presentation includes “forward-looking statements” within the meaning of the Private Securities Litigation Reform Act of 1995 related to Insight’s plans and expectations. Statements that are not historical facts, including those related to Coronavirus strain (“COVID-19”), our future responses to and the impact of COVID-19 on our Company, our expectations about future benefits relating to the PCM integration, including future expected trends in the IT market and our opportunities for growth, are forward-looking statements. These forward-looking statements are subject to assumptions, risks and uncertainties which could cause actual results or future events to differ materially from such statements. The Company undertakes no obligation to update publicly or revise any of the forward-looking statements, except as otherwise required by law. More detailed information about risk factors is included in today’s press release and discussed in the Company’s most recently filed periodic reports and subsequent filings with the Securities and Exchange Commission. Non-GAAP measures This presentation will reference certain non-GAAP financial information as ‘Adjusted’. A reconciliation of non-GAAP financial measures presented in this document to our actual GAAP results is attached to the back of this presentation and included in the press release issued today, which you may find on the Investor Relations section of our website at investor.insight.com. Constant currency In some instances the Company refers to changes in net sales, gross profit and earnings from operations on a consolidated basis and in North America, EMEA and APAC excluding the effects of fluctuating foreign currency exchange rates. In computing these changes and percentages, the Company compares the current year amount as translated into U.S. dollars under the applicable accounting standards to the prior year amount in local currency translated into U.S. dollars utilizing the weighted average translation rate for the current period.
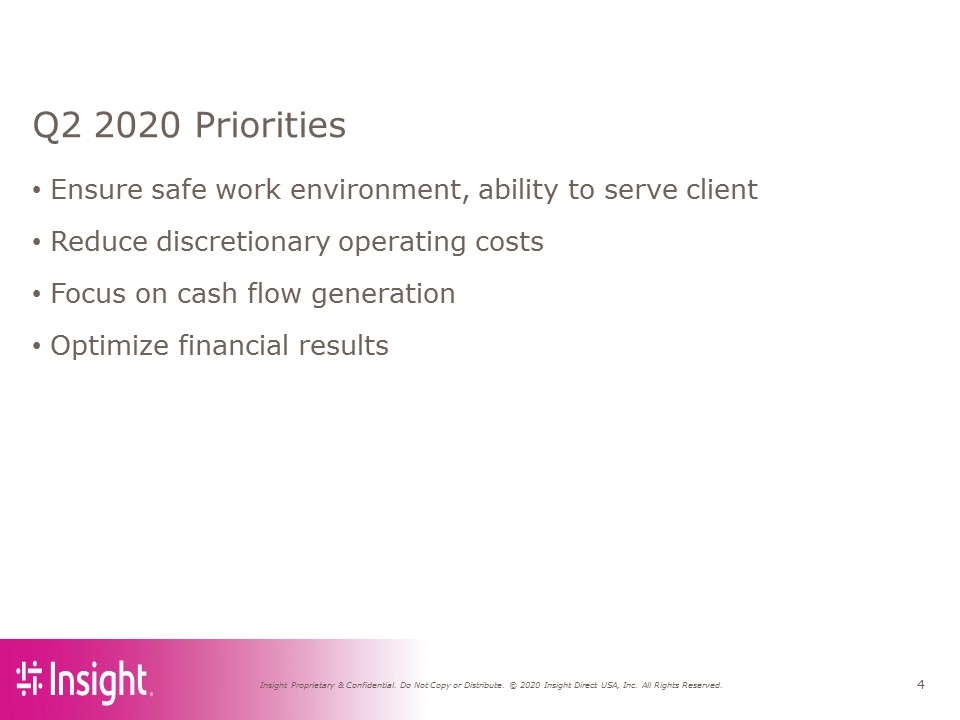
Q2 2020 Priorities Ensure safe work environment, ability to serve client Reduce discretionary operating costs Focus on cash flow generation Optimize financial results
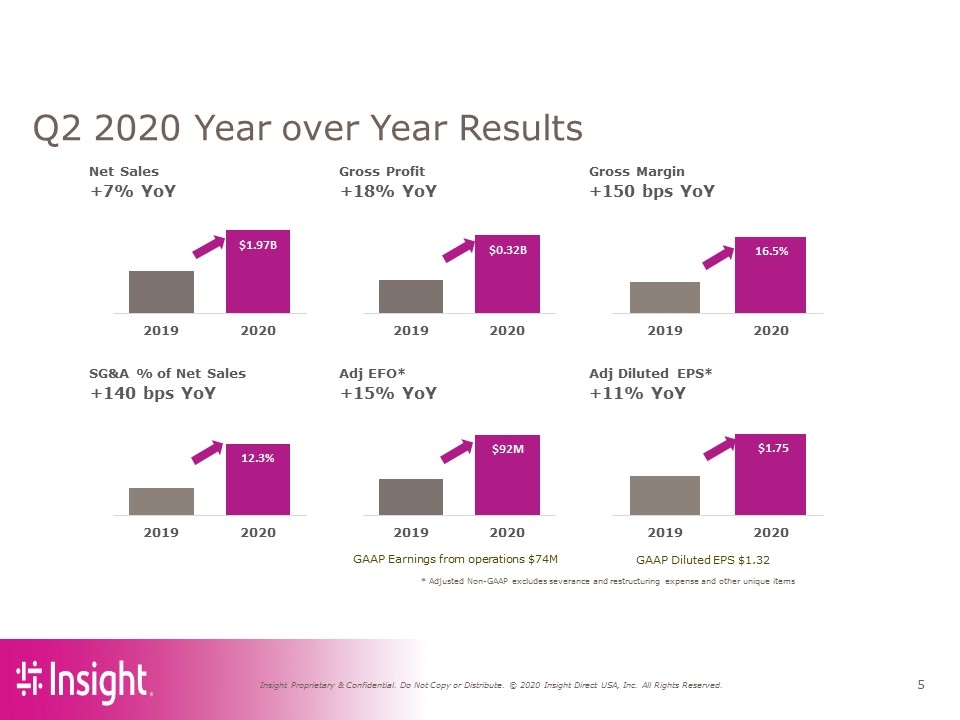
Q2 2020 Year over Year Results GAAP Earnings from operations $74M GAAP Diluted EPS $1.32 * Adjusted Non-GAAP excludes severance and restructuring expense and other unique items Net Sales Gross Profit Gross Margin +7% YoY +18% YoY +150 bps YoY SG&A % of Net Sales Adj EFO* Adj Diluted EPS* +140 bps YoY +15% YoY +11% YoY $1.97B 2019 2020 $0.32B 2019 2020 $92M 2019 2020 12.3% 2019 2020 16.5% 2019 2020 $1.75 2019 2020
PCM Integration Update Nearing completion of onboarding all PCM clients to SAP platform Well positioned to compete as single brand in marketplace Complete data migration by end of 2020 Expect ~$50-$55 million in annualized run-rate cost saving by year end
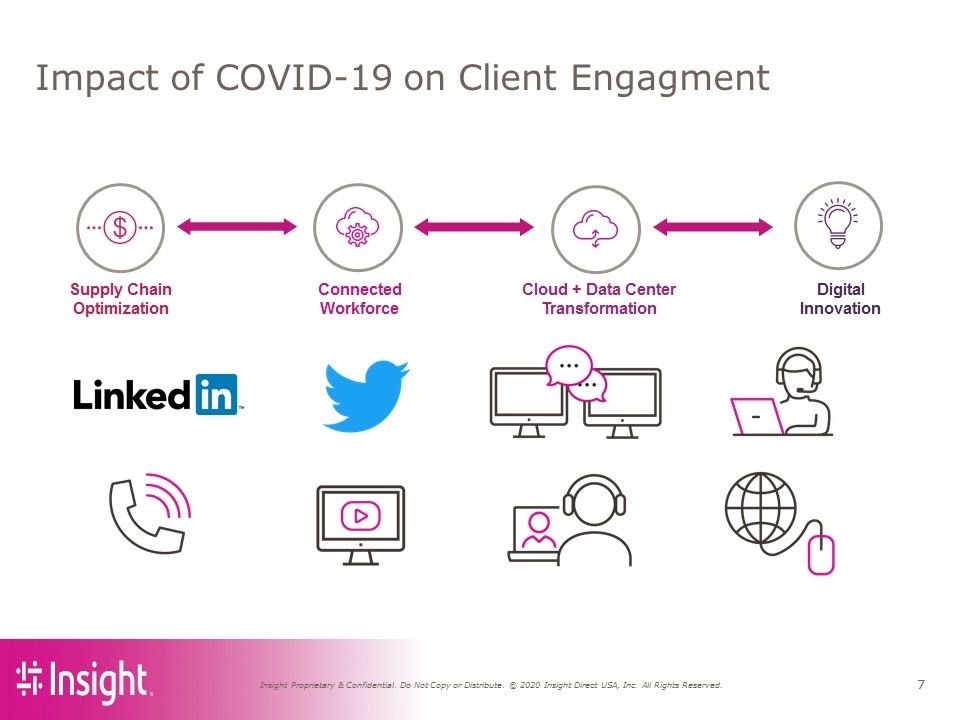
Impact of COVID-19 on Client Engagment Cloud + Data Center Transformation Digital Innovation Supply Chain Optimization Connected Workforce
Current Demand Environment Most markets remain in work from home mode Hardware bookings in North America down> 10% year over year in July Currently expect consolidated net sales to be up in the third quarter year over year due to the addition of PCM for additional two months this year On a consolidated basis, currently expect gross margins in the business to be between 14.7% and 14.9%, up year over year due to the addition of PCM and a higher mix of cloud and services sales Currently expect SG&A as a percent of sales will approximate levels reported in the second quarter
CFO Commentary Recent Cost Reductions Liquidity and Debt Covenants Financial Results by Region Taxes and Cash Flow
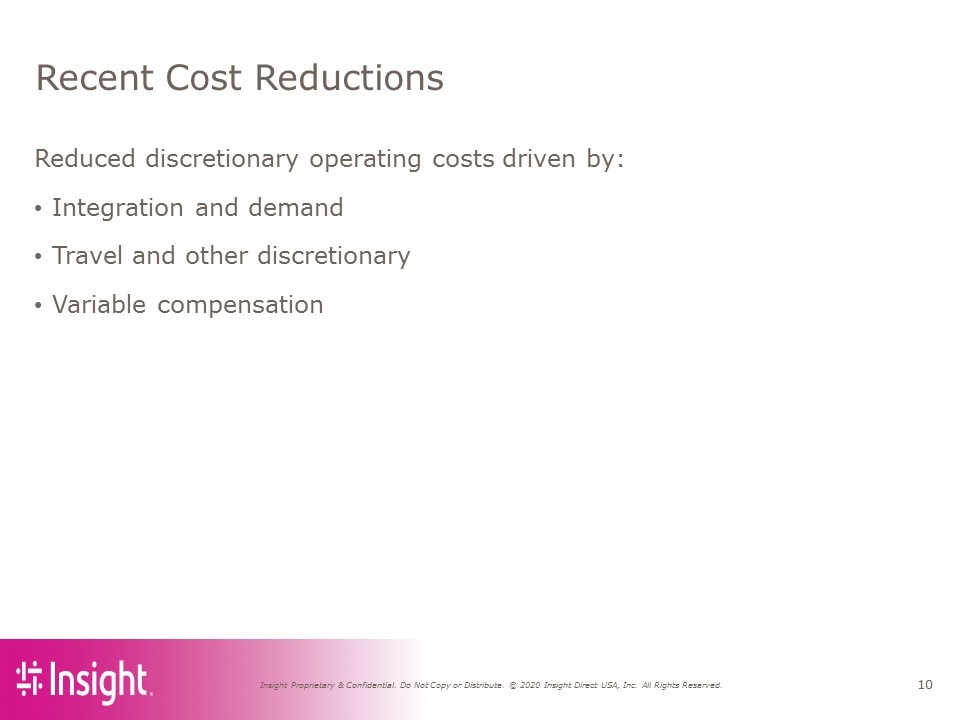
Recent Cost Reductions Reduced discretionary operating costs driven by: Integration and demand Travel and other discretionary Variable compensation
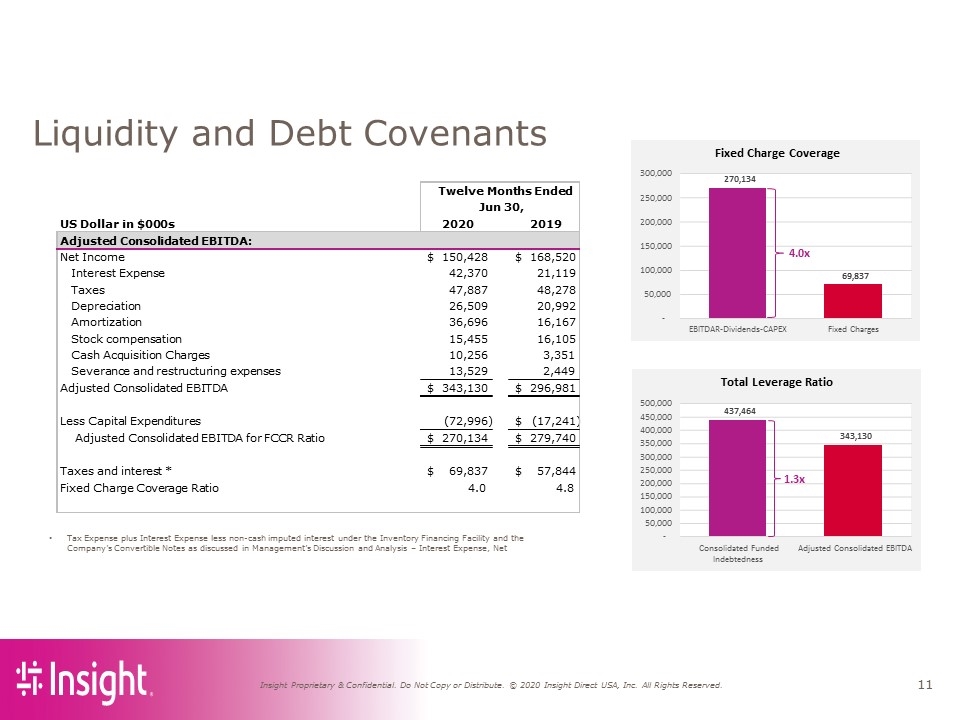
Liquidity and Debt Covenants Tax Expense plus Interest Expense less non-cash imputed interest under the Inventory Financing Facility and the Company’s Convertible Notes as discussed in Management’s Discussion and Analysis – Interest Expense, Net US Dollar in $000s 2020 2019 Adjusted Consolidated EBITDA: Net Income 150,428 $ 168,520 $ Interest Expense 42,370 21,119 Taxes 47,887 48,278 Depreciation 26,509 20,992 Amortization 36,696 16,167 Stock compensation 15,455 16,105 Cash Acquisition Charges 10,256 3,351 Severance and restructuring expenses 13,529 2,449 Adjusted Consolidated EBITDA 343,130 $ 296,981 $ Less Capital Expenditures (72,996) (17,241) $ Adjusted Consolidated EBITDA for FCCR Ratio 270,134 $ 279,740 $ Taxes and interest * 69,837 $ 57,844 $ Fixed Charge Coverage Ratio 4.0 4.8 Twelve Months Ended Jun 30, Fixed Charge Coverage 270,134 69,837 - 50,000 100,000 150,000 200,000 250,000 300,000 EBITDAR-Dividends-CAPEX Fixed Charges 4.0x Total Leverage Ratio 437,464 343,130 - 50,000 100,000 150,000 200,000 250,000 300,000 350,000 400,000 450,000 500,000 Consolidated Funded Indebtedness Adjusted Consolidated EBITDA 1.3x
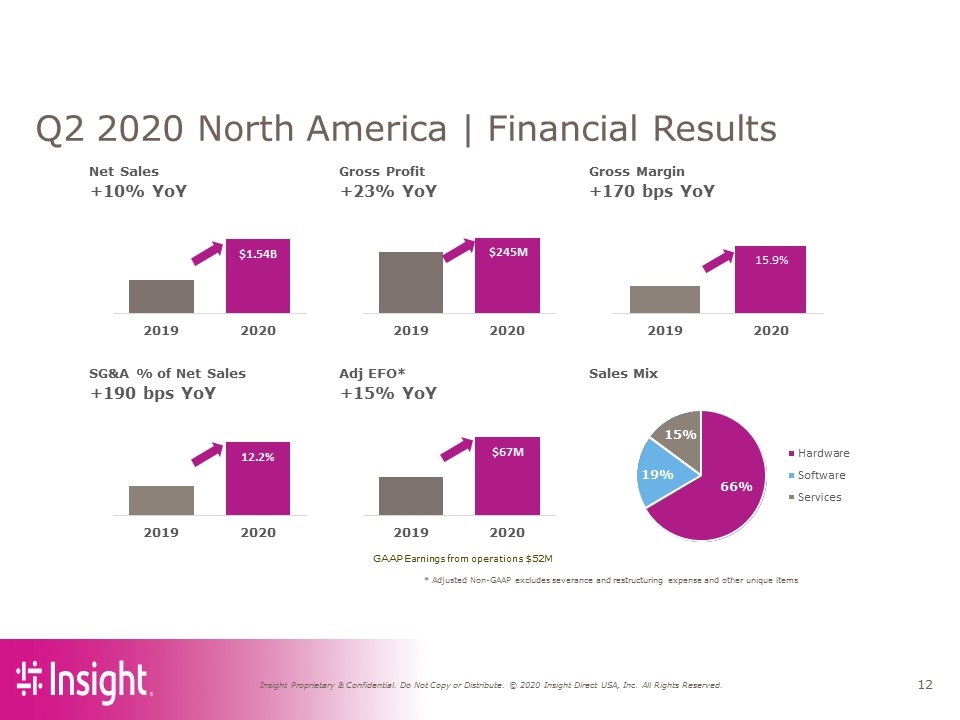
* Adjusted Non-GAAP excludes severance and restructuring expense and other unique items Q2 2020 North America | Financial Results GAAP Earnings from operations $52M Net Sales Gross Profit Gross Margin +10% YoY +23% YoY +170 bps YoY SG&A % of Net Sales Adj EFO* Sales Mix +190 bps YoY +15% YoY 66% 19% 15% Hardware Software Services $1.54B 2019 2020 $245M 2019 2020 15.9% 2019 2020 $67M 2019 2020 12.2% 2019 2020
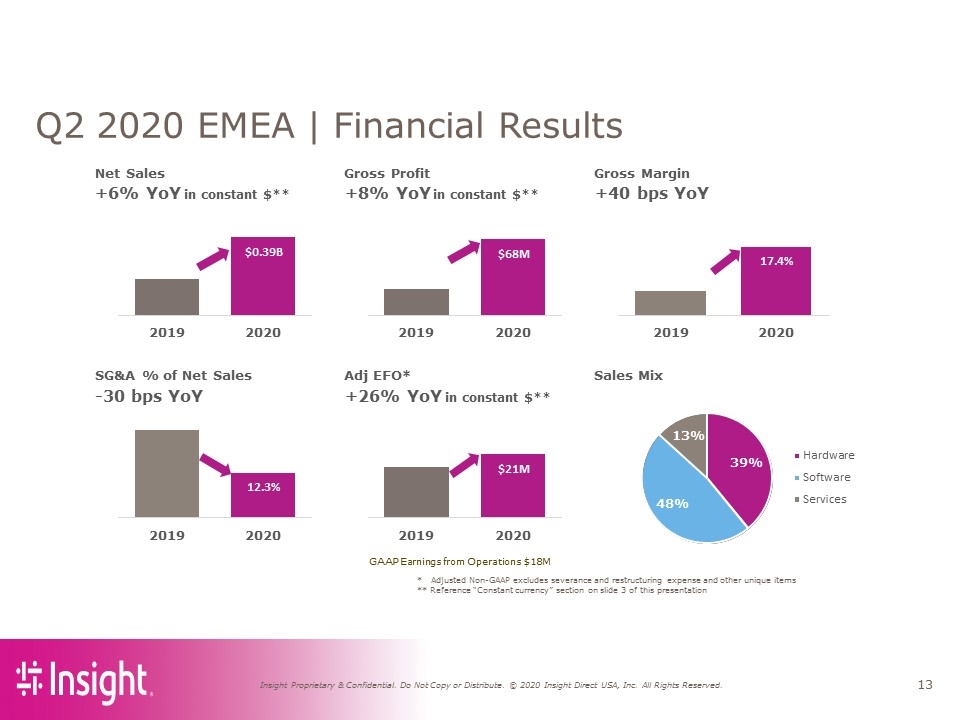
* Adjusted Non-GAAP excludes severance and restructuring expense and other unique items ** Reference “Constant currency” section on slide 3 of this presentation Q2 2020 EMEA | Financial Results in constant $** in constant $** GAAP Earnings from Operations $18M in constant $** Net Sales Gross Profit Gross Margin +6% YoY +8% YoY +40 bps YoY SG&A % of Net Sales Adj EFO* Sales Mix -30 bps YoY +26% YoY 39% 48% 13% Hardware Software Services $0.39B 2019 2020 $68M 2019 2020 17.4% 2019 2020 $21M 2019 2020 12.3% 2019 2020
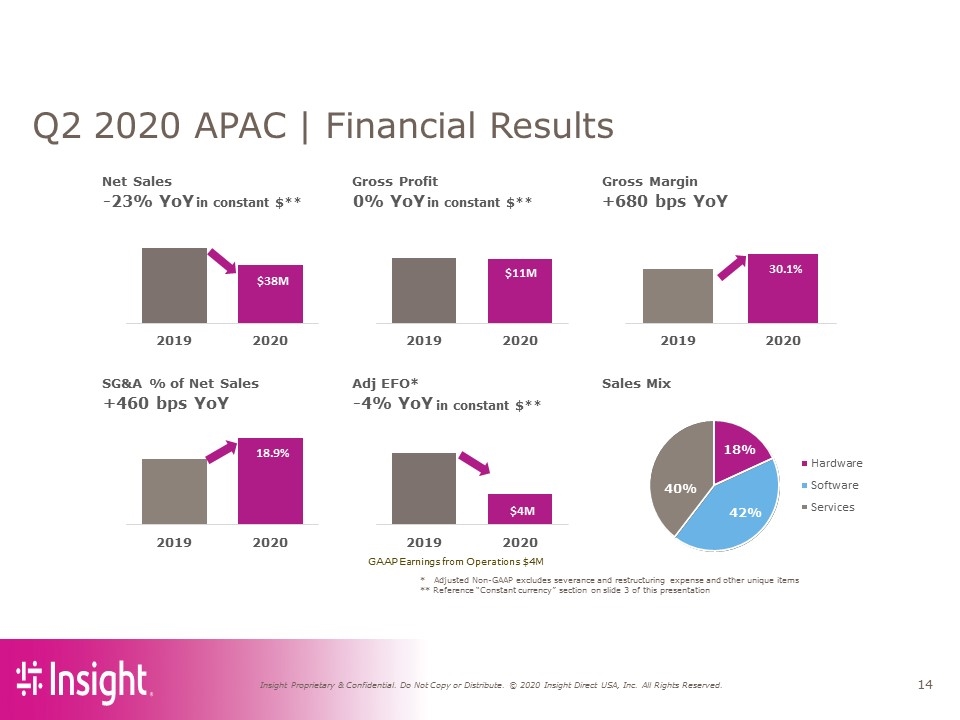
Net Sales Gross Profit Gross Margin -23% YoY 0% YoY +680 bps YoY SG&A % of Net Sales Adj EFO* Sales Mix +460 bps YoY -4% YoY $38M 2019 2020 $11M 2019 2020 30.1% 2019 2020 $4M 2019 2020 18.9% 2019 2020 18% 42% 40% Hardware Software Services * Adjusted Non-GAAP excludes severance and restructuring expense and other unique items ** Reference “Constant currency” section on slide 3 of this presentation Q2 2020 APAC | Financial Results in constant $** in constant $** GAAP Earnings from Operations $4M in constant $**
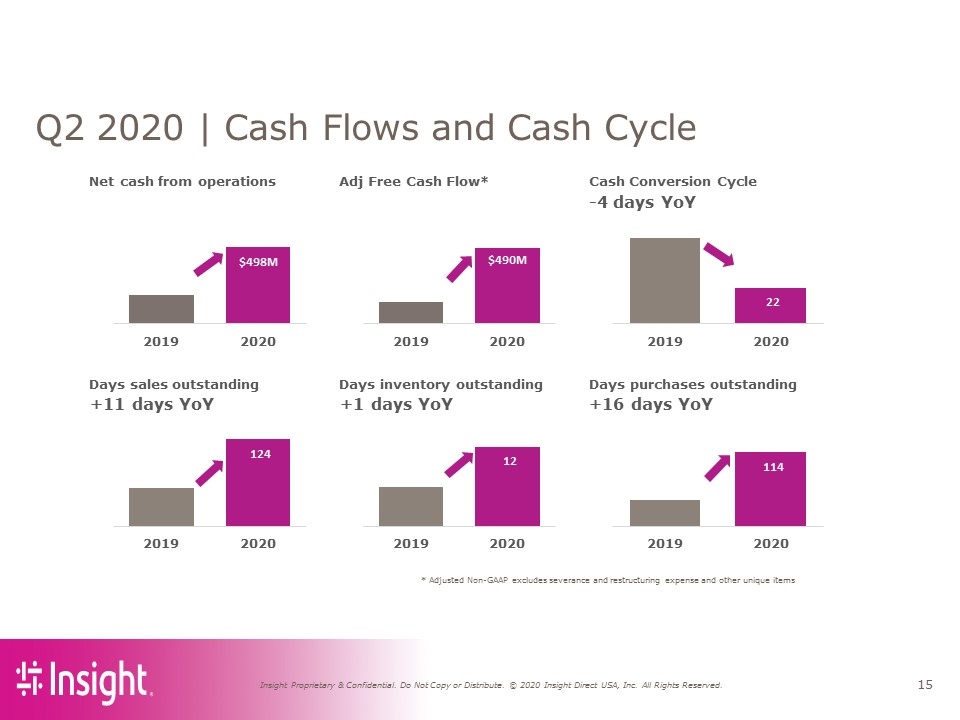
* Adjusted Non-GAAP excludes severance and restructuring expense and other unique items Q2 2020 | Cash Flows and Cash Cycle Net cash from operations Adj Free Cash Flow* Cash Conversion Cycle -4 days YoY Days sales outstanding Days inventory outstanding Days purchases outstanding +11 days YoY +1 days YoY +16 days YoY $498M 2019 2020 $490M 2019 2020 22 2019 2020 124 2019 2020 12 2019 2020 114 2019 2020
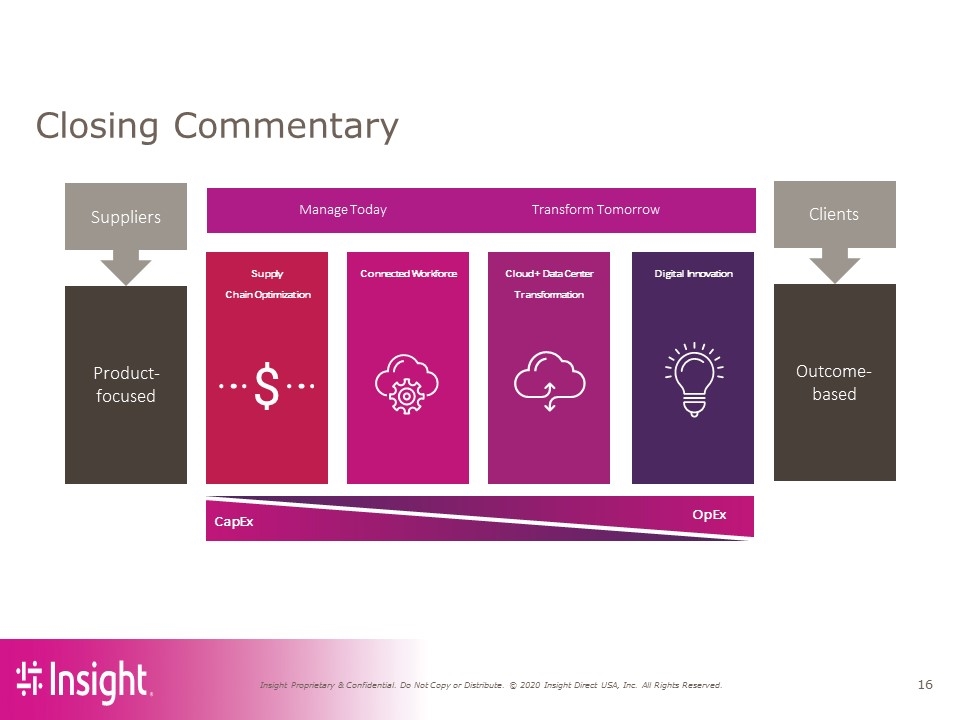
Closing Commentary Product-focused Suppliers Outcome-based Clients Supply Chain Optimization Connected Workforce Cloud + Data Center Transformation Digital Innovation CapEx OpEx Manage Today Transform Tomorrow
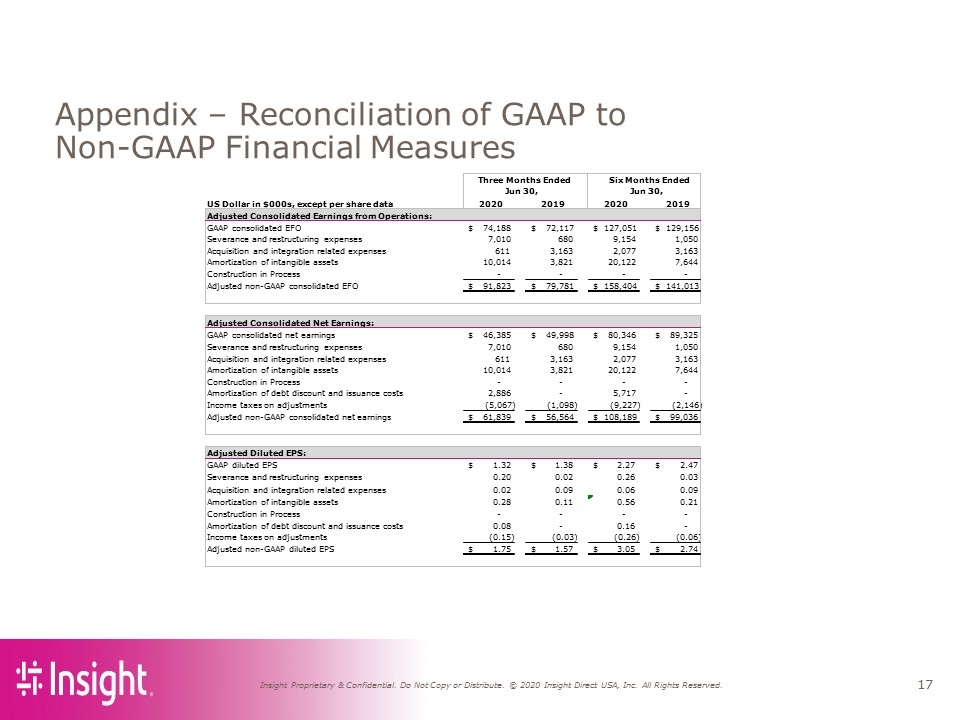
Appendix – Reconciliation of GAAP to Non-GAAP Financial Measures US Dollar in $000s, except per share data 2020 2019 2020 2019 Adjusted Consolidated Earnings from Operations: GAAP consolidated EFO 74,188 $ 72,117 $ 127,051 $ 129,156 $ Severance and restructuring expenses 7,010 680 9,154 1,050 Acquisition and integration related expenses 611 3,163 2,077 3,163 Amortization of intangible assets 10,014 3,821 20,122 7,644 Construction in Process - - - - Adjusted non-GAAP consolidated EFO 91,823 $ 79,781 $ 158,404 $ 141,013 $ Adjusted Consolidated Net Earnings: GAAP consolidated net earnings 46,385 $ 49,998 $ 80,346 $ 89,325 $ Severance and restructuring expenses 7,010 680 9,154 1,050 Acquisition and integration related expenses 611 3,163 2,077 3,163 Amortization of intangible assets 10,014 3,821 20,122 7,644 Construction in Process - - - - Amortization of debt discount and issuance costs 2,886 - 5,717 - Income taxes on adjustments (5,067) (1,098) (9,227) (2,146) Adjusted non-GAAP consolidated net earnings 61,839 $ 56,564 $ 108,189 $ 99,036 $ Adjusted Diluted EPS: GAAP diluted EPS 1.32 $ 1.38 $ 2.27 $ 2.47 $ Severance and restructuring expenses 0.20 0.02 0.26 0.03 Acquisition and integration related expenses 0.02 0.09 0.06 0.09 Amortization of intangible assets 0.28 0.11 0.56 0.21 Construction in Process - - - - Amortization of debt discount and issuance costs 0.08 - 0.16 - Income taxes on adjustments (0.15) (0.03) (0.26) (0.06) Adjusted non-GAAP diluted EPS 1.75 $ 1.57 $ 3.05 $ 2.74 $ Three Months Ended Six Months Ended Jun 30, Jun 30,
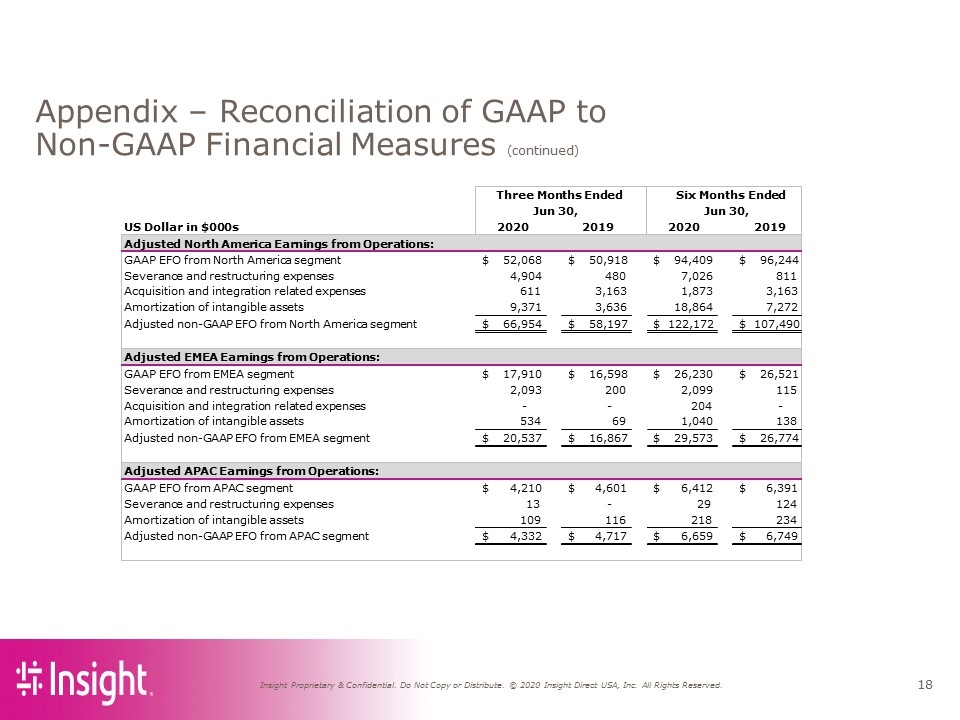
Appendix – Reconciliation of GAAP to Non-GAAP Financial Measures (continued) US Dollar in $000s 2020 2019 2020 2019 Adjusted North America Earnings from Operations: GAAP EFO from North America segment 52,068 $ 50,918 $ 94,409 $ 96,244 $ Severance and restructuring expenses 4,904 480 7,026 811 Acquisition and integration related expenses 611 3,163 1,873 3,163 Amortization of intangible assets 9,371 3,636 18,864 7,272 Adjusted non-GAAP EFO from North America segment 66,954 $ 58,197 $ 122,172 $ 107,490 $ Adjusted EMEA Earnings from Operations: GAAP EFO from EMEA segment 17,910 $ 16,598 $ 26,230 $ 26,521 $ Severance and restructuring expenses 2,093 200 2,099 115 Acquisition and integration related expenses - - 204 - Amortization of intangible assets 534 69 1,040 138 Adjusted non-GAAP EFO from EMEA segment 20,537 $ 16,867 $ 29,573 $ 26,774 $ Adjusted APAC Earnings from Operations: GAAP EFO from APAC segment 4,210 $ 4,601 $ 6,412 $ 6,391 $ Severance and restructuring expenses 13 - 29 124 Amortization of intangible assets 109 116 218 234 Adjusted non-GAAP EFO from APAC segment 4,332 $ 4,717 $ 6,659 $ 6,749 $ Jun 30, Jun 30, Three Months Ended Six Months Ended
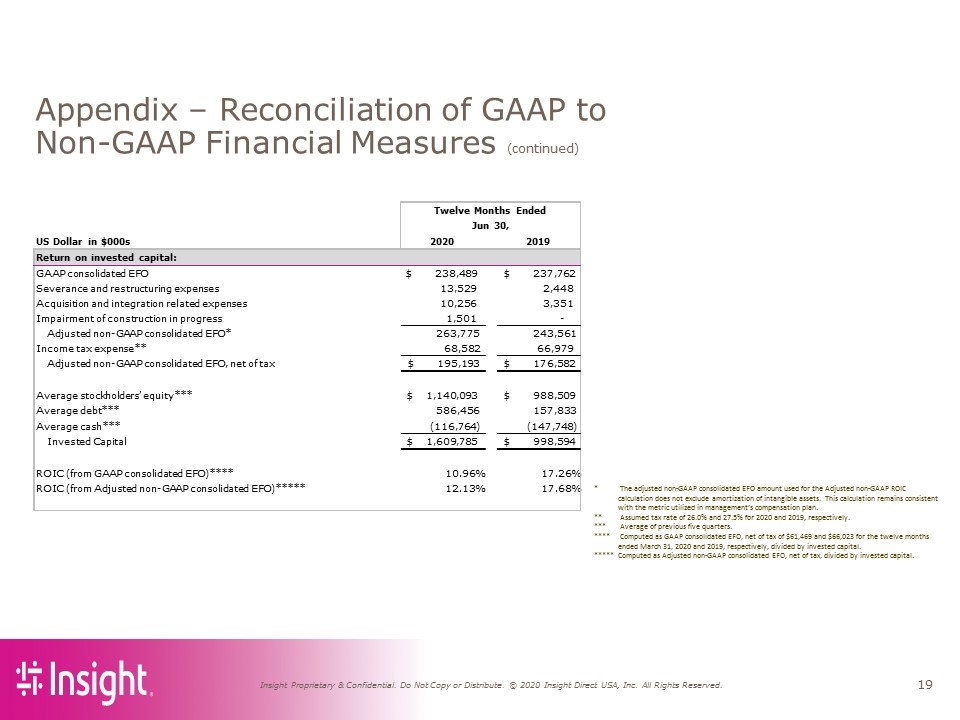
Appendix – Reconciliation of GAAP to Non-GAAP Financial Measures (continued) * The adjusted non-GAAP consolidated EFO amount used for the Adjusted non-GAAP ROIC calculation does not exclude amortization of intangible assets. This calculation remains consistent with the metric utilized in management’s compensation plan. ** Assumed tax rate of 26.0% and 27.5% for 2020 and 2019, respectively. *** Average of previous five quarters. **** Computed as GAAP consolidated EFO, net of tax of $61,469 and $66,023 for the twelve months ended March 31, 2020 and 2019, respectively, divided by invested capital. ***** Computed as Adjusted non-GAAP consolidated EFO, net of tax, divided by invested capital. US Dollar in $000s 2020 2019 GAAP consolidated EFO $ 238,489 $ 237,762 Severance and restructuring expenses 13,529 2,448 Acquisition and integration related expenses 10,256 3,351 Impairment of construction in progress 1,501 - Adjusted non-GAAP consolidated EFO* 263,775 243,561 Income tax expense** 68,582 66,979 Adjusted non-GAAP consolidated EFO, net of tax $ 195,193 $ 176,582 Average stockholders’ equity*** $ 1,140,093 $ 988,509 Average debt*** 586,456 157,833 Average cash*** (116,764) (147,748) Invested Capital $ 1,609,785 $ 998,594 ROIC (from GAAP consolidated EFO)**** 10.96% 17.26% ROIC (from Adjusted non-GAAP consolidated EFO)***** 12.13% 17.68% Twelve Months Ended Jun 30, Return on invested capital: