Exhibit 99.1

|
|
|
FOR IMMEDIATE RELEASE |
Nasdaq: NSIT |
Insight Enterprises, Inc. Reports first QUARTER
2021 results
TEMPE, AZ – May 6, 2021 – Insight Enterprises, Inc. (Nasdaq: NSIT) (the “Company”) today reported financial results for the quarter ended March 31, 2021. Highlights include:
|
|
• |
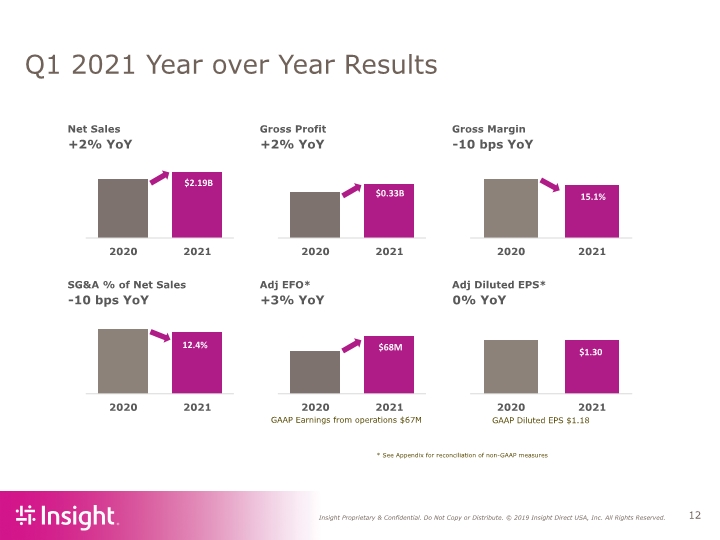
Net sales increased 2% year over year to $2.2 billion |
|
|
• |
Earnings from operations increased 27% to $67.0 million |
|
|
• |
Adjusted earnings from operations increased 3% to $68.3 million |
|
|
• |
Diluted earnings per share of $1.18 increased 24% year over year |
|
|
• |
Adjusted diluted earnings per share of $1.30 was flat with prior year |
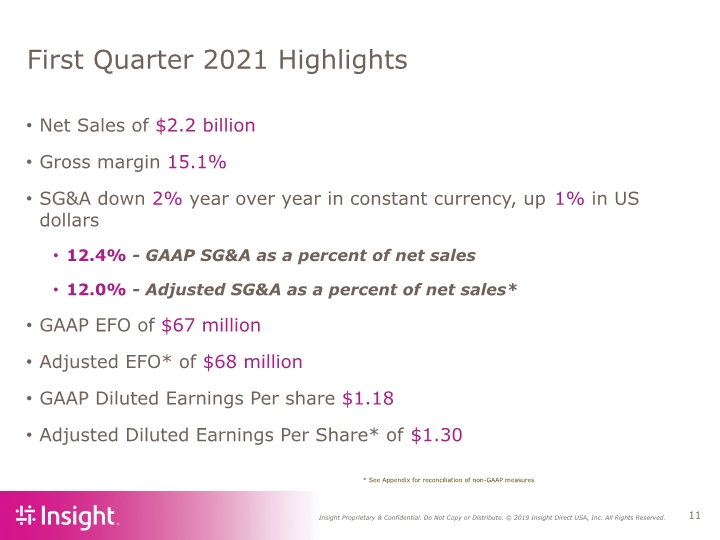
In the first quarter of 2021, net sales increased 2%, year over year. Gross profit also increased 2% while gross margin contracted 10 basis points compared to the first quarter of 2020. Earnings from operations of $67.0 million increased 27% compared to $52.9 million in the first quarter of 2020. Adjusted earnings from operations of $68.3 million increased 3% compared to $66.6 million in the first quarter of 2020. Diluted earnings per share for the quarter was $1.18, up 24%, year over year, and adjusted diluted earnings per share was $1.30, flat year to year.
“In the first quarter, with the launch of COVID-19 vaccines, parts of the world began to awaken from the year long quarantine and economic pause. I’m happy to report that our business returned to organic top line growth year over year in the first quarter,” stated Ken Lamneck, President and Chief Executive Officer. “Largely consistent gross margins, year over year, combined with operating leverage drove earnings from operations up 27% and Adjusted earnings from operations up 3%. Our performance for the quarter sets a good base for what we expect will be a strong year.” stated Lamneck.
KEY HIGHLIGHTS
|
|
• |
Consolidated net sales for the first quarter of 2021 of $2.19 billion increased 2%, year over year, when compared to the first quarter of 2020. |
|
|
• |
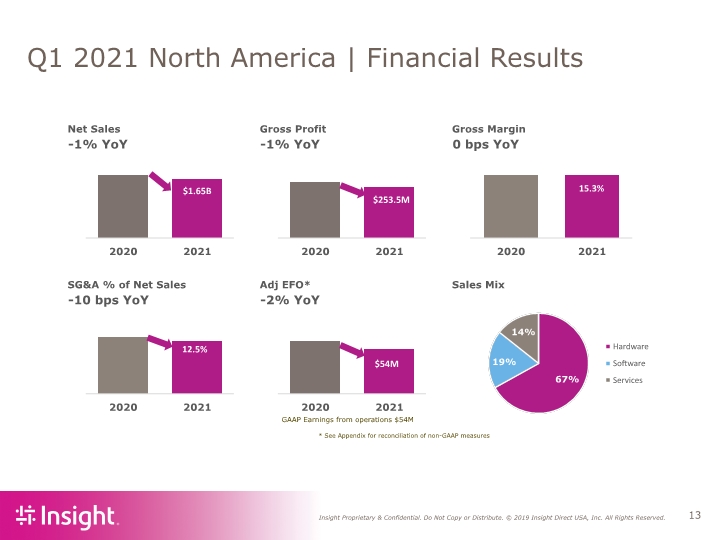
Net sales in North America decreased 1%, year to year, to $1.65 billion; |
|
|
• |
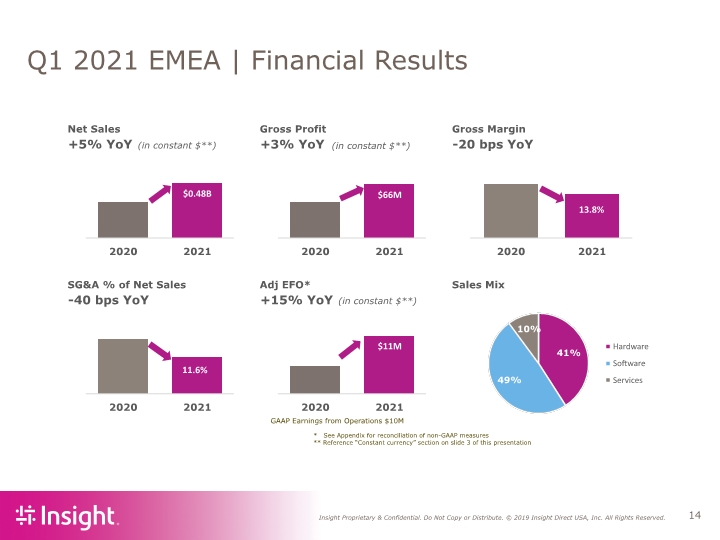
Net sales in EMEA increased 14%, year over year, to $478.8 million; and |
|
|
• |
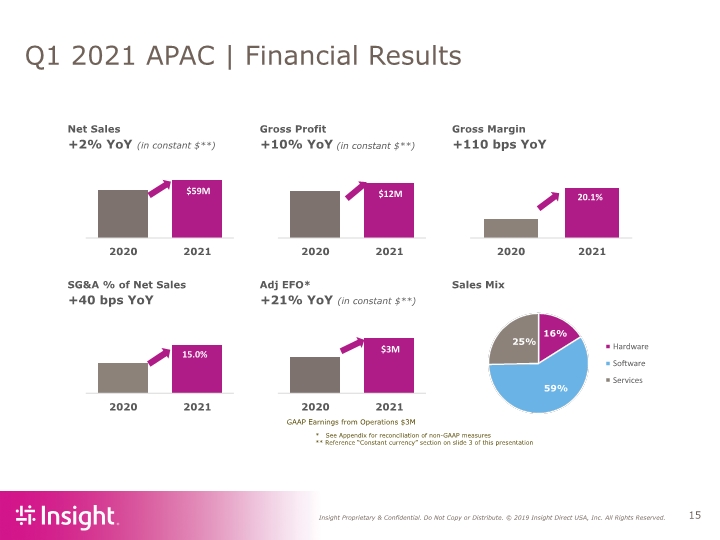
Net sales in APAC increased 17%, year over year, to $59.5 million. |
|
|
• |
Excluding the effects of fluctuating foreign currency exchange rates, consolidated net sales were flat, year to year, with growth in net sales in EMEA and APAC of 5% and 2%, respectively, year over year, partially offset by a decline in North America of 2%, year to year. |
|
|
• |
Consolidated gross profit increased to $331.5 million, an increase of 2% compared to the first quarter of 2020, with consolidated gross margin contracting 10 basis points to 15.1% of net sales. |
|
|
• |
Gross profit in North America decreased 1%, year to year, to $253.5 million (15.3% gross margin); |
|
|
• |
Gross profit in EMEA increased 12%, year over year, to $66.0 million (13.8% gross margin); and |
|
|
• |
Gross profit in APAC increased 24%, year over year, to $12.0 million (20.1% gross margin). |
|
|
• |
Excluding the effects of fluctuating foreign currency exchange rates, consolidated gross profit was flat, year to year, with gross profit growth in EMEA and APAC of 3% and 10%, respectively, year over year, partially offset by a decline in North America of 4%, year to year. |
- MORE -
|
Insight Enterprises, Inc. |
|
6820 South Harl Avenue |
|
Tempe, Arizona 85283 |
|
800.467.4448 |
|
FAX 480.760.8958 |
|
|
• |
Consolidated earnings from operations increased 27% compared to the first quarter of 2020 to $67.0 million, or 3.1% of net sales. |
|
|
• |
Earnings from operations in North America increased 27%, year over year, to $53.9 million, or 3.3% of net sales; |
|
|
• |
Earnings from operations in EMEA increased 21%, year over year, to $10.1 million, or 2.1% of net sales; and |
|
|
• |
Earnings from operations in APAC increased 37%, year over year, to $3.0 million, or 5.1% of net sales. |
|
|
• |
Excluding the effects of fluctuating foreign currency exchange rates, consolidated earnings from operations increased 22%, year over year, with increased earnings from operations in North America, EMEA and APAC of 24%, 9% and 23%, respectively, year over year. |
|
|
• |
Adjusted earnings from operations increased 3% compared to the first quarter of 2020 to $68.3 million, or 3.1% of net sales. |
|
|
• |
Adjusted earnings from operations in North America decreased 2%, year to year, to $54.1 million, or 3.3% of net sales; |
|
|
• |
Adjusted earnings from operations in EMEA increased 23%, year over year, to $11.1 million, or 2.3% of net sales; and |
|
|
• |
Adjusted earnings from operations in APAC increased 35%, year over year, to $3.1 million, or 5.3% of net sales. |
|
|
• |
Consolidated net earnings and diluted earnings per share for the first quarter of 2021 were $43.2 million and $1.18, respectively, at an effective tax rate of 23.8%. |
|
|
• |
Adjusted consolidated net earnings and Adjusted diluted earnings per share for the first quarter of 2021 were $46.5 million and $1.30, respectively. |
In discussing financial results for the three months ended March 31, 2021 and 2020 in this press release, the Company refers to certain financial measures that are adjusted from the financial results prepared in accordance with United States generally accepted accounting principles (“GAAP”). When referring to non-GAAP measures, the Company refers to such measures as “Adjusted.” See “Use of Non-GAAP Financial Measures” for additional information. A tabular reconciliation of financial measures prepared in accordance with GAAP to the non-GAAP financial measures is included at the end of this press release.
In some instances, the Company refers to changes in net sales, gross profit and earnings from operations on a consolidated basis and in North America, EMEA and APAC excluding the effects of fluctuating foreign currency exchange rates. In computing these changes and percentages, the Company compares the current year amount as translated into U.S. dollars under the applicable accounting standards to the prior year amount in local currency translated into U.S. dollars utilizing the weighted average translation rate for the current period.
The tax effect of Adjusted amounts referenced herein were computed using the statutory tax rate for the taxing jurisdictions in the operating segment in which the related expenses were recorded, adjusted for the effects of valuation allowances on net operating losses in certain jurisdictions.
- MORE -
|
Insight Enterprises, Inc. |
|
6820 South Harl Avenue |
|
Tempe, Arizona 85283 |
|
800.467.4448 |
|
FAX 480.760.8958 |
Stock repurchase
On May 3, 2021, the Company’s Board of Directors authorized the Company to increase amounts available under the existing stock repurchase program, pursuant to which the Company may purchase up to an aggregate of $125 million of the Company's common stock, including $25 million that was previously authorized in February 2020. The Company's share repurchases will be made on the open market, through block trades, through 10b5-1 plans or otherwise. The number of shares purchased, and the timing of the purchases will be based on working capital requirements, general business conditions and other factors. The Company intends to retire the repurchased shares.
guidance
For the full year 2021, the Company expects to deliver net sales growth in the 4% to 8% range and Adjusted diluted earnings per share is expected to be between $6.60 and $6.80. This forecast is unchanged from the previously communicated outlook.
This outlook assumes
|
|
• |
interest expense between $25 million and $28 million; |
|
|
• |
an effective tax rate of 25% to 26% for the full year 2021; |
|
|
• |
capital expenditures of $75 to $85 million, including the build out of our new corporate headquarters; and |
|
|
• |
an average share count for the full year of approximately 36 million shares. |
This outlook excludes acquisition-related intangibles amortization expense of approximately $32 million and the non-cash convertible debt discount and issuance costs, reported as part of interest expense, of approximately $12 million and assumes no acquisition-related or severance and restructuring expenses. Due to the inherent difficulty of forecasting some of these types of expenses, which impact net earnings and diluted earnings per share, the Company is unable to reasonably estimate the impact of such expenses, if any, to net earnings and diluted earnings per share. Accordingly, the Company is unable to provide a reconciliation of GAAP to non-GAAP diluted earnings per share for the full year 2021 forecast.
Conference Call and Webcast
The Company will host a conference call and live web cast today at 9:00 a.m. ET to discuss first quarter 2021 results of operations. A live web cast of the conference call (in listen-only mode) will be available on the Company’s web site at http://investor.insight.com/, and a replay of the web cast will be available on the Company’s web site for a limited time following the call. To access the live conference call, please register in advance using this event link. Upon registering, participants will receive dial-in information via email, as well as a unique registrant ID, event passcode, and detailed instructions regarding how to join the call.
- MORE -
|
Insight Enterprises, Inc. |
|
6820 South Harl Avenue |
|
Tempe, Arizona 85283 |
|
800.467.4448 |
|
FAX 480.760.8958 |
Use of NON-GAAP Financial Measures
The non-GAAP financial measures are referred to as “Adjusted”. Adjusted consolidated earnings from operations, Adjusted consolidated net earnings and Adjusted diluted earnings per share exclude (i) severance and restructuring expenses, (ii) certain acquisition and integration related expenses, (iii) amortization of intangible assets, and (iv) the tax effects of each of these items, as applicable. Adjusted consolidated net earnings and Adjusted diluted earnings per share also exclude amortization of debt discount and issuance costs associated with the issuance of the Company’s convertible senior notes due 2025. The Company excludes these items when internally evaluating earnings from operations, tax expense, net earnings and diluted earnings per share for the Company and earnings from operations for each of the Company’s operating segments. Adjusted diluted earnings per share also includes the impact of the benefit from the note hedge where the Company’s average stock price for the first quarter of 2021 was in excess of $68.32, which is the initial conversion price of the convertible senior notes. Adjusted EBITDA adds back (i) interest expense, (ii) income tax expense, (iii) depreciation and amortization of property and equipment, (iv) amortization of intangibles, (v) non-cash stock based compensation (vi) severance and restructuring expenses and (vii) certain acquisition and integration related expenses. Adjusted free cash flow is the Company’s net cash provided by operating activities adjusted for (i) purchases of property and equipment and (ii) the net borrowings or repayments under the inventory financing facilities. Adjusted return on invested capital (“ROIC”) excludes (i) severance and restructuring expenses, (ii) certain acquisition and integration related expenses, (iii) impairment of construction in progress, (iv) loss on sale of property, (v) litigation settlement proceeds, and (vi) the tax effects of each of these items, as applicable.
These non-GAAP measures are used by the Company and its management to evaluate financial performance against budgeted amounts, to calculate incentive compensation, to assist in forecasting future performance and to compare the Company’s results to those of the Company’s competitors. The Company believes that these non-GAAP financial measures are useful to investors because they allow for greater transparency, facilitate comparisons to prior periods and the Company’s competitors’ results and assist in forecasting performance for future periods. These non-GAAP financial measures are not prepared in accordance with GAAP and may be different from non-GAAP financial measures presented by other companies. Non-GAAP financial measures should not be considered as a substitute for, or superior to, measures of financial performance prepared in accordance with GAAP.
- MORE -
|
Insight Enterprises, Inc. |
|
6820 South Harl Avenue |
|
Tempe, Arizona 85283 |
|
800.467.4448 |
|
FAX 480.760.8958 |
Financial Summary Table
(dollars in thousands, except per share data)
(Unaudited)
|
|
|
Three Months Ended March 31, |
|
|
|
|
2021 |
|
|
2020 |
|
|
change |
|
|
Insight Enterprises, Inc. |
|
|
|
|
|
|
|
|
|
|
|
|
|
Net sales: |
|
|
|
|
|
|
|
|
|
|
|
|
|
Products |
|
$ |
1,893,020 |
|
|
$ |
1,848,316 |
|
|
2% |
|
|
Services |
|
$ |
300,048 |
|
|
$ |
295,735 |
|
|
1% |
|
|
Total net sales |
|
$ |
2,193,068 |
|
|
$ |
2,144,051 |
|
|
2% |
|
|
Gross profit |
|
$ |
331,474 |
|
|
$ |
325,336 |
|
|
2% |
|
|
Gross margin |
|
|
15.1 |
% |
|
|
15.2 |
% |
|
(10 bps) |
|
|
Selling and administrative expenses |
|
$ |
271,190 |
|
|
$ |
268,863 |
|
|
1% |
|
|
Severance and restructuring expenses |
|
$ |
(6,740 |
) |
|
$ |
2,144 |
|
|
(> 100%) |
|
|
Acquisition and integration related expenses |
|
$ |
— |
|
|
$ |
1,466 |
|
|
* |
|
|
Earnings from operations |
|
$ |
67,024 |
|
|
$ |
52,863 |
|
|
27% |
|
|
Net earnings |
|
$ |
43,168 |
|
|
$ |
33,961 |
|
|
27% |
|
|
Diluted earnings per share |
|
$ |
1.18 |
|
|
$ |
0.95 |
|
|
24% |
|
|
|
|
|
|
|
|
|
|
|
|
|
|
|
|
North America |
|
|
|
|
|
|
|
|
|
|
|
|
|
Net sales: |
|
|
|
|
|
|
|
|
|
|
|
|
|
Products |
|
$ |
1,418,227 |
|
|
$ |
1,433,649 |
|
|
(1%) |
|
|
Services |
|
$ |
236,554 |
|
|
$ |
240,732 |
|
|
(2%) |
|
|
Total net sales |
|
$ |
1,654,781 |
|
|
$ |
1,674,381 |
|
|
(1%) |
|
|
Gross profit |
|
$ |
253,489 |
|
|
$ |
256,928 |
|
|
(1%) |
|
|
Gross margin |
|
|
15.3 |
% |
|
|
15.3 |
% |
|
|
— |
|
|
Selling and administrative expenses |
|
$ |
206,806 |
|
|
$ |
211,203 |
|
|
(2%) |
|
|
Severance and restructuring expenses |
|
$ |
(7,238 |
) |
|
$ |
2,122 |
|
|
(> 100%) |
|
|
Acquisition and integration related expenses |
|
$ |
— |
|
|
$ |
1,262 |
|
|
* |
|
|
Earnings from operations |
|
$ |
53,921 |
|
|
$ |
42,341 |
|
|
27% |
|
|
|
|
|
|
|
|
|
|
|
|
|
|
|
|
Sales Mix |
|
|
|
|
|
|
|
|
|
** |
|
|
Hardware |
|
|
67 |
% |
|
|
68 |
% |
|
(2%) |
|
|
Software |
|
|
19 |
% |
|
|
18 |
% |
|
1% |
|
|
Services |
|
|
14 |
% |
|
|
14 |
% |
|
(2%) |
|
|
|
|
|
100 |
% |
|
|
100 |
% |
|
(1%) |
|
|
|
|
|
|
|
|
|
|
|
|
|
|
|
|
EMEA |
|
|
|
|
|
|
|
|
|
|
|
|
|
Net sales: |
|
|
|
|
|
|
|
|
|
|
|
|
|
Products |
|
$ |
430,394 |
|
|
$ |
376,051 |
|
|
14% |
|
|
Services |
|
$ |
48,442 |
|
|
$ |
42,835 |
|
|
13% |
|
|
Total net sales |
|
$ |
478,836 |
|
|
$ |
418,886 |
|
|
14% |
|
|
Gross profit |
|
$ |
66,035 |
|
|
$ |
58,774 |
|
|
12% |
|
|
Gross margin |
|
|
13.8 |
% |
|
|
14.0 |
% |
|
(20 bps) |
|
|
Selling and administrative expenses |
|
$ |
55,447 |
|
|
$ |
50,244 |
|
|
10% |
|
|
Severance and restructuring expenses |
|
$ |
498 |
|
|
$ |
6 |
|
|
> 100% |
|
|
Acquisition and integration related expenses |
|
$ |
— |
|
|
$ |
204 |
|
|
* |
|
|
Earnings from operations |
|
$ |
10,090 |
|
|
$ |
8,320 |
|
|
21% |
|
|
|
|
|
|
|
|
|
|
|
|
|
|
|
|
Sales Mix |
|
|
|
|
|
|
|
|
|
** |
|
|
Hardware |
|
|
41 |
% |
|
|
42 |
% |
|
12% |
|
|
Software |
|
|
49 |
% |
|
|
48 |
% |
|
17% |
|
|
Services |
|
|
10 |
% |
|
|
10 |
% |
|
13% |
|
|
|
|
|
100 |
% |
|
|
100 |
% |
|
14% |
|
|
|
|
|
|
|
|
|
|
|
|
|
|
|
|
* |
Percentage change not considered meaningful. |
|
** |
Change in sales mix represents growth/decline in category net sales on a U.S. dollar basis and does not exclude the effects of fluctuating foreign currency exchange rates. |
- MORE -
|
Insight Enterprises, Inc. |
|
6820 South Harl Avenue |
|
Tempe, Arizona 85283 |
|
800.467.4448 |
|
FAX 480.760.8958 |
Financial Summary Table (continued)
(dollars in thousands, except per share data)
(Unaudited)
|
|
|
Three Months Ended March 31, |
|
|
|
|
2021 |
|
|
2020 |
|
|
change |
|
|
APAC |
|
|
|
|
|
|
|
|
|
|
|
|
|
Net sales: |
|
|
|
|
|
|
|
|
|
|
|
|
|
Products |
|
$ |
44,399 |
|
|
$ |
38,616 |
|
|
15% |
|
|
Services |
|
$ |
15,052 |
|
|
$ |
12,168 |
|
|
24% |
|
|
Total net sales |
|
$ |
59,451 |
|
|
$ |
50,784 |
|
|
17% |
|
|
Gross profit |
|
$ |
11,950 |
|
|
$ |
9,634 |
|
|
24% |
|
|
Gross margin |
|
|
20.1 |
% |
|
|
19.0 |
% |
|
110 bps |
|
|
Selling and administrative expenses |
|
$ |
8,937 |
|
|
$ |
7,416 |
|
|
21% |
|
|
Severance and restructuring expenses |
|
$ |
— |
|
|
$ |
16 |
|
|
* |
|
|
Earnings from operations |
|
$ |
3,013 |
|
|
$ |
2,202 |
|
|
37% |
|
|
|
|
|
|
|
|
|
|
|
|
|
|
|
|
Sales Mix |
|
|
|
|
|
|
|
|
|
** |
|
|
Hardware |
|
|
16 |
% |
|
|
15 |
% |
|
23% |
|
|
Software |
|
|
59 |
% |
|
|
61 |
% |
|
13% |
|
|
Services |
|
|
25 |
% |
|
|
24 |
% |
|
24% |
|
|
|
|
|
100 |
% |
|
|
100 |
% |
|
17% |
|
|
* |
Percentage change not considered meaningful. |
|
** |
Change in sales mix represents growth/decline in category net sales on a U.S. dollar basis and does not exclude the effects of fluctuating foreign currency exchange rates. |
- MORE -
|
Insight Enterprises, Inc. |
|
6820 South Harl Avenue |
|
Tempe, Arizona 85283 |
|
800.467.4448 |
|
FAX 480.760.8958 |
Forward-Looking Information
Certain statements in this release and the related conference call, web cast and presentation are “forward-looking statements” within the meaning of the Private Securities Litigation Reform Act of 1995. Forward-looking statements, including those related to our future responses to and the potential impact of coronavirus strain COVID-19 (“COVID-19”) on our Company, the Company’s future financial performance and results of operations, the Company’s anticipated effective tax rate, capital expenditures, expected average share count, the Company’s expectations regarding cash flow, the Company’s expectations regarding current supply constraints, future trends in the IT market, including due to COVID-19, our business strategy and our strategic initiatives, are inherently subject to risks and uncertainties, some of which cannot be predicted or quantified. Future events and actual results could differ materially from those set forth in, contemplated by, or underlying the forward-looking statements. There can be no assurances that the results discussed by the forward-looking statements will be achieved, and actual results may differ materially from those set forth in the forward-looking statements. Some of the important factors that could cause the Company’s actual results to differ materially from those projected in any forward-looking statements, include, but are not limited to, the following, which are discussed in the Company’s filings with the Securities and Exchange Commission (the “SEC”), including in “Risk Factors” in Part I, Item 1A of the Company’s Annual Report on Form 10-K for the year ended December 31, 2020:
|
|
• |
actions of the Company’s competitors, including manufacturers and publishers of products the Company sells; |
|
|
• |
the Company’s reliance on partners for product availability, competitive products to sell and marketing funds and purchasing incentives, which can change significantly in the amounts made available and in the requirements year over year; |
|
|
• |
the duration and severity of the COVID-19 pandemic and its effects on the Company’s business, results of operations and financial condition, as well as the widespread outbreak of any other illnesses or communicable diseases; |
|
|
• |
general economic conditions, economic uncertainties and changes in geopolitical conditions; |
|
|
• |
changes in the IT industry and/or rapid changes in technology; |
|
|
• |
supply constraints for devices; |
|
|
• |
accounts receivable risks, including increased credit loss experience or extended payment terms with the Company’s clients; |
|
|
• |
the Company’s reliance on independent shipping companies; |
|
|
• |
the risks associated with the Company’s international operations; |
|
|
• |
natural disasters or other adverse occurrences; |
|
|
• |
disruptions in the Company’s IT systems and voice and data networks; |
|
|
• |
cyberattacks or breaches of data privacy and security regulations; |
|
|
• |
intellectual property infringement claims and challenges to the Company’s registered trademarks and trade names; |
|
|
• |
legal proceedings, including PCM related litigation, client audits and failure to comply with laws and regulations; |
|
|
• |
failure to comply with the terms and conditions of the Company’s commercial and public sector contracts; |
|
|
• |
exposure to changes in, interpretations of, or enforcement trends related to tax rules and regulations; |
|
|
• |
the Company’s potential to draw down a substantial amount of indebtedness; |
|
|
• |
the conditional conversion feature of the convertible notes, which if triggered, may adversely affect the Company’s financial condition and operating results; |
|
|
• |
the accounting method for convertible debt securities that may be settled in cash, such as the convertible notes, could have a material effect on the Company’s reported financial results; |
|
|
• |
the Company is subject to counterparty risk with respect to the convertible note hedge transactions; |
|
|
• |
risks associated with the discontinuation of LIBOR as a benchmark rate; |
|
|
• |
increased debt and interest expense and availability of funds under the Company’s financing facilities; |
|
|
• |
possible significant fluctuations in the Company’s future operating results as well as seasonality and variability in customer demands; |
|
|
• |
the Company’s dependence on certain key personnel; |
|
|
• |
risks associated with the integration and operation of acquired businesses, including the achievement of expected synergies and benefits; and |
|
|
• |
future sales of the Company’s common stock or equity-linked securities in the public market could lower the market price for our common stock. |
- MORE -
|
Insight Enterprises, Inc. |
|
6820 South Harl Avenue |
|
Tempe, Arizona 85283 |
|
800.467.4448 |
|
FAX 480.760.8958 |
Additionally, there may be other risks that are otherwise described from time to time in the reports that the Company files with the SEC. Any forward-looking statements in this release, the related conference call, webcast and presentation speak only as of the date on which they are made and should be considered in light of various important factors, including the risks and uncertainties listed above, as well as others. The Company assumes no obligation to update, and, except as may be required by law, does not intend to update, any forward-looking statements. The Company does not endorse any projections regarding future performance that may be made by third parties.
|
Contact: |
|
Glynis Bryan |
|
|
|
|
|
Chief Financial Officer |
|
|
|
|
|
Tel. 480.333.3390 |
|
|
|
|
|
Email [email protected] |
|
|
- MORE -
|
Insight Enterprises, Inc. |
|
6820 South Harl Avenue |
|
Tempe, Arizona 85283 |
|
800.467.4448 |
|
FAX 480.760.8958 |
INSIGHT ENTERPRISES, INC. AND SUBSIDIARIES
Consolidated Statements of Operations
(In thousands, except per share data)
(Unaudited)
|
|
|
Three Months Ended
March 31, |
|
|
|
|
2021 |
|
|
2020 |
|
|
Net sales: |
|
|
|
|
|
|
|
|
|
Products |
|
|
1,893,020 |
|
|
$ |
1,848,316 |
|
|
Services |
|
|
300,048 |
|
|
|
295,735 |
|
|
Total net sales |
|
|
2,193,068 |
|
|
|
2,144,051 |
|
|
Costs of goods sold: |
|
|
|
|
|
|
|
|
|
Products |
|
|
1,721,258 |
|
|
|
1,670,238 |
|
|
Services |
|
|
140,336 |
|
|
|
148,477 |
|
|
Total costs of goods sold |
|
|
1,861,594 |
|
|
|
1,818,715 |
|
|
Gross profit |
|
|
331,474 |
|
|
|
325,336 |
|
|
Operating expenses: |
|
|
|
|
|
|
|
|
|
Selling and administrative expenses |
|
|
271,190 |
|
|
|
268,863 |
|
|
Severance and restructuring expenses, net |
|
|
(6,740 |
) |
|
|
2,144 |
|
|
Acquisition and integration related expenses |
|
|
— |
|
|
|
1,466 |
|
|
Earnings from operations |
|
|
67,024 |
|
|
|
52,863 |
|
|
Non-operating (income) expense: |
|
|
|
|
|
|
|
|
|
Interest expense, net |
|
|
9,969 |
|
|
|
11,826 |
|
|
Other expense (income), net |
|
|
388 |
|
|
|
(1,563 |
) |
|
Earnings before income taxes |
|
|
56,667 |
|
|
|
42,600 |
|
|
Income tax expense |
|
|
13,499 |
|
|
|
8,639 |
|
|
Net earnings |
|
$ |
43,168 |
|
|
$ |
33,961 |
|
|
|
|
|
|
|
|
|
|
|
|
Net earnings per share: |
|
|
|
|
|
|
|
|
|
Basic |
|
$ |
1.23 |
|
|
$ |
0.96 |
|
|
Diluted |
|
$ |
1.18 |
|
|
$ |
0.95 |
|
|
|
|
|
|
|
|
|
|
|
|
Shares used in per share calculations: |
|
|
|
|
|
|
|
|
|
Basic |
|
|
35,199 |
|
|
|
35,233 |
|
|
Diluted |
|
|
36,699 |
|
|
|
35,646 |
|
- MORE -
|
Insight Enterprises, Inc. |
|
6820 South Harl Avenue |
|
Tempe, Arizona 85283 |
|
800.467.4448 |
|
FAX 480.760.8958 |
INSIGHT ENTERPRISES, INC. AND SUBSIDIARIES
Consolidated Balance Sheets
(In thousands)
(Unaudited)
|
|
|
March 31,
2021 |
|
|
December 31,
2020 |
|
|
ASSETS |
|
|
|
|
|
|
|
|
|
Current assets: |
|
|
|
|
|
|
|
|
|
Cash and cash equivalents |
|
$ |
138,753 |
|
|
$ |
128,313 |
|
|
Accounts receivable, net |
|
|
2,583,716 |
|
|
|
2,685,448 |
|
|
Inventories |
|
|
253,297 |
|
|
|
185,650 |
|
|
Other current assets |
|
|
177,927 |
|
|
|
177,039 |
|
|
Total current assets |
|
|
3,153,693 |
|
|
|
3,176,450 |
|
|
|
|
|
|
|
|
|
|
|
|
Property and equipment, net |
|
|
148,531 |
|
|
|
146,016 |
|
|
Goodwill |
|
|
429,757 |
|
|
|
429,368 |
|
|
Intangible assets, net |
|
|
239,833 |
|
|
|
246,915 |
|
|
Other assets |
|
|
282,793 |
|
|
|
311,983 |
|
|
|
|
$ |
4,254,607 |
|
|
$ |
4,310,732 |
|
|
|
|
|
|
|
|
|
|
|
|
LIABILITIES AND STOCKHOLDERS’ EQUITY |
|
|
|
|
|
|
|
|
|
Current liabilities: |
|
|
|
|
|
|
|
|
|
Accounts payable – trade |
|
$ |
1,460,172 |
|
|
$ |
1,461,312 |
|
|
Accounts payable – inventory financing facilities |
|
|
309,075 |
|
|
|
356,930 |
|
|
Accrued expenses and other current liabilities |
|
|
404,995 |
|
|
|
408,117 |
|
|
Current portion of long-term debt |
|
|
830 |
|
|
|
1,105 |
|
|
Total current liabilities |
|
|
2,175,072 |
|
|
|
2,227,464 |
|
|
|
|
|
|
|
|
|
|
|
|
Long-term debt |
|
|
416,401 |
|
|
|
437,581 |
|
|
Deferred income taxes |
|
|
33,963 |
|
|
|
33,209 |
|
|
Other liabilities |
|
|
246,005 |
|
|
|
270,049 |
|
|
|
|
|
2,871,441 |
|
|
|
2,968,303 |
|
|
Stockholders’ equity: |
|
|
|
|
|
|
|
|
|
Preferred stock |
|
|
— |
|
|
|
— |
|
|
Common stock |
|
|
353 |
|
|
|
351 |
|
|
Additional paid-in capital |
|
|
361,935 |
|
|
|
364,288 |
|
|
Retained earnings |
|
|
1,036,413 |
|
|
|
993,245 |
|
|
Accumulated other comprehensive loss – foreign currency
translation adjustments |
|
|
(15,535 |
) |
|
|
(15,455 |
) |
|
Total stockholders’ equity |
|
|
1,383,166 |
|
|
|
1,342,429 |
|
|
|
|
$ |
4,254,607 |
|
|
$ |
4,310,732 |
|
- MORE -
|
Insight Enterprises, Inc. |
|
6820 South Harl Avenue |
|
Tempe, Arizona 85283 |
|
800.467.4448 |
|
FAX 480.760.8958 |
INSIGHT ENTERPRISES, INC. AND SUBSIDIARIES
Consolidated Statements of Cash Flows
(In thousands)
(Unaudited)
|
|
|
Three Months Ended
March 31, |
|
|
|
|
2021 |
|
|
2020 |
|
|
Cash flows from operating activities: |
|
|
|
|
|
|
|
|
|
Net earnings |
|
$ |
43,168 |
|
|
$ |
33,961 |
|
|
Adjustments to reconcile net earnings to net cash provided by
operating activities: |
|
|
|
|
|
|
|
|
|
Depreciation and amortization |
|
|
14,222 |
|
|
|
17,397 |
|
|
Provision for losses on accounts receivable |
|
|
2,178 |
|
|
|
3,136 |
|
|
Non-cash stock-based compensation |
|
|
4,716 |
|
|
|
4,409 |
|
|
Deferred income taxes |
|
|
643 |
|
|
|
(509 |
) |
|
Amortization of debt discount and issuance costs |
|
|
4,172 |
|
|
|
3,965 |
|
|
Other adjustments |
|
|
(7,617 |
) |
|
|
1,297 |
|
|
Changes in assets and liabilities: |
|
|
|
|
|
|
|
|
|
Decrease in accounts receivable |
|
|
93,485 |
|
|
|
22,648 |
|
|
Increase in inventories |
|
|
(67,946 |
) |
|
|
(48,332 |
) |
|
Decrease in other assets |
|
|
16,759 |
|
|
|
57,241 |
|
|
(Decrease) increase in accounts payable |
|
|
(25,315 |
) |
|
|
23,277 |
|
|
Decrease in accrued expenses and other liabilities |
|
|
(35,759 |
) |
|
|
(25,364 |
) |
|
Net cash provided by operating activities |
|
|
42,706 |
|
|
|
93,126 |
|
|
Cash flows from investing activities: |
|
|
|
|
|
|
|
|
|
Proceeds from sale of assets held for sale |
|
|
27,211 |
|
|
|
14,218 |
|
|
Purchases of property and equipment |
|
|
(7,847 |
) |
|
|
(7,382 |
) |
|
Acquisitions, net of cash and cash equivalents acquired |
|
|
— |
|
|
|
(6,406 |
) |
|
Net cash provided by investing activities |
|
|
19,364 |
|
|
|
430 |
|
|
Cash flows from financing activities: |
|
|
|
|
|
|
|
|
|
Borrowings on ABL revolving credit facility |
|
|
897,848 |
|
|
|
678,197 |
|
|
Repayments on ABL revolving credit facility |
|
|
(921,848 |
) |
|
|
(788,443 |
) |
|
Net repayments under inventory financing facilities |
|
|
(17,782 |
) |
|
|
(764 |
) |
|
Repurchases of treasury stock |
|
|
— |
|
|
|
(25,000 |
) |
|
Other payments |
|
|
(7,485 |
) |
|
|
(5,756 |
) |
|
Net cash used in financing activities |
|
|
(49,267 |
) |
|
|
(141,766 |
) |
|
Foreign currency exchange effect on cash, cash equivalents and
restricted cash balances |
|
|
(2,445 |
) |
|
|
(3,615 |
) |
|
Increase (decrease) in cash, cash equivalents and restricted cash |
|
|
10,358 |
|
|
|
(51,825 |
) |
|
Cash, cash equivalents and restricted cash at beginning of period |
|
|
130,582 |
|
|
|
116,297 |
|
|
Cash, cash equivalents and restricted cash at end of period |
|
$ |
140,940 |
|
|
$ |
64,472 |
|
- MORE -
|
Insight Enterprises, Inc. |
|
6820 South Harl Avenue |
|
Tempe, Arizona 85283 |
|
800.467.4448 |
|
FAX 480.760.8958 |
INSIGHT ENTERPRISES, INC. AND SUBSIDIARIES
Reconciliation of GAAP to non-GAAP Financial Measures
(In thousands, except per share data)
(unaudited)
|
|
|
Three Months Ended
March 31, |
|
|
|
|
2021 |
|
|
2020 |
|
|
Adjusted Consolidated Earnings from Operations: |
|
|
|
|
|
|
|
|
|
GAAP consolidated EFO |
|
$ |
67,024 |
|
|
$ |
52,863 |
|
|
Amortization of intangible assets |
|
|
8,041 |
|
|
|
10,108 |
|
|
Other |
|
|
(6,740 |
) |
|
|
3,610 |
|
|
Adjusted non-GAAP consolidated EFO |
|
$ |
68,325 |
|
|
$ |
66,581 |
|
|
|
|
|
|
|
|
|
|
|
|
Adjusted Consolidated Net Earnings: |
|
|
|
|
|
|
|
|
|
GAAP consolidated net earnings |
|
$ |
43,168 |
|
|
$ |
33,961 |
|
|
Amortization of intangible assets |
|
|
8,041 |
|
|
|
10,108 |
|
|
Amortization of debt discount and issuance costs |
|
|
2,983 |
|
|
|
2,831 |
|
|
Other |
|
|
(6,740 |
) |
|
|
3,610 |
|
|
Income taxes on non-GAAP adjustments |
|
|
(919 |
) |
|
|
(4,160 |
) |
|
Adjusted non-GAAP consolidated net earnings |
|
$ |
46,533 |
|
|
$ |
46,350 |
|
|
|
|
|
|
|
|
|
|
|
|
Adjusted Diluted Earnings Per Share: |
|
|
|
|
|
|
|
|
|
GAAP diluted EPS |
|
$ |
1.18 |
|
|
$ |
0.95 |
|
|
Amortization of intangible assets |
|
|
0.22 |
|
|
|
0.28 |
|
|
Amortization of debt discount and issuance costs |
|
|
0.08 |
|
|
|
0.08 |
|
|
Other |
|
|
(0.18 |
) |
|
|
0.10 |
|
|
Income taxes on non-GAAP adjustments |
|
|
(0.03 |
) |
|
|
(0.11 |
) |
|
Impact of benefit from note hedge |
|
|
0.03 |
|
|
|
— |
|
|
Adjusted non-GAAP diluted EPS |
|
$ |
1.30 |
|
|
$ |
1.30 |
|
|
|
|
|
|
|
|
|
|
|
|
Shares used in diluted EPS calculation |
|
|
36,699 |
|
|
|
35,646 |
|
|
Impact of benefit from note hedge |
|
|
(1,039 |
) |
|
|
— |
|
|
Shares used in Adjusted non-GAAP diluted EPS calculation |
|
|
35,660 |
|
|
|
35,646 |
|
|
|
|
|
|
|
|
|
|
|
|
Adjusted North America Earnings from Operations: |
|
|
|
|
|
|
|
|
|
GAAP EFO from North America segment |
|
$ |
53,921 |
|
|
$ |
42,341 |
|
|
Amortization of intangible assets |
|
|
7,417 |
|
|
|
9,493 |
|
|
Other |
|
|
(7,238 |
) |
|
|
3,384 |
|
|
Adjusted non-GAAP EFO from North America segment |
|
$ |
54,100 |
|
|
$ |
55,218 |
|
|
|
|
|
|
|
|
|
|
|
|
Adjusted EMEA Earnings from Operations: |
|
|
|
|
|
|
|
|
|
GAAP EFO from EMEA segment |
|
$ |
10,090 |
|
|
$ |
8,320 |
|
|
Amortization of intangible assets |
|
|
496 |
|
|
|
506 |
|
|
Other |
|
|
498 |
|
|
|
210 |
|
|
Adjusted non-GAAP EFO from EMEA segment |
|
$ |
11,084 |
|
|
$ |
9,036 |
|
- MORE -
|
Insight Enterprises, Inc. |
|
6820 South Harl Avenue |
|
Tempe, Arizona 85283 |
|
800.467.4448 |
|
FAX 480.760.8958 |
INSIGHT ENTERPRISES, INC. AND SUBSIDIARIES
Reconciliation of GAAP to NON-GAAP Financial Measures (Continued)
(In thousands, except per share data)
(unaudited)
|
|
|
Three Months Ended
March 31, |
|
|
|
|
2021 |
|
|
2020 |
|
|
Adjusted APAC Earnings from Operations: |
|
|
|
|
|
|
|
|
|
GAAP EFO from APAC segment |
|
$ |
3,013 |
|
|
$ |
2,202 |
|
|
Amortization of intangible assets |
|
|
128 |
|
|
|
109 |
|
|
Other |
|
|
— |
|
|
|
16 |
|
|
Adjusted non-GAAP EFO from APAC segment |
|
$ |
3,141 |
|
|
$ |
2,327 |
|
|
|
|
|
|
|
|
|
|
|
|
Adjusted EBITDA: |
|
|
|
|
|
|
|
|
|
GAAP consolidated net earnings |
|
$ |
43,168 |
|
|
$ |
33,961 |
|
|
Interest expense |
|
|
10,086 |
|
|
|
11,918 |
|
|
Income tax expense |
|
|
13,499 |
|
|
|
8,639 |
|
|
Depreciation and amortization of property and equipment |
|
|
6,181 |
|
|
|
7,289 |
|
|
Amortization of intangible assets |
|
|
8,041 |
|
|
|
10,108 |
|
|
Non-cash stock-based compensation |
|
|
4,716 |
|
|
|
4,409 |
|
|
Other |
|
|
(6,740 |
) |
|
|
3,610 |
|
|
Adjusted non-GAAP EBITDA |
|
$ |
78,951 |
|
|
$ |
79,934 |
|
|
|
|
|
|
|
|
|
|
|
|
GAAP consolidated net earnings as a percentage of net sales |
|
|
2.0 |
% |
|
|
1.6 |
% |
|
Adjusted non-GAAP EBITDA as a percentage of net sales |
|
|
3.6 |
% |
|
|
3.7 |
% |
|
|
|
Twelve Months Ended
March 31, |
|
|
|
|
2021 |
|
|
2020 |
|
|
Adjusted return on invested capital: |
|
|
|
|
|
|
|
|
|
GAAP consolidated EFO |
|
$ |
285,736 |
|
|
$ |
236,418 |
|
|
Other |
|
|
2,928 |
|
|
|
21,508 |
|
|
Adjusted non-GAAP consolidated EFO* |
|
|
288,664 |
|
|
|
257,926 |
|
|
Income tax expense** |
|
|
75,053 |
|
|
|
67,061 |
|
|
Adjusted non-GAAP consolidated EFO, net of tax |
|
$ |
213,611 |
|
|
$ |
190,865 |
|
|
Average stockholders’ equity*** |
|
$ |
1,269,282 |
|
|
$ |
1,103,865 |
|
|
Average debt*** |
|
|
468,330 |
|
|
|
522,016 |
|
|
Average cash*** |
|
|
(111,766 |
) |
|
|
(110,957 |
) |
|
Invested Capital |
|
$ |
1,625,846 |
|
|
$ |
1,514,924 |
|
|
|
|
|
|
|
|
|
|
|
|
Adjusted non-GAAP ROIC (from GAAP consolidated EFO) **** |
|
|
13.01 |
% |
|
|
11.55 |
% |
|
Adjusted non-GAAP ROIC (from non-GAAP consolidated
EFO) ***** |
|
|
13.14 |
% |
|
|
12.60 |
% |
|
* |
The adjusted non-GAAP consolidated EFO amount used for the Adjusted non-GAAP ROIC calculation does not exclude amortization of intangible assets. This calculation remains consistent with the metric utilized in management’s compensation plan. |
|
** |
Assumed tax rate of 26.0%. |
|
*** |
Average of previous five quarters. |
|
**** |
Computed as GAAP consolidated EFO, net of tax of $74,291 and $61,469 for the twelve months ended March 31, 2021 and 2020, respectively, divided by invested capital. |
|
***** |
Computed as Adjusted non-GAAP consolidated EFO, net of tax, divided by invested capital. |
- ### -
|
Insight Enterprises, Inc. |
|
6820 South Harl Avenue |
|
Tempe, Arizona 85283 |
|
800.467.4448 |
|
FAX 480.760.8958 |

Insight Enterprises, Inc. First Quarter 2021
Earnings Conference Call and Webcast Exhibit 99.2
Agenda Disclosures
CEO Commentary
First Quarter 2021 Highlights
Solutions Focused
Commitment to Long-Term Priorities
Investing in Our Business
CFO Commentary
First Quarter 2021 Financial Highlights by Region
Cashflow and Debt Covenants
2021 Outlook
Closing Comments
Disclosures Safe harbor statement
This presentation includes “forward-looking statements” within the meaning of the Private Securities Litigation Reform Act of 1995 related to Insight’s plans and expectations. Statements that are not historical facts, including those related to Coronavirus strain (“COVID-19”), our future responses to and the impact of COVID-19 on our Company, our expectations about future financial results, our expectations regarding current supply constraints, future expected trends in the IT market and our opportunities for growth, are forward-looking statements. These forward-looking statements are subject to assumptions, risks and uncertainties which could cause actual results or future events to differ materially from such statements. The Company undertakes no obligation to update publicly or revise any of the forward-looking statements, except as otherwise required by law. More detailed information about risk factors is included in today’s press release and discussed in the Company’s most recently filed periodic reports and subsequent filings with the Securities and Exchange Commission.
Non-GAAP measures This presentation will reference certain non-GAAP financial information as ‘Adjusted’. A reconciliation of non-GAAP financial measures presented in this document to our actual GAAP results is attached to the back of this presentation and included in the press release issued today, which you may find on the Investor Relations section of our website at investor.insight.com.
Constant currency In some instances the Company refers to changes in net sales, gross profit and earnings from operations on a consolidated basis and in North America, EMEA and APAC excluding the effects of fluctuating foreign currency exchange rates. In computing these changes and percentages, the Company compares the current year amount as translated into U.S. dollars under the applicable accounting standards to the prior year amount in local currency translated into U.S. dollars utilizing the weighted average translation rate for the current period.
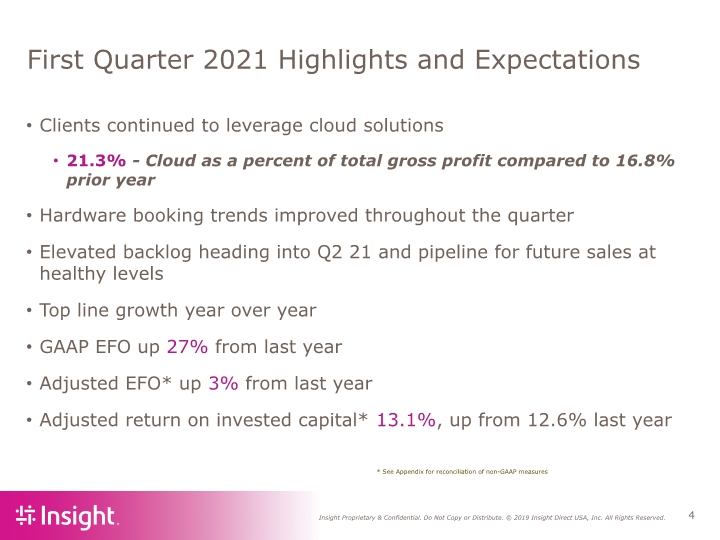
First Quarter 2021 Highlights and Expectations Clients continued to leverage cloud solutions
21.3% - Cloud as a percent of total gross profit compared to 16.8% prior year
Hardware booking trends improved throughout the quarter
Elevated backlog heading into Q2 21 and pipeline for future sales at healthy levels
Top line growth year over year
GAAP EFO up 27% from last year
Adjusted EFO* up 3% from last year
Adjusted return on invested capital* 13.1%, up from 12.6% last year
* See Appendix for reconciliation of non-GAAP measures
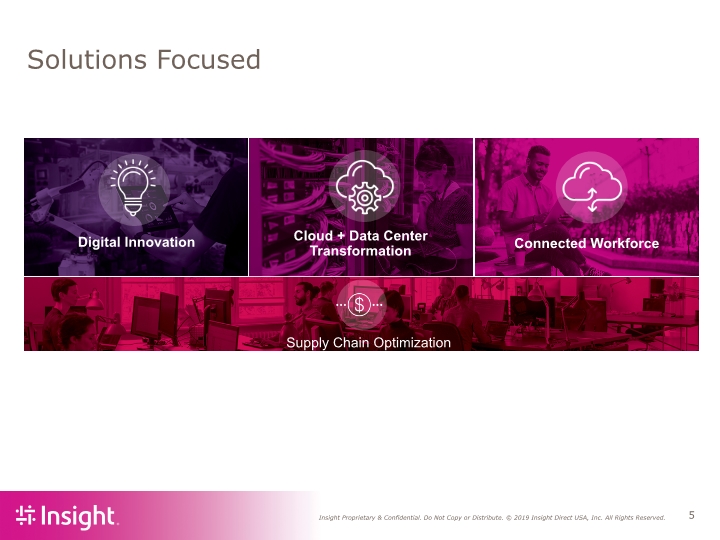
Solutions Focused
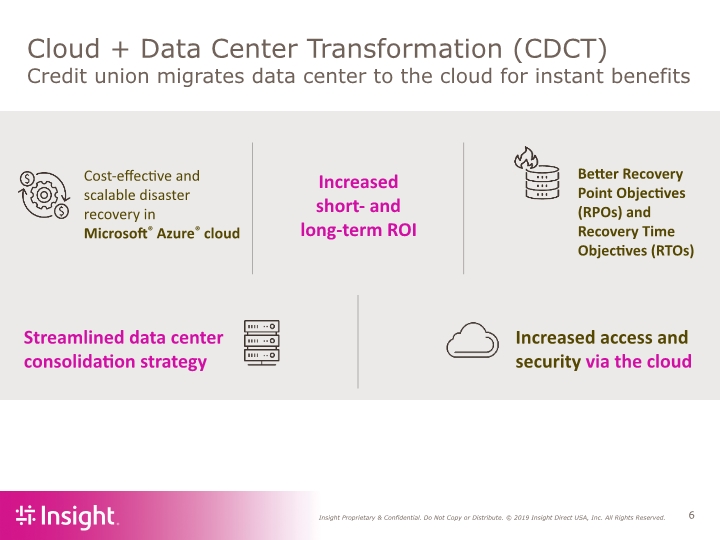
Cloud + Data Center Transformation (CDCT) Credit union migrates data center to the cloud for instant benefits Increased short- and long-term ROI
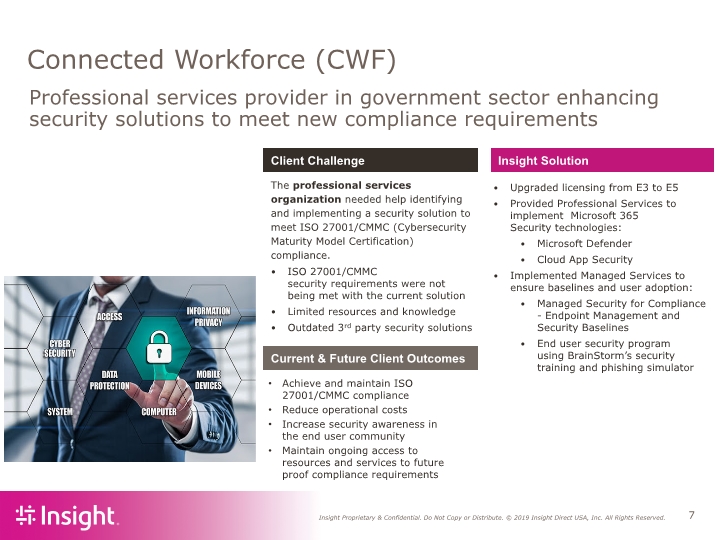
Connected Workforce (CWF) Client Challenge The professional services organization needed help identifying and implementing a security solution to meet ISO 27001/CMMC (Cybersecurity Maturity Model Certification) compliance.
ISO 27001/CMMC security requirements were not being met with the current solution
Limited resources and knowledge
Outdated 3rd party security solutions Upgraded licensing from E3 to E5
Provided Professional Services to implement Microsoft 365 Security technologies:
Microsoft Defender
Cloud App Security
Implemented Managed Services to ensure baselines and user adoption:
Managed Security for Compliance - Endpoint Management and Security Baselines
End user security program using BrainStorm’s security training and phishing simulator
Insight Solution Achieve and maintain ISO 27001/CMMC compliance
Reduce operational costs
Increase security awareness in the end user community
Maintain ongoing access to resources and services to future proof compliance requirements Current & Future Client Outcomes Professional services provider in government sector enhancing security solutions to meet new compliance requirements
Commitment to Long-Term Priorities Continue to innovate to capture market share in high growth areas
Develop and deliver solutions that drive better business outcomes for clients
Expand and scale business with strategic clients and end markets
Continue to optimize client experience
Maintain outlook for 2021 and long-term goals highlighted at 2019 Investor Day
Deliver on 5-year key initiatives*
Grow sales faster than the market at 8-10% CAGR
Expand EBITDA margin to 5.0-5.5%
Optimize return on invested capital to a range of 19-21%
Increase services gross profit as a % of total GP to between 50-52%
*5-year CAGR base year is 2019
Investing in Our Business to Fuel Growth Invest in critical areas with a goal to deliver best in class client experience and optimize infrastructure to scale future growth
Invest in sales and technical talent
Enhance scalable IT systems and processes
Leverage ecommerce platforms to target mid-market
Support as-a-service consumption models
Industry analysts expect low to mid-single digit growth
Backlog remains elevated
Supply constraints expected to continue through the balance of the year
We expect acceleration in back half of year will drive stronger top line growth
CFO Commentary First Quarter 2021 Financial Highlights by Region
Cashflow and Debt Covenants
2021 Outlook
First Quarter 2021 Highlights Net Sales of $2.2 billion
Gross margin 15.1%
SG&A down 2% year over year in constant currency, up 1% in US dollars
12.4% - GAAP SG&A as a percent of net sales
12.0% - Adjusted SG&A as a percent of net sales*
GAAP EFO of $67 million
Adjusted EFO* of $68 million
GAAP Diluted Earnings Per share $1.18
Adjusted Diluted Earnings Per Share* of $1.30
* See Appendix for reconciliation of non-GAAP measures
Q1 2021 Year over Year Results GAAP Earnings from operations $67M GAAP Diluted EPS $1.18 * See Appendix for reconciliation of non-GAAP measures
* See Appendix for reconciliation of non-GAAP measures Q1 2021 North America | Financial Results GAAP Earnings from operations $54M
* See Appendix for reconciliation of non-GAAP measures
** Reference “Constant currency” section on slide 3 of this presentation Q1 2021 EMEA | Financial Results GAAP Earnings from Operations $10M (in constant $**) (in constant $**) (in constant $**)
* See Appendix for reconciliation of non-GAAP measures
** Reference “Constant currency” section on slide 3 of this presentation Q1 2021 APAC | Financial Results (in constant $**) (in constant $**) GAAP Earnings from Operations $3M (in constant $**)
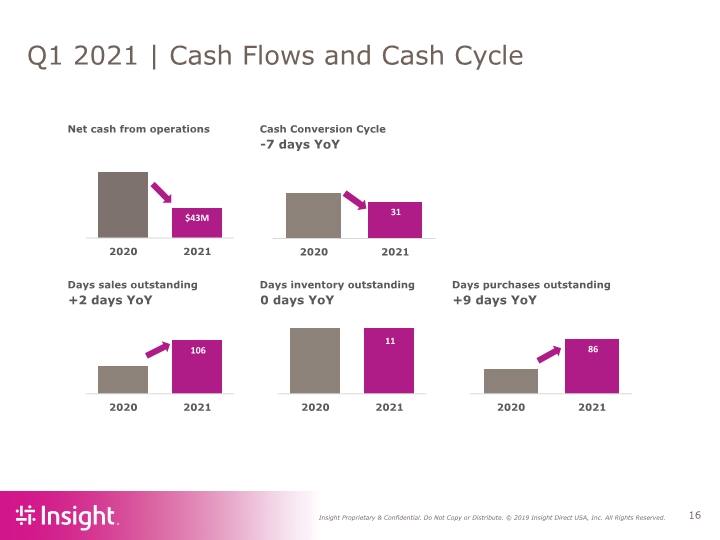
Q1 2021 | Cash Flows and Cash Cycle
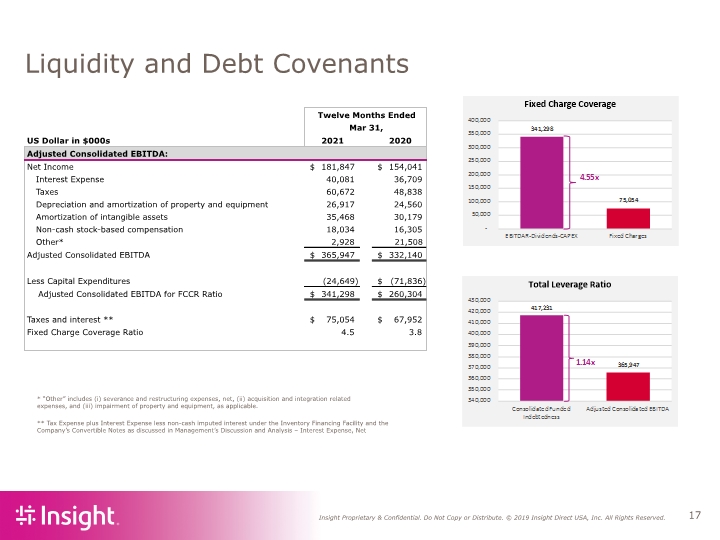
Liquidity and Debt Covenants ** Tax Expense plus Interest Expense less non-cash imputed interest under the Inventory Financing Facility and the Company’s Convertible Notes as discussed in Management’s Discussion and Analysis – Interest Expense, Net * “Other” includes (i) severance and restructuring expenses, net, (ii) acquisition and integration related expenses, and (iii) impairment of property and equipment, as applicable.
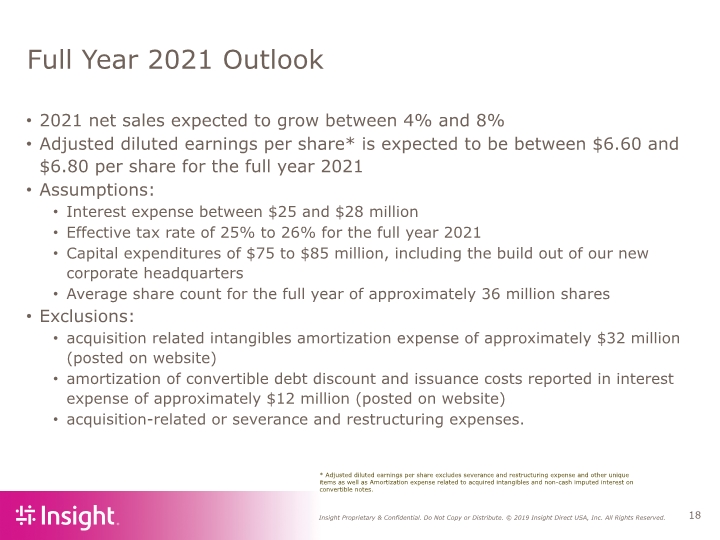
Full Year 2021 Outlook 2021 net sales expected to grow between 4% and 8%
Adjusted diluted earnings per share* is expected to be between $6.60 and $6.80 per share for the full year 2021
Assumptions:
Interest expense between $25 and $28 million
Effective tax rate of 25% to 26% for the full year 2021
Capital expenditures of $75 to $85 million, including the build out of our new corporate headquarters
Average share count for the full year of approximately 36 million shares
Exclusions:
acquisition related intangibles amortization expense of approximately $32 million (posted on website)
amortization of convertible debt discount and issuance costs reported in interest expense of approximately $12 million (posted on website)
acquisition-related or severance and restructuring expenses. * Adjusted diluted earnings per share excludes severance and restructuring expense and other unique items as well as Amortization expense related to acquired intangibles and non-cash imputed interest on convertible notes.

Commitment to ESG Insight’s values of Hunger, Heart, and Harmony are core to how our teammates treat one another, engage with those we work with every day, and improve the communities where we work and live.
2021 Corporate Citizenship Report
Best Employers for
Diversity Forbes
2021 World’s Most Admired Companies Fortune
2021

Appendix

Appendix – Reconciliation of GAAP to Non-GAAP Financial Measures* * Adjusted consolidated earnings from operations, Adjusted consolidated net earnings and Adjusted diluted earnings per share exclude (i) severance and restructuring expenses, (ii) certain acquisition and integration related expenses, (iii) amortization of intangible assets, and (iv) the tax effects of each of these items, as applicable. Adjusted consolidated net earnings and Adjusted diluted earnings per share also exclude amortization of debt discount and issuance costs associated with the issuance of the Company’s convertible senior notes due 2025.
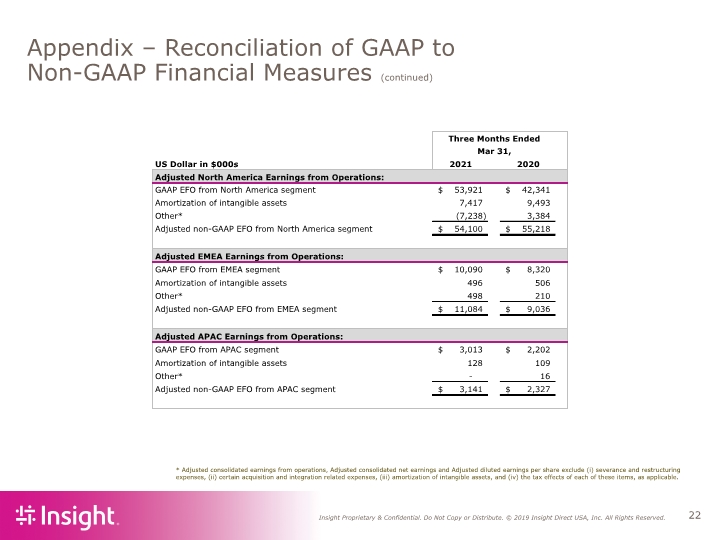
Appendix – Reconciliation of GAAP to Non-GAAP Financial Measures (continued) * Adjusted consolidated earnings from operations, Adjusted consolidated net earnings and Adjusted diluted earnings per share exclude (i) severance and restructuring expenses, (ii) certain acquisition and integration related expenses, (iii) amortization of intangible assets, and (iv) the tax effects of each of these items, as applicable.
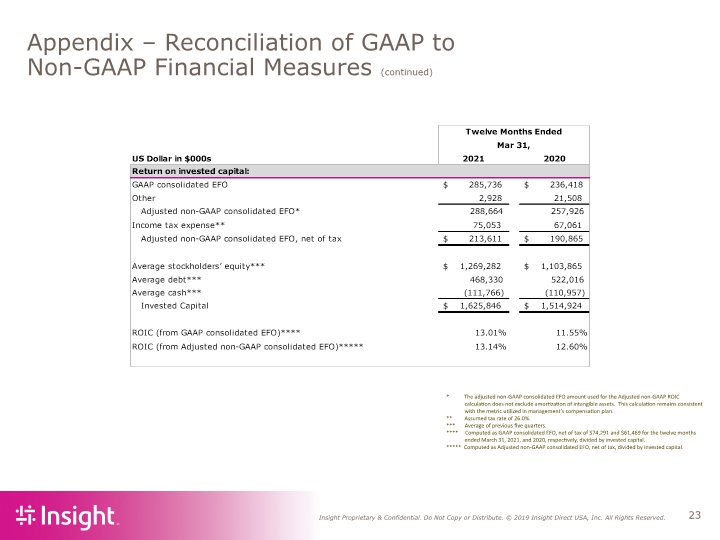
Appendix – Reconciliation of GAAP to Non-GAAP Financial Measures (continued)
* The adjusted non-GAAP consolidated EFO amount used for the Adjusted non-GAAP ROIC calculation does not exclude amortization of intangible assets. This calculation remains consistent with the metric utilized in management’s compensation plan.
** Assumed tax rate of 26.0%.
*** Average of previous five quarters.
**** Computed as GAAP consolidated EFO, net of tax of $74,291 and $61,469 for the twelve months ended March 31, 2021, and 2020, respectively, divided by invested capital.
***** Computed as Adjusted non-GAAP consolidated EFO, net of tax, divided by invested capital.
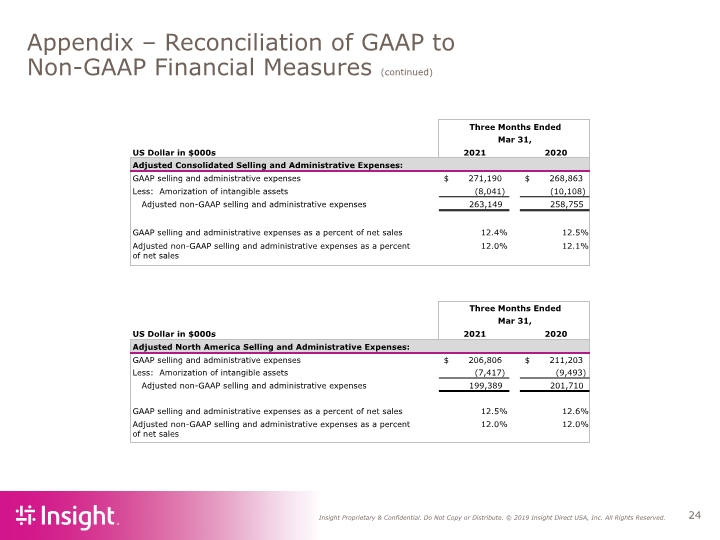
Appendix – Reconciliation of GAAP to Non-GAAP Financial Measures (continued)
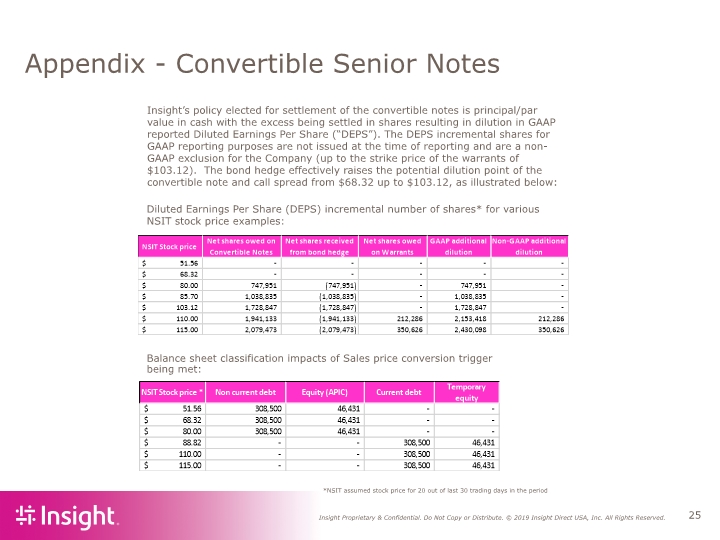
Appendix - Convertible Senior Notes *NSIT assumed stock price for 20 out of last 30 trading days in the period
Diluted Earnings Per Share (DEPS) incremental number of shares* for various NSIT stock price examples: Insight’s policy elected for settlement of the convertible notes is principal/par value in cash with the excess being settled in shares resulting in dilution in GAAP reported Diluted Earnings Per Share (“DEPS”). The DEPS incremental shares for GAAP reporting purposes are not issued at the time of reporting and are a non-GAAP exclusion for the Company (up to the strike price of the warrants of $103.12). The bond hedge effectively raises the potential dilution point of the convertible note and call spread from $68.32 up to $103.12, as illustrated below: Balance sheet classification impacts of Sales price conversion trigger being met:
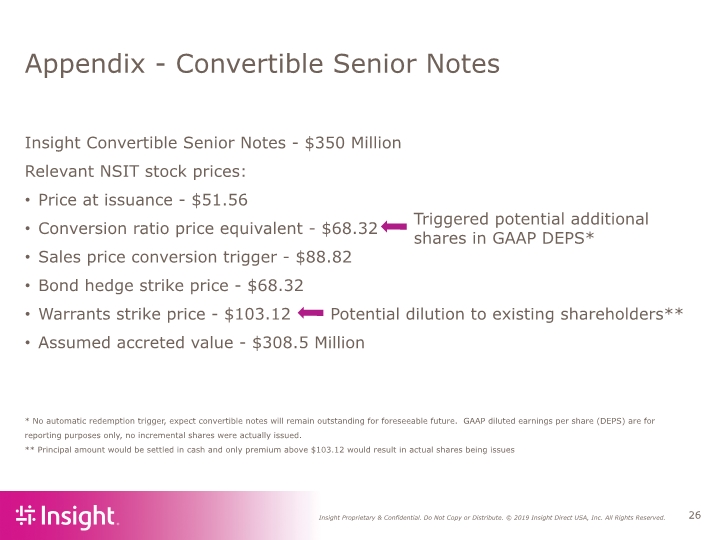
Appendix - Convertible Senior Notes * No automatic redemption trigger, expect convertible notes will remain outstanding for foreseeable future. GAAP diluted earnings per share (DEPS) are for reporting purposes only, no incremental shares were actually issued.
** Principal amount would be settled in cash and only premium above $103.12 would result in actual shares being issues
Insight Convertible Senior Notes - $350 Million
Relevant NSIT stock prices:
Price at issuance - $51.56
Conversion ratio price equivalent - $68.32
Sales price conversion trigger - $88.82
Bond hedge strike price - $68.32
Warrants strike price - $103.12 Potential dilution to existing shareholders**
Assumed accreted value - $308.5 Million Triggered potential additional
shares in GAAP DEPS*