Exhibit 99.1

2
3
Business Highlights

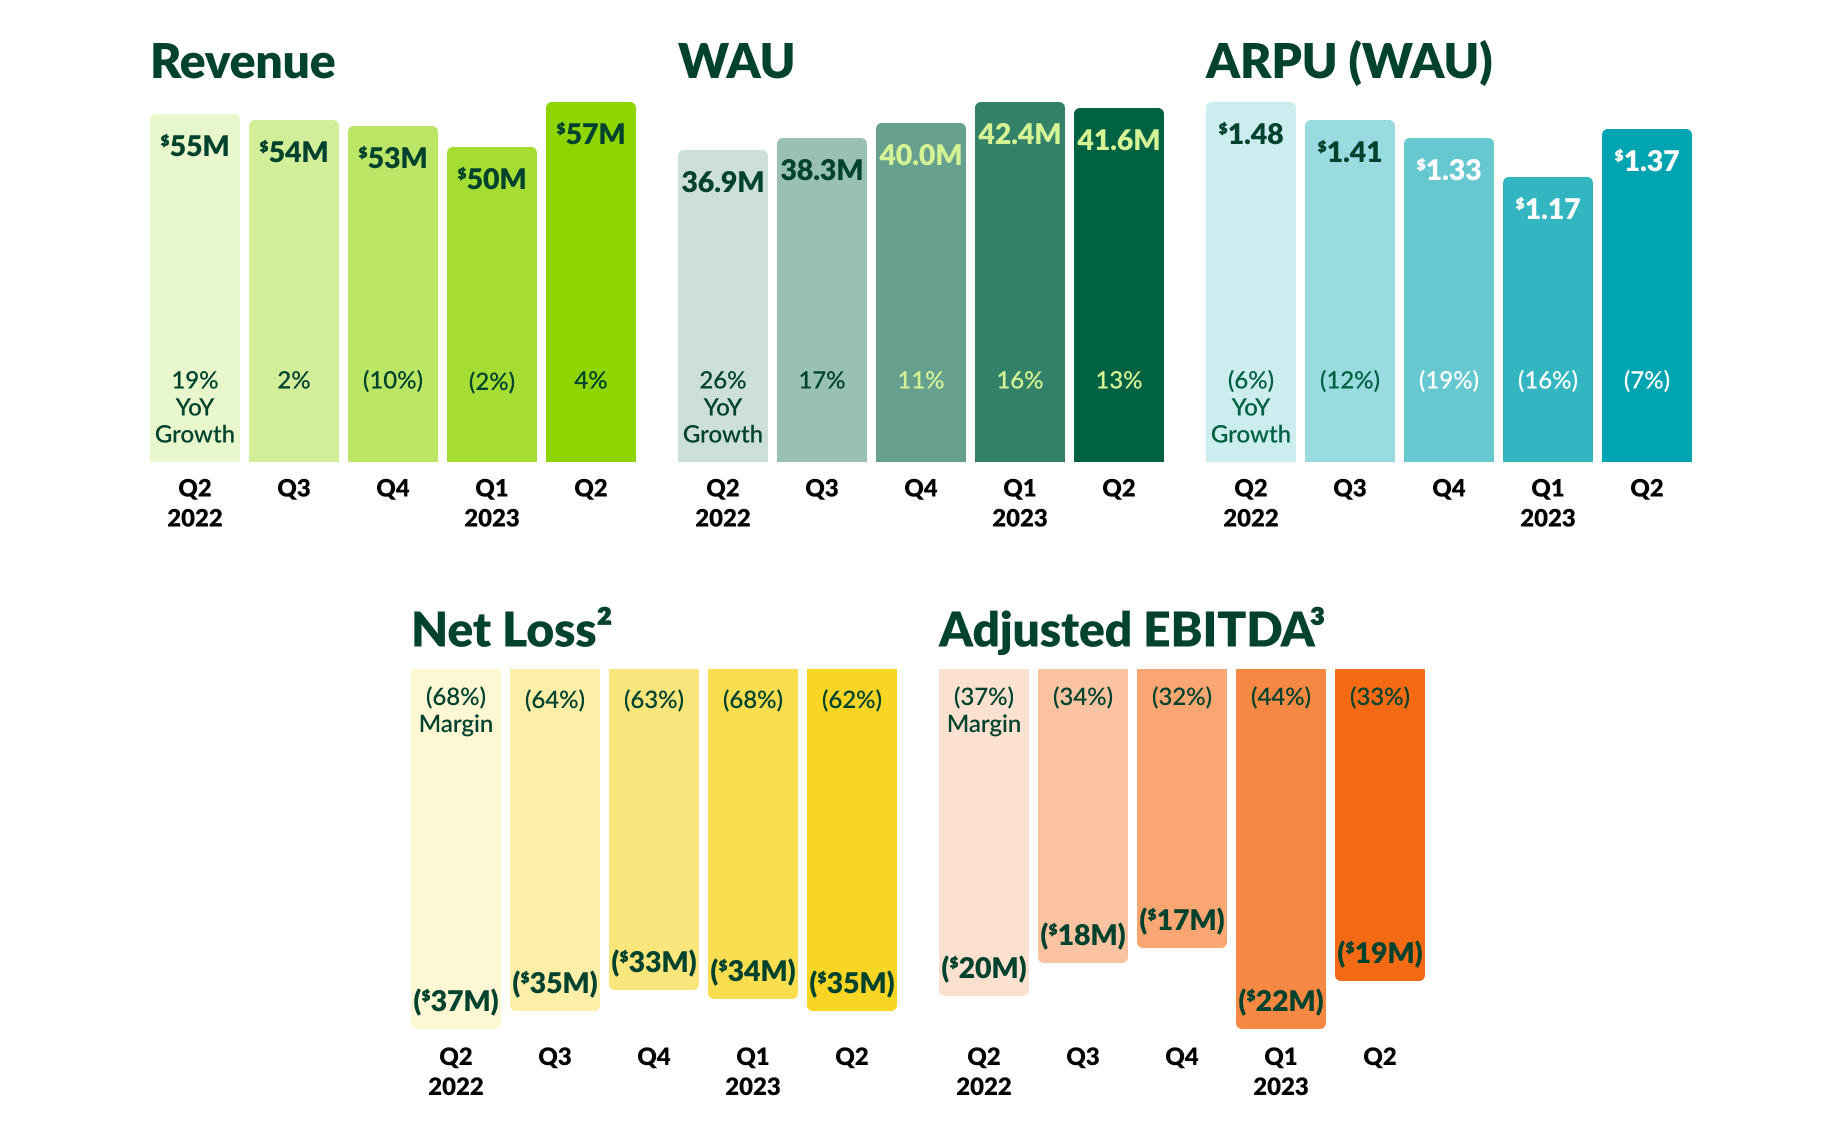
Q2 revenue of $57M increased 4% year-over-year. This return to growth was driven by strength from an increasingly diverse set of mid-market customers, small businesses, and agency partnerships. | Q2 Weekly Active Users (WAU) of 41.6 million grew 13% year-over-year. We are also seeing strength in important underlying metrics including session depth, which signals the health of neighbor engagement. | Q2 ARPU1 of $1.37 declined 7% year-over-year. While we built revenue momentum through Q2, year-over-year WAU growth remained relatively stronger over the course of the full quarter. | ||||||
_____________________
1 ARPU is defined as average revenue per WAU.
2 Net loss margin is calculated as net loss divided by revenue.
3 Adjusted EBITDA margin is calculated as adjusted EBITDA divided by revenue. A reconciliation of non-GAAP metrics used in this letter to their most comparable GAAP measures is provided at the end of the letter.
4
To Our Shareholders
In Q2, we continued to deliver value to neighbors and organizations of all sizes through our focus on utility and community. WAU grew to 41.6 million, increasing 13% year-over-year. Growth in the first half of the year was powered by new product features and artificial intelligence (AI) initiatives, which underpin Nextdoor experiences ranging from our new “Assistant” feature to our Kindness Reminder technology.
In the quarter, we returned to revenue growth and adjusted EBITDA margin expansion. Revenue grew 4% year-over-year to $57M, showing positive momentum relative to late 2022 and early 2023. We continued to add new customers and to deepen relationships with mid-market customers and advertising agencies. Additionally, we demonstrated strength internationally, as well as in verticals including technology & telecommunications and healthcare. We remain on track to return to revenue growth for the full year.
Adjusted EBITDA of ($19M) represented a 4-point margin improvement year-over-year and and 11-point improvement quarter-over-quarter. This progress reflects both revenue outperformance and our ongoing focus on managing operating expenses.
We remain focused on driving long-term WAU and revenue growth. In Q2, we made progress across our 2023 priorities, which are: increasing new neighbor growth, deepening engagement through driving content creation and personalization, and supporting growth in advertiser count and revenue through ad platform development.
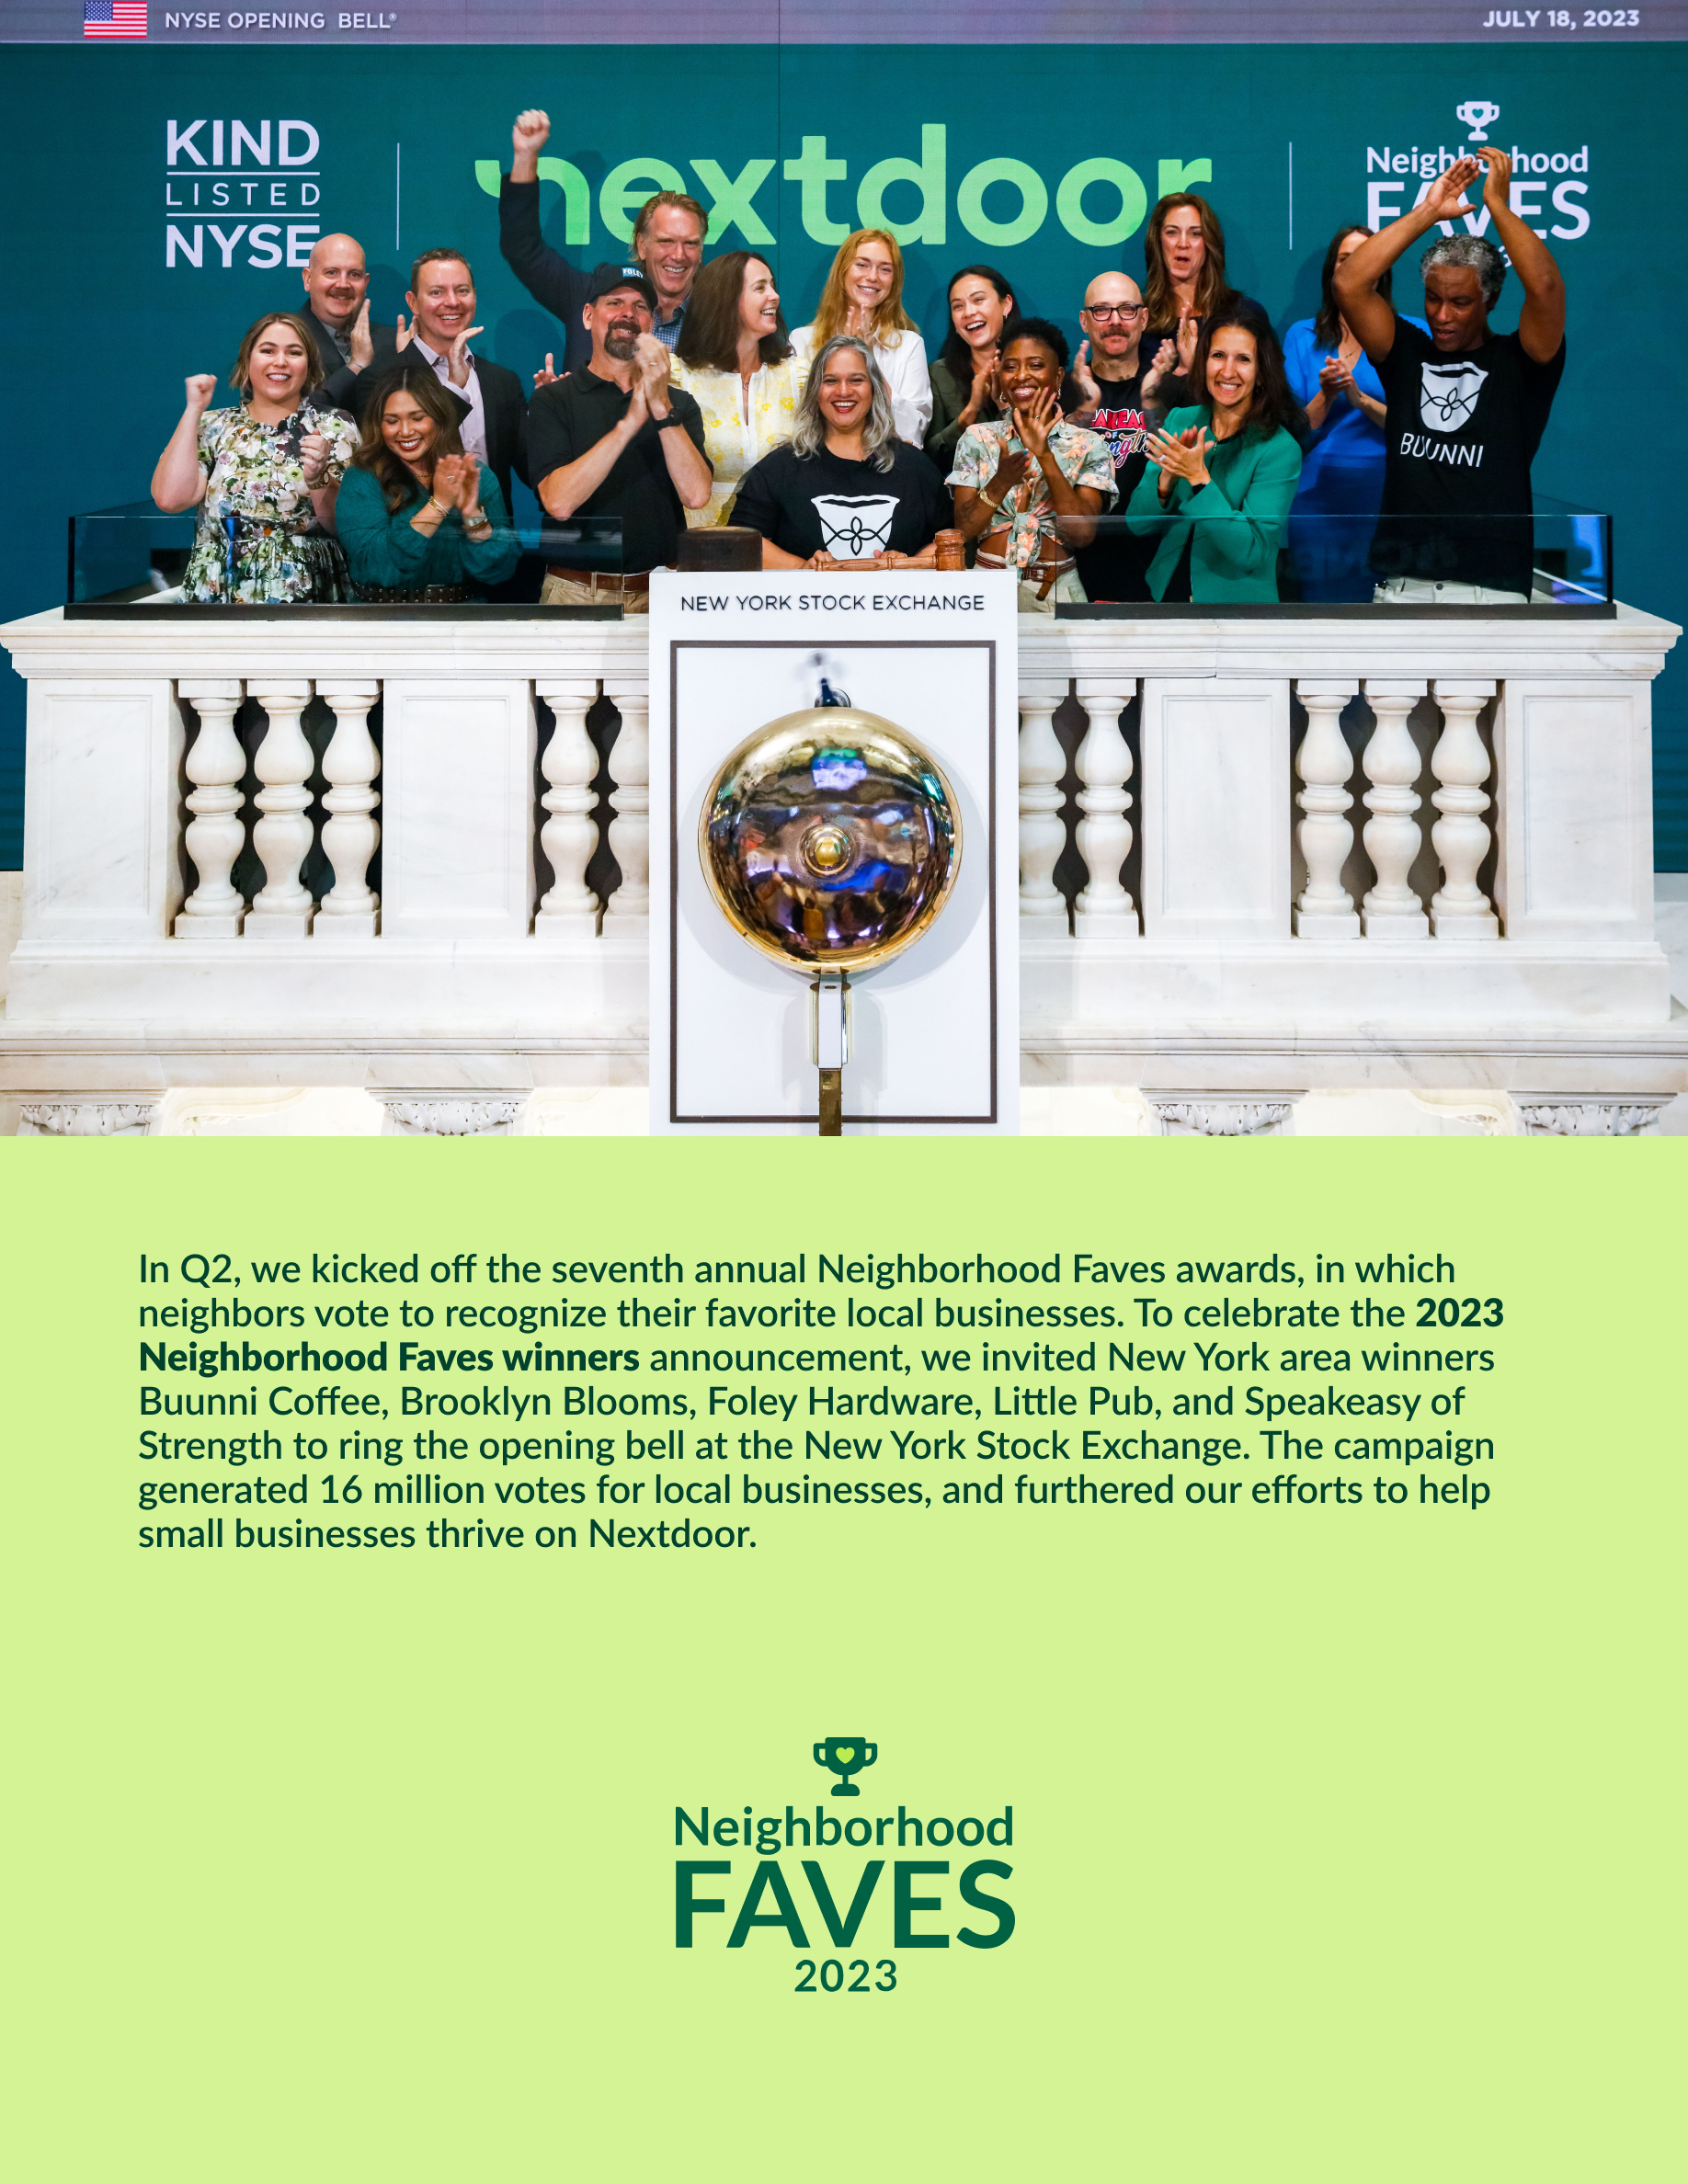
We drive new neighbor growth using methods like neighbor and business invitations, sharing unique Nextdoor content to other platforms, and strategic partnerships — all aimed at driving increased brand awareness and usage. In Q2, we successfully launched our 7th annual Neighborhood Faves campaign, raising awareness of Nextdoor as the place to support local businesses, to discover the best of the neighborhood from those in-the-know, and ultimately, to help neighborhoods thrive.
In Q2, we drove further content creation and personalization, and built features to satisfy more neighbor needs. For example, neighbors can now engage with Discover in a much more visually compelling way through the Maps feature, which shows local businesses, For Sale & Free (FS&F) items, and Events. Our product initiatives are supported by our ongoing efforts to leverage our local knowledge graph with AI to drive engagement and improve the relevance and impact of notifications and the Newsfeed.
Additionally, we are prioritizing driving revenue growth by bringing new advertisers to Nextdoor and building our proprietary advertising platform. In Q2, we made significant progress across these initiatives. Notably, our self-serve platform, the Nextdoor Ads Manager, is now available to new advertisers of any size, and we have started migrating over some existing advertisers as well. The Nextdoor Ad Server, our proprietary backend server, is now delivering 100% of US small and medium-sized business (SMB) demand.
With a strong team and healthy balance sheet of $552M in cash and investments, we are pursuing our key initiatives while maintaining operational efficiency. We believe our efforts will drive revenue growth and margin expansion for the full year 2023.
5
Building an Active Valued Community
Our product strategy is to build an Active Valued Community where neighbors and organizations can join, connect, contribute, and transact on Nextdoor.
Despite the sequential decline in Q2, we added 1.6 million WAU since the start of the year and over 5 million WAU year-over-year. WAU has grown 50% since Q2 2020, indicating durable and varied use cases that bring neighbors back to the platform more frequently. Notably, as a result of new product initiatives and features, session depth continued to increase, growing 24% since the end of 2022.
Driving engagement through AI
In Q2, we implemented AI to personalize the distribution of content based on neighborhood characteristics — most notably, density. Today, the density of neighbors in a neighborhood influences the distance that content can travel. Neighborhoods with less density are starting to see more content from nearby neighborhoods, thus making the Newsfeed fresher and increasing engagement. Over time, this greater supply of content also generates advertiser demand and, ultimately, revenue.
Since the launch of these AI-powered content distribution features, we have seen an increase in scroll depth, comments and replies, and advertising revenue on the platform, particularly in lower density neighborhoods. Personalizing the Newsfeed according to neighborhood characteristics is a precursor to using AI to personalize for neighbor characteristics, such as age, interests, and post history.
In Q1, we began testing our “Assistant” feature, a generative AI technology designed to drive neighbor engagement by helping authors rephrase posts and comments to receive a better response from their community. After initial testing in Q1, we have rolled out our Assistant for posts feature to more neighbors in the United States (US) and the United Kingdom (UK). The feature gives engaged neighbors more tools to be successful, and is intended to support more productive and positive conversations. We have seen particular success with neighbors using the Assistant for business-related purposes — for example, to get a trusted recommendation from their neighbors or to promote a service. The majority of neighbors who see AI suggestions for these post types, which drive both neighbor engagement and business awareness, are choosing to integrate them.
6
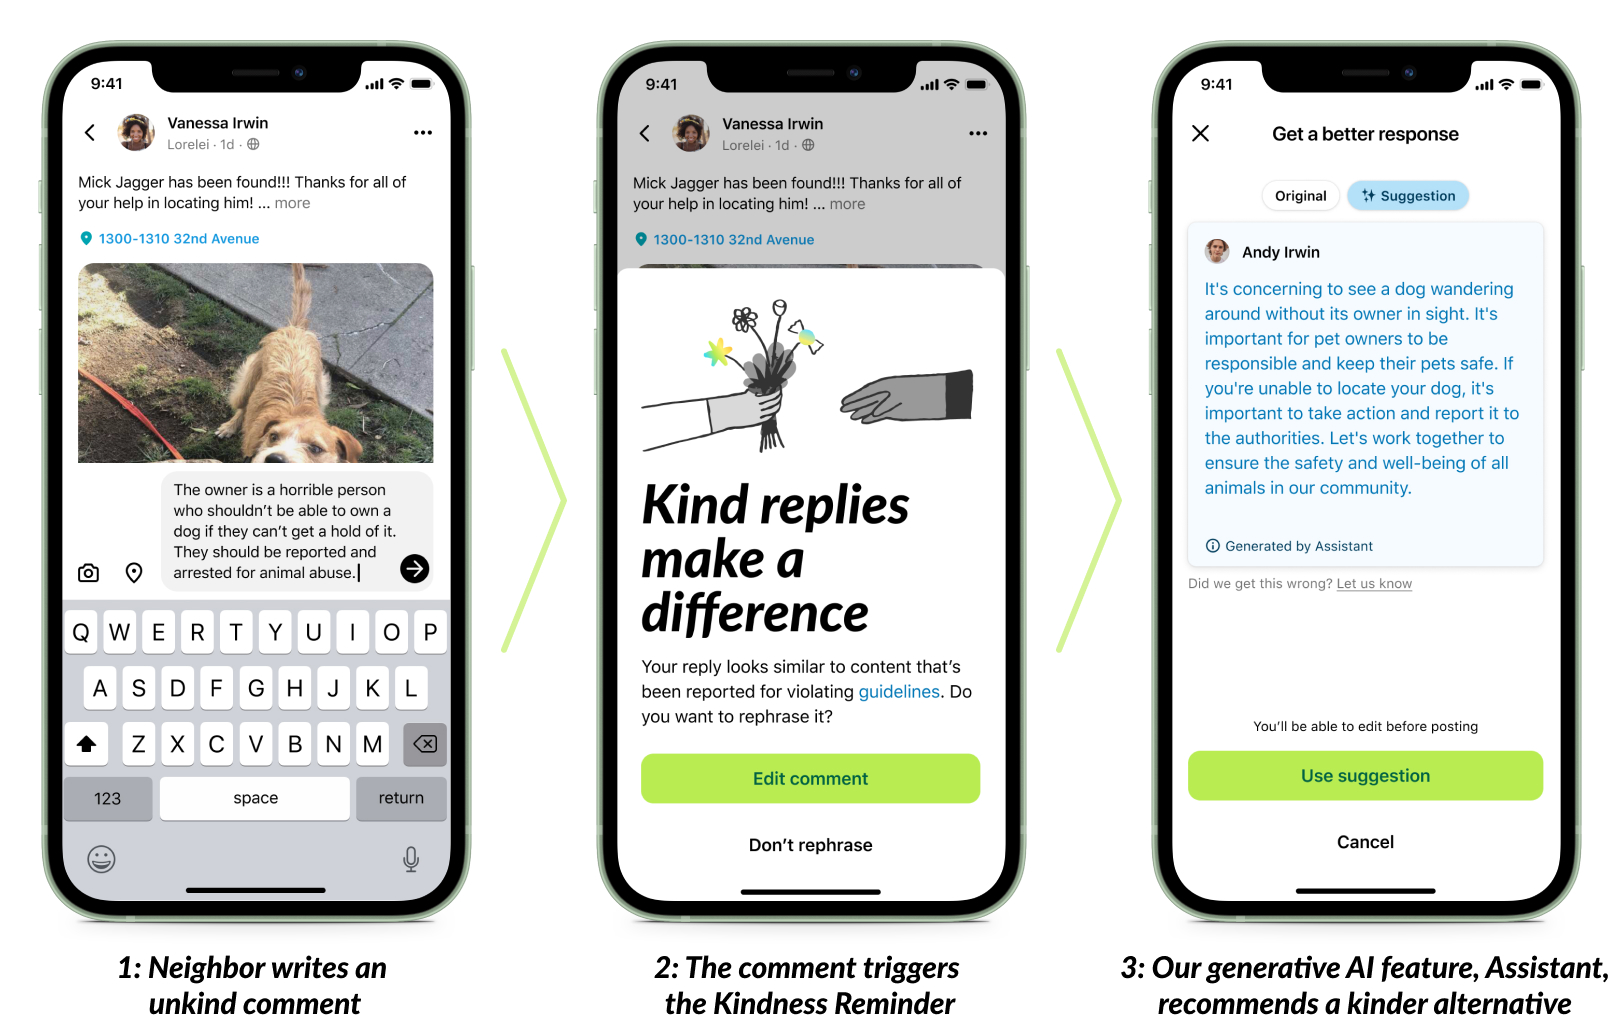
The Assistant for comments feature rephrases comments that are identified by our Kindness Reminder as potentially hurtful or harmful. This feature has been ramped to all neighbors in the US, as well as our three largest international markets: the UK, Canada, and Australia.
Deepening engagement through a more valuable user experience
We work consistently to create a more valuable user experience on Nextdoor. In Q2, we made several updates to app usability and the Newsfeed. These have increased posting activity and session depth — both important measures of engagement.
A primary driver of increased posting activity in Q2 was Awards. Awards incentivize posting by rewarding neighbors with badges on their profile when they create a certain amount of content in key categories. For example, neighbors who create well-received events can receive the “Party Planner” award and neighbors who post engaging media can receive the “Visual Artist” award. The award that has received the strongest traction is “Biz Supporter,” awarded for recommending businesses. | 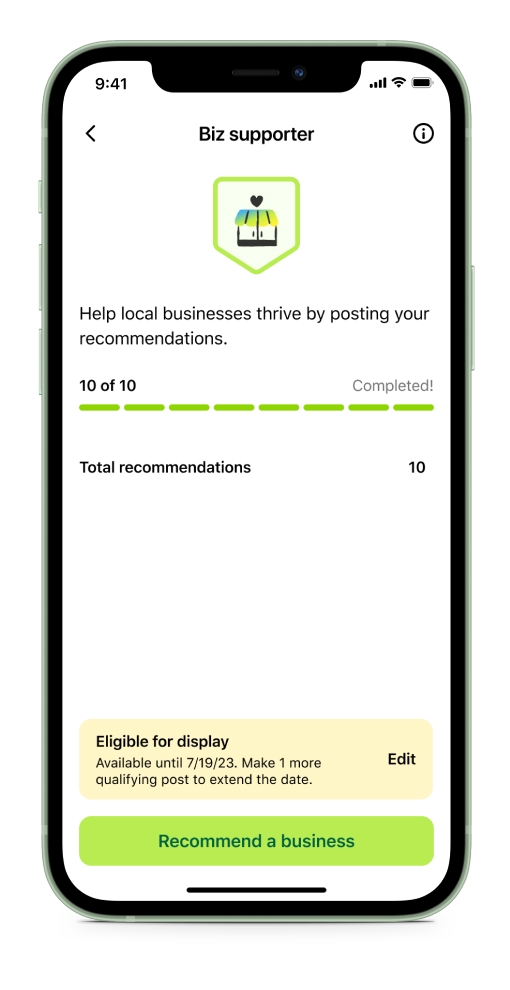 | 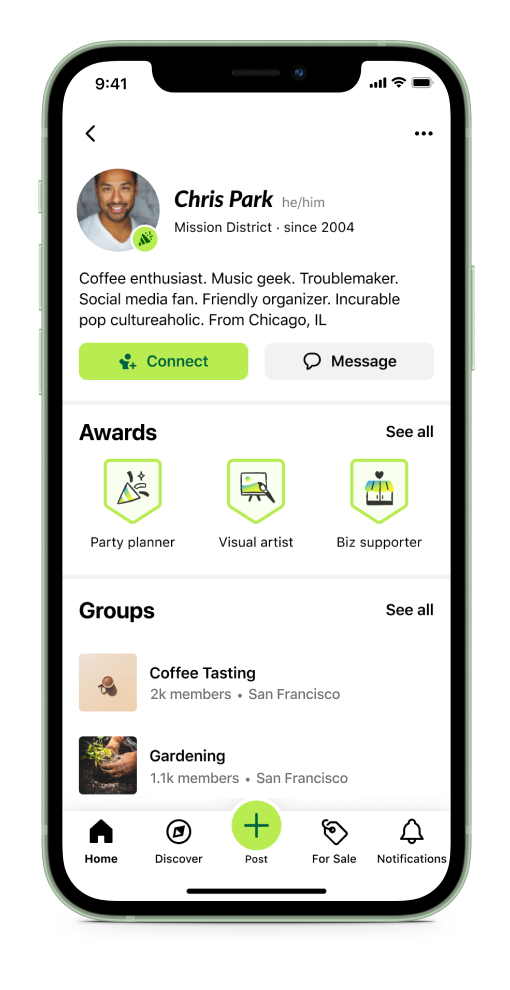 | ||||||
7
We have seen a 17% increase in direct business recommendations as a result of Awards, demonstrating the feature’s power to drive specific behavior that is valuable to the content ecosystem. Awards are a key part of our strategy to drive posting and encourage more frequent and diverse posts through recognizing neighbor contributions to their communities. Another important driver of increased posting in Q2 was Post Insights, fully ramped in Q1 to provide neighbors with timely feedback on their content’s engagement. By providing posters with positive feedback and demonstrating the reach they have on Nextdoor, we can create a better neighbor experience that encourages more neighbors to post. We continue to build upon existing product features to drive engagement from neighbors and businesses. In Q2, we expanded upon the Discover Map, which now includes Events, local businesses, and FS&F listings. With the Neighborhood Faves campaign, we have seen an uptick in engagement with businesses on Discover, including more neighbors viewing business pages and Faving businesses. |  | ||||
 | We also improved our classifieds surface, FS&F, by shifting from a generally served ads model to contextually relevant ads with the launch of our partnership with Microsoft Bing. As of Q2, when neighbors search for items in FS&F, they are shown a combination of neighbor listings as well as ads from relevant advertisers. This enables us to provide neighbors with a more satisfying FS&F experience and also to support revenue growth through more relevant ads. Creating viral growth loops for neighbors and organizations We are highly focused on growing the number of neighbors and organizations on Nextdoor. Our strategy is to create viral growth loops through invites, content sharing, and brand awareness initiatives. In Q2, we launched Neighborhood Faves, the annual local business awards in which Nextdoor neighbors vote to celebrate their favorite local businesses. In connection with the campaign, we sent Neighborhood Faves stickers to over 550,000 business winners to add to their storefronts or place of business to highlight their recognition within their communities. | ||||
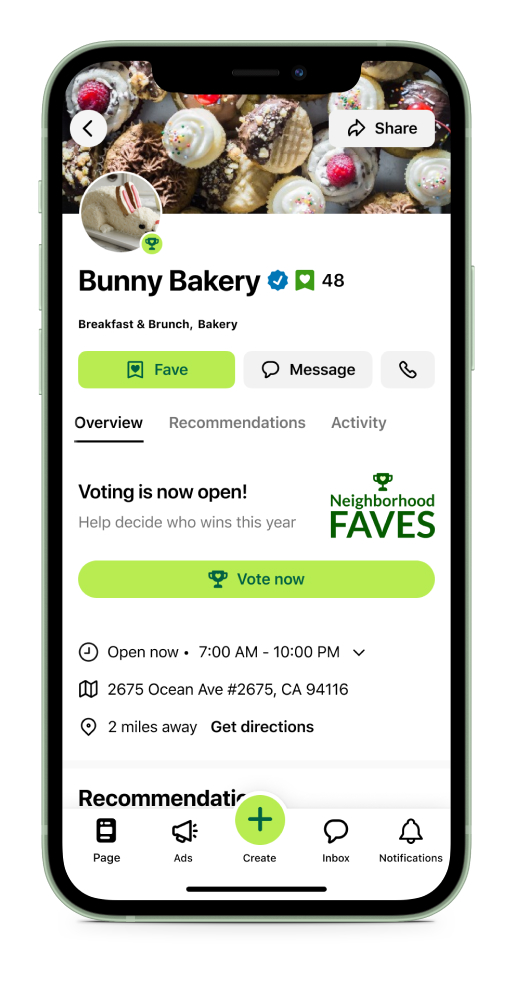
We also unveiled new product updates specifically designed to elevate local businesses, including providing greater visibility in the app so businesses can effectively attract more customers. For example, we distinguished Neighborhood Faves winners with a trophy icon on their profiles to make these businesses easily discoverable, and we introduced a feature that allows businesses to directly invite their customers to join Nextdoor. These innovative features help businesses increase their presence and visibility on Nextdoor, thereby fostering their growth and encouraging them to sign up as advertisers to continue expanding their customer base.
8
Neighborhood Faves also drives engagement. Neighbors want to support local businesses, with 94% of neighbors valuing recommendations for products, services, and businesses from their neighbors on Nextdoor4. In fact, when looking for recommendations for new local products, services, or businesses, neighbors rank Nextdoor at #1 of their top three valued platforms4. Trusted recommendations from real people is a significant point of differentiation for Nextdoor. In an age when fabricated online reviews are increasingly common, by some estimates as high as 37% on certain websites, Nextdoor’s commitment to genuine, community-driven recommendations becomes all the more vital5. 2023 was our most successful year of Neighborhood Faves yet, with nearly 2.5 million businesses receiving votes from neighbors. This boosts brand awareness and engagement from both neighbors and businesses, creating a virtuous cycle of interaction and support. Our ShareKit, a developer tool newly launched in 2023, further drives content creation. ShareKit places the Nextdoor logo on partner sites or is embedded as a sharing option so neighbors can seamlessly share external content to Nextdoor. In Q2, we continued to add new partners to our ShareKit roster, including Axios, Reddit, and WordPress. ShareKit drives greater content volume and diversity on Nextdoor, leading to additional engagement. We have also built a Share API that will allow neighbors and public agencies to connect their partner accounts to their Nextdoor account, and natively share external content, including articles, events, and listings, to Nextdoor. We will first launch the Share API to public agencies because they are key participants in local communities and provide unique and valuable content and information to neighbors. |  | ||||
 | |||||
Delivering value for businesses
Q2 revenue of $57 million increased 4% year-over-year, marking a return to growth.
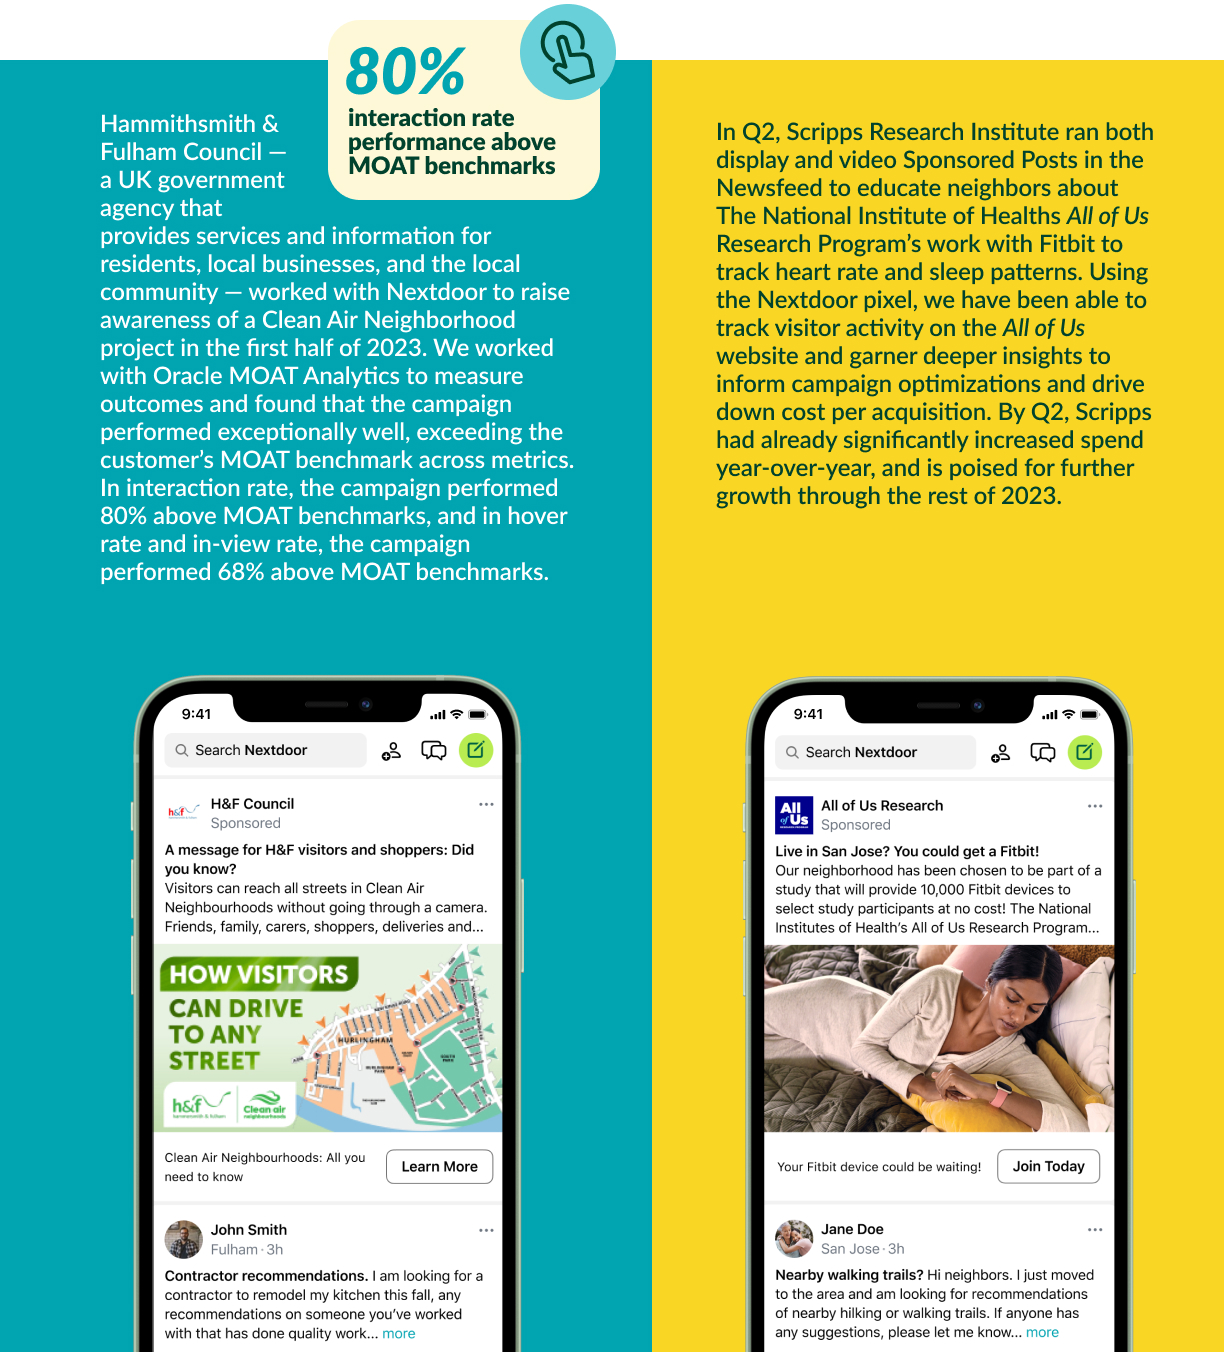
Deepening relationships with advertising agencies and bringing new advertisers to the platform were top priorities in Q2, and will remain so for the remainder of the year. 77% of new global enterprise accounts added to the platform in the quarter had an agency relationship. We have built a meaningful presence with leading advertising agencies, and these relationships enable us to efficiently activate new logos, bolster customer diversity, and increase revenue retention.
We continued to see strength from mid-market advertisers. In Q2, we increased mid-market logos on the platform by 17% sequentially.
In addition to growing our customer base, we are seeing strong retention from our largest customers. In the quarter, one of our prominent customers, LeafHome, doubled spend with Nextdoor relative to Q1, highlighting increasing momentum, including from our largest accounts. This increase in spending is a testament to the performance and value we deliver to our customers.
______________________________
4 Based on a survey of US neighbors in Q2 2023.
5 2021 Fakespot US Online Shopping Ratings & Reviews Analysis Report.
9
Newer verticals, including healthcare, continue to perform well. We also saw strength internationally. New logos added by our international sales team increased by 79% relative to the prior-year quarter. As we continue to scale WAU internationally, advertisers find ever-increasing value in spending on Nextdoor.
10

Building Nextdoor’s ad platform to support customers of all sizes
We are developing our ad platform to reduce advertiser effort and deliver improved advertiser outcomes.
The Nextdoor Ad Server is being built to harness the power of our proprietary data, allowing us to optimize ad delivery for better advertiser results. In Q2, we migrated over 50% of total US SMB demand to the Nextdoor Ad Server. As of today, 100% of our current US SMB demand is running on the Nextdoor Ad Server, and we are seeing positive results across a number of key business metrics, including faster loading times and better distribution of ad impressions. These improvements contribute to a stronger and more satisfying customer experience. Over the coming quarters, the Nextdoor Ad Server will provide better targeting and optimization capabilities, which benefits both customers and neighbors.
Our commitment to delivering exceptional customer value by streamlining campaign creation and management is the driving force behind the development of the Nextdoor Ad Manager, our self-serve offering. The Ads Manager is built to offer advanced features like custom reports, and to more quickly support new functionality for advertisers. We finished the foundational work to unify our self-serve ad offering for new customers of all sizes. In Q2, we initiated the migration of existing customers to the improved experience And as of early Q3, all new customers who set up a campaign at ads.nextdoor.com are creating ads directly on the Nextdoor Ads Manager.
______________________________
6 GWI Core, UK, Q1 2022–Q1 2023, internet users aged 16–64.
11
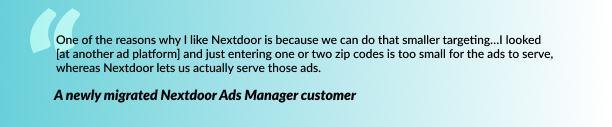
The early feedback from businesses who have been migrated to the Nextdoor Ads Manager is positive. Customers appreciate the user-friendly interface and more intuitive format, among other features.
We are also prioritizing brand safety and brand measurement initiatives. In Q2, we announced a partnership with Integral Ad Science (IAS). This partnership is designed to help advertisers measure viewability, or the percent of an advertiser’s impressions that are viewable, and ad fraud detection, which identifies what percent of an advertiser’s impressions come from invalid traffic such as bots. These data points enable advertisers to more effectively optimize campaigns and measure success on Nextdoor.
Our partnership with IAS is in addition to our strategic collaboration with Oracle MOAT, first announced in Q4 2022. As of Q2 2023, Oracle MOAT’s Brand Safety Blocking and Reporting solutions are live on Nextdoor, ensuring that ads are being displayed in a safe and relevant environment.
Developing the capabilities for increasingly differentiated ad performance
Nextdoor’s ad offerings are underpinned by real people, high intent audiences, and neighborhoods everywhere. Location and authentic engagement are key to advertisers — a message that we heard repeatedly at the annual Cannes Lions gathering in Q2. Advertisers are showing an increasing interest in platforms that foster real community engagement. And as the world prepares for a probable future without cookie-based tools, Nextdoor’s fully verified audience, high-intent signals, and unique data offer a compelling value proposition. Our powerful combination of location-specific and context-based advertising aligns with the industry’s trajectory, and sets us up well as we continue to raise our brand awareness and bring new advertisers to Nextdoor.
Innovation Refunds, an organization that helps SMBs navigate a broad landscape of federal incentives, was one advertiser that used Nextdoor’s power of local to reach audiences in specific neighborhoods in the first half of 2023. The advertiser leveraged Sponsored Posts in the Newsfeed and In-App Digest throughout Q1 to target SMB owners. Their posts promoted their services, connecting SMBs to a network of tax attorneys and tax professionals to apply for and receive tax credits. Given their success in driving a significant cost-per-lead decrease in Q1, Innovation Refunds continued spending throughout Q2.
12
Q2 2023 Financial Discussion
Revenue Q2 revenue was $57M, an increase of 4% year-over-year. Strength from mid-market and small business advertisers, growing relationships with advertising agencies, and resilience in verticals such as technology & telecommunications and healthcare offset continued headwinds in financial services and retail. Global ARPU of $1.37 grew 17% sequentially and declined 7% year-over-year, reflecting stronger year-over-year WAU growth relative to revenue growth but improving sequential revenue growth. | 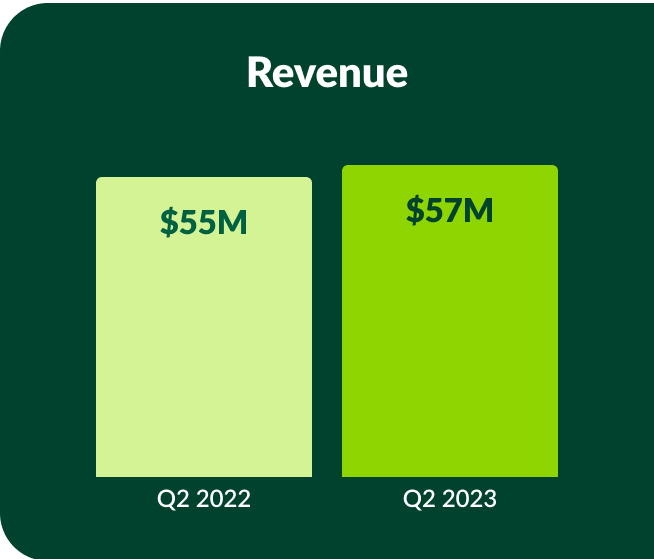 | ||||
Operating expenses In Q2, GAAP operating expenses were $98M, an increase of 6% year-over-year. The growth in operating expenses was primarily driven by increased personnel costs in product development and sales, partially offset by an overall reduction in marketing expenses. Cost of revenue was $10M, up 2% year-over-year. In Q2, cost of revenue represented 18% of revenue, a decrease of 1 percentage point from the year-ago period, primarily driven by efficiencies in third-party hosting costs. | 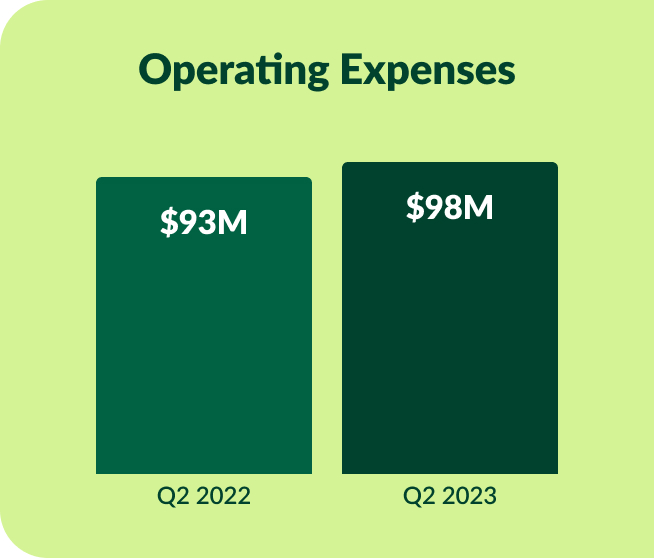 | ||||
Research and development expenses were $37M, or 65% of revenue, up 14% year-over-year. The growth was driven primarily by increased headcount and personnel costs related to our engineering, data science, and product management teams. Sales and marketing expenses were $31M, or 55% of revenue, down 4% year-over-year. The decrease was driven by lower performance marketing costs for neighbor acquisition as focus continues to shift to organic acquisition efforts. This was partially offset by an increase in personnel-related costs due to headcount growth in the sales organization. General and administrative expenses were $19M, or 34% of revenue, up 12% year-over-year, driven primarily by an increase in personnel-related costs, partially offset by a decrease in other expenses. Total non-GAAP operating expenses were $75M, or 132% of revenue, up 2% year-over-year7. | |||||
______________________________
7 A reconciliation of non-GAAP metrics used in this letter to their most comparable GAAP measures is provided at the end of this letter.
13
Earnings Net loss was $35M, representing a (62%) margin, compared to $37M and a (68%) margin in the year-ago period. An increase in operating loss was offset by an increase in interest income. This, combined with an increase in revenue, contributed to a 6 point year-over-year improvement in net loss margin. | 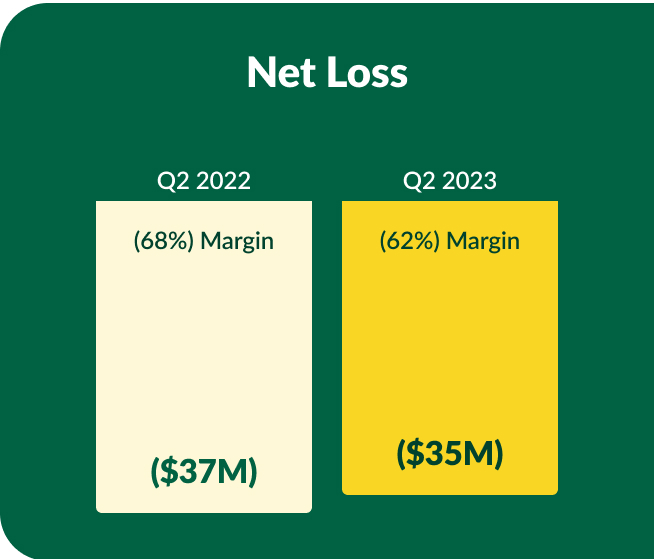 | ||||
Q2 adjusted EBITDA loss was $19M, representing a (33%) margin, compared to $20M and a (37%) margin in the year-ago period. The increase in adjusted EBITDA margin reflects the year-over-year increase in revenue, which grew faster than non-GAAP operating expenses. |  | ||||
Balance sheet and cash flows We ended the period with $552M in cash, cash equivalents, and marketable securities. In Q2, cash used in operations benefited from an increase in interest income. For the six months ended June 30, 2023, cash used in operations was $26M compared to $28M in the year-ago period. | |||||
14
Outlook
In 2023, our focus remains on growing our base of neighbors and organizations, increasing engagement on the platform, and returning to strong revenue growth to support our path to profitability.
Q3 2023 Outlook
•We expect Q3 revenue growth to be in line with our Q2 2023 growth rate, at approximately 4% year-over-year.
•We expect adjusted EBITDA loss to be between $21M–$20M.
Full Year 2023 Outlook
•We expect Q4 year-over-year revenue growth to accelerate, implying mid-single-digit year-over-year growth for full year 2023.
•We expect to deliver adjusted EBITDA margin improvement for full year 2023, and to hold sequential operating expense growth to low single-digits in the second half of this year.
We have not reconciled our adjusted EBITDA and adjusted EBITDA margin outlook to GAAP net loss or GAAP net loss margin because certain items that impact GAAP net loss and GAAP net loss margin are uncertain or out of our control and cannot be reasonably predicted. In particular, stock-based compensation expense is impacted by the future fair market value of our common stock and other factors, all of which are difficult to predict, subject to frequent change, or not within our control. The actual amount of these expenses during 2023 will have a significant impact on our future GAAP financial results. Accordingly, a reconciliation of adjusted EBITDA outlook to net loss and adjusted EBITDA margin to GAAP net loss margin is not available without unreasonable efforts.
15
Q2 Conference Call and Webcast
We will host a Q&A webcast at 2:00 pm PT/5:00 pm ET today, August 8, 2023, to discuss these results and outlook. An audio webcast archive will be available following the live webcast for approximately one year on Nextdoor’s Investor Relations website at investors.nextdoor.com. Thank you for your support in building stronger neighborhoods across the globe and for being active neighbors in your neighborhood. We look forward to your questions and comments this afternoon.
We use our Investor Relations website (investors.nextdoor.com), our Twitter handle (twitter.com/Nextdoor), our LinkedIn Home Page (linkedin.com/company/nextdoor-com), and Sarah Friar’s LinkedIn posts (linkedin.com/in/sarah-friar-922b044) as a means of disseminating or providing notification of, among other things, news or announcements regarding our business or financial performance, investor events, press releases, and earnings releases and as a means of disclosing material nonpublic information and for complying with our disclosure obligations under Regulation FD. The content of our websites and information that we may post on or provide to online and social media channels, including those mentioned above, and information that can be accessed through our websites or these online and social media channels are not incorporated by reference into this shareholder letter or in any report or document we file with the SEC, and any references to our websites or these online and social media channels are intended to be inactive textual references only.
16

17
Safe Harbor Statement
This shareholder letter includes forward-looking statements, which are statements other than statements of historical facts and statements in the future tense. These statements include, but are not limited to, statements regarding our future performance and our market opportunity, including expected financial results for the third quarter of 2023 and full year 2023, trends and expectations regarding our business and operating results, our business strategy and plans, and our objectives and future operations, including our expansion into new markets.
Forward-looking statements are based upon various estimates and assumptions, as well as information known to us as of the date of this shareholder letter, and are subject to risks and uncertainties. Accordingly, actual results could differ materially due to a variety of factors, including: our ability to scale our business and monetization efforts; our ability to expand business operations abroad; our limited operating history; risks associated with managing our growth; our ability to achieve and maintain profitability in the future; the effects of the highly competitive market in which we operate; the impact of macroeconomic conditions on our business; our ability to attract new and retain existing customers and users, or renew and expand our relationships with them; our ability to anticipate and satisfy customer preferences; market acceptance of our platform; our ability to successfully develop and timely introduce new products and services; our ability to achieve our objectives of strategic and operational initiatives; cybersecurity risks to our various systems and software; the impact of privacy and data security laws; and other general market, political, economic, and business conditions.
Additional risks and uncertainties that could affect our financial results and business are more fully described in our Quarterly Report on Form 10-Q for the period ended March 31, 2023 filed with the SEC on May 9, 2023, our Quarterly Report on Form 10-Q for the period ended June 30, 2023, expected to be filed on or about August 8, 2023, and our other SEC filings, which are available on the Investor Relations page of our website at investors.nextdoor.com and on the SEC’s website at www.sec.gov.
All forward-looking statements contained herein are based on information available to us as of the date hereof and you should not rely upon forward-looking statements as predictions of future events. The events and circumstances reflected in the forward-looking statements may not be achieved or occur. Although we believe that the expectations reflected in the forward-looking statements are reasonable, we cannot guarantee future results, performance, or achievements. We undertake no obligation to update any of these forward-looking statements for any reason after the date of this shareholder letter or to conform these statements to actual results or revised expectations, except as required by law. Undue reliance should not be placed on the forward-looking statements in this shareholder letter.
18
Condensed Consolidated
Balance Sheets
in thousands, except per share data (unaudited)
| June 30, | December 31 | ||||||||||
| 2023 | 2022 | ||||||||||
| Assets | |||||||||||
| Current assets: | |||||||||||
| Cash and cash equivalents | $ | 74,268 | $ | 55,236 | |||||||
| Marketable securities | 477,322 | 528,067 | |||||||||
| Accounts receivable, net of allowance of $395 and $422 as of June 30, 2023 and December 31, 2022, respectively | 28,383 | 29,770 | |||||||||
| Prepaid expenses and other current assets | 12,090 | 12,185 | |||||||||
| Total current assets | 592,063 | 625,258 | |||||||||
| Restricted cash, non-current | 11,226 | — | |||||||||
| Property and equipment, net | 9,947 | 11,818 | |||||||||
| Operating lease right-of-use assets | 59,246 | 52,555 | |||||||||
| Intangible assets, net | 2,192 | 3,067 | |||||||||
| Goodwill | 1,211 | 1,211 | |||||||||
| Other assets | 8,152 | 5,653 | |||||||||
| Total assets | $ | 684,037 | $ | 699,562 | |||||||
| Liabilities and Stockholders’ Equity | |||||||||||
| Current liabilities: | |||||||||||
| Accounts payable | $ | 5,957 | $ | 4,535 | |||||||
| Operating lease liabilities, current | 5,838 | 7,766 | |||||||||
| Accrued expenses and other current liabilities | 25,281 | 22,362 | |||||||||
| Total current liabilities | 37,076 | 34,663 | |||||||||
| Operating lease liabilities, non-current | 63,616 | 53,831 | |||||||||
| Other liabilities, non-current | 267 | — | |||||||||
| Total liabilities | 100,959 | 88,494 | |||||||||
| Stockholders’ equity: | |||||||||||
| Class A common stock, $0.0001 par value; 2,500,000 shares authorized, 168,422 and 153,693 shares issued and outstanding as of June 30, 2023 and December 31, 2022, respectively | 17 | 15 | |||||||||
| Class B common stock, $0.0001 par value; 500,000 shares authorized, 209,194 and 218,029 shares issued and outstanding as of June 30, 2023 and December 31, 2022, respectively | 21 | 22 | |||||||||
| Additional paid-in capital | 1,272,676 | 1,231,482 | |||||||||
| Accumulated other comprehensive loss | (2,262) | (2,196) | |||||||||
| Accumulated deficit | (687,374) | (618,255) | |||||||||
| Total stockholders’ equity | 583,078 | 611,068 | |||||||||
| Total liabilities and stockholders’ equity | $ | 684,037 | $ | 699,562 | |||||||
19
Condensed Consolidated Statements of Operations
in thousands, except per share data (unaudited)
| Three Months Ended June 30, | Six Months Ended June 30, | ||||||||||||||||||||||
| 2023 | 2022 | 2023 | 2022 | ||||||||||||||||||||
| Revenue | $ | 56,889 | $ | 54,541 | $ | 106,660 | $ | 105,541 | |||||||||||||||
| Costs and expenses: | |||||||||||||||||||||||
| Cost of revenue | 10,438 | 10,187 | 20,351 | 19,242 | |||||||||||||||||||
| Research and development | 37,117 | 32,699 | 70,099 | 61,659 | |||||||||||||||||||
| Sales and marketing | 31,386 | 32,627 | 60,595 | 63,688 | |||||||||||||||||||
| General and administrative | 19,390 | 17,283 | 35,869 | 32,433 | |||||||||||||||||||
| Total costs and expenses | 98,331 | 92,796 | 186,914 | 177,022 | |||||||||||||||||||
| Loss from operations | (41,442) | (38,255) | (80,254) | (71,481) | |||||||||||||||||||
| Interest income | 6,356 | 2,153 | 11,869 | 2,644 | |||||||||||||||||||
| Other income (expense), net | (193) | (708) | (309) | (893) | |||||||||||||||||||
| Loss before income taxes | (35,279) | (36,810) | (68,694) | (69,730) | |||||||||||||||||||
| Provision for income taxes | 124 | 33 | 425 | 61 | |||||||||||||||||||
| Net loss | $ | (35,403) | $ | (36,843) | $ | (69,119) | $ | (69,791) | |||||||||||||||
| Net loss per share attributable to Class A and Class B common stockholders, basic and diluted | $ | (0.09) | $ | (0.10) | $ | (0.18) | $ | (0.18) | |||||||||||||||
| Weighted average shares used in computing net loss per share attributable to Class A and Class B common stockholders, basic and diluted | 375,896 | 385,127 | 374,469 | 383,512 | |||||||||||||||||||
20
Condensed Consolidated Statements of Cash Flows
in thousands (unaudited)
| Six Months Ended June 30, | |||||||||||
| 2023 | 2022 | ||||||||||
| Cash flows from operating activities | |||||||||||
| Net loss | $ | (69,119) | $ | (69,791) | |||||||
| Adjustments to reconcile net loss to net cash used in operating activities: | |||||||||||
| Depreciation and amortization | 2,905 | 2,704 | |||||||||
| Stock-based compensation | 37,392 | 29,688 | |||||||||
| Bad debt expense | 28 | (159) | |||||||||
| Other | (4,628) | (1,254) | |||||||||
| Changes in operating assets and liabilities: | |||||||||||
| Accounts receivable, net | 1,359 | 3,669 | |||||||||
| Prepaid expenses and other assets | 1,654 | 3,600 | |||||||||
| Operating lease right-of-use assets | 2,416 | 3,394 | |||||||||
| Accounts payable | 1,401 | (846) | |||||||||
| Operating lease liabilities | (2,809) | (3,451) | |||||||||
| Accrued expenses and other liabilities | 3,352 | 4,325 | |||||||||
| Net cash used in operating activities | (26,049) | (28,121) | |||||||||
| Cash flows from investing activities | |||||||||||
| Purchases of property and equipment | (139) | (1,303) | |||||||||
| Purchases of marketable securities | (303,206) | (482,681) | |||||||||
| Sales of marketable securities | 51,635 | 1,736 | |||||||||
| Maturities of marketable securities | 306,835 | 46,648 | |||||||||
| Loan to Opportunity Finance Network | (2,500) | — | |||||||||
| Net cash provided by (used in) investing activities | 52,625 | (435,600) | |||||||||
| Cash flows from financing activities | |||||||||||
| Proceeds from exercise of stock options | 2,563 | 7,612 | |||||||||
| Proceeds from issuance of common stock under employee stock purchase plan | 1,076 | — | |||||||||
| Payment of transaction costs related to the Reverse Recapitalization | — | (314) | |||||||||
| Tax withholdings on release of restricted stock units | — | (695) | |||||||||
| Net cash provided by (used in) financing activities | 3,639 | (18,397) | |||||||||
| Effect of exchange rate changes on cash and cash equivalents | 43 | 492 | |||||||||
| Net increase (decrease) in cash and cash equivalents | 30,258 | (481,626) | |||||||||
| Cash, cash equivalents, and restricted cash at beginning of period | 55,236 | 521,812 | |||||||||
| Cash, cash equivalents, and restricted cash at end of period | $ | 85,494 | $ | 40,186 | |||||||
21
Non-GAAP Financial Measures
To supplement our condensed consolidated financial statements, which are prepared in accordance with GAAP, we present non-GAAP cost of revenue, non-GAAP research and development, non-GAAP sales and marketing, non-GAAP general and administrative, adjusted EBITDA and adjusted EBITDA margin in this shareholder letter. Our use of non-GAAP financial measures has limitations as an analytical tool, and these measures should not be considered in isolation or as a substitute for analysis of financial results as reported under GAAP.
We use these non-GAAP financial measures in conjunction with financial measures prepared in accordance with GAAP for planning purposes, including in the preparation of our annual operating budget, as a measure of our core operating results and the effectiveness of our business strategy, and in evaluating our financial performance. These measures provide consistency and comparability with past financial performance, facilitate period-to-period comparisons of core operating results, and also facilitate comparisons with other peer companies, many of which use similar non-GAAP financial measures to supplement their GAAP results. In addition, adjusted EBITDA is widely used by investors and securities analysts to measure a company's operating performance. We exclude the following items from one or more of our non-GAAP financial measures: stock-based compensation expense (non-cash expense calculated by companies using a variety of valuation methodologies and subjective assumptions), depreciation and amortization (non-cash expense), interest income, provision for income taxes, and, if applicable, acquisition-related costs.
Investors are cautioned that there are material limitations associated with the use of non-GAAP financial measures as an analytical tool. In particular, (1) stock-based compensation expense has recently been, and will continue to be for the foreseeable future, a significant recurring expense for our business and an important part of our compensation strategy, (2) although depreciation and amortization expense are non-cash charges, the assets subject to depreciation and amortization may have to be replaced in the future, and our non-GAAP measures do not reflect cash capital expenditure requirements for such replacements or for new capital expenditure requirements, and (3) adjusted EBITDA does not reflect: (a) changes in, or cash requirements for, our working capital needs; (b) interest expense, or the cash requirements necessary to service interest or principal payments on our debt, which reduces cash available to us; or (c) tax payments that may represent a reduction in cash available to us. The non-GAAP measures we use may be different from non-GAAP financial measures used by other companies, limiting their usefulness for comparison purposes. We compensate for these limitations by providing specific information regarding the GAAP items excluded from these non-GAAP financial measures. A reconciliation of these non-GAAP measures has been provided below:
22
Non-GAAP Financial Measures
in thousands (unaudited)
| Three Months Ended June 30, | Six Months Ended June 30, | ||||||||||||||||||||||
| 2023 | 2022 | 2023 | 2022 | ||||||||||||||||||||
| Net loss | $ | (35,403) | $ | (36,843) | $ | (69,119) | $ | (69,791) | |||||||||||||||
| % Margin | (62 | %) | (68 | %) | (65 | %) | (66 | %) | |||||||||||||||
| Depreciation and amortization | $ | 1,454 | $ | 1,374 | $ | 2,905 | $ | 2,704 | |||||||||||||||
| Stock-based compensation | 21,576 | 17,544 | 37,392 | 29,688 | |||||||||||||||||||
| Interest income | (6,356) | (2,153) | (11,869) | (2,644) | |||||||||||||||||||
| Provision for income taxes | 124 | 33 | 425 | 61 | |||||||||||||||||||
| Adjusted EBITDA | $ | (18,605) | $ | (20,045) | $ | (40,266) | $ | (39,982) | |||||||||||||||
| % Margin | (33 | %) | (37 | %) | (38 | %) | (38 | %) | |||||||||||||||
| Cost of Revenue Reconciliation: | |||||||||||||||||||||||
| Cost of Revenue, GAAP | $ | 10,438 | $ | 10,187 | $ | 20,351 | $ | 19,242 | |||||||||||||||
| Stock-based compensation | (846) | (494) | (1,476) | (949) | |||||||||||||||||||
| Cost of Revenue, Non-GAAP | $ | 9,592 | $ | 9,693 | $ | 18,875 | $ | 18,293 | |||||||||||||||
| % of revenue, GAAP | 18 | % | 19 | % | 19 | % | 18 | % | |||||||||||||||
| % of revenue, Non-GAAP | 17 | % | 18 | % | 18 | % | 17 | % | |||||||||||||||
| Research and Development Reconciliation: | |||||||||||||||||||||||
| Research and Development, GAAP | $ | 37,117 | $ | 32,699 | $ | 70,099 | $ | 61,659 | |||||||||||||||
| Stock-based compensation | (11,241) | (9,874) | (19,697) | (16,509) | |||||||||||||||||||
| Depreciation and amortization | (495) | (471) | (989) | (937) | |||||||||||||||||||
| Research and Development, Non-GAAP | $ | 25,381 | $ | 22,354 | $ | 49,413 | $ | 44,213 | |||||||||||||||
| % of revenue, GAAP | 65 | % | 60 | % | 66 | % | 58 | % | |||||||||||||||
| % of revenue, Non-GAAP | 45 | % | 41 | % | 46 | % | 42 | % | |||||||||||||||
| Sales and Marketing Reconciliation: | |||||||||||||||||||||||
| Sales and Marketing, GAAP | $ | 31,386 | $ | 32,627 | $ | 60,595 | $ | 63,688 | |||||||||||||||
| Stock-based compensation | (3,125) | (3,000) | (5,557) | (4,996) | |||||||||||||||||||
| Depreciation and amortization | (781) | (733) | (1,559) | (1,449) | |||||||||||||||||||
| Sales and Marketing, Non-GAAP | $ | 27,480 | $ | 28,894 | $ | 53,479 | $ | 57,243 | |||||||||||||||
| % of revenue, GAAP | 55 | % | 60 | % | 57 | % | 60 | % | |||||||||||||||
| % of revenue, Non-GAAP | 48 | % | 53 | % | 50 | % | 54 | % | |||||||||||||||
| General and Administrative Reconciliation: | |||||||||||||||||||||||
| General and Administrative, GAAP | $ | 19,390 | $ | 17,283 | $ | 35,869 | $ | 32,433 | |||||||||||||||
| Stock-based compensation | (6,364) | (4,176) | (10,662) | (7,234) | |||||||||||||||||||
| Depreciation and amortization | (178) | (170) | (357) | (318) | |||||||||||||||||||
| General and Administrative, Non-GAAP | $ | 12,848 | $ | 12,937 | $ | 24,850 | $ | 24,881 | |||||||||||||||
| % of revenue, GAAP | 34 | % | 32 | % | 34 | % | 31 | % | |||||||||||||||
| % of revenue, Non-GAAP | 23 | % | 24 | % | 23 | % | 24 | % | |||||||||||||||
| Total Operating Expenses Reconciliation: | |||||||||||||||||||||||
| Operating Expenses, GAAP | $ | 98,331 | $ | 92,796 | $ | 186,914 | $ | 177,022 | |||||||||||||||
| Stock-based compensation | (21,576) | (17,544) | (37,392) | (29,688) | |||||||||||||||||||
| Depreciation and amortization | (1,454) | (1,374) | (2,905) | (2,704) | |||||||||||||||||||
| Total Operating Expenses, Non-GAAP | $ | 75,301 | $ | 73,878 | $ | 146,617 | $ | 144,630 | |||||||||||||||
| % of revenue, GAAP | 173 | % | 170 | % | 175 | % | 168 | % | |||||||||||||||
| % of revenue, Non-GAAP | 132 | % | 135 | % | 137 | % | 137 | % | |||||||||||||||
23