Exhibit 99.1
1

2
Business Highlights

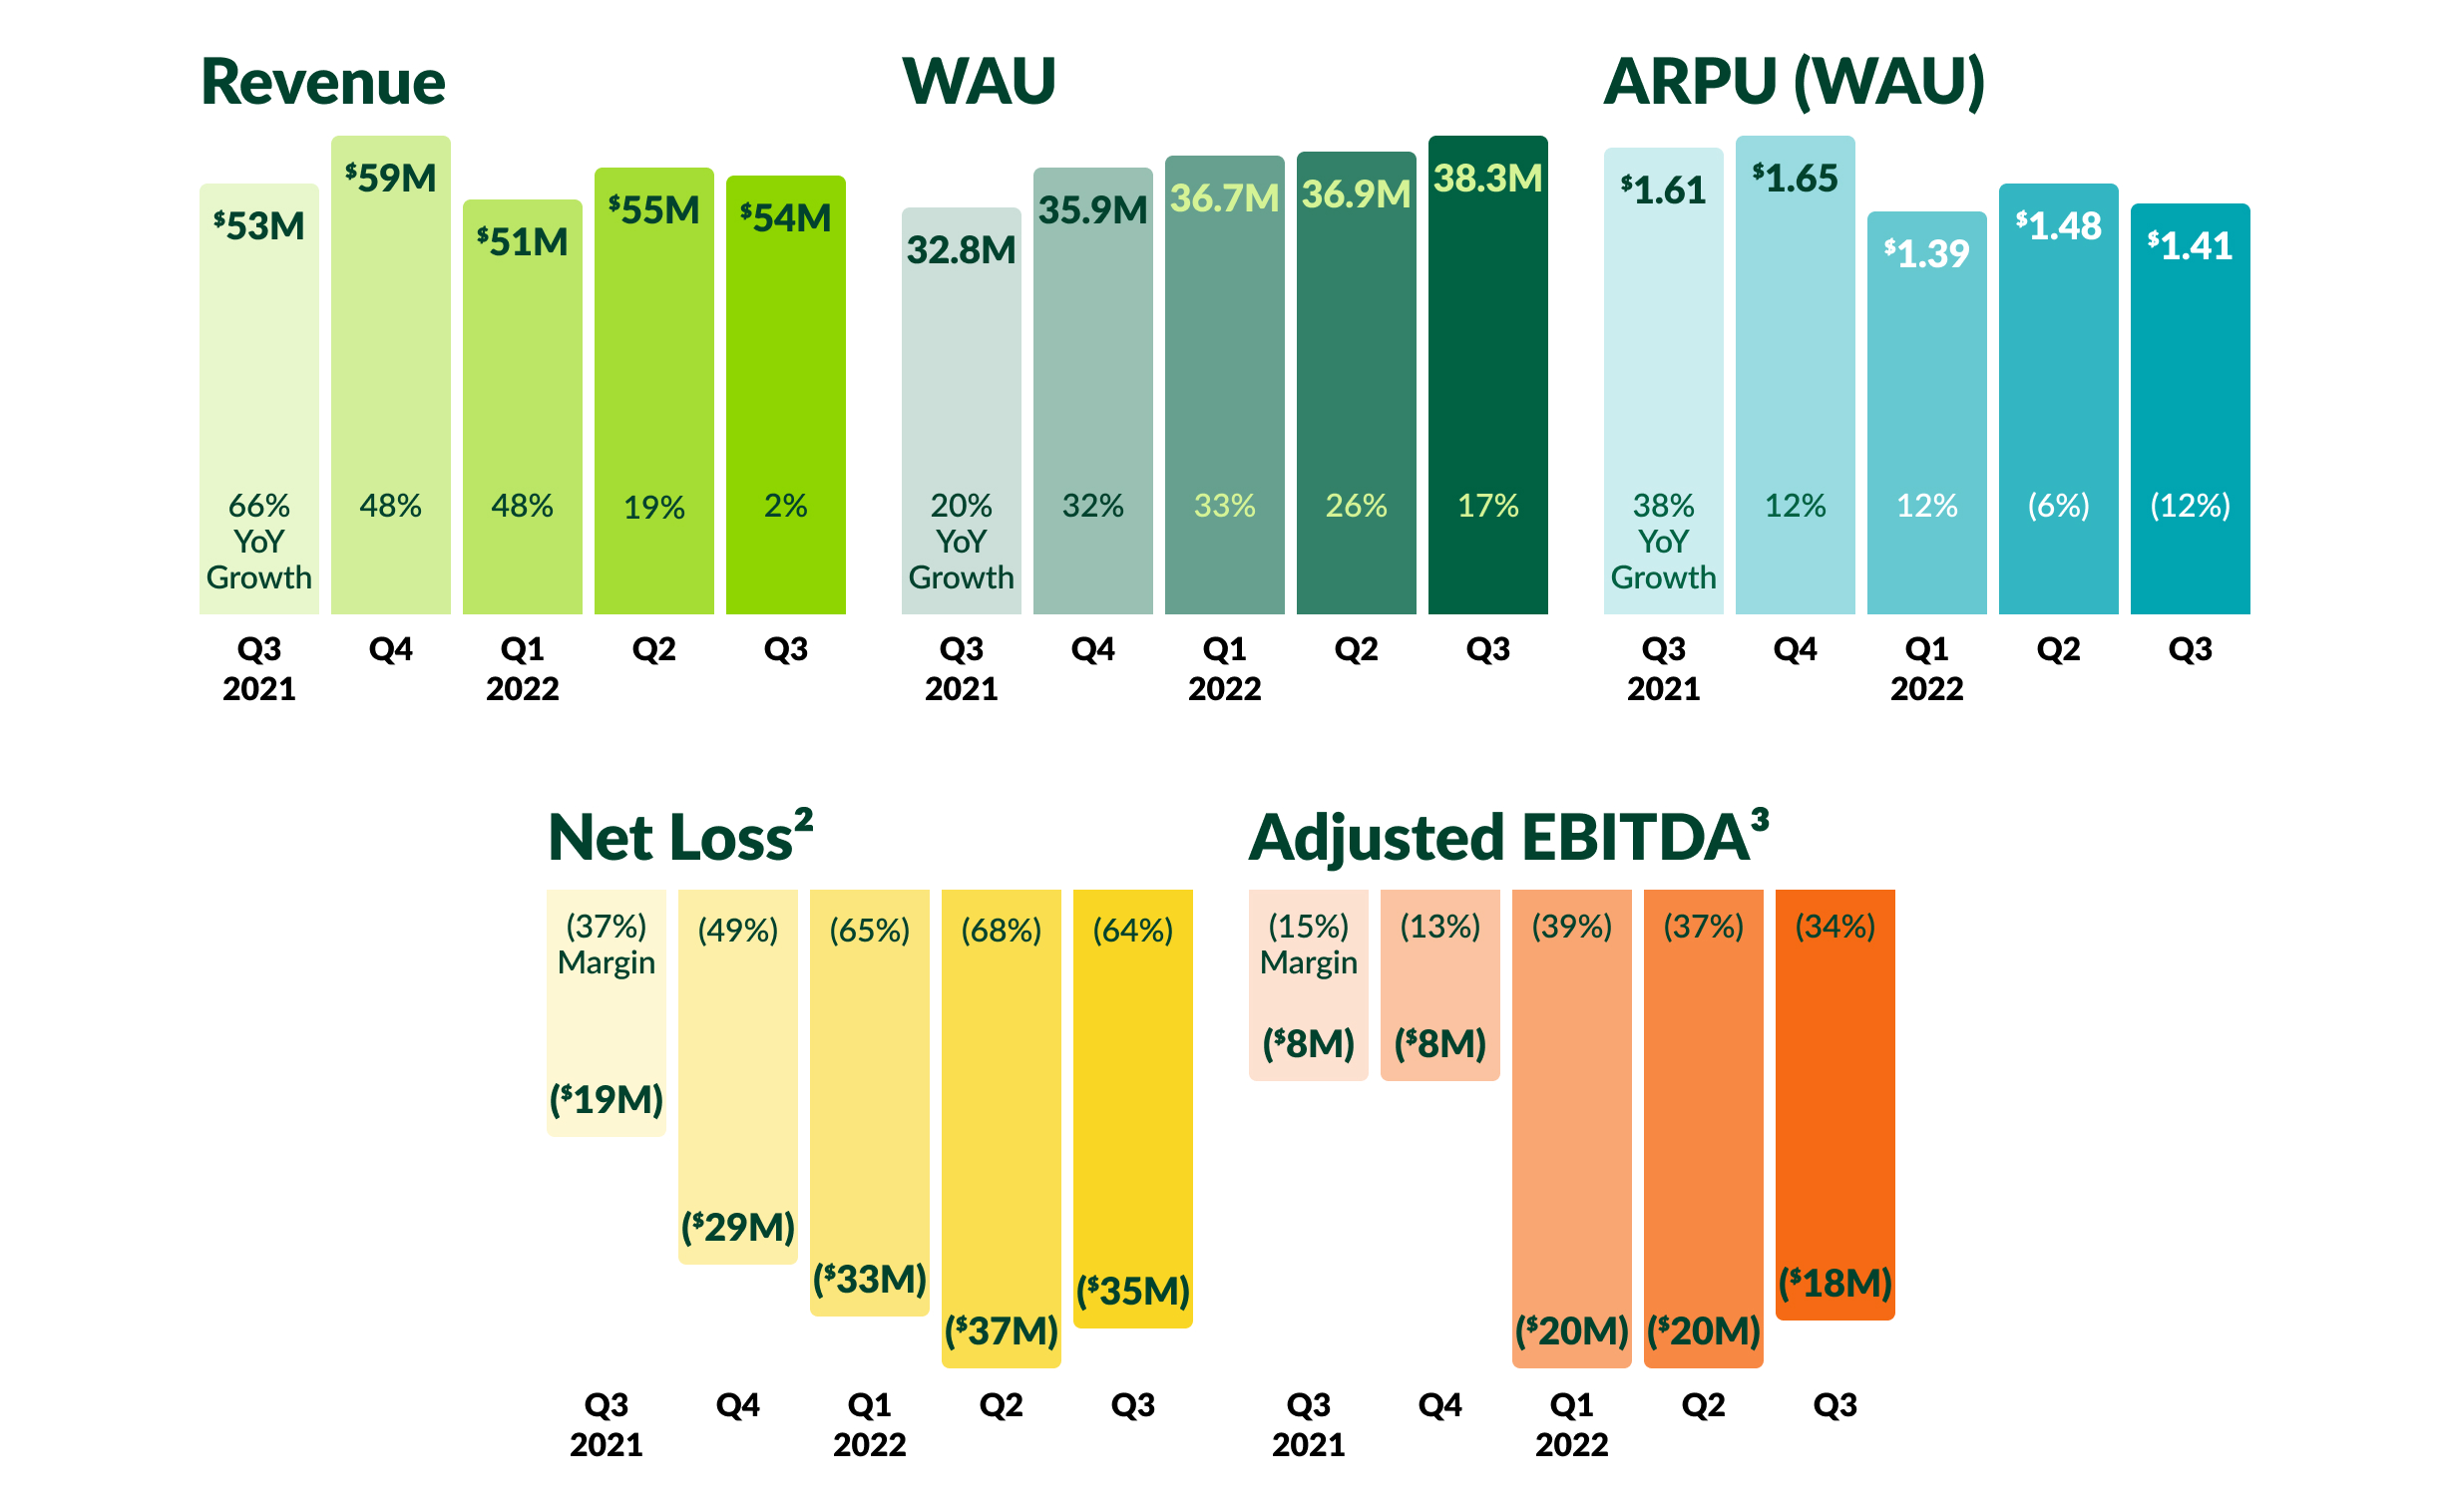
Q3 revenue grew 2% year-over-year to $54M. Resilience from an increasingly diverse set of mid-market customers was offset by softness in advertising spend among other customers and certain key verticals. | Q3 Weekly Active Users (WAU) grew 17% year-over-year to 38.3 million, reflecting growing engagement from both U.S. and international neighbors. Quarter-over-quarter WAU grew 4%, and growth in sessions accelerated for the third straight quarter. | Q3 ARPU of $1.41 declined 12% year-over-year driven by strong WAU growth in relatively less-monetized international markets and lower levels of monetization from SMB customers. This was partially offset by year-over-year growth in eCPMs and ads delivered for larger customers.1 | ||||||
_____________________
1 ARPU is defined as average revenue per WAU. eCPM is a measure of the revenue received for every thousand ad impressions served.
2 Net loss margin is calculated as net loss divided by revenue.
3 Adjusted EBITDA margin is calculated as adjusted EBITDA divided by revenue. A reconciliation of non-GAAP metrics used in this letter to their most comparable GAAP measures is provided at the end of the letter.
3
To Our Shareholders
In Q3, challenging global macroeconomic conditions continued to affect our neighbors and customers. Against the backdrop of high and sticky inflation, rising interest rates, and ongoing geopolitical risks, we continue to live our purpose of cultivating a kinder world where everyone has a neighborhood to rely on. Nextdoor consistently meets the moment for all neighborhood stakeholders — from providing the forums for neighbors to find jobs and side-hustles to offset inflationary pressures to celebrating neighbors during Neighbor Month. We have supported neighbors during extreme weather events and enabled agencies and advertisers to share timely, relevant messaging. As one public agency recently put it: “Nextdoor is there to support us through disaster and in blue skies.”
Our strategy to transform Nextdoor into an Active Valued Community, where neighbors and organizations can join, connect, contribute, and transact, is delivering strong engagement. Q3 WAU grew 17% year-over-year and 4% quarter-over-quarter. Notably, sessions grew 15% quarter-over-quarter, accelerating relative to 10% sequential growth in Q2, highlighting the increasing range and relevance of use cases on Nextdoor. Engagement growth was a highlight in the U.S., where we added over one million WAU quarter-over-quarter.
Revenue grew 2% year-over-year to $54M. New and existing mid-market customer growth was resilient, contributing to continued revenue diversification and results consistent with our Q3 guidance. However, near-term advertiser spend is more uncertain relative to when we last issued guidance, particularly as demand from key verticals, such as financial services and real estate, continues to slow.
We remain focused on WAU and revenue growth, including through initiatives such as our major advertiser partnership with Treat Map. We believe these types of product-led investments will translate into an efficient long-term growth model and competitively position our adjusted EBITDA margins in line with our peers. For example, 90% of neighbor growth in Q3 was organic, indicating durable neighbor acquisition.
Our long-term strategy and priorities remain the same — to focus on initiatives that grow our base of neighbors and organizations, increase engagement on the platform, and drive sustained revenue growth above 2022 levels.
4
Building an Active Valued Community
Providing utility and community to neighbors and organizations
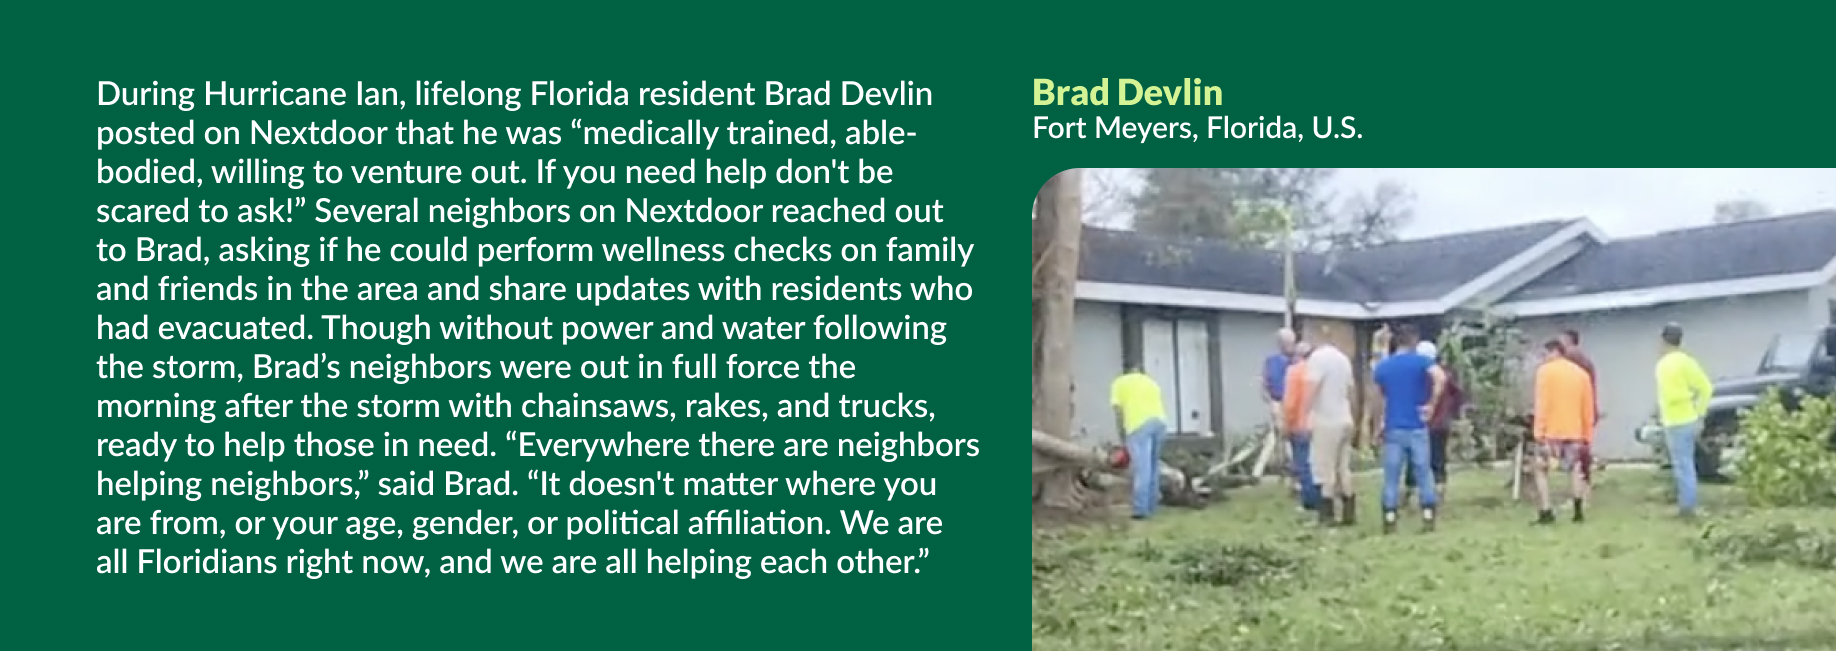
Neighbors and organizations come to Nextdoor for utility and community. Both use cases are intertwined and amplify each other, leading neighbors to engage on Nextdoor with increasing frequency. In Q3, we saw this combination play out most visibly in Florida, where Nextdoor helped communities stay connected during Hurricane Ian.
Our partnerships with public agencies and advertisers supported our goal of providing neighbors with real-time, relevant, hyper-local information in Q3. During the periods leading up to, during, and after the hurricane, nearly 300 public agencies posted to Nextdoor across Florida and its surrounding states. We also boosted the relevant posts related to the crisis to ensure that neighbors impacted were receiving important information in the newsfeed and through notifications. These posts have been viewed over 16 million times.4
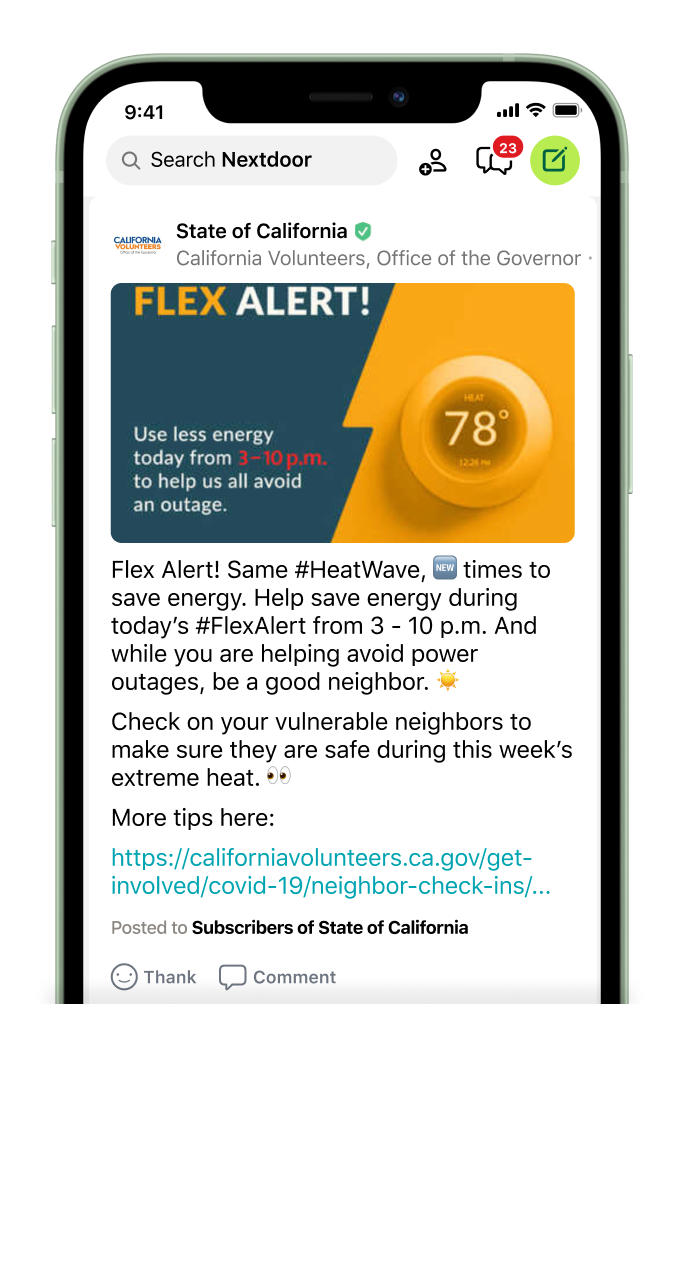 | On the other side of the country, public agencies sprang into action to provide support during the Q3 heat wave in California. Throughout the summer, California Volunteers, on behalf of the state government, shared educational posts on navigating heat waves. And in early September, when the power grid was at risk of going down due to peak usage, California Volunteers was able to quickly disseminate alerts on Nextdoor to notify neighbors to conserve power. As a result of the emergency alerts, neighbors reduced energy usage and the state avoided outages that would have impacted millions of residents. | ||||
On the advertiser side in Q3, Nextdoor and Flex Alert teamed up on a first-of-its-kind Energy Savers Challenge to rally California neighborhoods, share energy conservation tips, and promote how Flex Alert helps prevent power outages. This ability to deliver utility for both organizations and neighbors underpins why we believe so strongly in our WAU and revenue opportunity. | 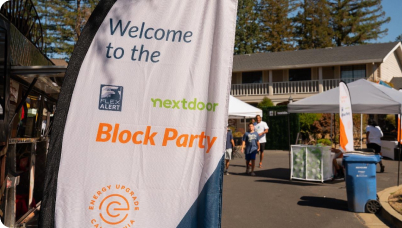 | ||||
______________________________
4 Data as of 11/08/2022.
5
Driving engagement and delightful neighbor experiences
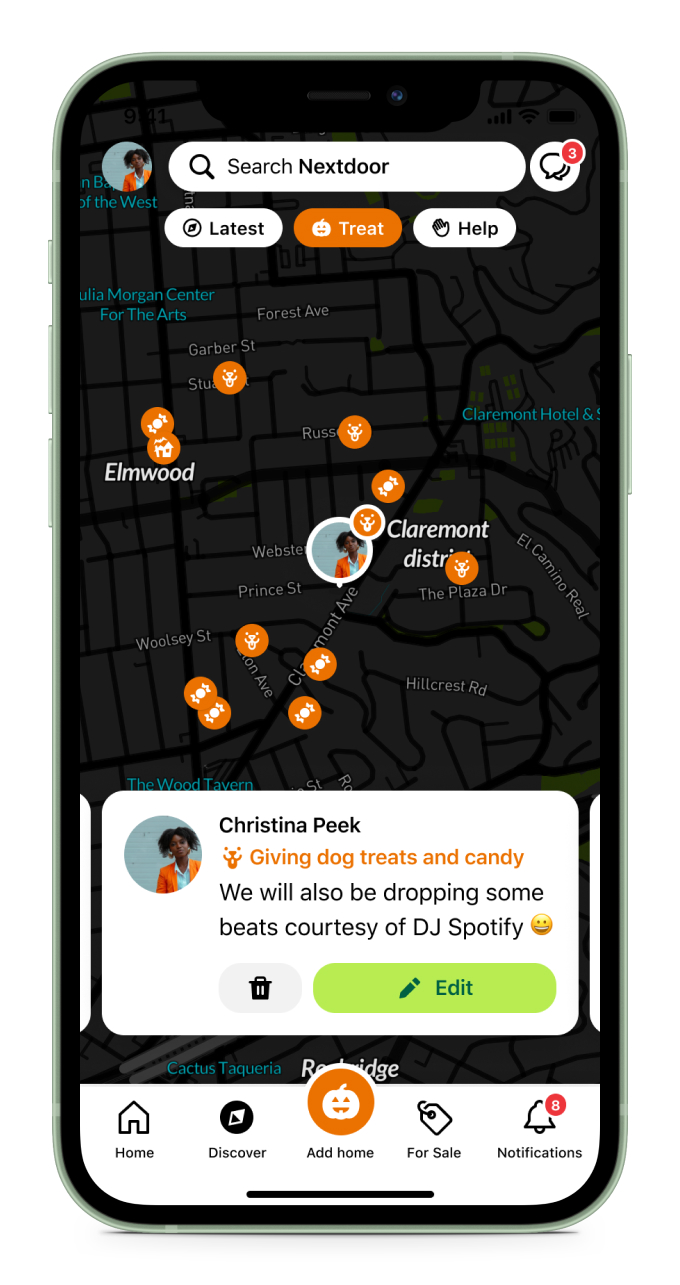 | In Q3, we integrated Maps into the Discover surface that we introduced in the prior quarter. This enabled us to launch our annual Treat Map on Discover, one of the features that neighbors now use most, offering a more visible experience than before and promoting an Active Valued Community. This year’s Treat Map, sponsored by Purina® Beggin’® Brand Dog Treats, was the go-to guide for neighbors who planned to celebrate Halloween, whether through passing out treats, decorating with haunted decor, or visiting other neighbors’ homes. More than 75% of Nextdoor neighbors have pets in their household, so this partnership was a compelling way for us to use neighbor insights to help brands reach the most relevant audience.5 We are continually working to deliver delightful neighbor experiences. We heard neighbors wanted Maps to be more interactive, so in Q3 we launched pins on Maps. Now, when neighbors pin their home to a Map, the pins are created as a post in the Nextdoor newsfeed. This makes the pins more visible, which encourages more neighbors to react or comment to the pins, and in the case of Treat Map, to participate in the Halloween festivities in their neighborhoods. Additionally, neighbors can now add text, photos, and videos to their pins, resulting in a more interactive and dynamic Maps experience. Taken together, the improved newsfeed and notification distribution supports our build of a content creation flywheel for Maps. | ||||
We are also advancing our machine learning technology to further leverage our unique data set so we can create a more personalized Nextdoor experience. In Q3, these machine learning models further optimized content relevance, email volume, and notification recipients, and reduced potentially hurtful or harmful content.6 Smarter notifications were a primary driver of the sequential WAU growth in Q3, demonstrating the impact of these improvements. Similarly, with Connections, we are deploying more sophisticated machine learning technology to help neighbors find other neighbors they might know. In Q3, the number of total connections grew over 50% quarter-over-quarter.
Fostering kind and vibrant neighborhoods
Our work to cultivate kindness on our platform is core to our business strategy and long-term user engagement. In Q3, we were recognized by Fast Company for The Innovation by Design Awards because of our Constructive Conversations Reminder and its use of predictive technology to encourage more neighborly interactions on the platform. We have since launched the new Election Civility Reminder, which draws upon the same approach, to help neighbors have civil political discourse during the U.S. election cycle. Our work leading up to the 2022 midterms has been designed to mitigate exposure to hurtful and harmful political content and identify and promote apolitical trustworthy resources.
______________________________
5 Source: GWI Core, U.S., Q1 2022–Q2 2022.
6 Harmful is defined as content that neighbors consider fraudulent, unsafe, or unwelcoming, including misinformation and discrimination. Hurtful is defined as content that neighbors consider uncivil, including personal attacks.
6
To this end, we also announced a partnership with Vote.org for the third consecutive U.S. election cycle to provide neighbors with the tools they need to be prepared for the midterms. Throughout the run up to the elections, neighbors have seen in-product campaigns to encourage voter registration and help find polling locations. In addition to Vote.org, we have partnered with various non-partisan civic engagement organizations, including the Lawyers Committee for Civil Rights and the NAACP, to be a key resource for neighbors throughout election season. In Q3 we introduced new automation to the neighbor verification process; this has led the number of successful verifications within a given 24-hour period to reach all-time highs in the U.S. This work is important because it improves the neighbor experience and encourages completion of the sign-up process, and thus neighbor growth, all while maintaining the safety and trust that differentiates Nextdoor. Continued strength from mid-market advertisers Advertising spend has slowed in certain endemic verticals, including financial services and real estate. Partially offsetting this trend, we did see strength from newer verticals including government, as well as continued growth in the number of mid-market advertisers and the spend per advertiser. Our advertiser partnerships in the quarter reflect a greater mix of recession resilient verticals, including healthcare, which grew 74% quarter-over-quarter. We also deepened relationships with performance-focused independent ad agencies as more advertisers are being driven towards direct response focused budgets in the current environment. | 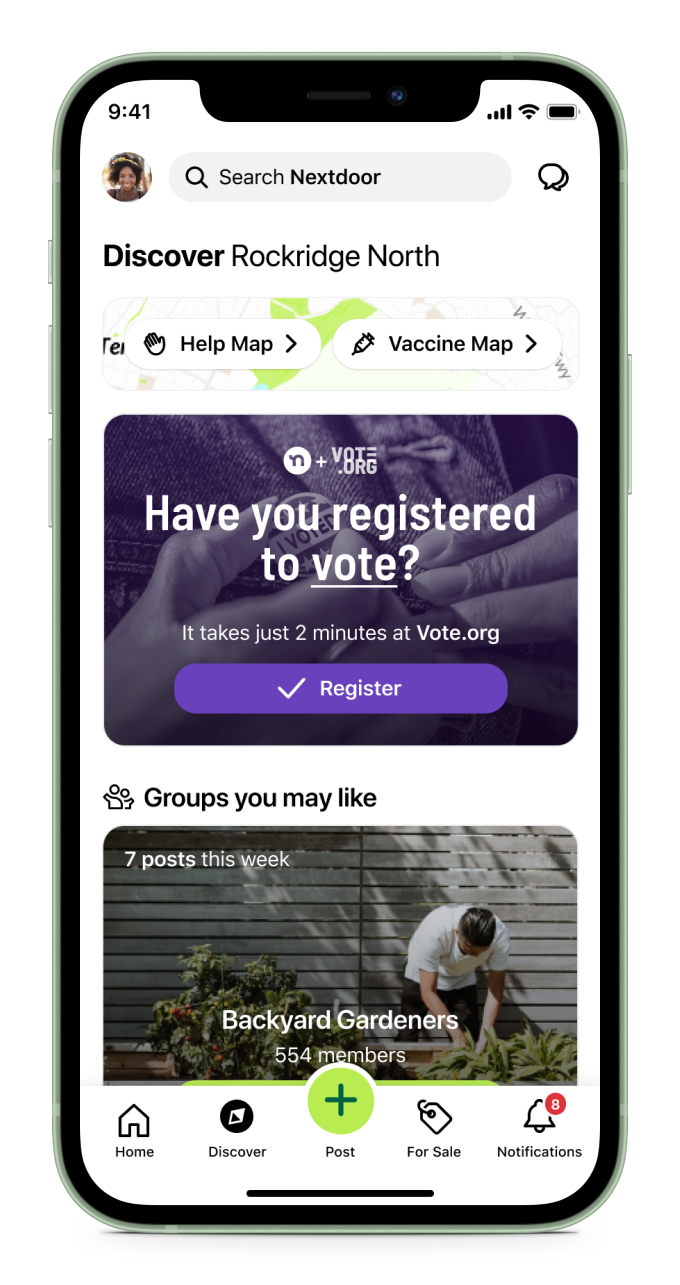 | ||||
One of the mid-market brands that saw ad campaign success on Nextdoor in Q3 was Shipt, a same-day delivery service that lets customers order from their local store for delivery right to their door. Shipt sought to raise awareness for its delivery services and drive in-store traffic and sales using first-party address data to target neighbors within metros where shoppers were available. In addition to first-party address data, Shipt benefited from the fact that neighbors come to Nextdoor with high-intent and over 90% of neighbors are the primary or joint decision makers on household purchases.7 Compared to the month prior to the campaign, Shipt experienced a 33% increase in searches from neighbors exposed to the campaign relative to a 7% increase in searches from those who were not. | 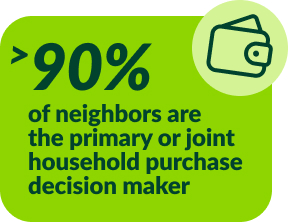 | ||||
Developing the capabilities for increasingly differentiated ad performance
We continue to strengthen our capabilities and solutions to drive and demonstrate value to our customers. One of the ways in which we do this is through third-party partnerships that help show the efficacy of ad campaigns on Nextdoor. In Q3, we implemented an integration with Neustar, a TransUnion company, that is intended to improve our performance in multi-touch attribution, a technique used by many large advertisers to measure campaign effectiveness.
______________________________
7 Source: GWI, U.S., Q3 2021–Q2 2022.
7
This server-to-server integration improves the accuracy of data transmission, bolsters our platform against the deprecation of cookies, and is an important step towards positioning us to win new advertiser budgets.
We also recently announced a strategic collaboration with Oracle Advertising that will give greater transparency, controls, and tools to advertisers of all sizes to help ensure high-value, optimal ad experiences on Nextdoor. Advertisers will soon be able to leverage customizable, end-to-end protection and key insights to optimize campaigns via pre and post-bid blocking, measurement, and verification. Development is expected to begin in 2023. The collaboration will add to Nextdoor's comprehensive approach to provide advertisers with the tools they are most looking for to find success on the platform.
In addition, we partner closely with brands such as Lucid, a Cint Group Company, to measure the effectiveness of our advertising solutions across verticals. For example, an insurance company recently ran a national brand awareness campaign and wanted to understand its performance. We added a Lucid brand lift study, which enabled us to measure not only brand awareness but also several secondary key performance indicators including ad recall, message association, brand recommendation, and brand consideration. The client saw exceptional results across metrics, with the majority being statistically significant at a 90% confidence level. These studies highlight the extent of the value we provide, even beyond customers' direct objectives, and are an important piece of information in supporting customers' decisions to spend on Nextdoor.
Nextdoor ad platform development
Developing our advertising platform remains a top priority for us and is an important step to provide more value to all customers, from the local plumber to the national grocery chain to the international pharmaceutical company.
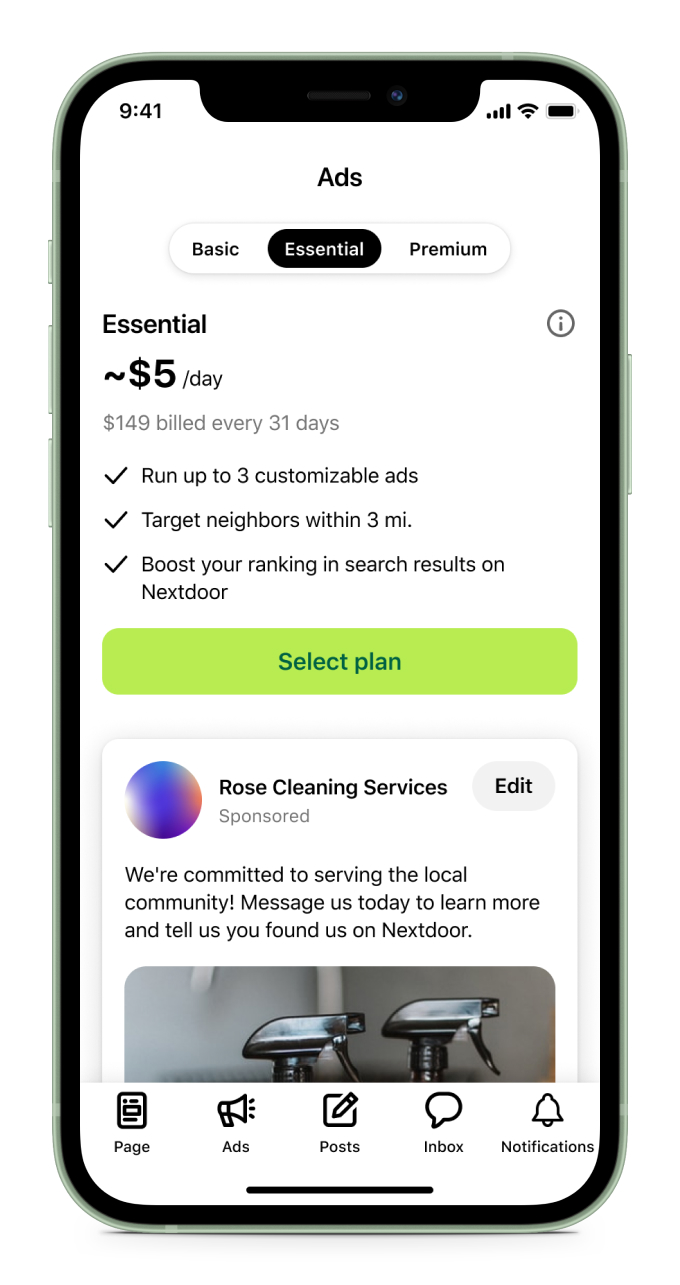 | We have started to migrate certain advertising campaigns onto our proprietary ad server, with Q3 being its first full quarter in use. Running ads on our proprietary ad server allows us to integrate our first-party data, including neighbor attributes, activity on the platform, and historical interaction with ads, to show neighbors the ads that are most relevant and personalized to them. We started the campaign migration to our ad server on the For Sale & Free surface because it is where neighbor purchasing intent is highest and where we believe we will see particularly positive results from deploying first-party data. We also continue to improve our self-serve campaign management tools, which we first launched in Q2. The set of features we were most focused on in Q3 was aimed at increasing ease of use. For example, the initial rollout of our campaign management experience required 5 steps to create an ad. In Q3, we reduced the ad creation process to as little as 1 step by prepopulating images copied from the customer’s business page. If existing content is not available, we prepopulate with default options that are customized by vertical to maximize the impact of the ad. The abridged process, currently rolled out to a subset of new customers, minimizes points of friction to maximize campaign creation and encourage new customers to join. It also helps customers create effective campaigns through greater automation. | ||||
8
Driving value for businesses and agencies of all sizes
In addition to providing businesses of all sizes with value through the tools to create successful campaigns, we also provide innovative ways to help organizations increase their presence in their neighborhoods.
For example, brands can run unique campaigns that build on our purpose and community focus. In July, Nextdoor and Verizon announced an initiative to encourage neighbor-to-neighbor connection across the country: The Big Neighborhood MeetUp. In honor of Nextdoor’s annual Neighbor Month in September and as part of Verizon’s #ACallForKindness campaign, this month-long movement served as a call to action to recognize and build vital relationships with those nearby and to showcase the power of kindness.
In Q3, we launched Neighborhood Favorites, our annual business awards program based on positive recommendations from real neighbors who live in the local community. For the second consecutive year, Neighborhood Favorites was sponsored by American Express. Through this campaign, we were able to provide value not only to one of the world’s largest brands, but also to the hundreds of thousands of local businesses that received recognition in their neighborhoods. This ability to seamlessly connect and integrate businesses of all sizes into the neighborhood ecosystem, both as brands but also as members of the community, is what differentiates our business model.
 | In Q3, we launched Faves, which allows neighbors to connect to businesses. "Fave" is the short-hand of Favorite, a word that has become part of Nextdoor's brand through Neighborhood Favorites. When a neighbor Faves a business, they are indicating that the business is one they truly love and support, and are signaling to Nextdoor that they want to see updates from this business. As a result, Faves increases newsfeed personalization because it allows neighbors to hear from the businesses that matter most to them. It also helps neighbors do more of what they find valuable on Nextdoor. For example, we know 85% of neighbors come to Nextdoor to find trusted reviews and recommendations and 74% say they do their best to spread the word about great local neighborhood businesses.8 Equally importantly, Faves helps businesses, who now have a more direct way to communicate with their most loyal customers. And when neighbors Fave a business, they are also encouraged to write a recommendation, which will then be distributed as a post in the newsfeed, giving businesses even greater visibility. | ||||
In Q3, we enabled public agencies, including local, state, and federal government entities, to purchase ads on Nextdoor through our self-service campaign management platform. Public agency advertising further expands the total addressable market (TAM) for Nextdoor. While public agencies are able to post to the platform for free through their claimed pages, the option for public agencies to run paid advertising campaigns enables more sophisticated targeting and flexible reach, increased visibility, and greater performance tracking. Over 5,000 U.S. public agencies have claimed a page on Nextdoor, and the majority post at least quarterly to the platform.9
______________________________
8 Sources: Nextdoor Survey, 07/2022 and OMS Nextdoor U.S. Brand Tracker, Q3 2021, respectively.
9 Based on Q2 2022–Q3 2022 data.
9
As of the end of Q3, just under 1% of the agencies that post quarterly have now run a paid campaign. This represents significant opportunity for us to expand the advertising option to the already existing and engaged base of public agencies.
Building for global growth
International WAU growth remains steady, with Canada and Western European markets once again delivering the highest growth. Over two-thirds of international neighbors joined the platform organically in Q3. Engagement trends remain consistent, with over 50% of Verified Neighbors returning weekly and over 50% of weekly neighbors returning daily.10 We are continuing to build brand awareness globally. In Q3, we launched a partnership with Major League Soccer franchise Toronto FC. | 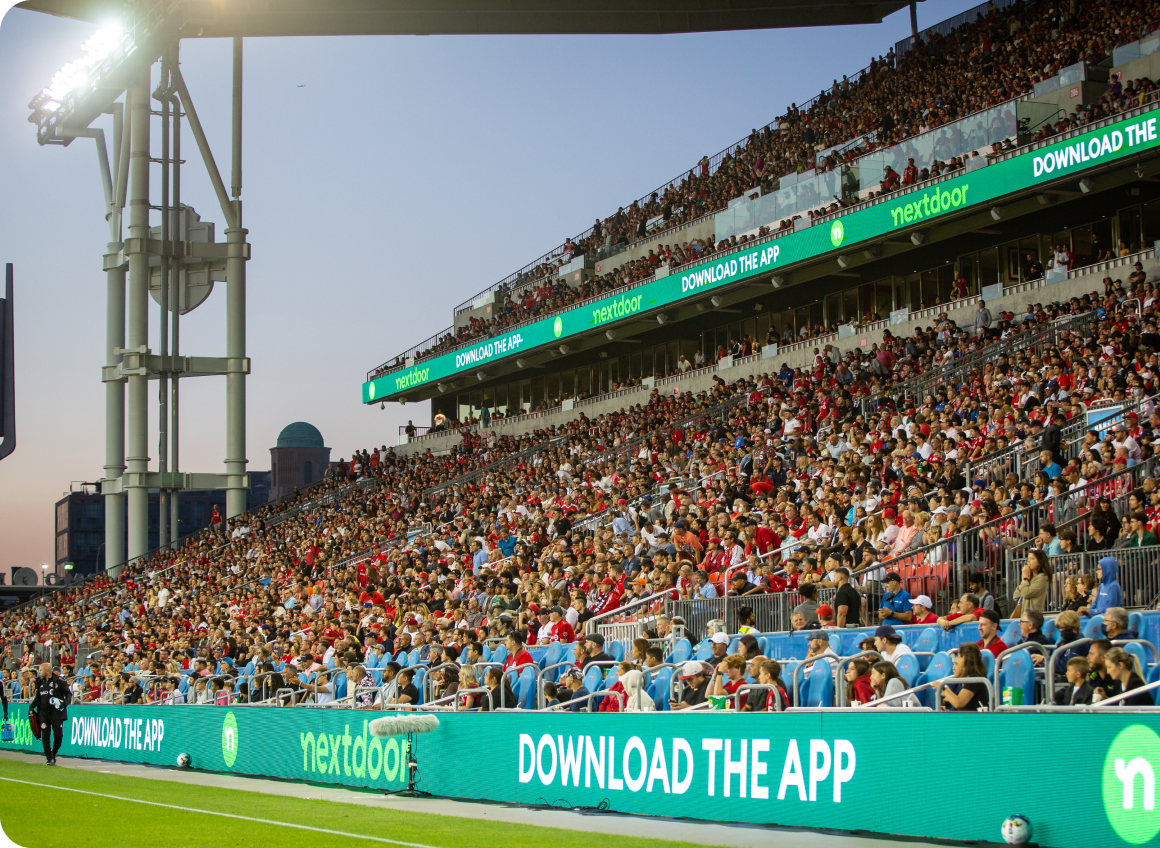 | ||||
The multi-year agreement positions Nextdoor as the official community app of the greater Toronto area team and its fans. The partnership includes a number of channels, including in-stadium and digital activation opportunities, and allows us to capitalize on the rise of soccer in Canada.
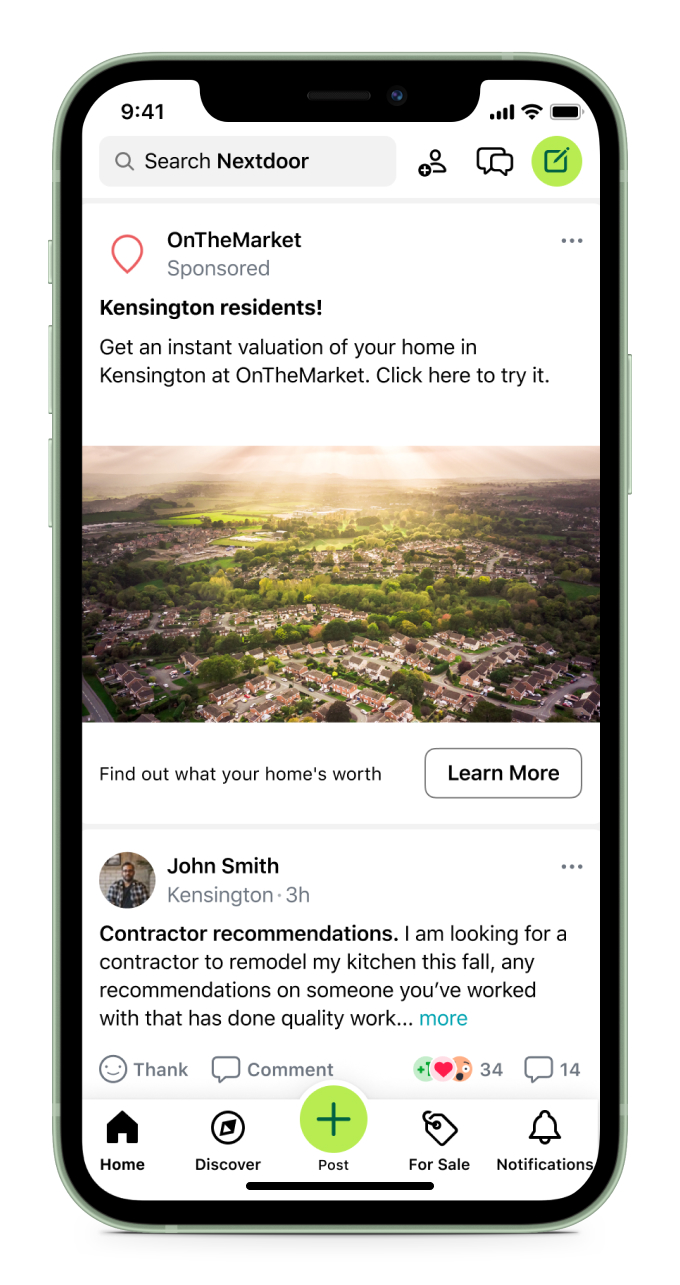 | Individual advertisers continue to leverage Nextdoor’s high intent and highly relevant audience in order to generate desired results, even in difficult environments. OnTheMarket, a UK online property portal, partnered with Nextdoor to drive online instant and agent valuations. 75% of UK neighbors identify as homeowners, so OnTheMarket’s campaign to run Sponsored Posts with local customization was a natural fit, driving a conversion rate that was 18% higher for instant valuation and 29% higher for agent valuation than OnTheMarket’s average benchmark.11 These results highlight the benefit of hyper-local, dynamic advertising on Nextdoor. | ||||
______________________________
10 Based on international data from Q3 2022. Verified Neighbors are individuals who have joined Nextdoor and completed the verification process for their account.
11 Source: GWI Core, U.S., Q1 2021–Q2 2022.
10
Q3 2022 Financial Discussion
Revenue Q3 revenue was $54M, an increase of 2% year-over-year. Sustained strength from mid-market advertisers was offset by a decrease in advertiser spend in key verticals including financial services, real estate, and more recently, home services. Global ARPU declined 12% year-over-year to $1.41, reflecting stronger year-over-year WAU growth relative to revenue growth. | 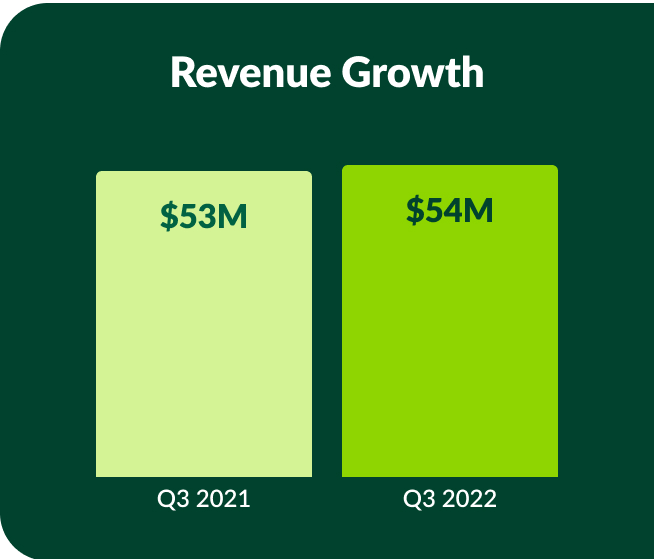 | ||||
Operating expenses In Q3, operating expenses were $90M, an increase of 26% year-over-year. The growth in operating expenses was primarily driven by increased headcount and personnel costs and general and administrative expenses required to operate as a public company. Cost of revenue was $10M, up 34% year-over-year. In Q3, cost of revenue represented 18% of revenue, an increase of 4 percentage points from the year-ago period, primarily driven by third-party hosting costs, which in turn were driven by increased user growth and engagement. | 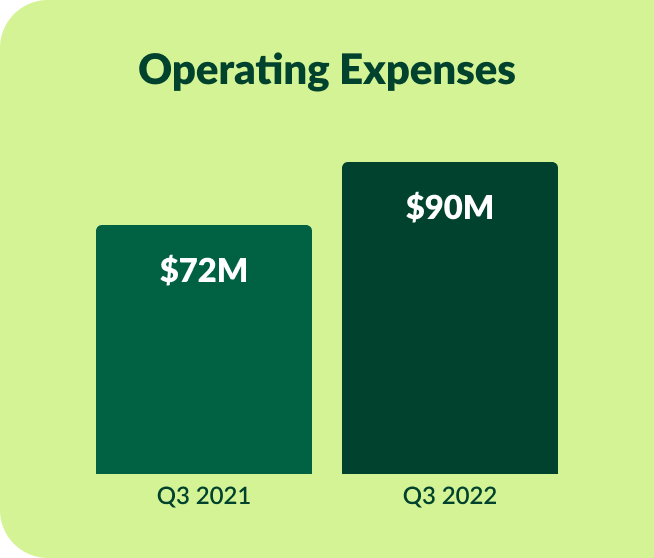 | ||||
Research and development expenses were $33M, or 62% of revenue, up 31% year-over-year. The growth was driven primarily by increased headcount and personnel costs related to our engineering, data science, and product management teams. Sales and marketing expenses were $29M, or 54% of revenue, up 6% year-over-year. The increase was primarily attributable to headcount growth, which was partially offset by a decrease in marketing costs for neighbor acquisition. General and administrative expenses were $18M, or 33% of revenue, up 57% year-over-year. The increase was driven by headcount growth and increased insurance expenses related to operating as a public company. Total non-GAAP operating expenses were $72M, or 133% of revenue, up 19% year-over-year.12 | |||||
______________________________
12 A reconciliation of non-GAAP metrics used in this letter to their most comparable GAAP measures is provided at the end of this letter.
11
Earnings Net loss was $35M in Q3 representing a (64%) margin, compared to $19M and a (37%) margin in the year-ago period. The increased net loss is attributable in part to relatively elevated year-over-year growth in stock-based compensation expense, which reflects both recent headcount growth and timing of new grants. We expect year-over-year growth in stock-based compensation expense to slow significantly in Q4. | 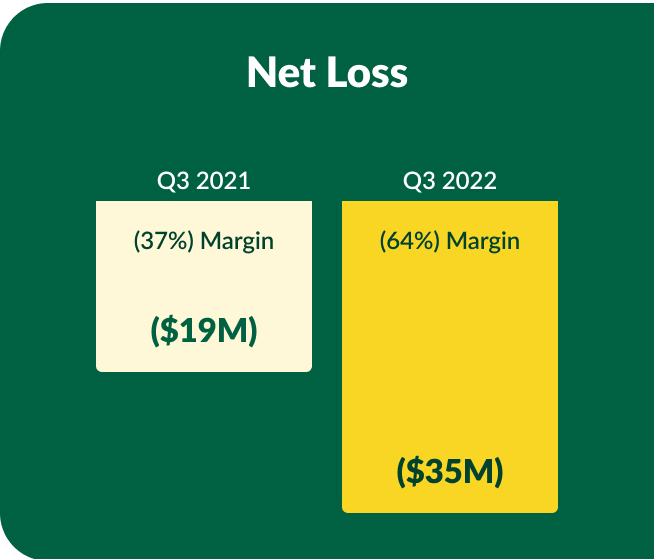 | ||||
Q3 adjusted EBITDA loss was $18M representing a (34%) margin, compared to $8M and a (15%) margin in the year-ago period. This margin reflects the accelerated 1H 2022 hiring that is playing a key role in advancing our product development efforts. | 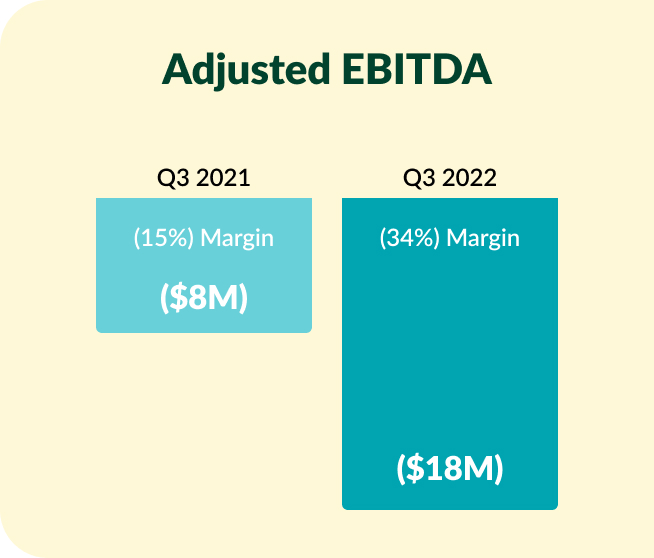 | ||||
Balance sheet and cash flows In Q3, we ended the period with $604M in cash and cash equivalents and marketable securities. Cash used in operations for the nine months ended September 30, 2022 was $41M compared to $33M in the year-ago period. At the end of May 2022, our Board of Directors authorized and approved a share repurchase program to repurchase up to $100M of our Class A common stock. During Q2 and Q3, we repurchased and retired approximately 23 million shares of Class A common stock for a total of $77.2M. | |||||
12
Outlook
Our focus remains on growing our base of neighbors and organizations, increasing engagement on the platform, and delivering strong revenue performance to support our reinvestment into the business for long-term growth.
Taking into account the current macroeconomic conditions, we are revising our outlook for the remainder of FY 2022.13
Q4 2022 Outlook
•Revenue is expected to be between $50M–$52M.
•Adjusted EBITDA loss is expected to be between $19M–$17M.
FY 2022 Outlook
•Q4 guidance implies FY 2022 revenue of between $209.5M–$211.5M.
•FY 2022 implied adjusted EBITDA margin is (36%).
We have not reconciled our adjusted EBITDA and adjusted EBITDA margin outlook to GAAP net loss or GAAP net loss margin because certain items that impact GAAP net loss and net loss margin are uncertain or out of our control and cannot be reasonably predicted. In particular, stock-based compensation expense is impacted by the future fair market value of our common stock and other factors, all of which are difficult to predict, subject to frequent change, or not within our control. The actual amount of these expenses during 2022 will have a significant impact on our future GAAP financial results. Accordingly, a reconciliation of adjusted EBITDA outlook to net loss and adjusted EBITDA margin to GAAP net loss margin is not available without unreasonable efforts.
______________________________
13 Prior guidance as of Nextdoor’s Q2 2022 earnings release on August 9, 2022.
13
Q3 Conference Call and Webcast
We will host a Q&A webcast at 2:00 pm PT/5:00 pm ET today, November 8, 2022, to discuss these results and outlook. An audio webcast archive will be available following the live webcast for approximately one year on Nextdoor’s Investor Relations website at investors.nextdoor.com. Thank you for your support in building stronger neighborhoods across the globe and for being active neighbors in your neighborhood. We look forward to your questions and comments this afternoon.
We use our Investor Relations website (investors.nextdoor.com), our Twitter handle (twitter.com/Nextdoor), our LinkedIn Home Page (linkedin.com/company/nextdoor-com), and Sarah Friar’s LinkedIn posts (linkedin.com/in/sarah-friar-922b044) as a means of disseminating or providing notification of, among other things, news or announcements regarding our business or financial performance, investor events, press releases, and earnings releases and as a means of disclosing material nonpublic information and for complying with our disclosure obligations under Regulation FD. The content of our websites and information that we may post on or provide to online and social media channels, including those mentioned above, and information that can be accessed through our websites or these online and social media channels are not incorporated by reference into this press release or in any report or document we file with the SEC, and any references to our websites or these online and social media channels are intended to be inactive textual references only.
14

15
Safe Harbor Statement
This shareholder letter includes forward-looking statements, which are statements other than statements of historical facts and statements in the future tense. These statements include, but are not limited to, statements regarding our future performance and our market opportunity, including expected financial results for the fourth quarter of 2022 and full year 2022, trends and expectations regarding our business and operating results, our business strategy and plans, and our objectives and future operations, including our expansion into new markets.
Forward-looking statements are based upon various estimates and assumptions, as well as information known to us as of the date of this shareholder letter, and are subject to risks and uncertainties. Accordingly, actual results could differ materially due to a variety of factors, including: our ability to scale our business and monetization efforts; our ability to expand business operations abroad; our limited operating history; risks associated with managing our growth; our ability to achieve and maintain profitability in the future; the effects of the highly competitive market in which we operate; the impact of the ongoing COVID-19 pandemic on our business; our ability to attract new and retain existing customers and users, or renew and expand our relationships with them; our ability to anticipate and satisfy customer preferences; market acceptance of our platform; our ability to successfully develop and timely introduce new products and services; our ability to achieve our objectives of strategic and operational initiatives; cybersecurity risks to our various systems and software; the impact of privacy and data security laws; and other general market, political, economic, and business conditions, including those related to the continuing impact of the ongoing COVID-19 pandemic.
Additional risks and uncertainties that could affect our financial results and business are more fully described in our Quarterly Report on Form 10-Q for the period ended June 30, 2022 filed with the SEC on August 9, 2022, our Quarterly Report on Form 10-Q for the period ended September 30, 2022, expected to be filed on or about November 8, 2022, and our other SEC filings, which are available on the Investor Relations page of our website at investors.nextdoor.com and on the SEC’s website at www.sec.gov.
All forward-looking statements contained herein are based on information available to us as of the date hereof and you should not rely upon forward-looking statements as predictions of future events. The events and circumstances reflected in the forward-looking statements may not be achieved or occur. Although we believe that the expectations reflected in the forward-looking statements are reasonable, we cannot guarantee future results, performance, or achievements. We undertake no obligation to update any of these forward-looking statements for any reason after the date of this shareholder letter or to conform these statements to actual results or revised expectations, except as required by law. Undue reliance should not be placed on the forward-looking statements in this shareholder letter.
16
Condensed Consolidated
Balance Sheets
in thousands, except per share data (unaudited)
| September 30, | December 31 | ||||||||||
| 2022 | 2021 | ||||||||||
| Assets | |||||||||||
| Current assets: | |||||||||||
| Cash and cash equivalents | $ | 90,731 | $ | 521,812 | |||||||
| Marketable securities | 513,744 | 193,999 | |||||||||
| Accounts receivable, net of allowance of $388 and $425 as of September 30, 2022 and December 31, 2021, respectively | 26,963 | 29,673 | |||||||||
| Prepaid expenses and other current assets | 10,252 | 16,259 | |||||||||
| Total current assets | 641,690 | 761,743 | |||||||||
| Property and equipment, net | 12,622 | 12,545 | |||||||||
| Operating lease right-of-use assets | 54,302 | 59,422 | |||||||||
| Intangible assets, net | 3,505 | 4,835 | |||||||||
| Goodwill | 1,211 | 1,211 | |||||||||
| Other assets | 599 | 330 | |||||||||
| Total assets | $ | 713,929 | $ | 840,086 | |||||||
| Liabilities and Stockholders’ Equity | |||||||||||
| Current liabilities: | |||||||||||
| Accounts payable | $ | 6,402 | $ | 6,163 | |||||||
| Operating lease liabilities, current | 7,604 | 7,131 | |||||||||
| Liability for unvested restricted stock | 476 | 4,765 | |||||||||
| Accrued expenses and other current liabilities | 20,149 | 15,444 | |||||||||
| Total current liabilities | 34,631 | 33,503 | |||||||||
| Operating lease liabilities, non-current | 55,844 | 61,598 | |||||||||
| Total liabilities | 90,475 | 95,101 | |||||||||
| Stockholders’ equity: | |||||||||||
| Class A common stock, $0.0001 par value; 2,500,000 shares authorized, 149,825 and 78,954 shares issued and outstanding as of September 30, 2022 and December 31, 2021, respectively | 15 | 8 | |||||||||
| Class B common stock, $0.0001 par value; 500,000 shares authorized, 219,356 and 304,701 shares issued and outstanding as of September 30, 2022 and December 31, 2021, respectively | 22 | 30 | |||||||||
| Additional paid-in capital | 1,212,167 | 1,225,815 | |||||||||
| Accumulated other comprehensive loss | (3,903) | (529) | |||||||||
| Accumulated deficit | (584,847) | (480,339) | |||||||||
| Total stockholders’ equity | 623,454 | 744,985 | |||||||||
| Total liabilities and stockholders’ equity | $ | 713,929 | $ | 840,086 | |||||||
17
Condensed Consolidated Statements of Operations
in thousands, except per share data (unaudited)
| Three Months Ended September 30, | Nine Months Ended September 30, | ||||||||||||||||||||||
| 2022 | 2021 | 2022 | 2021 | ||||||||||||||||||||
| Revenue | $ | 53,954 | $ | 52,705 | $ | 159,495 | $ | 132,870 | |||||||||||||||
| Costs and expenses: | |||||||||||||||||||||||
| Cost of revenue | 9,882 | 7,371 | 29,124 | 20,308 | |||||||||||||||||||
| Research and development | 33,398 | 25,461 | 95,057 | 69,612 | |||||||||||||||||||
| Sales and marketing | 29,000 | 27,448 | 92,688 | 76,698 | |||||||||||||||||||
| General and administrative | 18,066 | 11,505 | 50,499 | 31,793 | |||||||||||||||||||
| Total costs and expenses | 90,346 | 71,785 | 267,368 | 198,411 | |||||||||||||||||||
| Loss from operations | (36,392) | (19,080) | (107,873) | (65,541) | |||||||||||||||||||
| Interest income | 2,703 | 21 | 5,347 | 86 | |||||||||||||||||||
| Other income (expense), net | (709) | (277) | (1,602) | (451) | |||||||||||||||||||
| Loss before income taxes | (34,398) | (19,336) | (104,128) | (65,906) | |||||||||||||||||||
| Provision for income taxes | 319 | 27 | 380 | 96 | |||||||||||||||||||
| Net loss | $ | (34,717) | $ | (19,363) | $ | (104,508) | $ | (66,002) | |||||||||||||||
| Net loss per share attributable to Class A and Class B common stockholders, basic and diluted | $ | (0.09) | $ | (0.18) | $ | (0.27) | $ | (0.64) | |||||||||||||||
| Weighted average shares used in computing net loss per share attributable to Class A and Class B common stockholders, basic and diluted | 377,756 | 106,387 | 381,571 | 102,495 | |||||||||||||||||||
18
Condensed Consolidated Statements of Cash Flows
in thousands (unaudited)
| Nine Months Ended September 30, | |||||||||||
| 2022 | 2021 | ||||||||||
| Cash flows from operating activities: | |||||||||||
| Net loss | $ | (104,508) | $ | (66,002) | |||||||
| Adjustments to reconcile net loss to net cash used in operating activities: | |||||||||||
| Depreciation and amortization | 4,169 | 3,202 | |||||||||
| Stock-based compensation | 46,957 | 26,971 | |||||||||
| Bad debt expense | (40) | 76 | |||||||||
| Other | (677) | 294 | |||||||||
| Changes in operating assets and liabilities: | |||||||||||
| Accounts receivable, net | 2,750 | (5,042) | |||||||||
| Prepaid expenses and other current assets | 6,075 | 426 | |||||||||
| Operating lease right-of-use assets | 5,120 | 4,938 | |||||||||
| Other assets | (269) | 330 | |||||||||
| Accounts payable | (445) | 221 | |||||||||
| Operating lease liabilities | (5,280) | (4,147) | |||||||||
| Accrued expenses and other current liabilities | 5,351 | 5,453 | |||||||||
| Net cash used in operating activities | (40,797) | (33,280) | |||||||||
| Cash flows from investing activities: | |||||||||||
| Purchases of property and equipment | (2,182) | (8,089) | |||||||||
| Purchases of marketable securities | (555,052) | (40,251) | |||||||||
| Sales of marketable securities | 7,822 | 2,411 | |||||||||
| Maturities of marketable securities | 224,005 | 50,645 | |||||||||
| Net cash provided by (used in) investing activities | (325,407) | 4,716 | |||||||||
| Cash flows from financing activities: | |||||||||||
| Proceeds from exercise of stock options, net of repurchases | 11,219 | 12,836 | |||||||||
| Proceeds from issuance of common stock under employee stock purchase plan | 1,430 | — | |||||||||
| Payment of transaction costs related to the Reverse Recapitalization | (314) | (2,973) | |||||||||
| Tax withholdings on release of restricted stock units | (695) | — | |||||||||
| Repurchase of common stock | (77,232) | — | |||||||||
| Prepayment under share repurchase program | (68) | — | |||||||||
| Net cash provided by (used in) financing activities | (65,660) | 9,863 | |||||||||
| Effect of exchange rate changes on cash and cash equivalents | 783 | 278 | |||||||||
| Net decrease in cash and cash equivalents | (431,081) | (18,423) | |||||||||
| Cash and cash equivalents at beginning of period | 521,812 | 84,743 | |||||||||
| Cash and cash equivalents at end of period | $ | 90,731 | $ | 66,320 | |||||||
19
Non-GAAP Financial Measures
To supplement our condensed consolidated financial statements, which are prepared in accordance with GAAP, we present non-GAAP cost of revenue, non-GAAP research and development, non-GAAP sales and marketing, non-GAAP general and administrative, adjusted EBITDA and adjusted EBITDA Margin in this shareholder letter. Our use of non-GAAP financial measures has limitations as an analytical tool, and these measures should not be considered in isolation or as a substitute for analysis of financial results as reported under GAAP.
We use these non-GAAP financial measures in conjunction with financial measures prepared in accordance with GAAP for planning purposes, including in the preparation of our annual operating budget, as a measure of our core operating results and the effectiveness of our business strategy, and in evaluating our financial performance. These measures provide consistency and comparability with past financial performance, facilitate period-to-period comparisons of core operating results, and also facilitate comparisons with other peer companies, many of which use similar non-GAAP financial measures to supplement their GAAP results. In addition, adjusted EBITDA is widely used by investors and securities analysts to measure a company's operating performance. We exclude the following items from one or more of our non-GAAP financial measures: stock-based compensation expense (non-cash expense calculated by companies using a variety of valuation methodologies and subjective assumptions), depreciation and amortization (non-cash expense), interest income, provision for income taxes, and, if applicable, acquisition-related costs.
Investors are cautioned that there are material limitations associated with the use of non-GAAP financial measures as an analytical tool. In particular, (1) stock-based compensation expense has recently been, and will continue to be for the foreseeable future, a significant recurring expense for our business and an important part of our compensation strategy, (2) although depreciation and amortization expense are non-cash charges, the assets subject to depreciation and amortization may have to be replaced in the future, and our non-GAAP measures do not reflect cash capital expenditure requirements for such replacements or for new capital expenditure requirements, and (3) adjusted EBITDA does not reflect: (a) changes in, or cash requirements for, our working capital needs; (b) interest expense, or the cash requirements necessary to service interest or principal payments on our debt, which reduces cash available to us; or (c) tax payments that may represent a reduction in cash available to us. The non-GAAP measures we use may be different from non-GAAP financial measures used by other companies, limiting their usefulness for comparison purposes. We compensate for these limitations by providing specific information regarding the GAAP items excluded from these non-GAAP financial measures. A reconciliation of these non-GAAP measures has been provided below:
20
Non-GAAP Financial Measures
in thousands (unaudited)
| Three Months Ended September 30, | Nine Months Ended September 30, | ||||||||||||||||||||||
| 2022 | 2021 | 2022 | 2021 | ||||||||||||||||||||
| Net loss | $ | (34,717) | $ | (19,363) | $ | (104,508) | $ | (66,002) | |||||||||||||||
| % Margin | (64 | %) | (37 | %) | (66 | %) | (50 | %) | |||||||||||||||
| Depreciation and amortization | $ | 1,465 | $ | 1,047 | $ | 4,169 | $ | 3,202 | |||||||||||||||
| Stock-based compensation | 17,270 | 10,592 | 46,957 | 26,971 | |||||||||||||||||||
| Interest income | (2,703) | (21) | (5,347) | (86) | |||||||||||||||||||
| Provision for income taxes | 319 | 27 | 380 | 96 | |||||||||||||||||||
| Adjusted EBITDA | $ | (18,366) | $ | (7,718) | $ | (58,349) | $ | (35,819) | |||||||||||||||
| % Margin | (34 | %) | (15 | %) | (37 | %) | (27 | %) | |||||||||||||||
| Cost of Revenue Reconciliation: | |||||||||||||||||||||||
| Cost of Revenue, GAAP | $ | 9,882 | $ | 7,371 | $ | 29,124 | $ | 20,308 | |||||||||||||||
| Stock-based compensation | (732) | (383) | (1,906) | (981) | |||||||||||||||||||
| Cost of Revenue, Non-GAAP | $ | 9,150 | $ | 6,988 | $ | 27,218 | $ | 19,327 | |||||||||||||||
| % of revenue, GAAP | 18 | % | 14 | % | 18 | % | 15 | % | |||||||||||||||
| % of revenue, Non-GAAP | 17 | % | 13 | % | 17 | % | 15 | % | |||||||||||||||
| Research and Development Reconciliation: | |||||||||||||||||||||||
| Research and Development, GAAP | $ | 33,398 | $ | 25,461 | $ | 95,057 | $ | 69,612 | |||||||||||||||
| Stock-based compensation | (9,630) | (5,680) | (25,914) | (13,954) | |||||||||||||||||||
| Depreciation and amortization | (506) | (268) | (1,443) | (791) | |||||||||||||||||||
| Research and Development, Non-GAAP | $ | 23,262 | $ | 19,513 | $ | 67,700 | $ | 54,867 | |||||||||||||||
| % of revenue, GAAP | 62 | % | 48 | % | 60 | % | 52 | % | |||||||||||||||
| % of revenue, Non-GAAP | 43 | % | 37 | % | 42 | % | 41 | % | |||||||||||||||
| Sales and Marketing Reconciliation: | |||||||||||||||||||||||
| Sales and Marketing, GAAP | $ | 29,000 | $ | 27,448 | $ | 92,688 | $ | 76,698 | |||||||||||||||
| Stock-based compensation | (2,621) | (1,711) | (7,617) | (4,461) | |||||||||||||||||||
| Depreciation and amortization | (770) | (698) | (2,219) | (2,176) | |||||||||||||||||||
| Sales and Marketing, Non-GAAP | $ | 25,609 | $ | 25,039 | $ | 82,852 | $ | 70,061 | |||||||||||||||
| % of revenue, GAAP | 54 | % | 52 | % | 58 | % | 58 | % | |||||||||||||||
| % of revenue, Non-GAAP | 47 | % | 48 | % | 52 | % | 53 | % | |||||||||||||||
| General and Administrative Reconciliation: | |||||||||||||||||||||||
| General and Administrative, GAAP | $ | 18,066 | $ | 11,505 | $ | 50,499 | $ | 31,793 | |||||||||||||||
| Stock-based compensation | (4,287) | (2,818) | (11,520) | (7,575) | |||||||||||||||||||
| Depreciation and amortization | (189) | (81) | (507) | (235) | |||||||||||||||||||
| General and Administrative, Non-GAAP | $ | 13,590 | $ | 8,606 | $ | 38,472 | $ | 23,983 | |||||||||||||||
| % of revenue, GAAP | 33 | % | 22 | % | 32 | % | 24 | % | |||||||||||||||
| % of revenue, Non-GAAP | 25 | % | 16 | % | 24 | % | 18 | % | |||||||||||||||
| Total Operating Expenses Reconciliation: | |||||||||||||||||||||||
| Operating Expenses, GAAP | $ | 90,346 | $ | 71,785 | $ | 267,368 | $ | 198,411 | |||||||||||||||
| Stock-based compensation | (17,270) | (10,592) | (46,957) | (26,971) | |||||||||||||||||||
| Depreciation and amortization | (1,465) | (1,047) | (4,169) | (3,202) | |||||||||||||||||||
| Total Operating Expenses, Non-GAAP | $ | 71,611 | $ | 60,146 | $ | 216,242 | $ | 168,238 | |||||||||||||||
| % of revenue, GAAP | 167 | % | 136 | % | 168 | % | 149 | % | |||||||||||||||
| % of revenue, Non-GAAP | 133 | % | 114 | % | 136 | % | 127 | % | |||||||||||||||
21