
The New York Times Company Reports Third-Quarter 2022 Results
NEW YORK, November 2, 2022 – The New York Times Company (NYSE: NYT) announced today third-quarter 2022 diluted earnings per share from continuing operations of $.22 compared with $.32 in the same period of 2021. Adjusted diluted earnings per share from continuing operations (defined below) was $.21 in the third quarter of 2022 compared with $.23 in the third quarter of 2021.
Operating profit increased to $51.0 million in the third quarter of 2022 from $49.0 million in the same period of 2021 as higher digital subscription revenues at The New York Times Group segment more than offset expected operating losses at The Athletic Media Company (“The Athletic”). Adjusted operating profit (defined below) increased to $69.0 million from $65.1 million in the prior year, as a result of the same drivers. Adjusted operating profit at The New York Times Group segment increased to $78.6 million from $65.1 million as digital subscription revenues more than offset lower print subscription, print advertising and other revenues. See “Key Highlights” on the following page for additional metrics.
Meredith Kopit Levien, president and chief executive officer, The New York Times Company, said, “The biggest story of our third quarter was continued progress on the bundle, with mounting evidence that our strategy is working. It was our best quarter yet for bundle net additions, with a record number of starts and a record percentage of our total starts taking the bundle. As a result of our efforts, we now have more than a million bundle subscribers, well on our way to our next mile marker of 15 million subscribers by 2027.
“Our third quarter results demonstrate steady progress toward becoming the ‘essential subscription’ for every English-speaking person seeking to understand and engage with the world. We did so by advancing the three pillars of our strategy: leading in news, helping people make the most of their lives and passions, and putting those ideas together in a bundle that makes The Times indispensable in the daily lives of millions more people.
“With three quarters of the year behind us, we are improving our outlook for full-year 2022 results and expect adjusted operating profit between $320 and $330 million, even with the dilution from our acquisition of The Athletic, which is on the high-end of the full year guidance range we provided in February.
“Our third-quarter results, including the 180,000 net digital-only subscriber additions, support our confidence in our strategy, and reinforce our conviction in the long-term opportunity for The New York Times Company. Even in an uncertain macroeconomic environment, it’s clear The Times has a powerful, multi-revenue stream model with great unit economics and we're aggressively chasing the tailwinds that will best position us to grow revenue and profit.”
Key Highlights
(In millions, except percentages, subscriber metrics (in thousands), Average revenue per user (“ARPU”) and per share data)
| Q3 2022 | Q2 2022 | Q1 2022 | Q4 2021 | Q3 2021 | ||||||||||||||||||||||||||||
| Operating profit | $ | 51.0 | $ | 51.7 | $ | 6.3 | $ | 94.1 | $ | 49.0 | ||||||||||||||||||||||
| Operating profit margin % | 9.3 | % | 9.3 | % | 1.2 | % | 15.8 | % | 9.6 | % | ||||||||||||||||||||||
Adjusted operating profit (“AOP”)(1) | $ | 69.0 | $ | 76.2 | $ | 60.9 | $ | 109.3 | $ | 65.1 | ||||||||||||||||||||||
AOP margin %(1) | 12.6 | % | 13.7 | % | 11.3 | % | 18.4 | % | 12.8 | % | ||||||||||||||||||||||
| AOP - The New York Times Group (“NYTG”) | $ | 78.6 | $ | 88.8 | $ | 67.7 | $ | 109.3 | $ | 65.1 | ||||||||||||||||||||||
| AOP margin % - NYTG | 15.0 | % | 16.6 | % | 12.9 | % | 18.4 | % | 12.8 | % | ||||||||||||||||||||||
| AOP - The Athletic | $ | (9.6) | $ | (12.6) | $ | (6.8) | $ | — | $ | — | ||||||||||||||||||||||
| Total revenue | $ | 547.7 | $ | 555.7 | $ | 537.4 | $ | 594.2 | $ | 509.1 | ||||||||||||||||||||||
| % change year over year | 7.6 | % | 11.5 | % | 13.6 | % | 16.7 | % | 19.3 | % | ||||||||||||||||||||||
| Digital-only subscription revenue | $ | 243.9 | $ | 238.7 | $ | 226.8 | $ | 205.5 | $ | 198.6 | ||||||||||||||||||||||
| % change year over year | 22.8 | % | 25.5 | % | 26.3 | % | 23.1 | % | 27.9 | % | ||||||||||||||||||||||
| Digital advertising revenue | $ | 70.3 | $ | 69.3 | $ | 67.0 | $ | 111.1 | $ | 67.0 | ||||||||||||||||||||||
| % change year over year | 4.9 | % | (2.4) | % | 12.6 | % | 23.3 | % | 40.2 | % | ||||||||||||||||||||||
| Operating costs | $ | 503.8 | $ | 504.0 | $ | 496.4 | $ | 500.1 | $ | 460.1 | ||||||||||||||||||||||
| % change year over year | 9.5 | % | 19.6 | % | 17.8 | % | 16.6 | % | 18.8 | % | ||||||||||||||||||||||
Adjusted operating costs(1) | $ | 478.7 | $ | 479.5 | $ | 476.5 | $ | 484.9 | $ | 444.1 | ||||||||||||||||||||||
| % change year over year | 7.8 | % | 18.2 | % | 17.7 | % | 17.8 | % | 19.9 | % | ||||||||||||||||||||||
| Total subscribers | 9,330 | 9,170 | 9,010 | 7,578 | 7,352 | |||||||||||||||||||||||||||
| Digital-only subscribers | 8,590 | 8,410 | 8,230 | 6,783 | 6,546 | |||||||||||||||||||||||||||
Digital-only subscribers net additions (2) | 180 | 180 | 418 | 237 | 356 | |||||||||||||||||||||||||||
| Digital-only subscriber ARPU | $ | 8.87 | $ | 8.83 | $ | 9.13 | $ | 9.60 | $ | 9.64 | ||||||||||||||||||||||
| % change year over year | (8.0) | % | (7.5) | % | (0.5) | % | 5.0 | % | 4.1 | % | ||||||||||||||||||||||
| Diluted earnings per share (“EPS”) | $ | 0.22 | $ | 0.37 | $ | 0.03 | $ | 0.41 | $ | 0.32 | ||||||||||||||||||||||
Adjusted diluted EPS(1) | $ | 0.21 | $ | 0.24 | $ | 0.19 | $ | 0.43 | $ | 0.23 | ||||||||||||||||||||||
| Diluted shares | 166.5 | 167.6 | 168.3 | 168.6 | 168.5 | |||||||||||||||||||||||||||
(1) Non-GAAP metric. See “Reconciliation of Non-GAAP Information” for more details. (2) Q1 2022 net additions do not include 1,029,000 digital-only subscribers added when the Company acquired The Athletic. | ||||||||||||||||||||||||||||||||
Comparisons
Unless otherwise noted, all comparisons are for the third quarter of 2022 to the third quarter of 2021.
Beginning with the second quarter of 2022, the Company has updated its rounding methodology for subscribers (including net subscriber additions), subscriptions (including net subscription additions) and subscriber-related metrics (other than ARPU) and will round to the nearest ten thousand instead of the nearest thousand as it had previously been presenting.
This release presents certain non-GAAP financial measures, including operating profit before depreciation, amortization, severance, multiemployer pension plan withdrawal costs and special items (or adjusted operating profit, and as expressed as a percentage of revenues, adjusted operating profit margin); operating costs before depreciation, amortization, severance and multiemployer pension plan withdrawal costs (or adjusted operating costs); and diluted earnings per share from continuing operations excluding severance, non-operating retirement costs and special items (or adjusted diluted earnings per share from continuing operations). Refer to “Reconciliation of Non-GAAP Information” in the exhibits for a discussion of management’s reasons for the presentation of these non-GAAP financial measures and reconciliations to the most comparable GAAP financial measures. Certain guidance is provided on a non-GAAP basis and
2
not reconciled to the most directly comparable GAAP measure due to the inherent difficulty of forecasting amounts necessary for such reconciliation.
Third quarter 2022 results included the following special item:
•A $7.1 million gain ($5.2 million or $0.03 per share after tax) related to a multiemployer pension liability adjustment.
Third quarter 2021 results included the following special item:
•A $27.2 million gain ($19.8 million or $.12 per share after tax) related to a non-marketable equity investment transaction. The gain is included in Interest income and other, net in our Condensed Consolidated Statements of Operations.
Consolidated Results from Continuing Operations
Revenues
Total revenues for the third quarter of 2022 increased 7.6 percent to $547.7 million from $509.1 million in the third quarter of 2021. Subscription revenues increased 11.7 percent to $382.7 million, advertising revenues decreased 0.4 percent to $110.5 million and other revenues decreased 1.9 percent to $54.5 million.
Subscription revenues in the third quarter of 2022 rose primarily due to the large number of subscribers whose introductory promotional subscriptions have graduated to higher prices, growth in the number of subscribers to the Company’s digital-only products, as well as the inclusion of subscription revenue from The Athletic. Subscription revenue from digital-only products increased 22.8 percent, to $243.9 million. Print subscription revenues decreased 3.6 percent to $138.8 million, largely due to lower domestic home delivery revenue, which declined 3.3 percent.
The Company ended the third quarter of 2022 with approximately 9.33 million paid subscribers with approximately 10.75 million paid subscriptions across its print and digital products. Of the 9.33 million subscribers, approximately 8.59 million were paid digital-only subscribers with approximately 10.02 million paid digital-only subscriptions.
Compared with the end of the second quarter of 2022, there was a net increase of 180,000 digital-only subscribers and 210,000 digital-only subscriptions. Compared with the end of the third quarter of 2021, there was a net increase of 1,010,000 digital-only subscribers and 1,230,000 digital-only subscriptions. The year-over-year result excludes approximately 1,029,000 subscribers and 1,161,000 subscriptions that were added as a result of the acquisition of The Athletic in the first quarter of 2022. The Company provided the ability to access The Athletic to additional digital bundle subscribers in the third quarter of 2022. Digital-only subscribers with The Athletic increased by 600,000, largely as a result of this action.
Third-quarter 2022 digital advertising revenue increased 4.9 percent and print advertising revenue decreased 8.5 percent. Digital advertising revenue was $70.3 million, or 63.6 percent of total Company advertising revenues, compared with $67.0 million, or 60.4 percent, in the third quarter of 2021. Digital advertising revenue increased primarily as a result of higher direct-sold advertising at The New York Times Group and the addition of advertising revenue from The Athletic, which more than offset lower revenue from fewer programmatic advertising impressions and pressure from the macroeconomic environment. Print advertising revenue decreased primarily in the advocacy and media categories and was also impacted by macroeconomic factors.
3
Other revenues decreased 1.9 percent in the third quarter of 2022, primarily as a result of lower licensing revenue, which was partially offset by higher Wirecutter affiliate and live event revenues.
Operating Costs
Total operating costs increased 9.5 percent in the third quarter of 2022 to $503.8 million compared with $460.1 million in the third quarter of 2021, while adjusted operating costs increased 7.8 percent to $478.7 million from $444.1 million in the third quarter of 2021. Operating costs that we refer to as “technology costs,” consisting of product development costs as well as components of costs of revenues and general and administrative costs as described below, increased 20.1 percent to $92.1 million compared with $76.7 million in the third quarter of 2021.
Cost of revenue increased 14.7 percent to $294.9 million compared with $257.0 million in the third quarter of 2021, largely due to our acquisition of The Athletic, as well as growth in the number of employees who work in the newsroom and higher subscriber servicing costs. Technology costs in cost of revenue, which consist primarily of costs related to content delivery and subscriber technology, increased 18.1 percent to $25.4 million compared with $21.5 million in the third quarter of 2021.
Sales and marketing costs decreased 22.7 percent to $64.7 million compared with $83.8 million in the third quarter of 2021 due to lower media expenses at The New York Times Group, which was partially offset by The Athletic sales and marketing costs. Media expenses, a component of sales and marketing costs that represents the cost to promote our subscription business, decreased 44.7 percent to $30.6 million in the third quarter of 2022 from $55.3 million in 2021.
Product development costs increased 24.2 percent to $50.5 million compared with $40.6 million in the third quarter of 2021, largely due to growth in the number of digital product development employees in connection with digital subscription strategic initiatives as well as our acquisition of The Athletic. All product development costs are technology costs.
General and administrative costs increased 11.7 percent to $72.0 million compared with $64.4 million in the third quarter of 2021, largely due to growth in the number of employees, our acquisition of The Athletic and higher severance expense. Technology costs in general and administrative, which consist primarily of costs related to enterprise technology and information security, increased 11.4 percent to $16.2 million compared with $14.5 million in the third quarter of 2021.
Business Segment Results
Beginning in the first quarter of 2022, we have two reportable segments: The New York Times Group and The Athletic. Management uses adjusted operating profit (loss) by segment in assessing performance and allocating resources. The Company includes in its presentation revenues and adjusted operating costs to arrive at adjusted operating profit (loss) by segment. Adjusted operating costs are defined as operating costs before depreciation and amortization, severance and multiemployer pension plan withdrawal costs. Adjusted operating profit is defined as operating profit before depreciation and amortization, severance, multiemployer pension plan withdrawal costs and special items. Refer to Segment Information in the exhibits for more information on these segment measures.
The New York Times Group
The New York Times Group revenues grew 2.8 percent in the third quarter of 2022 to $523.6 million from $509.1 million in the third quarter of 2021. Subscription revenues increased 5.4 percent to $361.0 million from $342.6 million in the third quarter of 2021, primarily due to growth in subscription revenues from digital-only products. Advertising revenues decreased 2.5 percent to $108.1 million from $110.9 million in the third quarter of 2021 due to lower print advertising revenues.
4
The New York Times Group adjusted operating costs were $445.0 million in the third quarter of 2022, flat compared to the prior year.
The New York Times Group adjusted operating profit increased 20.7 percent to $78.6 million from $65.1 million in the prior year as a result of higher digital-only subscription revenues.
The Athletic
Revenues at The Athletic totaled $24.1 million in the third quarter of 2022, primarily from subscription revenues.
The Athletic adjusted operating costs totaled $33.7 million in the third quarter of 2022, largely from cost of revenue, which is primarily related to journalism costs.
The Athletic adjusted operating loss totaled $9.6 million in the third quarter of 2022.
Consolidated Other Data
Interest Income and Other, net
Interest income and other, net in the third quarter of 2022 was $1.6 million compared with $28.6 million in the third quarter of 2021. The third quarter of 2021 included a $27.2 million gain from a non-marketable
equity investment transaction.
Income Taxes
The Company had income tax expense of $14.2 million in the third quarter of 2022 compared with income tax expense of $20.3 million in the third quarter of 2021. The effective income tax rate was 28.0 percent in the third quarter of 2022 and 27.1 percent in the third quarter of 2021. The decrease in income tax expense was primarily due to lower income from continuing operations in the third quarter of 2022.
Earnings Per Share
Diluted earnings per share from continuing operations in the third quarter of 2022 was $.22 compared with $.32 in the same period of 2021. Adjusted earnings per share from continuing operations was $.21 in the third quarter of 2022 compared with $.23 in the third quarter of 2021.
Liquidity
As of September 25, 2022, the Company had cash and marketable securities of $468.6 million, a decrease of $605.8 million from $1.07 billion as of December 26, 2021. Approximately $550.0 million was used to fund the purchase price of The Athletic in February 2022.
In February 2022, the Board of Directors approved a $150 million Class A stock repurchase program. As of October 28, 2022, we had repurchased 2,778,380 shares for approximately $93.1 million and $56.9 million remained under this authorization.
The Company has an unsecured revolving line of credit. As of September 25, 2022, there were no outstanding borrowings under the credit facility, and the Company did not have other outstanding debt.
Capital Expenditures
Capital expenditures totaled approximately $9 million in the third quarter of 2022 compared with approximately $11 million in the third quarter of 2021. The decrease in capital expenditures in 2022 was primarily driven by higher expenditures in the prior year related to improvements in our headquarters building. The expenditures in 2021 and 2022 were intended to address growth in the number of employees and to enhance technologies that support our transition to hybrid work with employees working both from the office and remotely.
5
Outlook
Below is the Company’s guidance for revenue and operating costs for the fourth quarter of 2022 compared with the fourth quarter of 2021. For The New York Times Group and the consolidated company, the comparison is to the consolidated results in the fourth quarter of 2021, before The Athletic acquisition. The guidance on The Athletic reflects our estimate of the impact The Athletic will have on fourth quarter consolidated results.
The Company has adopted a change to its fiscal calendar and as a result, the Company’s 2022 fiscal year will end on December 31, 2022 and thereafter be the calendar year. As a result, the Company’s 2022 fourth quarter will contain six additional days compared with the fourth quarter of 2021. The following outlook reflects the inclusion of the impact of these additional days.
| (14 weeks vs 13 weeks) | The New York Times Group | The Athletic (contribution to consolidated results) | The New York Times Company | ||||||||
| Digital-only subscription revenues | increase approximately 20% | 10 - 13 percentage points (pp) | increase 30 - 33% | ||||||||
| Total subscription revenues | increase 10 - 13% | 6 - 8 pp | increase 17 - 20% | ||||||||
| Digital advertising revenues | decrease approximately 10% | approximately 5 pp | decrease mid-single digits | ||||||||
| Total advertising revenues | decrease approximately 10% | approximately 3 pp | decrease mid-single digits | ||||||||
| Other revenue | increase low-single digits | n/a | increase low-single digits | ||||||||
| Operating costs | n/a | n/a | TK | ||||||||
| Adjusted operating costs | approximately flat | approximately 7 - 9 pp | increase 7 - 9% | ||||||||
In 2022, we expect adjusted operating profit between $320 and $330 million, which reflects expected growth in our core business before the impact from The Athletic.
The Company expects the following on a pre-tax basis in 2022 (including The Athletic):
•Depreciation and amortization: approximately $85 million,(1)
•Interest income and other, net: approximately $40 million,(2) and
•Capital expenditures: approximately $50 million.
(1) Annual outlook includes approximately $27.0 million intangibles amortization largely related to the acquisition of The Athletic.
(2) Includes a $34.2 million gain recorded in the second quarter of 2022 related to the sale of a portion of land at our printing and distribution facility in College Point, N.Y.
6
Conference Call Information
The Company’s third-quarter 2022 earnings conference call will be held on Wednesday, November 2, at 8:00 a.m. E.T.
A live webcast of the earnings conference call will be available at investors.nytco.com. Participants can pre-register for the telephone conference at https://dpregister.com/sreg/10171041/f46dccf130, which will generate dial-in instructions allowing participants to bypass an operator at the time of the call. Alternatively, to access the call without pre-registration, dial 844-413-3940 (in the U.S.) or 412-858-5208 (international callers).
An archive of the webcast will be available beginning about two hours after the call at investors.nytco.com. The archive will be available for approximately three months. An audio replay will be available at 877-344-7529 (in the U.S.) and 412-317-0088 (international callers) beginning approximately two hours after the call until 11:59 p.m. E.T. on Wednesday, November 16. The replay access code is 7405716.
The New York Times Company (NYSE: NYT) is a trusted source of quality, independent journalism whose mission is to seek the truth and help people understand the world. With more than 9 million subscribers accounting for more than 10 million subscriptions across a diverse array of print and digital products — from news to cooking to games to sports — The Times Company has evolved from a local and regional news leader into a diversified media company with curious readers, listeners and viewers around the globe. Follow news about the company at NYTCo.com.
Except for the historical information contained herein, the matters discussed in this press release are forward-looking statements within the meaning of Section 27A of the Securities Act of 1933, as amended, and Section 21E of the Securities Exchange Act of 1934, as amended. Terms such as “aim,” “anticipate,” “believe,” “confidence,” “contemplate,” “continue,” “conviction,” “could,” “drive,” “estimate,” “expect,” “forecast,” “future,” “goal,” “guidance,” “intend,” “likely,” “may,” “might,” “objective,” “opportunity,” “optimistic,” “outlook,” “plan,” “position,” “potential,” “predict,” “project,” “seek,” “should,” “strategy,” “target,” “will,” “would” or similar statements or variations of such words and other similar expressions are intended to identify forward-looking statements, although not all forward-looking statements contain such terms. Forward-looking statements are based upon our current expectations, estimates and assumptions and involve risks and uncertainties that change over time; actual results could differ materially from those predicted by such forward-looking statements. These risks and uncertainties include, but are not limited to: significant competition in all aspects of our business; our ability to grow the size and profitability of our subscriber base; our dependence on metrics that are subject to inherent challenges in measurement; our ability to improve and scale our technical and data infrastructure and respond and adapt to changes in technology and consumer behavior; numerous factors that affect our advertising revenues, including economic conditions, market dynamics, evolving digital advertising trends and the evolution of our strategy; damage to our brand or reputation; the impact of the Covid-19 pandemic; economic, geopolitical and other risks associated with the international scope of our business and foreign operations; our ability to attract and maintain a talented and diverse workforce; the impact of labor negotiations and agreements; adverse results from litigation or governmental investigations; risks associated with the acquisition of The Athletic, including, among others, those related to our ability to realize the anticipated benefits of the acquisition, our ability to meet our publicly announced guidance about the impact of the acquisition, and the risks associated with The Athletic’s business and operations; the risks and challenges associated with investments we make in new and existing products and services, including The Athletic; risks associated with other acquisitions, divestitures, investments and other transactions; potential effects on our operating flexibility as a result of the nature of significant portions of our expenses; the effects of the size and volatility of our pension plan obligations; liabilities that may result from our participation in multiemployer
7
pension plans; significant disruptions in our newsprint supply chain or newspaper printing and distribution channels or a significant increase in the costs to print and distribute our newspaper; security breaches and other network and information systems disruptions; our ability to comply with laws and regulations, including with respect to privacy, data protection and consumer marketing practices; payment processing risk; defects, delays or interruptions in the cloud-based hosting services we utilize; our ability to protect our intellectual property; claims of intellectual property infringement that we have been, and may be in the future, be subject to; the effects of restrictions on our operations as a result of the terms of our credit facility; our future access to capital markets and other financing options; and the concentration of control of our company due to our dual-class capital structure.
More information regarding these risks and uncertainties and other important factors that could cause actual results to differ materially from those in the forward-looking statements is set forth in the Company’s filings with the Securities and Exchange Commission, including its Annual Report on Form 10-K for the year ended December 26, 2021, and subsequent filings. Investors are cautioned not to place undue reliance on any such forward-looking statements, which speak only as of the date they are made. The Company undertakes no obligation to publicly update or revise any forward-looking statement, whether as a result of new information, future events or otherwise.
Exhibits: Condensed Consolidated Statements of Operations
Footnotes
Segment Information
Reconciliation of Non-GAAP Information
Contacts:
Media: Danielle Rhoades Ha, 212-556-8719; [email protected]
Investors: Harlan Toplitzky, 212-556-7775; [email protected]
8
| THE NEW YORK TIMES COMPANY | |||||||||||||||||||||||||||||||||||
| CONDENSED CONSOLIDATED STATEMENTS OF OPERATIONS | |||||||||||||||||||||||||||||||||||
| (Dollars and shares in thousands, except per share data) | |||||||||||||||||||||||||||||||||||
| Third Quarter | Nine Months | ||||||||||||||||||||||||||||||||||
| 2022 | 2021 | % Change | 2022 | 2021 | % Change | ||||||||||||||||||||||||||||||
| Revenues | |||||||||||||||||||||||||||||||||||
Subscription(a) | $ | 382,672 | $ | 342,609 | 11.7 | % | $ | 1,138,270 | $ | 1,010,910 | 12.6 | % | |||||||||||||||||||||||
Advertising(b) | 110,467 | 110,887 | (0.4) | % | 344,116 | 320,777 | 7.3 | % | |||||||||||||||||||||||||||
Other(c) | 54,541 | 55,607 | (1.9) | % | 158,399 | 148,958 | 6.3 | % | |||||||||||||||||||||||||||
| Total revenues | 547,680 | 509,103 | 7.6 | % | 1,640,785 | 1,480,645 | 10.8 | % | |||||||||||||||||||||||||||
| Operating costs | |||||||||||||||||||||||||||||||||||
| Cost of revenue (excluding depreciation and amortization) | 294,856 | 256,978 | 14.7 | % | 876,804 | 759,333 | 15.5 | % | |||||||||||||||||||||||||||
| Sales and marketing | 64,732 | 83,767 | (22.7) | % | 205,089 | 197,475 | 3.9 | % | |||||||||||||||||||||||||||
| Product development | 50,474 | 40,638 | 24.2 | % | 148,729 | 119,280 | 24.7 | % | |||||||||||||||||||||||||||
| General and administrative | 71,970 | 64,418 | 11.7 | % | 212,468 | 183,278 | 15.9 | % | |||||||||||||||||||||||||||
Depreciation and amortization (d) | 21,760 | 14,326 | 51.9 | % | 61,150 | 43,529 | 40.5 | % | |||||||||||||||||||||||||||
| Total operating costs | 503,792 | 460,127 | 9.5 | % | 1,504,240 | 1,302,895 | 15.5 | % | |||||||||||||||||||||||||||
Acquisition-related costs (e) | — | — | — | 34,712 | — | * | |||||||||||||||||||||||||||||
Gain from pension liability adjustment (f) | (7,127) | — | * | (7,127) | — | * | |||||||||||||||||||||||||||||
Lease termination charge (g) | — | — | — | — | 3,831 | * | |||||||||||||||||||||||||||||
| Operating profit | 51,015 | 48,976 | 4.2 | % | 108,960 | 173,919 | (37.4) | % | |||||||||||||||||||||||||||
| Other components of net periodic benefit costs | 1,757 | 2,599 | (32.4) | % | 4,903 | 7,796 | (37.1) | % | |||||||||||||||||||||||||||
Interest income and other, net (h) | 1,579 | 28,569 | (94.5) | % | 38,258 | 31,953 | 19.7 | % | |||||||||||||||||||||||||||
| Income from continuing operations before income taxes | 50,837 | 74,946 | (32.2) | % | 142,315 | 198,076 | (28.2) | % | |||||||||||||||||||||||||||
| Income tax expense | 14,220 | 20,290 | (29.9) | % | 39,196 | 47,994 | (18.3) | % | |||||||||||||||||||||||||||
| Net income attributable to The New York Times Company common stockholders | $ | 36,617 | $ | 54,656 | (33.0) | % | $ | 103,119 | $ | 150,082 | (31.3) | % | |||||||||||||||||||||||
| Average number of common shares outstanding: | |||||||||||||||||||||||||||||||||||
| Basic | 166,433 | 168,027 | (0.9) | % | 167,290 | 167,895 | (0.4) | % | |||||||||||||||||||||||||||
| Diluted | 166,497 | 168,546 | (1.2) | % | 167,418 | 168,492 | (0.6) | % | |||||||||||||||||||||||||||
| Basic earnings per share attributable to The New York Times Company common stockholders | $ | 0.22 | $ | 0.33 | (33.3) | % | $ | 0.62 | $ | 0.89 | (30.3) | % | |||||||||||||||||||||||
| Diluted earnings per share attributable to The New York Times Company common stockholders | $ | 0.22 | $ | 0.32 | (31.3) | % | $ | 0.62 | $ | 0.89 | (30.3) | % | |||||||||||||||||||||||
| Dividends declared per share | $ | 0.09 | $ | 0.07 | 28.6 | % | $ | 0.18 | $ | 0.14 | 28.6 | % | |||||||||||||||||||||||
| * Represents a change equal to or in excess of 100% or not meaningful. | |||||||||||||||||||||||||||||||||||
| See footnotes pages for additional information. | |||||||||||||||||||||||||||||||||||
9
| THE NEW YORK TIMES COMPANY | ||||||||||||||||||||||||||||||||||||||
| FOOTNOTES | ||||||||||||||||||||||||||||||||||||||
| (Amounts in thousands) | ||||||||||||||||||||||||||||||||||||||
| (a) The following table summarizes digital and print subscription revenues for the third quarters and first nine months of 2022 and 2021: | ||||||||||||||||||||||||||||||||||||||
| Third Quarter | Nine Months | |||||||||||||||||||||||||||||||||||||
| 2022 | 2021 | % Change | 2022 | 2021 | % Change | |||||||||||||||||||||||||||||||||
Digital-only subscription revenues (1) | $ | 243,889 | $ | 198,633 | 22.8 | % | $ | 709,378 | $ | 568,378 | 24.8 | % | ||||||||||||||||||||||||||
| Print subscription revenues: | ||||||||||||||||||||||||||||||||||||||
Domestic home delivery subscription revenues (2) | 124,653 | 128,895 | (3.3) | % | 387,125 | 398,045 | (2.7) | % | ||||||||||||||||||||||||||||||
Single-copy, NYT International and Other subscription revenues (3) | 14,130 | 15,081 | (6.3) | % | 41,767 | 44,487 | (6.1) | % | ||||||||||||||||||||||||||||||
| Subtotal print subscription revenues | 138,783 | 143,976 | (3.6) | % | 428,892 | 442,532 | (3.1) | % | ||||||||||||||||||||||||||||||
| Total subscription revenues | $ | 382,672 | $ | 342,609 | 11.7 | % | $ | 1,138,270 | $ | 1,010,910 | 12.6 | % | ||||||||||||||||||||||||||
(1) Includes revenue from digital-only bundled and standalone subscriptions to our news product, as well as The Athletic and our Games, Cooking, Audm and Wirecutter products. | ||||||||||||||||||||||||||||||||||||||
(2) Domestic home delivery subscriptions include access to our digital news product, as well as The Athletic and our Games, Cooking and Wirecutter products. | ||||||||||||||||||||||||||||||||||||||
(3) NYT International is the international edition of our print newspaper. | ||||||||||||||||||||||||||||||||||||||
We offer a digital subscription package (or “bundle”) that includes access to our digital news product, as well as The Athletic and our Games, Cooking and Wirecutter products. We also offer standalone digital subscriptions to our digital news product, as well as to The Athletic, and our Games, Cooking, Audm and Wirecutter products. The Company has set out below the number of digital-only, print and total subscribers to the Company’s products as well as certain additional metrics, including average revenue per subscriber. A digital-only subscriber is defined as a subscriber who has subscribed (and provided a valid method of payment) for the right to access one or more of the Company’s digital products.
| The following table summarizes digital and print subscribers as of the end of the five most recent fiscal quarters: | ||||||||||||||||||||||||||||||||
| Q3 2022 | Q2 2022 | Q1 2022 | Q4 2021 | Q3 2021 | ||||||||||||||||||||||||||||
Digital-only subscribers (1) | 8,590 | 8,410 | 8,230 | 6,783 | 6,546 | |||||||||||||||||||||||||||
Print subscribers(2) | 740 | 760 | 780 | 795 | 806 | |||||||||||||||||||||||||||
Total subscribers (3) | 9,330 | 9,170 | 9,010 | 7,578 | 7,352 | |||||||||||||||||||||||||||
(1) Subscribers with paid digital-only subscriptions to one or more of our news product, The Athletic, or our Games, Cooking and Wirecutter products. Subscribers with a paid domestic home-delivery print subscription to The New York Times are excluded. The number of digital-only subscribers includes group corporate and group education subscriptions (which collectively represented approximately 4% of paid digital-only subscriptions as of the third quarter of 2022). The number of group subscribers is derived using the value of the relevant contract and a discounted subscription rate. | ||||||||||||||||||||||||||||||||
(2) Subscribers with a paid domestic home delivery or mail print subscription to The New York Times, which also includes access to our digital news product, as well as The Athletic and our Games, Cooking and Wirecutter products, or a paid print subscription to our Book Review or Large Type Weekly products. Book Review, Mail and Large Type Weekly subscribers are included in the count of subscribers but not subscriptions. | ||||||||||||||||||||||||||||||||
(3) The sum of individual metrics may not always equal total amounts indicated due to rounding. | ||||||||||||||||||||||||||||||||
10
| THE NEW YORK TIMES COMPANY | ||||||||||||||||||||||||||||||||
| FOOTNOTES | ||||||||||||||||||||||||||||||||
| (Amounts in thousands, except for ARPU) | ||||||||||||||||||||||||||||||||
The following table summarizes supplementary subscriber metrics as of the end of the five most recent fiscal quarters: | ||||||||||||||||||||||||||||||||
| Q3 2022 | Q2 2022 | Q1 2022 | Q4 2021 | Q3 2021 | ||||||||||||||||||||||||||||
Digital-only subscriber ARPU(1) | $ | 8.87 | $ | 8.83 | $ | 9.13 | $ | 9.60 | $ | 9.64 | ||||||||||||||||||||||
Digital-only bundle and multiproduct subscribers(2) | 2,130 | 1,980 | 1,835 | 1,607 | 1,491 | |||||||||||||||||||||||||||
Digital-only subscribers with News(3) | 6,210 | 6,140 | 6,101 | 5,826 | 5,665 | |||||||||||||||||||||||||||
Digital-only subscribers with The Athletic(4) | 2,290 | 1,690 | 1,216 | — | — | |||||||||||||||||||||||||||
(1) “Digital-only subscriber Average Revenue per User” or “Digital-only subscriber ARPU” is calculated by dividing the average monthly digital subscription revenue (calculated by dividing digital subscription revenue in the quarter by 3.25 to reflect a 28-day billing cycle) in the measurement period by the average number of digital subscribers during the period. | ||||||||||||||||||||||||||||||||
(2) Subscribers with a digital bundle or paid digital-only subscriptions that include access to two or more of the Company’s products, including through separate standalone subscriptions. This metric was previously called “Total Multiproduct subscribers” and included subscribers with a print home-delivery subscription. The four quarters prior to the third quarter of 2022 have been recast to reflect this change. | ||||||||||||||||||||||||||||||||
(3) Subscribers with a paid digital-only subscription that includes the ability to access the Company’s digital news product. | ||||||||||||||||||||||||||||||||
(4) Subscribers with a paid digital-only subscription that includes the ability to access The Athletic. This metric was previously called “Subscribers with The Athletic”. | ||||||||||||||||||||||||||||||||
| While the Company is moving toward an emphasis on individual subscriber growth rather than growth of total subscriptions, we expect to continue to report on the number of subscriptions at least through the fourth quarter of 2022. The following table summarizes digital and print subscriptions as of the end of the five most recent fiscal quarters: | ||||||||||||||||||||||||||||||||
| Q3 2022 | Q2 2022 | Q1 2022 | Q4 2021 | Q3 2021 | ||||||||||||||||||||||||||||
Digital-only subscriptions(1) | 10,020 | 9,810 | 9,579 | 8,005 | 7,630 | |||||||||||||||||||||||||||
Print subscriptions(2) | 730 | 750 | 770 | 784 | 795 | |||||||||||||||||||||||||||
Total subscriptions(3) | 10,750 | 10,560 | 10,349 | 8,789 | 8,425 | |||||||||||||||||||||||||||
(1) Paid digital-only subscriptions to our news product, as well as The Athletic and our Games, Cooking, Audm and Wirecutter products. Standalone subscriptions to these products are counted separately and bundle subscriptions are counted as one subscription. The number of paid digital-only subscriptions includes group corporate and group education subscriptions (which collectively represented approximately 4% of paid digital-only subscriptions as of the third quarter of 2022). The number of group subscriptions is derived using the value of the relevant contract and a discounted subscription rate. | ||||||||||||||||||||||||||||||||
(2) Paid domestic home-delivery print subscriptions to The New York Times, which also include access to our digital news product, as well as The Athletic and our Games, Cooking and Wirecutter products. Excludes subscriptions to our Book Review or Large Type Weekly products and subscriptions to The New York Times that are delivered by mail. | ||||||||||||||||||||||||||||||||
(3) The sum of individual metrics may not always equal total amounts indicated due to rounding. | ||||||||||||||||||||||||||||||||
11
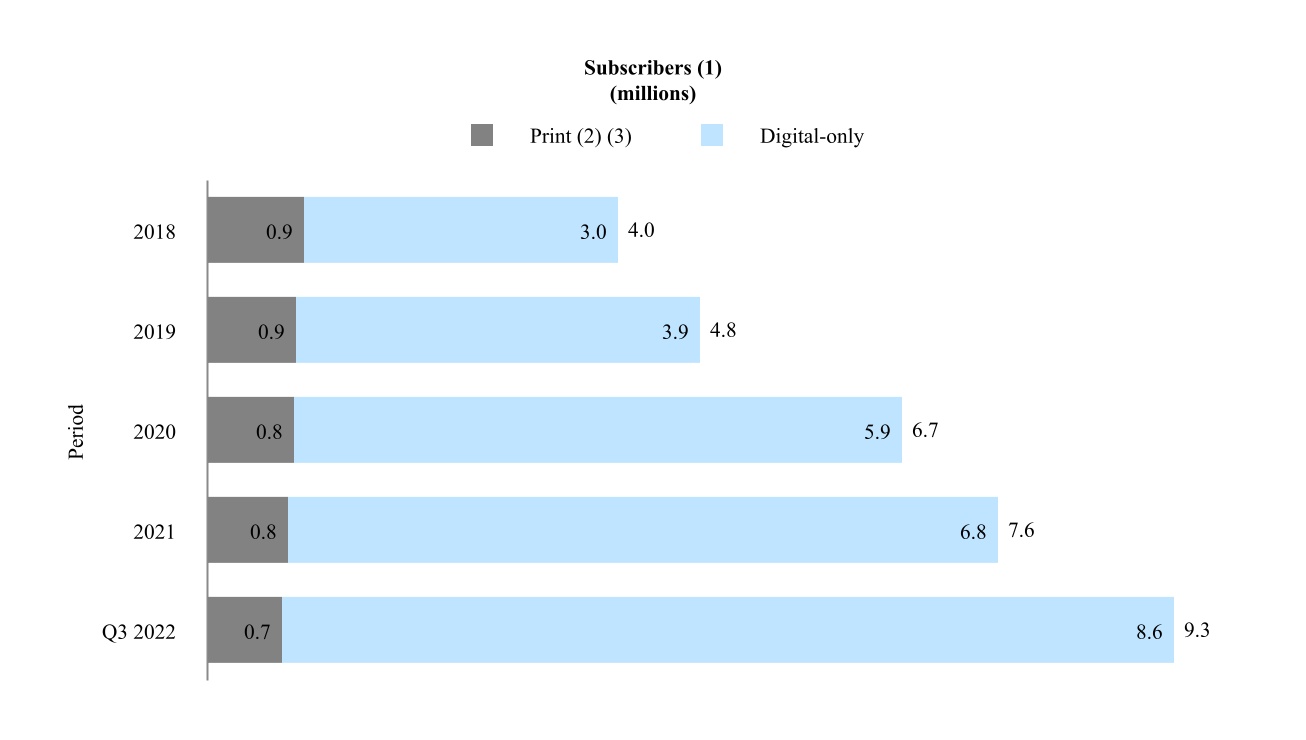
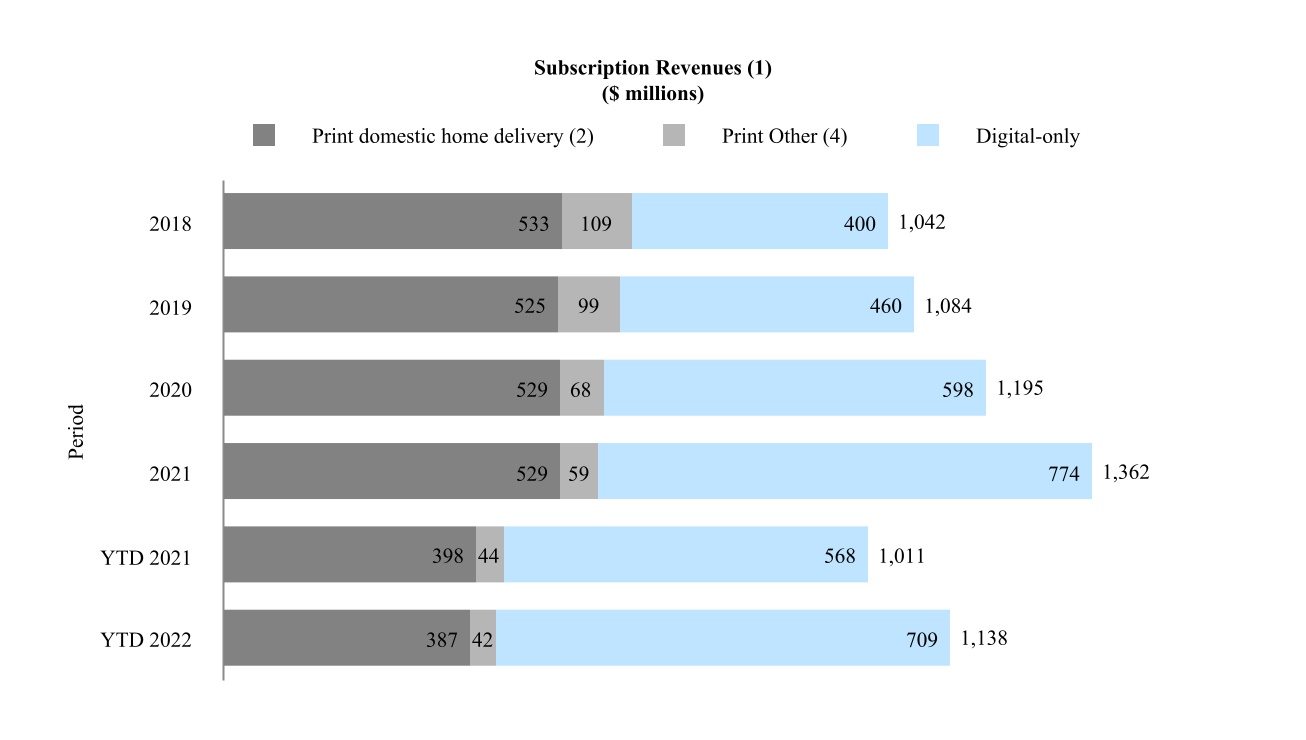
We believe that the significant growth over the last several years in subscribers to our products demonstrates the success of our “subscription-first” strategy and the willingness of our readers to pay for high-quality journalism. The Company is increasing its emphasis on subscriber growth rather than growth of total subscriptions. The following charts illustrate the growth in net digital-only subscribers and corresponding subscription revenues as well as the relative stability of our print domestic home delivery subscription products.
(1) Amounts may not add due to rounding.
(2) Includes access to some of our digital products.
(3) Includes Book Review, Mail and Large Type Weekly subscribers.
(4) Print Other includes single-copy, NYT International and other subscription revenues.
12
| THE NEW YORK TIMES COMPANY | ||||||||||||||||||||||||||||||||||||||
| FOOTNOTES | ||||||||||||||||||||||||||||||||||||||
| (Amounts in thousands) | ||||||||||||||||||||||||||||||||||||||
| (b) The following table summarizes digital and print advertising revenues for the third quarters and first nine months of 2022 and 2021: | ||||||||||||||||||||||||||||||||||||||
| Third Quarter | Nine Months | |||||||||||||||||||||||||||||||||||||
| 2022 | 2021 | % Change | 2022 | 2021 | % Change | |||||||||||||||||||||||||||||||||
| Advertising revenues: | ||||||||||||||||||||||||||||||||||||||
| Digital | $ | 70,282 | $ | 66,981 | 4.9 | % | $ | 206,588 | $ | 197,472 | 4.6 | % | ||||||||||||||||||||||||||
| 40,185 | 43,906 | (8.5) | % | 137,528 | 123,305 | 11.5 | % | |||||||||||||||||||||||||||||||
| Total advertising | $ | 110,467 | $ | 110,887 | (0.4) | % | $ | 344,116 | $ | 320,777 | 7.3 | % | ||||||||||||||||||||||||||
| (c) Other revenues primarily consist of revenues from licensing, Wirecutter affiliate referrals, commercial printing, the leasing of floors in the Company headquarters, retail commerce, television and film, our live events business, and our student subscription sponsorship program. Digital other revenues, which consist primarily of Wirecutter affiliate referral revenue, digital licensing revenue, and television and film revenue, totaled $28.5 million and $81.5 million for the third quarter and first nine months of 2022, respectively. | ||||||||||||||||||||||||||||||||||||||
| (d) Includes amortization of intangible assets related to our acquisitions of approximately $7 million and $18 million for the third quarter and first nine months of 2022, respectively. | ||||||||||||||||||||||||||||||||||||||
| (e) In the first quarter of 2022, the Company recorded acquisition-related costs, which primarily include expenses paid in connection with the acceleration of The Athletic stock options, and legal, accounting, financial advisory and integration planning expenses. | ||||||||||||||||||||||||||||||||||||||
| (f) In the third quarter of 2022, the Company recorded a $7.1 million gain resulting from a multiemployer pension liability adjustment. | ||||||||||||||||||||||||||||||||||||||
| (g) In the second quarter of 2021, the Company recorded a $3.8 million charge resulting from the termination of a tenant’s lease in our headquarters building. | ||||||||||||||||||||||||||||||||||||||
| (h) In the second quarter of 2022, the Company recorded a $34.2 million gain ($24.9 million or $0.15 per share after tax) related to an agreement to lease and subsequently sell approximately four acres of land at our printing and distribution facility in College Point, N.Y. | ||||||||||||||||||||||||||||||||||||||
13
| THE NEW YORK TIMES COMPANY | ||||||||||||||||||||||||||||||||||||||
| SEGMENT INFORMATION | ||||||||||||||||||||||||||||||||||||||
| (Amounts in thousands) | ||||||||||||||||||||||||||||||||||||||
The results of The Athletic have been included in our Condensed Consolidated Financial Statements beginning February 1, 2022, the date of the acquisition. The Athletic is a separate reportable segment of the Company. As a result, beginning in the first quarter of 2022, we have two reportable segments: The New York Times Group and The Athletic. Management uses adjusted operating profit (loss) by segment in assessing performance and allocating resources. The Company includes in its presentation revenues and adjusted operating costs to arrive at adjusted operating profit (loss) by segment. Adjusted operating costs are defined as operating costs before depreciation and amortization, severance and multiemployer pension plan withdrawal costs. Adjusted operating profit is defined as operating profit before depreciation and amortization, severance, multiemployer pension plan withdrawal costs and special items. Adjusted operating profit expressed as a percentage of revenues is referred to as adjusted operating profit margin. Subscription revenue from our digital subscription package (or “bundle”) is allocated to The New York Times Group and The Athletic. We allocate revenue first to our digital news product based on its list price and then the remaining bundle revenue is allocated to the other products in the bundle, including The Athletic, based on their relative list price. The direct variable expenses associated with the bundle, which include credit card fees, third party fees and sales taxes, are allocated to The New York Times Group and The Athletic based on a historical actual percentage of these costs to bundle revenue. | ||||||||||||||||||||||||||||||||||||||
| Third Quarter | Nine Months | |||||||||||||||||||||||||||||||||||||
| 2022 | 2021 | % Change | 2022 | 2021 | % Change | |||||||||||||||||||||||||||||||||
| Revenues | ||||||||||||||||||||||||||||||||||||||
| The New York Times Group | $ | 523,570 | $ | 509,103 | 2.8 | % | $ | 1,584,970 | $ | 1,480,645 | 7.0 | % | ||||||||||||||||||||||||||
| The Athletic | 24,110 | — | * | 55,815 | — | * | ||||||||||||||||||||||||||||||||
| Total revenues | $ | 547,680 | $ | 509,103 | 7.6 | % | $ | 1,640,785 | $ | 1,480,645 | 10.8 | % | ||||||||||||||||||||||||||
| Adjusted operating costs | ||||||||||||||||||||||||||||||||||||||
| The New York Times Group | $ | 445,020 | $ | 444,050 | 0.2 | % | $ | 1,349,880 | $ | 1,254,582 | 7.6 | % | ||||||||||||||||||||||||||
| The Athletic | 33,683 | — | * | 84,806 | — | * | ||||||||||||||||||||||||||||||||
| Total adjusted operating costs | $ | 478,703 | $ | 444,050 | 7.8 | % | $ | 1,434,686 | $ | 1,254,582 | 14.4 | % | ||||||||||||||||||||||||||
| Adjusted operating profit | ||||||||||||||||||||||||||||||||||||||
| The New York Times Group | $ | 78,550 | $ | 65,053 | 20.7 | % | $ | 235,090 | $ | 226,063 | 4.0 | % | ||||||||||||||||||||||||||
| The Athletic | (9,573) | — | * | (28,991) | — | * | ||||||||||||||||||||||||||||||||
| Total adjusted operating profit | $ | 68,977 | $ | 65,053 | 6.0 | % | $ | 206,099 | $ | 226,063 | (8.8) | % | ||||||||||||||||||||||||||
| AOP margin % - NYTG | 15.0 | % | 12.8 | % | 220 bps | 14.8 | % | 15.3 | % | (50) bps | ||||||||||||||||||||||||||||
| * Represents a change equal to or in excess of 100% or not meaningful. | ||||||||||||||||||||||||||||||||||||||
| Revenues detail by segment | ||||||||||||||||||||||||||||||||||||||
| Third Quarter | Nine Months | |||||||||||||||||||||||||||||||||||||
| 2022 | 2021 | % Change | 2022 | 2021 | % Change | |||||||||||||||||||||||||||||||||
| The New York Times Group | ||||||||||||||||||||||||||||||||||||||
| Subscription | $ | 360,997 | $ | 342,609 | 5.4 | % | $ | 1,089,218 | $ | 1,010,910 | 7.7 | % | ||||||||||||||||||||||||||
| Advertising | 108,134 | 110,887 | (2.5) | % | 337,455 | 320,777 | 5.2 | % | ||||||||||||||||||||||||||||||
| Other | 54,439 | 55,607 | (2.1) | % | 158,297 | 148,958 | 6.3 | % | ||||||||||||||||||||||||||||||
| Total | $ | 523,570 | $ | 509,103 | 2.8 | % | $ | 1,584,970 | $ | 1,480,645 | 7.0 | % | ||||||||||||||||||||||||||
| The Athletic | ||||||||||||||||||||||||||||||||||||||
| Subscription | $ | 21,675 | $ | — | * | $ | 49,052 | $ | — | * | ||||||||||||||||||||||||||||
| Advertising | 2,333 | — | * | 6,661 | — | * | ||||||||||||||||||||||||||||||||
| Other | 102 | — | * | 102 | — | * | ||||||||||||||||||||||||||||||||
| Total | $ | 24,110 | $ | — | * | $ | 55,815 | $ | — | * | ||||||||||||||||||||||||||||
| The New York Times Company | ||||||||||||||||||||||||||||||||||||||
| Subscription | $ | 382,672 | $ | 342,609 | 11.7 | % | $ | 1,138,270 | $ | 1,010,910 | 12.6 | % | ||||||||||||||||||||||||||
| Advertising | 110,467 | 110,887 | (0.4) | % | 344,116 | 320,777 | 7.3 | % | ||||||||||||||||||||||||||||||
| Other | 54,541 | 55,607 | (1.9) | % | 158,399 | 148,958 | 6.3 | % | ||||||||||||||||||||||||||||||
| Total | $ | 547,680 | $ | 509,103 | 7.6 | % | $ | 1,640,785 | $ | 1,480,645 | 10.8 | % | ||||||||||||||||||||||||||
| * Represents a change equal to or in excess of 100% or not meaningful. | ||||||||||||||||||||||||||||||||||||||
14
| THE NEW YORK TIMES COMPANY | ||||||||||||||||||||||||||||||||||||||
| SEGMENT INFORMATION | ||||||||||||||||||||||||||||||||||||||
| (Amounts in thousands) | ||||||||||||||||||||||||||||||||||||||
| Adjusted operating costs (operating costs before depreciation and amortization, severance and multiemployer pension plan withdrawal costs) detail by segment | ||||||||||||||||||||||||||||||||||||||
| Third Quarter | Nine Months | |||||||||||||||||||||||||||||||||||||
| 2022 | 2021 | % Change | 2022 | 2021 | % Change | |||||||||||||||||||||||||||||||||
| The New York Times Group | ||||||||||||||||||||||||||||||||||||||
| Cost of revenue (excluding depreciation and amortization) | $ | 274,945 | $ | 256,978 | 7.0 | % | $ | 824,405 | $ | 759,333 | 8.6 | % | ||||||||||||||||||||||||||
| Sales and marketing | 57,326 | 83,767 | (31.6) | % | 189,970 | 197,475 | (3.8) | % | ||||||||||||||||||||||||||||||
| Product development | 46,273 | 40,638 | 13.9 | % | 138,225 | 119,280 | 15.9 | % | ||||||||||||||||||||||||||||||
Adjusted general and administrative (1) | 66,476 | 62,667 | 6.1 | % | 197,280 | 178,494 | 10.5 | % | ||||||||||||||||||||||||||||||
| Total | $ | 445,020 | $ | 444,050 | 0.2 | % | $ | 1,349,880 | $ | 1,254,582 | 7.6 | % | ||||||||||||||||||||||||||
| The Athletic | ||||||||||||||||||||||||||||||||||||||
| Cost of revenue (excluding depreciation and amortization) | $ | 19,911 | $ | — | * | $ | 52,399 | $ | — | * | ||||||||||||||||||||||||||||
| Sales and marketing | 7,406 | — | * | 15,119 | — | * | ||||||||||||||||||||||||||||||||
| Product development | 4,201 | — | * | 10,504 | — | * | ||||||||||||||||||||||||||||||||
Adjusted general and administrative (2) | 2,165 | — | * | 6,784 | — | * | ||||||||||||||||||||||||||||||||
| Total | $ | 33,683 | $ | — | * | $ | 84,806 | $ | — | * | ||||||||||||||||||||||||||||
| The New York Times Company | ||||||||||||||||||||||||||||||||||||||
| Cost of revenue (excluding depreciation and amortization) | $ | 294,856 | $ | 256,978 | 14.7 | % | $ | 876,804 | $ | 759,333 | 15.5 | % | ||||||||||||||||||||||||||
| Sales and marketing | 64,732 | 83,767 | (22.7) | % | 205,089 | 197,475 | 3.9 | % | ||||||||||||||||||||||||||||||
| Product development | 50,474 | 40,638 | 24.2 | % | 148,729 | 119,280 | 24.7 | % | ||||||||||||||||||||||||||||||
| Adjusted general and administrative | 68,641 | 62,667 | 9.5 | % | 204,064 | 178,494 | 14.3 | % | ||||||||||||||||||||||||||||||
| Total | $ | 478,703 | $ | 444,050 | 7.8 | % | $ | 1,434,686 | $ | 1,254,582 | 14.4 | % | ||||||||||||||||||||||||||
(1) Excludes severance of $2.0 million and $4.5 million for the third quarter and first nine months of 2022, respectively, and multiemployer pension withdrawal costs of $1.3 million and $3.7 million for the third quarter and first nine months of 2022, respectively. Excludes severance of $0.5 million and $0.9 million for the third quarter and first nine months of 2021, respectively, and multiemployer pension withdrawal costs of $1.3 million and $3.9 million for the third quarter and first nine months of 2021, respectively. | ||||||||||||||||||||||||||||||||||||||
(2) Excludes $0.2 million of severance for the first nine months of 2022. | ||||||||||||||||||||||||||||||||||||||
| * Represents a change equal to or in excess of 100% or not meaningful. | ||||||||||||||||||||||||||||||||||||||
15
| THE NEW YORK TIMES COMPANY | ||||||||||||||||||||||||||||||||||||||
| RECONCILIATION OF NON-GAAP INFORMATION | ||||||||||||||||||||||||||||||||||||||
| In this release, the Company has referred to non-GAAP financial information with respect to diluted earnings per share from continuing operations excluding severance, non-operating retirement costs and special items (or adjusted diluted earnings per share from continuing operations); operating profit before depreciation, amortization, severance, multiemployer pension plan withdrawal costs and special items (or adjusted operating profit, and as divided by revenues, adjusted operating profit margin); and operating costs before depreciation, amortization, severance and multiemployer pension withdrawal costs (or adjusted operating costs). The Company has included these non-GAAP financial measures because management reviews them on a regular basis and uses them to evaluate and manage the performance of the Company’s operations. Management believes that, for the reasons outlined below, these non-GAAP financial measures provide useful information to investors as a supplement to reported diluted earnings/(loss) per share from continuing operations, operating profit/(loss) and operating costs. However, these measures should be evaluated only in conjunction with the comparable GAAP financial measures and should not be viewed as alternative or superior measures of GAAP results. | ||||||||||||||||||||||||||||||||||||||
| Adjusted diluted earnings per share provides useful information in evaluating the Company’s period-to-period performance because it eliminates items that the Company does not consider to be indicative of earnings from ongoing operating activities. Adjusted operating profit and adjusted operating profit margin are useful in evaluating the ongoing performance of the Company’s business as they exclude the significant non-cash impact of depreciation and amortization as well as items not indicative of ongoing operating activities. Total operating costs include depreciation, amortization, severance and multiemployer pension plan withdrawal costs. Total operating costs excluding these items provide investors with helpful supplemental information on the Company’s underlying operating costs that is used by management in its financial and operational decision-making. | ||||||||||||||||||||||||||||||||||||||
| Management considers special items, which may include impairment charges, pension settlement charges, acquisition-related costs and other items that arise from time to time, to be outside the ordinary course of our operations. Management believes that excluding these items provides a better understanding of the underlying trends in the Company’s operating performance and allows more accurate comparisons of the Company’s operating results to historical performance. In addition, management excludes severance costs, which may fluctuate significantly from quarter to quarter, because it believes these costs do not necessarily reflect expected future operating costs and do not contribute to a meaningful comparison of the Company’s operating results to historical performance. | ||||||||||||||||||||||||||||||||||||||
| Non-operating retirement costs include (i) interest cost, expected return on plan assets, amortization of actuarial gains and loss components and amortization of prior service credits of single-employer pension expense, (ii) interest cost, amortization of actuarial gains and loss components and amortization of prior service credits of retirement medical expense and (iii) all multiemployer pension plan withdrawal costs. These non-operating retirement costs are primarily tied to financial market performance including changes in market interest rates and investment performance. Management considers non-operating retirement costs to be outside the performance of the business and believes that presenting adjusted diluted earnings per share from continuing operations excluding non-operating retirement costs and presenting adjusted operating results excluding multiemployer pension plan withdrawal costs, in addition to the Company’s GAAP diluted earnings per share from continuing operations and GAAP operating results, provide increased transparency and a better understanding of the underlying trends in the Company’s operating business performance. | ||||||||||||||||||||||||||||||||||||||
| Reconciliations of these non-GAAP financial measures to the most directly comparable GAAP measures are set out in the tables below. | ||||||||||||||||||||||||||||||||||||||
16
| THE NEW YORK TIMES COMPANY | ||||||||||||||||||||||||||||||||||||||
| RECONCILIATION OF NON-GAAP INFORMATION | ||||||||||||||||||||||||||||||||||||||
| (Dollars in thousands, except per share data) | ||||||||||||||||||||||||||||||||||||||
| Reconciliation of diluted earnings per share from continuing operations excluding severance, non-operating retirement costs and special items (or adjusted diluted earnings per share from continuing operations) | ||||||||||||||||||||||||||||||||||||||
| Third Quarter | Nine Months | |||||||||||||||||||||||||||||||||||||
| 2022 | 2021 | % Change | 2022 | 2021 | % Change | |||||||||||||||||||||||||||||||||
| Diluted earnings per share from continuing operations | $ | 0.22 | $ | 0.32 | (31.3) | % | $ | 0.62 | $ | 0.89 | (30.3 | %) | ||||||||||||||||||||||||||
| Add: | ||||||||||||||||||||||||||||||||||||||
| Severance | 0.01 | — | * | 0.03 | 0.01 | * | ||||||||||||||||||||||||||||||||
| Non-operating retirement costs: | ||||||||||||||||||||||||||||||||||||||
| Multiemployer pension plan withdrawal costs | 0.01 | 0.01 | — | 0.02 | 0.02 | — | ||||||||||||||||||||||||||||||||
| Other components of net periodic benefit costs | 0.01 | 0.02 | (50.0) | % | 0.03 | 0.05 | (40.0) | % | ||||||||||||||||||||||||||||||
| Special items: | ||||||||||||||||||||||||||||||||||||||
| Acquisition-related costs | — | — | — | 0.21 | — | * | ||||||||||||||||||||||||||||||||
| Gain from non-marketable equity investment | — | (0.16) | * | — | (0.16) | * | ||||||||||||||||||||||||||||||||
| Lease termination charge | — | — | — | — | 0.02 | * | ||||||||||||||||||||||||||||||||
| Gain on the sale of land | — | — | — | (0.20) | — | * | ||||||||||||||||||||||||||||||||
| Gain from pension liability adjustment | (0.04) | — | * | (0.04) | — | * | ||||||||||||||||||||||||||||||||
| Income tax expense of adjustments | — | 0.04 | * | (0.01) | 0.02 | * | ||||||||||||||||||||||||||||||||
Adjusted diluted earnings per share from continuing operations(1) | $ | 0.21 | $ | 0.23 | (8.7) | % | $ | 0.65 | $ | 0.84 | (22.6) | % | ||||||||||||||||||||||||||
(1) Amounts may not add due to rounding. | ||||||||||||||||||||||||||||||||||||||
| * Represents a change equal to or in excess of 100% or not meaningful. | ||||||||||||||||||||||||||||||||||||||
17
| THE NEW YORK TIMES COMPANY | ||||||||||||||||||||||||||||||||||||||
| RECONCILIATION OF NON-GAAP INFORMATION | ||||||||||||||||||||||||||||||||||||||
| (Dollars in thousands, except per share data) | ||||||||||||||||||||||||||||||||||||||
| Reconciliation of operating profit before depreciation and amortization, severance, multiemployer pension plan withdrawal costs and special items (or adjusted operating profit) | ||||||||||||||||||||||||||||||||||||||
| Third Quarter | Nine Months | |||||||||||||||||||||||||||||||||||||
| 2022 | 2021 | % Change | 2022 | 2021 | % Change | |||||||||||||||||||||||||||||||||
| Operating profit | $ | 51,015 | $ | 48,976 | 4.2 | % | $ | 108,960 | $ | 173,919 | (37.4) | % | ||||||||||||||||||||||||||
| Add: | ||||||||||||||||||||||||||||||||||||||
| Depreciation and amortization | 21,760 | 14,326 | 51.9 | % | 61,150 | 43,529 | 40.5 | % | ||||||||||||||||||||||||||||||
| Severance | 2,010 | 476 | * | 4,670 | 882 | * | ||||||||||||||||||||||||||||||||
| Multiemployer pension plan withdrawal costs | 1,319 | 1,275 | 3.5 | % | 3,734 | 3,902 | (4.3) | % | ||||||||||||||||||||||||||||||
| Special items: | ||||||||||||||||||||||||||||||||||||||
| Acquisition-related costs | — | — | — | 34,712 | — | * | ||||||||||||||||||||||||||||||||
| Lease termination charge | — | — | — | — | 3,831 | * | ||||||||||||||||||||||||||||||||
| Gain from pension liability adjustment | (7,127) | — | * | (7,127) | — | * | ||||||||||||||||||||||||||||||||
| Adjusted operating profit | $ | 68,977 | $ | 65,053 | 6.0 | % | $ | 206,099 | $ | 226,063 | (8.8) | % | ||||||||||||||||||||||||||
| Divided by: | ||||||||||||||||||||||||||||||||||||||
| Revenue | $ | 547,680 | $ | 509,103 | 7.6 | % | $ | 1,640,785 | $ | 1,480,645 | 10.8 | % | ||||||||||||||||||||||||||
| Operating profit margin | 9.3 | % | 9.6% | (30) bps | 6.6% | 11.7% | (510) bps | |||||||||||||||||||||||||||||||
| Adjusted operating profit margin | 12.6 | % | 12.8% | (20) bps | 12.6% | 15.3% | (270) bps | |||||||||||||||||||||||||||||||
| * Represents a change equal to or in excess of 100% or not meaningful. | ||||||||||||||||||||||||||||||||||||||
| Reconciliation of operating costs before depreciation and amortization, severance and multiemployer pension plan withdrawal costs (or adjusted operating costs) | ||||||||||||||||||||||||||||||||||||||
| Third Quarter | Nine Months | |||||||||||||||||||||||||||||||||||||
| 2022 | 2021 | % Change | 2022 | 2021 | % Change | |||||||||||||||||||||||||||||||||
| Operating costs | $ | 503,792 | $ | 460,127 | 9.5 | % | $ | 1,504,240 | $ | 1,302,895 | 15.5 | % | ||||||||||||||||||||||||||
| Less: | ||||||||||||||||||||||||||||||||||||||
| Depreciation and amortization | 21,760 | 14,326 | 51.9 | % | 61,150 | 43,529 | 40.5 | % | ||||||||||||||||||||||||||||||
| Severance | 2,010 | 476 | * | 4,670 | 882 | * | ||||||||||||||||||||||||||||||||
| Multiemployer pension plan withdrawal costs | 1,319 | 1,275 | 3.5 | % | 3,734 | 3,902 | (4.3) | % | ||||||||||||||||||||||||||||||
| Adjusted operating costs | $ | 478,703 | $ | 444,050 | 7.8 | % | $ | 1,434,686 | $ | 1,254,582 | 14.4 | % | ||||||||||||||||||||||||||
| * Represents a change equal to or in excess of 100% or not meaningful. | ||||||||||||||||||||||||||||||||||||||
18