o-20211101
0000726728false00007267282021-11-012021-11-010000726728us-gaap:CommonClassAMember2021-11-012021-11-010000726728o:SeniorUnsecuredNotesPayableDueJuly2027Member2021-11-012021-11-010000726728o:SeniorUnsecuredNotesPayableDueDecember2030Member2021-11-012021-11-010000726728o:SeniorUnsecuredNotesPayableDueJuly2033Member2021-11-012021-11-01

United States
Securities and Exchange Commission
Washington, D.C. 20549 
Form 8-K
Current Report 
Pursuant to Section 13 or 15(d) of the
Securities Exchange Act of 1934 
Date of report: November 1, 2021
(Date of Earliest Event Reported) 
REALTY INCOME CORPORATION
(Exact name of registrant as specified in its charter) 
Maryland 1-13374 33-0580106
(State or Other Jurisdiction of
Incorporation or Organization)
 (Commission File Number) (IRS Employer Identification No.)

11995 El Camino Real, San Diego, California 92130
(Address of principal executive offices) 
(858284-5000
(Registrant’s telephone number, including area code) 
N/A
(former name or former address, if changed since last report) 
Check the appropriate box below if the Form 8-K filing is intended to simultaneously satisfy the filing obligation of the registrant under any of the following provisions: 
Written communications pursuant to Rule 425 under the Securities Act (17 CFR 230.425) 
Soliciting material pursuant to Rule 14a-12 under the Exchange Act (17 CFR 240.14a-12) 
Pre-commencement communications pursuant to Rule 14d-2(b) under the Exchange Act (17 CFR 240.14d-2(b)) 
Pre-commencement communications pursuant to Rule 13e-4(c) under the Exchange Act (17 CFR 240.13e-4(c)) 

Securities registered pursuant to Section 12(b) of the Act:
Title of Each ClassTrading Symbol(s)Name of Each Exchange On Which Registered
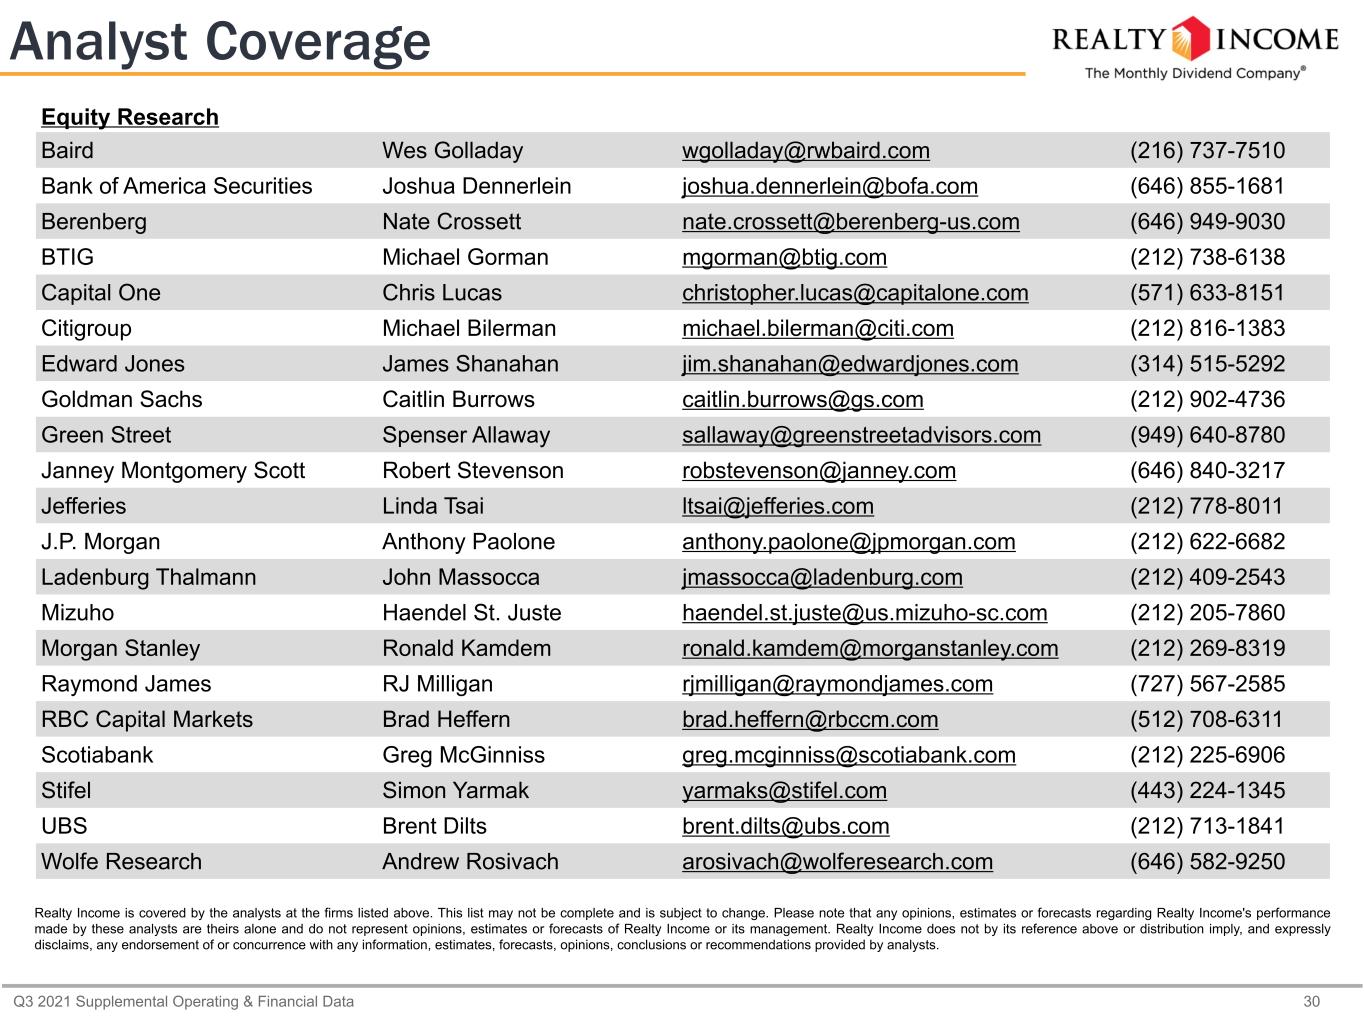
Common Stock, $0.01 Par ValueONew York Stock Exchange
1.125% Notes due 2027O27ANew York Stock Exchange
1.625% Notes due 2030O30New York Stock Exchange
1.750% Notes due 2033O33ANew York Stock Exchange
Indicate by check mark whether the registrant is an emerging growth company as defined in Rule 405 of the Securities Act of 1933 (§230.405 of this chapter) or Rule 12b-2 of the Securities Exchange Act of 1934 (§240.12b-2 of this chapter).
Emerging growth company
  
If an emerging growth company, indicate by check mark if the registrant has elected not to use the extended transition period for complying with any new or revised financial accounting standards provided pursuant to Section 13(a) of the Exchange Act.


Item 2.02        Results of Operations and Financial Condition 
On November 1, 2021, Realty Income Corporation (the “Company”) issued a press release setting forth its results of operations for the three and nine months ended September 30, 2021.  A copy of the press release is attached hereto as Exhibit 99.1 and is incorporated herein by reference.  This information, including the information contained in the press release, shall not be deemed “filed” for purposes of Section 18 of the Securities Exchange Act of 1934, as amended (the “Exchange Act”), and is not incorporated by reference into any of the Company’s filings, whether made before or after the date hereof, regardless of any general incorporation language in any such filing.
Additionally, on November 1, 2021, the Company made available on its website a financial supplement containing operating and financial data of the Company (“Supplemental Operating and Financial Data”) for the three and nine months ended September 30, 2021 and such Supplemental Operating and Financial Data is furnished as Exhibit 99.2 hereto.  The Supplemental Operating and Financial Data included as Exhibit 99.2 to this report is being furnished pursuant to this Item 2.02 of Form 8-K and is also being furnished under Item 7.01—“Regulation FD Disclosure” of Form 8-K, and shall not be deemed “filed” for purposes of Section 18 of the Exchange Act and is not incorporated by reference into any of the Company’s filings, whether made before or after the date hereof, regardless of any general incorporation language in any such filing.
Item 7.01        Regulation FD Disclosure. 
On November 1, 2021, the Company made available on its website a financial supplement containing operating and financial data of the Company (“Supplemental Operating and Financial Data”) for the three and nine months ended September 30, 2021 and such Supplemental Operating and Financial Data is furnished as Exhibit 99.2 hereto.  The Supplemental Operating and Financial Data included as Exhibit 99.2 to this report is being furnished pursuant to this Item 7.01 of Form 8-K and is also being furnished under Item 2.02—“Results of Operations and Financial Condition” of Form 8-K, and shall not be deemed “filed” for purposes of Section 18 of the Exchange Act and is not incorporated by reference into any of the Company’s filings, whether made before or after the date hereof, regardless of any general incorporation language in any such filing. 
Item 9.01         Financial Statements and Exhibits 
(d)  Exhibits 
99.1   Press release dated November 1, 2021
99.2   Supplemental Operating and Financial Data for the Three and Nine Months Ended September 30, 2021
104 The Form 8-K cover page, formatted in Inline Extensible Business Reporting Language and included as Exhibit 101


SIGNATURE
 
Pursuant to the requirements of the Securities Exchange Act of 1934, the registrant has duly caused this report to be signed on its behalf by the undersigned hereunto duly authorized.
 
Dated: November 1, 2021REALTY INCOME CORPORATION
  
 By:/s/ CHRISTIE B. KELLY
  Christie B. Kelly
  Executive Vice President, Chief Financial Officer, and Treasurer


Exhibit 99.1
pressreleaseheadera.jpg


REALTY INCOME ANNOUNCES OPERATING RESULTS FOR
THE THREE AND NINE MONTHS ENDED SEPTEMBER 30, 2021


SAN DIEGO, CALIFORNIA, November 1, 2021....Realty Income Corporation (Realty Income, NYSE: O), The Monthly Dividend Company®, today announced operating results for the three and nine months ended September 30, 2021. All per share amounts presented in this press release are on a diluted per common share basis unless stated otherwise.

COMPANY HIGHLIGHTS:

For the three months ended September 30, 2021:

Net income per share increased to $0.34, compared to $0.07 for the three months ended September 30, 2020
Normalized FFO per share increased 8.5% to $0.89, compared to the three months ended September 30, 2020
AFFO per share increased 12.3% to $0.91, compared to the three months ended September 30, 2020
Invested $1.61 billion in 308 properties and properties under development or expansion, including $532.5 million in Europe
Net debt to annualized EBITDAre ratio was 5.0x
Net debt to annualized pro forma adjusted EBITDAre was 4.9x

Events subsequent to September 30, 2021:

Completed the merger with VEREIT, Inc. and commenced consent solicitations and offers to exchange outstanding notes issued by VEREIT, Inc. for new notes issued by Realty Income

CEO Comments

“I continue to be inspired by the dynamic talent of our Realty Income team, who remains committed to executing across our strategic growth initiatives while undertaking integration efforts. We are pleased with the growth trajectory of our business and sustained health of our portfolio, as illustrated through our strong third quarter results,” said Sumit Roy, Realty Income’s President and Chief Executive Officer. “Our position as a global consolidator continues to build as we invested a record $3.78 billion year to date across three countries, including our debut transaction in Continental Europe. In addition, we are proud to announce today’s closing of our merger with VEREIT, further establishing ourselves as a leading net lease REIT and we look forward to integrating the capabilities of many talented colleagues into our 'One Team'.”

“The closing of the merger with VEREIT and our anticipated subsequent spin-off of substantially all of the combined companies’ office properties allows us to provide enhanced clarity on our anticipated near-term earnings run rate, demonstrating what we believe is a compelling risk/reward proposition for investors. To that end, assuming the consummation of the spin-off as anticipated on November 12th, we are increasing our 2021 AFFO per share guidance to $3.55 - $3.60, representing 5.5% annual growth based on the midpoint, which includes increased acquisition guidance of over $5 billion, as well as introducing 2022 AFFO per share guidance of $3.84 - $3.97, representing 9.2% annual growth based on the midpoint.”

pressreleasefootera.jpg


Select Financial Results

The following summarizes our select financial results (dollars in millions, except per share data):
Three Months Ended September 30,Nine Months Ended September 30,
2021202020212020
Total revenue
$491.9$404.6$1,399.0$1,233.5
Net income available to common stockholders (1)(2)
$135.0$22.9$355.4$277.6
Net income per share
$0.34$0.07$0.94$0.81
Funds from operations available to common stockholders (FFO) (2)(3)
$332.3$283.0$914.4$848.4
FFO per share
$0.85$0.82$2.41$2.48
Normalized funds from operations available to common stockholders (Normalized FFO) (3)
$349.1$283.0$944.5$848.4
Normalized FFO per share
$0.89$0.82$2.49$2.48
Adjusted funds from operations available to common stockholders (AFFO) (3)
$356.8$282.5$1,002.7$875.0
AFFO per share
$0.91$0.81$2.64$2.55
(1) The calculation to determine net income attributable to common stockholders includes provisions for impairment, gains on sales of real estate, and foreign currency gains and losses. These items can vary from quarter to quarter and can significantly impact net income available to common stockholders and period to period comparisons.
(2) Our financial results during the nine months ended September 30, 2021 were impacted by the following transactions: (i) a $50.5 million loss on extinguishment of debt, primarily due to the January 2021 early redemption of the 3.250% notes due October 2022 recorded in the three months ended March 31, 2021, (ii) $30.1 million of merger-related costs related to our merger with VEREIT, of which $16.8 million related to the three months ended September 30, 2021, (iii) $31.0 million of provisions for impairment, of which $11.0 million related to the three months ended September 30, 2021, and (iv) $13.9 million in reserves, net of reserve reversals, recorded as a reduction of rental revenue. Our financial results during the nine months ended September 30, 2020 were impacted by the following transactions: (i) $123.4 million of provisions for impairment, of which $105.1 million related to the three months ended September 30, 2020, (ii) $34.4 million in reserves recorded as a reduction of rental revenue, of which $24.1 million related to the three months ended September 30, 2020, (iii) a $9.8 million loss on extinguishment of debt due to the January 2020 early redemption of the 5.750% notes due 2021 recorded in the three months ended March 31, 2020, and (iv) a $3.5 million executive severance charge for our former chief financial officer also recorded in the three months ended March 31, 2020.
(3) FFO, Normalized FFO, and AFFO are non-GAAP financial measures. Normalized FFO is based on FFO and adjusted to exclude merger-related costs related to our merger with VEREIT and AFFO further adjusts Normalized FFO for unique revenue and expense items, such as losses on extinguishment of debt and executive severance costs. Please see the Glossary in the Supplemental Operating and Financial Data for the three months ended September 30, 2021 for our definitions and explanations of how we utilize these metrics. See pages 10 and 11 herein for reconciliations to the most directly comparable GAAP measure.

Rent Collections Update

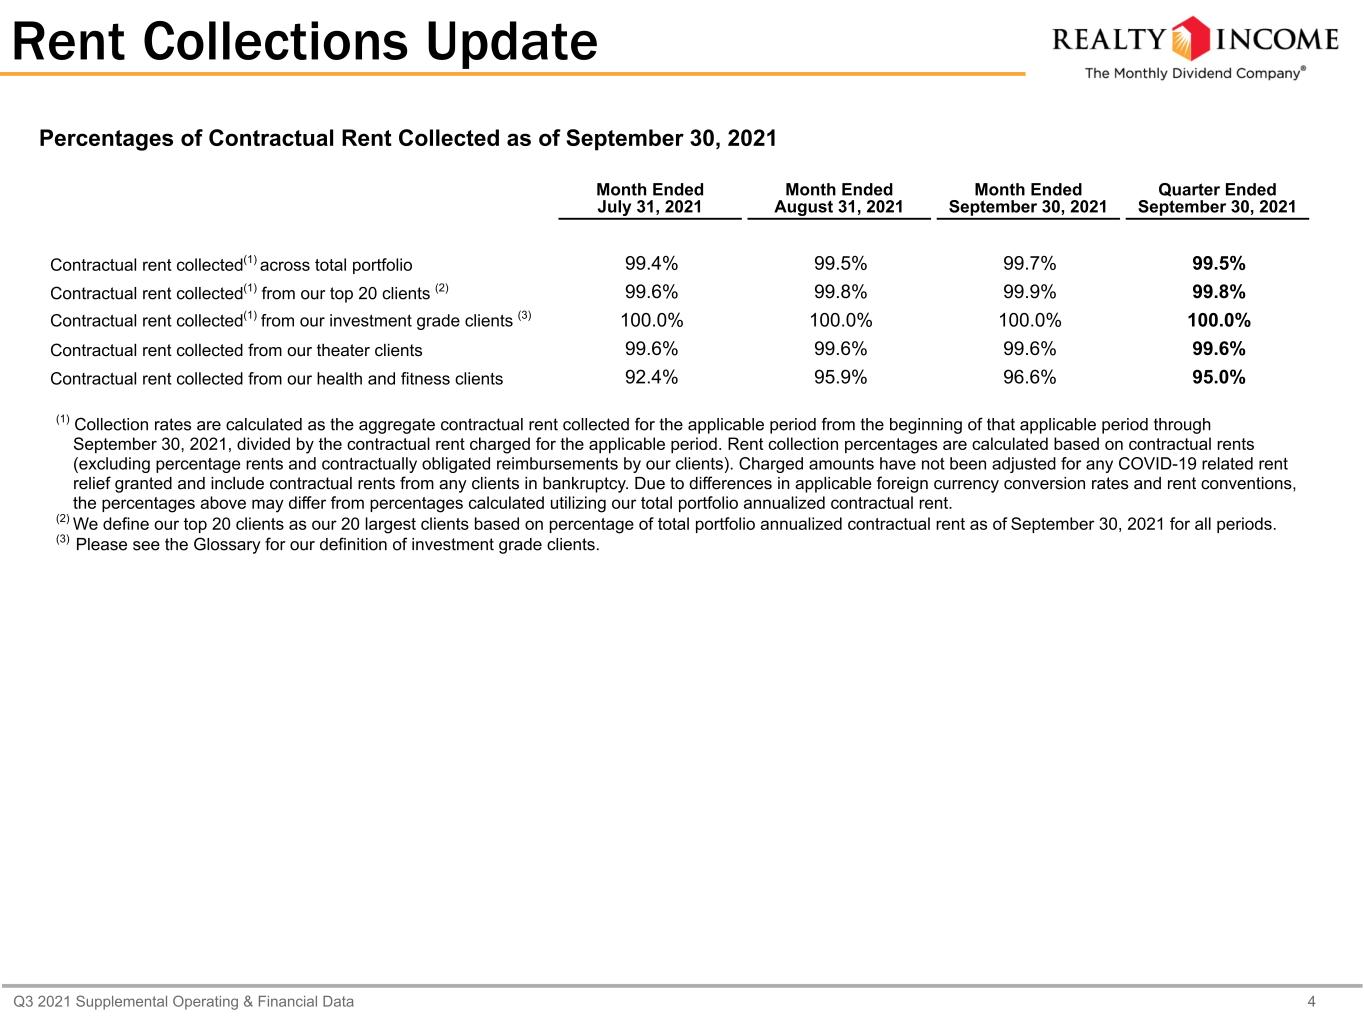
Percentages of Contractual Rent Collected as of September 30, 2021
Month Ended
July 31, 2021
Month Ended
August 31, 2021
Month Ended
September 30, 2021
Quarter Ended
September 30, 2021
Contractual rent collected(1) across total portfolio
99.4%99.5%99.7%99.5%
Contractual rent collected(1) from our top 20 clients (2)
99.6%99.8%99.9%99.8%
Contractual rent collected(1) from our investment grade clients (3)
100.0%100.0%100.0%100.0%
Contractual rent collected from our theater clients99.6%99.6%99.6%99.6%
Contractual rent collected from our health and fitness clients92.4%95.9%96.6%95.0%
(1) Collection rates are calculated as the aggregate contractual rent collected for the applicable period from the beginning of that applicable period through September 30, 2021, divided by the contractual rent charged for the applicable period. Rent collection percentages are calculated based on contractual rents (excluding percentage rents and contractually obligated reimbursements by our clients). Charged amounts have not been adjusted for any COVID-19 related rent relief granted and include contractual rents from any clients in bankruptcy. Due to differences in applicable foreign currency conversion rates and rent conventions, the percentages above may differ from percentages calculated utilizing our total portfolio annualized contractual rent.
(2) We define our top 20 clients as our 20 largest clients based on percentage of total portfolio annualized contractual rent as of September 30, 2021 for all periods.
(3) Please see the Glossary in the Supplemental Operating and Financial Data for the three months ended September 30, 2021 for our definition of investment grade clients.

- 2 -


We either have executed deferral agreements or maintain ongoing deferral discussions with clients that account for a majority of the unpaid contractual rent for each of the periods referenced in the table above.

Rental Revenue Reserves and Reserve Reversals (1)
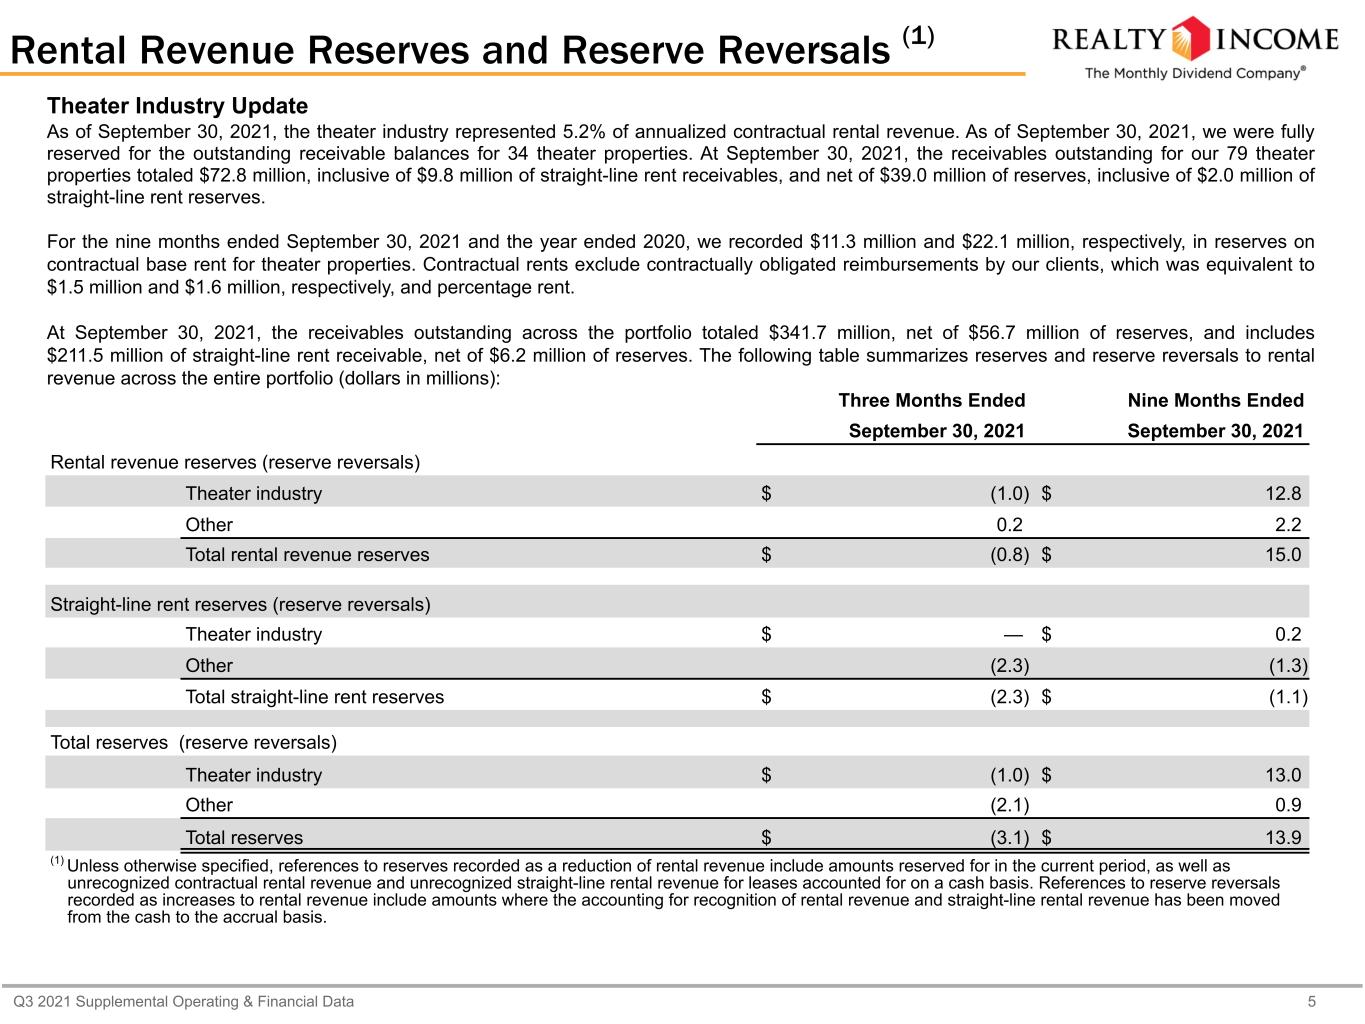
The following table summarizes reserves and reserve reversals to rental revenue across the entire portfolio (dollars in millions):
Three Months EndedNine Months Ended
September 30, 2021
September 30, 2021
Rental revenue reserves (reserve reversals)
Theater industry$(1.0)$12.8 
Other0.2 2.2 
Total rental revenue reserves$(0.8)$15.0 
Straight-line rent reserves (reserve reversals)
Theater industry$— $0.2 
Other(2.3)(1.3)
Total straight-line rent reserves$(2.3)$(1.1)
Total reserves (reserve reversals)
Theater industry$(1.0)$13.0 
Other(2.1)0.9 
Total reserves$(3.1)$13.9 
(1) Unless otherwise specified, references to reserves recorded as a reduction of rental revenue include amounts reserved for in the current period, as well as unrecognized contractual rental revenue and unrecognized straight-line rental revenue for leases accounted for on a cash basis. References to reserve reversals recorded as increases to rental revenue include amounts where the accounting for recognition of rental revenue and straight-line rental revenue has been moved from the cash to the accrual basis.

Theater Industry Update

As of September 30, 2021, the theater industry represented 5.2% of annualized contractual rental revenue. As of September 30, 2021, we were fully reserved for the outstanding receivable balances for 34 theater properties. At September 30, 2021, the receivables outstanding for our 79 theater properties totaled $72.8 million, inclusive of $9.8 million of straight-line rent receivables, and net of $39.0 million of reserves, inclusive of $2.0 million of straight-line rent reserves.

For the nine months ended September 30, 2021 and the year ended 2020, we recorded $11.3 million and $22.1 million, respectively, in reserves on contractual base rent for theater properties. Contractual rents exclude contractually obligated reimbursements by our clients, which was equivalent to $1.5 million and $1.6 million, respectively, and percentage rent.

At September 30, 2021, the receivables outstanding across the portfolio totaled $341.7 million, net of $56.7 million of reserves, and includes $211.5 million of straight-line rent receivable, net of $6.2 million of reserves.

We did not record any provisions for impairment on theater properties for the nine months ended September 30, 2021. See "Item 1A—Risk Factors" in Part I of our Annual Report on Form 10-K for the year ended December 31, 2020 for more information regarding the actual and potential future impacts of the COVID-19 pandemic and the measures taken to limit its spread on our clients and our business, results of operations, financial condition and liquidity.

Dividend Increases

In September 2021, we announced the 96th consecutive quarterly dividend increase, which is the 112th increase in the amount of the dividend since our listing on the New York Stock Exchange (NYSE) in 1994. The annualized dividend amount as of September 30, 2021 was $2.8320 per share. The amount of monthly dividends paid per share increased 0.9% to $0.707 for the three months ended September 30, 2021, as compared to $0.701 for the three months ended September 30, 2020. During the three months ended September 30, 2021, we distributed $273.8 million in common dividends to stockholders, representing 76.7% of our AFFO of $356.8 million.

- 3 -


Real Estate Portfolio Update

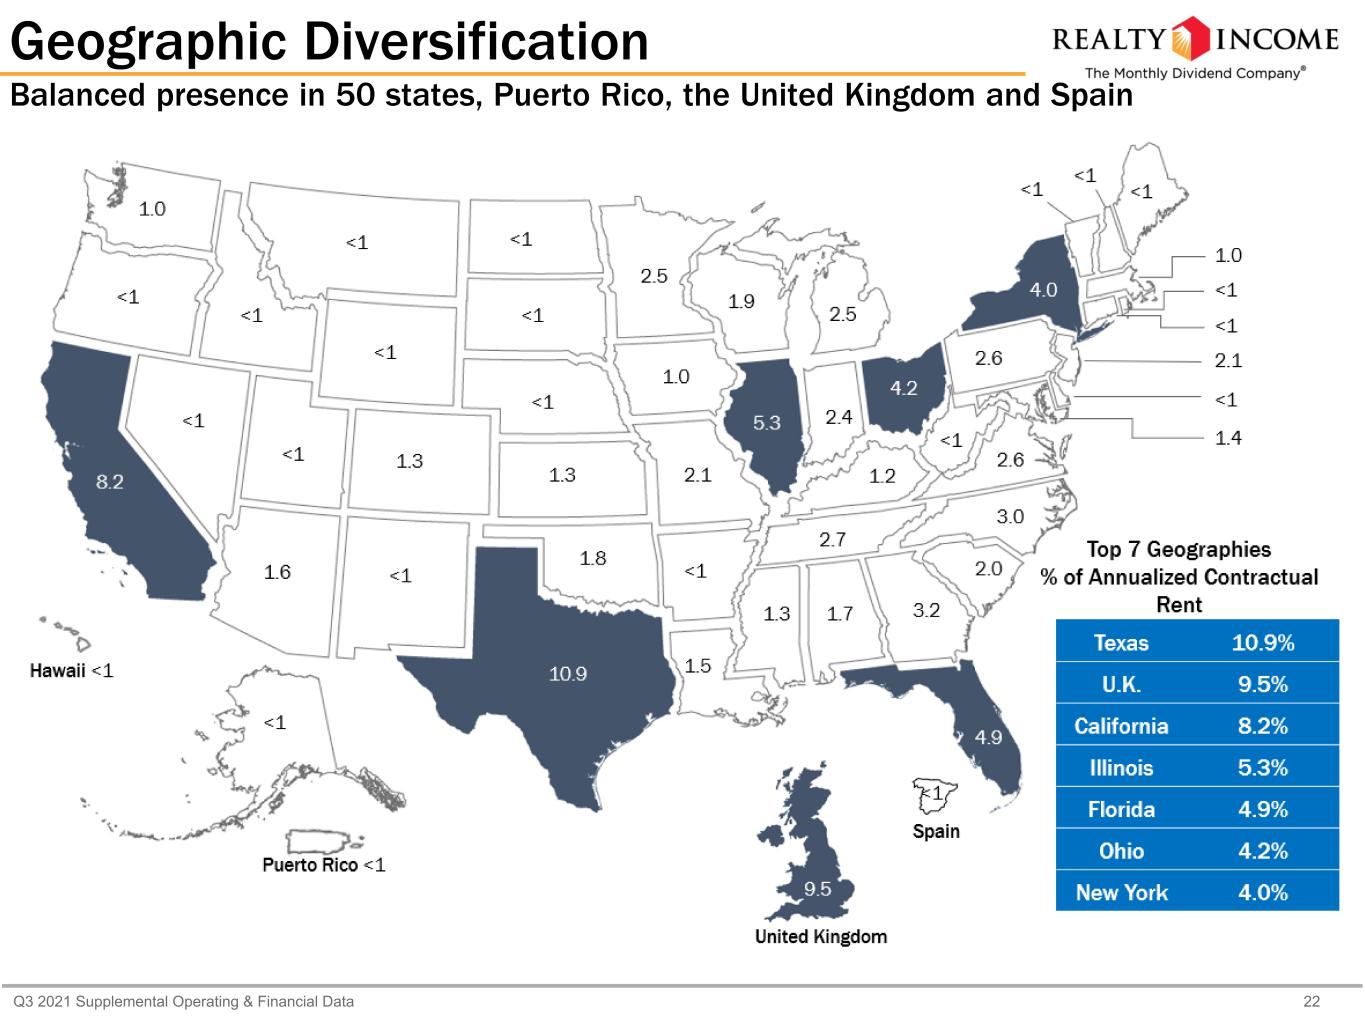
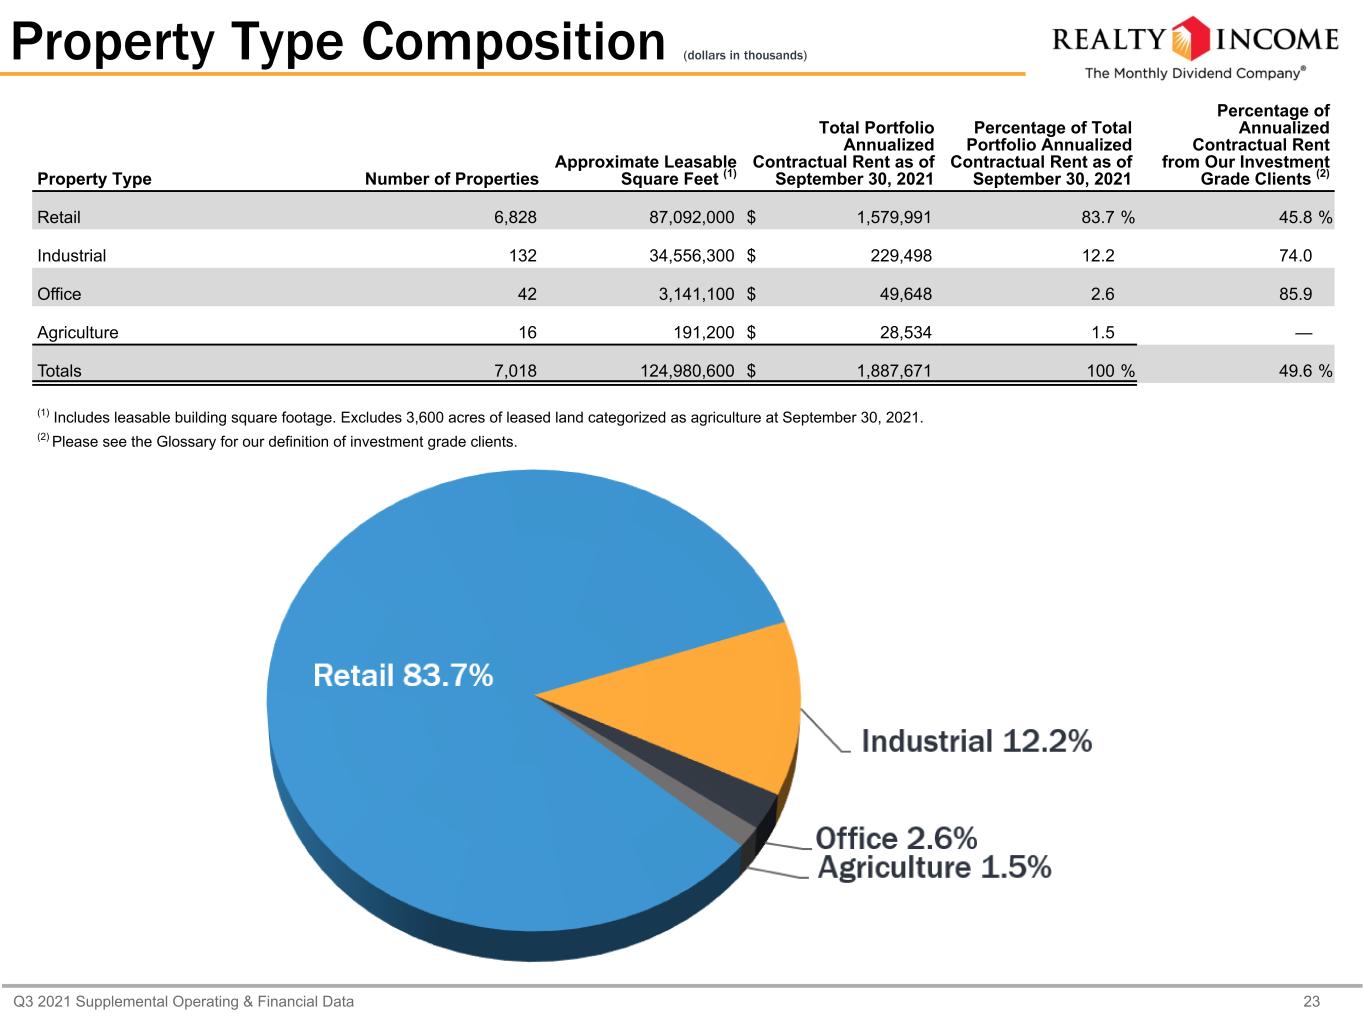
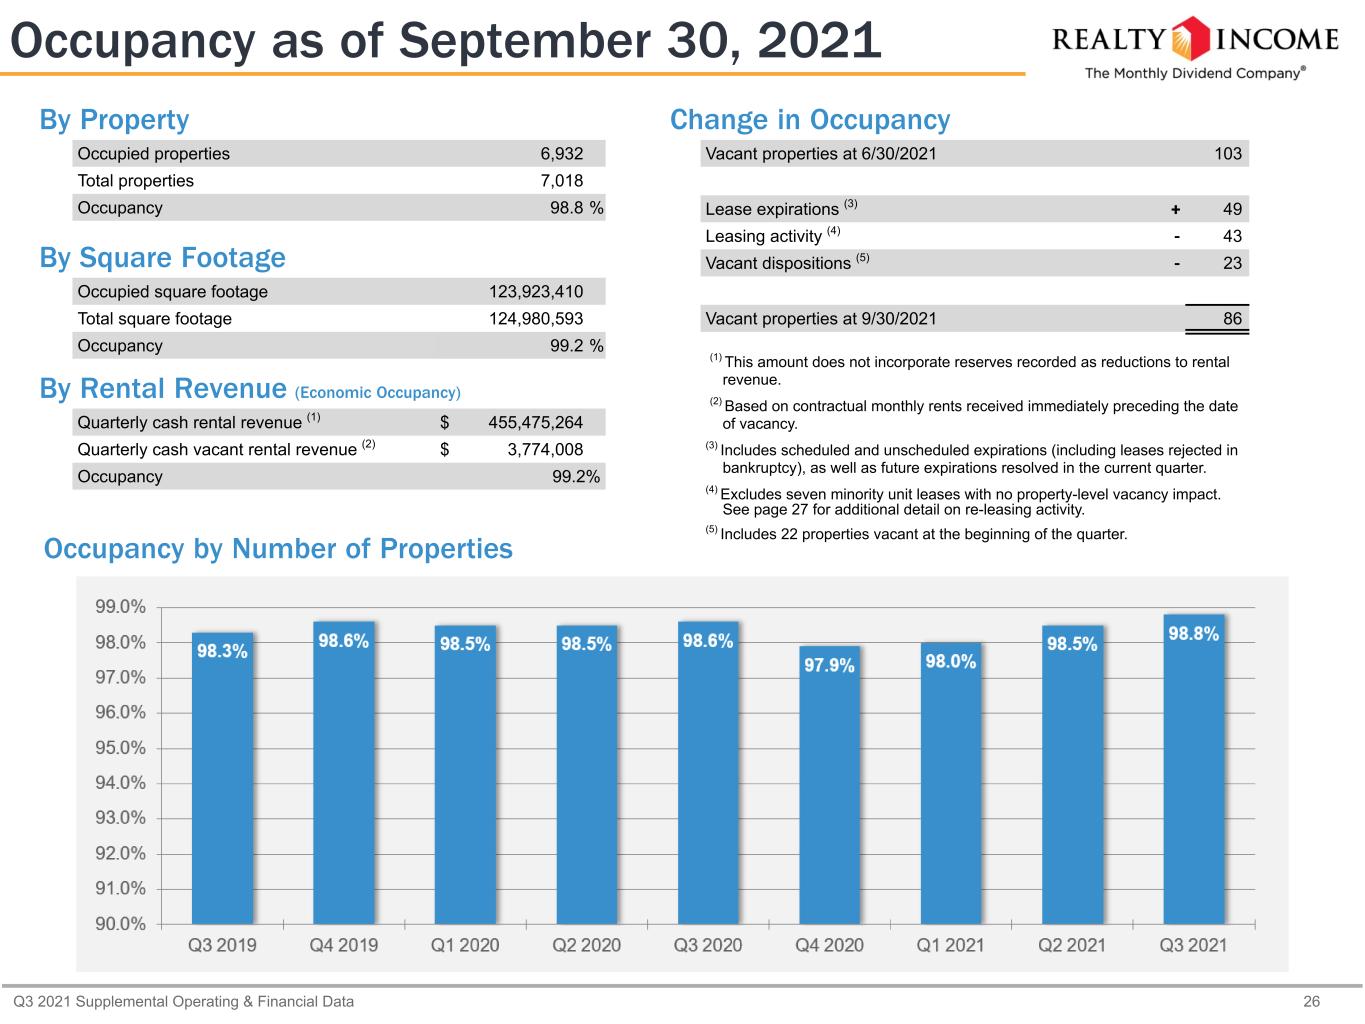
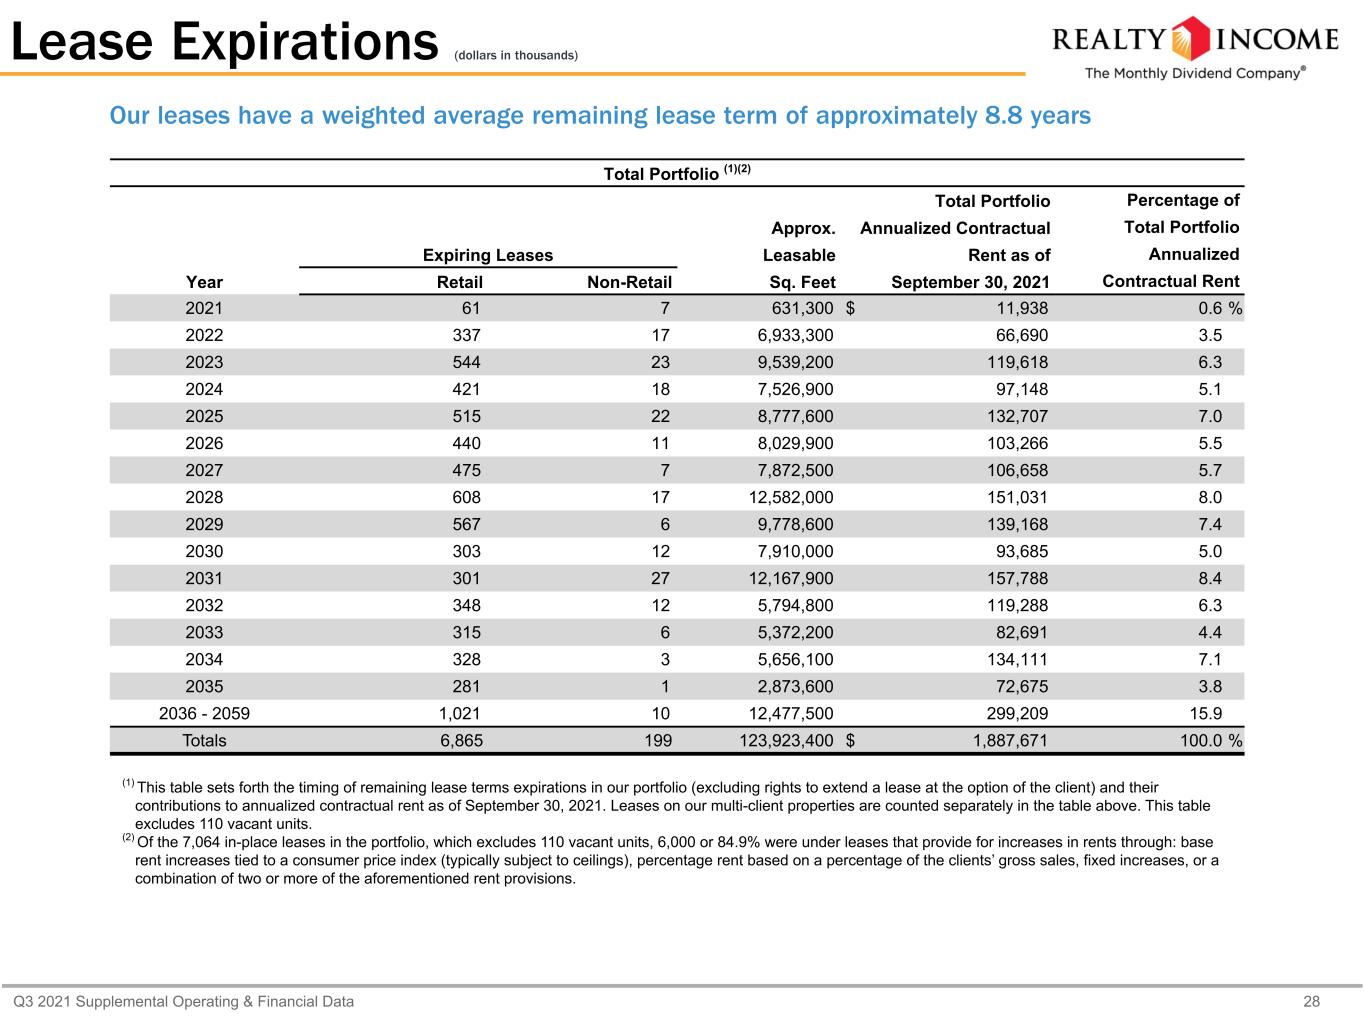
As of September 30, 2021, our portfolio consisted of 7,018 properties located in all 50 U.S. states, Puerto Rico, the U.K. and Spain, and leased to approximately 650 clients doing business in 60 separate industries. The properties are primarily freestanding and leased under long-term net lease agreements with a weighted average remaining lease term of approximately 8.8 years. Our portfolio of commercial real estate has historically provided dependable rental revenue supporting the payment of monthly dividends. As of September 30, 2021, portfolio occupancy was 98.8% with 86 properties available for lease or sale out of 7,018, as compared to 98.5% as of June 30, 2021 and 98.6% as of September 30, 2020.

Changes in Occupancy
Three months ended September 30, 2021
Properties available for lease at June 30, 2021
103 
Lease expirations (1)
49 
Re-leases to same client(35)
Re-leases to new client (8)
Vacant dispositions(23)
Properties available for lease at September 30, 2021
86 
Nine months ended September 30, 2021
Properties available for lease at December 31, 2020
140 
Lease expirations (1)
175 
Re-leases to same client(126)
Re-leases to new client(23)
Vacant dispositions(80)
Properties available for lease at September 30, 2021
86 
(1)Includes scheduled and unscheduled expirations (including leases rejected in bankruptcy), as well as future expirations resolved in the periods indicated above.

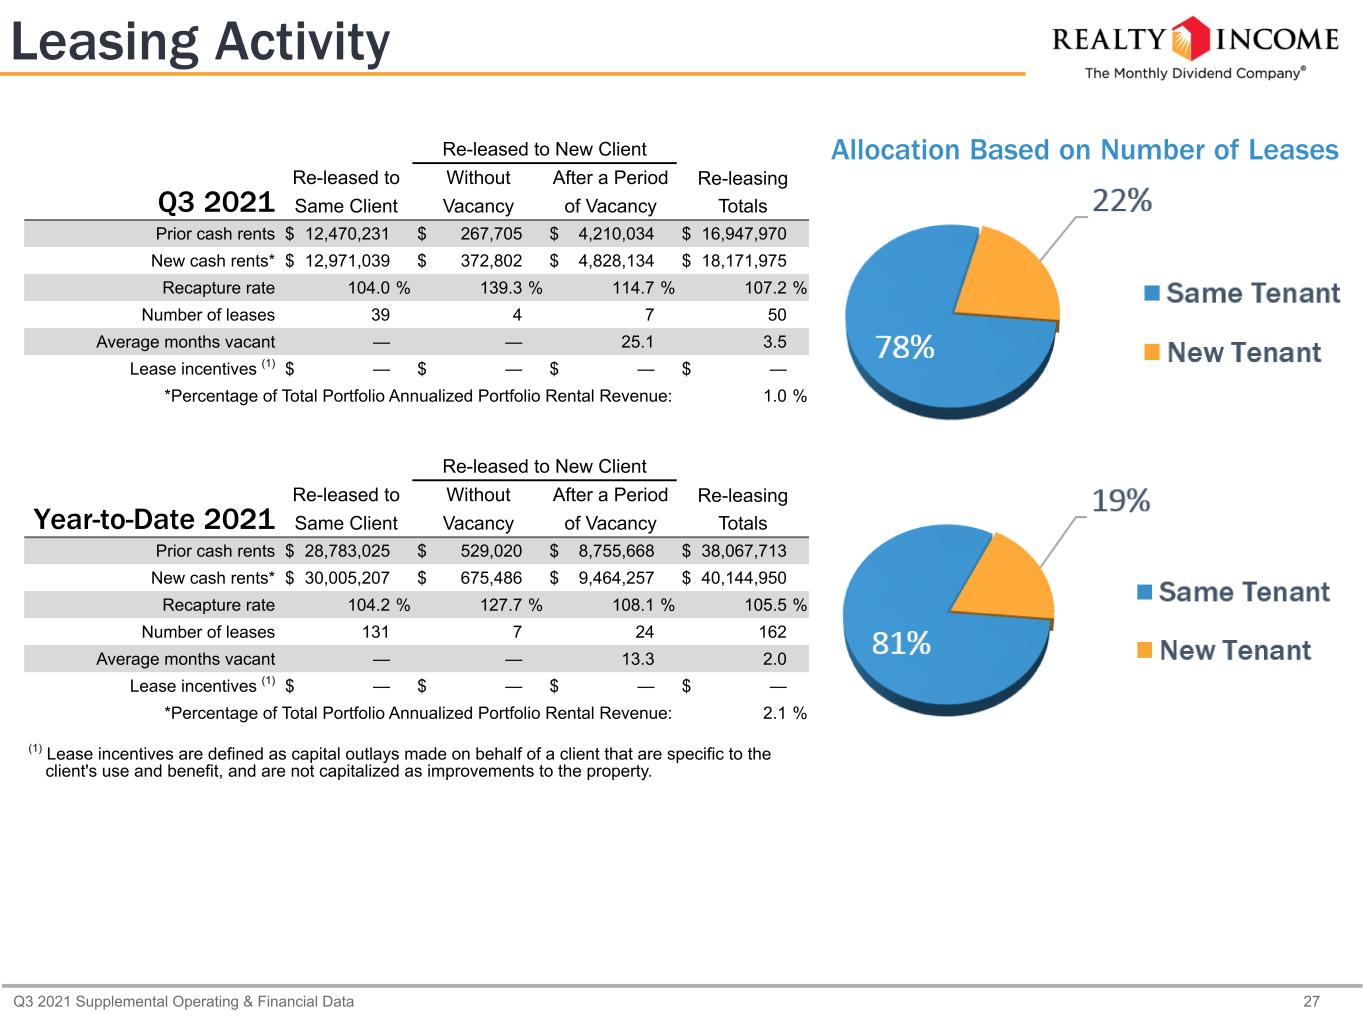
During the three months ended September 30, 2021, the annual new rent on re-leases was $18.172 million, as compared to the previous annual rent of $16.948 million on the same units, representing a rent recapture rate of 107.2% on the units re-leased. We re-leased four units to new clients without a period of vacancy, and seven units to new clients after a period of vacancy.

During the nine months ended September 30, 2021, the annual new rent on re-leases was $40.145 million, as compared to the previous annual rent of $38.068 million on the same units, representing a rent recapture rate of 105.5% on the units re-leased. We re-leased seven units to new clients without a period of vacancy, and 24 units to new clients after a period of vacancy.
- 4 -


Investments in Real Estate
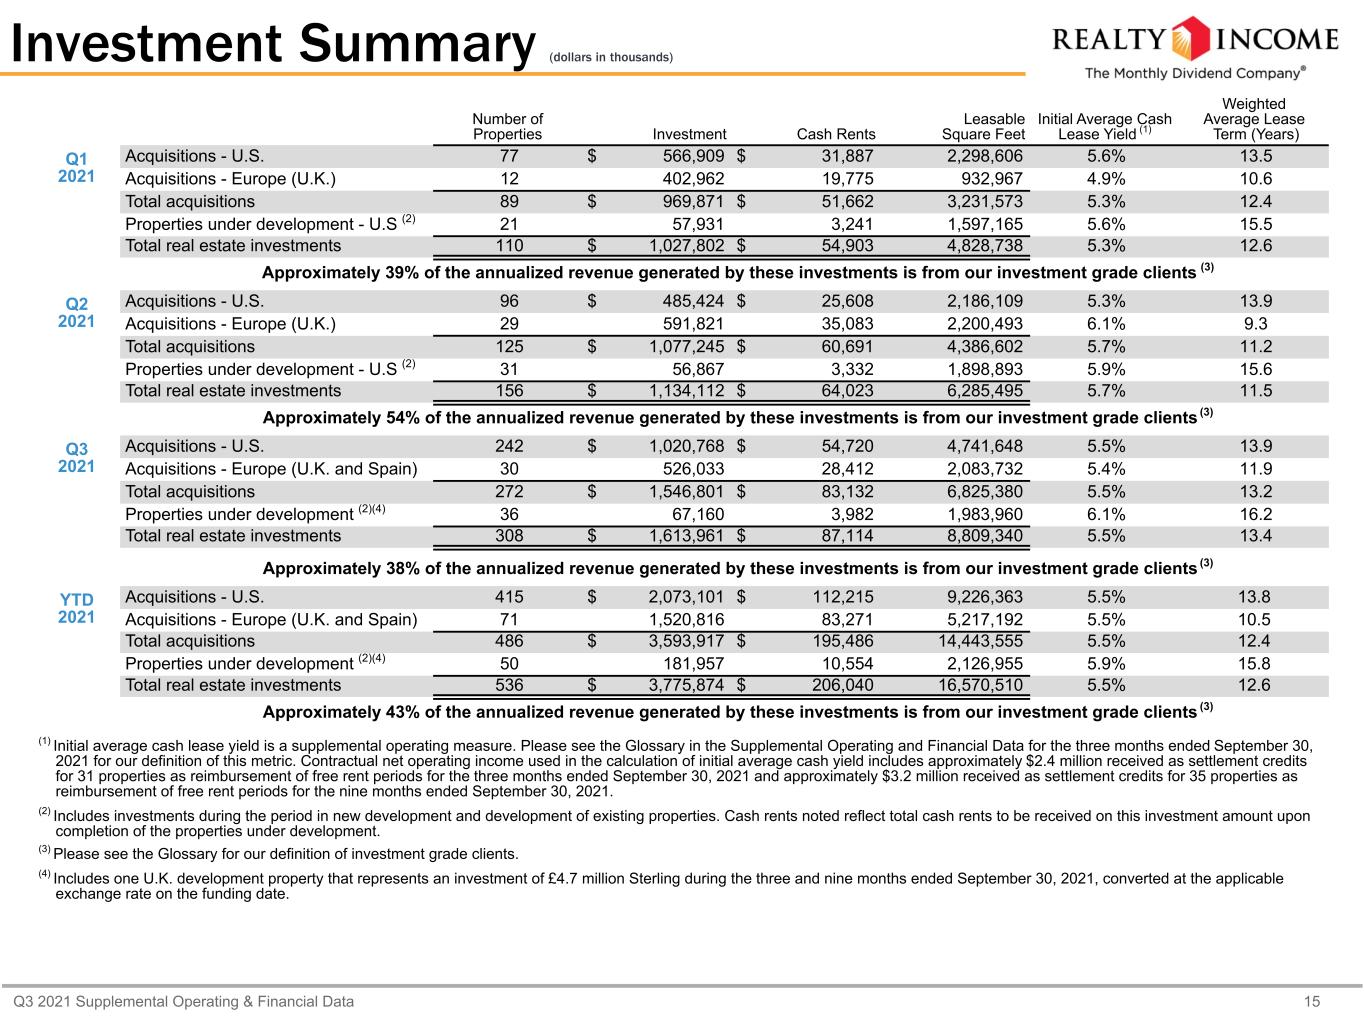
The following table summarizes our acquisitions in the U.S. and Europe for the periods indicated below:
Number of
Properties
Leasable
Square Feet
Investment
($ in thousands)
Weighted
Average
Lease Term
(Years)
Initial Average
Cash Lease
Yield (1)
Three months ended September 30, 2021
Acquisitions - U.S. (in 32 states)
242 4,741,648 $1,020,768 13.9 5.5 %
Acquisitions - Europe (U.K. and Spain)
30 2,083,732 526,033 11.9 5.4 %
Total acquisitions272 6,825,380 1,546,801 13.2 5.5 %
Properties under development (2)
36 1,983,960 67,160 16.2 6.1 %
Total (3)
308 8,809,340 $1,613,961 13.4 5.5 %
Nine months ended September 30, 2021
Acquisitions - U.S. (in 38 states)
415 9,226,363 $2,073,101 13.85.5 %
Acquisitions - Europe (U.K. and Spain)
71 5,217,192 1,520,816 10.55.5 %
Total acquisitions486 14,443,555 $3,593,917 12.45.5 %
Properties under development (2)
50 2,126,955 181,957 15.85.9 %
Total (4)
536 16,570,510 $3,775,874 12.65.5 %
(1)Initial average cash lease yield is a supplemental operating measure. Please see the Glossary in the Supplemental Operating and Financial Data for the three months ended September 30, 2021 for our definition of this metric. Contractual net operating income used in the calculation of initial average cash yield includes approximately $2.4 million received as settlement credits for 31 properties as reimbursement of free rent periods for the three months ended September 30, 2021 and approximately $3.2 million received as settlement credits for 35 properties as reimbursement of free rent periods for the nine months ended September 30, 2021.
(2) Includes one U.K. development property that represents an investment of £4.7 million Sterling during the three and nine months ended September 30, 2021, converted at the applicable exchange rate on the funding date.
(3) Our clients occupying the new properties are 86.2% retail and 13.8% industrial, based on rental revenue. Approximately 38% of the rental revenue generated from acquisitions during the three months ended September 30, 2021 is from our investment grade rated clients, their subsidiaries or affiliated companies.
(4) Our clients occupying the new properties are 80.2% retail and 19.8% industrial, based on rental revenue. Approximately 43% of the rental revenue generated from acquisitions during the nine months ended September 30, 2021 is from our investment grade rated clients, their subsidiaries or affiliated companies.

Same Store Rental Revenue
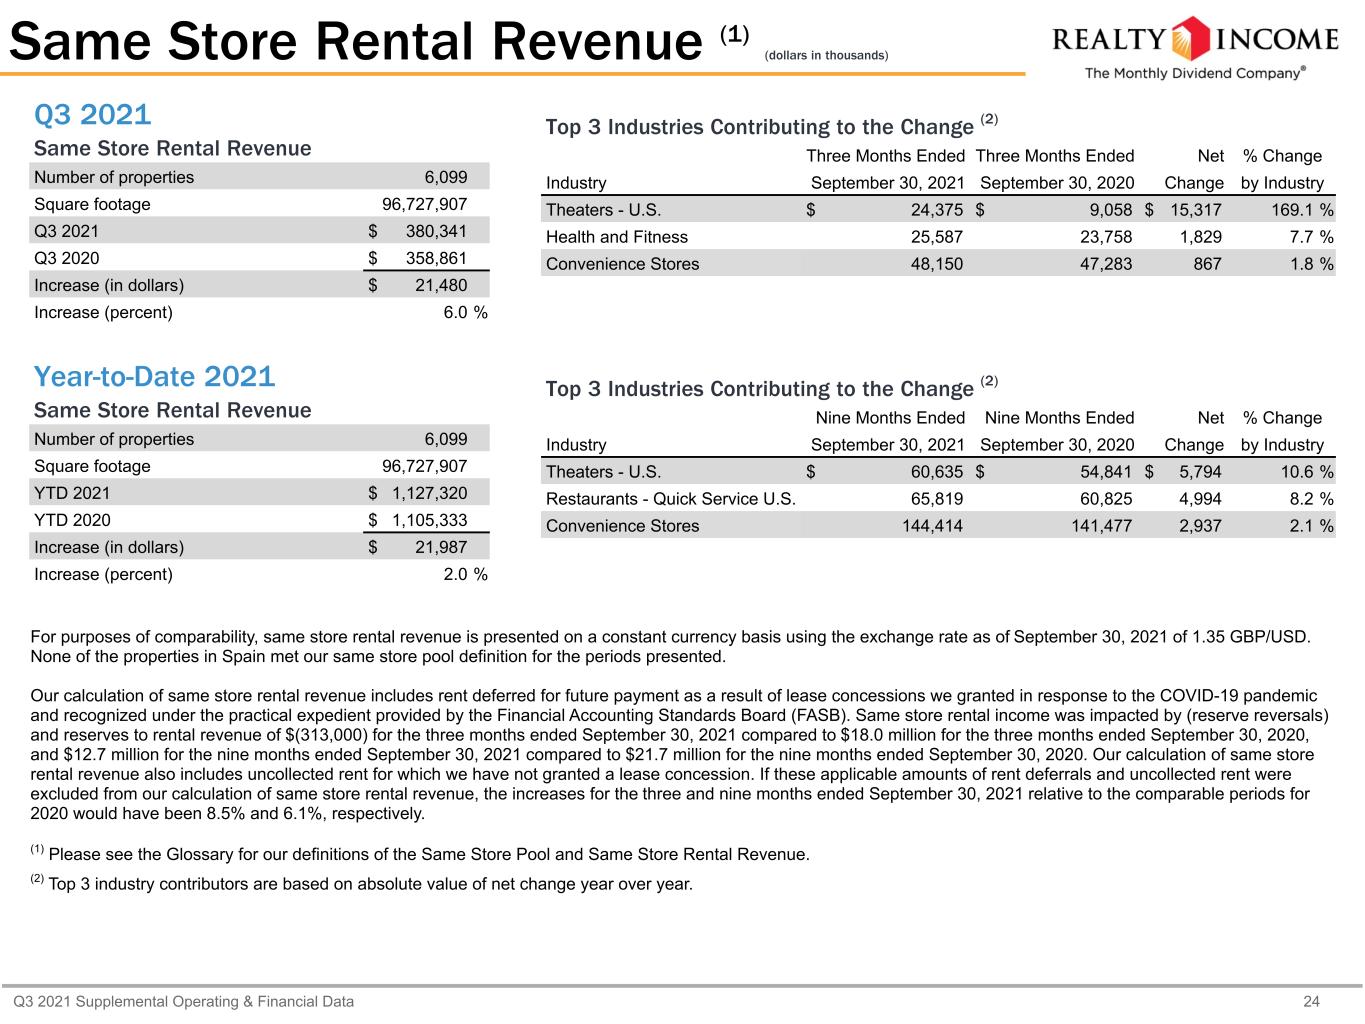
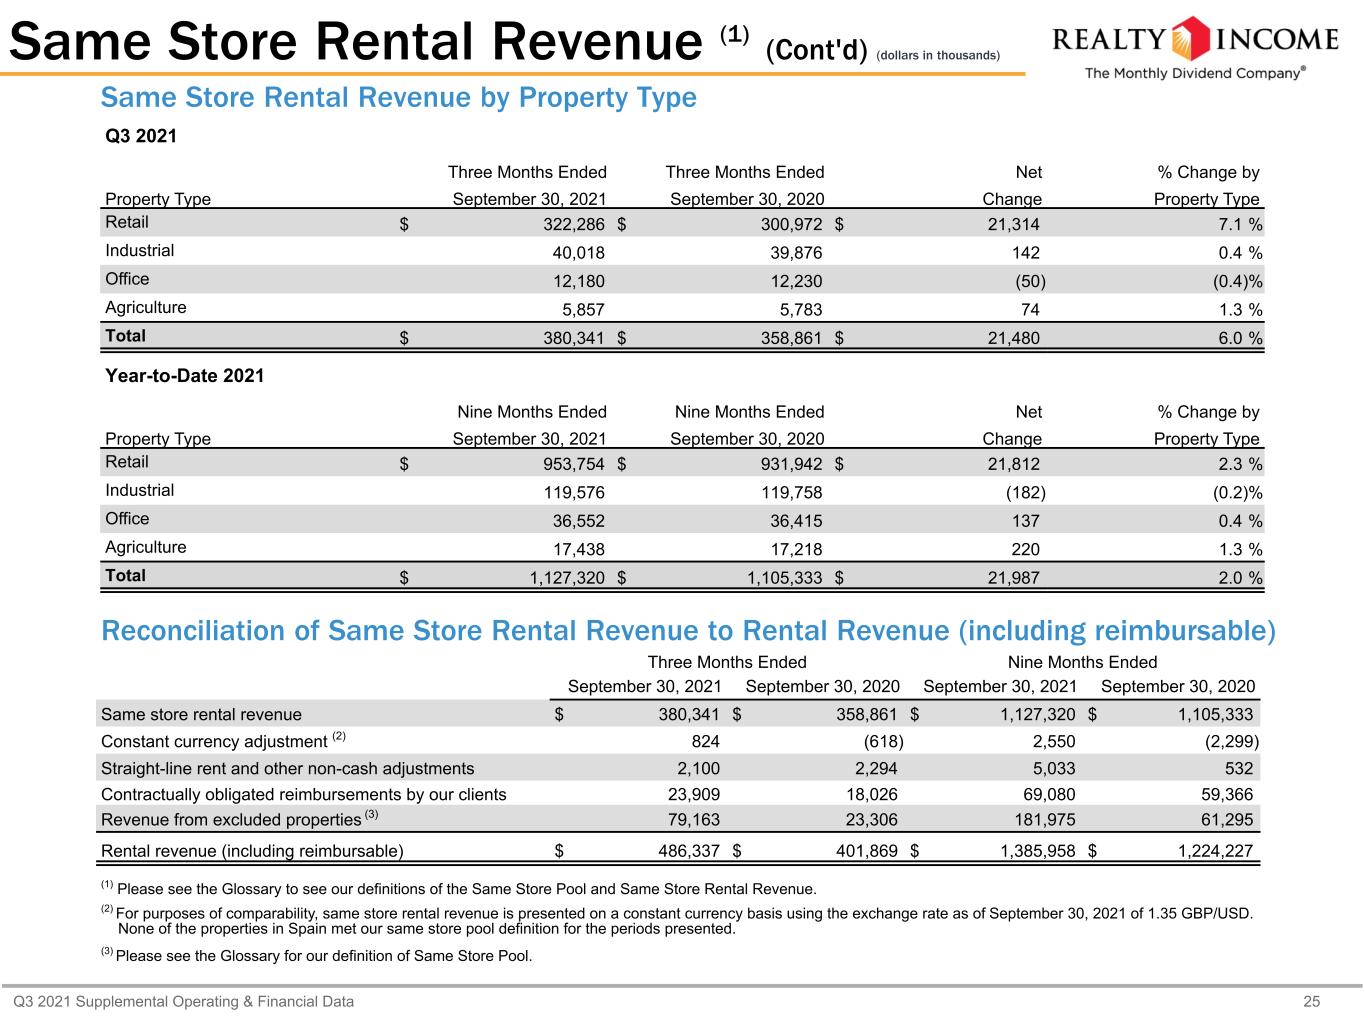
The following summarizes our same store rental revenue on 6,099 properties under lease (dollars in millions):
Three Months Ended September 30,
Nine Months Ended September 30,Increase
2021202020212020Three Months
Nine Months
Rental revenue
$380.3$358.9$1,127.3$1,105.36.0 %2.0 %

For purposes of comparability, same store rental revenue is presented on a constant currency basis using the exchange rate as of September 30, 2021 of 1.35 GBP/USD. None of the properties in Spain met our same store pool definition for the periods presented.

Our calculation of same store rental revenue includes rent deferred for future payment as a result of lease concessions we granted in response to the COVID-19 pandemic and recognized under the practical expedient provided by the Financial Accounting Standards Board (FASB). Same store rental income was impacted by (reserve reversals) and reserves to rental revenue of $(313,000) for the three months ended September 30, 2021 compared to $18.0 million for the three months ended September 30, 2020, and $12.7 million for the nine months ended September 30, 2021 compared to $21.7 million for the nine months ended September 30, 2020. Our calculation of same store rental revenue also includes uncollected rent for which we have not granted a lease concession. If these applicable amounts of rent deferrals and uncollected rent were excluded from our calculation of same store rental revenue, the increases for the three and nine months ended September 30, 2021 relative to the comparable periods for 2020 would have been 8.5% and 6.1%, respectively.    

- 5 -


Property Dispositions
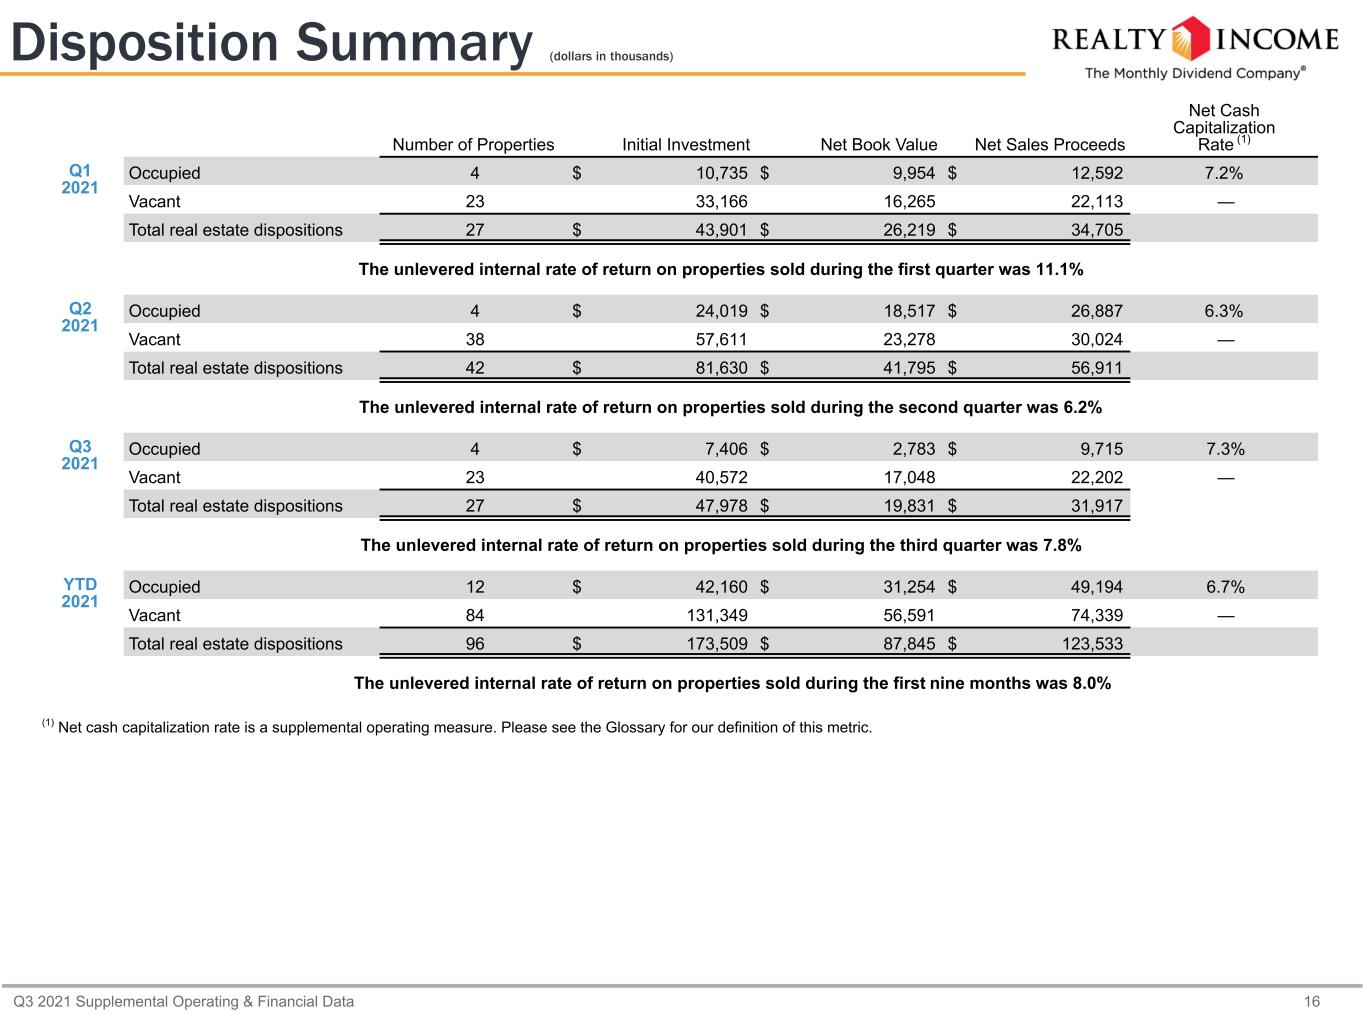
The following summarizes our property dispositions (dollars in millions):
Three Months Ended September 30, 2021Nine Months Ended September 30, 2021
Properties sold
27 96 
Net sales proceeds
$31.9$123.5
Gain on sales of real estate
$12.1$35.4

Liquidity and Capital Markets

Capital Raising
During the three months ended September 30, 2021, we raised $1.63 billion from the sale of common stock at a weighted average price of $67.93 per share, primarily through proceeds from the sale of common stock through our At-The-Market-Program and the July 2021 raising of $594.1 million from the issuance of 9,200,000 shares of common stock in an underwritten public offering, inclusive of 1,200,000 shares purchased by the underwriters upon the exercise of their option to purchase additional shares.

In July 2021, we issued £400 million of 1.125% senior unsecured notes due 2027 (the "2027" Notes) and £350 million of 1.750% senior unsecured notes due 2033 (the "2033" Notes). The public offering price for the 2027 Notes was 99.305% of the principal amount, for an effective semi-annual yield to maturity of 1.242%, and the public offering price for the 2033 Notes was 99.842% of the principal amount, for an effective semi-annual yield to maturity of 1.757%. Combined, the new issues of the 2027 Notes and 2033 Notes have a weighted average term of 8.8 years and a weighted average effective semi-annual yield to maturity of 1.48%. The issuances represented our debut green bond offering.

Revolving Credit Facility and Commercial Paper Program
We have a $3.0 billion unsecured revolving credit facility, with an initial term that expires in March 2023 (subject to two six-month options to extend). The revolving credit facility also has a $1.0 billion accordion feature, which is subject to obtaining lender commitments. As of September 30, 2021, there were no borrowings on our revolving credit facility. In addition, we had a cash balance of $517.0 million.

Additionally, we have a U.S. dollar-denominated unsecured commercial paper program. Under the terms of this program, we may issue unsecured commercial paper notes up to a maximum aggregate amount outstanding of $1.0 billion, with proceeds used for general corporate purposes. We use our unsecured revolving credit facility as a liquidity backstop for the repayment of the notes issued under this program. As of September 30, 2021, we had $405.0 million in commercial paper borrowings.


- 6 -


Earnings Guidance

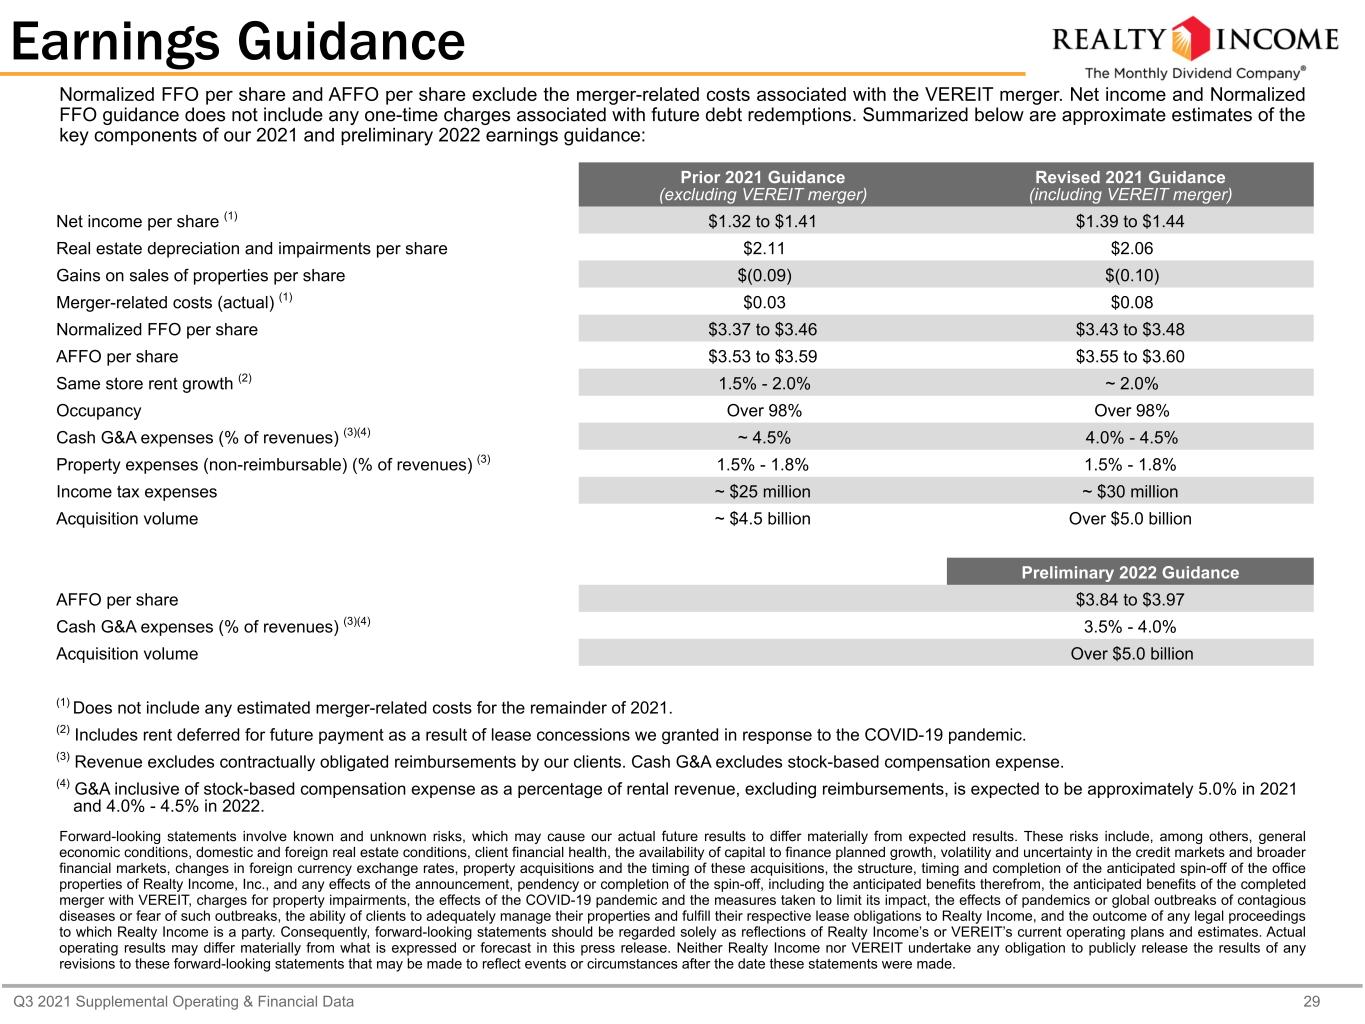
Normalized FFO per share and AFFO per share exclude the merger-related costs associated with the VEREIT merger. Net income and Normalized FFO guidance does not include any one-time charges associated with future debt redemptions. Summarized below are approximate estimates of the key components of our 2021 and preliminary 2022 earnings guidance:
Prior 2021 GuidanceRevised 2021 Guidance
(Excluding VEREIT merger)(Including VEREIT merger)
Net income per share (1)
$1.32 to $1.41$1.39 to $1.44
Real estate depreciation and impairments per share$2.11$2.06
Gains on sales of properties per share$(0.09)$(0.10)
Merger-related costs (actual) (1)
$0.03$0.08
Normalized FFO per share$3.37 to $3.46$3.43 to $3.48
AFFO per share$3.53 to $3.59$3.55 to $3.60
Same store rent growth (2)
1.5% - 2.0%~ 2.0%
OccupancyOver 98%Over 98%
Cash G&A expenses (% of revenues) (3)(4)
~ 4.5%4.0% - 4.5%
Property expenses (non-reimbursable) (% of revenues) (3)
1.5% - 1.8%1.5% - 1.8%
Income tax expenses~ $25 million~ $30 million
Acquisition volume~ $4.5 billionOver $5.0 billion
Preliminary 2022 Guidance
AFFO per share$3.84 to $3.97
Cash G&A expenses (% of revenues) (3)
3.5% - 4.0%
Acquisition volumeOver $5.0 billion
(1) Does not include any estimated merger-related costs for the remainder of 2021.
(2) Includes rent deferred for future payment as a result of lease concessions we granted in response to the COVID-19 pandemic.
(3) Revenue excludes contractually obligated reimbursements by our clients. Cash G&A excludes stock-based compensation expense.
(4) G&A inclusive of stock-based compensation expense as a percentage of rental revenue, excluding reimbursements, is expected to be approximately 5.0% in 2021 and 4.0% - 4.5% in 2022.

Conference Call Information

In conjunction with the release of our operating results, we will host a conference call on November 2, 2021 at 11:30 a.m. PT to discuss the results. To access the conference call, dial (888) 440-5675 (United States) or (646) 960-0268 (International). When prompted, provide the conference ID 9982808.

A telephone replay of the conference call can also be accessed by calling (800) 770-2030 and entering the conference ID 9982808. The telephone replay will be available through November 16, 2021.

A live webcast will be available in listen-only mode by clicking on the webcast link on our home page or in the investors section at www.realtyincome.com. A replay of the conference call webcast will be available approximately one hour after the conclusion of the live broadcast. No access code is required for this replay.

Supplemental Materials and Sustainability Report

Supplemental Operating and Financial Data for the three months ended September 30, 2021, including reconciliations for non-GAAP measures within the Glossary, are available on our corporate website at www.realtyincome.com/investors/financial-information/quarterly-results.

- 7 -


The Sustainability Report for the year ended December 31, 2020 is available on our corporate website at www.realtyincome.com/corporate-responsibility. During June 2021, we established our Green Financing Framework, which is also available on our corporate website at www.realtyincome.com/corporate-responsibility/Green-Financing-Framework.

About Realty Income

Realty Income, The Monthly Dividend Company®, is an S&P 500 company and member of the S&P 500 Dividend Aristocrats® index. We invest in people and places to deliver dependable monthly dividends that increase over time. The company is structured as a REIT, and its monthly dividends are supported by the cash flow from over 7,000 real estate properties owned under long-term lease agreements with our commercial clients. To date, the company has declared 616 consecutive common stock monthly dividends throughout its 52-year operating history and increased the dividend 112 times since Realty Income's public listing in 1994 (NYSE: O). Additional information about the company can be obtained from the corporate website at www.realtyincome.com.

Forward-Looking Statements

Statements in this press release that are not strictly historical are “forward-looking” statements. Forward-looking statements involve known and unknown risks, which may cause our actual future results to differ materially from expected results. These risks include, among others, general economic conditions, domestic and foreign real estate conditions, client financial health, the availability of capital to finance planned growth, volatility and uncertainty in the credit markets and broader financial markets, changes in foreign currency exchange rates, property acquisitions and the timing of these acquisitions, the structure, timing and completion of the anticipated spin-off of the office properties of Realty Income, Inc., and any effects of the announcement, pendency or completion of the spin-off, including the anticipated benefits therefrom, the anticipated benefits of the completed merger with VEREIT, charges for property impairments, the effects of the COVID-19 pandemic and the measures taken to limit its impact, the effects of pandemics or global outbreaks of contagious diseases or fear of such outbreaks, the ability of clients to adequately manage their properties and fulfill their respective lease obligations to Realty Income, and the outcome of any legal proceedings to which Realty Income is a party. Consequently, forward-looking statements should be regarded solely as reflections of Realty Income’s or VEREIT’s current operating plans and estimates. Actual operating results may differ materially from what is expressed or forecast in this press release. Neither Realty Income nor VEREIT undertake any obligation to publicly release the results of any revisions to these forward-looking statements that may be made to reflect events or circumstances after the date these statements were made.

Investor Contact:
Jonathan Pong, CFA, CPA
SVP, Head of Corporate Finance
(858) 284-5177
- 8 -


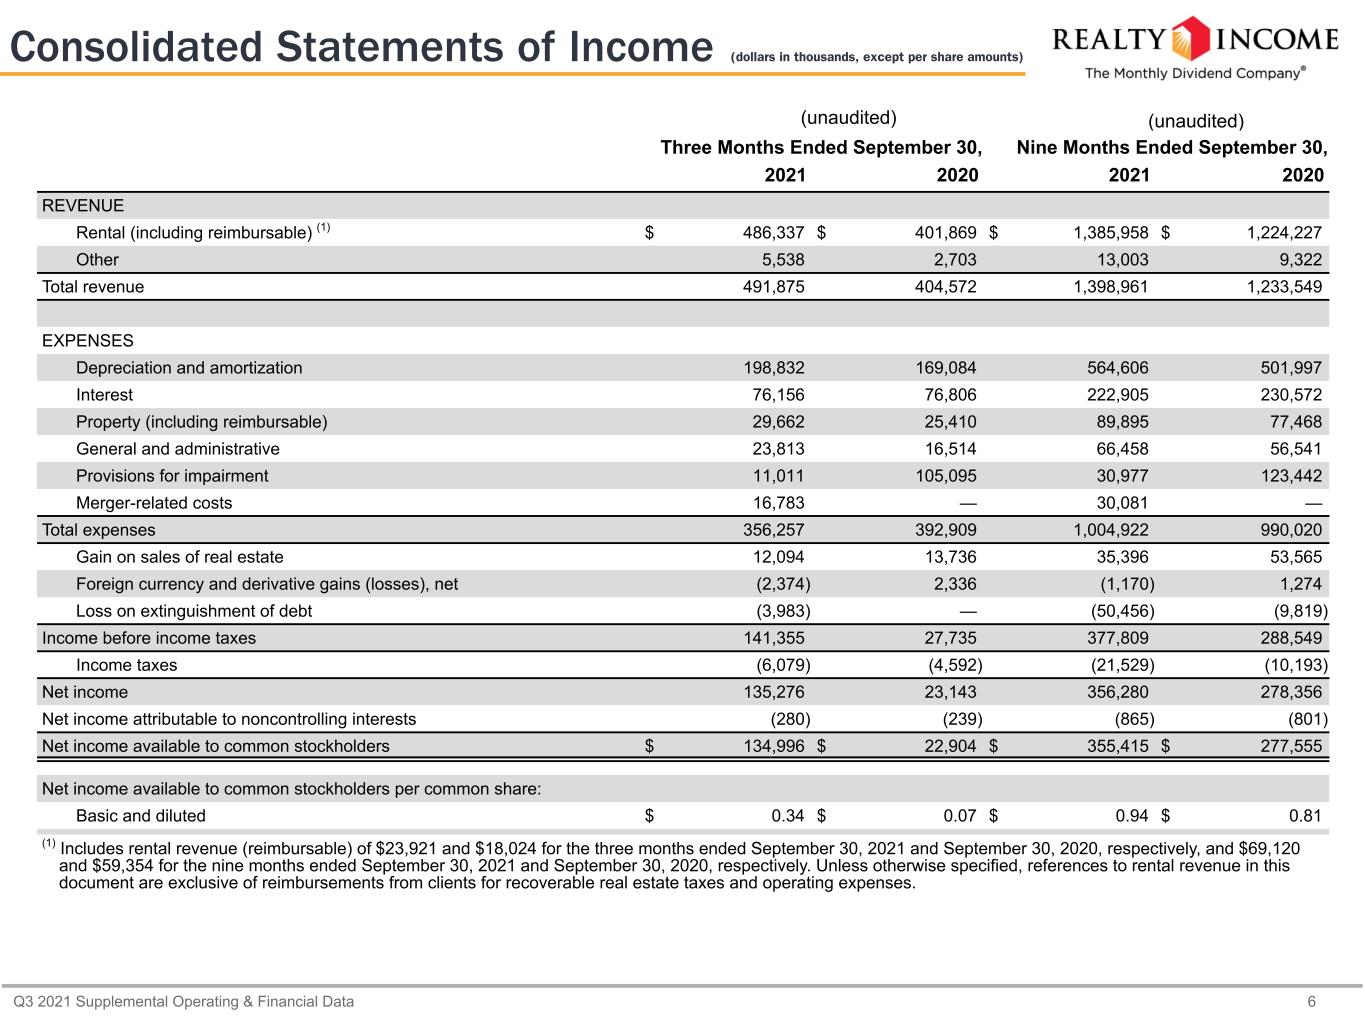
CONSOLIDATED STATEMENTS OF INCOME
(dollars in thousands, except per share amounts) (unaudited)
Three MonthsThree MonthsNine MonthsNine Months
Ended 9/30/21Ended 9/30/20Ended 9/30/21Ended 9/30/20
REVENUE
Rental (including reimbursable) (1)
$486,337 $401,869 $1,385,958 $1,224,227 
Other
5,538 2,703 13,003 9,322 
Total revenue491,875 404,572 1,398,961 1,233,549 
EXPENSES
Depreciation and amortization198,832 169,084 564,606 501,997 
Interest76,156 76,806 222,905 230,572 
Property (including reimbursable)29,662 25,410 89,895 77,468 
General and administrative23,813 16,514 66,458 56,541 
Provisions for impairment11,011 105,095 30,977 123,442 
Merger-related costs16,783 — 30,081 — 
Total expenses356,257 392,909 1,004,922 990,020 
Gain on sales of real estate12,094 13,736 35,396 53,565 
Foreign currency and derivative gains (losses), net(2,374)2,336 (1,170)1,274 
Loss on extinguishment of debt(3,983)— (50,456)(9,819)
Income before income taxes141,355 27,735 377,809 288,549 
Income taxes(6,079)(4,592)(21,529)(10,193)
Net income135,276 23,143 356,280 278,356 
Net income attributable to noncontrolling interests(280)(239)(865)(801)
Net income available to common stockholders$134,996 $22,904 $355,415 $277,555 
Funds from operations available to common stockholders (FFO)$332,335 $282,978 $914,417 $848,419 
Normalized funds from operations available to common stockholders (Normalized FFO)$349,118 $282,978 $944,498 $848,419 
Adjusted funds from operations available to common stockholders (AFFO)$356,837 $282,509 $1,002,706 $874,972 
Per share information for common stockholders:
Net income, basic and diluted$0.34 $0.07 $0.94 $0.81 
FFO, basic and diluted$0.85 $0.82 $2.41 $2.48 
Normalized FFO, basic and diluted$0.89 $0.82 $2.49 $2.48 
AFFO:
Basic$0.91 $0.82 $2.64 $2.56 
Diluted$0.91 $0.81 $2.64 $2.55 
Cash dividends paid per common share$0.707 $0.701 $2.115 $2.092 
(1)We recorded (reserve reversals) and reserves to rental revenue of $(3.1) million (of which $(2.3) million was related to straight-line rent receivables) for the three months ended September 30, 2021 and $24.1 million (of which $2.3 million was related to straight-line receivables) for the three months ended September 30, 2020, $13.9 million (of which $(1.1) million was related to straight-line rent receivables) for the nine months ended September 30, 2021 and $34.4 million (of which $5.1 million was related to straight-line receivables) for the nine months ended September 30, 2020. Unless otherwise specified, references to reserves recorded as a reduction of rental revenue include amounts reserved for in the current period, as well as unrecognized contractual rental revenue and unrecognized straight-line rental revenue for leases accounted for on a cash basis. References to reserve reversals recorded as increases to rental revenue include amounts where the accounting for recognition of rental revenue and straight-line rental revenue has been moved from the cash to the accrual basis.
- 9 -


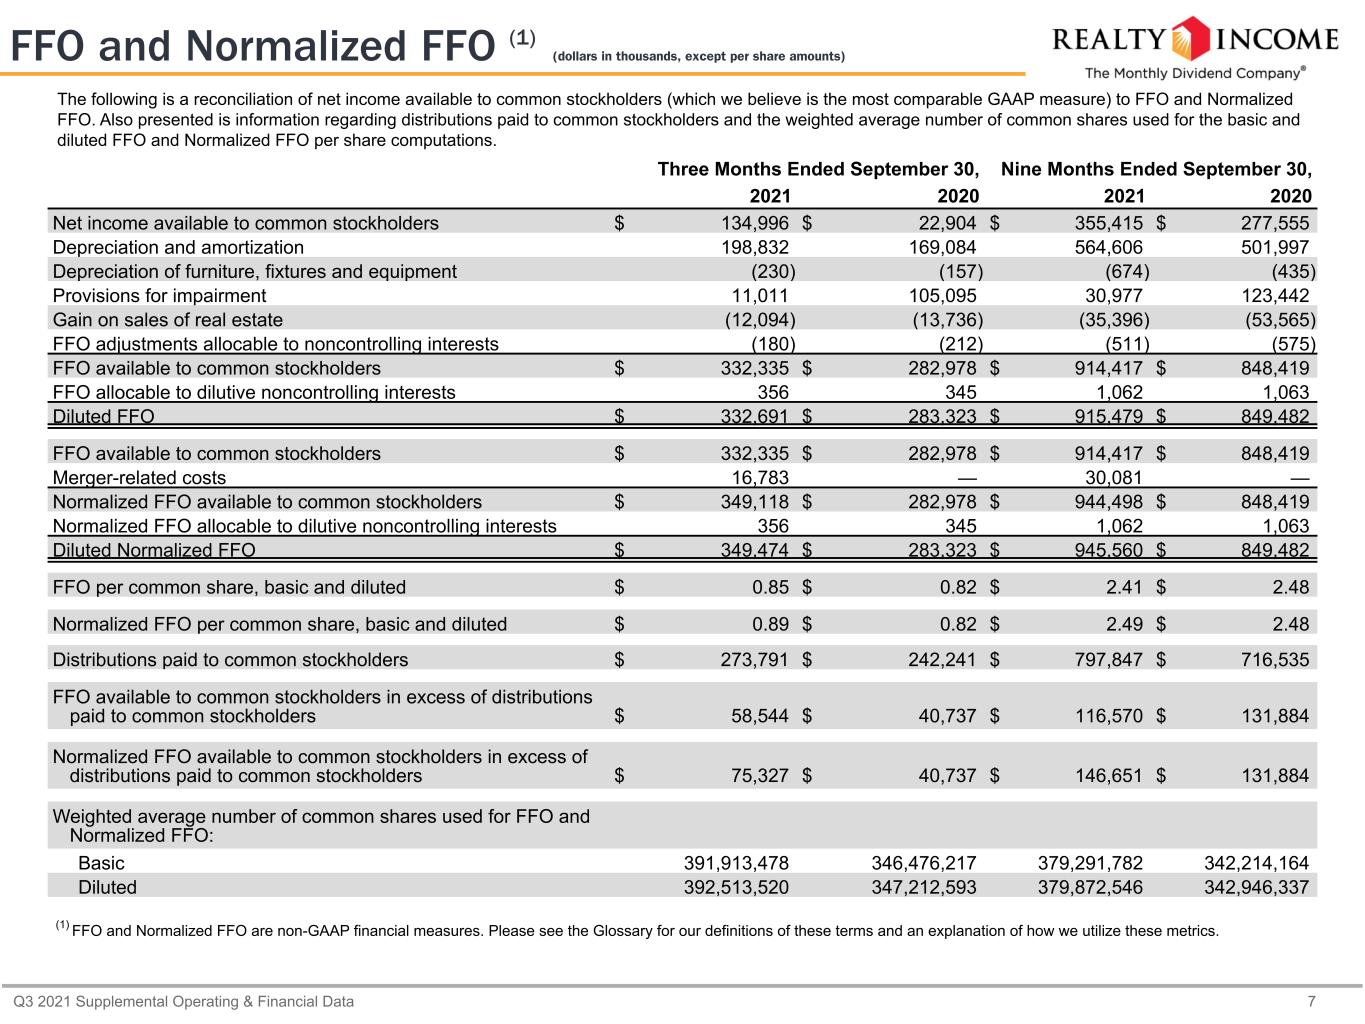
FUNDS FROM OPERATIONS (FFO) AND NORMALIZED FUNDS FROM OPERATIONS (Normalized FFO)
(dollars in thousands, except per share amounts)

FFO and Normalized FFO are non-GAAP financial measures. Please see the Glossary in the Supplemental Operating and Financial Data for the three months ended September 30, 2021 for our definitions and explanations of how we utilize these metrics.
Three MonthsThree MonthsNine MonthsNine Months
Ended 9/30/21Ended 9/30/20Ended 9/30/21Ended 9/30/20
Net income available to common stockholders
$134,996 $22,904 $355,415 $277,555 
Depreciation and amortization
198,832 169,084 564,606 501,997 
Depreciation of furniture, fixtures and equipment
(230)(157)(674)(435)
Provisions for impairment
11,011 105,095 30,977 123,442 
Gain on sales of real estate
(12,094)(13,736)(35,396)(53,565)
FFO adjustments allocable to noncontrolling interests
(180)(212)(511)(575)
FFO available to common stockholders
$332,335 $282,978 $914,417 $848,419 
FFO allocable to dilutive noncontrolling interests
356 345 1,062 1,063 
Diluted FFO
$332,691 $283,323 $915,479 $849,482 
FFO available to common stockholders
$332,335 $282,978 $914,417 $848,419 
Merger-related costs
16,783 — 30,081 — 
Normalized FFO available to common stockholders
$349,118 $282,978 $944,498 $848,419 
Normalized FFO allocable to dilutive noncontrolling interests
356 345 1,062 1,063 
Diluted Normalized FFO
$349,474 $283,323 $945,560 $849,482 
FFO per common share, basic and diluted$0.85 $0.82 $2.41 $2.48 
Normalized FFO per common share, basic and diluted$0.89 $0.82 $2.49 $2.48 
Distributions paid to common stockholders
$273,791 $242,241 $797,847 $716,535 
FFO available to common stockholders in excess of distributions paid to common stockholders
$58,544 $40,737 $116,570 $131,884 
Normalized FFO available to common stockholders in excess of distributions paid to common stockholders
$75,327 $40,737 $146,651 $131,884 
Weighted average number of common shares used for FFO and Normalized FFO:
Basic
391,913,478 346,476,217 379,291,782 342,214,164 
Diluted
392,513,520 347,212,593 379,872,546 342,946,337 
- 10 -


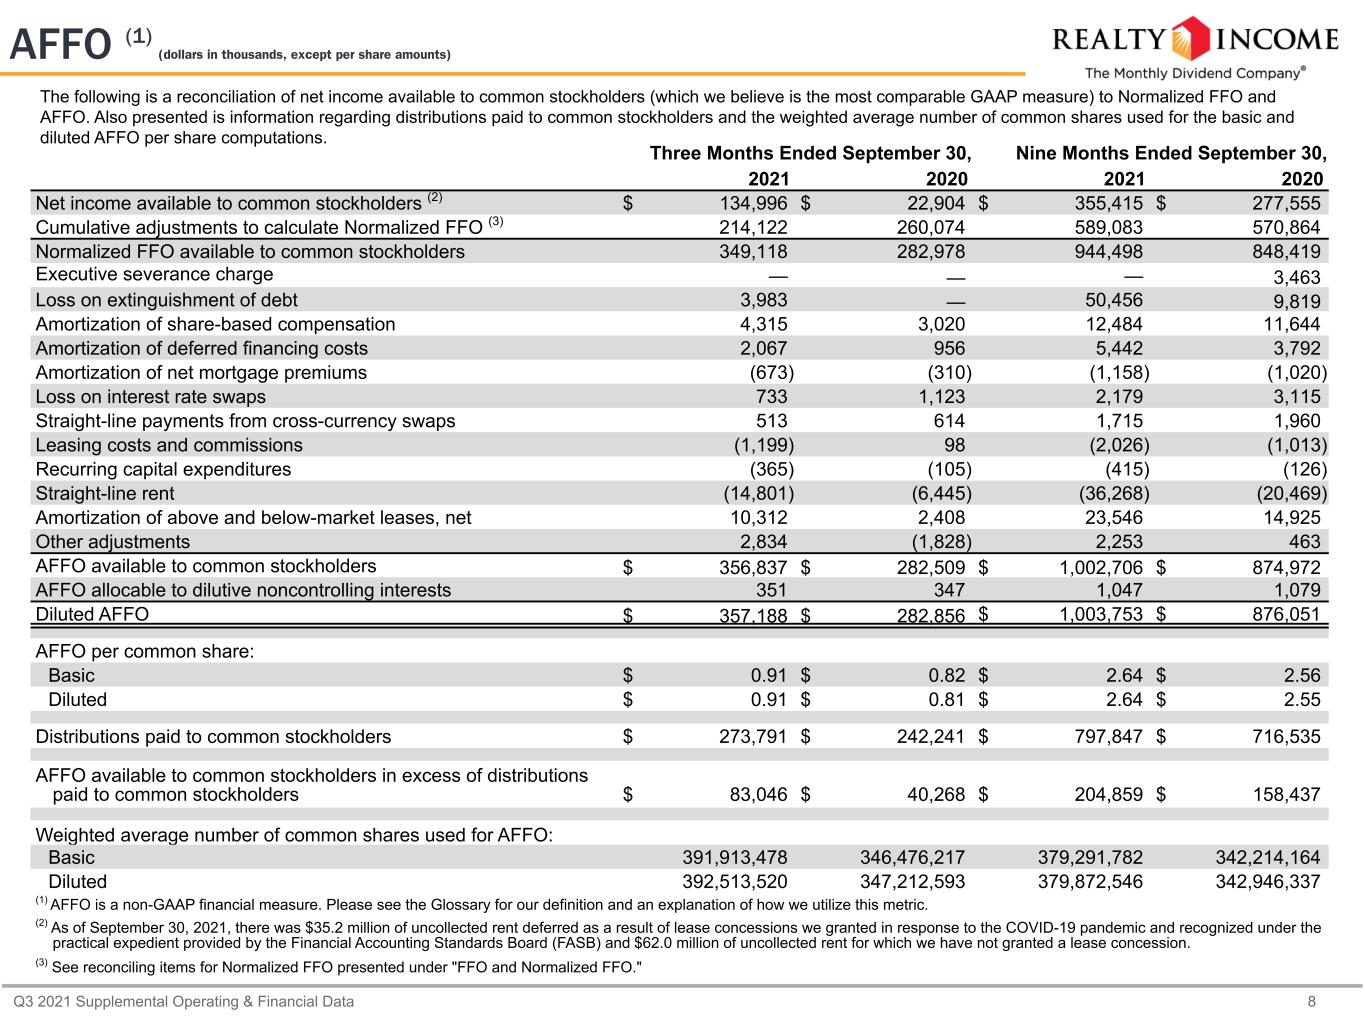
ADJUSTED FUNDS FROM OPERATIONS (AFFO)
(dollars in thousands, except per share amounts) 

AFFO is a non-GAAP financial measure. Please see the Glossary in the Supplemental Operating and Financial Data for the three months ended September 30, 2021 for our definition and an explanation of how we utilize this metric.

Three MonthsThree MonthsNine MonthsNine Months
Ended 9/30/21Ended 9/30/20Ended 9/30/21Ended 9/30/20
Net income available to common stockholders (1)
$134,996 $22,904 $355,415 $277,555 
Cumulative adjustments to calculate Normalized FFO (2)
214,122 260,074 589,083 570,864 
Normalized FFO available to common stockholders
349,118 282,978 944,498 848,419 
 Executive severance charge (3)
— — — 3,463 
 Loss on extinguishment of debt
3,983 — 50,456 9,819 
Amortization of share-based compensation
4,315 3,020 12,484 11,644 
Amortization of deferred financing costs (4)
2,067 956 5,442 3,792 
Amortization of net mortgage premiums
(673)(310)(1,158)(1,020)
Loss on interest rate swaps
733 1,123 2,179 3,115 
Straight-line payments from cross-currency swaps (5)
513 614 1,715 1,960 
Leasing costs and commissions
(1,199)98 (2,026)(1,013)
Recurring capital expenditures
(365)(105)(415)(126)
Straight-line rent
(14,801)(6,445)(36,268)(20,469)
Amortization of above and below-market leases, net
10,312 2,408 23,546 14,925 
Other adjustments (6)
2,834 (1,828)2,253 463 
AFFO available to common stockholders
$356,837 $282,509 $1,002,706 $874,972 
AFFO allocable to dilutive noncontrolling interests
351 347 1,047 1,079 
Diluted AFFO
$357,188 $282,856 $1,003,753 $876,051 
AFFO per common share:
Basic$0.91 $0.82 $2.64 $2.56 
Diluted$0.91 $0.81 $2.64 $2.55 
Distributions paid to common stockholders
$273,791 $242,241 $797,847 $716,535 
AFFO available to common stockholders in excess of distributions paid to common stockholders
$83,046 $40,268 $204,859 $158,437 


Weighted average number of common shares used for AFFO:
Basic
391,913,478 346,476,217 379,291,782 342,214,164 
Diluted
392,513,520 347,212,593 379,872,546 342,946,337 
(1)As of September 30, 2021, there was $35.2 million of uncollected rent deferred as a result of lease concessions we granted in response to the COVID-19 pandemic and recognized under the practical expedient provided by the Financial Accounting Standards Board (FASB) and $62.0 million of uncollected rent for which we have not granted a lease concession.
(2)See Normalized FFO calculations on page ten for reconciling items.
(3)The executive severance charge represents the incremental costs incurred upon our former CFO's departure in March 2020, consisting of $1.6 million of cash, $1.8 million of share-based compensation expense and $58,000 of professional fees.
(4)Includes the amortization of costs incurred and capitalized upon issuance of our notes payable, assumption of our mortgages payable and issuance of our current and previous term loans. The deferred financing costs are being amortized over the lives of the respective notes payable, mortgages and term loan. No costs associated with our credit facility agreements or annual fees paid to credit rating agencies have been included.
(5)Straight-line payments from cross-currency swaps represent quarterly payments in U.S. dollars received by us from counterparties in exchange for associated foreign currency payments. These USD payments are fixed and determinable for the duration of the associated hedging transaction.
(6)Includes adjustments allocable to noncontrolling interests, obligations related to financing lease liabilities, mark-to-market adjustments on derivatives that do not qualify for hedge accounting, and foreign currency gains and losses as a result of intercompany debt and remeasurement transactions.

- 11 -


HISTORICAL FFO AND AFFO
(dollars in thousands, except per share amounts)
For the three months ended September 30,
20212020201920182017
Net income available to common stockholders
$134,996 $22,904 $101,049 $98,999 $87,940 
Depreciation and amortization, net of furniture, fixtures and equipment
198,602 168,927 149,288 136,801 127,436 
Provisions for impairment
11,011 105,095 13,503 6,862 365 
Gain on sales of real estate
(12,094)(13,736)(1,674)(7,813)(4,319)
FFO adjustments allocable to noncontrolling interests
(180)(212)(135)(299)(230)
FFO available to common stockholders$332,335 $282,978 $262,031 $234,550 $211,192 
Merger-related costs16,783 — — — — 
Normalized FFO available to common stockholders$349,118 $282,978 $262,031 $234,550 $211,192 
FFO per diluted share
$0.85 $0.82 $0.82 $0.81 $0.77 
Normalized FFO per diluted share$0.89 $0.82 $0.82 $0.81 $0.77 
AFFO available to common stockholders$356,837 $282,509 $265,355 $236,195 $213,601 
AFFO per diluted share
$0.91 $0.81 $0.83 $0.81 $0.77 
.
Cash dividends paid per share
$0.707 $0.701 $0.680 $0.660 $0.635 
Weighted average diluted shares outstanding - FFO and Normalized FFO392,513,520 347,212,593 320,726,136 291,207,186 276,050,671 
Weighted average diluted shares outstanding - AFFO392,513,520 347,212,593 320,726,136 291,207,186 276,138,853 

For the nine months ended September 30,
20212020201920182017
Net income available to common stockholders
$355,415 $277,555 $307,185 $278,542 $240,662 
Depreciation and amortization, net of furniture, fixtures and equipment
563,932 501,562 436,929 401,576 371,315 
Provisions for impairment
30,977 123,442 31,236 25,034 8,072 
Gain on sales of real estate
(35,396)(53,565)(15,828)(18,818)(17,689)
FFO adjustments allocable to noncontrolling interests
(511)(575)(327)(820)(683)
FFO available to common stockholders$914,417 $848,419 $759,195 $685,514 $601,677 
Merger-related costs30,081 — — — — 
Normalized FFO available to common stockholders$944,498 $848,419 $759,195 $685,514 $601,677 
FFO per diluted share
$2.41 $2.48 $2.43 $2.39 $2.22 
Normalized FFO per diluted share$2.49 $2.48 $2.43 $2.39 $2.22 
AFFO available to common stockholders$1,002,706 $874,972 $768,026 $687,744 $623,327 
AFFO per diluted share
$2.64 $2.55 $2.46 $2.40 $2.30 
.
Cash dividends paid per share
$2.115 $2.092 $2.030 $1.969 $1.891 
Weighted average diluted shares outstanding - FFO and Normalized FFO379,872,546 342,946,337 312,300,391 287,105,285 271,126,114 
Weighted average diluted shares outstanding - AFFO379,872,546 342,946,337 312,300,391 287,105,285 271,214,296 
- 12 -


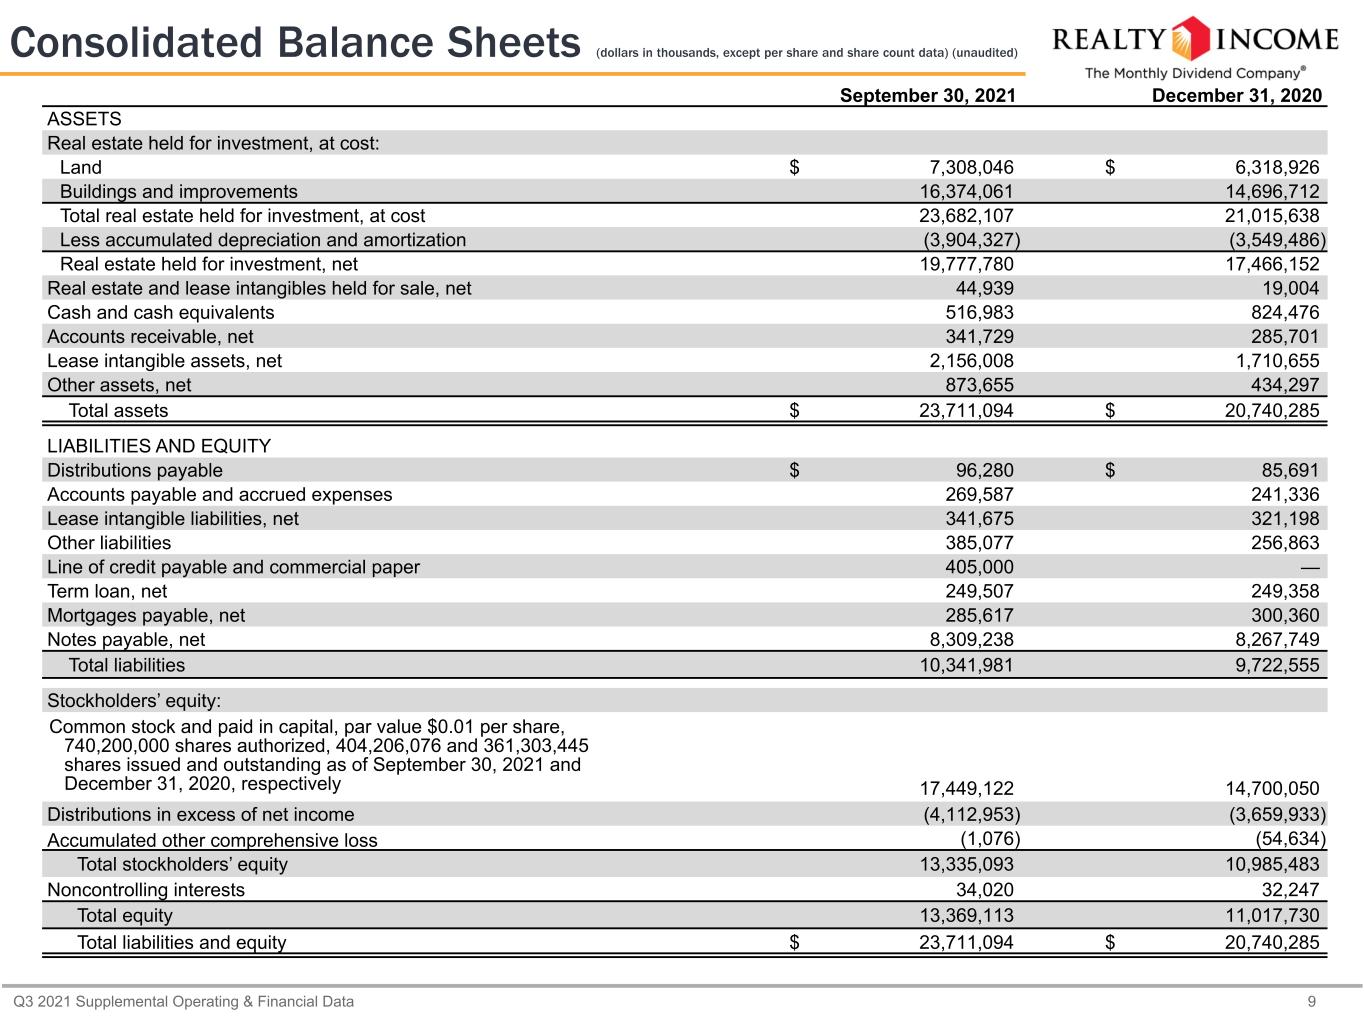
REALTY INCOME CORPORATION AND SUBSIDIARIES
CONSOLIDATED BALANCE SHEETS
(dollars in thousands, except per share and share count data) (unaudited)
September 30, 2021December 31, 2020
ASSETS
Real estate held for investment, at cost:
Land
$7,308,046 $6,318,926 
Buildings and improvements
16,374,061 14,696,712 
Total real estate held for investment, at cost
23,682,107 21,015,638 
Less accumulated depreciation and amortization
(3,904,327)(3,549,486)
Real estate held for investment, net
19,777,780 17,466,152 
Real estate and lease intangibles held for sale, net
44,939 19,004 
Cash and cash equivalents
516,983 824,476 
Accounts receivable, net
341,729 285,701 
Lease intangible assets, net
2,156,008 1,710,655 
Other assets, net
873,655 434,297 
Total assets
$23,711,094 $20,740,285 
LIABILITIES AND EQUITY
Distributions payable
$96,280 $85,691 
Accounts payable and accrued expenses
269,587 241,336 
Lease intangible liabilities, net
341,675 321,198 
Other liabilities
385,077 256,863 
Line of credit payable and commercial paper
405,000 — 
Term loan, net
249,507 249,358 
Mortgages payable, net
285,617 300,360 
Notes payable, net
8,309,238 8,267,749 
Total liabilities
10,341,981 9,722,555 
Commitments and contingencies
Stockholders’ equity:
   Common stock and paid in capital, par value $0.01 per share, 740,200,000 shares authorized, 404,206,076 and 361,303,445 shares issued and outstanding as of September 30, 2021 and December 31, 2020, respectively
17,449,122 14,700,050 
Distributions in excess of net income
(4,112,953)(3,659,933)
Accumulated other comprehensive loss
(1,076)(54,634)
Total stockholders’ equity
13,335,093 10,985,483 
Noncontrolling interests
34,020 32,247 
Total equity
13,369,113 11,017,730 
Total liabilities and equity
$23,711,094 $20,740,285 
- 13 -


Realty Income Performance vs. Major Stock Indices
Equity
NASDAQ
Realty Income
REIT Index (1)
DJIA
S&P 500
Composite
Dividend
Total
Dividend
Total
Dividend
Total
Dividend
Total
Dividend
Total
yield
return (2)
yield
return (3)
yield
return (3)
yield
return (3)
yield
return (4)
10/18 to 12/31/1994
 10.5%
 10.8%
 7.7%
0.0%
 2.9%
(1.6%)
 2.9%
(1.2%)
 0.5%
(1.7%)
1995
 8.3%
 42.0%
 7.4%
 15.3%
 2.4%
 36.9%
 2.3%
 37.6%
 0.6%
 39.9%
1996
 7.9%
 15.4%
 6.1%
 35.3%
 2.2%
 28.9%
 2.0%
 23.0%
 0.2%
 22.7%
1997
 7.5%
 14.5%
 5.5%
 20.3%
 1.8%
 24.9%
 1.6%
 33.4%
 0.5%
 21.6%
1998
 8.2%
 5.5%
 7.5%
(17.5%)
 1.7%
 18.1%
 1.3%
 28.6%
 0.3%
 39.6%
1999
 10.5%
(8.7%)
 8.7%
(4.6%)
 1.3%
 27.2%
 1.1%
 21.0%
 0.2%
 85.6%
2000
 8.9%
 31.2%
 7.5%
 26.4%
 1.5%
(4.7%)
 1.2%
(9.1%)
 0.3%
(39.3%)
2001
 7.8%
 27.2%
 7.1%
 13.9%
 1.9%
(5.5%)
 1.4%
(11.9%)
 0.3%
(21.1%)
2002
 6.7%
 26.9%
 7.1%
 3.8%
 2.6%
(15.0%)
 1.9%
(22.1%)
 0.5%
(31.5%)
2003
 6.0%
 21.0%
 5.5%
 37.1%
 2.3%
 28.3%
 1.8%
 28.7%
 0.6%
 50.0%
2004
 5.2%
 32.7%
 4.7%
 31.6%
 2.2%
 5.6%
 1.8%
 10.9%
 0.6%
 8.6%
2005
 6.5%
(9.2%)
 4.6%
 12.2%
 2.6%
 1.7%
 1.9%
 4.9%
 0.9%
 1.4%
2006
 5.5%
 34.8%
 3.7%
 35.1%
 2.5%
 19.0%
 1.9%
 15.8%
 0.8%
 9.5%
2007
 6.1%
 3.2%
 4.9%
(15.7%)
 2.7%
 8.8%
 2.1%
 5.5%
 0.8%
 9.8%
2008
 7.3%
(8.2%)
 7.6%
(37.7%)
 3.6%
(31.8%)
 3.2%
(37.0%)
 1.3%
(40.5%)
2009
 6.6%
 19.3%
 3.7%
 28.0%
 2.6%
 22.6%
 2.0%
 26.5%
 1.0%
 43.9%
2010
 5.1%
 38.6%
 3.5%
 27.9%
 2.6%
 14.0%
 1.9%
 15.1%
 1.2%
 16.9%
2011
 5.0%
 7.3%
 3.8%
 8.3%
 2.8%
 8.3%
 2.3%
 2.1%
 1.3%
(1.8%)
2012
 4.5%
 20.1%
 3.5%
 19.7%
 3.0%
 10.2%
 2.5%
 16.0%
 2.6%
 15.9%
2013
 5.8%
(1.8%)
 3.9%
 2.9%
 2.3%
 29.6%
 2.0%
 32.4%
 1.4%
 38.3%
2014
 4.6%
 33.7%
 3.6%
 28.0%
 2.3%
 10.0%
 2.0%
 13.7%
 1.3%
 13.4%
2015
 4.4%
 13.0%
 3.9%
 2.8%
 2.6%
 0.2%
 2.2%
 1.4%
 1.4%
 5.7%
2016
 4.2%
 16.0%
 4.0%
 8.6%
 2.5%
 16.5%
 2.1%
 12.0%
 1.4%
 7.5%
2017
 4.5%
 3.6%
 3.9%
 8.7%
 2.2%
 28.1%
 1.9%
 21.8%
 1.1%
 28.2%
2018
 4.2%
 15.2%
 4.4%
(4.0%)
 2.5%
(3.5%)
 2.2%
(4.4%)
 1.4%
(3.9%)
20193.7%21.1%3.7%28.7%2.4%25.3%1.9%31.5%1.1%35.2%
20204.5%(11.8%)3.6%(5.1%)1.9%9.7%1.5%18.4%0.9%43.6%
YTD 2021 4.4%  7.7%  2.9%  21.6%  1.9%  12.1%  1.4%  15.9%  0.7%  12.1%
Compound Average
Annual Total Return (5)
 15.1%  10.7%  10.9%  10.7%  11.5%
 
Note:  All of these dividend yields are calculated as annualized dividends based on the last dividend paid in applicable time period divided by the closing price as of period end. Dividend yield sources: Nareit website and Bloomberg, except for the 1994 NASDAQ dividend yield which was sourced from Datastream / Thomson Financial.

(1)FTSE Nareit US Equity REIT Index, as per Nareit website.
(2)Calculated as the difference between the closing stock price as of period end less the closing stock price as of previous period, plus dividends paid in period, divided by closing stock price as of end of previous period. Does not include reinvestment of dividends for the annual percentages.
(3)Includes reinvestment of dividends. Source: Nareit website and Factset.
(4)Price only index, does not include dividends as NASDAQ did not report total return metrics for the entirety of the measurement period. Source: Factset.
(5)All of these Compound Average Annual Total Return rates are calculated in the same manner for each period from Realty Income's NYSE listing on October 18, 1994 through September 30, 2021, and (except for NASDAQ) assume reinvestment of dividends. Past performance does not guarantee future performance. Realty Income presents this data for informational purposes only and makes no representation about its future performance or how it will compare in performance to other indices in the future.
- 14 -
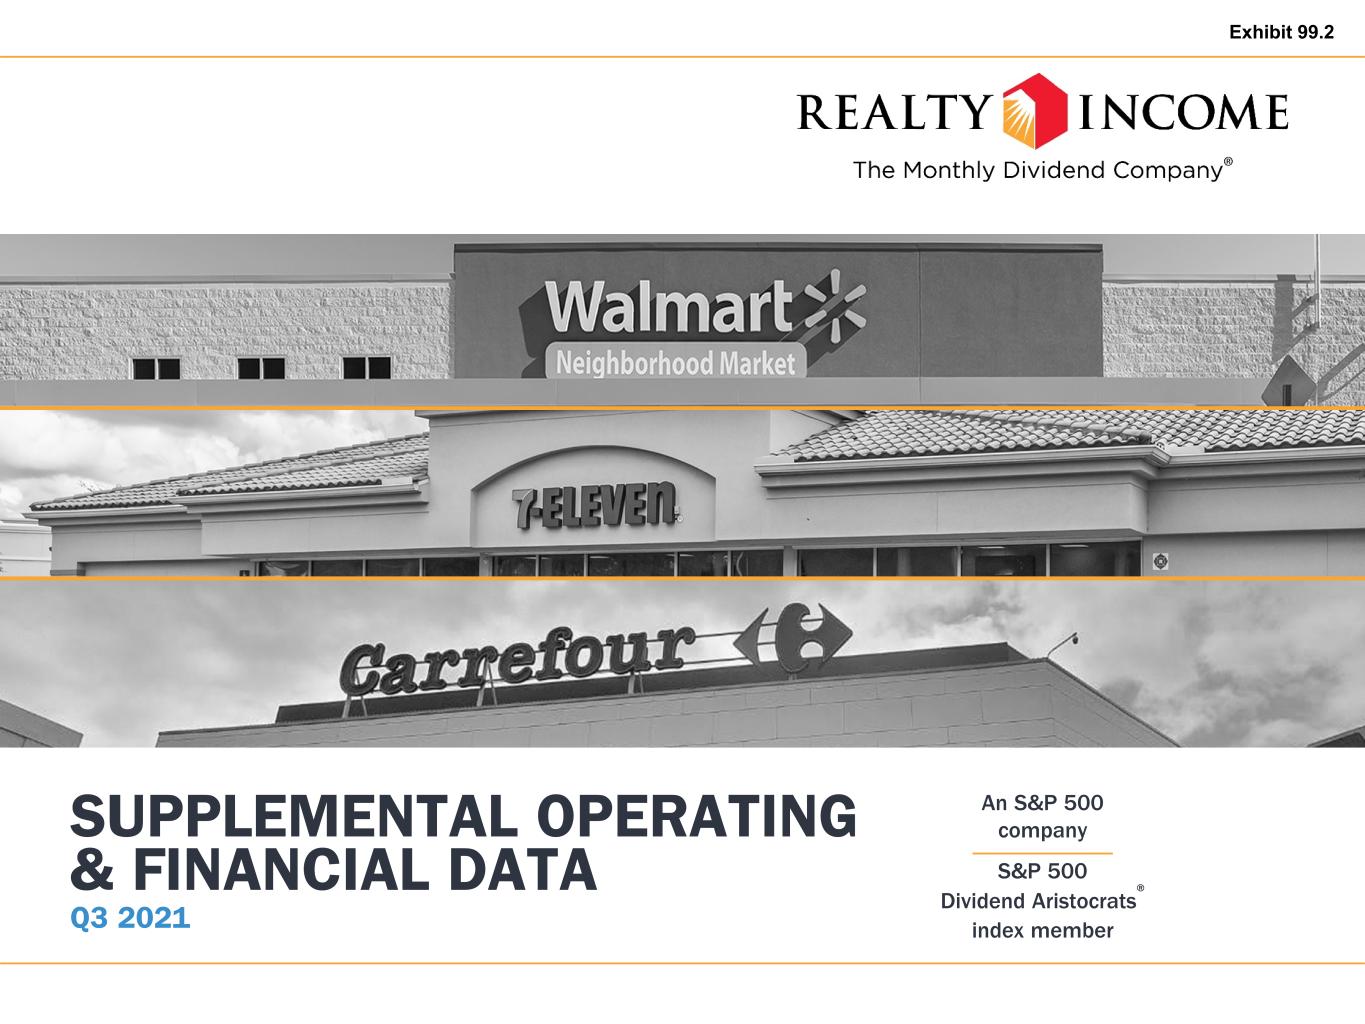
SUPPLEMENTAL OPERATING & FINANCIAL DATA Q3 2021 An S&P 500 company S&P 500 Dividend Aristocrats® index member Exhibit 99.2


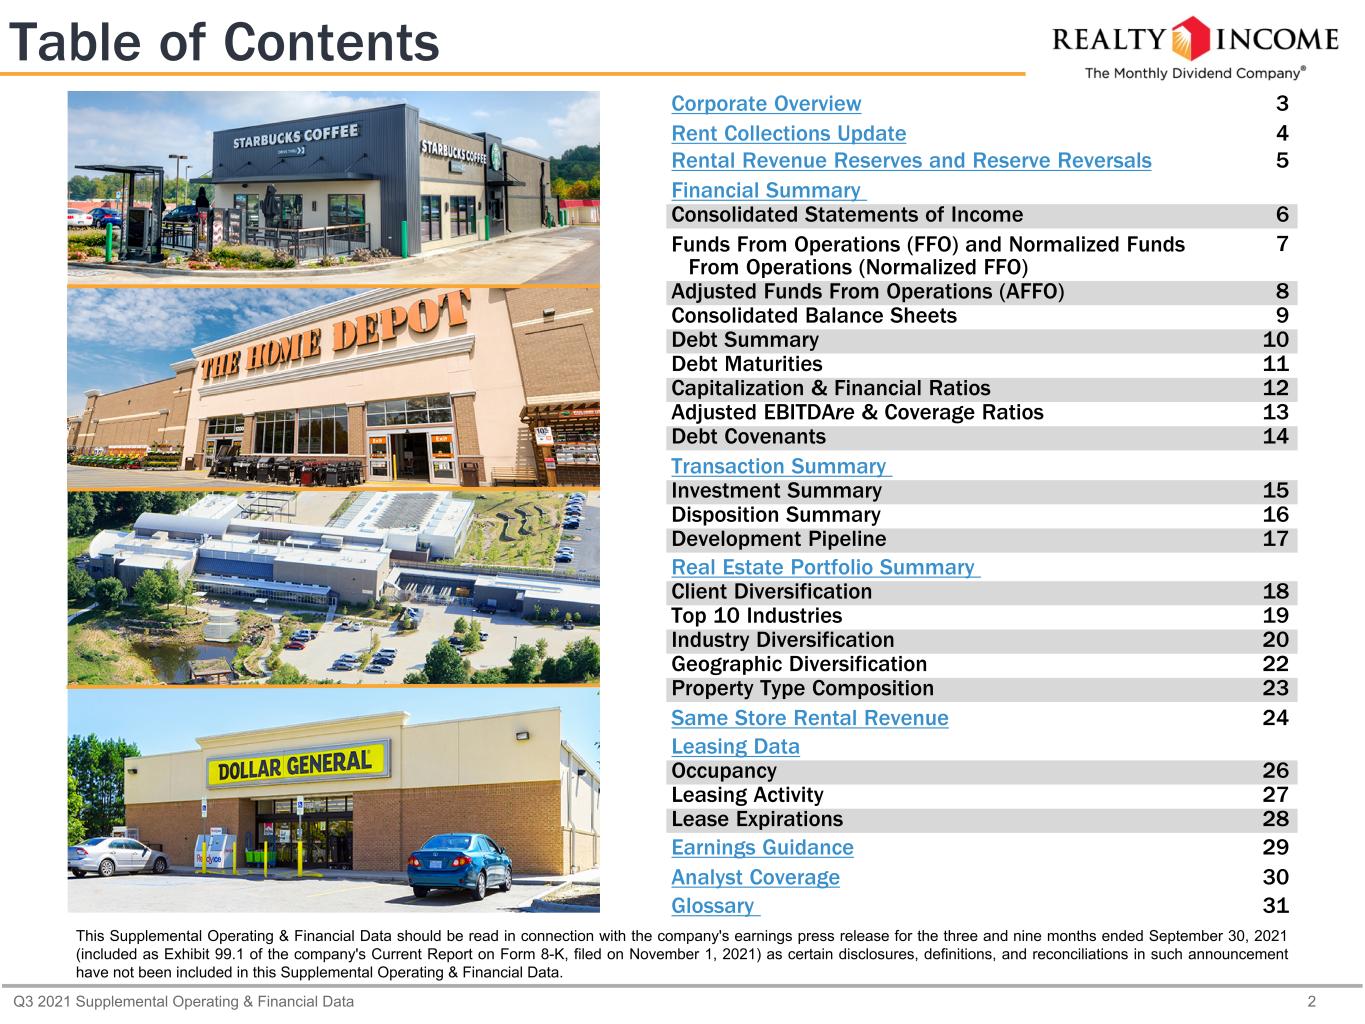
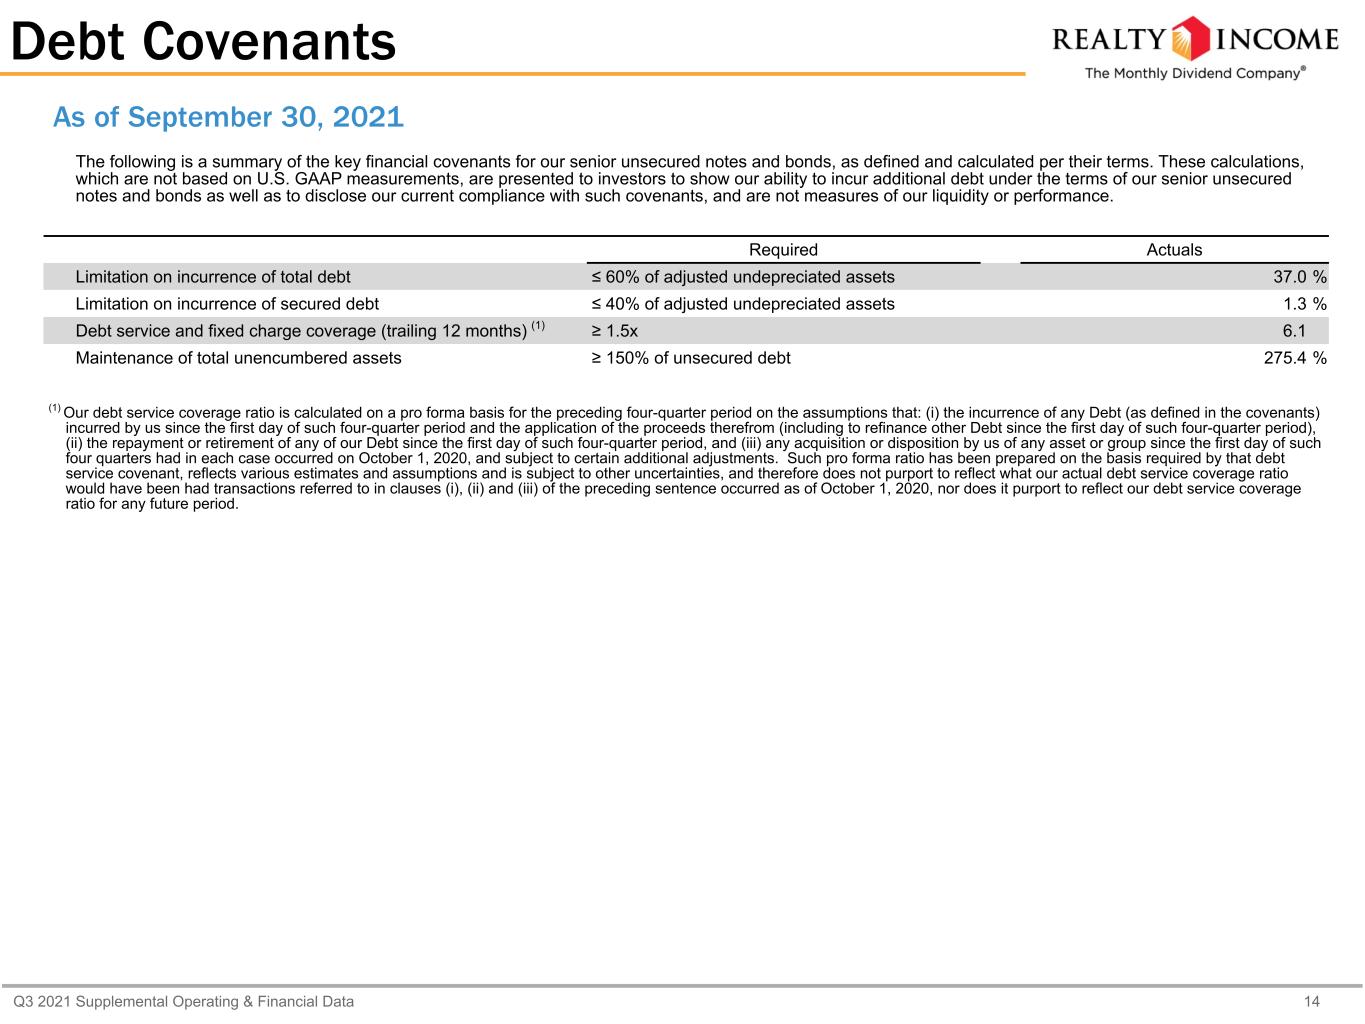
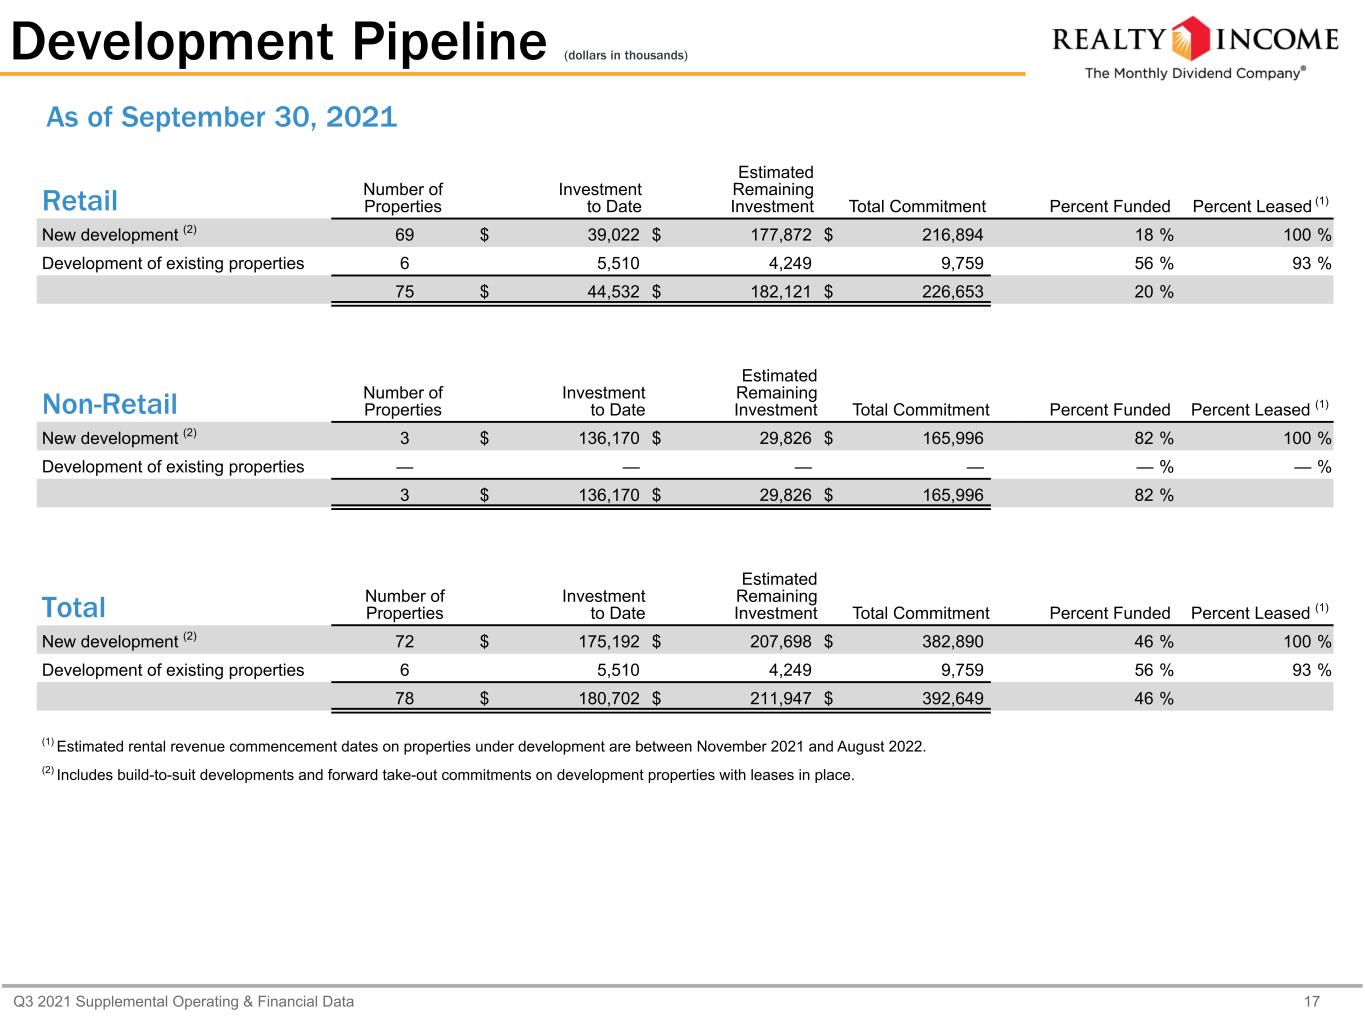
Q3 2021 Supplemental Operating & Financial Data 2 Table of Contents Corporate Overview 3 Rent Collections Update 4 Rental Revenue Reserves and Reserve Reversals 5 Financial Summary Consolidated Statements of Income 6 Funds From Operations (FFO) and Normalized Funds From Operations (Normalized FFO) 7 Adjusted Funds From Operations (AFFO) 8 Consolidated Balance Sheets 9 Debt Summary 10 Debt Maturities 11 Capitalization & Financial Ratios 12 Adjusted EBITDAre & Coverage Ratios 13 Debt Covenants 14 Transaction Summary Investment Summary 15 Disposition Summary 16 Development Pipeline 17 Real Estate Portfolio Summary Client Diversification 18 Top 10 Industries 19 Industry Diversification 20 Geographic Diversification 22 Property Type Composition 23 Same Store Rental Revenue 24 Leasing Data Occupancy 26 Leasing Activity 27 Lease Expirations 28 Earnings Guidance 29 Analyst Coverage 30 Glossary 31 This Supplemental Operating & Financial Data should be read in connection with the company's earnings press release for the three and nine months ended September 30, 2021 (included as Exhibit 99.1 of the company's Current Report on Form 8-K, filed on November 1, 2021) as certain disclosures, definitions, and reconciliations in such announcement have not been included in this Supplemental Operating & Financial Data.


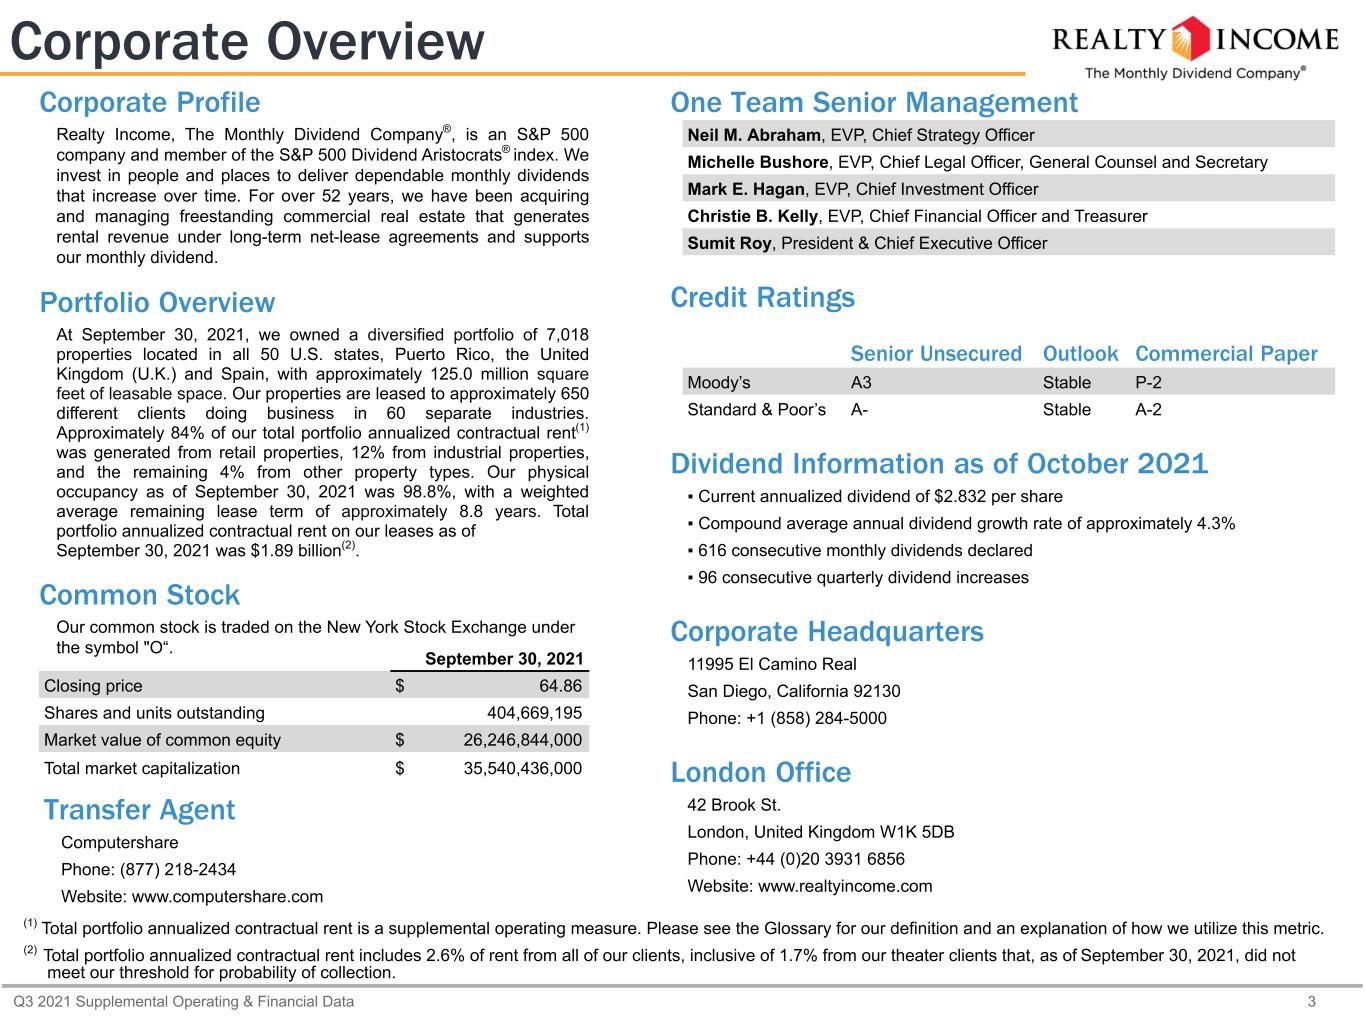
Q3 2021 Supplemental Operating & Financial Data 3 One Team Senior Management Neil M. Abraham, EVP, Chief Strategy Officer Michelle Bushore, EVP, Chief Legal Officer, General Counsel and Secretary Mark E. Hagan, EVP, Chief Investment Officer Christie B. Kelly, EVP, Chief Financial Officer and Treasurer Sumit Roy, President & Chief Executive Officer Credit Ratings Senior Unsecured Outlook Commercial Paper Moody’s A3 Stable P-2 Standard & Poor’s A- Stable A-2 Dividend Information as of October 2021 ▪ Current annualized dividend of $2.832 per share ▪ Compound average annual dividend growth rate of approximately 4.3% ▪ 616 consecutive monthly dividends declared ▪ 96 consecutive quarterly dividend increases Corporate Headquarters 11995 El Camino Real San Diego, California 92130 Phone: +1 (858) 284-5000 London Office 42 Brook St. London, United Kingdom W1K 5DB Phone: +44 (0)20 3931 6856 Website: www.realtyincome.com Corporate Overview September 30, 2021 Closing price $ 64.86 Shares and units outstanding 404,669,195 Market value of common equity $ 26,246,844,000 Total market capitalization $ 35,540,436,000 Transfer Agent Computershare Phone: (877) 218-2434 Website: www.computershare.com (1) Total portfolio annualized contractual rent is a supplemental operating measure. Please see the Glossary for our definition and an explanation of how we utilize this metric. (2) Total portfolio annualized contractual rent includes 2.6% of rent from all of our clients, inclusive of 1.7% from our theater clients that, as of September 30, 2021, did not meet our threshold for probability of collection. Corporate Profile Realty Income, The Monthly Dividend Company®, is an S&P 500 company and member of the S&P 500 Dividend Aristocrats® index. We invest in people and places to deliver dependable monthly dividends that increase over time. For over 52 years, we have been acquiring and managing freestanding commercial real estate that generates rental revenue under long-term net-lease agreements and supports our monthly dividend. Portfolio Overview At September 30, 2021, we owned a diversified portfolio of 7,018 properties located in all 50 U.S. states, Puerto Rico, the United Kingdom (U.K.) and Spain, with approximately 125.0 million square feet of leasable space. Our properties are leased to approximately 650 different clients doing business in 60 separate industries. Approximately 84% of our total portfolio annualized contractual rent(1) was generated from retail properties, 12% from industrial properties, and the remaining 4% from other property types. Our physical occupancy as of September 30, 2021 was 98.8%, with a weighted average remaining lease term of approximately 8.8 years. Total portfolio annualized contractual rent on our leases as of September 30, 2021 was $1.89 billion(2). Common Stock Our common stock is traded on the New York Stock Exchange under the symbol "O“.


Q3 2021 Supplemental Operating & Financial Data 4 Rent Collections Update Percentages of Contractual Rent Collected as of September 30, 2021 (1) Collection rates are calculated as the aggregate contractual rent collected for the applicable period from the beginning of that applicable period through September 30, 2021, divided by the contractual rent charged for the applicable period. Rent collection percentages are calculated based on contractual rents (excluding percentage rents and contractually obligated reimbursements by our clients). Charged amounts have not been adjusted for any COVID-19 related rent relief granted and include contractual rents from any clients in bankruptcy. Due to differences in applicable foreign currency conversion rates and rent conventions, the percentages above may differ from percentages calculated utilizing our total portfolio annualized contractual rent. (2) We define our top 20 clients as our 20 largest clients based on percentage of total portfolio annualized contractual rent as of September 30, 2021 for all periods. (3) Please see the Glossary for our definition of investment grade clients. Month Ended July 31, 2021 Month Ended August 31, 2021 Month Ended September 30, 2021 Quarter Ended September 30, 2021 Contractual rent collected(1) across total portfolio 99.4% 99.5% 99.7% 99.5% Contractual rent collected(1) from our top 20 clients (2) 99.6% 99.8% 99.9% 99.8% Contractual rent collected(1) from our investment grade clients (3) 100.0% 100.0% 100.0% 100.0% Contractual rent collected from our theater clients 99.6% 99.6% 99.6% 99.6% Contractual rent collected from our health and fitness clients 92.4% 95.9% 96.6% 95.0%


Q3 2021 Supplemental Operating & Financial Data 5 Rental Revenue Reserves and Reserve Reversals (1) Theater Industry Update As of September 30, 2021, the theater industry represented 5.2% of annualized contractual rental revenue. As of September 30, 2021, we were fully reserved for the outstanding receivable balances for 34 theater properties. At September 30, 2021, the receivables outstanding for our 79 theater properties totaled $72.8 million, inclusive of $9.8 million of straight-line rent receivables, and net of $39.0 million of reserves, inclusive of $2.0 million of straight-line rent reserves. For the nine months ended September 30, 2021 and the year ended 2020, we recorded $11.3 million and $22.1 million, respectively, in reserves on contractual base rent for theater properties. Contractual rents exclude contractually obligated reimbursements by our clients, which was equivalent to $1.5 million and $1.6 million, respectively, and percentage rent. At September 30, 2021, the receivables outstanding across the portfolio totaled $341.7 million, net of $56.7 million of reserves, and includes $211.5 million of straight-line rent receivable, net of $6.2 million of reserves. The following table summarizes reserves and reserve reversals to rental revenue across the entire portfolio (dollars in millions): Three Months Ended Nine Months Ended September 30, 2021 September 30, 2021 Rental revenue reserves (reserve reversals) Theater industry $ (1.0) $ 12.8 Other 0.2 2.2 Total rental revenue reserves $ (0.8) $ 15.0 Straight-line rent reserves (reserve reversals) Theater industry $ — $ 0.2 Other (2.3) (1.3) Total straight-line rent reserves $ (2.3) $ (1.1) Total reserves (reserve reversals) Theater industry $ (1.0) $ 13.0 Other (2.1) 0.9 Total reserves $ (3.1) $ 13.9 (1) Unless otherwise specified, references to reserves recorded as a reduction of rental revenue include amounts reserved for in the current period, as well as unrecognized contractual rental revenue and unrecognized straight-line rental revenue for leases accounted for on a cash basis. References to reserve reversals recorded as increases to rental revenue include amounts where the accounting for recognition of rental revenue and straight-line rental revenue has been moved from the cash to the accrual basis.


Q3 2021 Supplemental Operating & Financial Data 6 (unaudited) (unaudited) Three Months Ended September 30, Nine Months Ended September 30, 2021 2020 2021 2020 REVENUE Rental (including reimbursable) (1) $ 486,337 $ 401,869 $ 1,385,958 $ 1,224,227 Other 5,538 2,703 13,003 9,322 Total revenue 491,875 404,572 1,398,961 1,233,549 EXPENSES Depreciation and amortization 198,832 169,084 564,606 501,997 Interest 76,156 76,806 222,905 230,572 Property (including reimbursable) 29,662 25,410 89,895 77,468 General and administrative 23,813 16,514 66,458 56,541 Provisions for impairment 11,011 105,095 30,977 123,442 Merger-related costs 16,783 — 30,081 — Total expenses 356,257 392,909 1,004,922 990,020 Gain on sales of real estate 12,094 13,736 35,396 53,565 Foreign currency and derivative gains (losses), net (2,374) 2,336 (1,170) 1,274 Loss on extinguishment of debt (3,983) — (50,456) (9,819) Income before income taxes 141,355 27,735 377,809 288,549 Income taxes (6,079) (4,592) (21,529) (10,193) Net income 135,276 23,143 356,280 278,356 Net income attributable to noncontrolling interests (280) (239) (865) (801) Net income available to common stockholders $ 134,996 $ 22,904 $ 355,415 $ 277,555 Net income available to common stockholders per common share: Basic and diluted $ 0.34 $ 0.07 $ 0.94 $ 0.81 (1) Includes rental revenue (reimbursable) of $23,921 and $18,024 for the three months ended September 30, 2021 and September 30, 2020, respectively, and $69,120 and $59,354 for the nine months ended September 30, 2021 and September 30, 2020, respectively. Unless otherwise specified, references to rental revenue in this document are exclusive of reimbursements from clients for recoverable real estate taxes and operating expenses. Consolidated Statements of Income (dollars in thousands, except per share amounts)


Q3 2021 Supplemental Operating & Financial Data 7 FFO and Normalized FFO (1) (dollars in thousands, except per share amounts) The following is a reconciliation of net income available to common stockholders (which we believe is the most comparable GAAP measure) to FFO and Normalized FFO. Also presented is information regarding distributions paid to common stockholders and the weighted average number of common shares used for the basic and diluted FFO and Normalized FFO per share computations. Three Months Ended September 30, Nine Months Ended September 30, 2021 2020 2021 2020 Net income available to common stockholders $ 134,996 $ 22,904 $ 355,415 $ 277,555 Depreciation and amortization 198,832 169,084 564,606 501,997 Depreciation of furniture, fixtures and equipment (230) (157) (674) (435) Provisions for impairment 11,011 105,095 30,977 123,442 Gain on sales of real estate (12,094) (13,736) (35,396) (53,565) FFO adjustments allocable to noncontrolling interests (180) (212) (511) (575) FFO available to common stockholders $ 332,335 $ 282,978 $ 914,417 $ 848,419 FFO allocable to dilutive noncontrolling interests 356 345 1,062 1,063 Diluted FFO $ 332,691 $ 283,323 $ 915,479 $ 849,482 FFO available to common stockholders $ 332,335 $ 282,978 $ 914,417 $ 848,419 Merger-related costs 16,783 — 30,081 — Normalized FFO available to common stockholders $ 349,118 $ 282,978 $ 944,498 $ 848,419 Normalized FFO allocable to dilutive noncontrolling interests 356 345 1,062 1,063 Diluted Normalized FFO $ 349,474 $ 283,323 $ 945,560 $ 849,482 FFO per common share, basic and diluted $ 0.85 $ 0.82 $ 2.41 $ 2.48 Normalized FFO per common share, basic and diluted $ 0.89 $ 0.82 $ 2.49 $ 2.48 Distributions paid to common stockholders $ 273,791 $ 242,241 $ 797,847 $ 716,535 FFO available to common stockholders in excess of distributions paid to common stockholders $ 58,544 $ 40,737 $ 116,570 $ 131,884 Normalized FFO available to common stockholders in excess of distributions paid to common stockholders $ 75,327 $ 40,737 $ 146,651 $ 131,884 Weighted average number of common shares used for FFO and Normalized FFO: Basic 391,913,478 346,476,217 379,291,782 342,214,164 Diluted 392,513,520 347,212,593 379,872,546 342,946,337 (1) FFO and Normalized FFO are non-GAAP financial measures. Please see the Glossary for our definitions of these terms and an explanation of how we utilize these metrics.


Q3 2021 Supplemental Operating & Financial Data 8 The following is a reconciliation of net income available to common stockholders (which we believe is the most comparable GAAP measure) to Normalized FFO and AFFO. Also presented is information regarding distributions paid to common stockholders and the weighted average number of common shares used for the basic and diluted AFFO per share computations. Three Months Ended September 30, Nine Months Ended September 30, 2021 2020 2021 2020 Net income available to common stockholders (2) $ 134,996 $ 22,904 $ 355,415 $ 277,555 Cumulative adjustments to calculate Normalized FFO (3) 214,122 260,074 589,083 570,864 Normalized FFO available to common stockholders 349,118 282,978 944,498 848,419 Executive severance charge — — — 3,463 Loss on extinguishment of debt 3,983 — 50,456 9,819 Amortization of share-based compensation 4,315 3,020 12,484 11,644 Amortization of deferred financing costs 2,067 956 5,442 3,792 Amortization of net mortgage premiums (673) (310) (1,158) (1,020) Loss on interest rate swaps 733 1,123 2,179 3,115 Straight-line payments from cross-currency swaps 513 614 1,715 1,960 Leasing costs and commissions (1,199) 98 (2,026) (1,013) Recurring capital expenditures (365) (105) (415) (126) Straight-line rent (14,801) (6,445) (36,268) (20,469) Amortization of above and below-market leases, net 10,312 2,408 23,546 14,925 Other adjustments 2,834 (1,828) 2,253 463 AFFO available to common stockholders $ 356,837 $ 282,509 $ 1,002,706 $ 874,972 AFFO allocable to dilutive noncontrolling interests 351 347 1,047 1,079 Diluted AFFO $ 357,188 $ 282,856 $ 1,003,753 $ 876,051 AFFO per common share: Basic $ 0.91 $ 0.82 $ 2.64 $ 2.56 Diluted $ 0.91 $ 0.81 $ 2.64 $ 2.55 Distributions paid to common stockholders $ 273,791 $ 242,241 $ 797,847 $ 716,535 AFFO available to common stockholders in excess of distributions paid to common stockholders $ 83,046 $ 40,268 $ 204,859 $ 158,437 Weighted average number of common shares used for AFFO: Basic 391,913,478 346,476,217 379,291,782 342,214,164 Diluted 392,513,520 347,212,593 379,872,546 342,946,337 (1) AFFO is a non-GAAP financial measure. Please see the Glossary for our definition and an explanation of how we utilize this metric. (2) As of September 30, 2021, there was $35.2 million of uncollected rent deferred as a result of lease concessions we granted in response to the COVID-19 pandemic and recognized under the practical expedient provided by the Financial Accounting Standards Board (FASB) and $62.0 million of uncollected rent for which we have not granted a lease concession. (3) See reconciling items for Normalized FFO presented under "FFO and Normalized FFO." AFFO (1) (dollars in thousands, except per share amounts)


Q3 2021 Supplemental Operating & Financial Data 9 Consolidated Balance Sheets (dollars in thousands, except per share and share count data) (unaudited) September 30, 2021 December 31, 2020 ASSETS Real estate held for investment, at cost: Land $ 7,308,046 $ 6,318,926 Buildings and improvements 16,374,061 14,696,712 Total real estate held for investment, at cost 23,682,107 21,015,638 Less accumulated depreciation and amortization (3,904,327) (3,549,486) Real estate held for investment, net 19,777,780 17,466,152 Real estate and lease intangibles held for sale, net 44,939 19,004 Cash and cash equivalents 516,983 824,476 Accounts receivable, net 341,729 285,701 Lease intangible assets, net 2,156,008 1,710,655 Other assets, net 873,655 434,297 Total assets $ 23,711,094 $ 20,740,285 LIABILITIES AND EQUITY Distributions payable $ 96,280 $ 85,691 Accounts payable and accrued expenses 269,587 241,336 Lease intangible liabilities, net 341,675 321,198 Other liabilities 385,077 256,863 Line of credit payable and commercial paper 405,000 — Term loan, net 249,507 249,358 Mortgages payable, net 285,617 300,360 Notes payable, net 8,309,238 8,267,749 Total liabilities 10,341,981 9,722,555 Stockholders’ equity: Common stock and paid in capital, par value $0.01 per share, 740,200,000 shares authorized, 404,206,076 and 361,303,445 shares issued and outstanding as of September 30, 2021 and December 31, 2020, respectively 17,449,122 14,700,050 Distributions in excess of net income (4,112,953) (3,659,933) Accumulated other comprehensive loss (1,076) (54,634) Total stockholders’ equity 13,335,093 10,985,483 Noncontrolling interests 34,020 32,247 Total equity 13,369,113 11,017,730 Total liabilities and equity $ 23,711,094 $ 20,740,285


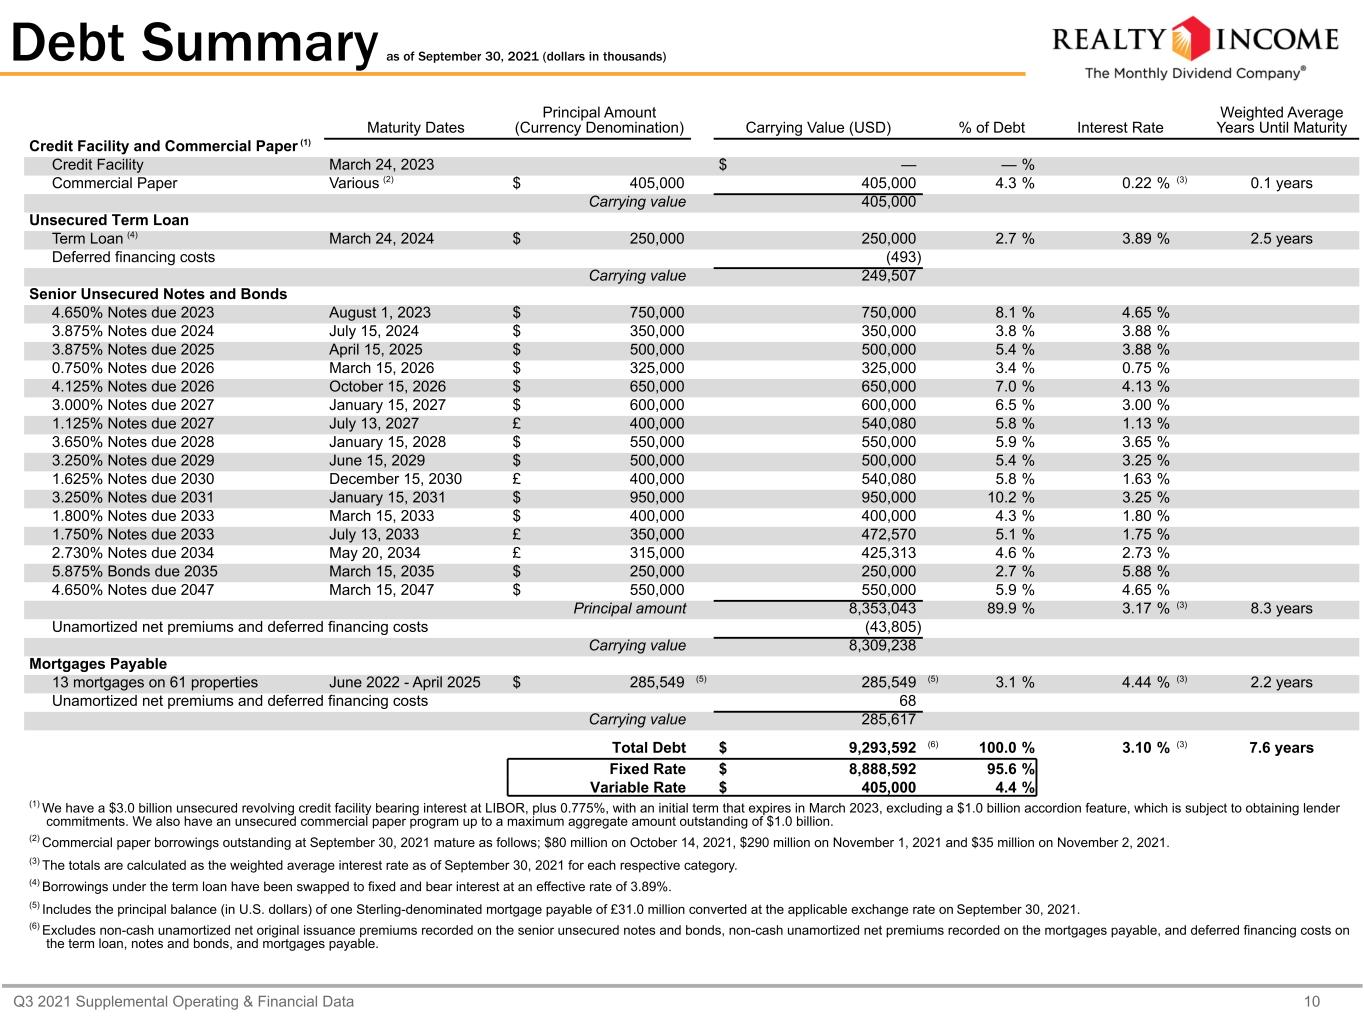
Q3 2021 Supplemental Operating & Financial Data 10 Debt Summary as of September 30, 2021 (dollars in thousands) Maturity Dates Principal Amount (Currency Denomination) Carrying Value (USD) % of Debt Interest Rate Weighted Average Years Until Maturity Credit Facility and Commercial Paper (1) Credit Facility March 24, 2023 $ — — % Commercial Paper Various (2) $ 405,000 405,000 4.3 % 0.22 % (3) 0.1 years Carrying value 405,000 Unsecured Term Loan Term Loan (4) March 24, 2024 $ 250,000 250,000 2.7 % 3.89 % 2.5 years Deferred financing costs (493) Carrying value 249,507 Senior Unsecured Notes and Bonds 4.650% Notes due 2023 August 1, 2023 $ 750,000 750,000 8.1 % 4.65 % 3.875% Notes due 2024 July 15, 2024 $ 350,000 350,000 3.8 % 3.88 % 3.875% Notes due 2025 April 15, 2025 $ 500,000 500,000 5.4 % 3.88 % 0.750% Notes due 2026 March 15, 2026 $ 325,000 325,000 3.4 % 0.75 % 4.125% Notes due 2026 October 15, 2026 $ 650,000 650,000 7.0 % 4.13 % 3.000% Notes due 2027 January 15, 2027 $ 600,000 600,000 6.5 % 3.00 % 1.125% Notes due 2027 July 13, 2027 £ 400,000 540,080 5.8 % 1.13 % 3.650% Notes due 2028 January 15, 2028 $ 550,000 550,000 5.9 % 3.65 % 3.250% Notes due 2029 June 15, 2029 $ 500,000 500,000 5.4 % 3.25 % 1.625% Notes due 2030 December 15, 2030 £ 400,000 540,080 5.8 % 1.63 % 3.250% Notes due 2031 January 15, 2031 $ 950,000 950,000 10.2 % 3.25 % 1.800% Notes due 2033 March 15, 2033 $ 400,000 400,000 4.3 % 1.80 % 1.750% Notes due 2033 July 13, 2033 £ 350,000 472,570 5.1 % 1.75 % 2.730% Notes due 2034 May 20, 2034 £ 315,000 425,313 4.6 % 2.73 % 5.875% Bonds due 2035 March 15, 2035 $ 250,000 250,000 2.7 % 5.88 % 4.650% Notes due 2047 March 15, 2047 $ 550,000 550,000 5.9 % 4.65 % Principal amount 8,353,043 89.9 % 3.17 % (3) 8.3 years Unamortized net premiums and deferred financing costs (43,805) Carrying value 8,309,238 Mortgages Payable 13 mortgages on 61 properties June 2022 - April 2025 $ 285,549 (5) 285,549 (5) 3.1 % 4.44 % (3) 2.2 years Unamortized net premiums and deferred financing costs 68 Carrying value 285,617 Total Debt $ 9,293,592 (6) 100.0 % 3.10 % (3) 7.6 years Fixed Rate $ 8,888,592 95.6 % Variable Rate $ 405,000 4.4 % (1) We have a $3.0 billion unsecured revolving credit facility bearing interest at LIBOR, plus 0.775%, with an initial term that expires in March 2023, excluding a $1.0 billion accordion feature, which is subject to obtaining lender commitments. We also have an unsecured commercial paper program up to a maximum aggregate amount outstanding of $1.0 billion. (2) Commercial paper borrowings outstanding at September 30, 2021 mature as follows; $80 million on October 14, 2021, $290 million on November 1, 2021 and $35 million on November 2, 2021. (3) The totals are calculated as the weighted average interest rate as of September 30, 2021 for each respective category. (4) Borrowings under the term loan have been swapped to fixed and bear interest at an effective rate of 3.89%. (5) Includes the principal balance (in U.S. dollars) of one Sterling-denominated mortgage payable of £31.0 million converted at the applicable exchange rate on September 30, 2021. (6) Excludes non-cash unamortized net original issuance premiums recorded on the senior unsecured notes and bonds, non-cash unamortized net premiums recorded on the mortgages payable, and deferred financing costs on the term loan, notes and bonds, and mortgages payable.


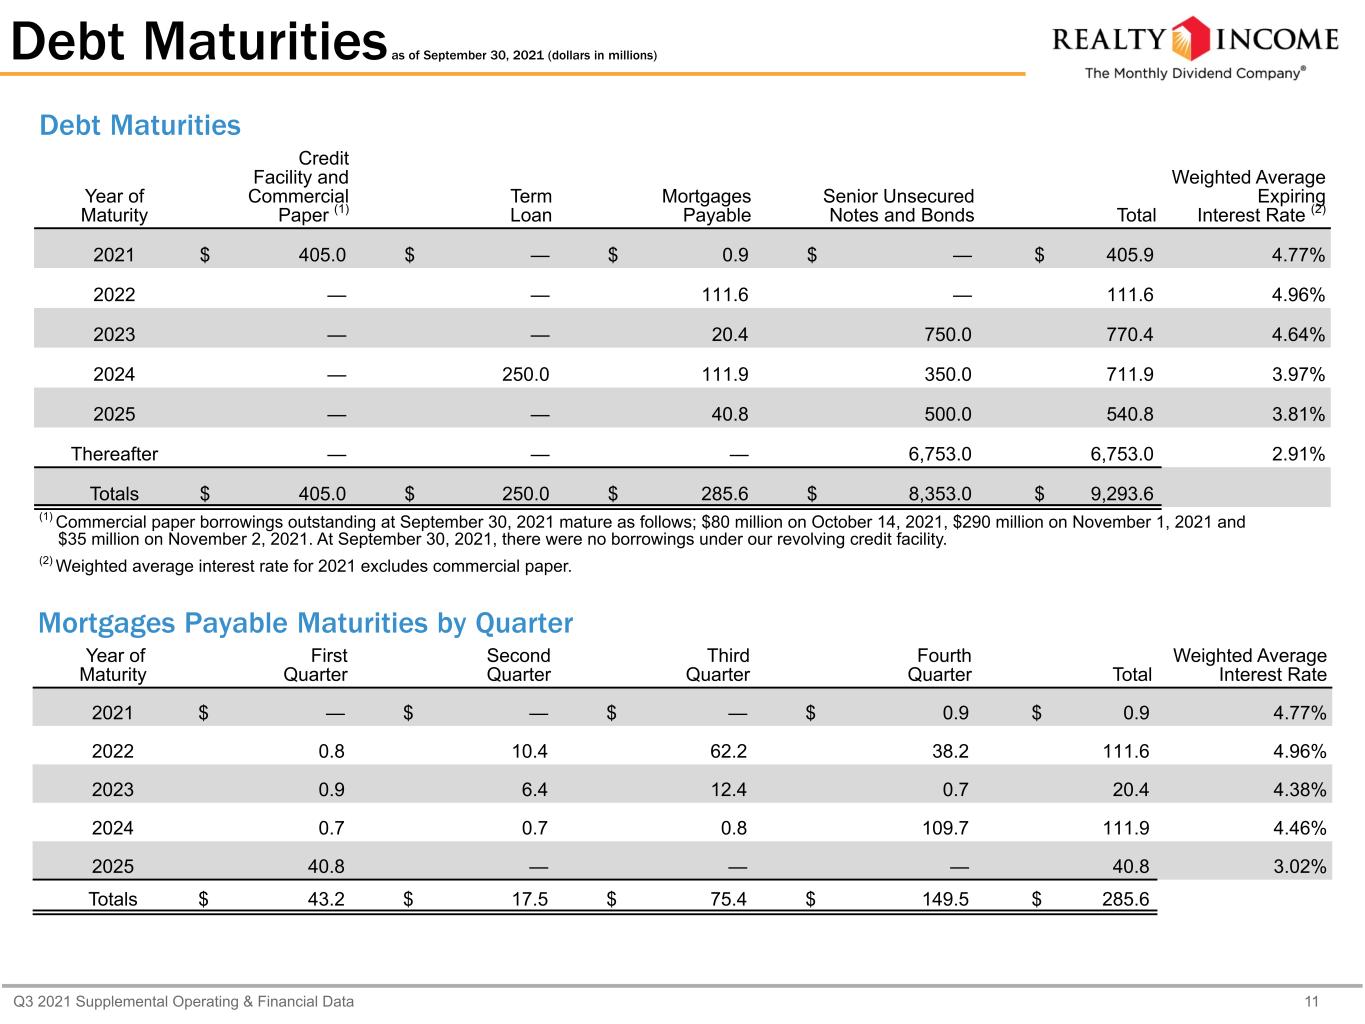
Q3 2021 Supplemental Operating & Financial Data 11 Debt Maturities as of September 30, 2021 (dollars in millions) Debt Maturities Year of Maturity Credit Facility and Commercial Paper (1) Term Loan Mortgages Payable Senior Unsecured Notes and Bonds Total Weighted Average Expiring Interest Rate (2) 2021 $ 405.0 $ — $ 0.9 $ — $ 405.9 4.77% 2022 — — 111.6 — 111.6 4.96% 2023 — — 20.4 750.0 770.4 4.64% 2024 — 250.0 111.9 350.0 711.9 3.97% 2025 — — 40.8 500.0 540.8 3.81% Thereafter — — — 6,753.0 6,753.0 2.91% Totals $ 405.0 $ 250.0 $ 285.6 $ 8,353.0 $ 9,293.6 (1) Commercial paper borrowings outstanding at September 30, 2021 mature as follows; $80 million on October 14, 2021, $290 million on November 1, 2021 and $35 million on November 2, 2021. At September 30, 2021, there were no borrowings under our revolving credit facility. (2) Weighted average interest rate for 2021 excludes commercial paper. Mortgages Payable Maturities by Quarter Year of Maturity First Quarter Second Quarter Third Quarter Fourth Quarter Total Weighted Average Interest Rate 2021 $ — $ — $ — $ 0.9 $ 0.9 4.77% 2022 0.8 10.4 62.2 38.2 111.6 4.96% 2023 0.9 6.4 12.4 0.7 20.4 4.38% 2024 0.7 0.7 0.8 109.7 111.9 4.46% 2025 40.8 — — — 40.8 3.02% Totals $ 43.2 $ 17.5 $ 75.4 $ 149.5 $ 285.6


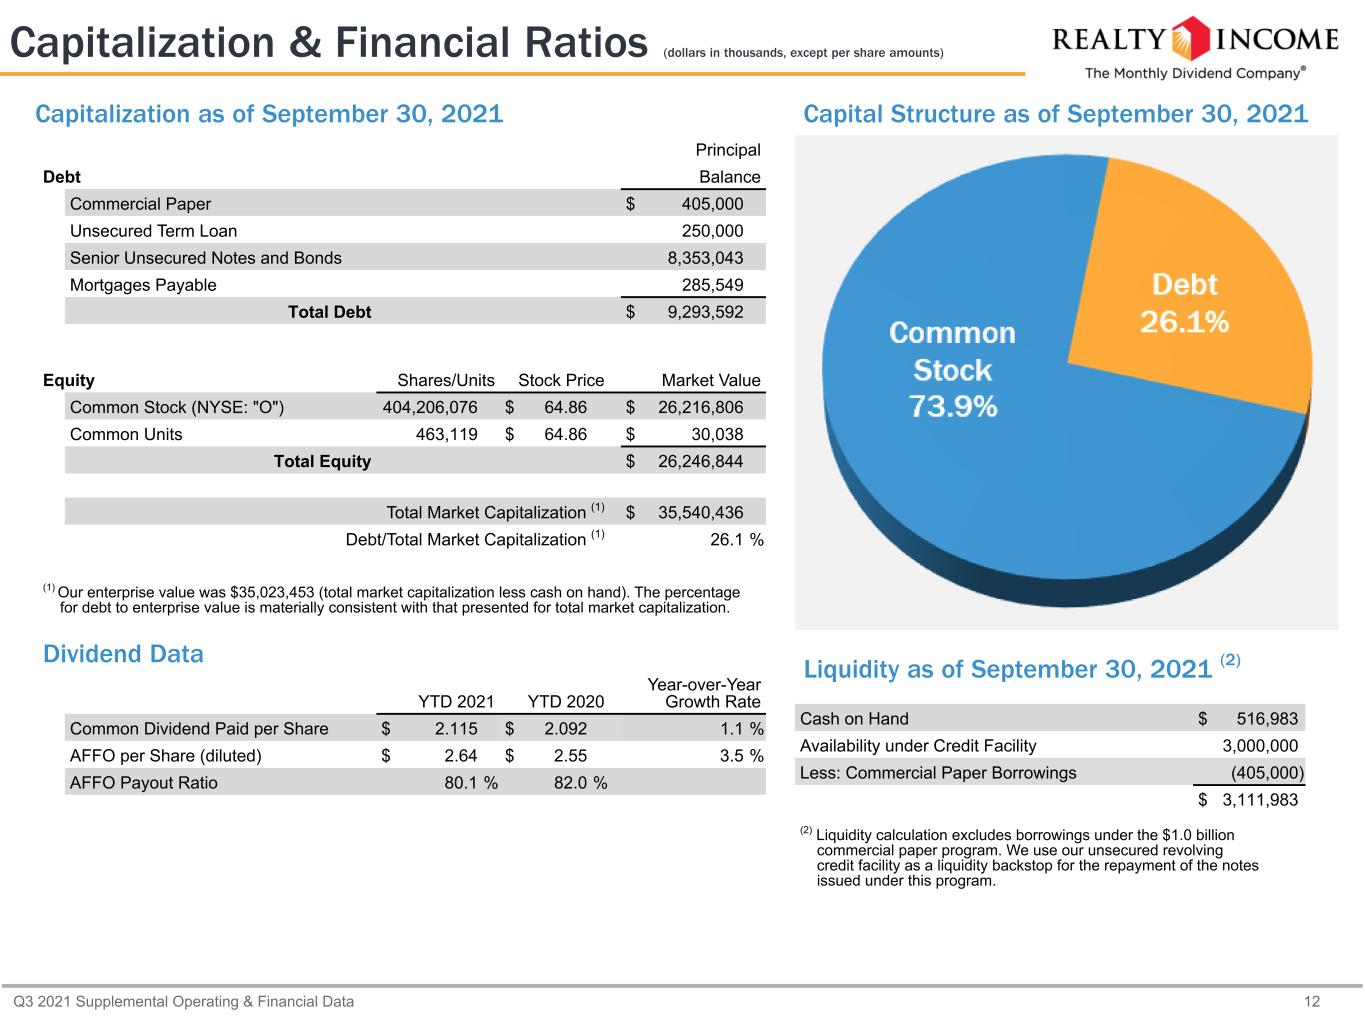
Q3 2021 Supplemental Operating & Financial Data 12 Capitalization & Financial Ratios (dollars in thousands, except per share amounts) Cash on Hand $ 516,983 Availability under Credit Facility 3,000,000 Less: Commercial Paper Borrowings (405,000) $ 3,111,983 (2) Liquidity calculation excludes borrowings under the $1.0 billion commercial paper program. We use our unsecured revolving credit facility as a liquidity backstop for the repayment of the notes issued under this program. Principal Debt Balance Commercial Paper $ 405,000 Unsecured Term Loan 250,000 Senior Unsecured Notes and Bonds 8,353,043 Mortgages Payable 285,549 Total Debt $ 9,293,592 Equity Shares/Units Stock Price Market Value Common Stock (NYSE: "O") 404,206,076 $ 64.86 $ 26,216,806 Common Units 463,119 $ 64.86 $ 30,038 Total Equity $ 26,246,844 Total Market Capitalization (1) $ 35,540,436 Debt/Total Market Capitalization (1) 26.1 % (1) Our enterprise value was $35,023,453 (total market capitalization less cash on hand). The percentage for debt to enterprise value is materially consistent with that presented for total market capitalization. Dividend Data YTD 2021 YTD 2020 Year-over-Year Growth Rate Common Dividend Paid per Share $ 2.115 $ 2.092 1.1 % AFFO per Share (diluted) $ 2.64 $ 2.55 3.5 % AFFO Payout Ratio 80.1 % 82.0 % Liquidity as of September 30, 2021 (2) Capitalization as of September 30, 2021 Capital Structure as of September 30, 2021


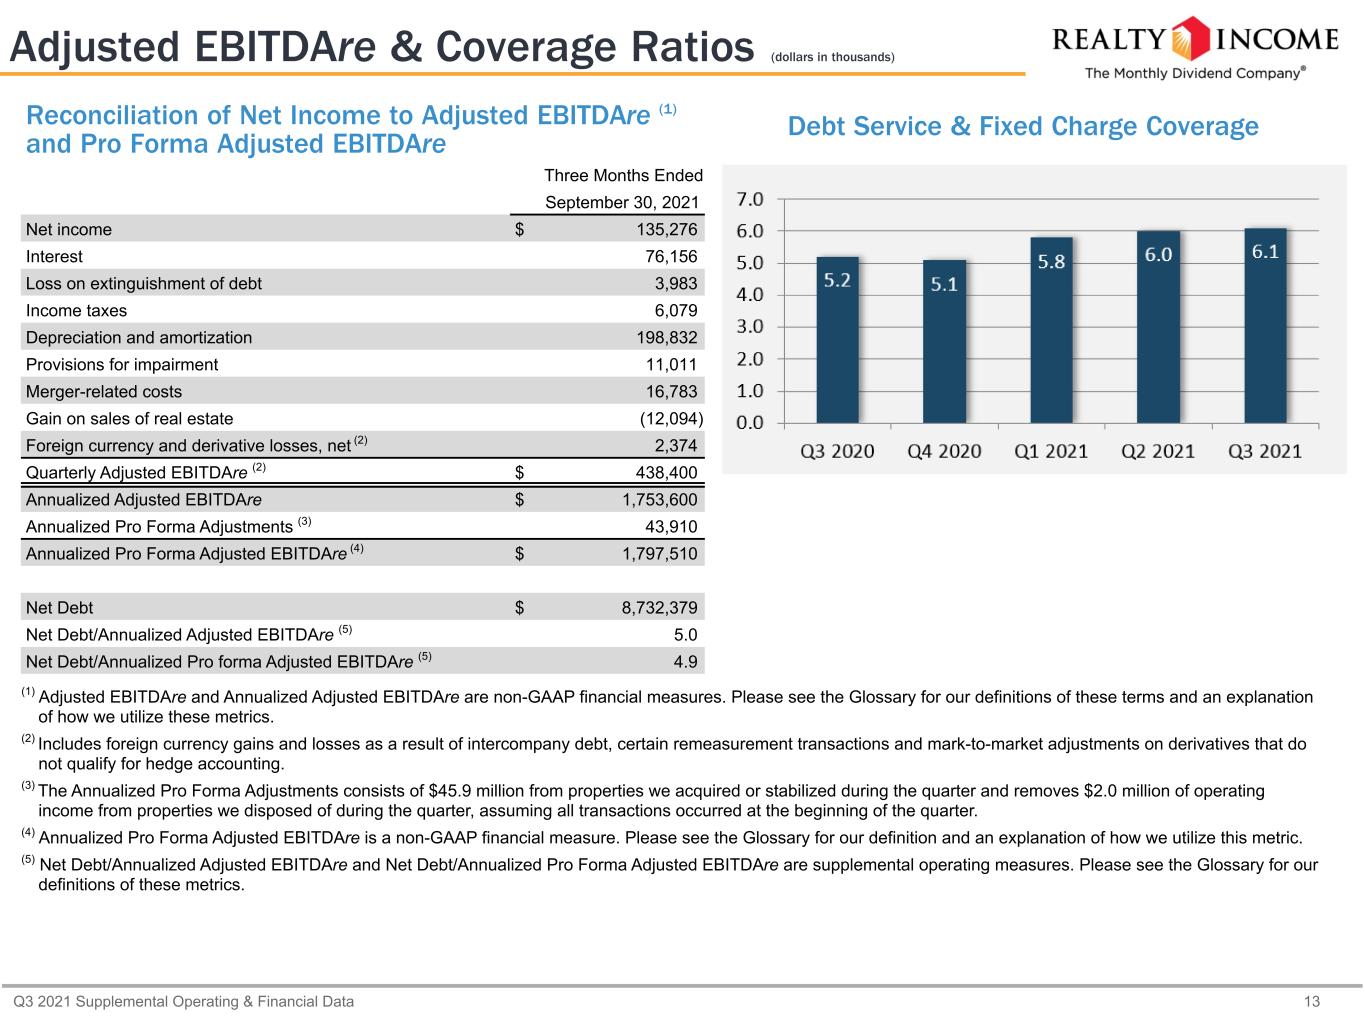
Q3 2021 Supplemental Operating & Financial Data 13 Adjusted EBITDAre & Coverage Ratios (dollars in thousands) Reconciliation of Net Income to Adjusted EBITDAre (1) and Pro Forma Adjusted EBITDAre Three Months Ended September 30, 2021 Net income $ 135,276 Interest 76,156 Loss on extinguishment of debt 3,983 Income taxes 6,079 Depreciation and amortization 198,832 Provisions for impairment 11,011 Merger-related costs 16,783 Gain on sales of real estate (12,094) Foreign currency and derivative losses, net (2) 2,374 Quarterly Adjusted EBITDAre (2) $ 438,400 Annualized Adjusted EBITDAre $ 1,753,600 Annualized Pro Forma Adjustments (3) 43,910 Annualized Pro Forma Adjusted EBITDAre (4) $ 1,797,510 Net Debt $ 8,732,379 Net Debt/Annualized Adjusted EBITDAre (5) 5.0 Net Debt/Annualized Pro forma Adjusted EBITDAre (5) 4.9 (1) Adjusted EBITDAre and Annualized Adjusted EBITDAre are non-GAAP financial measures. Please see the Glossary for our definitions of these terms and an explanation of how we utilize these metrics. (2) Includes foreign currency gains and losses as a result of intercompany debt, certain remeasurement transactions and mark-to-market adjustments on derivatives that do not qualify for hedge accounting. (3) The Annualized Pro Forma Adjustments consists of $45.9 million from properties we acquired or stabilized during the quarter and removes $2.0 million of operating income from properties we disposed of during the quarter, assuming all transactions occurred at the beginning of the quarter. (4) Annualized Pro Forma Adjusted EBITDAre is a non-GAAP financial measure. Please see the Glossary for our definition and an explanation of how we utilize this metric. (5) Net Debt/Annualized Adjusted EBITDAre and Net Debt/Annualized Pro Forma Adjusted EBITDAre are supplemental operating measures. Please see the Glossary for our definitions of these metrics. Debt Service & Fixed Charge Coverage


Q3 2021 Supplemental Operating & Financial Data 14 Debt Covenants The following is a summary of the key financial covenants for our senior unsecured notes and bonds, as defined and calculated per their terms. These calculations, which are not based on U.S. GAAP measurements, are presented to investors to show our ability to incur additional debt under the terms of our senior unsecured notes and bonds as well as to disclose our current compliance with such covenants, and are not measures of our liquidity or performance. Required Actuals Limitation on incurrence of total debt ≤ 60% of adjusted undepreciated assets 37.0 % Limitation on incurrence of secured debt ≤ 40% of adjusted undepreciated assets 1.3 % Debt service and fixed charge coverage (trailing 12 months) (1) ≥ 1.5x 6.1 Maintenance of total unencumbered assets ≥ 150% of unsecured debt 275.4 % (1) Our debt service coverage ratio is calculated on a pro forma basis for the preceding four-quarter period on the assumptions that: (i) the incurrence of any Debt (as defined in the covenants) incurred by us since the first day of such four-quarter period and the application of the proceeds therefrom (including to refinance other Debt since the first day of such four-quarter period), (ii) the repayment or retirement of any of our Debt since the first day of such four-quarter period, and (iii) any acquisition or disposition by us of any asset or group since the first day of such four quarters had in each case occurred on October 1, 2020, and subject to certain additional adjustments. Such pro forma ratio has been prepared on the basis required by that debt service covenant, reflects various estimates and assumptions and is subject to other uncertainties, and therefore does not purport to reflect what our actual debt service coverage ratio would have been had transactions referred to in clauses (i), (ii) and (iii) of the preceding sentence occurred as of October 1, 2020, nor does it purport to reflect our debt service coverage ratio for any future period. As of September 30, 2021


Q3 2021 Supplemental Operating & Financial Data 15 Investment Summary (dollars in thousands) Number of Properties Investment Cash Rents Leasable Square Feet Initial Average Cash Lease Yield (1) Weighted Average Lease Term (Years) Q1 2021 Acquisitions - U.S. 77 $ 566,909 $ 31,887 2,298,606 5.6% 13.5 Acquisitions - Europe (U.K.) 12 402,962 19,775 932,967 4.9% 10.6 Total acquisitions 89 $ 969,871 $ 51,662 3,231,573 5.3% 12.4 Properties under development - U.S (2) 21 57,931 3,241 1,597,165 5.6% 15.5 Total real estate investments 110 $ 1,027,802 $ 54,903 4,828,738 5.3% 12.6 Approximately 39% of the annualized revenue generated by these investments is from our investment grade clients (3) Q2 2021 Acquisitions - U.S. 96 $ 485,424 $ 25,608 2,186,109 5.3% 13.9 Acquisitions - Europe (U.K.) 29 591,821 35,083 2,200,493 6.1% 9.3 Total acquisitions 125 $ 1,077,245 $ 60,691 4,386,602 5.7% 11.2 Properties under development - U.S (2) 31 56,867 3,332 1,898,893 5.9% 15.6 Total real estate investments 156 $ 1,134,112 $ 64,023 6,285,495 5.7% 11.5 Approximately 54% of the annualized revenue generated by these investments is from our investment grade clients (3) Q3 2021 Acquisitions - U.S. 242 $ 1,020,768 $ 54,720 4,741,648 5.5% 13.9 Acquisitions - Europe (U.K. and Spain) 30 526,033 28,412 2,083,732 5.4% 11.9 Total acquisitions 272 $ 1,546,801 $ 83,132 6,825,380 5.5% 13.2 Properties under development (2)(4) 36 67,160 3,982 1,983,960 6.1% 16.2 Total real estate investments 308 $ 1,613,961 $ 87,114 8,809,340 5.5% 13.4 Approximately 38% of the annualized revenue generated by these investments is from our investment grade clients (3) YTD 2021 Acquisitions - U.S. 415 $ 2,073,101 $ 112,215 9,226,363 5.5% 13.8 Acquisitions - Europe (U.K. and Spain) 71 1,520,816 83,271 5,217,192 5.5% 10.5 Total acquisitions 486 $ 3,593,917 $ 195,486 14,443,555 5.5% 12.4 Properties under development (2)(4) 50 181,957 10,554 2,126,955 5.9% 15.8 Total real estate investments 536 $ 3,775,874 $ 206,040 16,570,510 5.5% 12.6 Approximately 43% of the annualized revenue generated by these investments is from our investment grade clients (3) (1) Initial average cash lease yield is a supplemental operating measure. Please see the Glossary in the Supplemental Operating and Financial Data for the three months ended September 30, 2021 for our definition of this metric. Contractual net operating income used in the calculation of initial average cash yield includes approximately $2.4 million received as settlement credits for 31 properties as reimbursement of free rent periods for the three months ended September 30, 2021 and approximately $3.2 million received as settlement credits for 35 properties as reimbursement of free rent periods for the nine months ended September 30, 2021. (2) Includes investments during the period in new development and development of existing properties. Cash rents noted reflect total cash rents to be received on this investment amount upon completion of the properties under development. (3) Please see the Glossary for our definition of investment grade clients. (4) Includes one U.K. development property that represents an investment of £4.7 million Sterling during the three and nine months ended September 30, 2021, converted at the applicable exchange rate on the funding date.


Q3 2021 Supplemental Operating & Financial Data 16 Disposition Summary (dollars in thousands) Number of Properties Initial Investment Net Book Value Net Sales Proceeds Net Cash Capitalization Rate (1) Q1 2021 Occupied 4 $ 10,735 $ 9,954 $ 12,592 7.2% Vacant 23 33,166 16,265 22,113 — Total real estate dispositions 27 $ 43,901 $ 26,219 $ 34,705 The unlevered internal rate of return on properties sold during the first quarter was 11.1% Q2 2021 Occupied 4 $ 24,019 $ 18,517 $ 26,887 6.3% Vacant 38 57,611 23,278 30,024 — Total real estate dispositions 42 $ 81,630 $ 41,795 $ 56,911 The unlevered internal rate of return on properties sold during the second quarter was 6.2% Q3 2021 Occupied 4 $ 7,406 $ 2,783 $ 9,715 7.3% Vacant 23 40,572 17,048 22,202 — Total real estate dispositions 27 $ 47,978 $ 19,831 $ 31,917 The unlevered internal rate of return on properties sold during the third quarter was 7.8% YTD 2021 Occupied 12 $ 42,160 $ 31,254 $ 49,194 6.7% Vacant 84 131,349 56,591 74,339 — Total real estate dispositions 96 $ 173,509 $ 87,845 $ 123,533 The unlevered internal rate of return on properties sold during the first nine months was 8.0% (1) Net cash capitalization rate is a supplemental operating measure. Please see the Glossary for our definition of this metric.


Q3 2021 Supplemental Operating & Financial Data 17 Development Pipeline (dollars in thousands) Retail Number of Properties Investment to Date Estimated Remaining Investment Total Commitment Percent Funded Percent Leased (1) New development (2) 69 $ 39,022 $ 177,872 $ 216,894 18 % 100 % Development of existing properties 6 5,510 4,249 9,759 56 % 93 % 75 $ 44,532 $ 182,121 $ 226,653 20 % Non-Retail Number of Properties Investment to Date Estimated Remaining Investment Total Commitment Percent Funded Percent Leased (1) New development (2) 3 $ 136,170 $ 29,826 $ 165,996 82 % 100 % Development of existing properties — — — — — % — % 3 $ 136,170 $ 29,826 $ 165,996 82 % Total Number of Properties Investment to Date Estimated Remaining Investment Total Commitment Percent Funded Percent Leased (1) New development (2) 72 $ 175,192 $ 207,698 $ 382,890 46 % 100 % Development of existing properties 6 5,510 4,249 9,759 56 % 93 % 78 $ 180,702 $ 211,947 $ 392,649 46 % (1) Estimated rental revenue commencement dates on properties under development are between November 2021 and August 2022. (2) Includes build-to-suit developments and forward take-out commitments on development properties with leases in place. As of September 30, 2021


Q3 2021 Supplemental Operating & Financial Data 18 Our Top 20 Clients Our 20 largest clients based on percentage of total portfolio annualized contractual rent, which does not give effect to deferred rent at September 30, 2021 include the following: Our Investment Grade Clients (3) Number of Leases 3,794 Percentage of Total Portfolio Annualized Contractual Rent 49.6% Weighted Average EBITDAR/Rent Ratio on Retail Properties 2.7x (2) Median EBITDAR/Rent Ratio on Retail Properties 2.6x (2) (1) Amounts for each client are calculated independently; therefore, the individual percentages may not sum to the total. (2) Based on an analysis of the most recently provided information from all retail clients that provide such information. The current calculations only partially reflect the impact of COVID-19. We do not independently verify the information we receive from our retail clients. Client Diversification Ranking Client Number of Leases Percentage of Total Portfolio Annualized Contractual Rent (1) Investment Grade Ratings (S&P/Moody's/Fitch) 1 7-Eleven 592 5.7% A/Baa2/- 2 Walgreens 246 5.0% BBB/Baa2/BBB- 3 Dollar General 859 4.2% BBB/Baa2/- 4 FedEx 42 3.4% BBB/Baa2/- 5 Dollar Tree / Family Dollar 603 3.3% BBB/Baa2/- 6 Sainsbury's 24 3.2% — 7 LA Fitness 56 2.8% — 8 AMC Theaters 34 2.5% — 9 Regal Cinemas (Cineworld) 41 2.4% — 10 Wal-Mart / Sam's Club 57 2.3% AA/Aa2/AA 11 Life Time Fitness 16 2.1% — 12 B&Q (Kingfisher) 18 2.0% BBB/Baa2/BBB 13 Tesco 14 1.9% BBB-/Baa3/BBB- 14 BJ's Wholesale Clubs 18 1.8% - 15 Home Depot 22 1.5% A/A2/A 16 Treasury Wine Estates Americas Company 17 1.4% — 17 Circle K (Couche-Tard) 237 1.4% BBB/Baa2/- 18 CVS Pharmacy 89 1.4% BBB/Baa2/- 19 Kroger 22 1.3% BBB/Baa1/- 20 Fas Mart (GPM Investments) 199 1.2% — Total 3,206 51.0% (3) Please see the Glossary for our definition of investment grade clients.


Q3 2021 Supplemental Operating & Financial Data 19 (1)Top 10 Industries Percentage of Total Portfolio Annualized Contractual Rent As of Sept 30, Dec 31, Dec 31, Dec 31, Dec 31, Dec 31, 2021 2020 2019 2018 2017 2016 Convenience stores 11.6% 11.9% 12.3% 12.6% 9.3% 10.0% Grocery stores 10.9 9.8 7.9 5.0 5.3 3.5 Dollar stores 7.5 7.6 7.9 7.3 7.5 8.0 Drug stores 7.2 8.2 8.8 9.4 10.2 10.8 Health and fitness 5.9 6.7 7.0 7.1 7.7 7.6 Home improvement 5.6 4.3 2.9 2.8 2.9 2.5 Restaurants - quick service 5.2 5.3 5.8 6.3 5.2 4.8 Theaters 5.2 5.6 6.1 5.3 5.7 4.6 Transportation services 3.8 3.9 4.3 5.0 5.4 5.7 General merchandise (2) 3.7 3.4 2.5 2.1 2.3 1.9 (1) The presentation of Top 10 Industries combines total portfolio contractual rent from the U.S. and Europe. Europe consists of properties in the U.K., starting in May 2019, and in Spain, starting in September 2021. (2) 'Europe - general merchandise' is included within the 'Europe - other' classification in the Industry Diversification table.


Q3 2021 Supplemental Operating & Financial Data 20 Percentage of Total Portfolio Annualized Contractual Rent As of Sept 30, Dec 31, Dec 31, Dec 31, Dec 31, Dec 31, 2021 2020 2019 2018 2017 2016 U.S. Aerospace 0.6% 0.6% 0.8% 0.9% 1.0% 1.1% Apparel stores 1.2 1.3 1.1 1.2 1.4 1.7 Automotive collision services 1.3 1.1 1.0 0.9 1.0 1.0 Automotive parts 1.5 1.6 1.6 1.7 1.5 1.3 Automotive service 2.9 2.7 2.6 2.3 2.5 2.0 Automotive tire services 1.8 2.0 2.1 2.3 2.5 2.6 Beverages 2.0 2.1 2.0 2.4 2.6 2.8 Child care 1.9 2.1 2.1 2.2 1.7 1.7 Consumer electronics 0.4 0.3 0.3 0.3 0.3 0.3 Consumer goods 0.5 0.6 0.6 0.7 0.7 0.9 Convenience stores 11.6 11.9 12.3 12.6 9.3 10.0 Crafts and novelties 0.9 0.9 0.6 0.6 0.6 0.5 Diversified industrial 1.0 0.8 0.7 0.8 0.8 0.9 Dollar stores 7.5 7.6 7.9 7.3 7.5 8.0 Drug stores 7.2 8.2 8.8 9.4 10.2 10.8 Education 0.2 0.2 0.2 0.3 0.3 0.3 Electric utilities * 0.1 0.1 0.1 0.1 0.1 Entertainment 0.3 0.3 0.3 0.3 0.4 0.4 Equipment services 0.2 0.3 0.4 0.4 0.4 0.5 Financial services 1.6 1.8 2.0 2.4 2.3 2.6 Food processing 0.6 0.7 0.7 0.5 0.6 1.0 General merchandise 3.6 3.4 2.5 2.1 2.3 1.9 Government services 0.5 0.6 0.7 0.9 0.9 1.0 Grocery stores 4.4 4.9 5.2 5.0 5.3 3.5 Health and beauty 0.2 0.2 0.2 0.2 * * Health and fitness 5.9 6.7 7.0 7.1 7.7 7.6 Health care 1.7 1.5 1.6 1.6 1.4 1.5 * Less than 0.1% Industry Diversification


Q3 2021 Supplemental Operating & Financial Data 21 Industry Diversification (Cont'd) Percentage of Total Portfolio Annualized Contractual Rent As of Sept 30, Dec 31, Dec 31, Dec 31, Dec 31, Dec 31, 2021 2020 2019 2018 2017 2016 Home furnishings 0.8% 0.7% 0.8% 0.8% 0.9% 0.9% Home improvement 3.2 3.1 2.9 2.8 2.9 2.5 Machinery 0.2 0.1 0.1 0.1 0.1 0.1 Motor vehicle dealerships 1.5 1.6 1.6 1.8 2.0 2.0 Office supplies 0.1 0.1 0.2 0.2 0.2 0.3 Other manufacturing 0.4 0.4 0.6 0.7 0.8 0.8 Packaging 0.8 0.9 0.8 1.0 1.1 0.9 Paper 0.1 0.1 0.1 0.1 0.1 0.1 Pet supplies and services 0.6 0.7 0.7 0.5 0.6 0.6 Restaurants - casual dining 2.4 2.8 3.2 3.3 3.6 3.7 Restaurants - quick service 5.2 5.3 5.8 6.3 5.2 4.8 Shoe stores 0.2 0.2 0.2 0.5 0.6 0.6 Sporting goods 0.8 0.7 0.8 0.9 1.0 1.5 Telecommunications 0.4 0.5 0.5 0.6 0.6 0.7 Theaters 5.2 5.6 6.1 5.3 5.7 4.6 Transportation services 3.8 3.9 4.3 5.0 5.4 5.7 Wholesale clubs 2.4 2.4 2.5 2.9 3.1 3.4 Other 0.5 0.2 0.7 0.7 0.8 0.8 Total U.S. 90.1% 93.8% 97.3% 100% 100% 100% Europe (1) Grocery stores 6.5 4.9 2.7 — — — Health care 0.1 0.1 — — — — Home improvement 2.4 1.2 — — — — Warehousing and storage 0.3 — — — — — Other 0.6 * * — — — Total Europe 9.9% 6.2% 2.7% —% —% —% Totals 100% 100% 100% 100% 100% 100% * Less than 0.1% (1) Europe consists of properties in the U.K., starting in May 2019, and in Spain, starting in September 2021.


Q3 2021 Supplemental Operating & Financial Data 22 Geographic Diversification Balanced presence in 50 states, Puerto Rico, the United Kingdom and Spain


Q3 2021 Supplemental Operating & Financial Data 23 Property Type Composition (dollars in thousands) Property Type Number of Properties Approximate Leasable Square Feet (1) Total Portfolio Annualized Contractual Rent as of September 30, 2021 Percentage of Total Portfolio Annualized Contractual Rent as of September 30, 2021 Percentage of Annualized Contractual Rent from Our Investment Grade Clients (2) Retail 6,828 87,092,000 $ 1,579,991 83.7 % 45.8 % Industrial 132 34,556,300 $ 229,498 12.2 74.0 Office 42 3,141,100 $ 49,648 2.6 85.9 Agriculture 16 191,200 $ 28,534 1.5 — Totals 7,018 124,980,600 $ 1,887,671 100 % 49.6 % (1) Includes leasable building square footage. Excludes 3,600 acres of leased land categorized as agriculture at September 30, 2021. (2) Please see the Glossary for our definition of investment grade clients.


Q3 2021 Supplemental Operating & Financial Data 24 Q3 2021 Same Store Rental Revenue Number of properties 6,099 Square footage 96,727,907 Q3 2021 $ 380,341 Q3 2020 $ 358,861 Increase (in dollars) $ 21,480 Increase (percent) 6.0 % Same Store Rental Revenue (1) (dollars in thousands) Top 3 Industries Contributing to the Change (2) Three Months Ended Three Months Ended Net % Change Industry September 30, 2021 September 30, 2020 Change by Industry Theaters - U.S. $ 24,375 $ 9,058 $ 15,317 169.1 % Health and Fitness 25,587 23,758 1,829 7.7 % Convenience Stores 48,150 47,283 867 1.8 % For purposes of comparability, same store rental revenue is presented on a constant currency basis using the exchange rate as of September 30, 2021 of 1.35 GBP/USD. None of the properties in Spain met our same store pool definition for the periods presented. Our calculation of same store rental revenue includes rent deferred for future payment as a result of lease concessions we granted in response to the COVID-19 pandemic and recognized under the practical expedient provided by the Financial Accounting Standards Board (FASB). Same store rental income was impacted by (reserve reversals) and reserves to rental revenue of $(313,000) for the three months ended September 30, 2021 compared to $18.0 million for the three months ended September 30, 2020, and $12.7 million for the nine months ended September 30, 2021 compared to $21.7 million for the nine months ended September 30, 2020. Our calculation of same store rental revenue also includes uncollected rent for which we have not granted a lease concession. If these applicable amounts of rent deferrals and uncollected rent were excluded from our calculation of same store rental revenue, the increases for the three and nine months ended September 30, 2021 relative to the comparable periods for 2020 would have been 8.5% and 6.1%, respectively. (2) Top 3 industry contributors are based on absolute value of net change year over year. (1) Please see the Glossary for our definitions of the Same Store Pool and Same Store Rental Revenue. Year-to-Date 2021 Same Store Rental Revenue Number of properties 6,099 Square footage 96,727,907 YTD 2021 $ 1,127,320 YTD 2020 $ 1,105,333 Increase (in dollars) $ 21,987 Increase (percent) 2.0 % Top 3 Industries Contributing to the Change (2) Nine Months Ended Nine Months Ended Net % Change Industry September 30, 2021 September 30, 2020 Change by Industry Theaters - U.S. $ 60,635 $ 54,841 $ 5,794 10.6 % Restaurants - Quick Service U.S. 65,819 60,825 4,994 8.2 % Convenience Stores 144,414 141,477 2,937 2.1 %


Q3 2021 Supplemental Operating & Financial Data 25 Same Store Rental Revenue (1) (Cont'd) (dollars in thousands) Q3 2021 Three Months Ended Three Months Ended Net % Change by Property Type September 30, 2021 September 30, 2020 Change Property Type Retail $ 322,286 $ 300,972 $ 21,314 7.1 % Industrial 40,018 39,876 142 0.4 % Office 12,180 12,230 (50) (0.4) % Agriculture 5,857 5,783 74 1.3 % Total $ 380,341 $ 358,861 $ 21,480 6.0 % Same Store Rental Revenue by Property Type Three Months Ended Nine Months Ended September 30, 2021 September 30, 2020 September 30, 2021 September 30, 2020 Same store rental revenue $ 380,341 $ 358,861 $ 1,127,320 $ 1,105,333 Constant currency adjustment (2) 824 (618) 2,550 (2,299) Straight-line rent and other non-cash adjustments 2,100 2,294 5,033 532 Contractually obligated reimbursements by our clients 23,909 18,026 69,080 59,366 Revenue from excluded properties (3) 79,163 23,306 181,975 61,295 Rental revenue (including reimbursable) $ 486,337 $ 401,869 $ 1,385,958 $ 1,224,227 (1) Please see the Glossary to see our definitions of the Same Store Pool and Same Store Rental Revenue. (2) For purposes of comparability, same store rental revenue is presented on a constant currency basis using the exchange rate as of September 30, 2021 of 1.35 GBP/USD. None of the properties in Spain met our same store pool definition for the periods presented. (3) Please see the Glossary for our definition of Same Store Pool. Reconciliation of Same Store Rental Revenue to Rental Revenue (including reimbursable) Year-to-Date 2021 Nine Months Ended Nine Months Ended Net % Change by Property Type September 30, 2021 September 30, 2020 Change Property Type Retail $ 953,754 $ 931,942 $ 21,812 2.3 % Industrial 119,576 119,758 (182) (0.2) % Office 36,552 36,415 137 0.4 % Agriculture 17,438 17,218 220 1.3 % Total $ 1,127,320 $ 1,105,333 $ 21,987 2.0 %


Q3 2021 Supplemental Operating & Financial Data 26 By Property Occupied properties 6,932 Total properties 7,018 Occupancy 98.8 % By Square Footage Occupied square footage 123,923,410 Total square footage 124,980,593 Occupancy 99.2 % By Rental Revenue (Economic Occupancy) Quarterly cash rental revenue (1) $ 455,475,264 Quarterly cash vacant rental revenue (2) $ 3,774,008 Occupancy 99.2% Change in Occupancy Vacant properties at 6/30/2021   103 Lease expirations (3) + 49 Leasing activity (4) - 43 Vacant dispositions (5) - 23 Vacant properties at 9/30/2021   86 (1) This amount does not incorporate reserves recorded as reductions to rental revenue. (2) Based on contractual monthly rents received immediately preceding the date of vacancy. (3) Includes scheduled and unscheduled expirations (including leases rejected in bankruptcy), as well as future expirations resolved in the current quarter. (4) Excludes seven minority unit leases with no property-level vacancy impact. See page 27 for additional detail on re-leasing activity. (5) Includes 22 properties vacant at the beginning of the quarter. Occupancy as of September 30, 2021 Occupancy by Number of Properties


Q3 2021 Supplemental Operating & Financial Data 27 Allocation Based on Number of Leases Leasing Activity Q3 2021 Re-leased to New Client Re-leased to Without After a Period Re-leasing Same Client Vacancy of Vacancy Totals Prior cash rents $ 12,470,231 $ 267,705 $ 4,210,034 $ 16,947,970 New cash rents* $ 12,971,039 $ 372,802 $ 4,828,134 $ 18,171,975 Recapture rate 104.0 % 139.3 % 114.7 % 107.2 % Number of leases 39 4 7 50 Average months vacant — — 25.1 3.5 Lease incentives (1) $ — $ — $ — $ — *Percentage of Total Portfolio Annualized Portfolio Rental Revenue: 1.0 % (1) Lease incentives are defined as capital outlays made on behalf of a client that are specific to the client's use and benefit, and are not capitalized as improvements to the property. Year-to-Date 2021 Re-leased to New Client Re-leased to Without After a Period Re-leasing Same Client Vacancy of Vacancy Totals Prior cash rents $ 28,783,025 $ 529,020 $ 8,755,668 $ 38,067,713 New cash rents* $ 30,005,207 $ 675,486 $ 9,464,257 $ 40,144,950 Recapture rate 104.2 % 127.7 % 108.1 % 105.5 % Number of leases 131 7 24 162 Average months vacant — — 13.3 2.0 Lease incentives (1) $ — $ — $ — $ — *Percentage of Total Portfolio Annualized Portfolio Rental Revenue: 2.1 %


Q3 2021 Supplemental Operating & Financial Data 28 (1) This table sets forth the timing of remaining lease terms expirations in our portfolio (excluding rights to extend a lease at the option of the client) and their contributions to annualized contractual rent as of September 30, 2021. Leases on our multi-client properties are counted separately in the table above. This table excludes 110 vacant units. (2) Of the 7,064 in-place leases in the portfolio, which excludes 110 vacant units, 6,000 or 84.9% were under leases that provide for increases in rents through: base rent increases tied to a consumer price index (typically subject to ceilings), percentage rent based on a percentage of the clients’ gross sales, fixed increases, or a combination of two or more of the aforementioned rent provisions. Our leases have a weighted average remaining lease term of approximately 8.8 years Lease Expirations (dollars in thousands) Total Portfolio (1)(2) Total Portfolio Percentage of Approx. Annualized Contractual Total Portfolio Expiring Leases Leasable Rent as of Annualized Year Retail Non-Retail Sq. Feet September 30, 2021 Contractual Rent 2021 61 7 631,300 $ 11,938 0.6 % 2022 337 17 6,933,300 66,690 3.5 2023 544 23 9,539,200 119,618 6.3 2024 421 18 7,526,900 97,148 5.1 2025 515 22 8,777,600 132,707 7.0 2026 440 11 8,029,900 103,266 5.5 2027 475 7 7,872,500 106,658 5.7 2028 608 17 12,582,000 151,031 8.0 2029 567 6 9,778,600 139,168 7.4 2030 303 12 7,910,000 93,685 5.0 2031 301 27 12,167,900 157,788 8.4 2032 348 12 5,794,800 119,288 6.3 2033 315 6 5,372,200 82,691 4.4 2034 328 3 5,656,100 134,111 7.1 2035 281 1 2,873,600 72,675 3.8 2036 - 2059 1,021 10 12,477,500 299,209 15.9 Totals 6,865 199 123,923,400 $ 1,887,671 100.0 %


Q3 2021 Supplemental Operating & Financial Data 29 Earnings Guidance Normalized FFO per share and AFFO per share exclude the merger-related costs associated with the VEREIT merger. Net income and Normalized FFO guidance does not include any one-time charges associated with future debt redemptions. Summarized below are approximate estimates of the key components of our 2021 and preliminary 2022 earnings guidance: Prior 2021 Guidance (excluding VEREIT merger) Revised 2021 Guidance (including VEREIT merger) Net income per share (1) $1.32 to $1.41 $1.39 to $1.44 Real estate depreciation and impairments per share $2.11 $2.06 Gains on sales of properties per share $(0.09) $(0.10) Merger-related costs (actual) (1) $0.03 $0.08 Normalized FFO per share $3.37 to $3.46 $3.43 to $3.48 AFFO per share $3.53 to $3.59 $3.55 to $3.60 Same store rent growth (2) 1.5% - 2.0% ~ 2.0% Occupancy Over 98% Over 98% Cash G&A expenses (% of revenues) (3)(4) ~ 4.5% 4.0% - 4.5% Property expenses (non-reimbursable) (% of revenues) (3) 1.5% - 1.8% 1.5% - 1.8% Income tax expenses ~ $25 million ~ $30 million Acquisition volume ~ $4.5 billion Over $5.0 billion Preliminary 2022 Guidance AFFO per share $3.84 to $3.97 Cash G&A expenses (% of revenues) (3)(4) 3.5% - 4.0% Acquisition volume Over $5.0 billion (1) Does not include any estimated merger-related costs for the remainder of 2021. (2) Includes rent deferred for future payment as a result of lease concessions we granted in response to the COVID-19 pandemic. (3) Revenue excludes contractually obligated reimbursements by our clients. Cash G&A excludes stock-based compensation expense. (4) G&A inclusive of stock-based compensation expense as a percentage of rental revenue, excluding reimbursements, is expected to be approximately 5.0% in 2021 and 4.0% - 4.5% in 2022. Forward-looking statements involve known and unknown risks, which may cause our actual future results to differ materially from expected results. These risks include, among others, general economic conditions, domestic and foreign real estate conditions, client financial health, the availability of capital to finance planned growth, volatility and uncertainty in the credit markets and broader financial markets, changes in foreign currency exchange rates, property acquisitions and the timing of these acquisitions, the structure, timing and completion of the anticipated spin-off of the office properties of Realty Income, Inc., and any effects of the announcement, pendency or completion of the spin-off, including the anticipated benefits therefrom, the anticipated benefits of the completed merger with VEREIT, charges for property impairments, the effects of the COVID-19 pandemic and the measures taken to limit its impact, the effects of pandemics or global outbreaks of contagious diseases or fear of such outbreaks, the ability of clients to adequately manage their properties and fulfill their respective lease obligations to Realty Income, and the outcome of any legal proceedings to which Realty Income is a party. Consequently, forward-looking statements should be regarded solely as reflections of Realty Income’s or VEREIT’s current operating plans and estimates. Actual operating results may differ materially from what is expressed or forecast in this press release. Neither Realty Income nor VEREIT undertake any obligation to publicly release the results of any revisions to these forward-looking statements that may be made to reflect events or circumstances after the date these statements were made.


Q3 2021 Supplemental Operating & Financial Data 30 Analyst Coverage Equity Research Baird Wes Golladay [email protected] (216) 737-7510 Bank of America Securities Joshua Dennerlein [email protected] (646) 855-1681 Berenberg Nate Crossett [email protected] (646) 949-9030 BTIG Michael Gorman [email protected] (212) 738-6138 Capital One Chris Lucas [email protected] (571) 633-8151 Citigroup Michael Bilerman [email protected] (212) 816-1383 Edward Jones James Shanahan [email protected] (314) 515-5292 Goldman Sachs Caitlin Burrows [email protected] (212) 902-4736 Green Street Spenser Allaway [email protected] (949) 640-8780 Janney Montgomery Scott Robert Stevenson [email protected] (646) 840-3217 Jefferies Linda Tsai [email protected] (212) 778-8011 J.P. Morgan Anthony Paolone [email protected] (212) 622-6682 Ladenburg Thalmann John Massocca [email protected] (212) 409-2543 Mizuho Haendel St. Juste [email protected] (212) 205-7860 Morgan Stanley Ronald Kamdem [email protected] (212) 269-8319 Raymond James RJ Milligan [email protected] (727) 567-2585 RBC Capital Markets Brad Heffern [email protected] (512) 708-6311 Scotiabank Greg McGinniss [email protected] (212) 225-6906 Stifel Simon Yarmak [email protected] (443) 224-1345 UBS Brent Dilts [email protected] (212) 713-1841 Wolfe Research Andrew Rosivach [email protected] (646) 582-9250 Realty Income is covered by the analysts at the firms listed above. This list may not be complete and is subject to change. Please note that any opinions, estimates or forecasts regarding Realty Income's performance made by these analysts are theirs alone and do not represent opinions, estimates or forecasts of Realty Income or its management. Realty Income does not by its reference above or distribution imply, and expressly disclaims, any endorsement of or concurrence with any information, estimates, forecasts, opinions, conclusions or recommendations provided by analysts.


Q3 2021 Supplemental Operating & Financial Data 31 Glossary T Adjusted EBITDAre. The National Association of Real Estate Investment Trusts (Nareit) came to the conclusion that a Nareit-defined EBITDA metric for real estate companies (i.e., EBITDA for real estate, or EBITDAre) would provide investors with a consistent measure to help make investment decisions among certain REITs. Our definition of “Adjusted EBITDAre” is generally consistent with the Nareit definition, other than our adjustment to remove foreign currency and derivative gains and losses (which is consistent with our previous calculations of "Adjusted EBITDAre"). We define Adjusted EBITDAre, a non-GAAP financial measure, for the most recent quarter as earnings (net income) before (i) interest expense, including non- cash loss (gain) on swaps, (ii) income and franchise taxes, (iii) loss on extinguishment of debt, (iv) real estate depreciation and amortization, (v) provisions for impairment, (vi) merger-related costs, (vii) gain on sales of real estate, and (viii) foreign currency and derivative gains and losses, net. Our Adjusted EBITDAre may not be comparable to Adjusted EBITDAre reported by other companies or as defined by Nareit, and other companies may interpret or define Adjusted EBITDAre differently than we do. Management believes Adjusted EBITDAre to be a meaningful measure of a REIT’s performance because it is widely followed by industry analysts, lenders and investors. Management also believes the use of an annualized quarterly Adjusted EBITDAre metric is meaningful because it represents our current earnings run rate for the period presented. The ratio of our total debt to our annualized quarterly Adjusted EBITDAre is also used to determine vesting of performance share awards granted to our executive officers. Adjusted EBITDAre should be considered along with, but not as an alternative to, net income as a measure of our operating performance. Adjusted Funds From Operations (AFFO), a non-GAAP financial measure, is defined as FFO adjusted for unique revenue and expense items, which we believe are not as pertinent to the measurement of our ongoing operating performance. Most companies in our industry use a similar measurement to AFFO, but they may use the term "CAD" (for Cash Available for Distribution) or "FAD" (for Funds Available for Distribution). We believe AFFO provides useful information to investors because it is a widely accepted industry measure of the operating performance of real estate companies that is used by industry analysts and investors who look at and compare those companies. In particular, AFFO provides an additional measure to compare the operating performance of different REITs without having to account for differing depreciation assumptions and other unique revenue and expense items which are not pertinent to measuring a particular company’s ongoing operating performance. Therefore, we believe that AFFO is an appropriate supplemental performance metric, and that the most appropriate GAAP performance metric to which AFFO should be reconciled is net income available to common stockholders. Annualized Pro Forma Adjusted EBITDAre, a non-GAAP financial measure, is defined as Adjusted EBITDAre including adjustments to incorporate operating income from properties we acquired or stabilized during the applicable quarter and to remove operating income from properties we disposed of during the applicable quarter, giving pro forma effect to all transactions as if they occurred at the beginning of the applicable quarter. The pro forma adjustments are consistent with the debt service coverage ratio calculated under financial covenants for our senior unsecured notes and bonds. See page 14 for further information regarding our debt covenants. Funds From Operations (FFO), a non-GAAP financial measure, consistent with the Nareit’s definition, is net income available to common stockholders, plus depreciation and amortization of real estate assets, plus provisions for impairments of depreciable real estate assets, and reduced by gains on property sales. Presentation of the information regarding FFO and AFFO (described on pages 7 and 8) is intended to assist the reader in comparing the operating performance of different REITs, although it should be noted that not all REITs calculate FFO and AFFO in the same way, so comparisons with other REITs may not be meaningful. FFO and AFFO should not be considered as alternatives to reviewing our cash flows from operating, investing, and financing activities. In addition, FFO and AFFO should not be considered as measures of liquidity, of our ability to make cash distributions, or of our ability to pay interest payments. We consider FFO to be an appropriate supplemental measure of a REIT’s operating performance as it is based on a net income analysis of property portfolio performance that adds back items such as depreciation and impairments for FFO. The historical accounting convention used for real estate assets requires straight-line depreciation of buildings and improvements, which implies that the value of real estate assets diminishes predictably over time. Since real estate values historically rise and fall with market conditions, presentations of operating results for a REIT using historical accounting for depreciation could be less informative. The use of FFO is recommended by the REIT industry as a supplemental performance measure. In addition, FFO is used as a measure of our compliance with the financial covenants of our credit facility.


Q3 2021 Supplemental Operating & Financial Data 32 Glossary (Cont'd) Initial Average Cash Lease Yield (acquisitions) is computed as contractual cash net operating income for the first twelve months following the acquisition date, divided by the total cost of the property (including all expenses borne by us). Investment Grade Clients are our clients with a credit rating, and our clients that are subsidiaries or affiliates of companies with a credit rating, as of the balance sheet date, of Baa3/BBB- or higher from one of the three major rating agencies (Moody’s/S&P/Fitch). Net Cash Capitalization Rates (dispositions) are computed as annualized current month contractual cash net operating income, divided by the net proceeds received upon sale of the property (including all expenses borne by us). Net Debt/Annualized Adjusted EBITDAre, a ratio used by management as a measure of leverage, is calculated as net debt (which we define as total debt per the consolidated balance sheet, less cash and cash equivalents), divided by annualized quarterly Adjusted EBITDAre. Net Debt/Annualized Pro Forma Adjusted EBITDAre, a ratio used by management as a measure of leverage, is calculated as net debt (which we define as total debt per the consolidated balance sheet, less cash and cash equivalents), divided by annualized Pro Forma Adjusted EBITDAre. Normalized Funds from Operations Available to Common Stockholders (Normalized FFO), a non-GAAP financial measure, is FFO excluding merger-related costs related to our merger with VEREIT. Same Store Pool, for purposes of determining the properties used to calculate our same store rental revenue, includes all properties that we owned for the entire year-to-date period, for both the current and prior year except for properties during the current or prior year that were: (i) vacant at any time, (ii) under development or redevelopment, or (iii) involved in eminent domain and rent was reduced. Same Store Rental Revenue excludes straight-line rent, the amortization of above and below-market leases, and reimbursements from clients for recoverable real estate taxes and operating expenses. For purposes of comparability, same store rental revenue is presented on a constant currency basis by applying the exchange rate as of the balance sheet date to base currency rental revenue. Total Portfolio Annualized Contractual Rent is the monthly aggregate cash amount charged to clients, inclusive of monthly base rent receivables, as of the balance sheet date, multiplied by 12, excluding percentage rent. We believe total portfolio annualized contractual rent is a useful supplemental operating measure, as it excludes properties that were no longer owned at the balance sheet date and includes the annualized rent from properties acquired during the quarter. Total portfolio annualized contractual rent has not been reduced to reflect reserves recorded as reductions to GAAP rental revenue in the periods presented.